
95% of researchers rate our articles as excellent or good
Learn more about the work of our research integrity team to safeguard the quality of each article we publish.
Find out more
ORIGINAL RESEARCH article
Front. Psychiatry , 09 December 2021
Sec. Molecular Psychiatry
Volume 12 - 2021 | https://doi.org/10.3389/fpsyt.2021.762683
This article is part of the Research Topic Rising Stars in Molecular Psychiatry View all 6 articles
 Qing Long1†
 Rui Wang2†‡
 Maoyang Feng3†
 Xinling Zhao1
 Yilin Liu1
 Xiao Ma1
 Lei Yu1
 Shujun Li1
 Zeyi Guo1
 Yun Zhu1
 Zhaowei Teng4*
 Yong Zeng1*
Background: Major depressive disorder (MDD) is a common and severe psychiatric disorder with a heavy burden on the individual and society. However, the prevalence varies significantly owing to the lack of auxiliary diagnostic biomarkers. To identify the shared differential expression genes (DEGs) with potential diagnostic value in both the hippocampus and whole blood, a systematic and integrated bioinformatics analysis was carried out.
Methods: Two datasets from the Gene Expression Omnibus database (GSE53987 and GSE98793) were downloaded and analyzed separately. A weighted gene co-expression network analysis was performed to construct the co-expression gene network of DEGs from GSE53987, and the most disease-related module was extracted. The shared DEGs from the module and GSE98793 were identified using a Venn diagram. Functional pathway prediction was used to identify the most disease-related DEGs. Finally, several DEGs were chosen, and their potential diagnostic value was determined by receiver operating characteristic curve analysis.
Results: After weighted gene co-expression network analysis, the most MDD-related module (MEgrey) was identified, and 623 DEGs were extracted from this module. The intersection between MEgrey and GSE98793 was calculated, and 163 common DEGs were identified. The co-expression network of 163 DEGs from these was then reconstructed. All hub genes were identified based on the connective degree of the reconstructed co-expression network. Based on the results of functional pathway enrichment, 17 candidate hub genes were identified. Finally, logistic regression and receiver operating characteristic curves showed that three candidate hub genes (CEP350, SMAD5, and HSPG2) had relatively high auxiliary value in the diagnosis of MDD.
Conclusion: Our results showed that the combination of CEP350, SMAD5, and HSPG2 has a relatively high diagnostic value for MDD. Pathway enrichment analysis also showed that these genes may play an important role in the pathogenesis of MDD. These results suggest a potentially important role for this gene combination in clinical practice.
Major depressive disorder (MDD) is a common mental disorder characterized by the presence of a set of depressed symptoms for at least 2 weeks (1). MDD places a heavy burden on medical systems worldwide (2, 3); however, the prevalence of this disorder varies geographically. In China, 3.02% of the population suffers from MDD (4). Smith argued that this relatively low morbidity may be due to different diagnostic criteria used in China (4). The diagnosis of major depression is based on clinical symptoms. Thus, it is difficult to reach a consensus on the symptoms due to the varied recognition of symptoms among individual clinicians and in different cultures. In addition, the lack of biomarkers contributes to regional differences in MDD diagnosis. Consequently, it is critical to identify biomarkers with reference values to assist in objective clinical identification.
The mechanisms underlying MDD remain unclear, and many hypotheses have been controversial. Historically, the monoamine hypothesis has been the most acceptable (5, 6); however, Boku et al. (7) argued that neuroplasticity and neurogenesis hypotheses should also be considered. In addition, a growing body of evidence suggests that inflammatory mechanisms also play a crucial role in the pathophysiological processes of MDD (8, 9). It has also been reported that there are some differences in gene expression between patients with MDD and normal individuals (10). Indeed, the impact of genes on the development of this disease has also been emphasized (11–13). Despite these various hypotheses, these studies have failed to provide specific or stable biomarkers that could be used for the diagnosis of MDD.
According to Mahajan et al. (14), compared to psychiatrically normal control subjects, some neuro-inflammatory genes in the hippocampus of MDD patients are differentially expressed. A recent study found that the gene expression pattern of Brodmann's area 9 (424 genes), 10 (52 genes), and 33 (59 genes) is altered between MDD and non-affected controls (15). Moreover, Mamdani et al. found that interferon regulatory factor 7 (IRF7) was upregulated by citalopram treatment via comparing the individuals with or without good response to the treatment (16). Thus, it has been shown that the different gene expression pattern in brain areas may have potential to distinguish MDD and psychiatrically-normal subjects and even the antidepressant response. However, these results are with few values in application to clinic practice because of the difficulty and immorality in obtaining brain samples from alive MDD patients. Therefore, the differences of gene expression pattern between MDD patients and non-psychiatric persons in periphery blood seems valuable for psychiatrists and the researchers of this field. Leday et al. (9) also identified that gene expression in the whole blood of MDD patients was different from that in non-psychotic individuals. Recently, a quantitative review has revealed that the transcriptional changes between MDD and non-affected controls were significantly different, especially in innate immune-related genes (17). Besides, a growing body of studies also showed that some peripheral miRNAs may potentials act as biomarkers for major depression and antidepressant treatment response (18). Consequently, it can be proposed that the differences of peripheral transcription between MDD patients and non-psychotic individuals may be a sign of diagnostic and treatment response markers. Despite numerous studies reporting that gene expression is altered in people with MDD, few studies have attempted to identify consistent differentially expressed genes (DEGs) between different tissues, especially between the peripheral blood and the brain.
In this study, we aimed to identify the shared DEGs with potential diagnostic value in both the hippocampus and the whole blood using a systematic and integrated bioinformatics analysis.
We downloaded two datasets (GSE53987 and GSE98793) from the Gene Expression Omnibus database. Both datasets were based on the Affymetrix Human Genome U133A array. There were a total of 17 samples of post-mortem hippocampal tissue from MDD patients in GSE53987. In addition, 18 post-mortem hippocampal tissue samples from healthy controls were included in this dataset. The GSE98793 dataset comprised 64 controls and 128 MDD patients. The MDD patients included those with and without generalized anxiety disorder (64 patients in each group). We analyzed data from MDD patients and those who were free of anxiety disorders.
The online tool, GEO2R, was used to analyze the two datasets. This tool is based on R language investigation (19). After defining the control and MDD groups, we compared the two groups. The combination of P-value and |logFC| are a typical method which is utilized by many studies (20, 21). Besides, because of the high heterogeneity between hippocampus and periphery blood, a relatively broaden threshold is needed to find more probable consistent DEGs. Thus, we defined significant up-regulation genes as those with LogFC > 0 and P < 0.05. On the contrary, significant down-regulated genes were defined as those with LogFC < 0 and P < 0.05. In other words, we artificially defined a value < 0.05, and |LogFC| > 0 as the cutoff criteria to judge the DEGs. The WGCNA package in R platform (22) was used to construct the co-expression network of the DEGs in GSE53987. The preservation of the constructed modules was judged by Z-summary which was shown in a previous study (23). After calculating and filtering, disease-related modules were loaded. Then, by scanning and comparing the correlation coefficients, the most relevant MDD module was extracted.
To find the shared DEGs between the most MDD-related modules and GSE98793, an online Venn diagram tool was used (http://www.ehbio.com/test/venn/). We then obtained the shared DEGs and extracted the co-expression network based on the selected module. Next, we used an application named Cytoscape (version 3.7.1) to reconstruct the co-expression network. A Cytoscape plugin known as cytoHubba was used to select DEGs with a relatively high degree of connectivity (defined as hub genes) from the complex network (24). CytoHubba plugin includes 12 algorisms, only degree algorism was used in this process.
Kyoto Encyclopedia of Genes and Genomes pathway enrichment and Gene Ontology analysis were performed to explore the potential molecular mechanisms of the DEGs in the extracted module in the neuropsychiatric process. These two analytical tools are available on the website (https://metascape.org/gp/index.html). The Gene Ontology project contains three clusters: biological processes (such as metabolic processes and immune system processes), cellular components (for example, synapse and protein-containing complex), and molecular function (the genes biological activities, such as structural activity and transporter activity). The Kyoto Encyclopedia of Genes and Genomes project is used for enrichment of genes in diseases and organismal systems. Finally, DEGs enriched in the pathway of interest were included in further processing.
The expression submatrix was obtained from two datasets. To explore the potential diagnostic value of selected candidate hub genes, a series of statistical analysis was used. Firstly, to construct an eligible combination model, logistic regression analysis was performed based on the expression selected hub genes in both datasets. After acquiring the optimal model, receiver operating character (ROC) curve was used to evaluate the potential diagnostic efficiency of it in both datasets. Finally, nomogram analysis and calibration curve were applied for identify prediction accuracy and risk evaluation of the combination model.
To draw the receiver operator characteristic (ROC) curve, we downloaded the submatrices of the two datasets. The expression of DEGs was used to identify potential diagnostic values. All statistical analyses were performed using the R software (version 4.1.0; R Foundation for Statistical Computing, Vienna, Austria). The pROC package (version 1.17.0.1) was used to calculate the potential diagnostic value of the shared hub genes in both datasets. Statistical tests resulting in a p-value < 0.05 were considered statistically significant.
The gene chip, GSE53987, contains the gene expression of three regions of post-mortem brain tissue samples from patients with MDD and non-psychiatric individuals. Gene expression profiles from the hippocampus were extracted. A total of 45,783 genes were tested using GEO2R. After scanning and filtering those without matched gene symbols, 1,280 genes were identified as DEGs. Another Gene Expression Omnibus dataset, GSE98793, consisted of gene expression profiles from the whole blood of 128 persons, including 64 MDD patients and 64 healthy controls. Using the same tool and criteria, 3864 DEGs were identified.
To identify the most disease-related DEGs from GSE53987, we performed a weighted gene co-expression network (Figure 1) analysis to construct the co-expression network. The module-trait analysis showed that the MEgrey module was most related to MDD (r2 = 0.91, p < 0.001). Furthermore, there was a significant negative correlation between this module and the healthy controls. Thus, this module has the greatest potential to distinguish patients with MDD from healthy controls. The preservation test of modules also showed that MEgrey was a high preserved module with a Z-summary score > 20 (data was shown in Supplementary Figure S1). After extracting the MEgrey module, 623 DEGs were studied further. To find the DEGs in common between the hippocampus and whole blood, online Venn diagrams were constructed. In addition, 163 DEGs were identified in both datasets (Figure 2A).
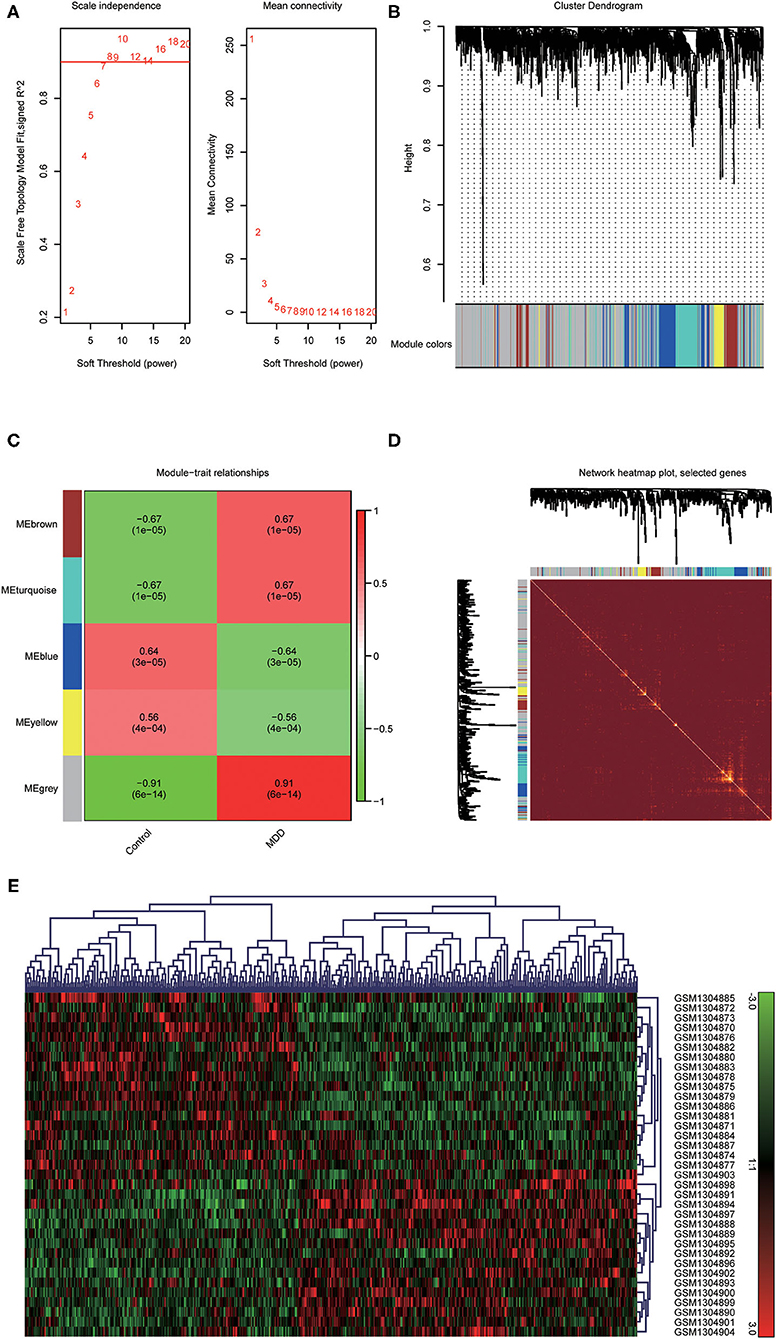
Figure 1. Construction of a weighted gene co-expression network analysis. (A) Selection of soft threshold; (B) Co-expression network of differential expressed genes from GSE53987; (C) Disease-related module: the words at the top of every module refer to the correlation index, and the words in brackets refer to the p-value; (D) The heatmap of the correlationship between modules of the selected genes; (E) The clustered gene expression heatmap of MEgrey module.
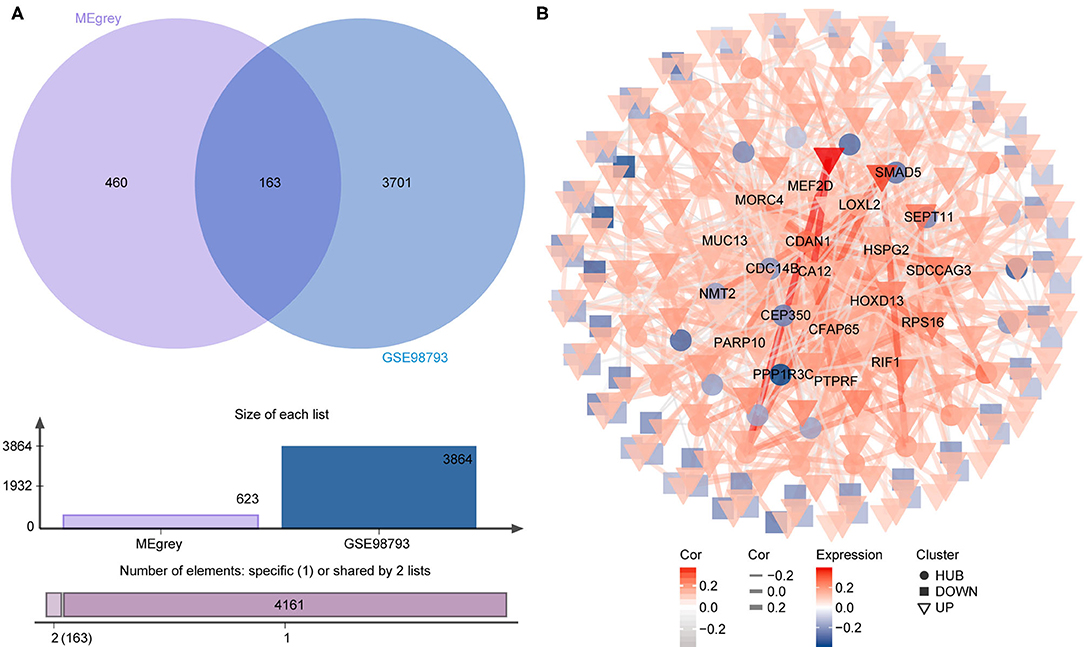
Figure 2. The differential expressed gene intersection between MEgrey and GSE98793. (A) The calculation progression of intersection between MEgrey and GSE98793; (B) The reconstruction of the co-expression differential expressed gene network from MEgrey module.
The co-expression network of the shared 163 DEGs was reconstructed using the MEgrey module. Then, the network was introduced to Cytoscape and genes with a connective degree ≥ 4 were defined as hub genes utilizing the cytoHubba plugin. In addition, igraph and ggraph mapping were performed to optimize the reconstructed co-expression network (Figure 2B). And the separated edges and nodes were deleted. Pathway enrichment analysis was used to identify candidate DEGs. The results showed that the hub genes were enriched in cytokinesis, synapse organization, skeletal system development, and so on. After comparing the literature and existing theories, the hub genes enriched in the neuropsychiatric pathway were identified (Figure 3). A total of 17 candidate genes were included in the evaluation of potential diagnostic value. The details of these genes are listed in Table 1.
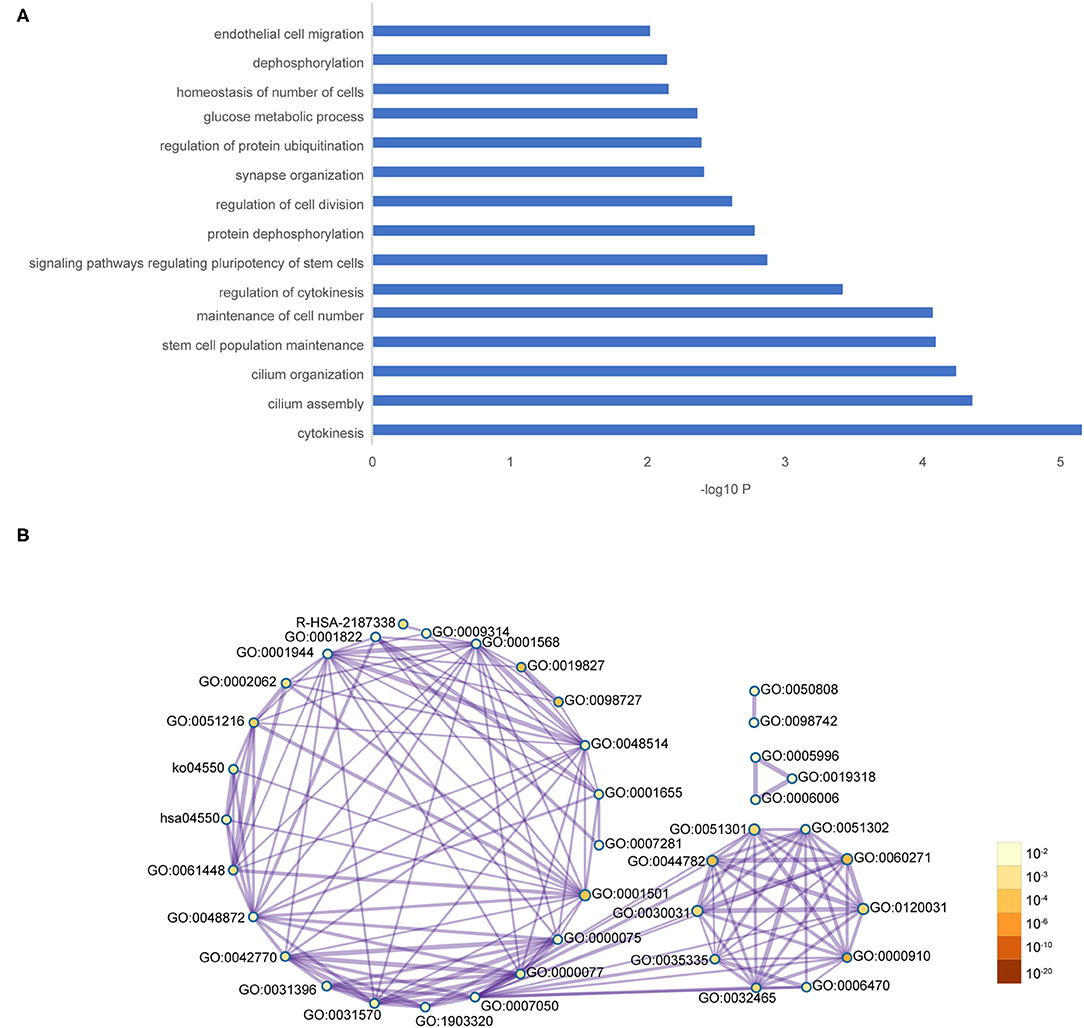
Figure 3. Functional pathway enrichment of hub genes. (A) The interested pathway. (B) All of the enrichment pathway terms of hub genes.
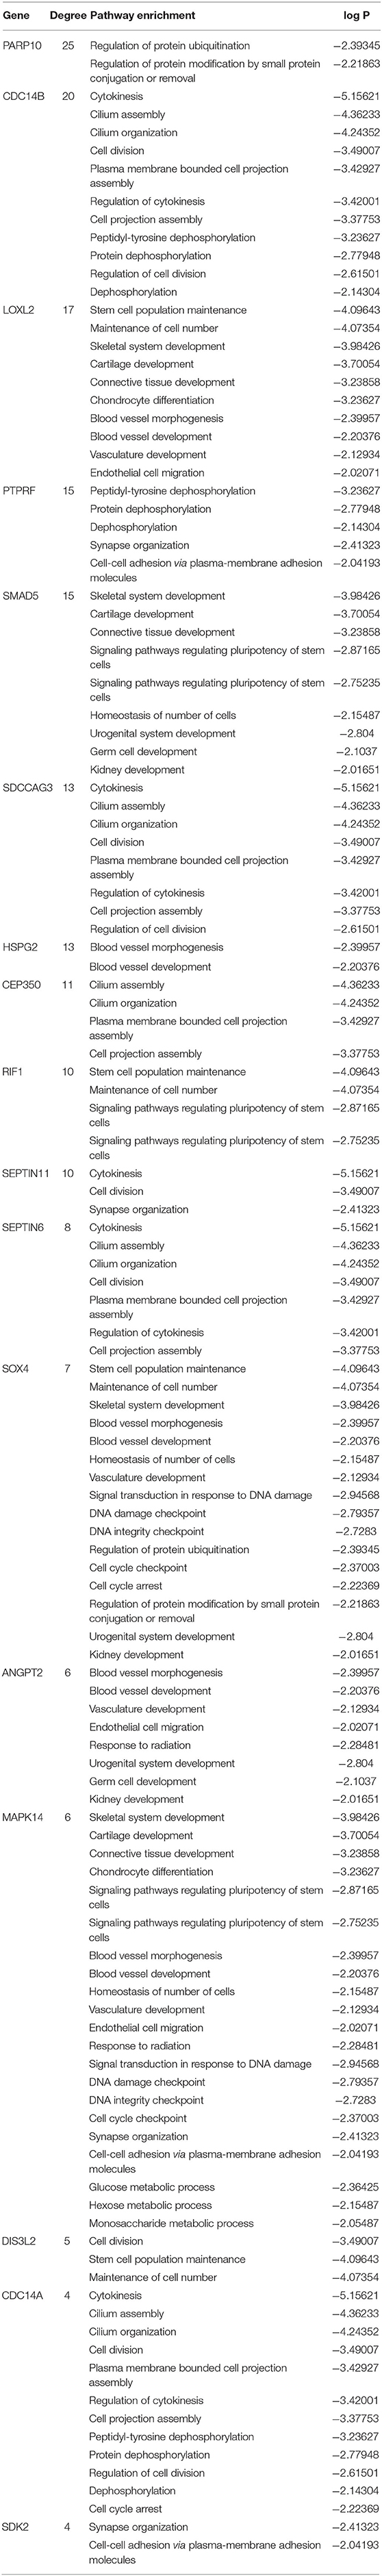
Table 1. List of gene hubs based on pathway enrichment.
We used logistic regression to screen 17 candidate genes from the GSE53987. After that, three significant genes were screened out (p > 0.05). To validate the diagnostic role of these three gene signatures, the combination gene risk score was calculated as follows: the combination gene panel = (−0.010 × expression value of CEP350) + (−0.007 × expression value of SMAD5) + (0.022 × expression value of HSPG2) + 0.571. The ROC curve was used to evaluate the diagnostic value of single genes and combined genes in MDD (Figure 4A). The results showed that all three single genes had diagnostic value, and the combination gene significantly improved the diagnostic value of MDD (Figure 4B). The AUC value of the combined gene was the highest at 0.9542.
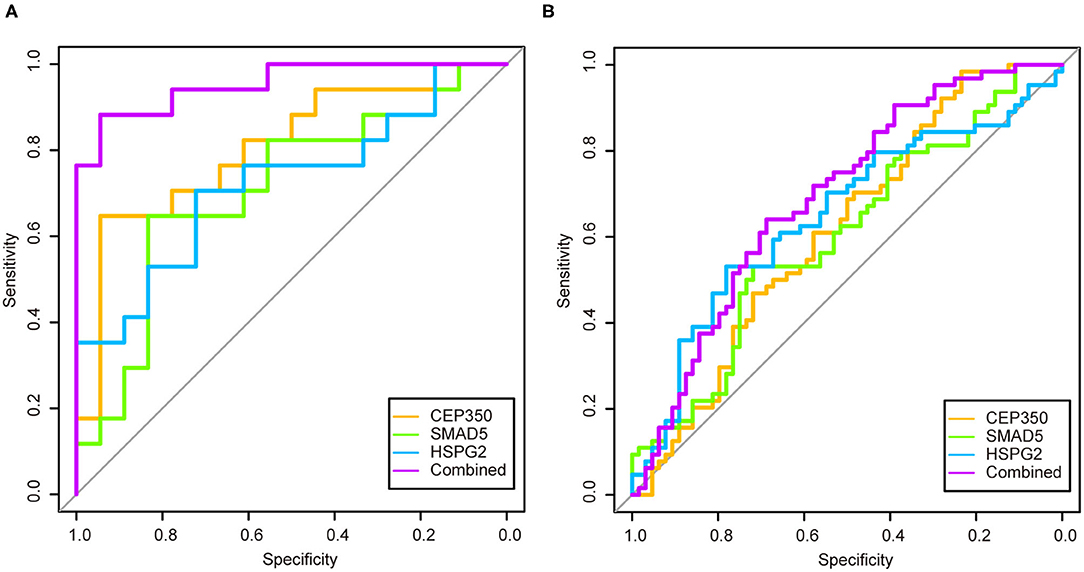
Figure 4. The receiver operator characteristic curves and area under the curve of the candidate genes in two datasets. (A) Receiver operator characteristic curves and area under the curve of the candidate genes of GSE53987; (B) Receiver operator characteristic curves and area under the curve of the candidate genes of GSE98793.
In order to verify the diagnostic value of the screened genes in MDD, we used the same method in the GSE98793 dataset. The combination gene risk score was calculated as follows: the combination gene panel = (−0.446 × expression value of CEP350) + (−0.139 × expression value of SMAD5) + (0.248 × expression value of HSPG2) + 3.999. The results also showed that the combined gene had a relatively high diagnostic value for MDD (Figure 4B). The AUC value of the combined gene was the largest at 0.6919.
To validate the prediction accuracy and risk evaluation of the combination genes, we draw the nomogram and calibration curve based on the expression of them. In the nomograms, each variable axis presented the value of a patient. The number of points received for the respective variable values was calculated based on an upward line. The total points axis represented the sum of the relevant numbers. And the consistency between the nomogram and the observed value was confirmed by calibration curve and Hosmer-Lemeshow test. Our calibration curves of the nomogram for risk of MDD demonstrated the prediction value is in accord with observation value in GSE53987 and GSE98793 dataset (Figures 5, 6). Hosmer-Lemeshow Test shown that p = 0.596 for the GSE 53987, and p = 0.134 for the GSE 98793, which suggested that there was no departure from perfect fit. Finally, the C-index was derived on the basis of the analysis. The C-index for the prediction nomogram was 0.961 (95% CI, 0.902–1.019) for the GSE 53987, and 0.691 (95% CI, 0.600–0.782) for the GSE 98793. These results showed a consensus with the ROC test.
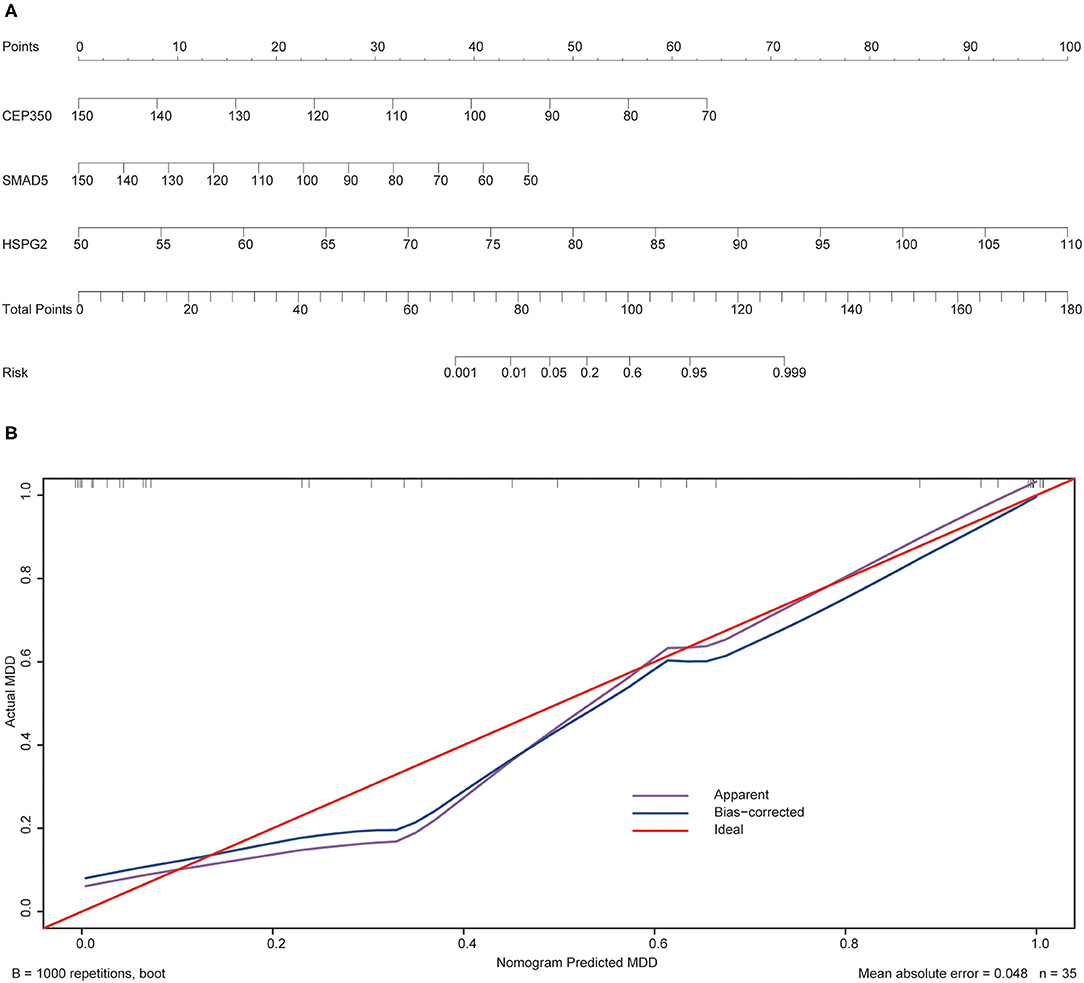
Figure 5. The nomogram and calibration of combination of three hub genes (CEP350, SMAD5, HSPG2) in GSE53987. (A) Nomogram of three hub genes: the value in points line is matched with the value in lines of the genes based on their expression. Total points line refers to the sum of the matched points of these genes. And the risk range line is matched with the corresponding range in total points line; (B) Calibration of combination of the three genes: the apparent line is along with ideal line, and Hosmer-Lemeshow Test showed that there is no significant difference between ideal line and apparent line.
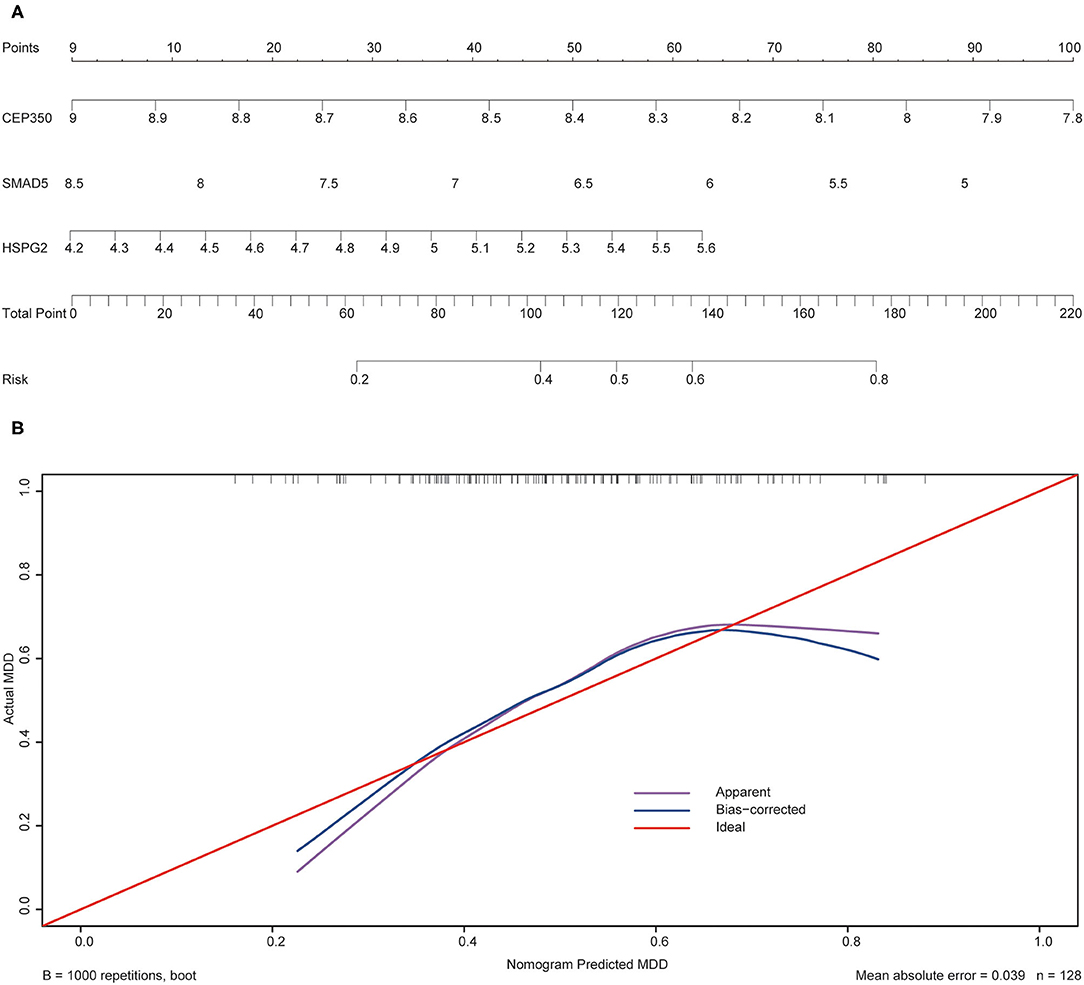
Figure 6. The nomogram and calibration of combination of three hub genes (CEP350, SMAD5, HSPG2) in GSE98793. (A) Nomogram of three hub genes: the value in points line is matched with the value in lines of the genes based on their expression. Total points line refers to the sum of the matched points of these genes. And the risk range line is matched with the corresponding range in total points line; (B) Calibration of combination of the three genes: the apparent line is along with ideal line, and Hosmer-Lemeshow Test showed that there is no significant difference between ideal line and apparent line.
MDD is a severe mental disorder, with a high recurrence rate (~80% of patients will have at least one recurrence in their lifetime), which places a heavy burden on individuals and on society (25). According to a global burden survey of diseases, depressive disorder ranks as the third leading cause of years lived with disability for both sexes (26). Moreover, the resistance to antidepressants is common among 30–50% of patients (18, 27, 28) with MDD (18, 27, 28). It has been found that the cure rate and prognosis of MDD partly depend on the stage. Early detection and treatment are often associated with a better response rate and prognosis (29). Moreover, a high misdiagnosis rate due to the limited knowledge of etiology and auxiliary diagnostic markers also contributes to poor recovery of patients with MDD (30, 31). Fortunately, a growing number of studies have reported that there are many alterations in gene expression between MDD patients and healthy controls in both brain and peripheral tissues (32). However, few studies have focused on the commonality of DEGs in the brain and peripheral tissues. Thus, the present study was conducted to identify the shared DEGs between the brain and peripheral blood of patients with MDD and explore their potential diagnostic value.
In the current study, DEGs from the hippocampus and whole blood of patients with MDD were analyzed. We performed a weighted gene co-expression network analysis to construct the correlation networks. The most disease-related modules were extracted. The common DEGs in both the hippocampus and peripheral blood were included after the comparison between the extracted module and the other dataset. A total of 163 common DEGs were reanalyzed from the co-expression network to identify hub genes for further study. Then, 66 hub genes based on the degree of connectivity were selected for pathway enrichment analysis. Our data showed that these hub genes were enriched in the following functional pathways: cytokinesis, cilium assembly, and cell division. These pathways have been reported to be closely related to neuropsychiatric disorders, such as dephosphorylation (33), regulation of protein ubiquitination (34), and synapse organization (35). Based on previous studies, the pathways of interest were selected and the enriched DEGs included in them were collected for the next step. After logistic regression was performed and ROC curve was calculated, three DEGs (CEP350, SMAD5, and HSPG2) with potential diagnostic value were identified as auxiliary diagnostic markers. Furthermore, the calibration curves and nomogram analysis also displayed an applicable possibility of the combination of these DEGs.
CEP350 (centrosomal protein 350) is a key regulator of cell polarity (36) and is involved in many biological processes. It has been reported that defective ciliogenesis may result in malformations of cortical development (37). Intriguingly, a previous study showed that CEP350 plays a role in ciliogenesis (38). Our analysis also found that CEP350 was enriched in the cilium assembly and organization pathways. In addition, a previous study has shown that 15% of brain-expressed cilia genes were significantly different between patients with MDD and controls (39). Indeed, a genome-wide by environment interaction study with stressful life events revealed that a single nucleotide polymorphism near CEP350 was associated with depressive symptoms in African Americans (40). Based on these findings, CEP350 may be involved in the development of the brain and the pathogenesis of MDD.
SMAD5 (SMAD family member 5) is well-known for its regulatory function in osteogenesis (41). The role of SMAD5 in developmental disorders has also been revealed in recent decades. It is located at chromosome 5q31, and has been regarded as a key region associated with development. Deletion or duplication of this region results in many developmental disorders, such as developmental delay, intellectual disability, and dysmorphic features (42). Moreover, SMAD5 has been identified as a transcription factor that participates in brain development. For instance, it plays an essential role in neuronal and glial development, and its knockdown may lead to exencephaly (43). Interestingly, it has been demonstrated that the dysregulation of brain development is strongly related to multiple psychiatric disorders, like schizophrenia (SCZ), bipolar disorder, and MDD. This suggests that SMAD5 is potentially involved in the pathogenesis of mental diseases. Indeed, in recent studies, whole-exome sequencing has revealed that SMAD5 is one of the candidate genes of SCZ (44) and another study showed that SMAD5 was associated with cognitive deficits in SCZ patients (45). Thus, SMAD5 plays an important role in neuropsychiatric disorders.
HSPG2 (heparan sulfate proteoglycan 2) is located at chromosome 1p36, which has been identified as an essential chromosome for brain development. Multiple developmental disorders of the brain emerge with the deletion of this region, such as seizures, vision problems, hearing loss, and brain anomalies (46). Moreover, a growing number of studies have found that HSPG2 is closely associated with tardive dyskinesia (47, 48), which is a common side effect of antipsychotics. Recent studies have also shown that HSPG2 is closely related to neuropsychiatric disorders, and Clement et al. found that a single nucleotide polymorphism of HSPG2 was positively associated with tardive dyskinesia occurrence in SCZ patients (49) and another study showed that a decreasing expression of HSPG2 was observed in both frontotemporal dementia and amyotrophic lateral sclerosis (50). Moreover, HSPG2 has been reported as a critical regulator in the maintenance and repair of the blood-brain barrier (BBB) (51). An increasing body of research has reported that BBB injuries are associated with many mental disorders, such as SCZ (52), bipolar disorder (53), and depressive disorders (54). Furthermore, it has been revealed that both chronic stress and impaired glutamate function in mouse models showed a depressive-like phenotype with downregulation of HSPG2 (55). Therefore, HSPG2 plays an important role in the pathogenesis of MDD.
Based on the above studies and our results, these three DEGs may have important functions in the mechanism of MDD. As mentioned in the previous section, we explored the potential diagnostic value of the three DEGs. It was shown that the combination of these three DEGs has a relatively high reference value in the diagnosis of MDD in both the hippocampus and peripheral blood.
There were some limitations to the present study. First, the filtration and calculation of the genes was based on bioinformatics analysis. Although these systematic methods avoid the bias of artificial selection to a certain extent, the deficiency of clinical samples and a series of experimental validations have limited their application in MDD patients. Besides, there is limited samples and insufficient datasets to find any other suitable independent cohort that can be utilized to validate our results. The specific functions of these DEGs that underpin the pathophysiological process of MDD need to be further studied in in vitro and in vivo models.
In conclusion, our results showed that the combination of three DEGs (CEP350, SMAD5, and HSPG2) has a relatively high reference auxiliary diagnostic value for MDD. Pathway enrichment analysis also revealed that these three DEGs may play a role in the pathogenesis of MDD. Thus, this combination diagnostic model of the three genes may have potential applications in the clinical practice concerning patients with MDD.
Publicly available datasets were analyzed in this study. This data can be found here: https://www.ncbi.nlm.nih.gov/gds/ (GSE53987 and GSE98793).
ZT and YZe have designed this study. QL has written the manuscript. RW and MF performed the statistical analysis and visualized the results. XZ and ZG formatted the reference lists. YL, XM, and LY helped to organize the visual data. YZh and SL collected and formatted the gene list. All authors contributed to the article and approved the submitted version.
This study was supported by the National Natural Science Foundation of China (81760253 and 81960254) and the Yunnan Health Training Project of High-level Talents (L-2017021) from YZe.
The authors declare that the research was conducted in the absence of any commercial or financial relationships that could be construed as a potential conflict of interest.
All claims expressed in this article are solely those of the authors and do not necessarily represent those of their affiliated organizations, or those of the publisher, the editors and the reviewers. Any product that may be evaluated in this article, or claim that may be made by its manufacturer, is not guaranteed or endorsed by the publisher.
We thank all participants involved in this study. And we also thank the developers of two application (Cytoscape and R software).
The Supplementary Material for this article can be found online at: https://www.frontiersin.org/articles/10.3389/fpsyt.2021.762683/full#supplementary-material
Supplementary Figure S1. Preservation test of all modules with significant association of MDD. (A) The preservation median rank, vertical axis refers to the preservation rank value; (B) Z-summary test for all modules, vertical axis refers to Z-summary score. Horizontal axis refers to the number of genes for both diagrams.
1. American Psychiatric Publishing. Diagnostic and Statistical Manual of Mental Disorders (DSM-5R). Washington, DC: American Psychiatric Publishing (2013).
2. Bromet E, Andrade LH, Hwang I, Sampson NA, Alonso J, de Girolamo G, et al. Cross-national epidemiology of DSM-IV major depressive episode. BMC Med. (2011) 9:90. doi: 10.1186/1741-7015-9-90
3. Whiteford HA, Degenhardt L, Rehm J, Baxter AJ, Ferrari AJ, Erskine HE, et al. Global burden of disease attributable to mental and substance use disorders: findings from the Global Burden of Disease Study 2010. Lancet. (2013) 382:1575–86. doi: 10.1016/S0140-6736(13)61611-6
5. Prins J, Olivier B, Korte SM. Triple reuptake inhibitors for treating subtypes of major depressive disorder: the monoamine hypothesis revisited. Expert Opin Investig Drugs. (2011) 20:1107–30. doi: 10.1517/13543784.2011.594039
6. Massart R, Mongeau R, Lanfumey L. Beyond the monoaminergic hypothesis: neuroplasticity and epigenetic changes in a transgenic mouse model of depression. Philos Trans R Soc Lond B Biol Sci. (2012) 367:2485–94. doi: 10.1098/rstb.2012.0212
7. Boku S, Nakagawa S, Toda H, Hishimoto A. Neural basis of major depressive disorder: beyond monoamine hypothesis. Psychiatry Clin Neurosci. (2018) 72:3–12. doi: 10.1111/pcn.12604
8. Raedler TJ. Inflammatory mechanisms in major depressive disorder. Curr Opin Psychiatry. (2011) 24:519–25. doi: 10.1097/YCO.0b013e32834b9db6
9. Leday GGR, Vértes PE, Richardson S, Greene JR, Regan T, Khan S, et al. Replicable and coupled changes in innate and adaptive immune gene expression in two case-control studies of blood microarrays in major depressive disorder. Biol Psychiatry. (2018) 83:70–80. doi: 10.1016/j.biopsych.2017.01.021
10. Jansen R, Penninx BWJH, Madar V, Xia K, Milaneschi Y, Hottenga JJ, et al. Gene expression in major depressive disorder. Mol Psychiatry. (2016) 21:339–47. doi: 10.1038/mp.2015.57
11. Klok MD, Alt SR, Irurzun Lafitte AJ, Turner JD, Lakke EA, Huitinga I, et al. Decreased expression of mineralocorticoid receptor mRNA and its splice variants in postmortem brain regions of patients with major depressive disorder. J Psychiatr Res. (2011) 45:871–8. doi: 10.1016/j.jpsychires.2010.12.002
12. Maheu M, Lopez JP, Crapper L, Davoli MA, Turecki G, Mechawar N. MicroRNA regulation of central glial cell line-derived neurotrophic factor (GDNF) signalling in depression. Transl Psychiatry. (2015) 5:e511. doi: 10.1038/tp.2015.11
13. Lin CH, Huang MW, Lin CH, Huang CH, Lane HY. Altered mRNA expressions for N-methyl-D-aspartate receptor-related genes in WBC of patients with major depressive disorder. J Affect Disord. (2019) 245:1119–25. doi: 10.1016/j.jad.2018.12.016
14. Mahajan GJ, Vallender EJ, Garrett MR, Challagundla L, Overholser JC, Jurjus G, et al. Altered neuro-inflammatory gene expression in hippocampus in major depressive disorder. Prog Neuropsychopharmacol Biol Psychiatry. (2018) 82:177–86. doi: 10.1016/j.pnpbp.2017.11.017
15. Scarr E, Udawela M, Dean B. Changed cortical risk gene expression in major depression and shared changes in cortical gene express ion between major depression and bipolar disorders. Aust N Z J Psychiatry. (2019) 53:1189–98. doi: 10.1177/0004867419857808
16. Mamdani F, Berlim MT, Beaulieu MM, Labbe A, Merette C, Turecki G. Gene expression biomarkers of response to citalopram treatment in major depressive disorder. Transl Psychiatry. (2011) 1:e13. doi: 10.1038/tp.2011.12
17. Wittenberg GM, Greene J, Vértes PE, Drevets WC, Bullmore ET. Major depressive disorder is associated with differential expression of innate immune and neutrophil-related gene networks in peripheral blood: a quantitative review of whole-genome transcriptional data from case-control studies. Biol Psychiatry. (2020) 88:625–37. doi: 10.1016/j.biopsych.2020.05.006
18. Lopez JP, Kos A, Turecki G. Major depression and its treatment: microRNAs as peripheral biomarkers of diagnosis and treatment response. Curr Opin Psychiatry. (2018) 31:7–16. doi: 10.1097/YCO.0000000000000379
19. Barrett T, Wilhite SE, Ledoux P, Evangelista C, Kim IF, Tomashevsky M, et al. NCBI GEO: archive for functional genomics data sets–update. Nucleic Acids Res. (2013) 41:D991–5. doi: 10.1093/nar/gks1193
20. Park AY, Han MR, Park KH, Kim JS, Son GS, Lee HY, et al. Radiogenomic analysis of breast cancer by using B-mode and vascular US and RNA sequencing. Radiology. (2020) 295:24–34. doi: 10.1148/radiol.2020191368
21. Yang Q, Li K, Li X, Liu J. Identification of key genes and pathways in myeloma side population cells by bioinformatics analysis. Int J Med Sci. (2020) 17:2063–76. doi: 10.7150/ijms.48244
22. Langfelder P, Horvath S. WGCNA: an R package for weighted correlation network analysis. BMC Bioinform. (2008) 9:559. doi: 10.1186/1471-2105-9-559
23. Broadbent J, Sampson D, Sabapathy S, Haseler LJ, Wagner KH, Bulmer AC, et al. Gene networks in skeletal muscle following endurance exercise are coexpressed in blood neutrophils and linked with blood inflammation markers. J Appl Physiol. (2017) 122:752–66. doi: 10.1152/japplphysiol.00114.2016
24. Chin CH, Chen SH, Wu HH, Ho CW, Ko MT, Lin CY. cytoHubba: identifying hub objects and sub-networks from complex interactome. BMC Syst Biol. (2014) 8:S4–11. doi: 10.1186/1752-0509-8-S4-S11
26. GBD 2017 Disease and Injury Incidence and Prevalence Collaborators. Global, regional, and national incidence, prevalence, and years lived with disability for 354 diseases and injuries for 195 countries and territories, 1990-2017: a systematic analysis for the Global Burden of Disease Study 2017. Lancet. (2018) 392:1789–858. doi: 10.1016/S0140-6736(18)32279-7
27. Berger T, Lee H, Young AH, Aarsland D, Thuret S. Adult hippocampal neurogenesis in major depressive disorder and Alzheimer's disease. Trends Mol Med. (2020) 26:803–18. doi: 10.1016/j.molmed.2020.03.010
28. Dudek KA, Dion-Albert L, Kaufmann FN, Tuck E, Lebel M, Menard C. Neurobiology of resilience in depression: immune and vascular insights from human and animal studies. Eur J Neurosci. (2021) 53:183–221. doi: 10.1111/ejn.14547
29. Babagi HF, Aljifri NMM, Dali RSO, Jan NSM, Alqahtani LM, Abusrrah WM, et al. An overview on unipolar major depression in adults diagnosis and management approach. Pharmacophore. (2020) 11:20–5.
30. Martin-Key NA, Olmert T, Barton-Owen G, Han SYS, Cooper JD, Eljasz P, et al. The Delta Study - Prevalence and characteristics of mood disorders in 924 individuals with low mood: results of the World Health Organization Composite International Diagnostic Interview (CIDI). Brain Behav. (2021) 11:e02167. doi: 10.1002/brb3.2167
31. Tomasik J, Han SYS, Barton-Owen G, Mirea DM, Martin-Key NA, Rustogi N, et al. A machine learning algorithm to differentiate bipolar disorder from major depressive disorder using an online mental health questionnaire and blood biomarker data. Transl Psychiatry. (2021) 11:41. doi: 10.1038/s41398-020-01181-x
32. Penner-Goeke S, Binder EB. Epigenetics and depression. Dialogues Clin Neurosci. (2019) 21:397–405. doi: 10.31887/DCNS.2019.21.4/ebinder
33. David O, Barrera I, Gould N, Gal-Ben-Ari S, Rosenblum K. D1 dopamine receptor activation induces neuronal eEF2 pathway-dependent protein synthesis. Front Mol Neurosci. (2020) 13:67. doi: 10.3389/fnmol.2020.00067
34. Park DI, Dournes C, Sillaber I, Ising M, Asara JM, Webhofer C, et al. Delineation of molecular pathway activities of the chronic antidepressant treatment response suggests important roles for glutamatergic and ubiquitin-proteasome systems. Transl Psychiatry. (2017) 7:e1078. doi: 10.1038/tp.2017.39
35. Licznerski P, Duman RS. Remodeling of axo-spinous synapses in the pathophysiology and treatment of depression. Neuroscience. (2013) 251:33–50. doi: 10.1016/j.neuroscience.2012.09.057
36. Kumar A, Rajendran V, Sethumadhavan R, Purohit R. CEP proteins: the knights of centrosome dynasty. Protoplasma. (2013) 250:965–83. doi: 10.1007/s00709-013-0488-9
37. Park SM, Lim JS, Ramakrishina S, Kim SH, Kim WK, Lee J, et al. Brain somatic mutations in MTOR disrupt neuronal ciliogenesis, leading to focal cortical dyslamination. Neuron. (2018) 99:83–97.e7. doi: 10.1016/j.neuron.2018.05.039
38. Mojarad BA, Gupta GD, Hasegan M, Goudiam O, Basto R, Gingras AC, et al. CEP19 cooperates with FOP and CEP350 to drive early steps in the ciliogenesis programme. Open Biol. (2017) 7:114. doi: 10.1098/rsob.170114
39. Alhassen W, Chen S, Vawter M, Robbins BK, Nguyen H, Myint TN, et al. Patterns of cilia gene dysregulations in major psychiatric disorders. Prog Neuropsychopharmacol Biol Psychiatry. (2021) 109:110255. doi: 10.1016/j.pnpbp.2021.110255
40. Dunn EC, Wiste A, Radmanesh F, Almli LM, Gogarten SM, Sofer T, et al. Genome-wide association study (GWAS) and genome-wide by environment interaction study (GWEIS) of depressive symptoms in African American and Hispanic/Latina women. Depress Anxiety. (2016) 33:265–80. doi: 10.1002/da.22484
41. Tasca A, Astleford K, Blixt NC, Jensen ED, Gopalakrishnan R, Mansky KC. SMAD1/5 signaling in osteoclasts regulates bone formation via coupling factors. PLoS ONE. (2018) 13:e0203404. doi: 10.1371/journal.pone.0203404
42. Rosenfeld JA, Drautz JM, Clericuzio CL, Cushing T, Raskin S, Martin J, et al. Deletions and duplications of developmental pathway genes in 5q31 contribute to abnormal phenotypes. Am J Med Genet A. (2011) 155A:1906–16. doi: 10.1002/ajmg.a.34100
43. Hegarty SV, O'Keeffe GW, Sullivan AM. BMP-Smad 1/5/8 signalling in the development of the nervous system. Prog Neurobiol. (2013) 109:28–41. doi: 10.1016/j.pneurobio.2013.07.002
44. Senormanci O, Karakas Celik S, Valipour E, Dogan V, Senormanci G. Determination of candidate genes involved in schizophrenia using the whole-exome sequencing. Bratisl Lek Listy. (2018) 119:572–6. doi: 10.4149/BLL_2018_104
45. Horiuchi Y, Kondo MA, Okada K, Takayanagi Y, Tanaka T, Ho T, et al. Molecular signatures associated with cognitive deficits in schizophrenia: a study of biopsied olfactory neural epithelium. Transl Psychiatry. (2016) 6:e915. doi: 10.1038/tp.2016.154
46. Jordan VK, Zaveri HP. Scott DA. 1p36 deletion syndrome: an update. Appl Clin Genet. (2015) 8:189–200. doi: 10.2147/TACG.S65698
47. Zai CC, Maes MS, Tiwari AK, Zai GC, Remington G, Kennedy JL. Genetics of tardive dyskinesia: promising leads and ways forward. J Neurol Sci. (2018) 389:28–34. doi: 10.1016/j.jns.2018.02.011
48. Greenbaum L, Alkelai A, Zozulinsky P, Kohn Y, Lerer B. Support for association of HSPG2 with tardive dyskinesia in Caucasian populations. Pharmacogenomics J. (2012) 12:513–20. doi: 10.1038/tpj.2011.32
49. Zai CC, Lee FH, Tiwari AK, Lu JY, de Luca V, Maes MS, et al. Investigation of the HSPG2 gene in tardive dyskinesia - new data and meta-analysis. Front Pharmacol. (2018) 9:974. doi: 10.3389/fphar.2018.00974
50. Katzeff JS, Bright F, Lo K, Kril JJ, Connolly A, Crossett B, et al. Altered serum protein levels in frontotemporal dementia and amyotrophic lateral sclerosis indicate calcium and immunity dysregulation. Sci Rep. (2020) 10:13741. doi: 10.1038/s41598-020-70687-7
51. Nakamura K, Ikeuchi T, Nara K, Rhodes CS, Zhang P, Chiba Y, et al. Perlecan regulates pericyte dynamics in the maintenance and repair of the blood–brain barrier. J Cell Biol. (2019) 218:3506–25. doi: 10.1083/jcb.201807178
52. Pollak TA, Drndarski S, Stone JM, David AS, McGuire P, Abbott NJ. The blood–brain barrier in psychosis. Lancet Psychiatry. (2018) 5:79–92. doi: 10.1016/S2215-0366(17)30293-6
53. Taler M, Aronovich R, Henry Hornfeld S, Dar S, Sasson E, Weizman A, et al. Regulatory effect of lithium on hippocampal blood–brain barrier integrity in a rat model of depressive-like behavior. Bipolar Disord. (2021) 23:55–65. doi: 10.1111/bdi.12962
54. Menard C, Pfau ML, Hodes GE, Kana V, Wang VX, Bouchard S, et al. Social stress induces neurovascular pathology promoting depression. Nat Neurosci. (2017) 20:1752–60. doi: 10.1038/s41593-017-0010-3
55. Tordera RM, Garcia-García AL, Elizalde N, Segura V, Aso E, Venzala E, et al. Chronic stress and impaired glutamate function elicit a depressive-like phenotype and common changes in gene expression in the mouse frontal cortex. Eur Neuropsychopharmacol. (2011) 21:23–32. doi: 10.1016/j.euroneuro.2010.06.016
Keywords: major depressive disorder (MDD), bioinformatical analysis, differentially expressed genes (DEG), integrated analysis, diagnostic model
Citation: Long Q, Wang R, Feng M, Zhao X, Liu Y, Ma X, Yu L, Li S, Guo Z, Zhu Y, Teng Z and Zeng Y (2021) Construction and Analysis of a Diagnostic Model Based on Differential Expression Genes in Patients With Major Depressive Disorder. Front. Psychiatry 12:762683. doi: 10.3389/fpsyt.2021.762683
Received: 16 September 2021; Accepted: 09 November 2021;
Published: 09 December 2021.
Edited by:
Stefania Schiavone, University of Foggia, ItalyReviewed by:
Yogesh Dwivedi, University of Alabama at Birmingham, United StatesCopyright © 2021 Long, Wang, Feng, Zhao, Liu, Ma, Yu, Li, Guo, Zhu, Teng and Zeng. This is an open-access article distributed under the terms of the Creative Commons Attribution License (CC BY). The use, distribution or reproduction in other forums is permitted, provided the original author(s) and the copyright owner(s) are credited and that the original publication in this journal is cited, in accordance with accepted academic practice. No use, distribution or reproduction is permitted which does not comply with these terms.
*Correspondence: Zhaowei Teng, dGVuZ3poYW93ZWkyMDAzQDE2My5jb20=; Yong Zeng, emVuZ3lvbmdAa21tdS5lZHUuY24=
†These authors have contributed equally to this work
‡Present Address: Rui Wang, Collaborative Innovation Center for Western Ecological Safety, Lanzhou University, Lanzhou, China
Disclaimer: All claims expressed in this article are solely those of the authors and do not necessarily represent those of their affiliated organizations, or those of the publisher, the editors and the reviewers. Any product that may be evaluated in this article or claim that may be made by its manufacturer is not guaranteed or endorsed by the publisher.
Research integrity at Frontiers
Learn more about the work of our research integrity team to safeguard the quality of each article we publish.