 Kuk-In Jang
 Sungkean Kim
 Soo Young Kim3
 Chany Lee
 Jeong-Ho Chae
95% of researchers rate our articles as excellent or good
Learn more about the work of our research integrity team to safeguard the quality of each article we publish.
Find out more
ORIGINAL RESEARCH article
Front. Psychiatry , 13 October 2021
Sec. Neuroimaging
Volume 12 - 2021 | https://doi.org/10.3389/fpsyt.2021.745458
This article is part of the Research Topic EEG / MEG Based Diagnosis for Psychiatric Disorders View all 10 articles
Background: Psychiatric diagnosis is formulated by symptomatic classification; disease-specific neurophysiological phenotyping could help with its fundamental treatment. Here, we investigated brain phenotyping in patients with schizophrenia (SZ) and major depressive disorder (MDD) by using electroencephalography (EEG) and conducted machine-learning-based classification of the two diseases by using EEG components.
Materials and Methods: We enrolled healthy controls (HCs) (n = 30) and patients with SZ (n = 34) and MDD (n = 33). An auditory P300 (AP300) task was performed, and the N1 and P3 components were extracted. Two-group classification was conducted using linear discriminant analysis (LDA) and support vector machine (SVM) classifiers. Positive and negative symptoms and depression and/or anxiety symptoms were evaluated.
Results: Considering both the results of statistical comparisons and machine learning-based classifications, patients and HCs showed significant differences in AP300, with SZ and MDD showing lower N1 and P3 than HCs. In the sum of amplitudes and cortical sources, the findings for LDA with classification accuracy (SZ vs. HCs: 71.31%, MDD vs. HCs: 74.55%), sensitivity (SZ vs. HCs: 77.67%, MDD vs. HCs: 79.00%), and specificity (SZ vs. HCs: 64.00%, MDD vs. HCs: 69.67%) supported these results. The SVM classifier showed reasonable scores between SZ and HCs and/or MDD and HCs. The comparison between SZ and MDD showed low classification accuracy (59.71%), sensitivity (65.08%), and specificity (54.83%).
Conclusions: Patients with SZ and MDD showed deficiencies in N1 and P3 components in the sum of amplitudes and cortical sources, indicating attentional dysfunction in both early and late sensory/cognitive gating input. The LDA and SVM classifiers in the AP300 are useful to distinguish patients with SZ and HCs and/or MDD and HCs.
Although psychiatric diagnosis is based on phenomenological distinction of overt features such as behavior, mood, and thought, determination of the neuropathological mechanisms with electroencephalography (EEG) remains challenging. Among the neurophysiologic phenotypes determined using EEG, there is no consistently recommended brain model for schizophrenia (SZ) and major depressive disorder (MDD). Previous EEG studies have focused on pathophysiological distinctions and symptomatic relationships (1–3). The clinical variations in SZ and MDD are very heterogeneous (4–6). Beyond clinical diagnosis based on phenomenological distinctions between SZ and MDD, the definition of EEG endophenotypes using machine learning could provide insights facilitating therapeutic breakthroughs for a variety of pathologic phenotypes (7–10). Especially, classification performance in psychiatric disorders was assured by applying linear discriminant analysis (LDA) and support vector machine (SVM) (11).
Auditory P300 (AP300) is a representative neurophysiological indicator in patients with SZ and depression (12–15); however, some studies provided inconsistent findings for this indicator in depression (16). AP300 includes the N1 and P3 components, which represent the most negative potential at around 100 ms and the most positive potential at around 300 ms following the onset of an auditory stimulus, respectively. Changes in P3 and N1 amplitudes in the midline electrodes are commonly observed (17, 18). Furthermore, the highest peak potential within defined time ranges for each component shows large variations across individuals because each component includes several neurobiological attributes (19, 20). Alternatively, the width of amplitudes within the defined time ranges can also indicate a pathological state (21).
AP300 reflects cognitive processes in auditory responses as well as working memory and attention process (22, 23). N1 has been defined as the neural allocation for early sensory input from the target stimulus (24, 25), and decreased N1 could reflect abnormal early selective attention in SZ and mood disorder (26–29). P3 is a major component of AP300 that is generated by late positive potential from information processing, such as an inputting rare event under ordinary situations (30, 31). N1 and P3 deficiencies are commonly observed in patients with SZ (32, 33). Several studies have also reported delayed latencies and decreased amplitudes of both N1 and P3 in patients with MDD (13, 34–36).
Here, we compared AP300 between healthy controls (HCs) and patients with SZ and MDD. To identify brain phenotypes of SZ and depression, changes in the N1 and P3 components were expressed in three dimensions, namely, peak with latency, sum of amplitudes, and cortical sources, by using radar charts. In addition, we applied machine learning techniques with linear discriminant analysis (LDA) and support vector machine (SVM) classifiers for each two-group classification.
We enrolled 34 patients with SZ (13 men and 21 women), 33 patients with MDD (11 men and 22 women), and 30 HCs (15 men and 15 women). The mean ages of the participants with SZ and MDD and the HCs were 37.21 ± 14.94, 40.03 ± 11.08, and 43.63 ± 12.80 years, respectively. The ages of all participants ranged from 19 to 82 years (mean: 40.15 ± 13.19 years). Participants who had vision or hearing problems, drug and/or alcohol abuse, traumatic brain injury, and a lifetime history of neurological disorders were excluded. Healthy participants with a lifetime history of psychiatric disorders were also excluded. All participants were native Koreans diagnosed using the MINI International Neuropsychiatric Interview of the Diagnostic and Statistical Manual of Mental Disorders, 5th Edition. The Positive and Negative Syndrome Scale (PANSS) (37) was evaluated in patients with SZ, while the Hamilton Depression and Anxiety rating scales (HAMD and HAMA) (38, 39) were evaluated in patients with MDD. The Beck Depression Inventory (BDI) was also evaluated in patients with MDD and HCs (40). All symptomatic evaluations were performed by a trained psychiatrist. Written informed consent was obtained from all the participants. This study followed the relevant guidelines and regulations of the Institutional Review Board of Seoul St. Mary's Hospital College of Medicine, The Catholic University of Korea (approval number: KC09FZZZ0211).
All the participants were seated in a comfortable chair in a sound-attenuated room. The EEG recording was performed using the NeuroScan SynAmps amplifier (Compumedics USA, El Paso, TX, USA) with a 62-channel head cap mounted with AgCl electrodes according to the international extended 10–20 system (FP1, FPz, FP2, AF3, AF4, F7, F5, F3, F1, Fz, F2, F4, F6, F8, FT7, FC5, FC3, FC1, FCz, FC2, FC4, FC6, FT8, T7, C5, C3, C1, Cz, C2, C4, C6, T8, TP7, CP5, CP3, CP1, CPz, CP2, CP4, CP6, TP8, P7, P5, P3, P1, Pz, P2, P4, P6, P8, PO7, PO5, PO3, POz, PO4, PO6, PO8, CB1, O1, Oz, O2, and CB2). Eye movements were detected by electrooculography (EOG) sensors placed above and below the left eye and the outer canthus of both eyes. Bandpass filters ranged from 1 to 100 Hz with a sampling rate of 1000 Hz. The reference and ground channels were located on both the mastoids and forehead, respectively. The impedance was maintained below 5 kΩ during the recording session.
AP300 with an auditory oddball task was conducted in the response-contingent behavior paradigm comprising 200 stimuli delivered using MDR-XB500 headphones (Sony, Tokyo, Japan) at 85 dB SPL with 2,000-ms fixed inter-stimulus intervals. A total of 160 standard tones of 1,000 Hz and 40 target tones of 1,500 Hz were presented randomly. The duration of the tone was 100 ms, and the rise and fall times were 10 ms. The STIM2 system (Compumedics USA, El Paso, TX, USA) was used to synchronize the auditory stimuli and EEG signals. All participants were instructed to press a button promptly when the target tones of 1,500 Hz were presented. A fixation cross was displayed in the middle of the screen during all recording sessions. Above 30-artifact free and -accurate epochs were used in the analyses. Gross artifacts were removed through visual inspection by a trained evaluator who had no information about the origin of the data. Artifacts related to eye blinks and/or movements were rejected in accordance with established mathematical procedures by using SCAN 4.5 and CURRY 8.0 software (41). Based on vertical EOG, positive and negative components exceeding 300 μV from the before- and after-onset stimuli (−100 to 300 ms) were rejected. The data were epoched from before-onset 100 ms to after-onset 700 ms on target stimuli. Pre-stimulus baseline correction was applied, and artifacts exceeding ±100 μV were rejected for all electrodes. The data were bandpass-filtered with a zero-phase shift ranging from 1 to 55 Hz. In the peak with latency, N1 was extracted between 50 and 150 ms post-stimulus. P3 was extracted between 250 and 500 ms. The width of the amplitudes was calculated by summation of all the amplitudes within the defined time ranges.
Cortical source estimation was performed using standardized low-resolution brain electromagnetic tomography (sLORETA) software. Estimation of the EEG inverse problem was conducted at the cortical source regions based on the 6,239 voxels (42). The source densities of N1 and P3 were calculated using mean values within the defined time ranges. ROIs in the cortical source level were selected to examine changes in the default mode network regions and cognitive control network (43, 44). The source activities of ROIs were extracted from the mean voxel values of the selected areas. The selected 14 regions were the left/right superior frontal gyri (SFGs), left/right middle frontal gyri (MFGs), left/right medial frontal gyri (MeFGs), left/right inferior frontal gyri (IFGs), left/right superior temporal gyri (STGs), left/right inferior parietal lobes (IPLs), and left/right precuneus.
Features were selected based on three dimensions: peak with latency (n = 12), sum of amplitudes (n = 7), and cortical sources (n = 28). Dimension-based feature selection was applied. The present study lacked a suitable sample size. Reducing dimension should be performed when the sample sizes and features were sufficiently large to secure acceptable classification performance (45). The classification accuracy, sensitivity, and specificity were evaluated using the 10-by-10-fold cross-validation technique with LDA (46) and linear SVM classifiers (47). Analysis in machine learning was conducted using MATLAB 2019 software with add on toolbox the Bioinformatics and the Statistics and Machine learning (Mathworks, Inc, USA).
Descriptive statistics were analyzed using multivariate analysis of variance (MANOVA), chi-square test, and t-test, as appropriate (Table 1). Age, education, and accepted AP300 trials among the groups were compared using MANOVA. Differences in sex were also examined using the chi-square test. BDI scores between patients with MDD and HCs were compared using t-test. For multivariate analysis with covariance, 49 variables of AP300 were examined as dependent variables among all groups, with age, sex, and education as covariates. Statistical significance was set at p < 0.05, two-tailed. Main-effect comparison was performed using the Bonferroni correction from the original p-values (48). All statistical analyses were performed using IBM SPSS software (version 20.0; IBM Corp., Armonk, NY, USA).
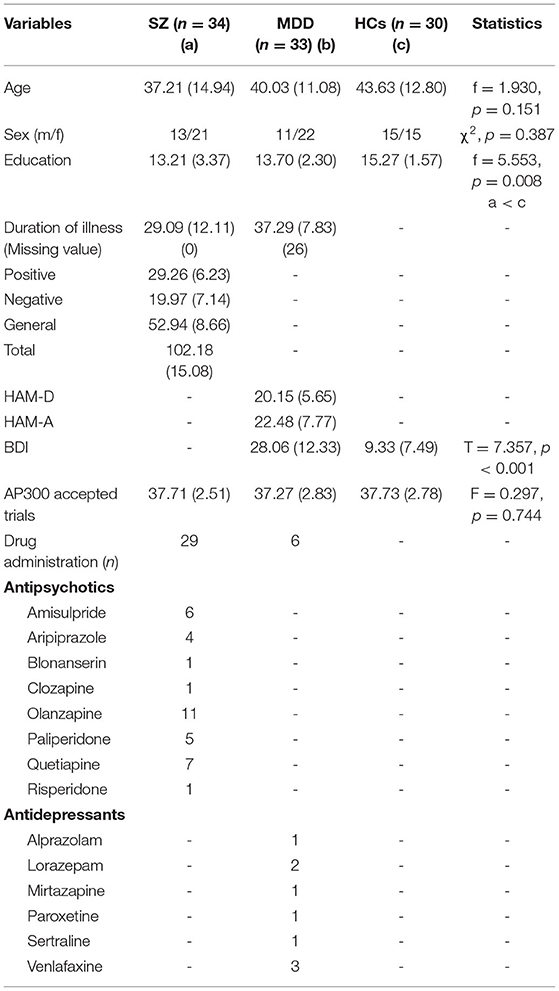
Table 1. Demographic data of the present study.
Descriptive statistics are presented in Table 1. We found no significant differences in age (F = 1.930, p = 0.151) and sex (χ2, p = 0.387) among the three groups. Level of education was significant between patients with SZ and HCs (SZ < HCs, F = 5.553, p = 0.008). The BDI scores significantly differed between HCs and patients with MDD (t = 7.357, p < 0.001). The number of accepted AP300 trials did not differ significantly among the three groups (F = 0.297, p = 0.744).
The present study found significant differences in AP300 among HCs and patients with SZ and MDD [F(2, 91) = 1.704, p = 0.006, η2 = 0.645]. In the assessment of the sum of amplitudes of AP300 (Table 2 and Figure 1A), significant differences were found among patients with SZ, MDD, and HCs (SZ < MDD < HCs, N1-Fz, p < 0.001; SZ < MDD, SZ < HCs, N1-Cz, p = 0.005; SZ < MDD, N1-Pz, p < 0.037; SZ < MDD, SZ < HC, Total value, p = 0.014).
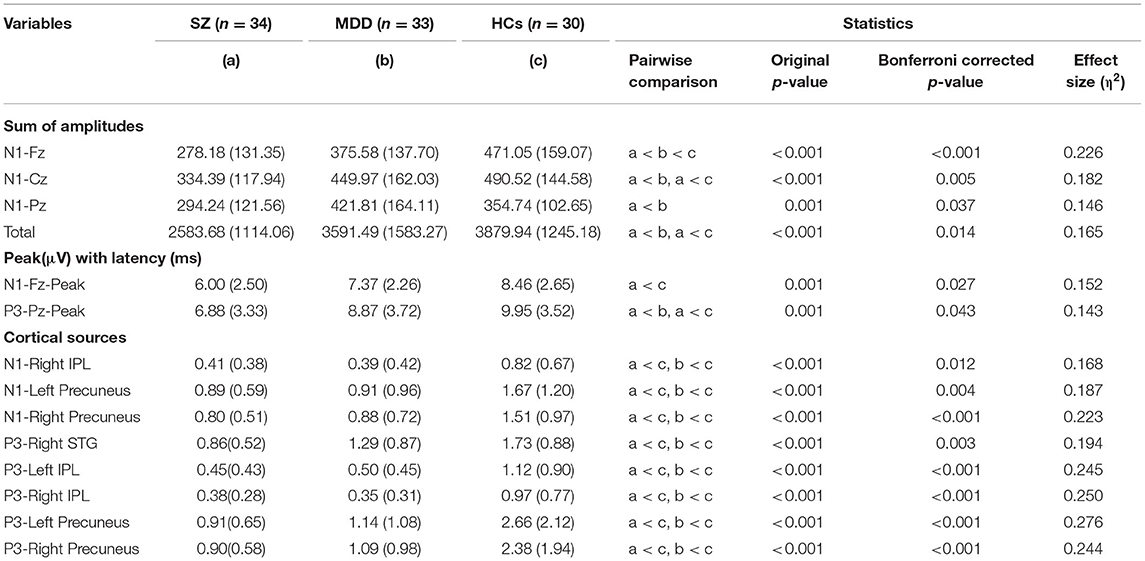
Table 2. Comparisons of AP300 between patients and HCs.
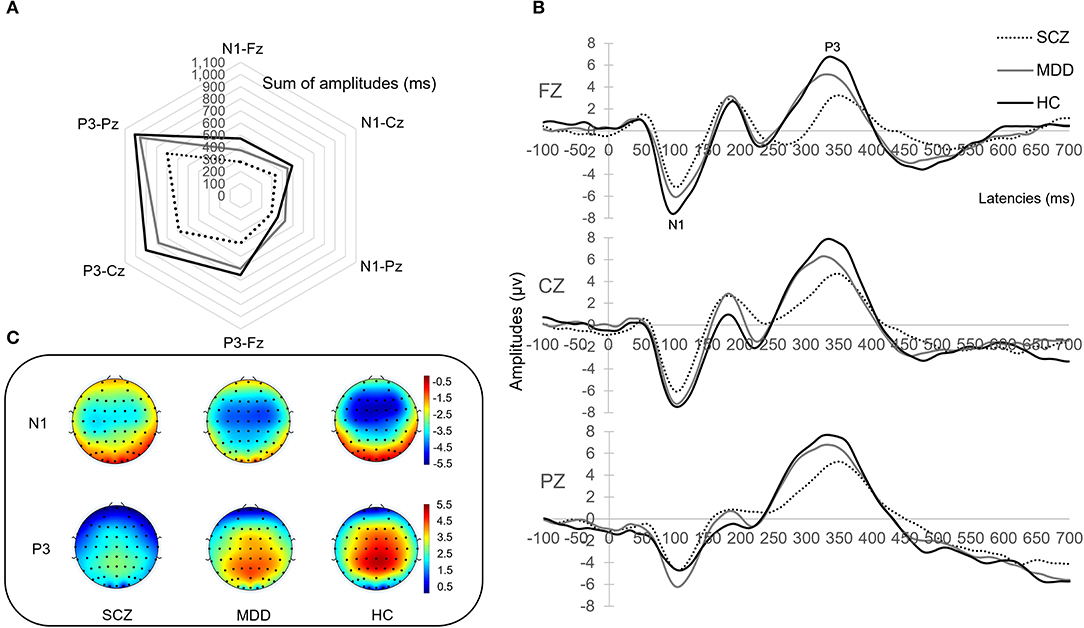
Figure 1. AP300 with brain phenotyping. (A) is the radar chart with sum of amplitudes. (B) is the peak and latency. (C) illustrates topographical map of N1 and P3 between patients and healthy controls.
On evaluating the peak with latency of AP300 (Table 2 and Figures 1B,C), differences were significant (SZ < HCs, N1-Fz-Peak, p = 0.027; SZ < MDD, SZ < HCs, P3-Pz-Peak, p = 0.043). On evaluating the cortical source activities of AP300 (Table 2 and Figure 2), significant differences were found (SZ < HCs, MDD < HCs, N1-R-IPL, p = 0.012; N1-L-Precuneus, p = 0.004; N1-R- Precuneus, p < 0.001; P3-R-STG, p = 0.003; P3-L-IPL, p < 0.001; P3-R-IPL, p < 0.001; P3-L-Precuneus, p < 0.001; P3-R-Precuneus, p < 0.001). There were no significant differences in the assessments of AP300 behavior. Meanwhile, correlations between clinical symptoms and AP300 were not significant (Figure 3).
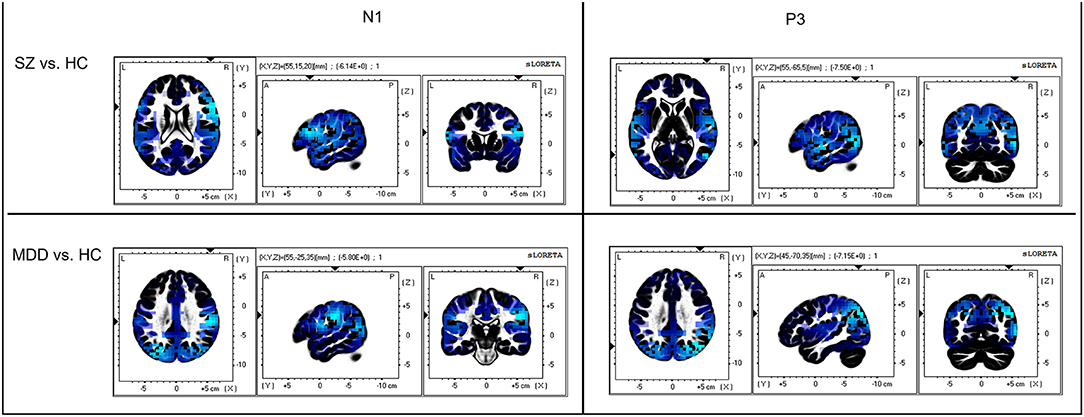
Figure 2. Comparison of AP300 at cortical source level. Blue color indicates cortical source deactivations in patients, compared to healthy controls. The sLORETA has a low-resolution anatomical distribution.
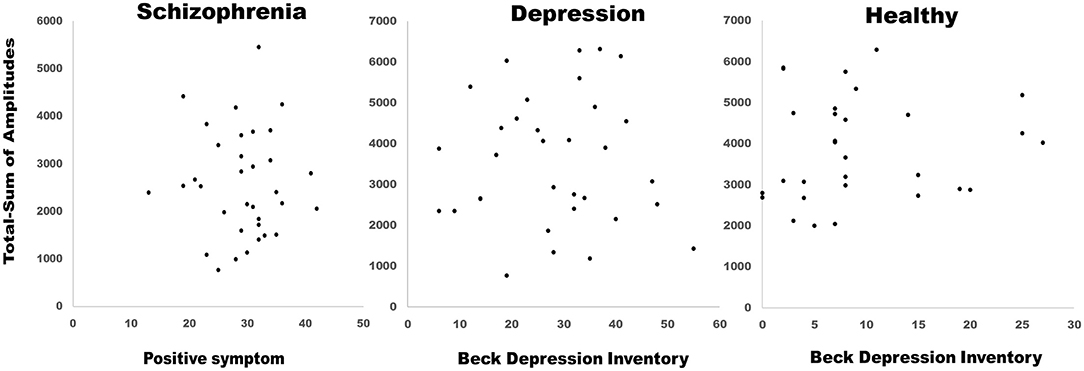
Figure 3. Correlations between clinical symptoms and AP300. Correlations were not significant.
The machine learning results with LDA and SVM are presented in Table 3. The results of the two-group classification are as follows:
Accuracy for sum of amplitudes: SZ vs. MDD, LDA, 59.71%, SVM, 54.48%; SZ vs. HCs, LDA, 71.31%, SVM, 57.81%; and MDD vs. HCs, LDA, 74.55%, SVM, 58.89%. Sensitivity for sum of amplitudes: SZ vs. MDD, LDA, 65.08%, SVM, 56.18%; SZ vs. HCs, LDA, 77.67%; SVM, 56.77%; and MDD vs. HCs, LDA, 79.00%, SVM, 57.58%. Specificity for sum of amplitudes: SZ vs. MDD, LDA, 54.83%, SVM, 52.73%; SZ vs. HCs, LDA, 64.00%, SVM, 59.00%; and MDD vs. HCs, LDA, 69.67%, SVM, 60.33%.
Accuracy for peak with latency: SZ vs. MDD, LDA, 55.75%, SVM, 53.88%; SZ vs. HCs, LDA, 70.74%, SVM, 67.35%; and MDD vs. HCs, LDA, 70.60%, SVM, 70.95%. Sensitivity for peak with latency: SZ vs. MDD, LDA, 57.25%, SVM, 55.00%; SZ vs. HCs, LDA, 69.42%; SVM, 70.00%; and MDD vs. HCs, LDA, 75.17%, SVM, 72.12%. Specificity for peak with latency: SZ vs. MDD, LDA, 55.00%, SVM, 52.73%; SZ vs. HCs, LDA, 72.33%; SVM, 64.33%; and MDD vs. HCs, LDA, 65.33%, SVM, 69.67%.
Accuracy for cortical sources: SZ vs. MDD, LDA, 54.28%, SVM, 54.78%; SZ vs. HCs, LDA, 65.41%, SVM, 71.88%; and MDD vs. HCs, LDA, 55.50%, SVM, 65.87%. Sensitivity for cortical sources: SZ vs. MDD, LDA, 58.25%, SVM, 66.77%; SZ vs. HCs, LDA, 69.25%, SVM, 74.41%; and MDD vs. HCs, LDA, 64.00%, SVM, 81.21%. Specificity for cortical sources: SZ vs. MDD, LDA, 50.08%, SVM, 42.42%; SZ vs. HCs, LDA, 60.67%, SVM, 69.00%; and MDD vs. HCs, LDA, 46.67%, SVM, 49.00%.
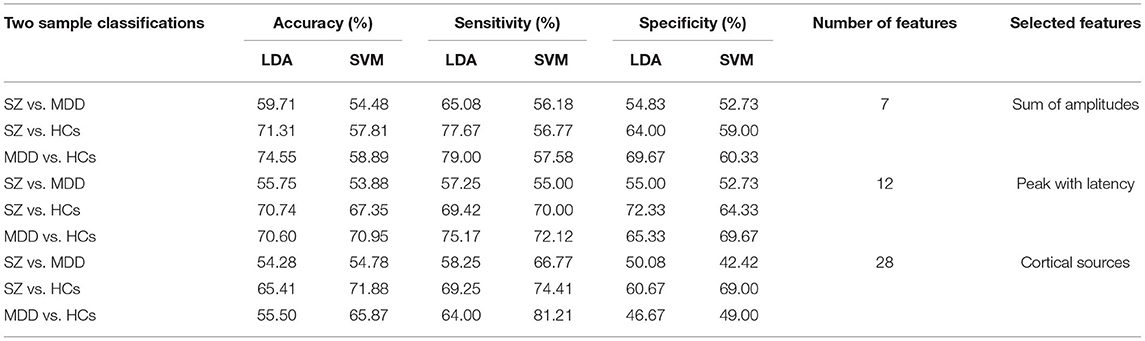
Table 3. Classification using LDA and SVM.
The present study demonstrated differences in AP300 between HCs and patients with SZ and MDD. AP300 with N1 deficiency in patients with SZ and MDD was predominantly found in the sum of the amplitudes. Machine learning-based classification with LDA showed reasonable accuracy and sensitivity between SZ and HCs and/or MDD and HCs. Considering the results of both statistical comparisons and machine learning-based classification, patients with SZ showed defective EEG phenotypes in N1-Fz, N1-Cz, N1-Pz, and total value in the sum of amplitudes. Patients with MDD showed an impaired EEG phenotype in N1-Fz in the sum of amplitudes. In cortical sources, patients with SZ and MDD showed decreased N1 and P3. The SVM classifier showed reasonable sensitivity between SZ and HCs and/or MDD and HCs.
The impaired N1 component in patients with SZ reflects early sensory gating deficits, which lead to a dysfunctional process of attentional information (49). This impaired phenotype is associated with aberrant neural plasticity in SZ patients showing clinical high-risk factors (50). Patients with depression showed delayed latency of N1 and a lower P3 amplitude (36). Deficits in early sensory gating are related to maladaptive initial directions of sensory information, resulting in delayed N1 latency and lower amplitude (49). P3 is an index of the late sensory gating that decodes whether the stimulus is significant or unnecessary (51).
The present study showed significant differences in N1 and P3 between patients with SZ and those with MDD. Compared to patients with MDD, patients with SZ had lower N1 and P3 amplitudes. However, this difference lacked power because classification with machine learning has low accuracy, sensitivity, and specificity. Previous studies reported that high classification performance was identified when sensor and source level EEG features were used together (10). EEG microstate features had higher classification performance than conventional EEG features in patients with SZ (52). In MDD, EEG band frequency features showed a good performance classifying patients and healthy individuals (53). In the present study, the mean and standard deviation in the EEG data could influence the results in statistical comparison, while distributional similarity of the used features between groups could have a possible effect on the lacking power in classification with machine learning. In addition, sociodemographic factors could influence the results. Further studies are warranted in patients with several clinical phenotypes and EEG features.
This study had a few limitations. First, the sample size was small; thus, future studies with large sample sizes should be conducted to verify the results. Second, several clinical phenotypes, such as affective or mood-specific types and psychosis with mood symptoms, need to be considered. Nevertheless, determination of the neuropathological mechanism via EEG phenotyping could provide useful information for the fundamental treatment of psychiatric disorders. This study identified that in sum of amplitude, a neurophysiologic phenotype with an N1 deficit featured in patients with MDD and SZ, indicating a dysfunctional process of early sensory attentional information. Supporting this result was that the LDA classifier showed reasonable accuracy and sensitivity. In cortical sources, a phenotype with deficits in both N1 and P3 was observed in patients with MDD and SZ, reflecting maladaptive early and/or late sensory/cognitive gating inputs. The SVM classifier with sensitivity showed reasonable scores.
The data presented in the current study are available from the first author (K-IJ) or corresponding author (J-HC) upon reasonable request. Requests to access these datasets should be directed to K-IJ.
The studies involving human participants were reviewed and approved by Institutional Review Board of Seoul St. Mary's Hospital College of Medicine, The Catholic University of Korea (approval number: KC09FZZZ0211). The patients/participants provided their written informed consent to participate in this study.
K-IJ, CL, and J-HC contributed to the conception and design of the study. K-IJ, SYK, and CL contributed to the acquisition and analysis of data. K-IJ contributed to drafting the article. K-IJ, SK, CL, SYK, and J-HC contributed to the review of the article. J-HC and CL contributed to the supervision of the study. All authors approved the final version of the article.
This study was supported by a grant from the Korea Health Technology R&D project through the Korea Health Industry Development Institute (KHIDI) (HI17C2272), as well as by the KBRI basic research program through the Korea Brain Research Institute, which is funded by the Ministry of Science and ICT (21-BR-01-13). This study was also supported by Basic Science Research Program through the National Research Foundation of Korea (NRF) funded by the Ministry of Education (2021R1A6A3A01086699).
The authors declare that the research was conducted in the absence of any commercial or financial relationships that could be construed as a potential conflict of interest.
All claims expressed in this article are solely those of the authors and do not necessarily represent those of their affiliated organizations, or those of the publisher, the editors and the reviewers. Any product that may be evaluated in this article, or claim that may be made by its manufacturer, is not guaranteed or endorsed by the publisher.
The Supplementary Material for this article can be found online at: https://www.frontiersin.org/articles/10.3389/fpsyt.2021.745458/full#supplementary-material
1. Earls HA, Curran T, Mittal V. A meta-analytic review of auditory event-related potential components as endophenotypes for schizophrenia: perspectives from first-degree relatives. Schizophrenia Bulletin. (2016) 42:1504-16 doi: 10.1093/schbul/sbw047
2. Singh R, Shukla R, Dalal PK, Sinha PK, Trivedi KJ. P 300 event related potential in depression. Indian J Psychiat. (2000) 42:402–9.
3. O'Donnell BF, McCarley RW, Potts GF, Salisbury DF, Nestor PG, Hirayasu YMA, et al. Shenton. Identification of neural circuits underlying P300 abnormalities in schizophrenia. Psychophysiology. (1999) 36:388–98. doi: 10.1017/s0048577299971688
4. Liang SG, A T. Greenwood. The impact of clinical heterogeneity in schizophrenia on genomic analyses. Schizophrenia Res. (2015) 161:490–5. doi: 10.1016/j.schres.2014.11.019
5. Wolfers T, Doan NT, Kaufmann T, Alnæs D, Moberget TI, Agartz M, et al. Mapping the heterogeneous phenotype of schizophrenia and bipolar disorder using normative models. JAMA Psychiat. (2018) 75:1146–55. doi: 10.1001/jamapsychiatry.2018.2467
6. D. Goldberg. The heterogeneity of “major depression”. World Psychiat. (WPA). (2011) 10:226–8 doi: 10.1002/j.2051-5545.2011.tb00061.x
7. Levitt J, Edhi MM, Thorpe RV, Leung JW, Michishita M, Koyama SS, et al. Pain phenotypes classified by machine learning using electroencephalography features. NeuroImage. (2020) 223:117256. doi: 10.1016/j.neuroimage.2020.117256
8. N. Hackett. QEEG phenotypes, depression and TMS. Progress Neurology Psychiatry. (2018) 22:23−6. doi: 10.1002/pnp.510
9. Mumtaz W, Ali SSA, Yasin MAM, Malik AS. A machine learning framework involving EEG-based functional connectivity to diagnose major depressive disorder (MDD). Med Biol Eng Comput. (2018) 56:233–46. doi: 10.1007/s11517-017-1685-z
10. Shim M, Hwang HJ, Kim DW, Lee SH, Im HC. Machine-learning-based diagnosis of schizophrenia using combined sensor-level and source-level EEG features. Schizophr Res. (2016) 176:314–9. doi: 10.1016/j.schres.2016.05.007
11. Quaak M, L. van de Mortel. Thomas RM, van Wingen G. Deep learning applications for the classification of psychiatric disorders using neuroimaging data: Systematic review and meta-analysis. NeuroImage Clinical. (2021) 30:102584. doi: 10.1016/j.nicl.2021.102584
12. Zhou L, Wang G, Nan C, Wang H, Liu Z, Bai H. Abnormalities in P300 components in depression: an ERP-sLORETA study. Nord J Psychiatry. 73:1–8 (2019) doi: 10.1080/08039488.2018.1478991
13. Klawohn J, Santopetro NJ, Meyer AG. Hajcak. Reduced P300 in depression: Evidence from a flanker task and impact on ERN, CRN, and Pe. Psychophysiology. (2020) 57:e13520. doi: 10.1111/psyp.13520
14. Chang W-H, Chen K-C, Yang Y-K, Chen P-S, Lu R-B, Yeh T-L, et al. Association between auditory P300, psychopathology, and memory function in drug-naïve schizophrenia. Kaohsiung J Med Sci. (2014) 30:133–8. doi: 10.1016/j.kjms.2013.10.003
15. D. Blackwood. P300, a state and a trait marker in schizophrenia. Lancet. (2000) 355:771–2. doi: 10.1016/s0140-6736(99)00261-5
16. Sara G, Gordon E, Kraiuhin C, Coyle S, Howson A, Meares R. The P300 ERP component: an index of cognitive dysfunction in depression? J Affect Disord. (1994) 31:29–38 doi: 10.1016/0165-0327(94)90124-4
17. Johnson R Jr. On the neural generators of the P300 component of the event-related potential. Psychophysiol. (1993) 30:90–7. doi: 10.1111/j.1469-8986.1993.tb03208.x
18. Simons CJP, Sambeth A, Krabbendam L, S. Pfeifer, van Os J, Riedel WJ. Auditory P300 and N100 components as intermediate phenotypes for psychotic disorder: Familial liability and reliability. Clinical Neurophysiology. (2011) 122:1984–90. doi: 10.1016/j.clinph.2011.02.033
19. Won K, Kwon M, Jang S, Ahn M, Jun SC. P300 Speller Performance Predictor Based on RSVP Multi-feature. Front Hum Neurosci. (2019) 13:261. doi: 10.3389/fnhum.2019.00261
20. Pfabigan D, Seidel E, Sladky R, Hahn A, Paul KA. Grahl, et al. P300 amplitude variation is related to ventral striatum BOLD response during gain and loss anticipation: An EEG and fMRI experiment. Neuroimage. (2014) 96:12–21. doi: 10.1016/j.neuroimage.2014.03.077
21. MacGregor LJ, Pulvermüller F, van Casteren M, Shtyrov Y. Ultra-rapid access to words in the brain. Nat Commun. (2012) 3:711. doi: 10.1038/ncomms1715
22. Chayasirisobhon WV, Chayasirisobhon S, Tin SN, Leu N, Tehrani K, McGuckin JS. Scalp-recorded auditory P300 event-related potentials in new-onset untreated temporal lobe epilepsy. Clin EEG Neurosci. (2007) 38:168–71. doi: 10.1177/155005940703800314
23. Donchin E, Coles HMG. Is the P300 component a manifestation of context updating? Behavioral Brain Sci. (1988) 11:357–74 doi: 10.1017/S0140525X00058027
24. Citherlet D, Boucher O, Tremblay J, Robert M, Gallagher A, Bouthillier A, et al. Spatiotemporal dynamics of auditory information processing in the insular cortex: an intracranial EEG study using an oddball paradigm. Brain Struct Funct. (2020) 225:1537–59 doi: 10.1007/s00429-020-02072-z
25. Thoma L, Rentzsch J, Gaudlitz K, Tänzer N, Gallinat J, Kathmann N, et al. P50, N100, and P200 Sensory Gating in Panic Disorder. Clin EEG Neurosci. (2020) 51:317–24 doi: 10.1177/1550059419899324
26. Baskaran, Milev R. S R. McIntyre. A review of electroencephalographic changes in diabetes mellitus in relation to major depressive disorder. Neuropsychiatr Dis Treat. (2013) 9:143–50. doi: 10.2147/ndt.S38720
27. Sumich, Harris A, Flynn G, Whitford T, Tunstall N, V. Kumari, et al. Event-related potential correlates of depression, insight and negative symptoms in males with recent-onset psychosis. Clin Neurophysiol. (2006) 117:1715–27 doi: 10.1016/j.clinph.2006.04.017
28. Strik WK, Dierks T, Böning J, Osterheider M, Caspari A, Körber J. Disorders of smooth pursuit eye movement and auditory N100 in schizophrenic patients. Psychiatry Res. (1992) 41:227–35. doi: 10.1016/0165-1781(92)90004-m
29. Ford JM, Mathalon DH, Kalba S, Marsh L. Pfefferbaum: N1 A, and P300 abnormalities in patients with schizophrenia, epilepsy, and epilepsy with schizophrenialike features. Biol Psychiat. (2001) 49:848–60 doi: 10.1016/s0006-3223(00)01051-9
30. Linden DEJ. The P300: where in the brain is it produced and what does it tell us? Neuroscientist. (2005) 11:563–76. doi: 10.1177/1073858405280524
31. Polich J, Eischen SE, G. E. Collins. P300 from a single auditory stimulus. Electroencephalography and Clinical Neurophysiology/Evoked Potentials Section, 92:253-261 (1994) doi: 10.1016/0168-5597(94)90068-X
32. Huang M-W, Chou H-CF, Lo P-Y, Cheng K-S. A comparative study on long-term evoked auditory and visual potential responses between Schizophrenic patients and normal subjects. BMC Psychiat. (2011) 11:74. doi: 10.1186/1471-244X-11-74
33. Jeon YW, Polich J. Meta-analysis of P300 and schizophrenia: patients, paradigms, practical implications. Psychophysiol. (2003) 40:684–701. doi: 10.1111/1469-8986.00070
34. Kawasaki T, Tanaka S, Wang J, Hokama H, Hiramatsu K. Abnormalities of P300 cortical current density in unmedicated depressed patients revealed by LORETA analysis of event-related potentials. Psychiatry Clin Neurosci. (2004) 58:68-75. doi: 10.1111/j.1440-1819.2004.01195.x
35. Santopetro NJ, Brush CJ, Bruchnak A, Klawohn J, Hajcak G. A reduced P300 prospectively predicts increased depressive severity in adults with clinical depression. Psychophysiol. (2021) 58:e13767. doi: 10.1111/psyp.13767
36. Urretavizcaya M, Moreno I, Benlloch L, Cardoner N, Serrallonga J, Menchón JM, et al. Auditory event-related potentials in 50 melancholic patients: increased N100, N200 and P300 latencies and diminished P300 amplitude. J Affect Disord. (2003) 74:293–7 doi: 10.1016/s0165-0327(02)00016-2
37. Kay SR, Fiszbein A, Opler LA. The Positive and Negative Syndrome Scale (PANSS) for Schizophrenia. Schizophrenia Bulletin. (1987) 13:261–76. doi: 10.1093/schbul/13.2.261
38. Hamilton M. The assessment of anxiety states by rating. Br J Med Psychol. (1959) 32:50–5. doi: 10.1111/j.2044-8341.1959.tb00467.x
39. Hamilton M. A rating scale for depression. J Neurology, Neurosurgery, Psychiatry. (1960) 23:56–62 doi: 10.1136/jnnp.23.1.56
40. Song Y-M, Lee H-K, Kim JW, Lee K. Reliability and validity of the Korean version of beck depression inventory-II via the internet: results from a University Student Sample. J Korean Neuropsychiatr Assoc. (2012) 51:402-8. doi: 10.4306/jknpa.2012.51.6.402
41. Semlitsch HV, Anderer P, Schuster PO. Presslich. A solution for reliable and valid reduction of ocular artifacts, applied to the P300 ER. Psychophysiol. (1986) 23:695–703.
42. Pascual-Marqui RD, Michel CM, Lehmann D. Low resolution electromagnetic tomography: a new method for localizing electrical activity in the brain. Int J Psychophysiol. (1994) 18:49–65. doi: 10.1016/0167-8760(84)90014-X
43. Harrison J, Pujol J, López-Solà M, Hernández-Ribas R, Deus J, Ortiz H, et al. Consistency and functional specialization in the default mode brain network. Proceedings of the National Academy of Sciences. (2008) 105:9781. doi: 10.1073/pnas.0711791105
44. Januszko P, Gmaj B, Piotrowski T, Kopera M, Klimkiewicz A, Wnorowska A, et al. Delta resting-state functional connectivity in the cognitive control network as a prognostic factor for maintaining abstinence: An eLORETA preliminary study. Drug Alcohol Dependence. (2021) 218:108393. doi: 10.1016/j.drugalcdep.2020.108393
45. Althnian, AlSaeed D, Al-Baity H, Samha A, Dris AB, Alzakari N, Abou Elwafa A, Kurdi H. Impact of dataset size on classification performance: an empirical evaluation in the medical domain. Applied Sci. (2021) 11. doi: 10.3390/app11020796
46. R. A. Fisher. The use of multiple measurements in taxonomic problems. Ann Eugenics. (1936) 7:179–88. doi: 10.1111/j.1469-1809.1936.tb02137.x
47. Schlögl, Lee F, Bischof H, Pfurtscheller G. Characterization of four-class motor imagery EEG data for the BCI-competition 2005. J Neural Eng. (2005) 2:L14–22. doi: 10.1088/1741-2560/2/4/l02
48. Y. Hochberg. A sharper bonferroni procedure for multiple tests of significance. Biometrika. (1988) 75:800–2. doi: 10.2307/2336325
49. Shen C-L, Chou T-L, Lai W-S, Hsieh MH, Liu C-C, Liu C-M, Hwu H-G. P50, N100, and P200 auditory sensory gating deficits in schizophrenia patients. Front Psychiat. (2020) 11:868. doi: 10.3389/fpsyt.2020.00868
50. Gonzalez-Heydrich J, Enlow MB, D'Angelo E, Seidman LJ, Gumlak S, Kim A, et al. N100 repetition suppression indexes neuroplastic defects in clinical high risk and psychotic youth. Neural plasticity. (2016) 2016:4209831. doi: 10.1155/2016/4209831
51. Micoulaud-Franchi JA, Lopez R, Cermolacce M, Vaillant F, Péri P, Boyer L, et al. Sensory gating capacity and attentional function in adults with adhd: a preliminary neurophysiological and neuropsychological study. J Atten Disord. (2019) 23:1199–209. doi: 10.1177/1087054716629716
52. Kim K, Duc NT, Choi M, Lee B. EEG microstate features for schizophrenia classification. PLoS ONE. (2021) 16:e0251842. doi: 10.1371/journal.pone.0251842
Keywords: electroencephalographic phenotyping, machine learning, auditory P300, schizophrenia, major depressive disorder
Citation: Jang K-I, Kim S, Kim SY, Lee C and Chae J-H (2021) Machine Learning-Based Electroencephalographic Phenotypes of Schizophrenia and Major Depressive Disorder. Front. Psychiatry 12:745458. doi: 10.3389/fpsyt.2021.745458
Received: 22 July 2021; Accepted: 14 September 2021;
Published: 13 October 2021.
Edited by:
Junpeng Zhang, Sichuan University, ChinaReviewed by:
Peng Xie, Chongqing Medical University, ChinaCopyright © 2021 Jang, Kim, Kim, Lee and Chae. This is an open-access article distributed under the terms of the Creative Commons Attribution License (CC BY). The use, distribution or reproduction in other forums is permitted, provided the original author(s) and the copyright owner(s) are credited and that the original publication in this journal is cited, in accordance with accepted academic practice. No use, distribution or reproduction is permitted which does not comply with these terms.
*Correspondence: Chany Lee, Y2hhbnlsZWVAa2JyaS5yZS5rcg==; Jeong-Ho Chae, YWxiZXJ0b0BjYXRob2xpYy5hYy5rcg==
Disclaimer: All claims expressed in this article are solely those of the authors and do not necessarily represent those of their affiliated organizations, or those of the publisher, the editors and the reviewers. Any product that may be evaluated in this article or claim that may be made by its manufacturer is not guaranteed or endorsed by the publisher.
Research integrity at Frontiers
Learn more about the work of our research integrity team to safeguard the quality of each article we publish.