 Su Mi Park1†
 Boram Jeong2
 Da Young Oh1
 Chi-Hyun Choi1
 Hee Yeon Jung1,3,4
 Jun-Young Lee1,3
 Donghwan Lee2*
 Jung-Seok Choi1,3*
- 1Department of Psychiatry, SMG-SNU Boramae Medical Center, Seoul, South Korea
- 2Department of Statistics, Ewha Womans University, Seoul, South Korea
- 3Department of Psychiatry and Behavioral Science, Seoul National University College of Medicine, Seoul, South Korea
- 4Institute of Human Behavioral Medicine, Seoul National University Medical Research Center, Seoul, South Korea
We aimed to develop a machine learning (ML) classifier to detect and compare major psychiatric disorders using electroencephalography (EEG). We retrospectively collected data from medical records, intelligence quotient (IQ) scores from psychological assessments, and quantitative EEG (QEEG) at resting-state assessments from 945 subjects [850 patients with major psychiatric disorders (six large-categorical and nine specific disorders) and 95 healthy controls (HCs)]. A combination of QEEG parameters including power spectrum density (PSD) and functional connectivity (FC) at frequency bands was used to establish models for the binary classification between patients with each disorder and HCs. The support vector machine, random forest, and elastic net ML methods were applied, and prediction performances were compared. The elastic net model with IQ adjustment showed the highest accuracy. The best feature combinations and classification accuracies for discrimination between patients and HCs with adjusted IQ were as follows: schizophrenia = alpha PSD, 93.83%; trauma and stress-related disorders = beta FC, 91.21%; anxiety disorders = whole band PSD, 91.03%; mood disorders = theta FC, 89.26%; addictive disorders = theta PSD, 85.66%; and obsessive–compulsive disorder = gamma FC, 74.52%. Our findings suggest that ML in EEG may predict major psychiatric disorders and provide an objective index of psychiatric disorders.
Introduction
As the standard of clinical practice, the establishment of psychiatric diagnoses is categorically and phenomenologically based. According to the International Classification of Disorders (ICD) and the Diagnostic and Statistical Manual for Mental Disorders (DSM) (1, 2), clinicians interpret explicit and observable signs and symptoms and provide categorical diagnoses based on which those symptoms fall into. This descriptive nosology enhances the simplicity of communication; however, it is limited by potentially insufficient objectivity as it relies on observation by the clinician and/or the presenting complaints reported by the patient or informant. In addition, the current system does not encompass psychopathology, in that symptom heterogeneity in the same category of disorder, or homogeneity among other disorders often is present. Research has found that symptom-focused diagnosis limits the focus of treatment to symptom relief only; therefore, data-driven approaches to study neural/biological mechanisms, such as the Research Domain Criteria project by the National Institute of Mental Health, have recently been used as a diagnostic aid (3, 4).
In mental healthcare, advances in data and computational science are rapidly changing. With respect to neural mechanisms and objective markers, the extent of evidence that we can measure has broadened. Additionally, use of machine learning (ML), such as artificial intelligence, has increased. Using out-of-sample estimates, ML can prospectively assess the performance of predictions on unseen data (test data) not used prior to model fitting (training data), thereby providing individualized information and yielding results with a potentially high level of clinical translation (5). This approach is contrary to classical inference based on null hypothesis tests (e.g., t-test, analysis of variance), which retrospectively focuses on in-sample estimates and group differences and thus lacks personalized explanation (6). ML is expected to help or possibly replace clinician decisions such as diagnosis, prediction, and prognosis or treatment outcomes (7).
The majority of current neuroimaging research (i.e., using functional magnetic resonance imaging) has applied supervised ML for diagnostic classification between patients and healthy controls (HCs). Studies have predominantly focused on Alzheimer's disease, schizophrenia, and depression (8–10) but have more recently expanded to other diagnostic topics (11). The literature suggests that ML can be used to discriminate psychiatric disorders using brain data with over 75% accuracy (12). A recent review (13) that used a support vector machine (SVM), a common ML method, to assess imaging data found that it is possible to distinguish patients with schizophrenia from HCs as follows: 17 of 22 studies found over 80% accuracy for the classification of validation data and top approaches, respectively (14).
Many imaging studies have compared HCs with subjects with one or several disorders, but few have comprehensively compared many disorders. This may be because acquiring imaging data is associated with high costs, especially when including sufficient patients for each group, a prerequisite for applying any supervised ML algorithm. Another alternative that can measure brain activity is electroencephalography (EEG), which delivers information about voltage measured through electrodes placed on the scalp. EEG is non-invasive, cost-effective, and suitable for measuring resting-state brain activity in natural settings, allowing easy acquisition of large amounts of data. In addition, as the acquisition technology is simplified and the calculation method is advanced, EEG is gaining attention as a core technology of brain–computer interface (BCI). One recent EEG study suggested that EEG spectra ML, using linear discriminant analysis learning method, can discriminate patients with schizophrenia from HCs with an accuracy of 80.66% (15); however, the main trend has been to differentiate between patients with single disorders [e.g., schizophrenia, depression, addiction, and post-traumatic stress disorder (PTSD), and dementia] and HCs (16–19). Notably, EEG features used for classification have differed from study to study; however, EEG studies that include a variety of psychiatric disorders are beginning to emerge (20).
Here, we aimed to establish novel classifiers for discriminating patients with major psychiatric disorders from HCs. We retrospectively collected EEG data of patients with six main categories of psychiatric disorders (i.e., schizophrenia, mood disorders, anxiety disorders, obsessive–compulsive disorders, addictive disorders, and trauma and stress-related disorders) and their specific diagnoses (i.e., depressive and bipolar disorders), excluding neurodevelopmental disorders. To increase the utility of our results, classification models were constructed using spectral power and functional connectivity (FC) features, which are commonly used EEG parameters in clinical settings (21, 22). Selected from ML methods, SVM and random forest (RF) were applied, which have been widely used in various fields of disease diagnosis; however, they struggled to explain the results of the model. Hence, we also performed a penalized logistic regression method, elastic net (EN) (23), to explain the results from the multivariate EEG parameters and facilitate a comparison of major discriminant features between disorders.
Materials and Methods
Experimental Subjects
Data were collected retrospectively from medical records, psychological assessment batteries, and quantitative EEG (QEEG) at resting-state assessments from January 2011 to December 2018 from the Seoul Metropolitan Government-Seoul National University (SMG-SNU) Boramae Medical Center in Seoul, South Korea. The original diagnostic decision for clinical patients who visited the medical center was made by a psychiatrist based on DSM-IV or DSM-5 criteria and was also assessed using the Mini-International Neuropsychiatric Interview during psychological assessments. Final clinical confirmation of the primary diagnosis was established by two psychiatrists and two psychologists from March 2019 to August 2019, who reviewed both the original diagnoses in electrical medical records and psychological assessments that had been completed 1 month before and after QEEG. Concurrently, we included a HC sample (n = 95), which was selected from the studies performed at the SMG-SNU Boramae Medical Center. The final analyses included 945 subjects. The inclusion criteria were as follows: age from 18 to 70 years; diagnosis of the following primary diagnoses, which fall into six large-category diagnoses and nine specific diagnoses: schizophrenia (n = 117), mood disorders [(n = 266); depressive disorder (n = 119) and bipolar disorders (n = 67)], anxiety disorders [(n = 107); panic disorder (n = 59) and social anxiety disorders (n = 48)], obsessive–compulsive disorder (n = 46), addictive disorders [(n = 186); alcohol use disorder (n = 93) and behavioral addiction including gambling and Internet gaming disorders (n = 93)], and trauma and stress-related disorders [(n = 128); PTSD (n = 52), acute stress disorder (n = 38), and adjustment disorder (n = 38)]; and no difficulty in reading, listening, writing, or understanding Hangeul (Korean language). The exclusion criteria were as follows: lifetime and current medical history of a neurological disorder or brain injury, neurodevelopmental disorder [i.e., intellectual disability [intelligence quotient (IQ) < 70] or borderline intellectual functioning (70 < IQ < 80), tic disorder, or attention deficit hyperactivity disorder), or any neurocognitive disorder. Ethical Approval.
This study was approved by the institutional review board (20-2019-16). In accordance with the retrospective study design, participant consent was waived.
EEG Settings and Parameters
EEG data included 5 min eyes-closed resting-state with 19 or 64 channels acquired with 500–1,000 Hz sampling rate and 0.1–100 on-line filters via Neuroscan (Scan 4.5; Compumedics NeuroScan, Victoria, Australia). Electrode impedances were kept below 5 kΩ by application of an abrasive and electrically conductive gel. In the analysis, the EEG data were down-sampled to 128 Hz, and 19 channels were selected based on the international 10–20 system in conjunction with a mastoid reference electrode as follows: FP1, FP2, F7, F3, Fz, F4, F8, T7, C3, Cz, C4, T8, P7, P3, Pz, P4, P8, O1, and O2. The ground channel was located between the FPz and Fz electrodes. Using the Neuroguide system (NG Deluxe 3.0.5; Applied Neuroscience, Inc., Largo, FL, USA), continuous EEG data were converted into the frequency domain using the fast Fourier transformation (FFT) with the following parameters: epoch = 2 s, sample rate = 128 samples/s (256 digital time points), frequency range = 0.5–40 Hz, and a resolution of 0.5 Hz with a cosine taper window to minimize leakage. Due to the mathematics of the FFT, a single epoch of time will be noisy; we used at least 60 s length of time. Details for EEG pre-processing and artifact rejection are described in a previous study (24) and are also provided in the online supplement. In the current study, power spectral density (PSD; μV2/Hz) and FC were included as EEG parameters. Each EEG parameter was calculated in the following frequency bands: delta (1–4 Hz), theta (4–8 Hz), alpha (8–12 Hz), beta (12–25 Hz), high beta (25–30 Hz), and gamma (30–40 Hz). PSD is the actual spectral power measured at the sensor level, and the absolute power value in each frequency band was included. FC was represented by coherence value, a measure of synchronization between two signals based on phase consistency (25, 26). To minimize the effects of windowing in the FFT (27), an EEG sliding average of the 256-point FFT cross-spectral matrix was computed for each subject. The EEG data were edited by advancing in 64-point steps (75% overlap), recomputing the FFT, and continuing with the 64-point sliding window of the 256-point FFT cross-spectrum for the entire edited EEG record. The mean, variance, standard deviation, sum of squares, and squared sum of the real (cosine) and imaginary (sine) coefficients of the cross-spectral matrix were computed across the sliding average of the edited EEG for all 19 channels for a total number of 81 and 1,539 log-transformed elements for each participant. The following equation was used to calculate coherence (28):
and
a(x) = cosine coefficient for the frequency (f) for channel x; b(x) = sine coefficient for the frequency (f) for channel x; u(y) = cosine coefficient for the frequency (f) for channel y; and v(y) = sine coefficient for the frequency (f) for channel y. Supplementary Figures 1–4 provide linked-ear topographic maps for PSD and FC.
Data Analysis
Statistical Analysis
Descriptive statistics were used to examine the overall distribution of the demographic characteristics for each participant (Table 1). To test the difference of demographic variables between each clinical subject and HC, t-tests and chi-squared tests were performed for continuous and binary variables, respectively. The patterns of these variables were different between clinical participants, age, sex, and/or years of education; therefore, their effects were included in the model for adjustment in further analyses. Furthermore, IQ is a major psychological variable that can be associated with QEEG (29) and can be considered a result of psychiatric symptoms (i.e., psychomotor retardation). Therefore, subsequent analyses compared models with adjusted and unadjusted IQ. Statistical analyses were conducted using R (version 3.6.3; https://www.r-project.org).
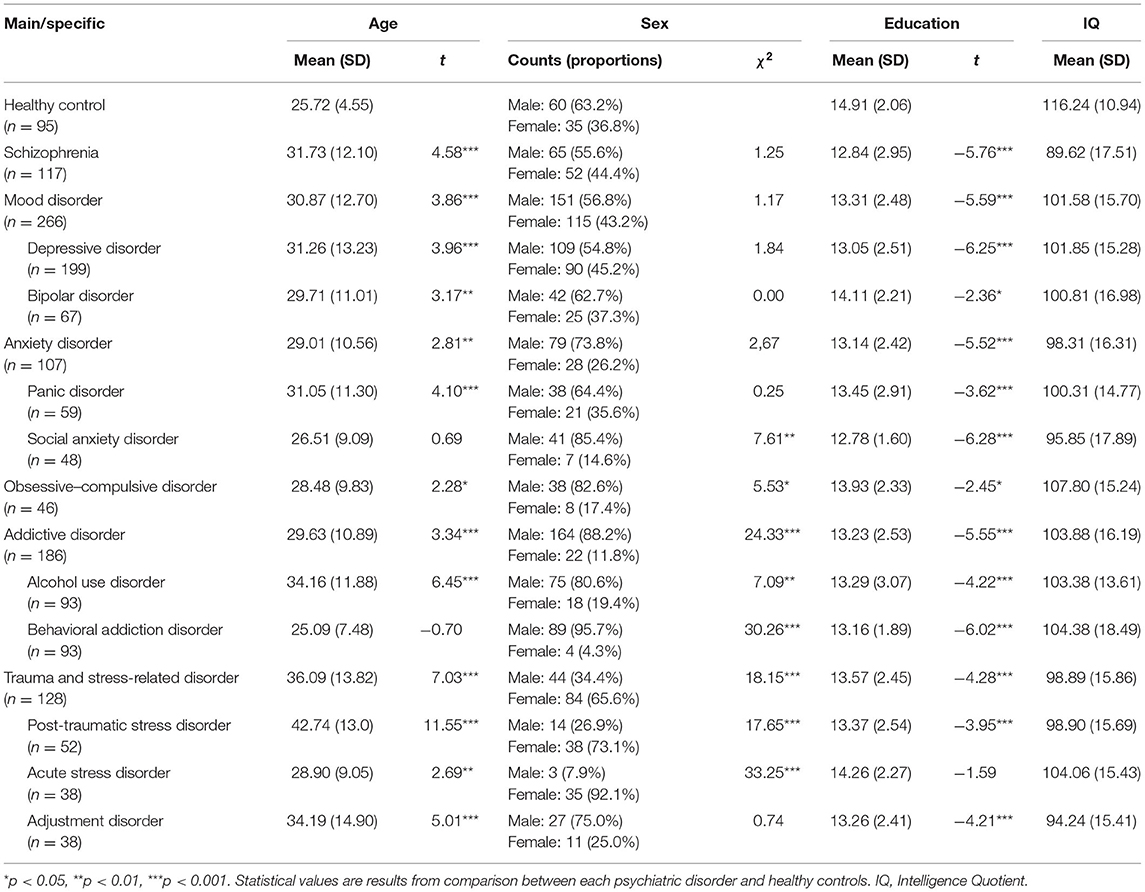
Table 1. Demographic characteristics of samples.
Classification of Psychiatric Disorders Based on QEEG
Feature Combination
For QEEG, feature combinations that were computed in classification models were a mixture of the following conditions: QEEG parameters including PSD (number of features = 19), FC (number of features = 171), and PSD + FC (number of features = 190); QEEG parameters in each frequency band including delta, theta, alpha, beta, high beta, gamma, and all six bands; and adjusting for age, sex, education, and IQ. The number of features computed in the ML model ranged from 22 (i.e., 19 channel PSD in the delta band + age + sex + education) to 1,144 [i.e., (19 channel PSD + 171 pair FC) × all six bands + age + sex + education + IQ; Figure 1].
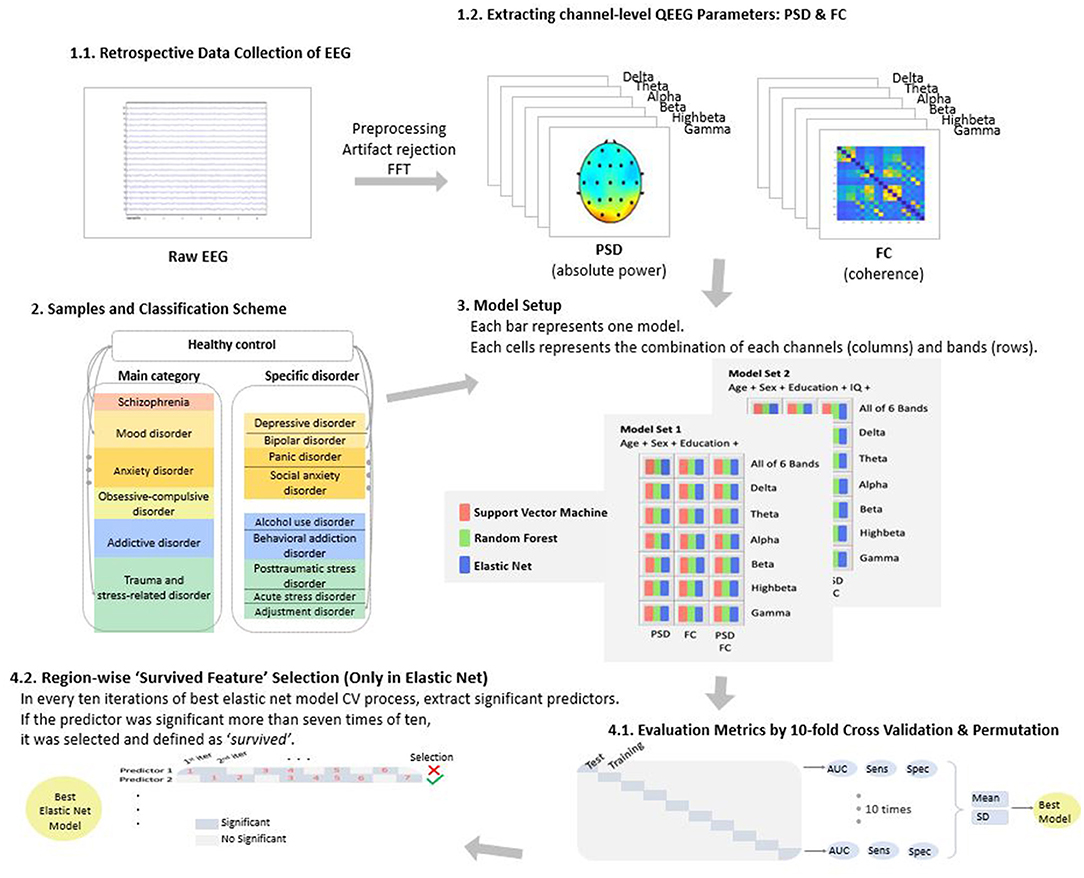
Figure 1. Overview of the study. EEG, electroencephalography; QEEG, quantitative EEG; PSD, power spectrum density; FC, functional connectivity; and FFT, fast Fourier transformation.
Classification Model
We considered three ML methods for classifying psychiatric disorders: SVM, RF, and logistic regression with EN penalty.
SVM
SVM is one of the most frequently used ML methods in binary classification. The main idea of SVM is to find a linear separating hyperplane that maximizes the margin—that is, the largest distance gap between the two group's data points (30). In general, most data cannot be linearly divided, so original data are mapped to a linearly separable high-dimensional space through the so-called kernel trick. The main hyperparameter of SVM is the regularization amount related with the size of the margin. It prevents the model from overfitting and improves the predictability of new data. We determined this hyperparameter with a grid search method, which finds the optimal parameter value in candidates from a grid of parameter values. The range of candidate values was set to (0.1, 0.5, 1, 5, 10). For SVM fitting, we used the R-package rminer, which provides various classification and regression methods, including SVM, under the same coherent function structure. In addition, it also allows us to tune the hyperparameters of the models.
RF
RF (31) is based on an ensemble technique that makes better predictions by combining multiple decision trees. The performance of a single decision tree is unstable since the generated decision trees differ according to the training dataset. To handle this problem, RF uses a bagging technique that builds many trees that randomly extract only some features and averages them. RF generally has a high level of performance by reducing the variance of prediction compared to that of a single model. The main hyperparameter of RF is the number of features randomly extracted when building a tree. Following Hastie et al. (32) we used the default value for the classification problem: the squared root of the total number of features. We used the R-package random Forest, which allows to fit RF by performing classification based on a forest of trees using random inputs and can examine the importance of each variable in the created model.
EN
When applying logistic classification with high-dimensional features, penalized logistic classification is commonly used for avoiding the ill-posed problem. Among the various penalty terms, the EN introduced by Zou and Hastie (23) works well when the input features are strongly correlated. Because the EN penalty is a compromise of the ridge and lasso penalty, it can effectively select the relevant variables and encourage highly correlated variables to be averaged. EN has a hyperparameter that indicates the amount of penalty used in the model. The optimal value of λ was selected by K-fold cross-validation. The R-package glmnet was used for fitting EN. glmnet is a package that fits classification or regression models via penalized maximum likelihood. It can handle lasso, EN, and ridge penalty through the regularization parameter λ; it provides the fast automatic search algorithm for finding the optimal value of λ.
Cross-Validation and Feature Extraction. The performance of all models was compared based using 10-fold cross-validation, which partitions the original sample into 10 disjointed subsets, using nine of those subsets in the training process, and then making predictions about the remaining subset. Furthermore, for each fold, EN extracts the relevant features, which have non-zero estimates of regression coefficients. If the estimates of a feature were not zero more than seven times among 10-fold groups, we considered the feature to have “survived.”
Permutation Test. We conducted a permutation test to assess the significance of each of the best EN models. We generated 1,000 random permutations and constructed the null distribution of the area under curve (AUC) (33, 34). p-values were obtained by calculating the number of cases that exceeded the AUC of the best EN model.
Results
Comparison of Models
To select the model, we compared the performance of SVM, RF, and EN in terms of AUC. Regardless of adjusting for IQ, the accuracies of SVM, RF, and EN were each above the level of chance. With respect to the prediction of distinguishing patients with main-categorical psychiatric disorders from the HCs, EN showed the highest accuracy, in that the mean AUC for all disorders adjusted for IQ was 87.59 ± 7.92% (SVM = 86.02 ± 8.89% and RF = 87.18 ± 8.08%). EN also demonstrated the highest mean AUC performance for specific disorders (EN = 87.76 ± 8.42%, SVM = 82.83 ± 7.62%, and RF = 86.16 ± 8.97%). Therefore, EN was selected as the final method for further analyses. Supplementary Tables 1, 2 show results for the comparisons of SVM, RF, and EN in detail.
Tables 1, 2 show the EN results of the discrimination model and feature combinations for each type of disorder. Compared to all features, PSD + FC in all bands were added to the models and select features showed superior classification accuracy (Tables 1, 2). In addition, adjusting IQ enhanced the performance of discrimination models compared to leaving IQ unadjusted (Supplementary Figure 5).
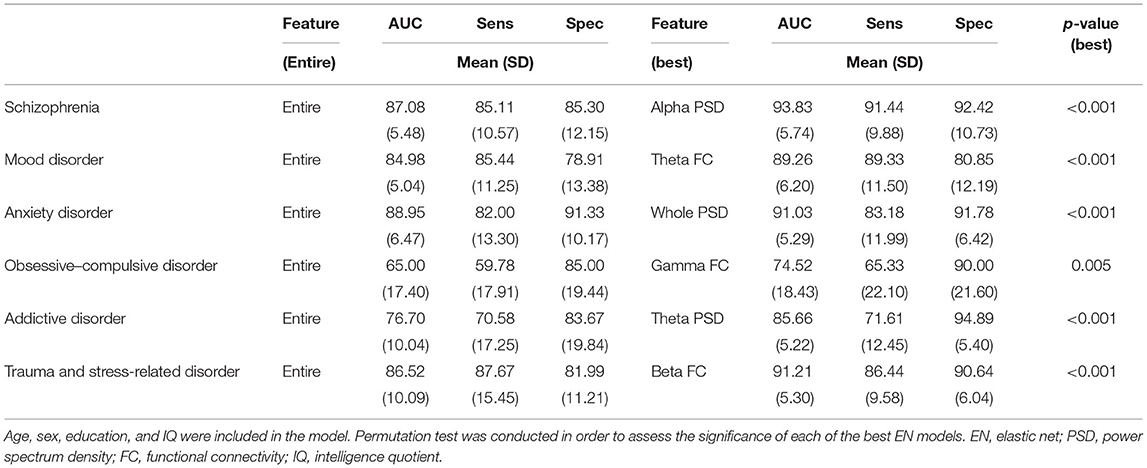
Table 2. Comparison of elastic net models in predicting outcomes in patients with psychiatric disorders distinguished from healthy controls in major category diagnoses.
Best Feature Combinations
All best models for each disorder from EN significantly distinguished between patients with psychiatric disorders and HCs (p < 0.05). The best feature combinations and classification accuracies for discrimination between patients with each large-category of diagnosis and HCs with adjusted IQ were as follows (Table 2): schizophrenia = alpha PSD, 93.83 ± 5.74%; trauma and stress-related disorders = beta FC, 91.21 ± 5.30%; anxiety disorders = whole band PSD, 91.03 ± 5.29; mood disorders = theta FC; 89.26 ± 6.20; addictive disorders = theta PSD, 85.66 ± 5.22; and obsessive–compulsive disorder = gamma FC, 74.52 ± 18.43. Higher accuracies of best models were found for specific diagnoses, compared to the large diagnostic category. Particularly, the maximum accuracy reached a fairly good level in that the accuracy for PTSD was 95.38 ± 4.90%.
Moreover, the best feature appeared differently based on specific diagnosis, even for those in the same category. The best accuracies for specific disorders after adjusting for IQ were as follows (Table 3): PTSD = beta PSD, 95.38 ± 4.90; adjustment disorder = alpha FC, 93.75 ± 7.31; acute stress disorder = beta PSD + FC, 92.00 ± 6.63; alcohol use disorder = whole band PSD, 93.21 ± 6.31; behavioral addiction = delta PSD, 84.78 ± 8.85; bipolar disorder = delta PSD + FC, 92.13 ± 3.01; depressive disorder = delta FC, 87.92 ± 5.67; social anxiety disorder = theta FC, 90.63 ± 8.51; and panic disorder = whole band PSD, 90.07 ± 5.32.
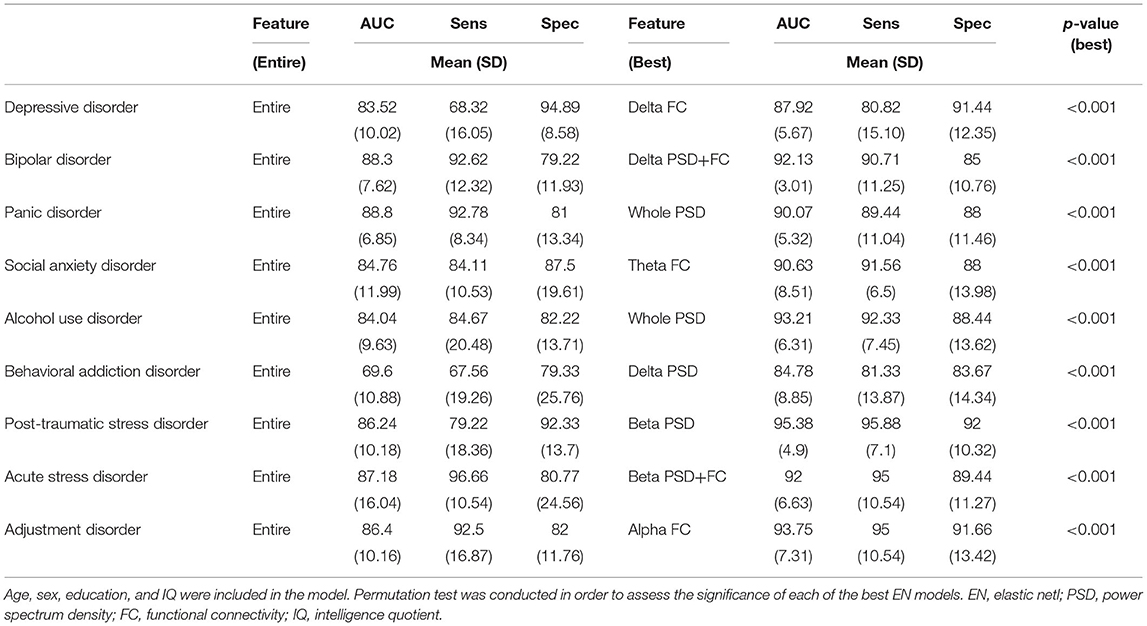
Table 3. Comparison of models in predicting outcomes in patients with psychiatric disorders distinguished from healthy controls in specific diagnoses.
Furthermore, Figures 2, 3 provide region-wise predictors in the best EN model that were at a survival rate above 70% during the cross-validation (for more details, see Supplementary Tables 3, 4).
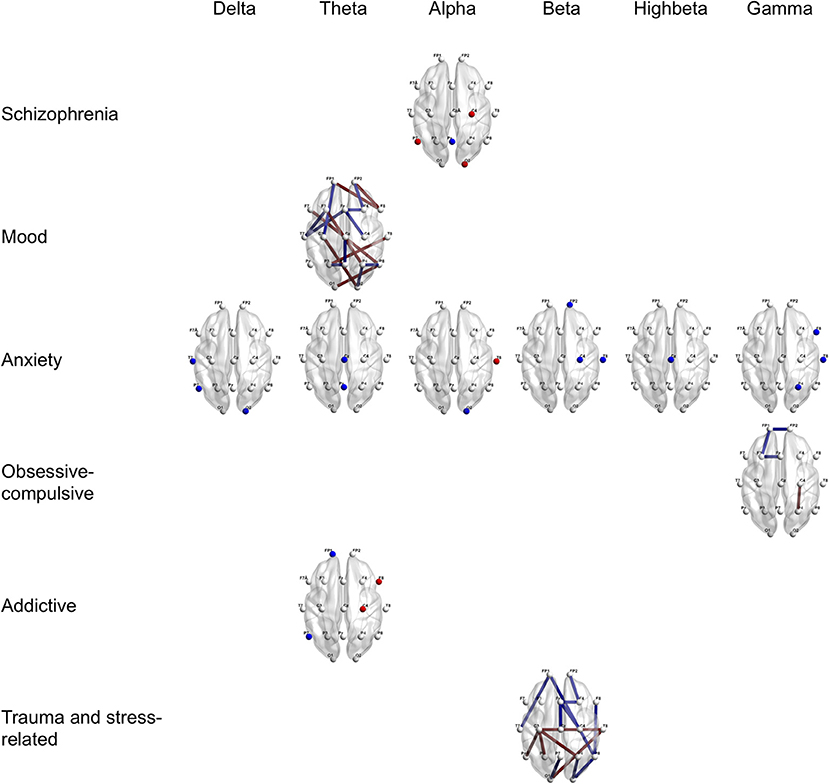
Figure 2. Region-wise predictions for main categories of psychiatric disorders distinguished from healthy controls. Dots and lines represent region-wise survived predictors in the best EN model, which emerged significant above 7 times during 10 times of cross-validation. Dots mean channel-level PSD (absolute power) as QEEG parameter and lines mean channel-level FC (coherence) as QEEG parameter. Features colored in red represent higher probabilities for the psychiatric disorder when more increase. Features colored in blue represent higher probabilities for the psychiatric disorder when more decrease. Age, sex, the year of education, and the IQ score were computed in the models. EN, Elastic Net; PSD, Power Spectrum Density; FC, Functional Connectivity; QEEG, Quantitative Electroencephalography; and IQ, Intelligence Quotient.
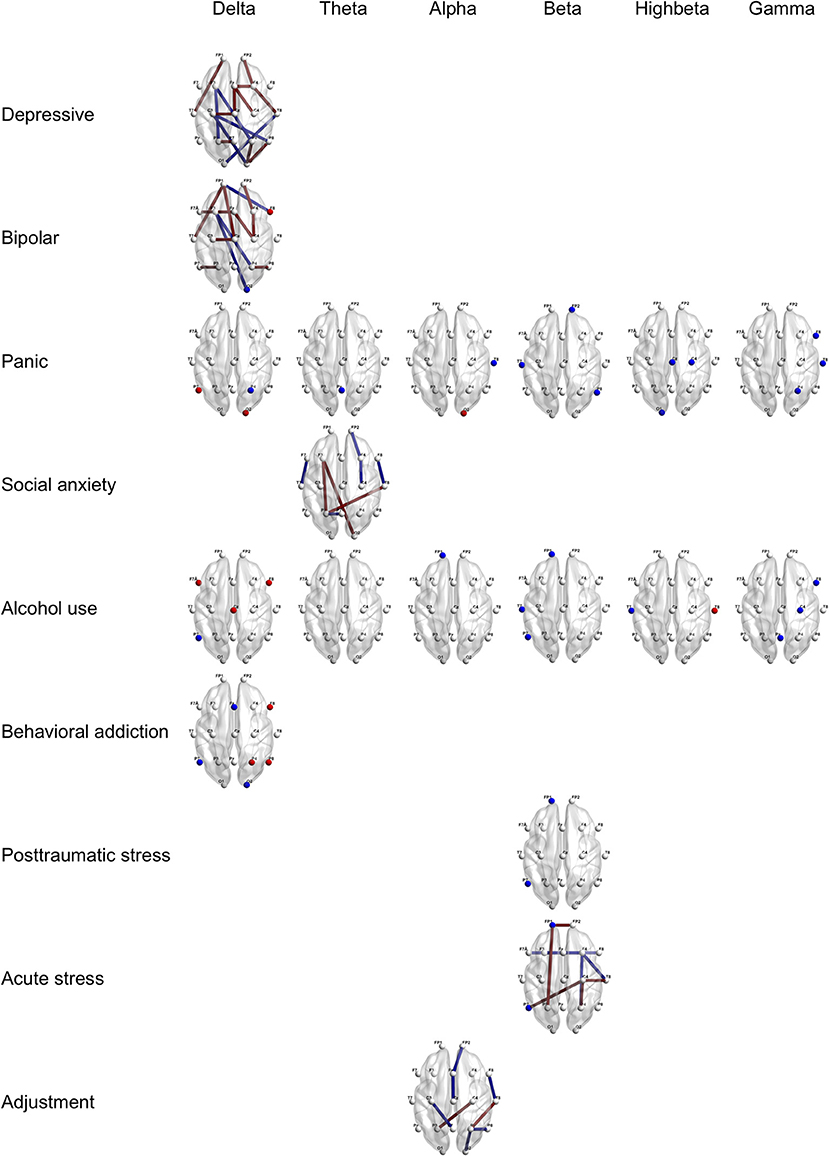
Figure 3. Region-wise predictions for specific psychiatric disorders. Dots and lines represent region-wise survived predictors in the best EN model, which emerged significant above 7 times during 10 times of cross-validation. Dots mean channel-level PSD (absolute power) as QEEG parameter and lines mean channel-level FC (coherence) as QEEG parameter. Features colored in red represent higher probabilities for the psychiatric disorder when more increase. Features colored in blue represent higher probabilities for the psychiatric disorder when more decrease. Age, sex, the year of education, and the IQ score were computed in the models. EN, Elastic Net; PSD, Power Spectrum Density; FC, Functional Connectivity; QEEG, Quantitative Electroencephalography; and IQ, Intelligence Quotient.
Discussion
Our current study offers the following clinical insights: higher severity disorders increase the accuracy of the ML discrimination (e.g., classification of schizophrenia demonstrated the best accuracy); classifications for specific diagnoses (e.g., PTSD and acute stress disorder) provide higher accuracy than grouping large categories (e.g., trauma and stress-related disorders); and each disorder classification model shows different EEG characteristics.
First, consistent with our findings, previous imaging studies have found higher diagnostic accuracy for schizophrenia (92%) than bipolar disorder (79%) (35); however, the authors suggest that this may be due to the fact that although both disorders are associated with altered brain activity in several overlapping regions, the magnitude of dysfunction was more pronounced in schizophrenia. Moreover, in the present study, trauma- and stress-related disorders ranked second for accuracy with an AUC of 91.21% among large-category disorders and PTSD ranked first with an AUC of 95.38% among specific diagnoses. Similarly, one study found higher accuracy for PTSD-HC (80.00%) than for major depression-HC (67.92%) discrimination (36). While it is difficult to determine the severity of the disorder by the accuracy alone, it is plausible that functional brain alterations in specific disorders, such as schizophrenia, representative psychiatric disorders, and PTSD with an explicit traumatic event, are more pronounced than that of other psychiatric disorders. Alternatively, the homogeneity of neurodynamical states of intra-diagnostic disorders might influence the accuracy.
Second, we obtained higher accuracy in the specific categories than in the large grouping categories. In particular, in addictive disorders, when alcohol use disorder (93.21%) and behavioral addiction (84.78%) were classified rather than assessed as a large categorical diagnosis (85.78%), the accuracies were much higher. Results of repeated studies of that behavioral addiction, including Internet gaming disorder, have distinguished functional brain features from those in substance abuse disorders (37). With respect to bipolar and depressive disorders, the two were divided into different categories in DSM-5, but in the previous version of DSM and the current version of ICD, they were classified into one (i.e., mood or affective disorder). Compared to the group of mood disorders (89.26%), bipolar disorder showed higher accuracy (92.13%) when classified alone, but the accuracy of depressive disorder (87.92%) was relatively low. These findings may supplement attempts to discriminate mood disorders (38, 39). However, it should be avoided to interpret it as a more serious disease because the accuracy of bipolar disorder was higher than that of depressive disorder. This is because, as mentioned above, neurodynamical state heterogeneity can exist even within the same category. In addition, since several complex factors such as duration of disorder, recurrence, comorbidity, severity of symptoms, and psychotropic medication can affect brain function and EEG (40, 41), the results of this study are not considered to be more discriminatory than HC or inter-disease severity. It is not appropriate to interpret the results of this study by simplifying as that such disease category is better discriminated than the healthy individuals or that there is a hierarchical hierarchy of diseases.
Third, each classification model provides different best predictive features; different EEG patterns may imply the likelihood of diagnosis of distinguished psychiatric disorders. For instance, schizophrenia is best distinguished from HCs by abnormal alpha band power spectra; however, anxiety disorders are best distinguished from HCs by abnormal whole band power spectra. Several key features including beta power abnormalities in trauma and stress-related disorder, theta connectivity abnormalities in social anxiety disorder, and prefrontal connectivity abnormalities in fast frequency in obsessive–compulsive disorder are consistent with previous studies using group difference statistics (21, 42–44). In addition, dysfunctional connectivity in slow frequency bands in depressive disorder has been confirmed by a previous ML study (17). These differences in EEG patterns were also present within the same category (e.g., panic disorder vs. social anxiety disorder; PTSD vs. acute stress disorder). This implies that there is heterogeneity between disorders classified into the same category. In fact, not all patients with acute stress disorder develop PTSD. In this context, one study suggested that fear inhibition was different between acute stress disorder and PTSD groups (45). The key EEG features of each disorder suggested in the present study can provide useful information for diagnostic decisions of individuals in clinical settings. Nevertheless, cautious interpretation of the findings should be implemented, in that key features are not to be considered as directly reflecting the brain mechanisms of the disorder.
This study focused on classification between patients with each mental disorder and HCs. We additionally performed analyses using EN ML between several psychiatric disorders. As in the previous analysis, the effects of demographic data and IQ were treated as covariates. The best EEG feature combination and AUC for each disease discrimination emerged as follows (see Supplementary Table 5 for more details): schizophrenia vs. bipolar disorder = alpha PSD + FC, 67.84 ± 13.67%; schizophrenia vs. mood disorder = alpha PSD, 68.08 ± 7.23%, schizophrenia vs. depressive disorder = theta FC, 68.70 ± 12.67%; bipolar disorder vs. depressive disorder = alpha PSD + FC, 67.84 ± 13.67%; and panic disorder vs. social anxiety disorder = alpha PSD + FC, 70.47 ± 20.91%. Although the results had lower AUC than the comparison between patients with each disorder and HCs, all permutation results showed a higher level of discrimination than chance (ps < 0.05). In other words, EEG ML might be helpful for diagnostic decision between psychiatric disorders and HC and also between disorders. Multi-class ML method approach attempts in future studies would enhance the usability of EEG ML.
There is a wide variety of methods for extracting features including time series domain and frequency domain, and methods are still being developed. Extracting relevant features for modeling is crucial for ML to perform dimensional reduction and increase prediction accuracy (46). The current study used channel-level resting-state EEG absolute power as a representative PSD and coherence as the index of FC. These two parameters are where bandwidth field knowledge and research results have been accumulated for several decades (21, 47, 48). Our results can be extended to diagnostic information and help individualized treatment choices. Previous research has reported promising outcomes for predicting treatment responses, including medication and transcranial direct current stimulation, with ML using pre-treatment resting-state EEG (49, 50). In addition, the task-free and resting-state method during acquisition of EEG involves less measurement time than the paradigm using experimental stimulation; thus, it has high accessibility and scalability.
The current study has several limitations. First, the effects of medication, comorbidity, and severity of disorder were not controlled. Second, diagnoses were made near the time EEGs were measured, and we therefore cannot rule out the possibility of mixed results of patients who were subsequently diagnosed with different disorders. Third, the sample is from one center and the race and nationality are limited to Asian and Korean. Finally, our design is retrospective, and we did not prospectively verify the modeling. Moreover, external validation was not performed on other samples. Therefore, for generalization, it is necessary to verify the results with additional samples.
In conclusion, we found that an ML approach using EEG could predict major psychiatric disorders with differing degrees of accuracy according to diagnosis. Each disorder classification model demonstrated different characteristics of EEG features. EEG ML is a promising approach for the classification of psychiatric disorders and has the potential to augment evidence-based clinical decisions and provide objectively measurable biomarkers. It would be advantageous to provide the automated diagnostic tools in future medical healthcare using BCI.
Data Availability Statement
The datasets presented in this study can be found in online repositories. The names of the repository/repositories and accession number(s) can be found at: https://osf.io/8bsvr/.
Ethics Statement
The studies involving human participants were reviewed and approved by the Institutional Review Board of SMG-SNU Boramae Medical Center, Seoul, Republic of Korea. The Ethics Committee waived the requirement of written informed consent for participation.
Author Contributions
SP performed data query and integration, EEG data analysis, statistical modeling, and interpretation of results, and contributed to writing the manuscript. BJ contributed to statistical modeling, programming, and writing the manuscript. DO contributed to data collection and writing the manuscript. C-HC, HJ, and J-YL contributed to data collection and reviewing the manuscript. DL and J-SC contributed to the conceptual design of the study and writing the manuscript. All authors contributed to the article and approved the submitted version.
Funding
This work was supported by a Grant-in-aid (Grant Number 02-2019-4) from the SMG-S NU Boramae Medical Center and a grant from the National Research Foundation of Korea (Grant Number 2021R1F1A1046081).
Conflict of Interest
The authors declare that the research was conducted in the absence of any commercial or financial relationships that could be construed as a potential conflict of interest.
Publisher's Note
All claims expressed in this article are solely those of the authors and do not necessarily represent those of their affiliated organizations, or those of the publisher, the editors and the reviewers. Any product that may be evaluated in this article, or claim that may be made by its manufacturer, is not guaranteed or endorsed by the publisher.
Acknowledgments
We would like to thank Editage (www.editage.co.kr) for English language editing.
Supplementary Material
The Supplementary Material for this article can be found online at: https://www.frontiersin.org/articles/10.3389/fpsyt.2021.707581/full#supplementary-material
References
1. World Health Organization. The ICD-10 Classification of Mental and Behavioural Disorders: Clinical Descriptions and Diagnostic Guidelines. World Health Organization (1992).
2. American Psychiatric Association. Diagnostic and Statistical Manual of Mental Disorders. 5th ed. Arlington, VA: American Psychiatric Association (2013). p. 947.
3. Insel TR. The NIMH research domain criteria (RDoC) project: precision medicine for psychiatry. Am J Psychiatry. (2014) 171:395–7. doi: 10.1176/appi.ajp.2014.14020138
4. Zhang X, Braun U, Tost H, Bassett DS. Data-driven approaches to neuroimaging analysis to enhance psychiatric diagnosis and therapy. Biol Psychiatry Cogn Neurosci Neuroimaging. (2020) 5:780–90. doi: 10.1016/j.bpsc.2019.12.015
5. Huys QJM, Maia TV, Frank MJ. Computational psychiatry as a bridge from neuroscience to clinical applications. Nat Neurosci. (2016) 19:404–13. doi: 10.1038/nn.4238
6. Bzdok D, Yeo BTT. Inference in the age of big data: future perspectives on neuroscience. Neuroimage. (2017) 155:549–64. doi: 10.1016/j.neuroimage.2017.04.061
7. Simon GE. Big data from health records in mental health care: hardly clairvoyant but already useful. JAMA Psychiatry. (2019) 76:349–50. doi: 10.1001/jamapsychiatry.2018.4510
8. Klöppel S, Stonnington CM, Chu C, Draganski B, Scahill RI, Rohrer JD, et al. Automatic classification of MR scans in Alzheimer's disease. Brain. (2008) 131:681–9. doi: 10.1093/brain/awm319
9. Csernansky JG, Schindler MK, Splinter NR, Wang L, Gado M, Selemon LD, et al. Abnormalities of thalamic volume and shape in schizophrenia. Am J Psychiatry. (2004) 161:896–902. doi: 10.1176/appi.ajp.161.5.896
10. Fu CH, Mourao-Miranda J, Costafreda SG, Khanna A, Marquand AF, Williams SCR, et al. Pattern classification of sad facial processing: toward the development of neurobiological markers in depression. Biol Psychiatry. (2008) 63:656–62. doi: 10.1016/j.biopsych.2007.08.020
11. Lueken U, Straube B, Yang Y, Hanh T, Beesdo-Baum K, Wittchen HU, et al. Separating depressive comorbidity from panic disorder: a combined functional magnetic resonance imaging and machine learning approach. J Affect Disord. (2015) 184:182–92. doi: 10.1016/j.jad.2015.05.052
12. Dwyer DB, Falkai P, Koutsouleris N. Machine learning approaches for clinical psychology and psychiatry. Annu Rev Clin Psychol. (2018) 14:91–118. doi: 10.1146/annurev-clinpsy-032816-045037
13. Steardo L Jr., Carbone EA, de Filippis R, Pisanu C, Segura-Garcia C, Squassina A et al. Application of support vector machine on fMRI data as biomarkers in schizophrenia diagnosis: a systematic review. Front Psychiatry. (2020) 11:588. doi: 10.3389/fpsyt.2020.00588
14. Qureshi MNI, Oh J, Cho D, Jo HJ, Lee B. Multimodal discrimination of schizophrenia using hybrid weighted feature concatenation of brain functional connectivity and anatomical features with an extreme learning machine. Front Neuroinform. (2017) 11:59. doi: 10.3389/fninf.2017.00059
15. Kim JY, Lee HS, Lee SH. EEG Source network for the diagnosis of schizophrenia and the identification of subtypes based on symptom severity-A machine learning approach. J Clin Med. (2020) 9:3934. doi: 10.3390/jcm9123934
16. Shim M, Hwang HJ, Kim DW, Lee SH, Im CH. Machine-learning-based diagnosis of schizophrenia using combined sensor-level and source-level EEG features. Schizophr Res. (2016) 176:314–9. doi: 10.1016/j.schres.2016.05.007
17. Mumtaz W, Ali SSA, Yasin MAM, Malik AS. A machine learning framework involving EEG-based functional connectivity to diagnose major depressive disorder (MDD). Med Biol Eng Comput. (2008) 56:233–46. doi: 10.1007/s11517-017-1685-z
18. Kim YW, Kim S, Shim M, Jin MJ, Jeon H, Lee SH, et al. Riemannian classifier enhances the accuracy of machine-learning-based diagnosis of PTSD using resting EEG. Prog Neuro Psychopharmacol Biol Psychiatry. (2020) 102:109960. doi: 10.1016/j.pnpbp.2020.109960
19. Ieracitano C, Mammone N, Hussain A, Morabito FC. A novel multi-modal machine learning based approach for automatic classification of EEG recordings in dementia. Neural Netw. (2020) 123:176–90. doi: 10.1016/j.neunet.2019.12.006
20. Morillo P, Ortega H, Chauca D, Proaño J, Vallejo-Huanga D, Cazares M. Psycho web: a machine learning platform for the diagnosis and classification of mental disorders. In: Ayaz H, editor. Advances in Neuroergonomics and Cognitive Engineering. AHFE 2019. Advances in Intelligent Systems and Computing, Vol 953. Cham: Springer (2020). doi: 10.1007/978-3-030-20473-0_39
21. Newson JJ, Thiagarajan TC. EEG frequency bands in psychiatric disorders: a review of resting state studies. Front Hum Neurosci. (2019) 12:521. doi: 10.3389/fnhum.2018.00521
22. Thatcher RW. Coherence, phase differences, phase shift, and phase lock in EEG/ERP analyses. Dev Neuropsychol. (2012) 37:476–96. doi: 10.1080/87565641.2011.619241
23. Zou H, Hastie T. Regularization and variable selection via the elastic net. J R Stat Soc Series B Stat Methodol. (2005) 67:301–20. doi: 10.1111/j.1467-9868.2005.00503.x
24. Park SM, Jung HY. Respiratory sinus arrhythmia biofeedback alters heart rate variability and default mode network connectivity in major depressive disorder: a preliminary study. Int J Psychophysiol. (2020) 158:225–37. doi: 10.1016/j.ijpsycho.2020.10.008
25. Guevara MA, Corsi-Cabrera M. EEG coherence or EEG correlation? Int J Psychophysiol. (1996) 23:145–53. doi: 10.1016/S0167-8760(96)00038-4
26. Nunez PL, Silberstein RB, Shi Z, Carpenter MR, Srinivasan R, Tucker DM, et al. EEG coherency II: experimental comparisons of multiple measures. Clin Neurophysiol. (1999) 110:469–86. doi: 10.1016/S1388-2457(98)00043-1
27. Kaiser J, Gruzelier JH. Timing of puberty and EEG coherence during photic stimulation. Int J Psychophysiol. (1996) 21:135–49. doi: 10.1016/0167-8760(95)00048-8
28. Thatcher RW, North DM, Biver CJ. Development of cortical connections as measured by EEG coherence and phase delays. Hum Brain Mapp. (2008) 29:1400–15. doi: 10.1002/hbm.20474
29. Thatcher RW, North DM, Biver CJ. EEG and intelligence: relations between EEG coherence, EEG phase delay and power. Clin Neurophysiol. (2005) 116:2129–41. doi: 10.1016/j.clinph.2005.04.026
30. Cortes C, Vapnik V. Support-vector networks. Machine Learn. (1995) 20:273–97. doi: 10.1007/BF00994018
32. Hastie T, Tibshirani R, Friedman J. The Elements of Statistical Learning: Data Mining, Inference, and Prediction, 2nd ed. New York, NY: Springer (2009).
33. Ojala M, Garriga GC. Permutation tests for studying classifier performance. J Mach Learn Res. (2010) 11:1833–63. Available online at: https://www.jmlr.org/papers/volume11/ojala10a/ojala10a
34. Antonucci LA, Pergola G, Pigoni A, Dwyer D, Kambeitz-Ilankovic L, Penzel N, et al. A pattern of cognitive deficits stratified for genetic and environmental risk reliably classifies patients with schizophrenia from healthy control subjects. Biol Psychiatry. (2020) 87:697–707. doi: 10.1016/j.biopsych.2019.11.007
35. Orru G, Pettersson-Yeo W, Marquand AF, Sartori G, Mechelli A. Using support vector machine to identify imaging biomarkers of neurological and psychiatric disease: a critical review. Neurosci Biobehav Rev. (2012) 36:1140–52. doi: 10.1016/j.neubiorev.2012.01.004
36. Shim M, Jin MJ, Im CH, Lee SH. Machine-learning-based classification between post-traumatic stress disorder and major depressive disorder using P300 features. NeuroImage Clin. (2019) 24:102001. doi: 10.1016/j.nicl.2019.102001
37. Park SM, Lee JY, Kim YJ, Lee JY, Jung HY, Sohn BK, et al. Neural connectivity in Internet gaming disorder and alcohol use disorder: a resting-state EEG coherence study. Sci Rep. (2017) 7:1333. doi: 10.1038/s41598-017-01419-7
38. Winokur G, Coryell W, Endicott J, Akiskal H. Further distinctions between manic-depressive illness (bipolar disorder) and primary depressive disorder (unipolar depression). Am J Psychiatry. (1993) 150:1176–81. doi: 10.1176/ajp.150.8.1176
39. Kempton MJ, Salvador Z, Munafò MR, Geddes JR, Simmons A, Frangou S, et al. Structural neuroimaging studies in major depressive disorder: meta-analysis and comparison with bipolar disorder. Arch Gen Psychiatry. (2011) 68:675–90. doi: 10.1001/archgenpsychiatry.2011.60
40. Lobo I, Portugal LC, Figueira I, Volchan E, David I, Pereira MG, et al. EEG correlates of the severity of posttraumatic stress symptoms: a systematic review of the dimensional PTSD literature. J Affect Disord. (2015) 183:210–20. doi: 10.1016/j.jad.2015.05.015
41. Ford MR, Goethe JW, Dekker DK. EEG coherence and power in the discrimination of psychiatric disorders and medication effects. Biol Psychiatry. (1986) 21:1175–88. doi: 10.1016/0006-3223(86)90224-6
42. Jokić-Begić N, Begić D. Quantitative electroencephalogram (qEEG) in combat veterans with post-traumatic stress disorder (PTSD). Nord J Psychiatry. (2003) 57:351–5. doi: 10.1080/08039480310002688
43. Xing M, Tadayonnejad R, MacNamara A, Ajilore O, DiGangi J, Phan LK, et al. Resting-state theta band connectivity and graph analysis in generalized social anxiety disorder. NeuroImage Clin. (2017) 13:24–32. doi: 10.1016/j.nicl.2016.11.009
44. Velikova S, Locatelli M, Insacco C, Smeraldi E, Comi G, Leocani L. Dysfunctional brain circuitry in obsessive-compulsive disorder: source and coherence analysis of EEG rhythms. Neuroimage. (2010) 49:977–83. doi: 10.1016/j.neuroimage.2009.08.015
45. Jovanovic T, Sakoman AJ, Kozarić-Kovačić D, Meštrović AH, Duncan EJ, Davis M, et al. Acute stress disorder versus chronic posttraumatic stress disorder: inhibition of fear as a function of time since trauma. Depres Anxiety. (2013) 30:217–24. doi: 10.1002/da.21991
46. Iscan Z, Dokur Z, Demiralp T. Classification of electroencephalogram signals with combined time and frequency features. Expert Syst Appl. (2011) 38:10499–505. doi: 10.1016/j.eswa.2011.02.110
47. Hughes JR, John ER. Conventional and quantitative electroencephalography in psychiatry. J Neuropsychiatry Clin Neurosci. (1990) 11:190–208. doi: 10.1176/jnp.11.2.190
48. Fenton G, Fenwick P, Dollimore J, Dunn TL, Hirsch SR. EEG spectral analysis in schizophrenia. Br J Psychiatry. (1980) 136:445–55. doi: 10.1192/bjp.136.5.445
49. Khodayari-Rostamabad A, Reilly JP, Hasey G, Debruin H, Maccrimmon D. Using pre-treatment EEG data to predict response to SSRI treatment for MDD. In: Proceedings in 32nd Annual International Conference of the IEEE Engineering in Medicine and Biology. Buenos Aires (2020). p. 6103–6.
Keywords: classification, electroencephalography, machine learning, psychiatric disorder, resting-state brain function, power spectrum density, functional connectivity
Citation: Park SM, Jeong B, Oh DY, Choi C-H, Jung HY, Lee J-Y, Lee D and Choi J-S (2021) Identification of Major Psychiatric Disorders From Resting-State Electroencephalography Using a Machine Learning Approach. Front. Psychiatry 12:707581. doi: 10.3389/fpsyt.2021.707581
Received: 10 May 2021; Accepted: 20 July 2021;
Published: 18 August 2021.
Edited by:
Jolanta Kucharska-Mazur, Pomeranian Medical University, PolandReviewed by:
Seung-Hwan Lee, Inje University Ilsan Paik Hospital, South KoreaGörkem Karakaş Ugurlu, Ankara Yildirim Beyazit University, Turkey
Copyright © 2021 Park, Jeong, Oh, Choi, Jung, Lee, Lee and Choi. This is an open-access article distributed under the terms of the Creative Commons Attribution License (CC BY). The use, distribution or reproduction in other forums is permitted, provided the original author(s) and the copyright owner(s) are credited and that the original publication in this journal is cited, in accordance with accepted academic practice. No use, distribution or reproduction is permitted which does not comply with these terms.
*Correspondence: Jung-Seok Choi, Y2hvaWpzNzNAZ21haWwuY29t; Donghwan Lee, ZG9uZ2h3YW4ubGVlQGV3aGEuYWMua3I=
†Present address: Su Mi Park, Department of Counseling Psychology, Hannam University, Daejeon, South Korea