
94% of researchers rate our articles as excellent or good
Learn more about the work of our research integrity team to safeguard the quality of each article we publish.
Find out more
ORIGINAL RESEARCH article
Front. Psychiatry , 16 August 2021
Sec. Child and Adolescent Psychiatry
Volume 12 - 2021 | https://doi.org/10.3389/fpsyt.2021.691717
This article is part of the Research Topic Fragile X Spectrum Disorders View all 24 articles
 Marwa Zafarullah1
 Blythe Durbin-Johnson2
 Emily S. Fourie3,4
 David R. Hessl5,6
 Susan M. Rivera3,4,5
 Flora Tassone1,5*
Fragile X-associated tremor/ataxia syndrome (FXTAS) is a late adult-onset neurodegenerative disorder that affects movement and cognition in male and female carriers of a premutation allele (55–200 CGG repeats; PM) in the fragile X mental retardation (FMR1) gene. It is currently unknown how the observed brain changes are associated with metabolic signatures in individuals who develop the disorder over time. The primary objective of this study was to investigate the correlation between longitudinal changes in the brain (area of the pons, midbrain, and MCP width) and the changes in the expression level of metabolic biomarkers of early diagnosis and progression of FXTAS in PM who, as part of an ongoing longitudinal study, emerged into two distinct categories. These included those who developed symptoms of FXTAS (converters, CON) at subsequent visits and those who did not meet the criteria of diagnosis (non-converters, NCON) and were compared to age-matched healthy controls (HC). We assessed CGG repeat allele size by Southern Blot and PCR analysis. Magnetic Resonance Imaging (MRIs) acquisition was obtained on a 3T Siemens Trio scanner and metabolomic profile was obtained by ultra-performance liquid chromatography, accurate mass spectrometer, and an Orbitrap mass analyzer. Our findings indicate that differential metabolite levels are linked with the area of the pons between healthy control and premutation groups. More specifically, we observed a significant association of ceramides and mannonate metabolites with a decreased area of the pons, both at visit 1 (V1) and visit 2 (V2) only in the CON as compared to the NCON group suggesting their potential role in the development of the disorder. In addition, we found a significant correlation of these metabolic signatures with the FXTAS stage at V2 indicating their contribution to the progression and pathogenesis of FXTAS. Interestingly, these metabolites, as part of lipid and sphingolipid lipids pathways, provide evidence of the role that their dysregulation plays in the development of FXTAS and inform us as potential targets for personalized therapeutic development.
Aging is a complex and evolutionarily conserved process that is found to be one of the main risk factors for a number of human neurodegenerative disorders (1). Aging and many aging-associated disorders share a range of molecular or cellular pathologies, which can involve a dysregulated energy balance. Increasing evidence suggests that metabolic alterations can strongly influence the development and the progression of various neurodegenerative disorders. Although the brain represents only 2% of the total body weight, it accounts for 20% of an individual's energy expenditure at rest (2). Thus, compromised energy metabolism and adverse changes, are potentially contributing to increased vulnerability of the brain to develop neurodevelopmental and neurodegenerative processes (3).
Fragile X-associated Tremor/Ataxia Syndrome (FXTAS) is a late-onset neurodegenerative disorder, mostly affecting carriers of the fragile X mental retardation 1 (FMR1) gene mutation after the age of 50. Currently, there is no effective treatment for FXTAS, and the cognitive and/or motor symptoms progressively worsen over time, causing reduced quality of life, increased medical costs, and eventually, death. FXTAS is caused by the expanded CGG repeats (55–200 CGG) within the 5′UTR of the FMR1 gene. In normal healthy individuals, the number of CGG repeats lies between 5 and 54 while individuals carrying alleles with a CGG repeat expansion >200 develop fragile X syndrome (FXS), the most common form of intellectual disability and known monogenic cause of autism spectrum disorders (ASD) (4). The high prevalence of the premutation allele among the general population (1:110–200 females and 1:430 males), leads to an estimate of approximately 1.5 million individuals in the general US population being at risk for FMR1 associated disorders, over their life spans. In addition, among the PM population, an estimated 40–75% of male and 8–16% of female PMs are at risk of developing FXTAS (5, 6).
FXTAS core features include progressive intention tremor and cerebellar gait ataxia, autonomic dysfunction, and parkinsonism. Neuropathologically, it is characterized by the presence of ubiquitin-positive intranuclear inclusions in neurons and astrocytes throughout the brain and in Purkinje cells (7). In addition to the clinical and neuropathological features, the radiological signs, including white matter hyperintensities (wmhs) in the middle cerebellar peduncles (the “MCP sign”) (8) also contribute to the diagnosis of FXTAS. Similarly, a significant prevalence of wmhs in the splenium of the corpus callosum (9, 10), generalized brain atrophy, increased T2 signal in area of the pons and periventricular regions along with the subcortical gray matter damage with atrophy of the midbrain, are part of the pathogenesis of FXTAS (5, 11).
The brainstem is the central axis of the brain and both of its regions, the area of the pons and the midbrain, play an important role in sensation and movement (12). The upper area of the pons and midbrain tegmentum are the main components of the ascending reticular activating system and associated with various other neurodegenerative disorders (13). Measurements of these areas have been shown previously to successfully differentiate subcortical movement disorders, such as Parkinson's disease (14), which presents with resting tremor that has also been observed in FXTAS. In addition, middle cerebellar peduncle (MCP) width showed a great sensitivity and specificity in differentiating multiple system atrophy from other disorders (15). We recently reported the MCP width as novel biomarker for FXTAS (16); decreased MCP width was observed in individuals who later developed symptoms of FXTAS as compared to premutation carriers (PM) who did not, and healthy controls. In addition, we also found reduced midbrain and area of the pons cross-sectional areas in patients with FXTAS compared to PM without FXTAS and controls (16). In a more recent study, we reported the association between these brain measures, including reduced MCP and SCP width, midbrain, and area of the pons cross-sectional area with increased expression levels of the Iso10/10b, Iso4/4b FMR1 mRNA isoforms of the ASFMR1 131 bp mRNA isoform (17), suggesting their potential role in the pathogenesis of FXTAS.
Metabolic alterations and mitochondrial dysfunction have been extensively investigated in numerous age-related neurodegenerative disorders (18). However, the relationships between systemic abnormalities in metabolism and the pathogenesis of FXTAS are poorly understood. Previous metabolomic studies have investigated a panel of four core serum metabolites (phenethylamine (PEA), oleamide, aconitate, and isocitrate) for sensitive and specific diagnosis of the PM with and without FXTAS and found oleamide/isocitrate as a biomarker of FXTAS (19). Later, mitochondrial dysfunction, markers of neurodegeneration, and pro-inflammatory damage in PM were reported (20). Increased mitochondrial oxidative stress in primary fibroblasts derived from PM, compared with age and sex-matched controls has also been observed (21). Napoli and colleagues found the presence of the Warburg effect (which involves an increase in the rate of glucose uptake and preferential production of lactate, even in the presence of oxygen) in the peripheral blood mononuclear cells (PBMCs)'s derived from the controls, in PM with and without FXTAS (22). Later, Napoli et al. observed a significant impact of allopregnanolone treatment on oxidative stress, GABA metabolism, and mitochondria-related outcomes, and suggested allopregnanolone as a potential therapeutic for the cognitive and GABA metabolism improvement in FXTAS patients (23). In the premutation animal model's significant metabolic changes were found in the sphingolipid and purine metabolism in the cerebellum of premutation mice while the Schlank (Cers5), Sk2 (Sphk1), and Ras (Impdh1) genes were suggested as genetic modifiers of CGG toxicity in Drosophila (24). It is, however, unclear how global perturbations in metabolism may be related to severity of FXTAS pathology and the eventual expression of symptoms in individuals at risk for developing FXTAS. Our recent study identified metabolic biomarkers of FXTAS early diagnosis and disease progression by characterizing individuals who developed symptoms of FXTAS over time. Specifically, we found that lipid metabolism and specifically the sub pathways involved in mitochondrial bioenergetics, are significantly altered in FXTAS (25).
To date, no study evaluating the metabolic alterations in correlation with brain changes in PM who develop symptoms of FXTAS over time has been reported. In the current study, we evaluated male participants, carriers of the FMR1 premutation allele, enrolled in an ongoing longitudinal study carried out at the UC Davis MIND Institute. The participants were followed for at least two longitudinal time points (Visit 1, V1, and Visit 2, V2) during which neuroimaging, neuropsychological, molecular measurements, as well as medical and neurological examinations were collected. A subset of the premutation participants, all symptom-free at the time of enrollment, developed symptoms that warranted a diagnosis of FXTAS by Visit 2. We define these individuals as converters (CON). The remaining premutation participants, who did not develop symptoms of FXTAS by Visit 2, we define as non-converters (NCON). In the current work, we investigated whether the expression levels of identified metabolic biomarkers were associated with changes in brain measures including the midbrain and pons cross-sectional area and MCP width, in the CON group compared to the NCON and HC groups. In addition, we also investigated the association of metabolite expression with the progression of FXTAS. Understanding the metabolic variations along with brain changes in PM who developed FXTAS symptoms over time is likely to provide insights into novel disease-modifying treatments for this progressive neurodegenerative disorder.
As part of a continuing longitudinal study at UC Davis MIND Institute, male PM, >45 years of age, and non-carrier age-matched controls were recruited from throughout the USA and Canada [as detailed in (16)]. All male participants were white in race; there were three Hispanic participants in the HC group, one in the CON group, and zero in NCON group. The studies and all protocols were carried out in accordance with the Institutional Review Board at the University of California, Davis. All participants gave written informed consent before participating in the study in line with the Declaration of Helsinki. FXTAS stage scoring was based on the clinical descriptions as previously described (26). Three categories were used in the diagnosis of FXTAS as explained in Zafarullah and Tassone (27) and termed as “definite,” “probable” and “possible.” Three age-matched groups were included in this study: CON, NCON, and HC. Using the data from two brain scans, from neurological assessment, FXTAS stage, and CGG repeat length, 10 participants were classified as “CON” as they developed clear FXTAS symptomology between visits (FXTAS stage score was 0–1 at V1 and ≥2 at V2); 10 were defined as “NCON” because they continued to show no signs of FXTAS at V2 (FXTAS stage score was 0–1 at both V1 and V2) and 10 as HC (normal FMR1 alleles/non-PM).
Genomic DNA (gDNA) was isolated from 5 mL of peripheral blood leukocytes using the Gentra Puregene Blood Kit (Qiagen). CGG repeat allele size and methylation status were assessed by using the combination of Southern Blot and PCR analysis as previously reported (28, 29).
The following methods including MRI acquisition and MRPI analysis were originally described in our previous report (16). High resolution structural magnetic resonance imaging (MRIs) acquisition was obtained on a 3T Siemens Trio scanner using a 32-channel head coil and a T1-weighted 3D MPRAGE sequence with the following parameters: TR = 2,170 ms, TE = 4.86 ms, flip angle = 7°, FoV = 256 mm2, 192 slices, 1 mm slice thickness. The scans were first aligned along the anterior-posterior commissure line using acpc detect (http://www.nitrc.org/projects/art) (30) or manually using DTI Studio (www.mristudio.org) (31). Then MRI bias field correction was performed using N4 (http://stnava.github.io/ANTs/) (32). A series of independent raters (two per measure) who were blinded to the participant age, group, and time point, quantitatively assessed all MR images for four measurements of brain morphology: MCP width as well pons and midbrain cross-sectional areas were based on methods previously described (33, 34).
Plasma metabolite profiling was determined by a non-targeted platform that allows the relative quantitative analysis of a large number of molecules (35). Samples were stored at −80°C until processing and then prepared using the automated MicroLab STAR® (Hamilton Company, Reno, NV, USA). Several recovery standards were added prior to the first step in the extraction process for QC purposes. To remove protein, dissociate small molecules bound to protein or trapped in the precipitated protein matrix, and to recover chemically diverse metabolites, proteins were precipitated with methanol under vigorous shaking for 2 min (Glen Mills GenoGrinder 2000) followed by centrifugation. The resulting extract was divided into five fractions: two for analysis by two separate reverse phases (RP)/UPLC-MS/MS methods with positive ion mode electrospray ionization (ESI), one for analysis by RP/UPLC-MS/MS with negative ion mode ESI, one for analysis by HILIC/UPLC-MS/MS with negative ion mode ESI, and one sample were reserved for backup. Samples were placed briefly on a TurboVap® (Zymark) to remove the organic solvent. The sample extracts were stored overnight under nitrogen before preparation for further analysis as explained in Zafarullah et al. (25).
The association between brain measures and metabolites at a single visit was analyzed using linear regression models that included a brain measure as the area of the pons and a metabolite as the single covariate. The association between changes in brain measures and in metabolites between visits was analyzed using linear regression models that included change in a brain measure as the area of the pons and change in metabolite, baseline metabolite level, and baseline brain measure as covariates. Models fitted to visit 1 data included all subjects (control, NCON, and CON), and models fitted to visit 2 data included all premutation subjects (NCON and CON). Specifically, all the Visit 1 regression analyses included all subjects (n = 30), and all the Visit 2 regression analyses included all premutation subjects (n = 20). P-values were adjusted for multiple testing (within each analysis, across metabolites) using the Benjamini-Hochberg false discovery rate controlling method (36). Analyses were conducted using R version 4.0.2 (37).
Three groups of male participants were included in this study: 1) PM who converted at V2 (CON; n = 10), 2) PM who did not convert at V2 (NCON; n = 10) and 3) healthy controls (HC; n = 10). All participants in the CON and NCOV groups were matched for age and CGG repeat length as reported in Table 1. Participant race, age, and ethnicity did not differ significantly between the three groups. As expected, CGG repeat size was significantly lower in healthy controls than in the CON and NCON groups (P < 0.001 in both comparisons) but it was not significantly different between the two premutation carrier groups of CON and NCON (P = 0.76).
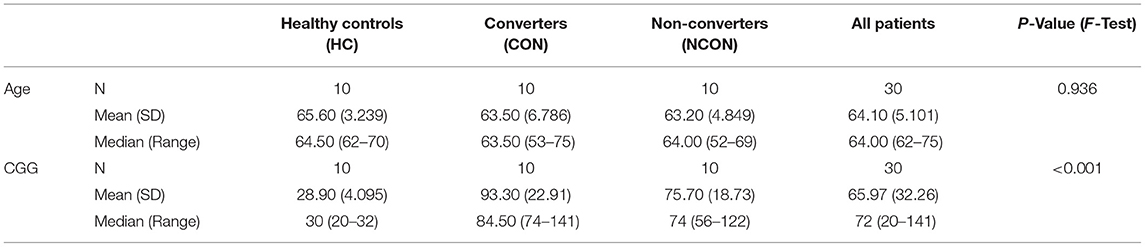
Table 1. Demographic information on age and CGG repeats in three male participant groups: HC, CON and NCON.
We have recently reported 94 potential metabolic biomarkers for early diagnosis and progression of FXTAS that showed significant changes in expression (P ≤ 0.05) in the CON as compared to the NCON both at V1 and V2 or only at V2 (25). In this study, we investigated the correlation between these potential metabolic biomarkers and brain measures (midbrain, area of the pons, and MCP width) among healthy control (HC), and PM including converter and non-converter (CON and NCON) at V1. We found a significant association (P ≤ 0.05) of expression level of six metabolites with area of the pons among all three groups (HC, CON, and NCON) at V1 (Figure 1). While no significant correlation of the midbrain and MCP width with the identified metabolites at baseline has been observed.
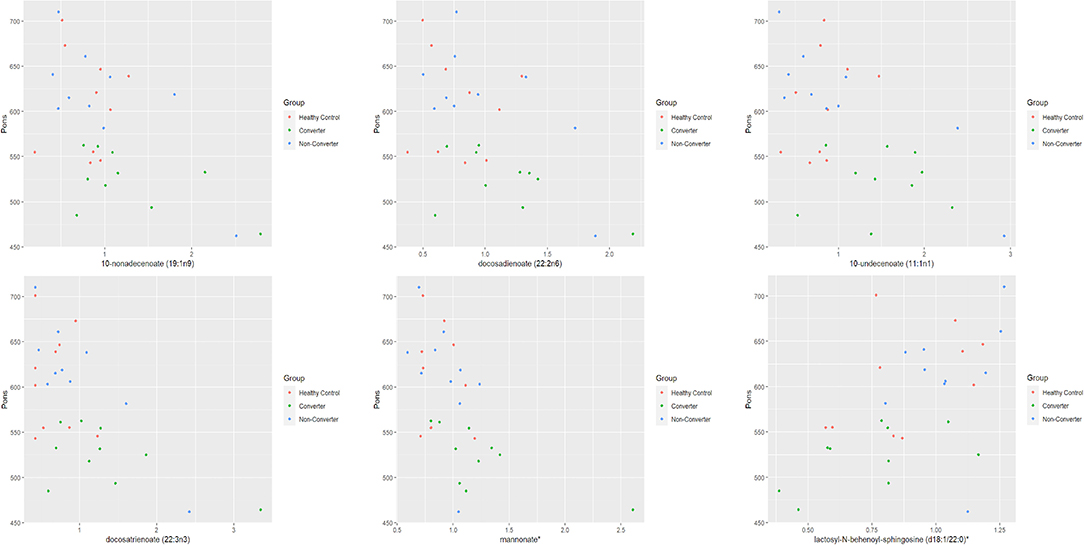
Figure 1. Pons by metabolite expression among HC, CON and NCON. Scatter plots showing correlation between pons and metabolite expression levels. The dots in red are representing the plotted values obtained for HC, green for CONV and blue for NCON. *The identity of these metabolites has not been officially confirmed based on the standard.
Within the two premutation groups, the levels of 11 metabolites showed a significant correlation (P ≤ 0.05) with decreased area of the pons at V1 while four showed a significant correlation at V2 only in the CON group but not in the NCON group. Interestingly, level of ceramide (d16:1/24:1, d18:1/22:1) correlated with area of the pons area both at V1 [Regression Slope −72.3 (−118.7, −25.9); P-value 0.0496; Figure 2A] and V2 [Regression Slope −56.7 (−88.3, −25.2); P-value 0.0597; Figure 2B]. Similarly, we also observed a significant correlation between mannonate and area of the area of the pons both at V1 [Regression Slope −97.3 (−162.3, −32.3); P-value 0.0496; Figure 2C] and V2 [Regression Slope −135 (−203.8, −67.2); P-value 0.0543; Figure 2D]. No significant correlations were observed between the midbrain area and MCP width and any metabolites both at V1 and V2 between CON and NCON premutation groups.
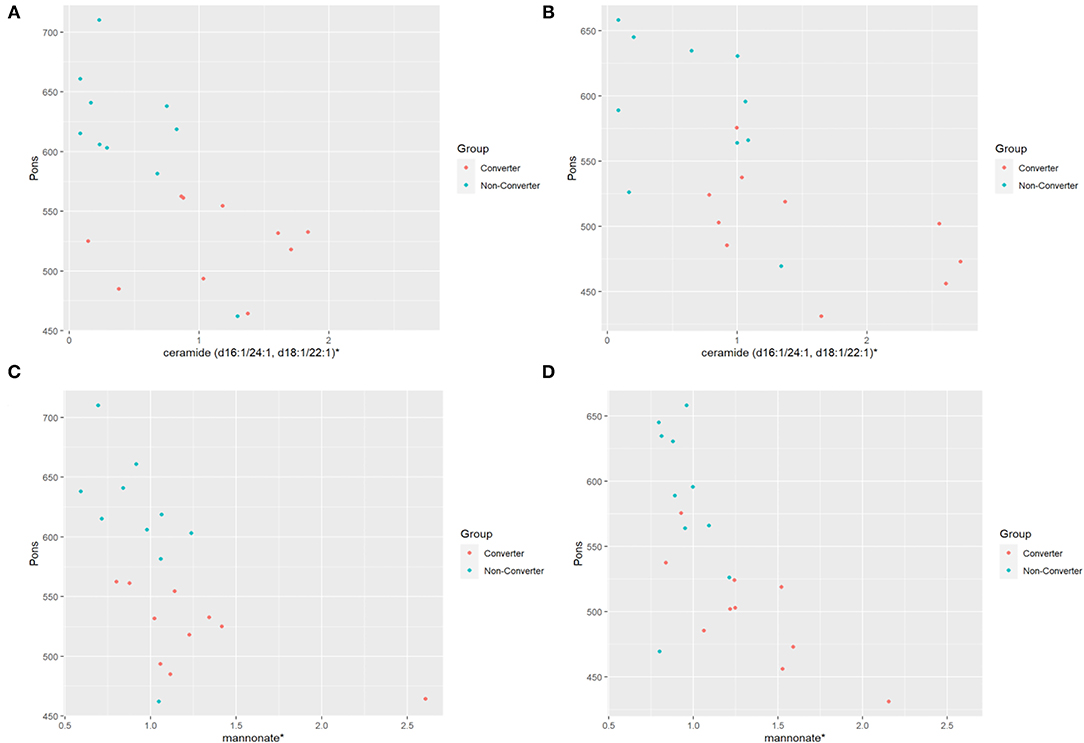
Figure 2. Distribution of metabolic biomarkers with pons between CON and NCON groups. (A) Scatter plots showing correlation between pons and ceramide in CON and NCON at V1. The dots in red are representing the plotted values obtained for CON, and turquoise for NCON. (B) Scatter plots showing correlation between pons and ceramide in CON and NCON at V2. (C) Scatter plots showing correlation between pons and mannonate in CON and NCON at V1. (D) Scatter plots showing correlation between pons and mannonate in CON and NCON at V2. *The identity of these metabolites has not been officially confirmed based on the standard.
We evaluated the differential expression of the metabolic biomarkers with the progression of FXTAS and with the FXTAS stage in the CON and NCON participants at V2. We observed that 27 metabolites significantly correlated with change in FXTAS stage from V1 to V2 with the majority of these metabolites being lipids followed by xenobiotics, amino acids, and energy (Table 2). Further we observed a significant correlation between the expression levels of several of these metabolites with the FXTAS stage (Figure 3A). Interestingly, six of these metabolites including palmitate (16:0) (Figure 3A), palmitoylcarnitine (C16), palmitoleate (16:1n7), fumarate, lactosyl-N-behenoyl-sphingosine (d18:1/22:0), and ceramide (d16:1/24:1, d18:1/22:1) have been reported to be critically involved in the development of other neurodegenerative disorders. In addition, these metabolites are part of the lipid and fatty acid metabolism (Figure 3B) and sphingolipid metabolism (Figure 3C). We previously shown that lipid metabolism was associated with the development and progression of FXTAS (changes of the FXTAS stage from V1 to V2) (25) and this association has also been reported in the premutation mouse model (24).
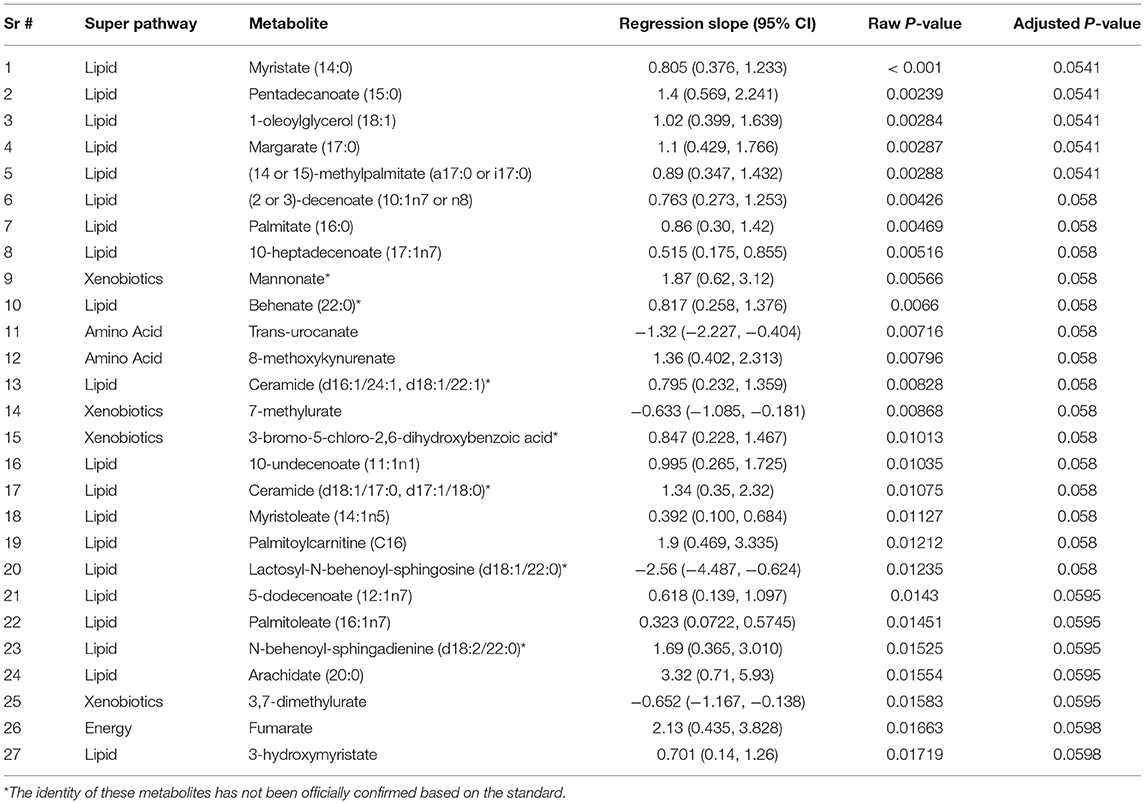
Table 2. Metabolite expression correlated with progression of FXTAS.
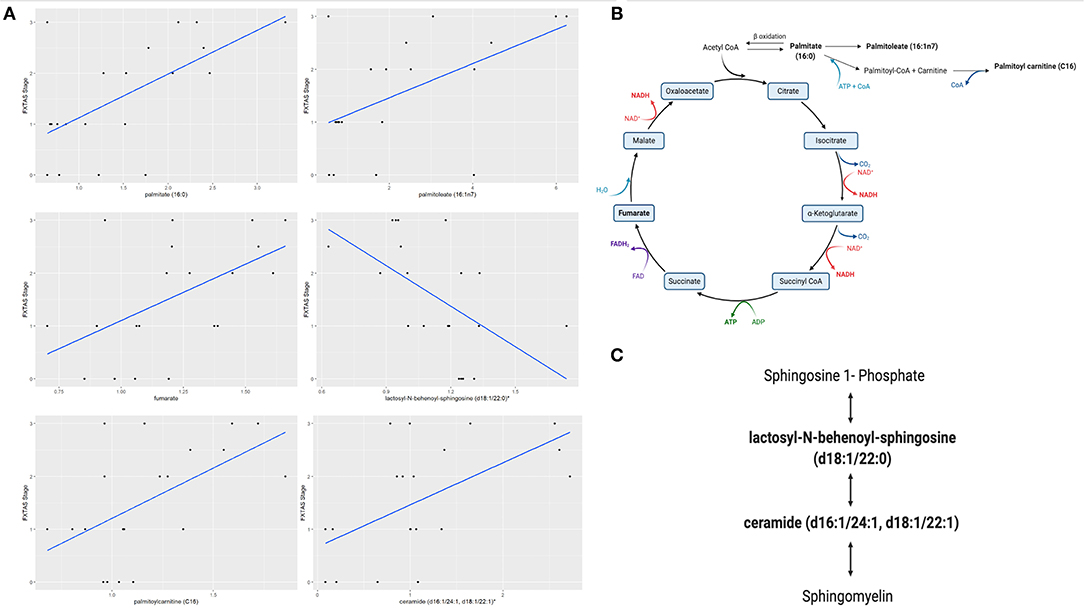
Figure 3. Fatty acid and sphingolipids metabolism associated with FXTAS development. (A) Six identified metabolites in FXTAS associated with other neurodegenerative disorder, here the comparison with the FXTAS stage is shown; data are presented as FXTAS stage (y-axis) and associated metabolite (x-axis) by using scatter plots. (B). Disturbance of fatty acid and lipids metabolism pathway is shown. (C) Sphingolipid metabolism pathway is shown. Bold metabolites, p ≤ 0.05 linked with the development of FXTAS. *The identity of these metabolites has not been officially confirmed based on the standard.
The present study results provide evidence that brain measures, specifically the area of the pons cross-sectional area, correlate with plasma levels of metabolites that are part of the fatty acid and sphingolipid metabolism. These findings expand upon our previous study of plasma metabolic profiling of participants who developed symptoms of FXTAS over time (25), potentially representing biomarkers of early diagnosis and progression of FXTAS and suggest that these factors play a role in the brain structure of individuals with FXTAS.
Magnetic resonance imaging (MRI) takes advantage of a strong magnetic field for non-invasively imaging of parts of the brain parts to identify regional tissue abnormalities and to obtain volumes of brain structures. The imaging profile provides an opportunity to not only visualize the neuroanatomical and functional signatures of various neurodegenerative disorders, but it can also identify disease-specific biomarkers of the underlying processes. Various imaging biomarkers have been reported in Parkinson's disease (PD) (38), Amyotrophic Lateral Sclerosis (ALS) (39), Alzheimer Disease (AD) (40), and Dementia (41) and recently by our team in FXTAS (16).
The brainstem (which includes midbrain, area of the pons, and the medulla oblongata) is a critical regulator of vital bodily functions (42) with midbrain and area of the pons primarily supporting cognition and mood while medulla oblongata regulates cardiovascular and respiratory functions (43). Interestingly, lesions and atrophy of these brainstem structures represent the hallmarks of various neurological disorders and recent findings have pointed to a much deeper involvement of the brainstem nuclei which could change our understanding of the cause, prevalence and early diagnosis of these devastating diseases. Altered volume of midbrain, area of the pons, and medulla oblongata have been reported in individuals with schizophrenia (SCZ), bipolar disorder (BD), multiple sclerosis (MS), dementia, mild cognitive impairment (MCI), and Parkinson's disease (PD) in comparison to healthy controls (HC) (44, 45). Interestingly, reduction in area of the pons over time can significantly discriminate MSA from Progressive Supranuclear Palsy (PSP) (46). Moreover, the Fractional Anisotropy (FA) and Apparent Diffusion Coefficient (ADC) values in the area of the pons can differentiate the middle cerebellar peduncles parkinsonian subtype (MSA-P) patients from PD with 100% specificity (47). Interestingly, the voxel-based morphometry (VBM) analysis has also identified neurodegenerative changes primarily in the midbrain and area of the pons of PSP patients as compared to controls (48). Finally, degeneration of the locus coeruleus (LC), a long and narrow nucleus in the area of the pons, correlates with cognitive dysfunction and potentiate pathology of AD (49).
In our earlier studies, we observed the variation in the MCP width, area of the pons and midbrain cross-sectional areas as well as their significant association with the molecular measures in individuals who developed symptoms of FXTAS over time as compared to non-symptomatic PM and healthy controls, suggesting their role in FXTAS pathogenesis and progression (16, 17). These findings point toward the critical involvement of the area of the pons in neurodegenerative disorders, which could potentially provide information about the neuropathology of the disease and lead to early clinical diagnosis of these diseases.
Metabolomics is the omics platform that measures levels of metabolites in biological samples (50) uncovering potential biomarkers of aging and neurodegenerative diseases such as AD (51), Parkinson (52), Huntington (53), MS (54), and Amyotrophic Lateral Sclerosis (55) and FXTAS (25). A larger number of untargeted metabolomics-based studies have been reported using plasma/serum samples, due to its minimally invasive nature and relatively easy availability of blood samples. Unique metabolic signatures associated with altered energy homeostasis, Krebs cycle, changes in lipid membrane associated with abnormal CSF Aβ42 levels, altered mitochondrial function, neurotransmitter and lipid biosynthesis, are altered in plasma of patients with mild cognitive impairment and more pronounced in patients with AD (56–61). Majorly disturbed metabolic pathways observed in PD are also related to the metabolism of lipids, energy (TCA cycle, glycolysis, acylcarnitines), fatty acids and tryptophan, with the latter presenting a high correlation with the progression of PD (62–68). The energy and phospholipid metabolism have also been found to be impaired in patients with HD that ultimately affects the function of neurons (53, 69). Glucose metabolism is dysregulated in AD patients (70) and in area of the pons and cerebellum of MSA patients (71, 72), while an association of fatty acid metabolism with the development of ALS was observed (73). Finally, in our recent study we reported on the identification of metabolic biomarkers of early diagnosis and progression of FXTAS and on their association with altered lipid metabolism including free fatty acids, acylcarnitine, sphingolipids, diacylglycerol, and phospholipids, in individuals who developed the symptoms of FXTAS over time (25).
In this study we observed an association of metabolic biomarkers, including ceramides and mannonate, in CON as compared to NCON (Figure 2) with brain measures, specifically with area of the pons area, suggesting the potential role of altered metabolomics in the pathogenesis of FXTAS. We also found their significant association with the FXTAS stage (Table 2) ultimately providing the insight into the FXTAS disease progression with the dysregulation of the metabolic pathways.
The Krebs cycle or the TCA cycle is an important pathway in the production of ATP through the oxidative phosphorylation of acetyl-CoA in the mitochondria. With the onset of the neurodegenerative processes in PD, the metabolism of TCA cycle was found to be dysregulated indicating an energy shortage and mitochondrial dysfunction in PD (74). Similarly, previous studies in FXTAS (19, 20, 22) reported on altered plasma and PBMCs levels (either increased or decreased) of several intermediates of the Krebs cycle in individuals with FXTAS as compared to controls. In accordance with these previous studies, we found a significance correlation of various Krebs cycle intermediates, including palmitate (16:0), palmitoleate (16:1n7), palmitoylcarnitine (C16) and fumarate (Figure 3B, bold) with the FXTAS stage (Figure 3A) supporting the observed mitochondrial dysfunction as a contributing factor in the pathogenesis of the FXTAS.
Sphingolipids include ceramides, sphingosine-1-phosphate, lactosyl-N-behenoyl-sphingosine and sphingomyelins, which play an important role in neuronal functions as sphingolipids are critical to prevent the cell death, loss of synaptic plasticity, and neurodegeneration (75). High levels of ceramide have been detected in the CNS and in plasma of AD patients and of PD patients, indicating that ceramide metabolism could be associated with various stages of PD and AD progression and hippocampal atrophy (76–78) and suggested as a pharmacological target for the AD treatment (79). In a recent study, the sphingolipid metabolism, and specifically the levels of sphingosine, sphingosine 1-phosphate, and sphingomyelin were found to be altered in the cerebellum of FXTAS mice (24). We have reported on increased ceramides levels in the CON as compared to NCON group (25) and, interestingly, in this study we observed a significant association with area of the pons both at V1 and V2 (Figures 2A,B). Further, the sphingolipid metabolism intermediates lactosyl-N-behenoyl-sphingosine (d18:1/22:0) and ceramide (d16:1/24:1, d18:1/22:1) (Figure 3C, bold) both were significantly associated with FXTAS stage suggesting their role in the development of FXTAS and the pathway as a potential target for personalized therapeutic development.
In this study, we found a significant correlation of metabolic biomarkers with the area of the pons in individuals who developed FXTAS over the time. We also report their significant association with the progression of the disorder and their role in context of dysregulated lipid and sphingolipid metabolism. These findings could be of a great value as the area of the pons provides distinct information about neuroanatomical and pathophysiological processes. Its association with the FXTAS biomarkers can assist in identifying the PM at risk as well as assist in evaluating disease progression and therapeutic responses to targeted drug development. Further research is needed to replicate these findings in a larger well-characterized cohort to further explore the role of other brainstem structures in FXTAS and human health and disease.
The raw data supporting the conclusions of this article will be made available by the authors, without undue reservation.
This study and all the included protocols involved the human participant and were carried out in accordance with the Institutional Review Board at the University of California Davis. All participants gave written informed consent before participating in the study in line with the Declaration of Helsinki.
FT contributed to the conception while MZ, SR, DH, and FT contributed to the organization of the study. BD-J performed the statistical analysis and MZ wrote the first draft of the manuscript. MZ, BD-J, EF, SR, DH, and FT made amendments to the manuscripts. All authors contributed to the manuscript revision and approved the submitted version, recruited samples in their respective centers, assessed outpatients, and organized the database.
The work is supported by R01MH07041.
DH has received funding from Novartis, Roche, Seaside Therapeutics LLC and Marinus Pharmaceuticals, Inc. for designing Fragile X clinical Trials. FT has received funding from Azrieli Foundation, Zynerba and Asuragen, Inc. for studies in Fragile X syndrome.
The remaining authors declare that the research was conducted in the absence of any commercial or financial relationships that could be construed as a potential conflict of interest.
All claims expressed in this article are solely those of the authors and do not necessarily represent those of their affiliated organizations, or those of the publisher, the editors and the reviewers. Any product that may be evaluated in this article, or claim that may be made by its manufacturer, is not guaranteed or endorsed by the publisher.
We thank the participants of the community-based studies who donated their time and sample for this study. This paper is dedicated to the memory of Matteo.
1. Niccoli T, Partridge L. Ageing as a risk factor for disease. Curr Biol. (2012) 22:R741–52. doi: 10.1016/j.cub.2012.07.024
2. Schönfeld P, Reiser G. Why does brain metabolism not favor burning of fatty acids to provide energy? Reflections on disadvantages of the use of free fatty acids as fuel for brain. J Cereb Blood Flow Metab. (2013) 33:1493–9. doi: 10.1038/jcbfm.2013.128
3. Camandola S, Mattson MP. Brain metabolism in health, aging, and neurodegeneration. EMBO J. (2017) 36:1474–92. doi: 10.15252/embj.201695810
4. Hagerman RJ, Berry-Kravis E, Hazlett HC, Bailey DB Jr, Moine H, Kooy RF, et al. Fragile X syndrome. Nat Rev Dis Primers. (2017) 3:17065. doi: 10.1038/nrdp.2017.65
5. Jacquemont S, Hagerman RJ, Leehey MA, Hall DA, Levine RA, Brunberg JA, et al. Penetrance of the fragile X-associated tremor/ataxia syndrome in a premutation carrier population. JAMA. (2004) 291:460–9. doi: 10.1001/jama.291.4.460
6. Tassone F, Iong KP, Tong T-H, Lo J, Gane LW, Berry-Kravis E, et al. FMR1 CGG allele size and prevalence ascertained through newborn screening in the United States. Genome Med. (2012) 4:100. doi: 10.1186/gm401
7. Hagerman RJ, Hagerman P. Fragile X-associated tremor/ataxia syndrome - features, mechanisms and management. Nat Rev Neurol. (2016) 12:403–412. doi: 10.1038/nrneurol.2016.82
8. Rivera SM, Stebbins GT, Grigsby J. Radiological Findings in FXTAS. In: The Fragile X-Associated Tremor Ataxia Syndrome (FXTAS) New York, NY: Springer. p. 55–66.
9. Apartis E, Blancher A, Meissner WG, Guyant-Maréchal L, Maltête D, De Broucker T, et al. FXTAS: new insights and the need for revised diagnostic criteria. Neurology. (2012) 79:1898–907. doi: 10.1212/WNL.0b013e318271f7ff
10. Kalus S, King J, Lui E, Gaillard F. Fragile X-associated tremor/ataxia syndrome: an under-recognised cause of tremor and ataxia. J Clin Neurosci. (2016) 23:162–4. doi: 10.1016/j.jocn.2015.08.010
11. Scaglione C, Ginestroni A, Vella A, Dotti MT, Nave RD, Rizzo G, et al. MRI and SPECT of midbrain and striatal degeneration in fragile X-associated tremor/ataxia syndrome. J Neurol. (2008) 255:144–6. doi: 10.1007/s00415-007-0711-8
12. Grinberg LT, Rueb U, Heinsen H. Brainstem: neglected locus in neurodegenerative diseases. Front Neurol. (2011) 2:42. doi: 10.3389/fneur.2011.00042
13. Yang A, h. Xiao X, l., Wang Z. Evaluation of normal changes in pons metabolites due to aging using turbo spectroscopic imaging. AJNR Am J Neuroradiol. (2014) 35:2099–105. doi: 10.3174/ajnr.A4031
14. Emamzadeh FN, Surguchov A. Parkinson's disease: biomarkers, treatment, and risk factors. Front Neurosci. (2018) 12:612. doi: 10.3389/fnins.2018.00612
15. Chelban V, Bocchetta M, Hassanein S, Haridy NA, Houlden H, Rohrer JD. An update on advances in magnetic resonance imaging of multiple system atrophy. J Neurol. (2019) 266:1036–45. doi: 10.1007/s00415-018-9121-3
16. Shelton AL, Wang JY, Fourie E, Tassone F, Chen A, Frizzi L, et al. Middle cerebellar peduncle width-a novel mri biomarker for FXTAS? Front Neurosci. (2018) 12:379. doi: 10.3389/fnins.2018.00379
17. Zafarullah M, Tang H-T, Durbin-Johnson B, Fourie E, Hessl D, Rivera SM, et al. FMR1 locus isoforms: potential biomarker candidates in fragile X-associated tremor/ataxia syndrome (FXTAS). Sci Rep. (2020) 10:11099. doi: 10.1038/s41598-020-67946-y
18. Cenini G, Lloret A, Cascella R. Oxidative stress in neurodegenerative diseases: from a mitochondrial point of view. Oxid Med Cell Longev. (2019) 2019:2105607. doi: 10.1155/2019/2105607
19. Giulivi C, Napoli E, Tassone F, Halmai J, Hagerman R. Plasma biomarkers for monitoring brain pathophysiology in fmr1 premutation carriers. Front Mol Neurosci. (2016) 9:71. doi: 10.3389/fnmol.2016.00071
20. Giulivi C, Napoli E, Tassone F, Halmai J, Hagerman R. Plasma metabolic profile delineates roles for neurodegeneration, pro-inflammatory damage and mitochondrial dysfunction in the FMR1 premutation. Biochem J. (2016) 473:3871–88. doi: 10.1042/BCJ20160585
21. Song G, Napoli E, Wong S, Hagerman R, Liu S, Tassone F, et al. Altered redox mitochondrial biology in the neurodegenerative disorder fragile X-tremor/ataxia syndrome: use of antioxidants in precision medicine. Mol Med. (2016) 22:548–59. doi: 10.2119/molmed.2016.00122
22. Napoli E, Song G, Schneider A, Hagerman R, Eldeeb MAAA, Azarang A, et al. Warburg effect linked to cognitive-executive deficits in FMR1 premutation. FASEB J. (2016) 30:3334–51. doi: 10.1096/fj.201600315R
23. Napoli E, Schneider A, Wang JY, Trivedi A, Carrillo NR, Tassone F, et al. Allopregnanolone treatment improves plasma metabolomic profile associated with GABA metabolism in fragile X-associated tremor/ataxia syndrome: a pilot study. Mol Neurobiol. (2019) 56:3702–13. doi: 10.1007/s12035-018-1330-3
24. Kong HE, Lim J, Zhang F, Huang L, Gu Y, Nelson DL, et al. Metabolic pathways modulate the neuronal toxicity associated with fragile X-associated tremor/ataxia syndrome. Hum Mol Genet. (2019) 28:980–91. doi: 10.1093/hmg/ddy410
25. Zafarullah M, Palczewski G, Rivera SM, Hessl DR, Tassone F. Metabolic profiling reveals dysregulated lipid metabolism and potential biomarkers associated with the development and progression of Fragile X-Associated Tremor/Ataxia Syndrome (FXTAS). FASEB J. (2020) 34:16676–92. doi: 10.1096/fj.202001880R
26. Bacalman S, Farzin F, Bourgeois JA, Cogswell J, Goodlin-Jones BL, Gane LW, et al. Psychiatric phenotype of the fragile X-associated tremor/ataxia syndrome (FXTAS) in males: newly described fronto-subcortical dementia. J Clin Psychiatry. (2006) 67:87–94. doi: 10.4088/JCP.v67n0112
27. Zafarullah M, Tassone F. Fragile X-Associated Tremor/Ataxia Syndrome (FXTAS). Methods Mol Biol. (2019) 1942:173–89. doi: 10.1007/978-1-4939-9080-1_15
28. Tassone F, Pan R, Amiri K, Taylor AK, Hagerman PJ. A rapid polymerase chain reaction-based screening method for identification of all expanded alleles of the fragile X (FMR1) gene in newborn and high-risk populations. J Mol Diagn. (2008) 10:43–9. doi: 10.2353/jmoldx.2008.070073
29. Filipovic-Sadic S, Sah S, Chen L, Krosting J, Sekinger E, Zhang W, et al. A novel FMR1 PCR method for the routine detection of low abundance expanded alleles and full mutations in fragile X syndrome. Clin Chem. (2010) 56:399–408. doi: 10.1373/clinchem.2009.136101
30. Ardekani BA, Bachman AH. Model-based automatic detection of the anterior and posterior commissures on MRI scans. Neuroimage. (2009) 46:677–82. doi: 10.1016/j.neuroimage.2009.02.030
31. Mori S, Crain BJ, Chacko VP, van Zijl PC. Three-dimensional tracking of axonal projections in the brain by magnetic resonance imaging. Ann Neurol. (1999) 45:265–9.
32. Tustison NJ, Avants BB, Cook PA, Zheng Y, Egan A, Yushkevich PA, et al. N4ITK: improved N3 bias correction. IEEE Trans Med Imaging. (2010) 29:1310–20. doi: 10.1109/TMI.2010.2046908
33. Quattrone A, Nicoletti G, Messina D, Fera F, Condino F, Pugliese P, et al. MR imaging index for differentiation of progressive supranuclear palsy from Parkinson disease and the Parkinson variant of multiple system atrophy. Radiology. (2008) 246:214–21. doi: 10.1148/radiol.2453061703
34. Nicoletti G, Fera F, Condino F, Auteri W, Gallo O, Pugliese P, et al. MR imaging of middle cerebellar peduncle width: differentiation of multiple system atrophy from Parkinson disease. Radiology. (2006) 239:825–30. doi: 10.1148/radiol.2393050459
35. Evans AM, DeHaven CD, Barrett T, Mitchell M, Milgram E. Integrated, nontargeted ultrahigh performance liquid chromatography/electrospray ionization tandem mass spectrometry platform for the identification and relative quantification of the small-molecule complement of biological systems. Anal Chem. (2009) 81:6656–67. doi: 10.1021/ac901536h
36. Benjamini Y, Hochberg Y. Controlling the false discovery rate: a practical and powerful approach to multiple testing. J R Stat Soc Ser. (1995) 57:289–300. doi: 10.1111/j.2517-6161.1995.tb02031.x
37. The R Project for Statistical Computing. Available online at: https://www.r-project.org/ (accessed April 6, 2021)
38. Saeed U, Compagnone J, Aviv RI, Strafella AP, Black SE, Lang AE, et al. Imaging biomarkers in Parkinson's disease and Parkinsonian syndromes: current and emerging concepts. Transl Neurodegener. (2017) 6:8. doi: 10.1186/s40035-017-0076-6
39. Mazón M, Vázquez Costa JF, Ten-Esteve A, Martí-Bonmatí L. Imaging biomarkers for the diagnosis and prognosis of neurodegenerative diseases. the example of amyotrophic lateral sclerosis. Front Neurosci. (2018) 12:784. doi: 10.3389/fnins.2018.00784
40. Braun DJ, Van Eldik LJ. In vivo brainstem imaging in alzheimer's disease: potential for biomarker development. Front Aging Neurosci. (2018) 10:266. doi: 10.3389/fnagi.2018.00266
41. Kehoe EG, McNulty JP, Mullins PG, Bokde AL. Advances in MRI biomarkers for the diagnosis of Alzheimer's disease. Biomark Med. (2014) 8:1151–69. doi: 10.2217/bmm.14.42
42. Del Negro CA, Funk GD, Feldman JL. Breathing matters. Nat Rev Neurosci. (2018) 19:351–67. doi: 10.1038/s41583-018-0003-6
43. Sara SJ. The locus coeruleus and noradrenergic modulation of cognition. Nat Rev Neurosci. (2009) 10:211–23. doi: 10.1038/nrn2573
44. Przedborski S. The two-century journey of Parkinson disease research. Nat Rev Neurosci. (2017) 18:251–9. doi: 10.1038/nrn.2017.25
45. Elvsåshagen T, Bahrami S, van der Meer D, Agartz I, Alnæs D, Barch DM, et al. The genetic architecture of human brainstem structures and their involvement in common brain disorders. Nat Commun. (2020) 11:4016. doi: 10.1038/s41467-020-17376-1
46. Reginold W, Lang AE, Marras C, Heyn C, Alharbi M, Mikulis DJ. Longitudinal quantitative MRI in multiple system atrophy and progressive supranuclear palsy. Parkinsonism Relat Disord. (2014) 20:222–5. doi: 10.1016/j.parkreldis.2013.10.002
47. Ito M, Watanabe H, Kawai Y, Atsuta N, Tanaka F, Naganawa S, et al. Usefulness of combined fractional anisotropy and apparent diffusion coefficient values for detection of involvement in multiple system atrophy. J Neurol Neurosurg Psychiatry. (2007) 78:722–8. doi: 10.1136/jnnp.2006.104075
48. Boxer AL, Geschwind MD, Belfor N, Gorno-Tempini ML, Schauer GF, Miller BL, et al. Patterns of brain atrophy that differentiate corticobasal degeneration syndrome from progressive supranuclear palsy. Arch Neurol. (2006) 63:81–6. doi: 10.1001/archneur.63.1.81
49. Theofilas P, Ehrenberg AJ, Dunlop S, Di Lorenzo Alho AT, Nguy A, Leite REP, et al. Locus coeruleus volume and cell population changes during Alzheimer's disease progression: A stereological study in human postmortem brains with potential implication for early-stage biomarker discovery. Alzheimers Dement. (2017) 13:236–46. doi: 10.1016/j.jalz.2016.06.2362
50. Bourgognon J-M, Steinert JR. The metabolome identity: basis for discovery of biomarkers in neurodegeneration. Neural Regen Res. (2019) 14:387–90. doi: 10.4103/1673-5374.245464
51. Wilkins JM, Trushina E. Application of metabolomics in Alzheimer's disease. Front Neurol. (2018) 8:719. doi: 10.3389/fneur.2017.00719
52. Shao Y, Le W. Recent advances and perspectives of metabolomics-based investigations in Parkinson's disease. Mol Neurodegener. (2019) 14:3. doi: 10.1186/s13024-018-0304-2
53. Graham SF, Pan X, Yilmaz A, Macias S, Robinson A, Mann D, et al. Targeted biochemical profiling of brain from Huntington's disease patients reveals novel metabolic pathways of interest. Biochim Biophys Acta Mol Basis Dis. (2018) 1864:2430–7. doi: 10.1016/j.bbadis.2018.04.012
54. Stoessel D, Stellmann J-P, Willing A, Behrens B, Rosenkranz SC, Hodecker SC, et al. Metabolomic profiles for primary progressive multiple sclerosis stratification and disease course monitoring. Front Hum Neurosci. (2018) 12:226. doi: 10.3389/fnhum.2018.00226
55. Kirk SE, Tracey TJ, Steyn FJ, Ngo ST. Biomarkers of metabolism in amyotrophic lateral sclerosis. Front Neurol. (2019) 10:191. doi: 10.3389/fneur.2019.00191
56. Trushina E, Dutta T, Persson XM, Mielke MM, Petersen RC. Identification of altered metabolic pathways in plasma and CSF in mild cognitive impairment and Alzheimer's disease using metabolomics. PLoS ONE. (2013) 8:e63644. doi: 10.1371/journal.pone.0063644
57. Kaddurah-Daouk R, Zhu H, Sharma S, Bogdanov M, Rozen SG, Matson W, et al. Alterations in metabolic pathways and networks in Alzheimer's disease. Transl Psychiatry. (2013) 3:e244. doi: 10.1038/tp.2013.18
58. Graham SF, Chevallier OP, Elliott CT, Hölscher C, Johnston J, McGuinness B, et al. Untargeted metabolomic analysis of human plasma indicates differentially affected polyamine and L-arginine metabolism in mild cognitive impairment subjects converting to Alzheimer's disease. PLoS ONE. (2015) 10:e0119452. doi: 10.1371/journal.pone.0119452
59. Sonntag K-C, Ryu W-I, Amirault KM, Healy RA, Siegel AJ, McPhie DL, et al. Late-onset Alzheimer's disease is associated with inherent changes in bioenergetics profiles. Sci Rep. (2017) 7:14038. doi: 10.1038/s41598-017-14420-x
60. Mapstone M, Cheema AK, Fiandaca MS, Zhong X, Mhyre TR, MacArthur LH, et al. Plasma phospholipids identify antecedent memory impairment in older adults. Nat Med. (2014) 20:415–8. doi: 10.1038/nm.3466
61. Toledo JB, Arnold M, Kastenmüller G, Chang R, Baillie RA, Han X, et al. Metabolic network failures in Alzheimer's disease: a biochemical road map. Alzheimers Dement. (2017) 13:965–84. doi: 10.1016/j.jalz.2017.01.020
62. Roede JR, Uppal K, Park Y, Lee K, Tran V, Walker D, et al. Serum metabolomics of slow vs. rapid motor progression Parkinson's disease: a pilot study. PLoS ONE. (2013) 8:e77629. doi: 10.1371/journal.pone.0077629
63. Trupp M, Jonsson P, Ohrfelt A, Zetterberg H, Obudulu O, Malm L, et al. Metabolite and peptide levels in plasma and CSF differentiating healthy controls from patients with newly diagnosed Parkinson's disease. J Parkinsons Dis. (2014) 4:549–60. doi: 10.3233/JPD-140389
64. Lei S, Zavala-Flores L, Garcia-Garcia A, Nandakumar R, Huang Y, Madayiputhiya N, et al. Alterations in energy/redox metabolism induced by mitochondrial and environmental toxins: a specific role for glucose-6-phosphate-dehydrogenase and the pentose phosphate pathway in paraquat toxicity. ACS Chem Biol. (2014) 9:2032–48. doi: 10.1021/cb400894a
65. Schulte EC, Altmaier E, Berger HS, Do KT, Kastenmüller G, Wahl S, et al. Alterations in lipid and inositol metabolisms in two dopaminergic disorders. PLoS ONE. (2016) 11:e0147129. doi: 10.1371/journal.pone.0147129
66. Saiki S, Hatano T, Fujimaki M, Ishikawa K-I, Mori A, Oji Y, et al. Decreased long-chain acylcarnitines from insufficient β-oxidation as potential early diagnostic markers for Parkinson's disease. Sci Rep. (2017) 7:7328. doi: 10.1038/s41598-017-06767-y
67. Havelund JF, Andersen AD, Binzer M, Blaabjerg M, Heegaard NHH, Stenager E, et al. Changes in kynurenine pathway metabolism in Parkinson patients with L-DOPA-induced dyskinesia. J Neurochem. (2017) 142:756–66. doi: 10.1111/jnc.14104
68. Okuzumi A, Hatano T, Ueno S-I, Ogawa T, Saiki S, Mori A, et al. Metabolomics-based identification of metabolic alterations in PARK2. Ann Clin Transl Neurol. (2019) 6:525–36. doi: 10.1002/acn3.724
69. Kumar KK, Goodwin CR, Uhouse MA, Bornhorst J, Schwerdtle T, Aschner M, et al. Untargeted metabolic profiling identifies interactions between Huntington's disease and neuronal manganese status. Metallomics. (2015) 7:363–70. doi: 10.1039/C4MT00223G
70. An Y, Varma VR, Varma S, Casanova R, Dammer E, Pletnikova O, et al. Evidence for brain glucose dysregulation in Alzheimer's disease. Alzheimers Dement. (2018) 14:318–29. doi: 10.1016/j.jalz.2017.09.011
71. Juh R, Kim J, Moon D, Choe B, Suh T. Different metabolic patterns analysis of Parkinsonism on the 18F-FDG PET. Eur J Radiol. (2004) 51:223–33. doi: 10.1016/S0720-048X(03)00214-6
72. Eckert T, Barnes A, Dhawan V, Frucht S, Gordon MF, Feigin AS, et al. FDG PET in the differential diagnosis of parkinsonian disorders. Neuroimage. (2005) 26:912–21. doi: 10.1016/j.neuroimage.2005.03.012
73. Goutman SA, Boss J, Guo K, Alakwaa FM, Patterson A, Kim S, et al. Untargeted metabolomics yields insight into ALS disease mechanisms. J Neurol Neurosurg Psychiatry. (2020) 91:1329–38. doi: 10.1136/jnnp-2020-323611
74. Graham SF, Rey NL, Yilmaz A, Kumar P, Madaj Z, Maddens M, et al. Biochemical profiling of the brain and blood metabolome in a mouse model of prodromal Parkinson's disease reveals distinct metabolic profiles. J Proteome Res. (2018) 17:2460–9. doi: 10.1021/acs.jproteome.8b00224
75. Alessenko AV, Albi E. Exploring sphingolipid implications in neurodegeneration. Front Neurol. (2020) 11:437. doi: 10.3389/fneur.2020.00437
76. Di Pardo A, Maglione V. Sphingolipid metabolism: a new therapeutic opportunity for brain degenerative disorders. Front Neurosci. (2018) 12:249. doi: 10.3389/fnins.2018.00249
77. Kim M, Nevado-Holgado A, Whiley L, Snowden SG, Soininen H, Kloszewska I, et al. Association between plasma ceramides and phosphatidylcholines and hippocampal brain volume in late onset Alzheimer's disease. J Alzheimers Dis. (2017) 60:809–17. doi: 10.3233/JAD-160645
78. Mielke MM, Maetzler W, Haughey NJ, Bandaru VVR, Savica R, Deuschle C, et al. Plasma ceramide and glucosylceramide metabolism is altered in sporadic Parkinson's disease and associated with cognitive impairment: a pilot study. PLoS ONE. (2013) 8:e73094. doi: 10.1371/journal.pone.0073094
79. van Kruining D, Luo Q, van Echten-Deckert G, Mielke MM, Bowman A, Ellis S, et al. Sphingolipids as prognostic biomarkers of neurodegeneration, neuroinflammation, and psychiatric diseases and their emerging role in lipidomic investigation methods. Adv Drug Deliv Rev. (2020) 159:232–44. doi: 10.1016/j.addr.2020.04.009
Keywords: fragile X-associated tremor/ataxia syndrome, area of the pons, metabolic biomarkers, brain measures, lipids, premutation carriers
Citation: Zafarullah M, Durbin-Johnson B, Fourie ES, Hessl DR, Rivera SM and Tassone F (2021) Metabolomic Biomarkers Are Associated With Area of the Pons in Fragile X Premutation Carriers at Risk for Developing FXTAS. Front. Psychiatry 12:691717. doi: 10.3389/fpsyt.2021.691717
Received: 06 April 2021; Accepted: 21 July 2021;
Published: 16 August 2021.
Edited by:
Reymundo Lozano, Mount Sinai Medical Center, United StatesReviewed by:
Laia Rodriguez-Revenga, Hospital Clínic de Barcelona, SpainCopyright © 2021 Zafarullah, Durbin-Johnson, Fourie, Hessl, Rivera and Tassone. This is an open-access article distributed under the terms of the Creative Commons Attribution License (CC BY). The use, distribution or reproduction in other forums is permitted, provided the original author(s) and the copyright owner(s) are credited and that the original publication in this journal is cited, in accordance with accepted academic practice. No use, distribution or reproduction is permitted which does not comply with these terms.
*Correspondence: Flora Tassone, ZnRhc3NvbmVAdWNkYXZpcy5lZHU=
Disclaimer: All claims expressed in this article are solely those of the authors and do not necessarily represent those of their affiliated organizations, or those of the publisher, the editors and the reviewers. Any product that may be evaluated in this article or claim that may be made by its manufacturer is not guaranteed or endorsed by the publisher.
Research integrity at Frontiers
Learn more about the work of our research integrity team to safeguard the quality of each article we publish.