
94% of researchers rate our articles as excellent or good
Learn more about the work of our research integrity team to safeguard the quality of each article we publish.
Find out more
ORIGINAL RESEARCH article
Front. Psychiatry , 28 October 2021
Sec. Mood Disorders
Volume 12 - 2021 | https://doi.org/10.3389/fpsyt.2021.678384
This article is part of the Research Topic Novel Approaches to Improve Detection, Differentiation and Treatment in Mood Disorders View all 12 articles
 Ruize Song1†
 Yachen Shi1†
 Xianrui Li2
 Jianli Zhu2
 Hongxing Zhang2,3
 Kun Li2
 Bi Wang2
 Haisan Zhang3
 Yongfeng Yang3
 Lijuan Gao1
 Yang Zhao4*
 Zhijun Zhang1,2*
Background: The evaluation of treatment response to antidepressant therapy commonly depends on neuropsychologic assessments, as there are currently no suitable biomarkers. Previous research has identified a panel of increased proteins in patients with major depressive disorder (MDD), including antithrombin III (ATIII), as potential biomarkers of depression.
Methods: A total of 90 MDD patients were recruited. Of these, 74 patients received occipital repetitive transcranial magnetic stimulation (rTMS) as individualized, standard, or sham treatment for 5 days, and underwent the complete procedure, including clinical assessments, blood collection, and protein measurement.
Results: After treatment, ATIII was significantly decreased in both the individualized and standard groups (both p < 0.001) relative to the sham group. In the individualized group, reduction in ATIII was associated with improvements in several neuropsychological assessments. Furthermore, ATIII at baseline in the standard group and after individualized rTMS showed good performance for evaluating or predicting the response to five-day treatment (AUC = 0.771, 95% CI, 0.571–0.971; AUC = 0.875, 95% CI, 0.714–1.000, respectively) and remission at follow-up (AUC = 0.736, 95% CI, 0.529–0.943; AUC = 0.828, 95% CI, 0.656–1.000, respectively). Lastly, both baseline ATIII and change in ATIII showed good predictive value for the 24-item Hamilton Depression Rating Scale at follow-up (p = 0.024 and 0.023, respectively).
Conclusion: Our study revealed a reduction in ATIII after occipital rTMS in MDD patients and a relationship between change in ATIII and therapeutic response. Taken together, these findings provide evidence for the potential of ATIII as a biomarker for the evaluation and prediction of antidepressive effects.
Major depressive disorder (MDD) is a mental illness characterized by low mood and anhedonia that affects 322 million people worldwide, leading to excess disability and mortality (1–3). For the period of 2007 to 2017, MDD was the third leading cause of global years lived with disability (YLDs) (1). According to the World Health Organization, this common mental disorder will be responsible for the greatest burden of disease worldwide by 2030 (4). Both biological factors and environmental milieu are related to the occurrence of depression (5, 6); however, little is known about the physiopathological mechanisms underlying MDD. Several hypotheses have been proposed (3, 7). In one of the mainstream theories, neuroinflammation is proposed to influence MDD through abnormalities in immune cells, like microglia, astrocytes and oligodendroglia, and increases in inflammatory factors (8–12). Accumulating evidence suggests that neuroinflammation might be a mediator of MDD in connection with other possible mechanisms, such as stress, neuroendocrine system dysfunction, neurotransmitters depletion, neurogenesis defects, and intestinal flora disorder (13–17). As reported in previous studies, various anti-inflammatory treatments can improve depression symptoms, supporting that inflammatory molecules or pathways may be potential targets for novel antidepressant therapy (18, 19).
At present, MDD and antidepressive therapy response are assessed by clinical features, rather than objective indicators, duo to the lack of confirmed clinical biomarkers (3, 20, 21). As a result, it is imperative to identify and evaluate potential biomarkers of MDD. A variety of techniques have been utilized in the aim to identify such biomarkers, including genomics, transcriptomics, proteomics, metabonomics, neuroimaging, electroencephalography, etc. (22–27). In comparison to other biological parameters, proteins play direct roles in the occurrence and development of MDD and the result of antidepressive treatment (24), and thus have great application as candidate biomarkers.
In our previous proteomic study, four proteins were noted: C-reactive protein (CRP), antithrombin III (ATIII), inter-alpha-trypsin inhibitor heavy chain H4 (ITIH4), and vitamin D binding protein (VDB) (28). As an acute-phase protein, CRP is synthesized by hepatocytes and increases rapidly in response to systemic inflammation with activated innate immunity (29, 30). A multitude of studies have demonstrated that high levels of CRP are associated with MDD (31). Notably, CRP values have been used to predict the outcome of depression and resistance to standard antidepressants (32–34). ATIII is a glycoprotein mainly produced in the liver that exerts anticoagulant and anti-inflammatory effects by targeting activated thrombin and other blood coagulation factors (35, 36). In addition, ATIII can promote prostacyclin release and deactivate leukocytes to inhibit inflammation independent from coagulation (36). As reported by Stelzhammer et al., elevated levels of ATIII were detected in MDD patients after the first session of electroconvulsive therapy (ECT) (37). ITIH4 is an acute-phase protein related to inflammatory response involved in cell proliferation, migration, anti-apoptosis, and matrix stabilizing (38, 39). A genome-wide analysis reported that single nucleotide polymorphisms (SNPs) in the ITIH4 gene were associated with bipolar disorder (40). Furthermore, according to Finseth et al., there are associations between suicide attempt and ITIH4 (41). The main biological function of VDB, as its name suggests, is to bind and transport the specific sterol and its metabolites. Additional physiological processes regulated by this glycoprotein include actin scavenging, macrophage and osteoclast activation, and phagocytic cells chemotaxis (42–44). In prior studies, increased VDB was observed in patients with major mood disorders, comprised of both MDD and bipolar disorder (45–47). These four proteins were observed to be elevated in the depressed sample compared with controls in our previous study (28), supporting their potential to differentiate MDD. However, whether they are associated with antidepressive treatment and curative effects is unknown.
Occipital repetitive transcranial magnetic stimulation (rTMS) therapy is a novel non-invasive intervention for MDD with established safety and efficacy (48). The occipital cortex has been demonstrated to be associated with the pathophysiologic changes of MDD, which was supported by altered visual evoked potential, diminished perception of ambient light, impaired synaptic plasticity and low density of calbindin-immunoreactive GABAergic neurons in the occipital cortex in MDD patients (49–51). Moreover, a previous study suggests that selectively neural response to emotional stimuli in the occipital cortex might be a useful biomarker in identifying responders to scopolamine (52), which partly supports the role of the occipital cortex in antidepressive treatment.
This present study aimed at exploring changes in four proteins included CRP, ATIII, ITIH4, and VDB after occipital rTMS, and to assess their potential as biomarkers of the outcomes and effects of antidepressive therapy.
The Ethics Committee of the Second Affiliated Hospital of Xinxiang Medical University approved this study, which was carried out at Henan Provincial Mental Hospital. All work involving human subjects followed the latest version of the Declaration of Helsinki. After the benefits and risks of the study were fully explained, a total of 90 drug naïve or drug free depressed individuals were recruited. Written informed consent was obtained from the participants or their legal guardians.
The inclusion criteria for MDD patients were as follows: (a) meeting the diagnostic criteria of MDD according to the Diagnostic and Statistical Manual of Mental Disorders, Fourth Edition (DSM-IV), assessed by two well-trained psychiatrists utilizing the Structured Clinical Interview for DSM-IV; (b) a score of >17 on the 24-item Hamilton Depression Rating Scale (HAMD-24); (c) aged 18 to 55 and drug naïve or drug free for at least 2 weeks; and (d) able to cooperate with the trial and understand the items properly.
Patients suffering from the following disorders or diseases were excluded: (a) other DSM-IV axis I or axis II disorders; (b) organic brain diseases; (c) psychotic depression; (d) endocrine diseases with abnormal biochemical indexes or organ functions; (e) treatment-resistant depression treated by electroconvulsive shock or rTMS with adequate dosage and duration; and f. diseases that result in any contraindications to magnetic resonance imaging (MRI) or rTMS. In addition, given potential effects due to alterations in hormones, female patients who were pregnant or in the puerperium or climacteric periods were excluded from this study.
The scales for neuropsychological assessments in three dimensions (affective assessments, social-psychology assessments, and cognitive function assessments) were described in detail in our previous study (53). Briefly, to estimate the affective states of the MDD patients, the HAMD-24, Hamilton Anxiety Scale (HAMA), Beck Scale for Suicide Ideation-Chinese version-Current (BSI-CV-C), Self-Rating Depression Scale (SDS), Self-Rating Anxiety Scale (SAS), and Beck Hopelessness Scale (BHS) were conducted under unified instructions at baseline and day 1, 3, and 5 of treatment. In addition, during the 4 week follow-up study, the HAMD-24 was used once per week to evaluate the outcomes. To assess social psychology traits, patients were assessed once using the Life Event Scale (LES), Childhood Trauma Questionnaire-Short Form (CTQ-SF), family Adaptation, Partnership, Growth, Affection, Resolve (APGAR), and Self-Consciousness Scale Revised (SCSR). Cognitive functions were estimated in terms of information processing speed, executive function, and visuospatial memory and learning function (detailed evaluation tools are listed in Supplementary Table 2), and were tested at baseline and at the end of treatment.
The strategy and parameters of rTMS treatment were reported in the previous study (48). Briefly, MDD patients were randomly assigned to the individualized group, standard group, or sham group to receive the corresponding therapy for 5 consecutive days. For the individualized group, the coordinates of the stimulation points were personalized based on affective visual tasks completed during functional MRI. For the standard group, fixed stimulation sites were set in the left cortical visual area V1. Moreover, the following parameters were applied in rTMS treatment in this study: stimulation intensity = 90% resting motor threshold, frequency = 10 Hz, train duration = 4 s, inter-train interval = 26 s, pulse number = 1,600 in each session, total duration = 20 min, number of time = 2 times per day, total sessions = 10.
Once participants were enrolled, 5 mL of fasting venous blood was collected in a plasma separator tube (Xinle, China) between 6:00 and 10:00 in the morning. An additional 5 mL whole blood sample was drawn after the 5 day treatment. Two runs of centrifugation were completed within 2 h of blood collection. The first processing was for plasma separation with a rotational speed of 2,000 × g for 10 min at 4°C. Afterwards, the supernatant was centrifuged for the second time for purification with a rotational speed of 12,000×g for 10 min under the same conditions. Plasma samples were stored at −80°C until quantitative determination of proteins.
Protein quantification was carried out using the enzyme-linked immunosorbent assay (ELISA) technique using commercial kits (R&D Systems, USA) according to the manufacturer's instructions. The concentration of diluted proteins was computed based on the standard curves, which was subsequently multiplied by the dilution factors to signify the actual protein level. Each sample was run in triplicate. Both the inter- and intra-assay coefficients of variation were <5%.
All data were analyzed using SPSS 20.0 (IBM, USA), GraphPad Prism 7.0 (GraphPad Software, USA), or SAS 9.4 (SAS Institute Inc., USA). Kolmogorov-Smirnov tests were used to assess the distributions of numerical variables. For variables with a non-normal distribution, Kruskal-Wallis tests were used to calculate the statistical significance of differences among groups. For variables with a Gaussian distribution, data were tested by one-way analyses of variance (ANOVA) with Bonferroni's post hoc tests. The protein levels and clinical assessments at the two time points were compared using paired t-tests or Wilcoxon signed-rank tests as required. In addition, Chi-squared tests were utilized to analyze categorical data. Partial correlation analyses and multivariate linear regressions were computed to determine the correlations and interactive effects, respectively. Receiver operating characteristic (ROC) curves were used to estimate and predict the antidepressive efficacy. Furthermore, a linear mixed model was established to explore predictive factors of therapeutic effects. Quantitative variables were expressed as mean [standard deviation (SD)] or median [interquartile range (IQR)], and categorical variables were expressed as absolute numbers. P < 0.05 was set as the level of statistical significance (two-tailed tests).
A total of 16 patients were excluded from analysis for various reasons, which are detailed in Supplementary Figure 1. Of the 74 remaining patients, 23 were assigned to the sham group, 24 were assigned to the individualized rTMS treatment group, and 27 were assigned to the standard rTMS treatment group. Of all demographic and clinical characteristics considered, the three groups only differed significantly in their drinking histories (p = 0.044, Supplementary Table 1).
As shown in Supplementary Table 2, the only significant differences in neuropsychological assessment scores for the three groups at baseline were for the CTQ-SF and Stroop A (CTQ-SF: p = 0.010; Stroop A: p = 0.046). Pairwise comparisons showed that CTQ-SF scores in the standard group were significantly lower than those in the other groups (p = 0.027, standard group vs. individualized group; p = 0.028, standard group vs. sham group), while the differences in information processing speed evaluated by the Stroop A test mainly came from the contrast between the individualized group and the sham group (p = 0.040). Comparisons of affective scale and cognitive test scores from baseline to the end of therapy showed notable improvements in the individualized group (all p < 0.05). Similarly, patients treated by standard rTMS showed significant amelioration of symptoms, as shown by changes from baseline to after treatment for most assessments, except the Neuropsychological Assessment Battery: Mazes (NAB Mazes) and Brief Visuospatial Memory Test-Revised (BVMT-R) (Supplementary Table 2).
Protein levels at baseline were comparable among the three groups, as shown in Figure 1 (CRP: F = 2.576, p = 0.083; ATIII: F = 0.802, p = 0.452; ITIH4: F = 0.341, p = 0.712; VDB: F = 0.219, p = 0.804). After individualized rTMS therapy, the levels of ATIII, ITIH4, and VDB significantly declined (t = 5.586, p < 0.001; t = 2.893, p = 0.008; t = 2.955, p = 0.007, respectively), while a downward trend with no statistical significance was observed for CRP (t = 0.503, p = 0.620) (Figure 1). Similarly, reductions in the expression of all proteins were demonstrated in the standard group when the whole treatment course was completed (CRP: t = 3.298, p = 0.003; ATIII: t = 4.523, p < 0.001; ITIH4: t = 4.589, p < 0.001; VDB: t = 3.029, p = 0.005) (Figure 1). In contrast to the rTMS treatment groups, as shown in Figure 1, the levels of proteins after five-day sham treatment were approximately equal to those at baseline (CRP: t = −0.148, p = 0.884; ATIII: t = −0.040, p = 0.968; ITIH4: t = 0.971, p = 0.342; VDB: t = −0.209, p = 0.836).
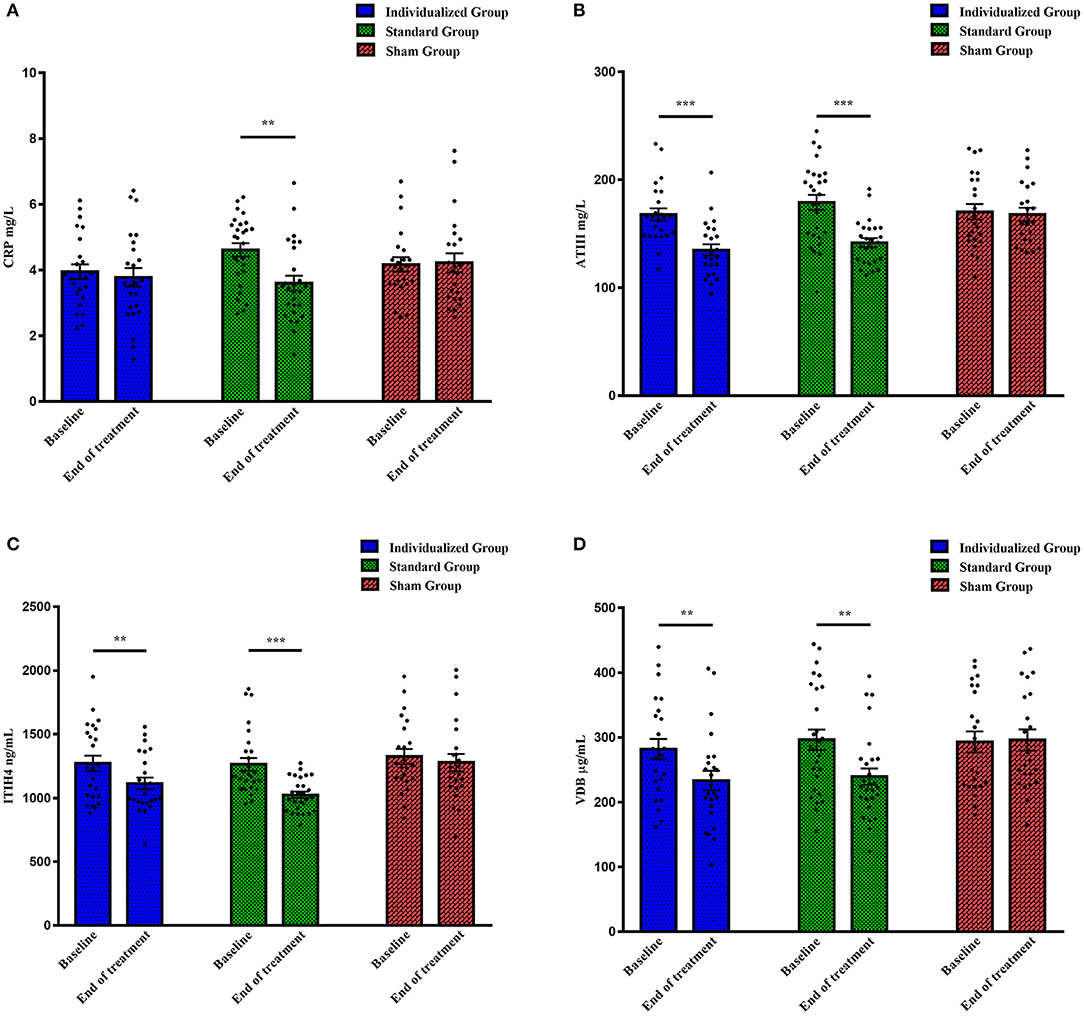
Figure 1. The levels of four proteins in different treatment groups at baseline and the end of treatment. (A) CRP levels (mg/L); (B) ATIII levels (mg/L); (C) ITIH4 levels (ng/mL); (D) VDB levels (μg/mL). CRP, C-reactive protein; ATIII, antithrombin III; ITIH4, inter-alpha-trypsin inhibitor heavy chain H4; VDB, vitamin D binding protein. **p < 0.01, ***p < 0.001.
There were significant correlations between changes in ATIII level, but not levels of the other three proteins, and antidepressive efficacy, as evaluated by changes in affective and cognitive assessments, in the individualized group. Controlling for ATIII level at baseline and the initial score, the alteration in ATIII was positively correlated with changes in several scales, including HAMD-24 (r = 0.509, p = 0.016), SDS (r = 0.536, p = 0.010), SAS (r = 0.442, p = 0.039), and BHS (r = 0.479, p = 0.024), while a negative correlation was observed for change in Stroop C (r = −0.599, p = 0.003) (Figures 2A–E). Further multiple linear regression was utilized to verify these correlations, and supported that change in ATIII could affect changes in HAMD-24 and Stroop C after individualized rTMS (standardized βHAMD−24 = 0.423, p = 0.039; standardized βStroopC = −0.471, p = 0.020).
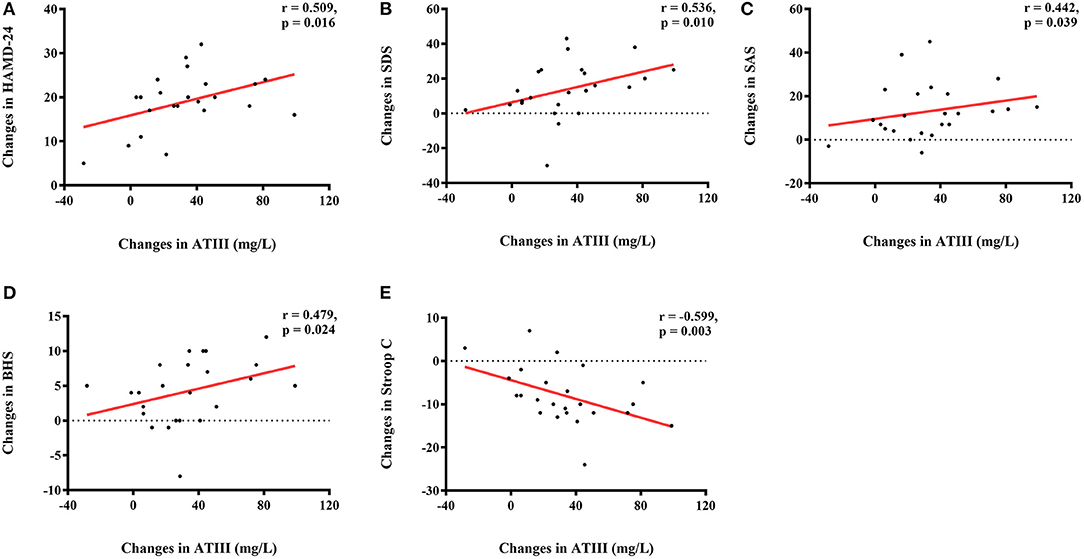
Figure 2. Correlations of altered ATIII (mg/L) and changes in neuropsychological assessments in the individualized group. (A) Positive correlation between change in ATIII level (mg/L) and change in HAMD-24; (B) Positive correlation between change in ATIII level (mg/L) and change in SDS; (C) Positive correlation between change in ATIII level (mg/L) and change in SAS; (D) Positive correlation between change in ATIII level (mg/L) and change in BHS; (E) Negative correlation between change in ATIII level (mg/L) and change in Stroop C. ATIII, antithrombin III; HAMD-24, 24-item Hamilton Depression Rating Scale; SDS, Self-Rating Depression Scale; SAS, Self-Rating Anxiety Scale; BHS, Beck Hopelessness Scale.
Further analyses revealed an interactive effect of family APGAR and alteration in ATIII on change in SAS, indicating that family APGAR and change in ATIII affected change in SAS together in the individualized group (standardized β = 0.418, p = 0.042). As shown in Figure 3, patients with greater reduction in SAS showed more notable changes in ATIII and higher family APGAR scores.
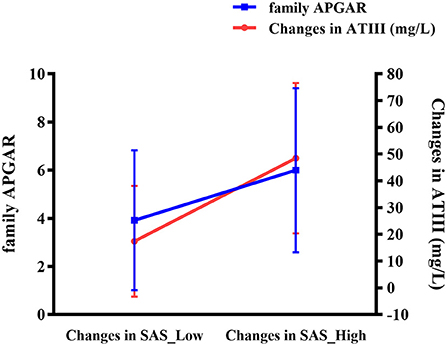
Figure 3. Interaction of altered ATIII (mg/L) and family APGAR on change in SAS in the individualized group. ATIII, antithrombin III; APGAR, Adaptation, Partnership, Growth, Affection, Resolve; SAS, Self-Rating Anxiety Scale.
Given the above-described findings, the ROC curve analysis used only ATIII rather than all four proteins. ATIII levels at two time points were analyzed for their ability to estimate or predict the response to 5 day treatment and remission at 4 week follow-up. In line with general practice, responders in this study were defined as patients with a change in HAMD-24 ≥50% and remission was evaluated by a HAMD-24 score ≤ 7.
For the individualized group, larger areas under the curve (AUCs) were observed based on the ROC curves of ATIII after rTMS therapy. There was higher specificity for identifying responders to 5 day treatment (AUC = 0.875, 95% CI, 0.714–1.000, sensitivity = 0.750, specificity = 0.938) and higher sensitivity for predicting remission 4 weeks later (AUC = 0.828, 95% CI, 0.656–1.000, sensitivity = 0.875, specificity = 0.625). Nevertheless, ROC curve analyses of ATIII at baseline showed a low predictive performance for response and remission with small AUCs (AUC = 0.547, 95% CI, 0.250–0.844, sensitivity = 0.375, specificity = 1.000; AUC = 0.688, 95% CI, 0.456–0.919, sensitivity = 0.750, specificity = 0.625, respectively) (Figure 4).
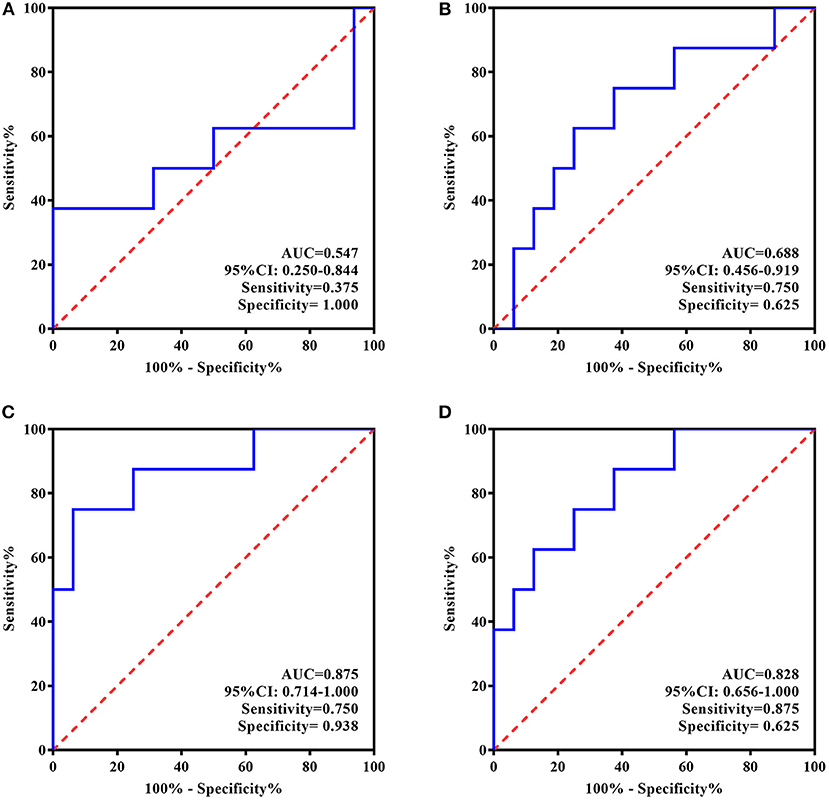
Figure 4. ROC Curve for the evaluating and predicting performance of ATIII in the individualized group. (A) ROC curve of ATIII at baseline for predicting the response to 5-day treatment; (B) ROC curve of ATIII at baseline for predicting the remission in 4 weeks following the treatment termination; (C) ROC curve of ATIII at day 5 for estimating the response to 5-day treatment; (D) ROC curve of ATIII at day 5 for predicting the remission in 4 weeks following the treatment termination. ROC curve, receiver operating characteristic curve; AUC, area under the curve; CI, confidence interval.
In contrast, according to the ROC curves presented in Figure 5, baseline ATIII in the standard treatment group showed better efficiency for predicting rTMS antidepressive effects, represented by both response and long-term remission (AUC = 0.771, 95% CI, 0.571–0.971, sensitivity = 0.588, specificity = 0.900; AUC = 0.736, 95% CI, 0.529–0.943, sensitivity = 0.643, specificity = 0.846, respectively), whereas ATIII at the end of treatment was ineffective for the same predictions (AUC = 0.507, 95% CI, 0.266–0.748, sensitivity = 0.444, specificity = 0.750; AUC = 0.538, 95% CI, 0.304–0.773, sensitivity = 0.769, specificity = 0.417, respectively).
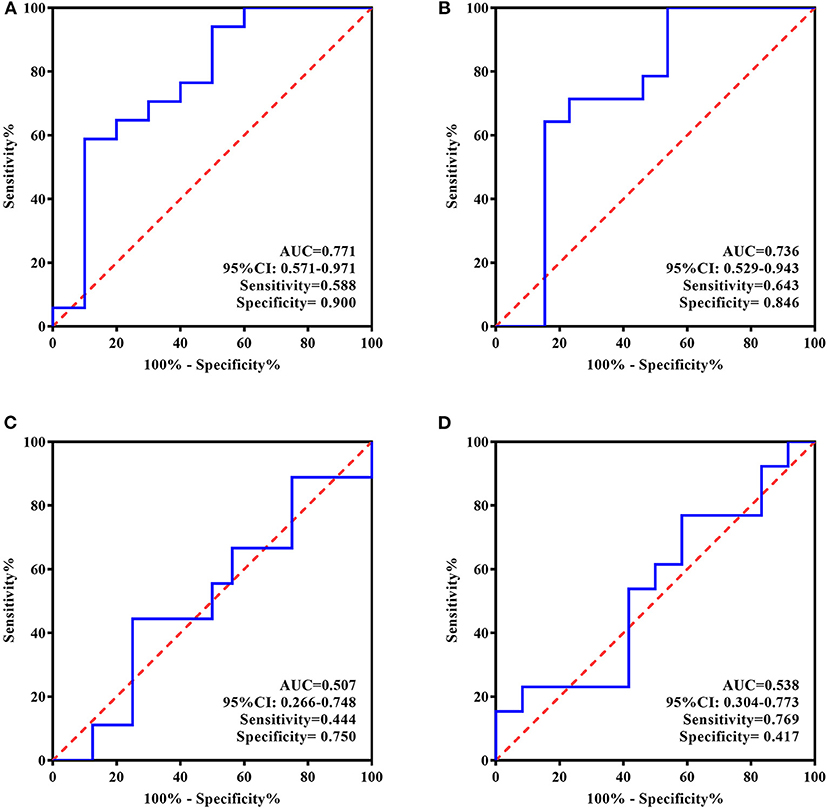
Figure 5. ROC Curve for the evaluating and predicting performance of ATIII in the standard group. (A) ROC curve of ATIII at baseline for predicting the response to 5-day treatment; (B) ROC curve of ATIII at baseline for predicting the remission in 4 weeks following the treatment termination; (C) ROC curve of ATIII at day 5 for estimating the response to 5-day treatment; (D) ROC curve of ATIII at day 5 for predicting the remission in 4 weeks following the treatment termination. ROC curve, receiver operating characteristic curve; AUC, area under the curve; CI, confidence interval.
Based on the assessments of affection at day 1, 3, and 5 (as well as additional assessments of HAMD-24 at week 1, 2, 3, 4 in the follow-up study) or cognitive tests after treatment, which were set as the curative effect indexes, multidimensional data were brought into the statistical model to estimate the potential predictive factors and their predictive values, including demographic and clinical information, days of treatment, treatment group, levels of the four proteins at baseline, and initial scores on all assessments and psychosocial scales. The value of baseline ATIII for predicting antidepressive efficacy is shown in Table 1. The antidepressive efficacy is supported by several assessments, such as HAMD-24 (p = 0.020), HAMA (p < 0.001), BSI-CV-C (p = 0.044), SDS (p < 0.001), SAS (p = 0.002), BHS (p = 0.014), Brief Assessment of Cognition in Schizophrenia: Symbol Coding (BACS SC, p = 0.002), and Stroop B (p = 0.048), while ITIH4 was only demonstrated to predict therapeutic effects represented by SAS (p = 0.044) (Supplementary Table 3). All potential predictive factors of each assessment are listed in Supplementary Table 3.
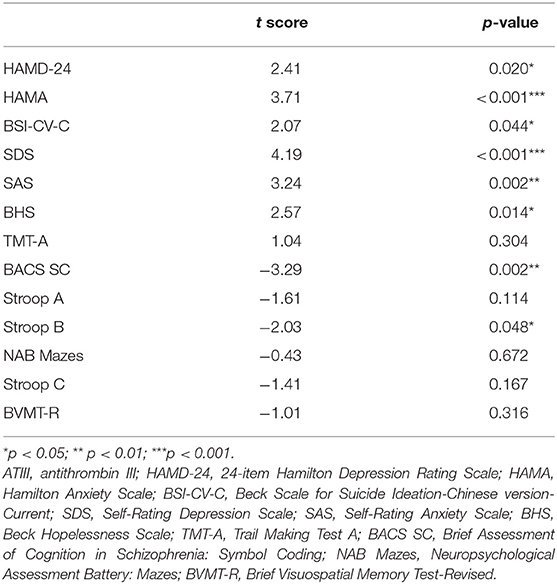
Table 1. ATIII at baseline involved in prediction of therapeutic effects.
In addition, given the impacts of altered protein levels on long-term curative efficiency evaluated by HAMD-24 at week 1, 2, 3, and 4, additional data of changes in protein expression were included in the model. As shown in Table 2, both ATIII at baseline and change in ATIII were related to HAMD-24 assessments at follow-up (p = 0.024 and 0.023, respectively), supporting their power to predict later effect.
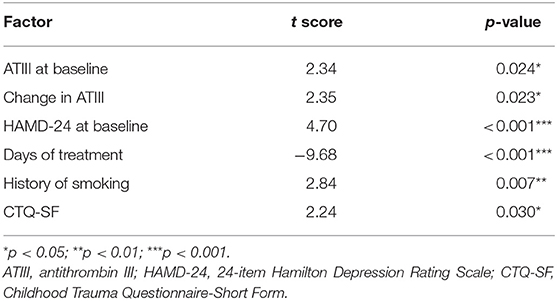
Table 2. Potential predictive factors of HAMD-24 in the follow-up study.
The present study revealed downtrends in a panel of plasma proteins, namely CRP, ATIII, ITIH4, and VDB, after 5 day occipital rTMS treatment. Moreover, significant correlations between decrease in ATIII and improvements in neuropsychological assessments comprised of HAMD-24, SDS, SAS, BHS, and Stroop C were demonstrated in patients treated by individualized rTMS. This study also illustrated the predictive performance of ATIII, whether for rTMS treatment groups or all participants, suggesting the potential of this protein for estimating and predicting antidepressive efficacy.
There was no grouping bias in the affective assessments or levels of proteins, indicating that patients treated by different methods were in depressive states of similar clinical severity and had similar protein expression profiles at the group level at baseline. At the end of treatment, levels of three proteins, namely ATIII, ITIH4, and VDB, were decreased in both rTMS groups; a statistically significant reduction in CRP was only shown in the standard rTMS treatment group. As reported by Jha et al., reduced CRP was observed after 8 week sertraline treatment in MDD patients, in line with the findings of our study (54). However, alterations in the levels of the other three proteins after antidepressive treatment have not been investigated in previous studies. Of the four proteins, no notable differences were found in the sham group between baseline and day 5, suggesting the possible relevance of these proteins to the therapeutic process of occipital rTMS. Based on mounting evidence, inflammatory response is considered the common pathway of these four candidate biomarkers (55–58), and is speculated to be a promising target of multiple non-convulsive neurostimulation interventions, including rTMS (59, 60), which might partly account for the differences in protein alterations between rTMS and sham treatment.
As a member of the family of serine protease inhibitors (serpins), ATIII originates from Serpin clade C, member 1 (SerpinC1) with a reaction center for serine protease in the conservative spatial structure (61). Apart from its major suppressive roles in coagulation and hemostasis, ATIII exerts anti-inflammation action with or without mediation of anticoagulation (36, 56). A previous study detected higher ATIII mRNA levels in both gray and white matter in patients with Alzheimer's disease compared with controls (62); specifically, increased ATIII in astrocytes was speculated to be commensurate with astrogliosis, which has also been observed in MDD (63). Berk et al. reported a supersensitive platelet response to thrombin stimulation in depressed patients (64). A recent study of remitted MDD patients found a higher procoagulant index and fibrinogen level (65), suggesting an enhanced procoagulant state and a feasible mechanism for the increased risk of cardiovascular disease in MDD patients (66). ATIII can repress thrombin-induced activation of platelets and endotheliocytes and reduce their secretions, such as interleukin-1 and P-selectin, which are demonstrated to promote interactions between endothelial cells and neutrophils to further aggravate inflammation (67, 68). As reported by Stelzhammer et al., compared to baseline levels, ATIII in MDD patients increased significantly after first ECT treatment; however, this was identified by liquid-chromatography mass spectrometry and not in combination with multiplex immunoassay (37). Our inconsistent results might be ascribed to several reasons. Firstly, only 10 patients with treatment-resistant depression were analyzed in the study by Stelzhammer et al. without expanded and independent validation. Such a low sample size might result in a false positive, as the authors speculated, and differences in race and antidepressant resistance could exacerbate inconsistencies. Moreover, increased ATIII was observed in patients treated by ECT after just once session, indicating its involvement in acute ECT effect. By contrast, in the present study, reduced ATIII levels were detected after 5 day rTMS treatment. The diverse therapeutic courses and related pathways could lead to the different protein expression profiles.
As determined in the present study, the decline in ATIII was further associated with improvement of clinical symptoms comprising depression, anxiety, hopelessness, and cognitive deficiency in the individualized group. Moreover, for the same patients, an interaction with change in SAS was demonstrated between altered ATIII and family APGAR, suggesting that family support may impact the relationship between protein levels and curative effect. On a deeper level, biological and environmental factors could interact to affect the antidepressive efficiency of occipital rTMS.
A biomarker should be useful for identifying and/or predicting response to treatment. In the present study, baseline ATIII in the standard group and decreased ATIII after individualized rTMS showed a high performance for estimating or predicting antidepressive effect, suggesting the prognostic value of ATIII at both baseline and the end of rTMS treatment. As a key factor, baseline ATIII was involved in the prediction of all emotional assessments, cognitive tests of information processing speed, and long-term efficacy evaluated by HAMD-24 at follow-up study together with changes in ATIII. Taken together, these findings demonstrate that ATIII could be a potential biomarker for curative effects in MDD treatment, regardless of the therapeutic method.
Previous proteomic research identified four proteins connected to MDD (28). In the present study, following rigorous scientific research, one of the four candidates, ATIII, was identified as a potential biomarker of both MDD diagnosis and antidepressive effect evaluation and forecasting by multi-verification. As ATIII level can be detected by a simple test, it is suitable for clinical screening. Another indicator identified in the proteomic study, VDB, was validated both in vitro and in vivo and an application has been filed for a patent. For this reason, we believe it is worthwhile to verify ATIII in a larger cohort and with further animal and cell experiments, followed by developing a convenient and efficient kit and filing a patent.
There are several limitations of this work. Firstly, this study explored biomarkers of curative efficacy based on the rapid antidepressive effects of occipital rTMS by analyzing changes in ATIII before and after rTMS treatment. As most MDD patients took medication or completed other therapies as prescribed at follow-up, homogeneity could not be maintained. In the light of this, blood samples were only collected at baseline and after 5 day rTMS stimulation. Due to the lack of blood collection at 4 week follow-up, it was not possible to assess changes in ATIII during this period or to evaluate its ability to estimate the long-term efficacy of antidepressive treatment. However, we were still able to demonstrate the predictive value of ATIII using a statistical model. Secondly, considering the importance of patient safety and need for patient cooperation, MDD patients who were suicidal or in a stuporous state were excluded. Therefore, our findings are limited to patients with moderate to severe depression without extreme negative symptoms. Thirdly, in order to eliminate interference from antidepressants and increase homogeneity, this study required patients to be drug naïve or drug free for at least 2 weeks before recruitment and reconfirmed MDD diagnosis at follow-up before statistics. In a future study, we will add rTMS stimulation along with standard medication to expand the scope of significance of ATIII. We will also carry out a non-inferiority study to compare the antidepressive effects of occipital and prefrontal rTMS in which there is no restriction related to the use of antidepressant drugs. Lastly, the small sample size could increase the risk of false-positive results; to validate the findings of this study, it is necessary to repeat this analysis in an independent cohort with a larger sample.
In conclusion, this study revealed decreases in CRP, ATIII, ITIH4, and VDB after occipital rTMS therapy. Furthermore, we revealed a relationship between greater reductions in ATIII and greater improvements in neuropsychological assessments in patients who received individualized stimulation. Ultimately, we demonstrated the potential value of ATIII as a biomarker of MDD and antidepressive treatment outcomes.
The raw data analyzed in this article are not publicly available. Requests to access the data should be directed toamFuZW1lbmd6aGFuZ0B2aXAuMTYzLmNvbQ==.
The studies involving human participants were reviewed and approved by the Ethics Committee of the Second Affiliated Hospital of Xinxiang Medical University. The patients/participants provided their written informed consent to participate in this study.
ZZ conceived and designed the study. ZZ and HoZ supervised to carry out the protocols and enrolled subjects. ZZ, HoZ, and RS characterized subjects. RS collected specimens, analyzed data, prepared the tables and figures, wrote the manuscript, and followed ZZ's guidance and they were responsible for the data interpretation. HaZ, KL, and BW were responsible for multi-mode MRI scan. XL, JZ, and YY carried out rTMS treatment. YS measured levels of CRP, ATIII, ITIH4, and VDBP. YZ established the linear mixed model. LG and YS assisted with the structure design of the manuscript. All authors contributed to the article and approved the submitted version.
The work was funded by the National Key Research and Development Plan of China (Nos. 2016YFC1306700 and 2016YFC1306704), the National Natural Science Key Foundation of China (No. 81830040), Science and Technology Program of Guangdong (No. 2018B030334001), Program of Excellent Talents in Medical Science of Jiangsu Province (No. JCRCA2016006), the Program for One Thousand Zhongyuan Talents (No. 204200510020), and NSFC-Henan Mutual Funds (U1704190).
The authors declare that the research was conducted in the absence of any commercial or financial relationships that could be construed as a potential conflict of interest.
All claims expressed in this article are solely those of the authors and do not necessarily represent those of their affiliated organizations, or those of the publisher, the editors and the reviewers. Any product that may be evaluated in this article, or claim that may be made by its manufacturer, is not guaranteed or endorsed by the publisher.
The authors would like to thank all participants in the present study for their cooperation and medical staff from the Department of Psychiatry and Radiology Department of the Second Affiliated Hospital of Xinxiang Medical University for their assistance in this work.
The Supplementary Material for this article can be found online at: https://www.frontiersin.org/articles/10.3389/fpsyt.2021.678384/full#supplementary-material
1. GBD 2017 Disease and Injury Incidence and Prevalence Collaborators. Global, regional, and national incidence, prevalence, and years lived with disability for 354 diseases and injuries for 195 countries and territories, 1990-2017: a systematic analysis for the Global Burden of Disease Study 2017. Lancet. (2018) 392:1789–858. doi: 10.1016/S0140-6736(18)32279-7
2. WHO. Depression and Other Common Mental Disorders: Global Health Estimates. Geneva: World Health Organization (2017).
5. Zwicker A, Denovan-Wright EM, Uher R. Gene-environment interplay in the etiology of psychosis. Psychol Med. (2018) 48:1925–36. doi: 10.1017/S003329171700383X
6. Nemeroff CB. Paradise Lost: the neurobiological and clinical consequences of child abuse and neglect. Neuron. (2016) 89:892–909. doi: 10.1016/j.neuron.2016.01.019
7. Jesulola E, Micalos P, Baguley IJ. Understanding the pathophysiology of depression: from monoamines to the neurogenesis hypothesis model - are we there yet? Behav Brain Res. (2018) 341:79–90. doi: 10.1016/j.bbr.2017.12.025
8. Dowlati Y, Herrmann N, Swardfager W, Liu H, Sham L, Reim EK, et al. A meta-analysis of cytokines in major depression. Biol Psychiatry. (2010) 67:446–57. doi: 10.1016/j.biopsych.2009.09.033
9. Eyre HA, Air T, Pradhan A, Johnston J, Lavretsky H, Stuart MJ, et al. A meta-analysis of chemokines in major depression. Prog Neuro Psychopharmacol Biol Psychiatry. (2016) 68:1–8. doi: 10.1016/j.pnpbp.2016.02.006
10. Troubat R, Barone P, Leman S, Desmidt T, Cressant A, Atanasova B, et al. Neuroinflammation and depression: a review. Eur J Neurosci. (2020) 53:151–171. doi: 10.1111/ejn.14720
11. Wang Q, Jie W, Liu JH, Yang JM, Gao TM. An astroglial basis of major depressive disorder? An overview. Glia. (2017) 65:1227–50. doi: 10.1002/glia.23143
12. Czeh B, Nagy SA. Clinical findings documenting cellular and molecular abnormalities of glia in depressive disorders. Front Mol Neurosci. (2018) 11:56. doi: 10.3389/fnmol.2018.00056
13. Frank MG, Fonken LK, Watkins LR, Maier SF. Microglia: neuroimmune-sensors of stress. Semin Cell Dev Biol. (2019) 94:176–85. doi: 10.1016/j.semcdb.2019.01.001
14. Llorens-Martin M, Jurado-Arjona J, Fuster-Matanzo A, Hernandez F, Rabano A, Avila J. Peripherally triggered and GSK-3beta-driven brain inflammation differentially skew adult hippocampal neurogenesis, behavioral pattern separation and microglial activation in response to ibuprofen. Transl Psychiatry. (2014) 4:e463. doi: 10.1038/tp.2014.92
15. Cai B, Seong KJ, Bae SW, Kook MS, Chun C, Lee JH, et al. Water-soluble arginyl-diosgenin analog attenuates hippocampal neurogenesis impairment through blocking microglial activation underlying NF-κB and JNK MAPK signaling in adult mice challenged by LPS. Mol Neurobiol. (2019) 56:6218–38. doi: 10.1007/s12035-019-1496-3
16. Zheng LS, Hitoshi S, Kaneko N, Takao K, Miyakawa T, Tanaka Y, et al. Mechanisms for interferon-alpha-induced depression and neural stem cell dysfunction. Stem Cell Rep. (2014) 3:73–84. doi: 10.1016/j.stemcr.2014.05.015
17. Wong ML, Inserra A, Lewis MD, Mastronardi CA, Leong L, Choo J, et al. Inflammasome signaling affects anxiety- and depressive-like behavior and gut microbiome composition. Mol Psychiatry. (2016) 21:797–805. doi: 10.1038/mp.2016.46
18. Schmidt FM, Kirkby KC, Lichtblau N. Inflammation and immune regulation as potential drug targets in antidepressant treatment. Curr Neuropharmacol. (2016) 14:674–87. doi: 10.2174/1570159X14666160115130414
19. Jha MK, Trivedi MH. Personalized antidepressant selection and pathway to novel treatments: clinical utility of targeting inflammation. Int J Mol Sci. (2018) 19:233. doi: 10.3390/ijms19010233
20. Battle DE. Diagnostic and Statistical Manual of mental disorders (DSM). CoDAS. (2013) 25:191–2. doi: 10.1590/s2317-17822013000200017
21. WHO. The ICD-10 Classification of Mental and Behavioural Disorders. Geneva: World Health Organization (1992).
22. Xu Z, Xie C, Xia L, Yuan Y, Zhu H, Huang X, et al. Targeted exome sequencing identifies five novel loci at genome-wide significance for modulating antidepressant response in patients with major depressive disorder. Transl Psychiatry. (2020) 10:30. doi: 10.1038/s41398-020-0689-x
23. Shi Y, Song R, Wang Z, Zhang H, Zhu J, Yue Y, et al. Potential clinical value of circular RNAs as peripheral biomarkers for the diagnosis and treatment of major depressive disorder. EBioMedicine. (2021) 66:103337. doi: 10.1016/j.ebiom.2021.103337
24. Comes AL, Papiol S, Mueller T, Geyer PE, Mann M, Schulze TG. Proteomics for blood biomarker exploration of severe mental illness: pitfalls of the past and potential for the future. Transl Psychiatry. (2018) 8:160. doi: 10.1038/s41398-018-0219-2
25. Pan JX, Xia JJ, Deng FL, Liang WW, Wu J, Yin BM, et al. Diagnosis of major depressive disorder based on changes in multiple plasma neurotransmitters: a targeted metabolomics study. Transl Psychiatry. (2018) 8:130. doi: 10.1038/s41398-018-0183-x
26. Voineskos AN, Mulsant BH, Dickie EW, Neufeld NH, Rothschild AJ, Whyte EM, et al. Effects of antipsychotic medication on brain structure in patients with major depressive disorder and psychotic features: neuroimaging findings in the context of a randomized placebo-controlled clinical trial. JAMA Psychiatry. (2020) 77:674–683. doi: 10.1001/jamapsychiatry.2020.0036
27. Rolle CE, Fonzo GA, Wu W, Toll R, Jha MK, Cooper C, et al. Cortical connectivity moderators of antidepressant vs placebo treatment response in major depressive disorder: secondary analysis of a randomized clinical trial. JAMA Psychiatry. (2020) 77:397–408. doi: 10.1001/jamapsychiatry.2019.3867
28. Shi Y, Song R, Wang L, Qi Y, Zhang H, Zhu J, et al. Identifying plasma biomarkers with high specificity for major depressive disorder: a multi-level proteomics study. J Affect Disord. (2020) 277:620–30. doi: 10.1016/j.jad.2020.08.078
29. Chang HH, Wang TY, Lee IH, Lee SY, Chen KC, Huang SY, et al. C-reactive protein: a differential biomarker for major depressive disorder and bipolar II disorder. World J Biol Psychiatry. (2017) 18:63–70. doi: 10.3109/15622975.2016.1155746
30. Felger JC, Haroon E, Miller AH. What's CRP got to do with it? Tackling the complexities of the relationship between CRP and depression. Brain Behav Immunity. (2018) 73:163–64. doi: 10.1016/j.bbi.2018.08.003
31. Haapakoski R, Mathieu J, Ebmeier KP, Alenius H, Kivimäki M. Cumulative meta-analysis of interleukins 6 and 1β, tumour necrosis factor α and C-reactive protein in patients with major depressive disorder. Brain Behav Immunity. (2015) 49:206–15. doi: 10.1016/j.bbi.2015.06.001
32. Vogelzangs N, Beekman AT, van Reedt Dortland AK, Schoevers RA, Giltay EJ, de Jonge P, et al. Inflammatory and metabolic dysregulation and the 2-year course of depressive disorders in antidepressant users. Neuropsychopharmacology. (2014) 39:1624–34. doi: 10.1038/npp.2014.9
33. Wium-Andersen MK, Ørsted DD, Nielsen SF, Nordestgaard BG. Elevated C-reactive protein levels, psychological distress, and depression in 73, 131 individuals. JAMA Psychiatry. (2013) 70:176–84. doi: 10.1001/2013.jamapsychiatry.102
34. Strawbridge R, Arnone D, Danese A, Papadopoulos A, Herane Vives A, Cleare AJ. Inflammation and clinical response to treatment in depression: a meta-analysis. Eur Neuropsychopharmacol. (2015) 25:1532–43. doi: 10.1016/j.euroneuro.2015.06.007
35. Kim BR, Oh J, Yu KS, Ryu HG. Pharmacokinetics of human antithrombin III concentrate in the immediate postoperative period after liver transplantation. Br J Clin Pharmacol. (2019) 86:923–932. doi: 10.1111/bcp.14200
36. Levy JH, Sniecinski RM, Welsby IJ, Levi M. Antithrombin: anti-inflammatory properties and clinical applications. Thromb Haemost. (2016) 115:712–28. doi: 10.1160/TH15-08-0687
37. Stelzhammer V, Guest PC, Rothermundt M, Sondermann C, Michael N, Schwarz E, et al. Electroconvulsive therapy exerts mainly acute molecular changes in serum of major depressive disorder patients. Eur Neuropsychopharmacol. (2013) 23:1199–207. doi: 10.1016/j.euroneuro.2012.10.012
38. Piñeiro M, Andrés M, Iturralde M, Carmona S, Hirvonen J, Pyörälä P, et al. ITIH4 (inter-alpha-trypsin inhibitor heavy chain 4) is a new acute-phase protein isolated from cattle during experimental infection. Infect Immunity. (2004) 72:3777–82. doi: 10.1128/IAI.72.7.3777-3782.2004
39. Shi X, Ohta Y, Liu X, Shang J, Morihara R, Nakano Y, et al. Acute anti-inflammatory markers ITIH4 and AHSG in mice brain of a novel Alzheimer's disease model. J Alzheimer's Dis. (2019) 68:1667–75. doi: 10.3233/JAD-181218
40. Psychiatric GWAS Consortium Bipolar Disorder Working Group. Large-scale genome-wide association analysis of bipolar disorder identifies a new susceptibility locus near ODZ4. Nat Genet. (2011) 43:977–83. doi: 10.1038/ng.943
41. Finseth PI, Sønderby IE, Djurovic S, Agartz I, Malt UF, Melle I, et al. Association analysis between suicidal behaviour and candidate genes of bipolar disorder and schizophrenia. J Affect Disord. (2014) 163:110–4. doi: 10.1016/j.jad.2013.12.018
42. Lisowska-Myjak B, Józwiak-Kisielewska A, Łukaszkiewicz J, Skarzyńska E. Vitamin D-binding protein as a biomarker to confirm specific clinical diagnoses. Expert Rev Mol Diagn. (2020) 20:49–56. doi: 10.1080/14737159.2020.1699064
43. Speeckaert M, Huang G, Delanghe JR, Taes YE. Biological and clinical aspects of the vitamin D binding protein (Gc-globulin) and its polymorphism. Clin Chim Acta. (2006) 372:33–42. doi: 10.1016/j.cca.2006.03.011
44. White P, Cooke N. The multifunctional properties and characteristics of vitamin D-binding protein. Trends Endocrinol Metab. (2000) 11:320–7. doi: 10.1016/S1043-2760(00)00317-9
45. Petrov B, Aldoori A, James C, Yang K, Algorta GP, Lee A, et al. Bipolar disorder in youth is associated with increased levels of vitamin D-binding protein. Transl Psychiatry. (2018) 8:61. doi: 10.1038/s41398-018-0109-7
46. Xu HB, Zhang RF, Luo D, Zhou Y, Wang Y, Fang L, et al. Comparative proteomic analysis of plasma from major depressive patients: identification of proteins associated with lipid metabolism and immunoregulation. Int J Neuropsychopharmacol. (2012) 15:1413–25. doi: 10.1017/S1461145712000302
47. Lee MY, Kim EY, Kim SH, Cho KC, Ha K, Kim KP, et al. Discovery of serum protein biomarkers in drug-free patients with major depressive disorder. Prog Neuro Psychopharmacol Biol Psychiatry. (2016) 69:60–8. doi: 10.1016/j.pnpbp.2016.04.009
48. Zhang Z, Zhang H, Xie CM, Zhang M, Shi Y, Song R, et al. Task-related functional magnetic resonance imaging-based neuronavigation for the treatment of depression by individualized repetitive transcranial magnetic stimulation of the visual cortex. Sci China Life Sci. (2020) 64:96–106. doi: 10.1007/s11427-020-1730-5
49. Normann C, Schmitz D, Fürmaier A, Döing C, Bach M. Long-term plasticity of visually evoked potentials in humans is altered in major depression. Biological psychiatry. (2007) 62:373–80. doi: 10.1016/j.biopsych.2006.10.006
50. Maciag D, Hughes J, O'Dwyer G, Pride Y, Stockmeier CA, Sanacora G, et al. Reduced density of calbindin immunoreactive GABAergic neurons in the occipital cortex in major depression: relevance to neuroimaging studies. Biol Psychiatry. (2010) 67:465–70. doi: 10.1016/j.biopsych.2009.10.027
51. Friberg TR, Borrero G. Diminished perception of ambient light: a symptom of clinical depression? J Affect Disord. (2000) 61:113–8. doi: 10.1016/S0165-0327(99)00194-9
52. Furey ML, Drevets WC, Hoffman EM, Frankel E, Speer AM, Zarate CA Jr. Potential of pretreatment neural activity in the visual cortex during emotional processing to predict treatment response to scopolamine in major depressive disorder. JAMA Psychiatry. (2013) 70:280–90. doi: 10.1001/2013.jamapsychiatry.60
53. Song R, Bai Y, Li X, Zhu J, Zhang H, Shi Y, et al. Plasma circular RNA DYM related to major depressive disorder and rapid antidepressant effect treated by visual cortical repetitive transcranial magnetic stimulation. J Affect Disord. (2020) 274:486–93. doi: 10.1016/j.jad.2020.05.109
54. Jha MK, Minhajuddin A, Chin-Fatt C, Greer TL, Carmody TJ, Trivedi MH. Sex differences in the association of baseline c-reactive protein (CRP) and acute-phase treatment outcomes in major depressive disorder: findings from the EMBARC study. J Psychiatric Res. (2019) 113:165–71. doi: 10.1016/j.jpsychires.2019.03.013
55. Osimo EF, Pillinger T, Rodriguez IM, Khandaker GM, Pariante CM, Howes OD. Inflammatory markers in depression: a meta-analysis of mean differences and variability in 5,166 patients and 5,083 controls. Brain Behav Immunity. (2020) 87:901–909. doi: 10.1016/j.bbi.2020.02.010
56. Lu Z, Wang F, Liang M. SerpinC1/Antithrombin III in kidney-related diseases. Clin Sci. (2017) 131:823–31. doi: 10.1042/CS20160669
57. Li L, Choi BC, Ryoo JE, Song SJ, Pei CZ, Lee KY, et al. Opposing roles of inter-α-trypsin inhibitor heavy chain 4 in recurrent pregnancy loss. EBioMedicine. (2018) 37:535–46. doi: 10.1016/j.ebiom.2018.10.029
58. Aksan A, Tugal D, Hein N, Boettger K, Caicedo-Zea Y, Diehl I, et al. Measuring vitamin D status in chronic inflammatory disorders: how does chronic inflammation affect the reliability of vitamin d metabolites in patients with IBD? J Clin Med. (2020) 9:547. doi: 10.3390/jcm9020547
59. Perrin AJ, Pariante CM. Endocrine and immune effects of non-convulsive neurostimulation in depression: a systematic review. Brain Behav Immunity. (2020) 87:910–920. doi: 10.1016/j.bbi.2020.02.016
60. Sasso V, Bisicchia E, Latini L, Ghiglieri V, Cacace F, Carola V, et al. Repetitive transcranial magnetic stimulation reduces remote apoptotic cell death and inflammation after focal brain injury. J Neuroinflamm. (2016) 13:150. doi: 10.1186/s12974-016-0616-5
61. Heit C, Jackson BC, McAndrews M, Wright MW, Thompson DC, Silverman GA, et al. Update of the human and mouse SERPIN gene superfamily. Hum Genomics. (2013) 7:22. doi: 10.1186/1479-7364-7-22
62. Kalaria RN, Golde T, Kroon SN, Perry G. Serine protease inhibitor antithrombin III and its messenger RNA in the pathogenesis of Alzheimer's disease. Am J Pathol. (1993) 143:886–93.
63. Han KM, Tae WS, Kim A, Kang Y, Kang W, Kang J, et al. Serum FAM19A5 levels: a novel biomarker for neuroinflammation and neurodegeneration in major depressive disorder. Brain Behav Immunity. (2020) 87:852–859. doi: 10.1016/j.bbi.2020.03.021
64. Berk M, Plein H. Platelet supersensitivity to thrombin stimulation in depression: a possible mechanism for the association with cardiovascular mortality. Clin Neuropharmacol. (2000) 23:182–5. doi: 10.1097/00002826-200007000-00002
65. von Känel R, Merz F, Pfister H, Brückl T, Zimmermann P, Uhr M, et al. Evidence for an enhanced procoagulant state in remitted major depression. World J Biol Psychiatry. (2019) 21:766–74. doi: 10.1080/15622975.2019.1696475
66. Charlson FJ, Moran AE, Freedman G, Norman RE, Stapelberg NJ, Baxter AJ, et al. The contribution of major depression to the global burden of ischemic heart disease: a comparative risk assessment. BMC Med. (2013) 11:250. doi: 10.1186/1741-7015-11-250
67. Falati S, Liu Q, Gross P, Merrill-Skoloff G, Chou J, Vandendries E, et al. Accumulation of tissue factor into developing thrombi in vivo is dependent upon microparticle P-selectin glycoprotein ligand 1 and platelet P-selectin. J Exp Med. (2003) 197:1585–98. doi: 10.1084/jem.20021868
Keywords: major depressive disorder, antithrombin III, occipital repetitive transcranial magnetic stimulation, antidepressive effect, biomarker
Citation: Song R, Shi Y, Li X, Zhu J, Zhang H, Li K, Wang B, Zhang H, Yang Y, Gao L, Zhao Y and Zhang Z (2021) Potential of Antithrombin III as a Biomarker of Antidepressive Effect in Major Depressive Disorder. Front. Psychiatry 12:678384. doi: 10.3389/fpsyt.2021.678384
Received: 09 March 2021; Accepted: 20 September 2021;
Published: 28 October 2021.
Edited by:
Danilo Arnone, United Arab Emirates University, United Arab EmiratesReviewed by:
Jijun Wang, Shanghai Jiao Tong University, ChinaCopyright © 2021 Song, Shi, Li, Zhu, Zhang, Li, Wang, Zhang, Yang, Gao, Zhao and Zhang. This is an open-access article distributed under the terms of the Creative Commons Attribution License (CC BY). The use, distribution or reproduction in other forums is permitted, provided the original author(s) and the copyright owner(s) are credited and that the original publication in this journal is cited, in accordance with accepted academic practice. No use, distribution or reproduction is permitted which does not comply with these terms.
*Correspondence: Zhijun Zhang, amFuZW1lbmd6aGFuZ0B2aXAuMTYzLmNvbQ==; Yang Zhao, eXpoYW9AbmptdS5lZHUuY24=
†These authors have contributed equally to this work and share first authorship
Disclaimer: All claims expressed in this article are solely those of the authors and do not necessarily represent those of their affiliated organizations, or those of the publisher, the editors and the reviewers. Any product that may be evaluated in this article or claim that may be made by its manufacturer is not guaranteed or endorsed by the publisher.
Research integrity at Frontiers
Learn more about the work of our research integrity team to safeguard the quality of each article we publish.