 Silke Bachmann
 Michaela Beck3
94% of researchers rate our articles as excellent or good
Learn more about the work of our research integrity team to safeguard the quality of each article we publish.
Find out more
ORIGINAL RESEARCH article
Front. Psychiatry, 24 June 2021
Sec. Aging Psychiatry
Volume 12 - 2021 | https://doi.org/10.3389/fpsyt.2021.670539
Neurological soft signs (NSS) represent minor neurological features and have been widely studied in psychiatric disease. The assessment is easily performed. Quantity and quality may provide useful information concerning the disease course. Mostly, NSS scores differ significantly between patients and controls. However, literature does not give reference values. In this pilot study, we recruited 120 healthy women and men to build a cross-sectional, census-based sample of healthy individuals, aged 20 to >70 years, subdivided in 10-year blocks for a close approach to the human lifeline. Testing for NSS and neurocognitive functioning was performed following the exclusion of mental and severe physical illness. NSS scores increased significantly between ages 50+ and 60+, which was primarily accountable to motor signs. Gender and cognitive functioning were not related to changes of scores. Although the number of individuals is small, study results may lay a foundation for further validation of NSS in healthy individuals.
The term neurological soft signs (NSS) refers to subtle and distinctive neurological abnormalities which are not as obvious as hard, i.e., localized, pathology, such as nuclear or primary tract lesion (1–3). Nevertheless, they reflect deficits in sensory integration, motor coordination, sequencing of complex motor acts, and others. Thus, and in combination with the relatively effortless assessment, NSS have been established in psychiatry as a meaningful tool to differentiate for example disease entities, course types, and degrees of chronicity. Recently, the motor domain of NSS in psychiatric illness in general has attracted increasing attention (4–8).
Psychiatrists and researchers have been interested in NSS at least for the past four decades (9). The highest scores of NSS were found in schizophrenia patients (10), both quantitatively and qualitatively (11). NSS in the pathological range were also detected in a variety of patients with—among others—mood (12), obsessive–compulsive (13), and personality disorders (14). Nevertheless, individuals who suffer from schizophrenia have been studied most often. Researchers found that NSS are rather not related to medication (10, 15–19), since they are present in first-episode patients (10, 20–28) as well as in individuals at risk and in relatives (29–33). Moreover, NSS are associated with negative symptoms, formal thought disorders, and cognitive symptoms in general (4, 17, 26, 34–41), as well as with fluctuations of psychopathology over time (20, 25, 26, 42, 43).
It is well-established that NSS can be found in healthy subjects as well, numbers range from 0 to 54% (11, 16, 44–55). This is an unusually wide range suggesting a significant heterogeneity regarding methodological issues at the level of defining and assessing NSS but also at the level of study sample recruitment and doubtlessly the presence of NSS. Concerning recruitment, information often is missing with respect to paternal age, malnutrition or infections during pregnancy, complications during pregnancy and delivery, and the complete family history, i.e., presence of psychiatric disease—all of which constitute risk or causal factors for the development of NSS.
NSS are not dichotomously distributed, but their presence seems to depict a continuum between healthy individuals and psychiatric patients. This has been shown by studies on schizophrenia patients' relatives, whose scores take an intermediate position between healthy and schizophrenia subjects, e.g. (31), again depending on quantity (number of signs) and quality (markedness) of the signs. Along these lines, in a systematic review and meta-analysis, Neelam and Marshall (56) confirmed that schizophrenia patients scored higher on NSS than relatives whose scores again ranged higher than those of unrelated healthy controls.
However, evidence concerning the presence of NSS in healthy individuals is mostly based on the assessment of matched control subjects in studies on psychiatric patients, i.e., healthy subjects have hardly been looked at independently and systematically in different age groups, according to gender, and according to stability over time, while approximations might be drawn from studies such as that of Chan et al. (57).
In the present study, we thus addressed the old but still prevalent critique that instruments for NSS assessment lack normative data (58) by presenting a preliminary set of NSS scores from an adult population sample applying the Heidelberg NSS scale (H-NSS) (59, 60) to different age groups. These data may provide a first step toward the establishment of NSS norm values.
Apart from providing a useful tool in clinical contexts, NSS have added up to modeling cerebral networks involved in schizophrenia. The dysfunctional networks and related brain areas associated with the pathogenesis of NSS have not been fully identified yet. Neuroimaging studies suggest a link to activation changes in the sensorimotor cortex and the supplementary motor area, cerebellar abnormalities, and subcortical findings involving the basal ganglia and thalamus (22, 27, 28, 35, 61–63). These findings are substantiated by the “cognitive dysmetria” hypothesis by Andreasen, based on the so-called cortico-cerebellar-thalamic-cortical circuitry (64). The latter has widely been used to explain the manifold symptoms of schizophrenia and to integrate motor and cognitive symptoms.
This study set out to establish reference values of a representative, cross-sectional, census-based sample of healthy individuals, ages 20 to >70 years, subdivided in 10-year blocks for a close approach to the human lifeline. A longitudinal study would have been the most adequate design, but our resources did not allow following a large group over four or five decades. Children and teenagers were excluded because they naturally exhibit higher NSS scores due to ongoing brain maturation which comes to a standstill around the age of 20, when they mostly disappear and reach their best, i.e., lowest, values (65, 66). Brain changes with increasing age have been described and concern, e.g., whole-brain volume (WBV), white matter (WM) integrity, metabolism, and cognitive functioning (67–70). We thus hypothesized that NSS become more prominent with age, in terms of quantity and quality, and in line with the normal aging processes. Neurocognitive tests were included using tests with high-quality criteria and age-related norms to (a) provide a solid matrix against which to contrast NSS results and to (b) compare information on brain circuits provided by both approaches and to possibly obtain a clearer picture. Moreover, correlations between NSS and cognitive functioning are well-established (11, 71–73).
During childhood and adolescence, NSS represent correlates of the developing brain. Probands thus had to be 20 years of age or older. Men and women, separately, from the normal population in Halle (Saale) were recruited via advertisements. Selection was performed according to the German census with respect to gender and education. A fixed-ratio schedule was used, including six age-specific groups (20–29, 30–39, 40–49, 50–59, 60–69, and >70 years). Age being the variable of interest, no age limit was set for the higher age groups. Representing the differences in life expectancy, 11 women and 9 men were recruited into the group >70 years, whereas equal numbers of men and women were included into all other groups. Probands' educational status was matched to the respective decade of the general German population according to the census data of 2008 (74). Recruitment was performed during the years 2009 and 2010.
Originally, we had aimed at including 180 adults (75). The intended cell size of 15 individuals per age decade and gender was not reached due to recruitment problems. The size had to be narrowed to n = 10 per cell. Likewise, the intended sample size had to be narrowed from 180 to 120 individuals.
Subjects had to be healthy and 20 years or older without upper age limit because age was the independent variable. The Structured Clinical Interview for DSM-IV Axis I (SCID-I, German version) (76) screening questionnaire was used to establish mental health; physical health and medication were assessed by a semi-structured interview. Exclusion criteria were any current or former psychiatric or severe somatic illness, any medication which acts on the central nervous system, refusal to participate in the study, or withdrawal of consent.
All probands underwent semi-structured interviewing to exclude lifetime serious physical, especially neurological, disease, regular intake of psychopharmacological medication, and psychiatric disorders by applying the SCID screening interview.
NSS were assessed with the Heidelberg NSS scale (H-NSS) (59, 60), which consists of 16 items, most of which (namely, 11 items) are rated separately for both the right and left sides, which is not the case for the items gait, tandem gait, Ozeretzki's test, articulation, and right/left orientation. The items are grouped into five factor subscales: motor coordination (items: Ozeretzki's test, diadochokinesis, pronation/supination, finger–thumb opposition, and articulation); sensory integration (items: gait, tandem gait, and 2-point discrimination); complex motor signs (items: finger-to-nose-test, fist–edge–palm test); right–left and spatial orientation (items: right/left orientation, graphesthesia, face–hand sensory test, and stereognosis); and hard signs (items: arm-holding test and mirror movements). Each single soft sign is rated on a 0–3-point scale (no/slight/moderate/marked abnormality, respectively), leading to scores between 0 (minimum) and 81 (maximum). On construction, the H-NSS yielded good internal reliability (Cronbach's alpha = 0.89 for healthy subjects) as well as interrater reliability (r = 0.88, p < 0.005) (59). Prior to this study, two raters (F.H. and M.B.) were trained together until they reached high interrater reliability. The training was performed by an experienced rater (S.B.).
The NSS assessment was complemented by an establishment of handedness via the Edinburgh Inventory (77). A laterality quotient was calculated that ranges from −100 (strong left hander) to +100 (strong right hander) from the rating of 10 common activities (e.g., please demonstrate how you throw a ball). We applied narrow definitions of right-handedness (laterality quotient of +80) and left-handedness (laterality quotient −80 or less); the remaining range represented mixed-handedness. Complementary questions concerned regular practice of music and left-handers in the family.
Intelligence was measured by applying the “Mehrfachwahl-Wortschatz-Test” (MWT-B; a German language-based verbal intelligence test) (78), which assesses the general, crystallized intelligence quotient (IQ) by testing recognition of vocabulary (37 items of increasing difficulty).
Well-known neurocognitive tests with good psychometric properties were administered; see Table 1.
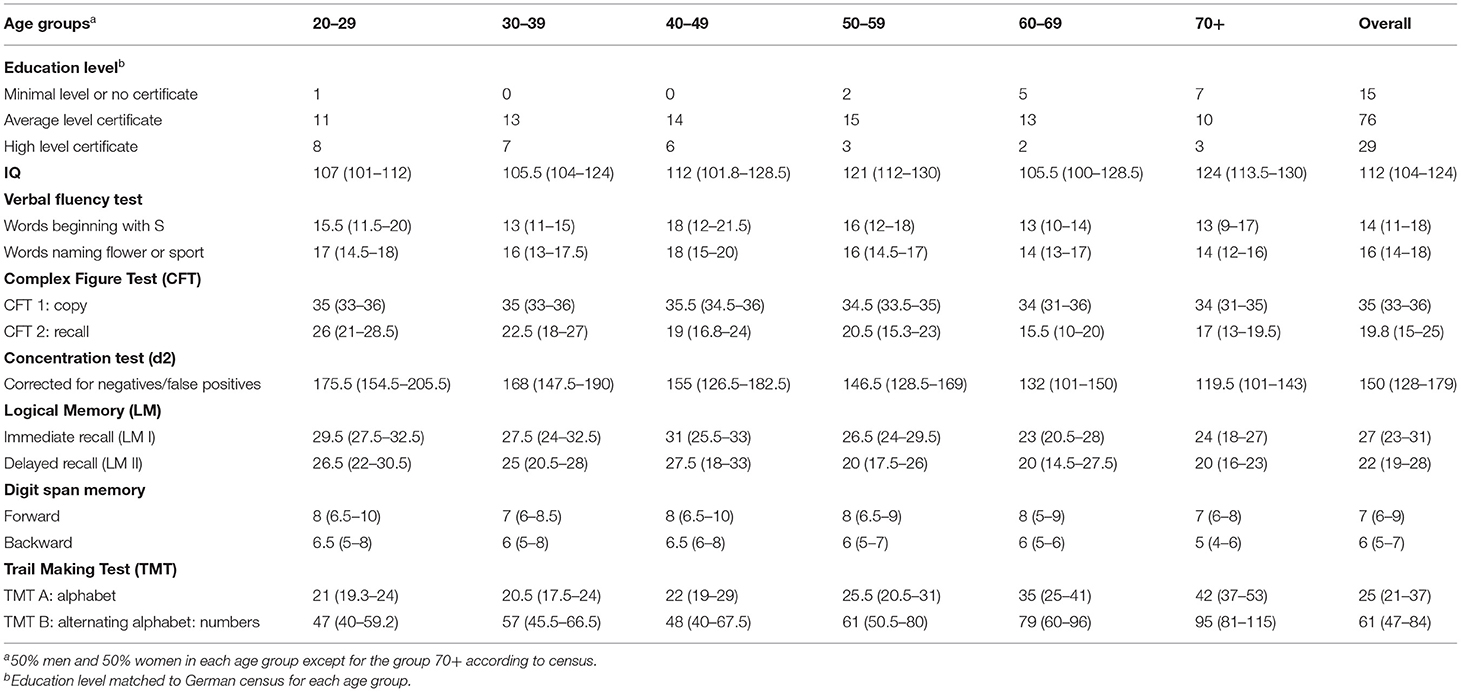
Table 1. Demographic characteristics of healthy subjects (n = 120), descriptive data, in count or in median (Q1–Q3).
The Rey Osterieth complex figure test (CFT) (79), according to Strauss et al. (80), asks probands to copy a complex figure (copy trial, CFT I) and to redraw this figure from memory after about 30 min (delayed recall, CFT II). Hereby, memory (encoding, storage, and retrieval) as well as visuospatial abilities (recall, recognition, and construction) are being tested. CFT results are most likely linked to the cerebellum and its functioning (81).
The tests “Logisches Gedächtnis I/II” (LG, logical memory) are subtests taken from the German adaptation of the Wechsler Memory Scale, revised version (WMS-R) (82). Both subtests are based on two stories which are read to the proband once (twice in older subjects). Logical, episodic, and long-term memories are assessed via immediate free reproduction of the stories (immediate recall, logical memory I) as well as free reproduction after about 30 min (delayed recall, logical memory II), the latter being followed by complementary, closed questions concerning details (yes/no; recognition).
The digit span memory test is also taken from the WMS-R. Two to nine numbers have to be repeated either forward or in reverse order. According to PET studies (83, 84), both the logical memory (LG) test and the symbol digit modalities test (DSMT) (85), which partially resembles the digit span memory test, give information regarding prefrontal and cerebellar functioning.
The d2 test depicts concentration in terms of selective and sustained attention with visual search function and processing speed influencing the result (86). Several rows of “d” and “p” with one to two lines below and/or one to two lines above the letter are presented. The proband is instructed to mark all “d”s with two lines. Concentration ability is calculated from correct and false-positive as well as true-negative answers.
Trail-Making Tests A and B (TMT-A and TMT-B, respectively) (87) measure visual search function, attentiveness, speed, and mental flexibility. Whereas, TMT-A asks to link numbers, TMT-B requests to shift between numbers and letters. Both subtests represent a measure of frontal activity.
Verbal fluency was studied via the most commonly used subtests of the German “Regensburger Wortflüssigkeitstest” (RWT) (88). Probands are asked to name as many words as possible which start with an S, followed by naming words which start with an M in a given time (formal lexicon), as many animals and as many sports and plants while switching between the latter (semantics). Hereby, divergent thinking and cognitive flexibility are assessed, which are associated with frontal areas. For feasibility reasons, we limited testing to the S-words and to the switch between sports and plants.
In sum, general explanations, written informed consent, assessment of demographic data and health status, and testing time amounted to a total of 90–100 min per person. Resting periods were allowed according to individual needs. The study was performed in accordance with the Declaration of Helsinki (89).
According to our hypothesis, NSS become more prominent with age, in terms of both quantity and quality; age was defined as the independent variable, and NSS total score as the dependent variable. Gender, educational level, and IQ were confounding factors. Linear regression models were used to test for associations between NSS total score and age by adjusting for gender and IQ.
Differences in NSS scores with respect to age groups were detected with Kruskal–Wallis tests, and if present post-hoc Dunn's tests were carried out to identify which groups differed from one another. Spearman correlations were performed for NSS total score vs. IQ, handedness, and the results of cognitive testing.
The initial study recruitment aimed at including 180 adults, in order to estimate errors for six age groups (from 20+ to 70+, with a 10-year increase per group). The current study used age as a continuous variable. Browne has mentioned a general flat rule to “use at least 30 subjects or greater to estimate a parameter” (90). The sample size was 120 subjects, indicating sufficient power to investigate the association between age and NSS total score (90). In order to avoid type 1 error, significance level was chosen to be 1% (0.01). All statistical analyses were conducted using STATA Special Edition 15.0 (91).
The presented sample was homogeneous and census based, consisting of white Germans from one area. Descriptive data are shown in Tables 1, 2. All participants took part in the interviews and the assessments of NSS and handedness. One person in the 60+ group did not take part in all neurocognitive tests, but in IQ and memory testing (LG I and II) only. In the 70+ group, one individual was not able to perform any of the cognitive tests, whereas another omitted to take the d2 concentration test.
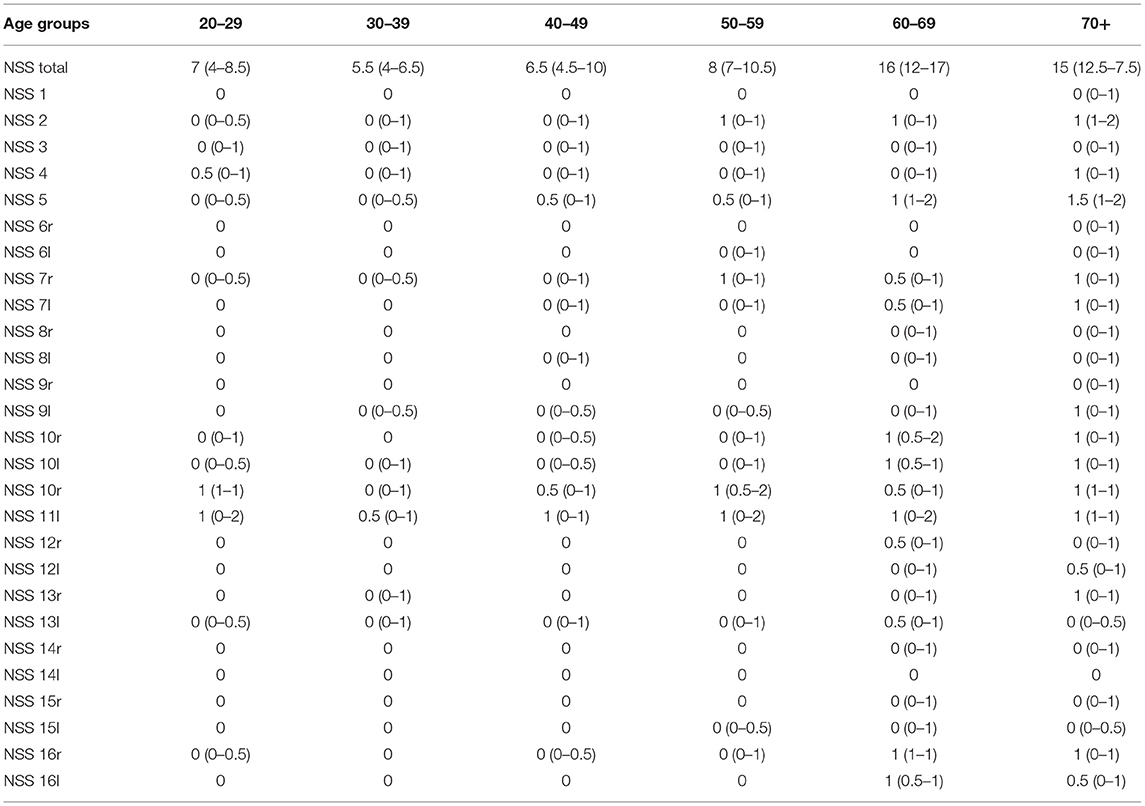
Table 2. Distribution of NSS total and each single NSS in each age group, descriptive data; median (Q1–Q3); r, right, l, left.
According to the census, gender was not equally distributed in the age group 70+. However, none of the assessed variables differed between men and women. Also, according to the census data, levels of schooling did not differ between the sexes. One single person in the age group 20+ remained without a formal certificate and was incorporated into the next higher group. Also, one female subject had not reached her 20th birthday yet. She was included due to recruiting problems within the given time. Education, IQ, results of cognitive testing as well as handedness, and NSS were comparable between men and women.
Although age groups differed regarding IQ, no influence of IQ on NSS emerged. The type of school attended was not related to IQ because there was a shift toward higher education from a maximum of 10% in a given age group in the 60s and 70s to over 50% attendance of the school type preparing for university studies in 2015 (East and West Germany alike).
NSS were overall in the normal, i.e., physiological range up to the age of 50+. Age groups 60+ and 70+ exhibited scores which compare to minor abnormalities (scores 9–15) and thus to the lowest level of possible abnormalities (scores 9–81) (92, 93). Due to the high amount of individuals scoring in the physiological range, the overall distribution of NSS was not normal but skewed to the left. On the whole, the NSS total scores were significantly related to age in both men and women, as shown by the regression curves in Figure 1, the curve being slightly steeper in men. For the whole sample, with a 10-year increase in subjects' age, the NSS total score rose by 2.4 points (coefficient 0.24, 95% confidence interval 0.21–0.28, p < 0.001) after adjusting for gender and IQ. For men, with a 10-year increase in subjects' age, the NSS total score rose by 2.6 points (coefficient 0.26, 95% confidence interval 0.20–0.33, p < 0.001) while the increase for women was 2.0 points (coefficient 0.20, 95% confidence interval 0.15–0.26, p < 0.001), both after adjusting for IQ.
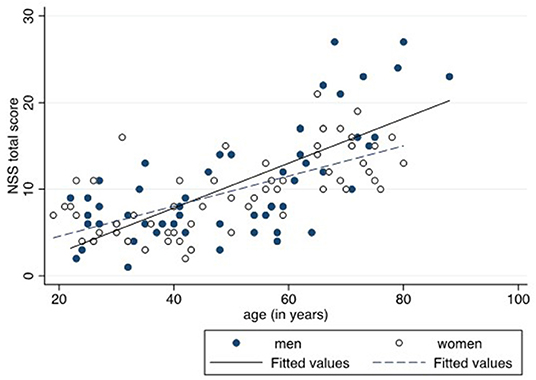
Figure 1. Relationship between neurological soft signs (NSS) total score and age by sex.
The box plots of the NSS total score in each age group is shown in Figure 2. The most significant increase, i.e., worsening of NSS, is seen between the age groups 50+ and 60+. The following single signs accounted for this increase: gait, tandem gait, Ozeretzki's test, finger–thumb opposition, 2-point discrimination, fist–edge–palm test (NSS 1, 2, 5,10, 12, and 16 in this order, both sides for signs 10, 12, and 16; see Supplementary Tables 2–10). These discriminating signs refer to motor tasks, i.e., either to complex motor tasks (fist–edge–palm test) or to motor coordination (Ozeretzki's test and finger-to-thumb test) and to sensory integration (gait, tandem gait, and 2-point discrimination). The remaining tests carry less weight toward the NSS increase between ages 50+ and 60+.
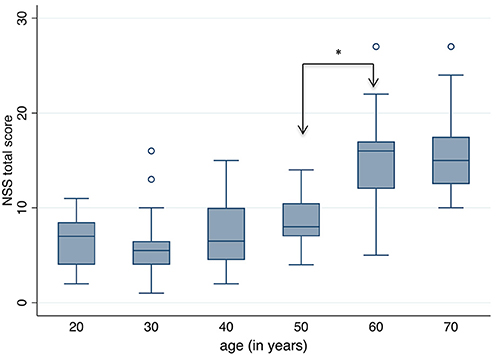
Figure 2. Neurological Soft Signs (NSS) total score according to age groups. A significant increase, i.e. worsening of NSS, is seen between the ages 50 and 60 years (*Dunn's Pairwise Comparison, p = 0.0002).
Handedness scores ranged from −40 to +100. The majority of subjects, namely, 90.9%, was right-handed; 11 subjects were mixed-handed; left-handedness did not occur. Presence of left-handers in the family (one to nine per age group) or regular practice of a musical instrument during the past 6 months (zero to four per age group) were unrelated to handedness. Handedness itself was not associated with any of the other parameters; neither were NSS scores or results of cognitive tests.
Neurocognitive test results of individuals in this study (see Table 3) were compared to the respective age groups' norms as given in the test manuals with one exception: probands' decrease of concentration in the sixth and more so the seventh decades could not be compared to norm values because the d2 test standardization exists up to the age of 60 years only.
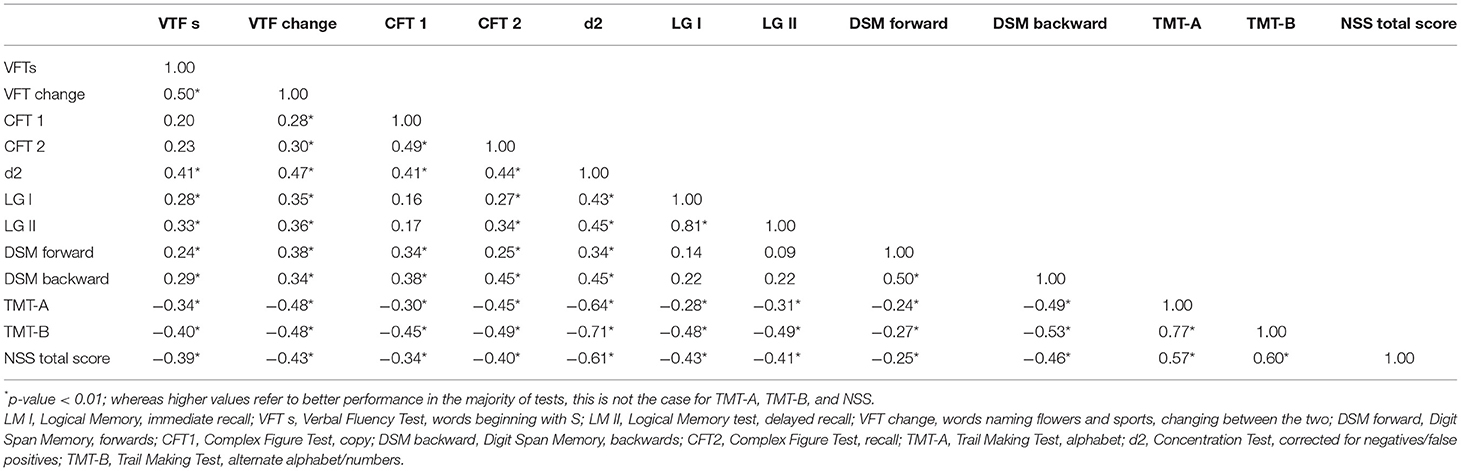
Table 3. Spearman correlation between co-function and total NSS.
Two moderate and thus meaningful correlations arose between NSS total score and results from cognitive testing, namely, a negative correlation between NSS total score and concentration according to d2 (r = −0.61, p < 0.01) as well as a positive correlation between NSS total score and the TMT-A (r = 0.57, p < 0.01). NSS total score and TMT-B were also positively and significantly correlated (r = 0.60, p < 0.01).
These correlations point in the same direction, namely, an increase of NSS being related to worsening of concentration and/or visual search function and processing speed with age.
This study aimed to assess NSS in healthy individuals grouped into age decades ranging from 20 to over 70 years, census based with respect to gender and education. The study yields the following main results:
1. It presents a preliminary reference matrix across the adult life span. NSS scores increased with age in this sample of 120 healthy subjects, independently of gender, intelligence, education, and handedness. Not only did NSS increase with age, but there was a period when the most pronounced change occurred, namely, between the fifth and sixth decades of life.
2. Worsening of motor function yielded the most important share of overall NSS increase.
3. The cognitive domains processing speed, visual search function, and concentration worsened in parallel with NSS, but none of the remaining cognitive functions did.
Ad 1: To our knowledge, this is the first study which systematically assessed age-related changes of NSS in healthy subjects on the basis of census data including age and education. Although the sample size is small due to recruitment problems, it encompasses a well-characterized group of adults with similar cell sizes per decade in females and males (20 to >70 years of age).
The NSS total score in the presented sample amounted to 10, which lies above the reference values of healthy subjects' scores as established for the H-NSS scale, namely, 0–8 points (93). However, when looking at younger and older age groups, younger (aged 20–49) individuals' NSS amounted to 6.5 ± 3.3 and thus remained in the physiological range. Reference values for healthy subjects aged 50 and above do not exist. Thus, scores in the latter age group (13.6 ± 5.7) in this study may as well be physiological.
NSS total score increased linearly with age in men and women, the rise being somewhat steeper in men but not significantly so. The increase proved to be independent of IQ, education, and handedness in both sexes. The most obvious and statistically significant increase occurred between the fifth and sixth decades. This is an important result because NSS—being mainly studied in psychiatric patients—have long been looked at as stable (11, 33). Where healthy subjects were studied, they usually served as controls. Even when healthy subjects' NSS were included in longitudinal studies, scores did not change (20), not surprisingly so, because patients were mostly at the beginning of their psychiatric disease, and thus, patients and controls were relatively young. This is especially true for schizophrenia, but also for other mental illness studied, except for the dementias. With ages clearly below 50 years and follow-up periods of 2–10 years at most, matched controls usually did not reach the age when a decrease in NSS might be expected.
There are a few possible exemptions, namely, the groups of Chan, Fountoulakis, and Kodama (49, 57, 94). These researchers sought to shed light on NSS in healthy individuals who were not recruited as controls. Kodama et al. (94) performed gross neurological examinations on healthy subjects aged 60–80 years cross-sectionally. The type of examination, however, is not comparable to the NSS assessment. Moreover, young and middle-aged groups are lacking. Fountoulakis et al. (49) studied 122 healthy subjects to detect a possible presence of NSS. There was no significant correlations between NSS and age, gender, or education. However, their focus was not on age, and although the age span ranged from 18 to 65 years with a mean of 33 years, only 19% of the subjects were above 40 years of age. Thus, most individuals did not reach the critical age where NSS increase began in our study. Chan et al. (57) assessed NSS in a large sample of patients with schizophrenia and other psychiatric disorders, in individuals with schizotypal personality disorders, and in unaffected relatives as well as healthy subjects aged 14–62 (n = 1,224). They matched healthy subjects to schizophrenia patients, including gender and intellectual level, which led to a very young sample with 74% of participants aged below 30 (80% below 40) years, whereas we collected probands based on a census, thus reaching an equal distribution between all age groups up to 70+. IQ was not normally spread in both studies, whereas gender was. NSS were rated as present or absent by Chan et al. (57); our assessment comprised four levels. Notwithstanding the differences between the studies, the NSS distribution according to age is stunningly similar. Chan et al. depicted a U-shaped curve with a descending left leg and a rising right leg. The left leg reflects the falling NSS scores in teenagers, the right leg an increase with age. The latter starts rising slightly at age 40 and above and curves above the age of 50. This finding strongly supports our results regarding the NSS increase starting at age 40+ and intensifying at age 50+. With a 10-year increase in subjects' age, NSS total score rises by 2.37 points (coefficient 0.237 × 10 = 2.37), after adjusting for gender and IQ. A decrease of NSS in teenagers (falling left leg) refers to the developmental trajectory (65).
In essence, our findings as well as those by Chan et al. (57, 95) are in line with studies on morphology, such as a review of 56 longitudinal MRI studies (69). These authors studied all available data on WBV changes over the life span by applying a weighted regression. Their analysis revealed relative stability of brain volumes between the ages ~18 and 35. At about 35 years, a steady brain loss of 0.2% per year began, which increased to 0.5% annual loss around the age of 50 years and remained stable at 0.5% after the age of 60 years. We assume that the increased brain volume loss, which comes about at age 50, is reflected functionally by worsening of NSS. Along these lines, a study on brain maturation deserves mention. Coupé et al. (96) assessed WM and gray matter (GM) in a large number of individuals to cover the human life span. They found an inverse U-shaped distribution of WM with the largest extension of WM in midlife—thus mirroring Chan's U-shaped distribution of NSS (lowest scores in midlife) and supporting that functioning is at its best level in this age group.
Our study yielded a slightly but non-significantly more pronounced increase of NSS with age in male as opposed to female participants. This is supported by findings of Driscoll et al. (97), who reported a more pronounced volume loss in men relative to women with increasing age. However, results of Coupé et al. and Hedman et al. (69, 96) predominantly oppose the aforementioned results. Coupé et al. examined data of over 2,000 healthy individuals and detected a more pronounced volume loss in males above the age of 80 years only. Hedman et al. (69) reported no gender differences in volume loss over time in the majority of 56 studies reviewed. Chan et al. (57) as well-concluded that change rates of WBVs were independent of gender.
Ad 2: In our study, worsening of motor function and sensory integration yielded the most important share of overall NSS increase between the ages 50 and 60. The following NSS contributed significantly: gait, tandem gait, Ozeretzki's test, finger–thumb opposition, 2-point discrimination, fist–edge–palm test (NSS 1, 2, 5,10, 12, and 16 in this order, both sides for signs 10, 12, and 16; see Supplementary Tables 2–10). According to the original five-factor model of H-NSS (88), gait, tandem gait, and 2-point discrimination represent “sensory integration”; Ozeretzki's test and finger-thumb-opposition belong to the factor “motor coordination,” and the fist–edge–palm test is a “complex motor task.” There was no relation to handedness for either of these signs. When we compare the classification of signs to that in the literature, there is some slight divergence regarding the fist–edge–palm test. It is also grouped with complex motor acts in the Neurological Evaluation Scale Evaluation Scale (NES) (98), but with the motor coordination tests on other scales, e.g., the Cambridge Neurological Inventory (CNI) (95). In either case, an equal share of motor and sensory signs accounts for the overall NSS increase between 50 and 60 years.
Our findings regarding an important role of motor NSS in healthy subjects are in line with those of Fountoulakis et al. (48), where 54% of healthy subjects exhibited one NSS, 14% two NSS, and 6.5% three NSS—among which motor signs were overrepresented. Chan et al. (57) regrettably did not present NSS on an item level; it thus remains unclear which single items contributed to the rise in total NSS. Dazzan et al. (99) studied the relationship of NSS and brain volumes in healthy subjects, differentiating GM and WM. The group reported motor signs to be mostly normal whereas sensory signs were not; the latter were related to GM reductions (see below). Participants' age ranged from 17 to 53 years, with a mean around 30 years. The absence of motor signs in this young age group compares to our results, where motor signs did not increase before the age of 50. Also, three sensory signs rose in our study, beyond the age 50 or 60 as well. Therefore, differences between studies may be attributed to the younger age in Dazzan et al. (99). The throughout higher sensory scores in the latter study may be reconciled with those reported by Chen et al. (100), who described correlations between motor and sensory signs.
Contrary to the longstanding knowledge on motor and supplementary motor areas in general, neuroimaging literature on motor abnormalities in healthy subjects is scarce. The above-mentioned study by Dazzan et al. (99) represents a landmark study. They grouped motor coordination, motor sequencing, and sensory integration to an NSS subscale called “integrative scale.” Healthy subjects were divided into subgroups according to high and low scores on this scale. High integrative scores were significantly related to GM reduction, namely, to the following GM clusters: anterior cingulate bilaterally, right middle temporal gyrus into the inferior frontal gyrus, and the right superior temporal gyrus. Regarding WM, the high-scoring group exhibited reductions of the superior longitudinal fasciculus into the internal and external capsules. Our results are in line with these findings on integrative signs, as sensory and motor signs contributed equally to the overall rise of NSS.
Along these lines (99) and with respect to overall NSS in healthy controls, an association to GM was also reported by Thomann et al. (22). In 2015, Thomann et al. (101) presented a functional imaging study, where in three out of five cortical networks of interest, negative correlations arose between NSS and the right precuneus, right superior frontal areas, supplementary motor areas, and left paracentral gyrus; no association with subcortical areas was detected. Thus, motor control in cortical rather than subcortical areas seemed to be related to NSS motor signs. The latter was confirmed by Hirjak et al. (63) with a special focus on cortical morphology. The group extended their studies to the cerebellum and detected a relationship between activities of lobule VI and motor coordination as well as hard signs (102). Contrary to their previous findings, Hirjak et al. (103) showed that in addition to the cerebellum, the brainstem and basal ganglia play a role in motor regulation. Moreover, the visuospatial control of motor acts along with the sensorimotor control, as described by the above researchers (63, 101), bridges motor and sensory activation—thus supporting Dazzan's introduction of “integrative signs.” The group (104) even suggested a meaningful integration in terms of a dimensional or brain network approach as being more appropriate to understand motor abnormalities. Thus, they built on Andreasen's cortico-cerebellar-thalamo-cortical circuit (CCTCC) (64), a hypothetical large network which has influenced schizophrenia research during several decades. Hirjak et al. (104) supposed that motor function or dysfunction is related to networks which encompass the cerebello-thalamo-cortical, basal ganglia and cortico-motor circuits, as well as serotonergic in addition to dopaminergic neurotransmitters. Correspondingly, the degeneration of the indicated neurotransmitter systems may contribute to age-related fine and gross motor declines, as well as to higher cognitive deficits along with peripheral factors such as a decrease in muscle strength and slowing of movements (105).
Ad 3: Along the lines of considering CCTCC as reflecting motor as well as cognitive functioning, neurocognitive testing was included into our study. With respect to the cognitive functions tested, a parallel worsening of NSS and processing speed and/or visual search function and/or concentration was noted in our study; namely, significant correlations arose for NSS and d2 as well as NSS and TMT-A. The correlation for NSS and TMT-B was nearly significant. Processing speed may represent the most important factor among these correlations, as concentration, more so than visual search function, is a function of processing speed (106). Physiologic, functional, and structural mechanism changes lead to the cognitive decline which is present to a certain degree in all aging humans. As stated by Hirjak et al. (102), sensorimotor control, assessed via NSS, and spatial processing are both localizable to lobule VI of the cerebellum in young healthy adults; they are thus part of the CCTCC.
Another study (95) looked at the relationship between NSS and neurocognitive functioning in healthy elderly aged 60 to >80. Results of cognitive tests in this sample were in line with the literature, namely, showing a decline with age and thus supporting our findings. The same group detected moderate relations between NSS and neurocognitive parameters, especially verbal, visual, and working memories. Authors concluded that the information assessed by NSS and neurocognitive tests is nearly identical and thus may be used vice versa in the detection of cognitive decline. The question of comparability of the respective measurements had been answered in the positive in an earlier publication (42).
Although we overall agree with Chan et al. (95), we prefer not to speak of a pathological decline but of a reflection of the physiological aging process in line with Seidler et al. (105). The latter group described an age-related change of cognitive and motor systems, both of which depend on the prefrontal cortex control. In parallel to an increasing loss of WM, GM, and WBV, older individuals have to recruit a larger network to perform a task.
Cognitive change over time has been addressed exclusively in normal aging by a wide variety of researchers. It is—among others—associated with reduced WM integrity; global brain metabolism decline, which affects the left inferior frontal junction, anterior cingulate/medial prefrontal cortex, dorsomedial thalamus, and subgenual cingulate/basal forebrain (70); and atrophy of the hippocampus and prefrontal cortices (67, 68, 70, 107). Genetic factors may affect the pace and quantity of this development (68).
Taken together, results point toward an age-related increase of NSS in unison with worsening of concentration and/or visual search function as well as processing speed in healthy subjects over a lifetime. These pilot study results are in line with the literature.
As studies in healthy subjects on NSS are still scarce, the main strength of this study is the census-based, homogeneous sample of healthy adults from age 20 onwards which provides a first step toward the establishment of NSS norms. Results are comparable internationally because the different scales for the assessment of NSS which are in use exhibit good psychometric properties and they comprise the same or similar items with respect to motor sequencing, motor coordination, and sensory integration. Moreover, the literature does not mention differences with respect to ethnic groups (25, 26).
It has to be borne in mind that the assessment of NSS can be learned easily by medical personnel or others. Examinations for assessment, confirmation, and follow-up of any deviations from the normal can thus be detected without technical equipment.
In our study, there was no relationship between NSS and IQ. This finding is in line with Dazzan et al. (99) who studied healthy subjects up to the age of 53. In contrast, previous researchers reported a low prevalence of NSS being related to a relatively high IQ (34, 45, 57, 108, 109). The use of different instruments may partially explain the different results and thus hint to a bias. In our study using the MWT-B, we measured crystallized and not fluid intelligence.
Certain limitations have to be mentioned, above all the cross-sectional design and the small sample size. A longitudinal design would have been the most adequate to assess NSS in healthy adults from age 20 to at least age 70. However, it is very difficult to allocate adequate resources to follow a large group of individuals for four or five decades. The small sample size does not allow to generalize findings to the general population. As there are no standard values for NSS, our preliminary data are nevertheless worthwhile. Larger studies with healthy participants are warranted. Another shortcoming is to not have asked for severe mental illness in first degree relatives. In addition, future studies may cover NSS and neurocognitive functions.
The datasets, i.e. raw data, presented in this article are not readily available because participating individuals were granted confidentiality. Requests to access the datasets should be directed to the first author.
Ethical review and approval was not required for this study on healthy human participants in accordance with the local legislation and institutional requirements. The participants provided their written informed consent.
SB had the idea for this project and supervised the study and wrote the manuscript. FH drafted the study protocol. Recruitment and examination of subjects were performed by FH and MB. D-HT performed the analyses and interpretation of the data as well as a critical revision of the manuscript. All authors contributed to the article and approved the submitted version.
Authors are grateful to the Stanley Medical Research Institute, Bethesda, USA and to the Psychiatric hospital Clienial Littenheid, Switzerland for funding.
The authors declare that the research was conducted in the absence of any commercial or financial relationships that could be construed as a potential conflict of interest.
Authors would like to thank the participants in this study. Moreover, the authors would like to thank Dai-Hua Tsai Riediker, Ph.D., for sound statistical advice and support. The analysis part of the study was supported by the psychiatric hospital Clienia Littenheid, Switzerland.
The Supplementary Material for this article can be found online at: https://www.frontiersin.org/articles/10.3389/fpsyt.2021.670539/full#supplementary-material
1. Tucker GJ, Campion EW, Silberfarb PM. Sensorimotor functions and cognitive disturbance in psychiatric patients. Am J Psychiatry. (1975) 132:17–21. doi: 10.1176/ajp.132.1.17
2. Quitkin F Rifkin A, Klein DF. Neurologic soft signs in schizophrenia and character disorders. Arch Gen Psychiatry. (1976) 33:845–53. doi: 10.1001/archpsyc.1976.01770070075008
3. Woods BT, Kinney KD, Yurgelun-Todd D. Neurologic abnormalities in schizophrenic patients and their families. I comparison of schizophrenic, bipolar, and substance abuse patients and normal controls. Arch Gen Psychiatry. (1986) 43:657–63. doi: 10.1001/archpsyc.1986.01800070043006
4. Kong L, Herold CJ, Cheung EFC, Chan RCK, Schröder J. Neurological soft signs and brain network abnormalities in schizophrenia. Schizophr Bull. (2020) 46:562–71. doi: 10.1093/schbul/sbz118
5. Northoff G, Hirjak D, Wolf RC, Magioncalda P, Martino M. All roads lead to the motor cortex: psychomotor mechanisms and their biochemical modulation in psychiatric disorders. Mol Psychiatry. (2020) 25:1910–9. doi: 10.1038/s41380-020-0814-5
6. Walther S, van Harten PN, Waddington JL, Cuesta MJ, Peralta V, Dupin L, et al. Movement disorder and sensorimotor abnormalities in schizophrenia and other psychoses - european consensus on assessment and perspectives. Eur Neuropsychopharmacol. (2020) 38:25–39. doi: 10.1016/j.euroneuro.2020.07.003
7. Walther S, Bernard JA, Mittal VA, Shankman SA. The utility of an RDoC motor domain to understand psychomotor symptoms in depression. Psychol Med. (2019) 49:212–6. doi: 10.1017/S0033291718003033
8. Wang X, Herold CJ, Kong L, Schroeder J. Associations between brain structural networks and neurological soft signs in healthy adults. Psychiatry Res Neuroimaging. (2019) 293:110989. doi: 10.1016/j.pscychresns.2019.110989
9. Rau JH, Green RS. Soft neurological correlates of compulsive eaters. J Nerv Ment Dis. (1978) 166:435–7. doi: 10.1097/00005053-197806000-00007
10. Dazzan P, Murray RM. Neurological soft signs in first-episode psychosis: a systematic review. Br J Psychiatry. (2002) 181(Suppl. 43):s50–7. doi: 10.1192/bjp.181.43.s50
11. Heinrichs DW, Buchanan RW. Significance and meaning of neurological signs in schizophrenia. Am J Psychiatry. (1988) 145:11–8. doi: 10.1176/ajp.145.1.11
12. Boks MP, Liddle PF, Burgerhof JG, Knegtering R, van den Bosch RJ. Neurological soft signs discriminating mood disorders from first episode schizophrenia. Acta Psychiatr Scand. (2004) 110:29–35. doi: 10.1111/j.1600-0447.2004.00298.x
13. Mergl R, Hegerl U. Neurological soft signs in patients with obsessive-compulsive disorder (review article). Fortschritte der Neurologie Psychiatrie. (2005) 73:504–16. doi: 10.1055/s-2004-830173
14. De La Fuente JM, Bobes J, Vizuete C, Bascaran M-T, Morlán I, Mendlewicz J. Neurologic soft signs in borderline personality disorder. J Clin Psychiatry. (2006) 67:541–6. doi: 10.4088/JCP.v67n0404
15. Boks MP, Russo S, Knegtering R, van den Bosch RJ. The specificity of neurological signs in schizophrenia: a review. Schizophr Res. (2000) 43:109–16. doi: 10.1016/S0920-9964(99)00145-0
16. Bombin I, Arango C, Buchanan RW. Significance and meaning of neurological signs in schizophrenia: two decades later. Schizophr Bull. (2005) 31:962–77. doi: 10.1093/schbul/sbi028
17. Chan RCK, Xu T, Heinrichs RW, Yu Y, Wang Y. Neurological soft signs in schizophrenia: a meta-analysis. Schizophr Bull. (2010) 36:1089–104. doi: 10.1093/schbul/sbp011
18. Krebs MO, Fayand AG, Bourdel MC, Dischamp J, Olie JP. Validity and factorial structure of a standardized examination for neurological soft-signs in schizophrenia. Schizophr Res. (2000) 45:245–60. doi: 10.1016/S0920-9964(99)00206-6
19. Tosato S DP. The psychopathology of schizophrenia and the presence of neurological soft signs: a review. Curr Opin Psychiatry. (2005) 18:285–8. doi: 10.1097/01.yco.0000165599.90928.c7
20. Bachmann S, Bottmer C, Schröder J. Neurological soft signs in first-episode schizophrenia: a follow-up study. Am J Psychiatry. (2005) 162:2337–43. doi: 10.1176/appi.ajp.162.12.2337
21. Thomann PA, Roebel M, Dos Santos V, Bachmann S, Essig M, Schröder J. Cerebellar substructures and neurological soft signs in first-episode schizophrenia. Psychiatry Res. (2009) 173:83–7. doi: 10.1016/j.pscychresns.2008.07.006
22. Thomann PA, Wüstenberg T, Santos VD, Bachmann S, Essig M, Schröder J. Neurological soft signs and brain morphology in first-episode schizophrenia. Psychol Med. (2009) 39:371–9. doi: 10.1017/S0033291708003656
23. Heuser M, Thomann PA, Essig M, Bachmann S, Schröder J. Neurological signs and morphological cerebral changes in schizophrenia: an analysis of NSS subscales in patients with first episode psychosis. Psychiatry Res. (2011) 192:69–76. doi: 10.1016/j.pscychresns.2010.11.009
24. Kong L, Bachmann S, Thomann PA, Essig M, Schröder J. Neurological soft signs and gray matter changes: a longitudinal analysis in first-episode schizophrenia. Schizophr Res. (2012) 134:27–32. doi: 10.1016/j.schres.2011.09.015
25. Bachmann S, Degen C, Geider FJ, Schröder J. Neurological soft signs in the clinical course of schizophrenia: results of a meta-analysis. Front Psychiatr. (2014) 5:185. doi: 10.3389/fpsyt.2014.00185
26. Bachmann S, Schröder J. Neurological Soft Signs in Schizophrenia: an update on the state- versus Trait-Perspective. Front Psychiatr. (2018) 8:272. doi: 10.3389/fpsyt.2017.00272
27. Bottmer C, Bachmann S, Pantel J, Essig M, Amann M, Schad LR, et al. Reduced cerebellar volume and neurological soft signs in first-episode schizophrenia. Psychiatry Res. (2005) 140:239–50. doi: 10.1016/j.pscychresns.2005.02.011
28. Keshavan MS, Sanders RD, Sweeney JA, Diwadkar VA, Goldstein G, Pettegrew JW, et al. Diagnostic specificity and neuroanatomical validity of neurological abnormalities in first-episode psychoses. Am J Psychiatry. (2003) 160:1298–304. doi: 10.1176/appi.ajp.160.7.1298
29. Picchioni MM, Toulopoulou T, Landau S, Davies N, Ribchester T, Murray RM. Neurological abnormalities in schizophrenic twins. Biol Psychiatr. (2006) 59:341–8. doi: 10.1016/j.biopsych.2005.07.007
30. Cantor-Graae E, McNeil TF, Rickler KC, Sjöström K, Rawlings R, Higgins ES, et al. Are neurological abnormalities in well discordant monozygotic cotwins of schizophrenic subjects the result of perinatal trauma? Am J Psychiatry. (1994) 151:1194–9. doi: 10.1176/ajp.151.8.1194
31. Niethammer R, Weisbrod M, Schiesser S, Grothe J, Maier S, Peter U, et al. Genetic influence on laterality in schizophrenia? a twin study of neurological soft signs. Am J Psychiatry. (2000) 157:272–4. doi: 10.1176/appi.ajp.157.2.272
32. Kelly BD CD, Denihan C. Neurological soft signs and dermatoglyphic anomalies in twins with schizophrenia. Eur Psychiatry. (2004) 19:159–63. doi: 10.1016/j.eurpsy.2003.10.006
33. Wolff AL, O'Driscoll GA. Motor deficits schizophrenia: the evidence from neuroleptic-naïve patients populations at risk. J Psychiatry Neurosci. (1999) 24:304–14.
34. Manschreck TC, Ames D. Neurological features and psychopathology. Biol Psychiatry. (1984) 19:703–19.
35. Schröder J, Geider FJ, Binkert M, Reitz C, Jauss M, Sauer H. Subsyndromes in chronic schizophrenia: do their psychopathological characteristics correspond to cerebral alterations? Psychiatry Res. (1992) 42:209–20. doi: 10.1016/0165-1781(92)90113-H
36. Arango C, Kirkpatrick B, Buchanan RW. Neurological signs and the heterogeneity of schizophrenia. Am J Psychiatry. (2000) 157:560–5. doi: 10.1176/appi.ajp.157.4.560
37. King DJ, Wilson A, Cooper SJ, Waddington JL. The clinical correlates of neurological soft signs in chronic schizophrenia. Br J Psychiatry. (1991) 158:770–5. doi: 10.1192/bjp.158.6.770
38. Chan RC, Huang J, Zhao Q, Wang Y, Lai YY, Hong N, et al. Prefrontal cortex connectivity dysfunction in performing the fist-edge-palm task in patients with first-episode schizophrenia and non-psychotic first-degree relatives. NeuroImage Clin. (2015) 9:411–7. doi: 10.1016/j.nicl.2015.09.008
39. Emsley R, Chiliza B, Asmal L, Kilian S, Riaan Olivier M, Phahladira L, et al. Neurological soft signs in first-episode schizophrenia: state- and trait-related relationships to psychopathology, cognition and antipsychotic medication effects. Schizophr Res. (2017) 188:144–50. doi: 10.1016/j.schres.2017.01.034
40. Cuesta MJ, Moreno-Izco L, Ribeiro M, López-Ilundain JM, Lecumberri P, Cabada T, et al. Motor abnormalities and cognitive impairment in first-episode psychosis patients, their unaffected siblings and healthy controls. Schizophr Res. (2018) 200:50–5. doi: 10.1016/j.schres.2017.10.035
41. Herold CJ, Lässer MM, Seidl UW, Hirjak D, Thomann PA, Schröder J. Neurological soft signs and psychopathology in chronic schizophrenia: a cross-sectional study in three age groups. Front Psychiatr. (2018) 9:98. doi: 10.3389/fpsyt.2018.00098
42. Chan RC, Gottesman I. Neurological soft signs as candidate endophenotypes for schizophrenia: a shooting star or a northern star? Neurosci Biobehav Rev. (2008) 32:957–71. doi: 10.1016/j.neubiorev.2008.01.005
43. Bachmann S, Schröder J. Neurological soft signs in schizophrenia: an update on the state- versus trait-perspective. Front Psychiatry. (2017) 8:272.
44. Hertzig M, Birch H. Neurologic organization in psychiatrically disturbed adolescents. a comparative consideration of sex differences. Arch Gen Psychiatry. (1968) 19:528–37. doi: 10.1001/archpsyc.1968.01740110016003
45. Kennard MA. Value of equivocal signs in neurological diagnosis. Neurology. (1960) 10:753–64. doi: 10.1212/WNL.10.8.753
46. Rochford JM, Detre T, Tucker GJ, Harrow M. Neuropsychological impairments in functional psychiatric diseases. Arch Gen Psychiatry. (1970) 22:114–9. doi: 10.1001/archpsyc.1970.01740260018003
47. Cox SM, Ludwig AM. Neurological soft signs and psychopathology: incidence in diagnostic groups. Can J Psychiatry. (1979) 24:668–73. doi: 10.1177/070674377902400711
48. Fountoulakis KN, Panagiotidis P, Gonda X, Kimiskidis V, Nimatoudis I. Neurological soft signs significantly differentiate schizophrenia patients from healthy controls. Acta Neuropsychiatr. (2018) 30:97–105. doi: 10.1017/neu.2017.29
49. Fountoulakis KN, Panagiotidis P, Kimiskidis V, Nimatoudis I, Gonda X. Prevalence and correlates of neurological soft signs in healthy controls without family history of any mental disorder: a neurodevelopmental variation rather than a specific risk factor? Int J Dev Neurosci. (2018) 68:59–65. doi: 10.1016/j.ijdevneu.2018.04.006
50. Gay O, Plaze M, Oppenheim C, Mouchet-Mages S, Gaillard R, Olié JP, et al. Cortex morphology in first-episode psychosis patients with neurological soft signs. Schizophr Bull. (2013) 39:820–9. doi: 10.1093/schbul/sbs083
51. Compton MT, Bollini AM, McKenzie Mack L, Kryda AD, Rutland J, Weiss PS, et al. Neurological soft signs and minor physical anomalies in patients with schizophrenia and related disorders, their first-degree biological relatives, non-psychiatric controls. Schizophrenia Res. (2007) 94:64–73. doi: 10.1016/j.schres.2007.04.002
52. Bollini AM, Compton MT, Esterberg ML, Rutland J, Chien VH, Walker EF. Associations between schizotypal features and indicators of neurological and morphological abnormalities. Schizophr Res. (2007) 92:32–40. doi: 10.1016/j.schres.2007.01.018
53. Gourion D GC, Olie JP, Lôo H, Krebs MO. Neurological morphological anomalies and the genetic liability to schizophrenia: a composite phenotype. Schizophr Res. (2004) 67:23–31. doi: 10.1016/S0920-9964(03)00099-9
54. Lawrie SM, Byrne M, Miller P, Hodges A, Clafferty RA, Cunningham Owens DG, et al. Neurodevelopmental indices and the development of psychotic symptoms in subjects at high risk of schizophrenia. Brit J Psychiatry. (2001) 178:524–30. doi: 10.1192/bjp.178.6.524
55. Egan MF, Hyde TM, Bonomo JB, Mattay VS, Bigelow LB, Goldberg TE, et al. Relative risk of neurological signs in siblings of patients with schizophrenia. Am J Psychiatry. (2001) 158:1827–34. doi: 10.1176/appi.ajp.158.11.1827
56. Neelam K, Garg GD, Marshall M. A systematic review and meta-analysis of neurological soft signs in relatives of people with schizophrenia. BMC Psychiatry. (2011) 11:139. doi: 10.1186/1471-244X-11-139
57. Chan RC, Xie W, Geng FL, Wang Y, Lui SS, Wang CY, et al. Clinical utility and lifespan profiling of neurological soft signs in schizophrenia spectrum disorders. Schizophr Bull. (2016) 42:560–70. doi: 10.1093/schbul/sbv196
58. Rie E. Soft signs in learning disabilities. In: DE T, editor. Soft Neurological Signs. Orlando, FL: Grune & Sratton (1987). p. 201–24.
59. Schröder J, Niethammer R, Geider FJ, Reitz C, Binkert M, Jauss M, et al. Neurological soft signs in schizophrenia. Schizophr Res. (1992) 6:25–30.
60. Schröder J, Richter P, Geider FJ, Niethammer R, Binkert M, Reitz C, et al. Discrete motoric and sensoric disorders (neurological soft signs) in acute course of endogenous psychosis. Zeitschr Klinische Psychol Psychopathol Psychother. (1993) 41:190–200.
61. Schröder J, Essig M, Baudendistel K, Jahn T, Gerdsen I, Stockert A, et al. Motor dysfunction and sensorimotor cortex activation changes in schizophrenia: a study with functional magnetic resonance imaging. NeuroImage. (1999) 9:81–7. doi: 10.1006/nimg.1998.0387
62. Hirjak D, Wolf RC, Stieltjes B, Seidl U, Schröder J, Thomann PA. Neurological soft signs and subcortical brain morphology in recent onset schizophrenia. J Psychiatr Res. (2012) 46:533–9. doi: 10.1016/j.jpsychires.2012.01.015
63. Hirjak D, Wolf RC, Kubera KM, Stieltjes B, Thomann PA. Multiparametric mapping of neurological soft signs in healthy adults. Brain Structure Function. (2016) 221:1209–21. doi: 10.1007/s00429-014-0964-9
64. Andreasen NC, Paradiso S, O'Leary DS. “Cognitive dysmetria” as an integrative theory of schizophrenia: a dysfunction in cortical-subcortical-cerebellar circuitry? Schizophr Bull. (1998) 24:203–18. doi: 10.1093/oxfordjournals.schbul.a033321
65. Biswas P, Malhotra S, Malhotra A, Gupta N. Comparative study of neurological soft signs in schizophrenia with onset in childhood, adolescence and adulthood. Acta Psychiatr Scand. (2007) 115:295–303. doi: 10.1111/j.1600-0447.2006.00901.x
66. Thompson PM, Vidal C, Giedd JN, Gochman P, Blumenthal J, Nicolson R, et al. Mapping adolescent brain change reveals dynamic wave of accelerated gray matter loss in very early-onset schizophrenia. Proc Natl Acad Sci USA. (2001) 98:11650–5. doi: 10.1073/pnas.201243998
67. Chételat G, Landeau B, Salmon E, Yakushev I, Bahri MA, Mézenge F, et al. Relationships between brain metabolism decrease in normal aging and changes in structural and functional connectivity. Neuroimage. (2013) 76:167–77. doi: 10.1016/j.neuroimage.2013.03.009
68. Glahn DC, Kent JW, Sprooten E, Diego VP, Winkler AM, et al. Genetic basis of neurocognitive decline reduced white-matter integrity in normal human brain aging. Proc Natl Acad Sci USA. (2013) 110:19006–11. doi: 10.1073/pnas.1313735110
69. Hedman AM, van Haren NE, Schnack HG, Kahn RS, Hulshoff Pol HE. Human brain changes across the life span: a review of 56 longitudinal magnetic resonance imaging studies. Hum Brain Mapp. (2012) 33:1987–2002. doi: 10.1002/hbm.21334
70. Pardo JV, Lee JT, Sheikh SA, Surerus-Johnson C, Shah H, Munch KR, et al. Where the brain grows old: decline in anterior cingulate and medial prefrontal function with normal aging. Neuroimage. (2007) 35:1231–7. doi: 10.1016/j.neuroimage.2006.12.044
71. Mohr F, Hubmann W, Cohen R, Bender W, Haslacher C, Hönicke S, et al. Neurological soft signs in schizophrenia: assessment and correlates. Eur Arch Psychiatry Clin Neurosci. (1996) 246:240–8. doi: 10.1007/BF02190275
72. Schröder J, Tittel A, Stockert A, Karr M. Memory deficits in subsyndromes of chronic schizophrenia. Schizophr Res. (1996) 21:19–26. doi: 10.1016/0920-9964(96)00027-8
73. Flashman LA FM, Gupta S, Andreasen NC. Soft signs and neuropsychological performance in schizophrenia. Am J Psychiatr. (1996) 153:526–32. doi: 10.1176/ajp.153.4.526
76. Wittchen HU, Wunderlich U, Gruschwitz S, Zaudig M. SKID-I: Strukturiertes klinisches Interview für DSM-IV. Göttingen: Hogrefe (1997).
77. Oldfield RC. The assessment and analysis of handedness: the Edinburgh inventory. Neuropsychologia. (1971) 9:97–113. doi: 10.1016/0028-3932(71)90067-4
79. Meyers JE, Meyers KR. Rey Complex Figure Test and Recognition Trial. 1st ed. Göttingen: Hogrefe Testzentrale (1995).
80. Strauss E, Sherman EMS, Spreen O. A Compendium of Neuropsychological Tests. Oxford: Oxford University Press (2006).
81. Akshoomoff N, Courchesne E, Press GA, Iragui V. Contribution of the cerebellum to neuropsychological functioning: evidence from a case of cerebellat degenerative disorder. Neuropsychologia. (1992) 30:315–28. doi: 10.1016/0028-3932(92)90105-U
82. Härting C, Markowitsch HJ, Neufeld H, Calabrese P, Deisinger K. Wechsler Gedächtnistest – revidierte Fassung: WMS-R; deutsche adaptation der revidierten fassung der Wechsler Memory Scale. Bern, Göttingen: Verlag Hans Huber (2004).
83. Andreasen NC, O'Leary DS, Cizadlo T, Arndt S, Rezai K, Ponto LL, et al. Schizophrenia and cognitive dysmetria: a positron-emission tomography study of dysfunctional prefrontal-thalamic-cerebellar circuitry. Proc Natl Acad Sci USA. (1996) 93:9985–90.
84. Tulving E, Kapur S, Markowitsch HJ, Craik FIM, Habib R, Houle S. Neuroanatomical correlates of retrieval in episodic memory: Auditory sentence recognition. Proc Natl Acad Sci USA. (1994) 91:2012–5.
85. Smith A. Symbol-Digit Modalities Test (SDMT). Manual (revised). Los Angeles: Western Psychological Services. Google Scholar (1982).
88. Aschenbrenner S, Tucha O, Lange KL. Regensburger Wortflüssigkeits-Test (RWT). Göttingen: Hogrefe (2000).
89. Association WM. World Medical Association Declaration of Helsinki ethical principles for medical research involving human subjects. JAMA. (2013) 310:2191–4. doi: 10.1001/jama.2013.281053
90. Browne R. On the use of a pilot sample for sample size determination. Stat Med. (1995) 14:1933–40. doi: 10.1002/sim.4780141709
91. StataCorp. College Station TSL. STATA Special Edition 15.0. StataCorp 2017 Stata Statistical Software: Release 15 College Station. TX: StataCorp LL (2017).
92. Schröder J, Niethammer R, Geider FJ, Reitz C, Binkert M, Jauss M, et al. Neurological soft signs in schizophrenia. Schizophr Res. (1991) 6:25–30. doi: 10.1016/0920-9964(91)90017-L
93. Schröder J RC, Binkert M, Sauer H. Diskrete motorische und sensorische Störungen (Neurologische Soft Signs). Heidelberg: Die Heidelberger NSS-Skala (1991).
94. Kodama T, Nakagawa M, Arimura K, Koriyama C, Akiba S, Osame M. Cross-sectional analysis of neurological findings among healthy elderly: study in a remote island in Kagoshima, Japan. Neuroepidemiology. (2002) 21:36–43. doi: 10.1159/000048612
95. Chan RCK, Xu T, Li HJ, Zhao Q, Liu HH, Wang Y, et al. Neurological abnormalities neurocognitive functions in healthy elder people: a structural equation modeling analysis. BBF. (2011) 7:32. doi: 10.1186/1744-9081-7-32
96. Coupé P, Catheline G, Lanuza E, Manjón JV. Towards a unified analysis of brain maturation and aging across the entire lifespan: a MRI analysis. Hum Brain Mapp. (2017) 38:5501–18. doi: 10.1002/hbm.23743
97. Driscoll I, Davatzikos C, An Y, Wu X, Shen D, Kraut M, et al. Longitudinal pattern of regional brain volume change differentiates normal aging from MCI. Neurology. (2009) 72:1906–13. doi: 10.1212/WNL.0b013e3181a82634
98. Buchanan RW, Heinrichs DW. The Neurological Evaluation Scale (NES): a structured instrument for the assessment of neurological signs in schizophrenia. Psychiatry Res. (1989) 27:335–50. doi: 10.1016/0165-1781(89)90148-0
99. Dazzan P, Morgan KD, Chitnis X, Suckling J, Morgan C, Fearon P, et al. The structural brain correlates of neurological soft signs in healthy individuals. Cerebral Cortex. (2006) 16:1225–31. doi: 10.1093/cercor/bhj063
100. Chen EY, Shapleske J, Luque R, McKenna PJ, Hodges JR, Calloway SP, et al. The Cambridge neurological inventory: a clinical instrument for assessment of soft neurological signs in psychiatric patients. Psychiatry Res. (1995) 56:183–204. doi: 10.1016/0165-1781(95)02535-2
101. Thomann PA, Hirjak D, Kubera KM, Stieltjes B, Wolf RC. Neural network activity and neurological soft signs in healthy adults. Behav Brain Res. (2015) 278:514–9. doi: 10.1016/j.bbr.2014.10.044
102. Hirjak D, Thomann PA, Kubera KM, Stieltjes B, Wolf RC. Cerebellar contributions to neurological soft signs in healthy young adults. Eur Arch Psychiatry Clin Neurosci. (2016) 266:35–41. doi: 10.1007/s00406-015-0582-4
103. Hirjak D, Huber M, Kirchler E, Kubera KM, Karner M, Sambataro F, et al. Cortical features of distinct developmental trajectories in patients with delusional infestation. Progr Neuro-Psychopharmacol Biol Psychiatr. (2017) 76:72–9. doi: 10.1016/j.pnpbp.2017.02.018
104. Hirjak D, Rashidi M, Fritze S, Bertolino AL, Geiger LS, Zang Z, et al. Patterns of co-altered brain structure and function underlying neurological soft signs in schizophrenia spectrum disorders. Hum Brain Mapp. (2019) 40:5029–41. doi: 10.1002/hbm.24755
105. Seidler RD, Bernard JA, Burutolu TB, Fling BW, Gordon MT, Gwin JT, et al. Motor control and aging: links to age-related brain structural, functional, biochemical effects. Neurosci Biobehav Rev. (2010) 34:721–33. doi: 10.1016/j.neubiorev.2009.10.005
106. Cohen RA, Marsiske MM, Smith GE. Neuropsychology of aging. Handbook Clin Neurol. (2019) 167:149–80. doi: 10.1016/B978-0-12-804766-8.00010-8
107. Buoli M, Serati M, Caldiroli A, Cremaschi L, Altamura AC. Neurodevelopmental versus neurodegenerative model of schizophrenia and bipolar disorder: comparison with physiological brain development and aging. Psychiatr Danub. (2017) 29:24–7. doi: 10.24869/psyd.2017.24
108. Mosher LR PW, Stabenau JR. Identical twins discordant for schizophrenia. Neurologic findings. Arch Gen Psychiatr. (1971) 24:422–30. doi: 10.1001/archpsyc.1971.01750110034006
Keywords: neurological soft signs, healthy adults, census-based, decade adjusted, age 20–70+, increase
Citation: Bachmann S, Beck M, Tsai D-H and Haupt F (2021) Neurological Soft Signs (NSS) in Census-Based, Decade-Adjusted Healthy Adults, 20 to >70 Years of Age. Front. Psychiatry 12:670539. doi: 10.3389/fpsyt.2021.670539
Received: 14 March 2021; Accepted: 30 April 2021;
Published: 24 June 2021.
Edited by:
Debanjan Banerjee, National Institute of Mental Health and Neurosciences (NIMHANS), IndiaReviewed by:
Migita Michael D'Cruz, National Institute of Mental Health and Neurosciences (NIMHANS), IndiaCopyright © 2021 Bachmann, Beck, Tsai and Haupt. This is an open-access article distributed under the terms of the Creative Commons Attribution License (CC BY). The use, distribution or reproduction in other forums is permitted, provided the original author(s) and the copyright owner(s) are credited and that the original publication in this journal is cited, in accordance with accepted academic practice. No use, distribution or reproduction is permitted which does not comply with these terms.
*Correspondence: Silke Bachmann, c2lsa2UuYmFjaG1hbm5AaGN1Z2UuY2g=
Disclaimer: All claims expressed in this article are solely those of the authors and do not necessarily represent those of their affiliated organizations, or those of the publisher, the editors and the reviewers. Any product that may be evaluated in this article or claim that may be made by its manufacturer is not guaranteed or endorsed by the publisher.
Research integrity at Frontiers
Learn more about the work of our research integrity team to safeguard the quality of each article we publish.