
94% of researchers rate our articles as excellent or good
Learn more about the work of our research integrity team to safeguard the quality of each article we publish.
Find out more
ORIGINAL RESEARCH article
Front. Psychiatry, 04 June 2021
Sec. Molecular Psychiatry
Volume 12 - 2021 | https://doi.org/10.3389/fpsyt.2021.657105
This article is part of the Research TopicMetabolic Profiles of Autistic and Typically Developing ChildrenView all 5 articles
 Xin-Jie Xu1†
 Xiao-E Cai2,3,4,5†
 Fan-Chao Meng2,3,4,6
 Tian-Jia Song2,3,4,7,8Xiao-Xi Wang2,3,4Yi-Zhen Wei9Fu-Jun Zhai2,3,4
 Bo Long1Jun Wang10
 Xin You11
 Rong Zhang2,3,4*
Background: Autism spectrum disorder (ASD) is defined as a pervasive developmental disorder which is caused by genetic and environmental risk factors. Besides the core behavioral symptoms, accumulated results indicate children with ASD also share some metabolic abnormalities.
Objectives: To analyze the comprehensive metabolic profiles in both of the first-morning urine and plasma samples collected from the same cohort of autistic boys.
Methods: In this study, 30 autistic boys and 30 tightly matched healthy control (HC) boys (age range: 2.4~6.7 years) were recruited. First-morning urine and plasma samples were collected and the liquid chromatography–mass spectrometry (LC-MS) was applied to obtain the untargeted metabolic profiles. The acquired data were processed by multivariate analysis and the screened metabolites were grouped by metabolic pathway.
Results: Different discriminating metabolites were found in plasma and urine samples. Notably, taurine and catechol levels were decreased in urine but increased in plasma in the same cohort of ASD children. Enriched pathway analysis revealed that perturbations in taurine and hypotaurine metabolism, phenylalanine metabolism, and arginine and proline metabolism could be found in both of the plasma and urine samples.
Conclusion: These preliminary results suggest that a series of common metabolic perturbations exist in children with ASD, and confirmed the importance to have a comprehensive analysis of the metabolites in different biological samples to reveal the full picture of the complex metabolic patterns associated with ASD. Further targeted analyses are needed to validate these results in a larger cohort.
Autism spectrum disorder (ASD) is defined as a pervasive developmental disorder with lifelong symptoms manifested in the early postnatal period (1). Although the biological mechanisms are still not fully understood, results of recent studies suggest that genetic heritability, environmental risk factors and the interplay effects between them play important roles in the pathogenesis of ASD (2–4). The diagnosis of ASD is made mainly according to the children's behavioral symptoms, which includes impairments in communication and reciprocal social interaction, as well as restricted and repetitive behaviors and interests (5, 6).
In addition to the core symptoms of behavioral characteristics, accumulated results from recent studies indicate that children with ASD may also share some patterns of metabolic abnormalities (7–16). Metabolic alterations related to amino acids, carbohydrates and vitamins have been observed in ASD in previously studies (7–16). The untargeted metabolomics approaches offer a sensitive means to profile a wide range of metabolites, which will provide more information for further investigations of the disease mechanisms and to screen potential biomarkers for the diagnosis of ASD (7, 10, 14). These studies mainly used blood serum (16), plasma (7, 14, 15) or urine (8–13) samples separately, and the main methods used to perform metabolomic analysis were nuclear magnetic resonance (NMR) spectroscopy (10, 12, 15); liquid chromatography-mass spectrometry (LC-MS) (7, 14) and gas chromatography-mass spectrometry (GC-MS) (8, 9). Although some of the results from previous studies were consistent, there were also many inconsistent findings, with some of them even appearing contradictory. These inconsistencies may be related to the differences in participants' characteristics (ethnicity, age, and sex composition); sample types (urine, blood, or saliva) and methodologies (differences in technical methods in data acquisition, processing and analysis) chosen for the different studies. All these mentioned factors may be confounders which would cause bias and distort the association between the metabolites and ASD.
In order to eliminate the influence of these confounding factors, a total of 30 autistic boys and 30 tightly matched healthy control (HC) boys in a relatively narrow age range (2.4~6.7 years old) were recruited in this study. Only boys were recruited in this study to eliminate the verified sex difference associated in ASD (17–19). Moreover, both of the first-morning urine and plasma samples were collected and analyzed to obtain the comprehensive untargeted metabolic profiles. Results derived from different samples in the same cohort will significantly contribute to a fuller picture of the comprehensive and complex metabolic patterns associated with ASD.
This study was approved by the Peking University Institutional Review Board (IRB00001052-13079). Detailed information on the aims and protocols of the study were explained to the parents or legal guardians of the child participants. Written informed consent was obtained before the involvement of the child participants in the study.
Autistic children were recruited from autism rehabilitation centers in Beijing, China (mainly from Wucailu Rehabilitation Center). The inclusion criteria for autistic children were: (1) Being diagnosed with autism which was confirmed by experienced psychiatrists according to the Diagnostic and Statistical Manual of Mental Disorders-IV-Text Revision (DSM-IV-TR, 2000) criteria. (2) Free of antibiotic treatment, prebiotics and probiotics for at least 4 weeks before sample collection. (3) The children's primary caregivers had good reading and comprehension skills and were able to fill in the relevant assessment scales. (4) The children's parents or legal guardians volunteered to participate in this study and signed the informed consent. Autistic children with symptoms of other comorbid neurological or psychiatric disorders were excluded from the study. Typically developing children in the control group were tightly matched with the ages of the autistic cases, and recruited through advertisements in kindergartens in Beijing. Children in the control group were also matched on the antibiotics, prebiotics, and probiotics criteria as well. Children were excluded from the control group if they have psychiatric conditions or other potentially confounding medical conditions.
The following scales were used to assess autistic symptoms in autistic and typically developing children:
1. Childhood Autism Rating Scale (CARS): A 15-item behavior rating scale consists of 14 domains that are generally affected by severe autism, plus one category of general impressions of autism. It is widely used by psychiatrists during diagnosis of autism (20).
2. Autism Diagnostic Observation Schedule (ADOS): A semi-structured, standardized observation tool which is highly recognized as an evaluative measurement for diagnosing ASD. It includes a number of play-based activities designed to accurately assess and diagnose ASD based on the results found across the areas of communication, social interaction, play/imaginative use of materials, and restricted and repetitive behaviors (21).
3. Autism Diagnostic Interview-Revised (ADI-R): A standardized comprehensive interview which has proven highly useful for diagnosing autism and planning treatment. It provides categorical results for three domains: qualities of reciprocal social interaction; communication and language; and restricted and repetitive, stereotyped interests and behaviors. Together with the ADOS, it is recognized as the current gold standard of ASD diagnosis worldwide (22).
4. Gesell Developmental Schedules (GDS): A measure of child development which is designed to assess a child's neurodevelopmental status on the basis of the development quotient (DQ) scores in 4 domains: adaption, motor, language function, and personal/social function (23).
Blood samples were collected by trained nurses between 7:00 and 9:30 a.m. Parents were previously informed to have their children fast overnight and allowed only a moderate amount of drinking water to minimize the potential effects of food and water intake. Four milliliters of venous blood was collected into chilled EDTA tubes containing aprotinin (500 KIU/mL blood). Blood samples were centrifuged at 1,600 g for 15 min. Plasma was isolated and divided into 500 μL aliquots. The fresh first morning midstream urine was collected in sterile tubes. The samples were placed on ice and immediately frozen into dry ice and transferred to store at −80°C until assay.
For plasma sample extraction, 200 μL of methanol was added to 100 μL of each thawed sample and vortexed for 60 s. The mixture was centrifuged at 12,000 rpm for 10 min at 4°C. For urine sample extraction, 100 μL of ddH2O was added to 100 μL of each thawed sample and vortexed for 5 min. The mixture was centrifuged at 10,000 rpm for 10 min at 4°C. The supernatant was then filtered by 0.22 μm membrane filtration and prepared for LC-MS analysis. To validate the reproducibility of the LC-MS system, 20 μL from prepared samples was pooled to generate the quality control (QC) samples.
Chromatographic separation was accomplished in an Acquity UPLC system equipped with an ACQUITY UPLC® BEH C18 (100 mm × 2.1 mm, 1.7 μm, Waters) column maintained at 40°C. The temperature of the autosampler was 4°C. Gradient elution of analytes was carried out with 0.1% formic acid in water (A) and 0.1% formic acid in acetonitrile (B) at a flow rate of 0.25 mL/min. Ten microliter of each sample was injected after equilibration. An increasing linear gradient of solvent B (v/v) was used as follows: 0~1 min, 2% B; 1~9.5 min, 2~50% B; 9.5~14 min, 50~98% B; 14~15 min, 98% B; 15~15.5 min, 98~2% B; 15.5~17 min, 2% B.
The ESI-MSn experiments were executed on the Thermo LTQOrbitrap XL mass spectrometer with the spray voltage of 4.8 and −4.5 kV in positive and negative modes. Sheath gas and auxiliary gas were set at 45 and 15 arbitrary units. The capillary temperature was 325°C. The voltages of the capillary and tube were 35 and 50, −15 and −50 V in positive and negative modes. The Orbitrap analyzer scanned over a mass range of m/z 50–1,000 for full scan at a mass resolution of 60,000. Data dependent acquisition (DDA) MS/MS experiments were performed with the CID scan. The normalized collision energy was 30 eV. Dynamic exclusion was implemented with a repeat count of 2, and exclusion duration of 15 s.
The initial analysis examined the participant demographics of the two groups with the Statistical Package for the Social Science version 19.0 (SPSS Inc., Chicago, Illinois) and the GraphPad Prism version 5.0 (GraphPad Software Inc., San Diego, CA). Continuous data were checked for normal distribution using the Shapiro–Wilk test first. For normally distributed data, the independent two-sample t-tests were used to compare the means of two groups. For those data that were not normally distributed, non-parametric tests (Mann–Whitney U-test) were used for unpaired comparison between groups.
Urine metabolomic data from UPLC/MS were standardized to eliminate urine volume variability. Multivariate statistics techniques were used to analyze the multiple variables simultaneously in order to extract comprehensive information from the large metabolomics data and to subsequently visualize and interpret it. Comprehensive and integrative metabolomic data was mainly analyzed using metaboanalyst 4.0 (https://www.metaboanalyst.ca/) (24). Metabolomic data was first normalized by a pooled sample from the HC group and then log transformation and auto scaling were used during data processing. Principal component analysis (PCA), which was considered as one of the most widely used unsupervised techniques for the analysis of metabolomics data, was used for an initial exploration of the data mainly to obtain an overview and reveal clustering or patterns in the data (24, 25). Additionally, partial least-squares-discriminant analysis (PLS-DA), which was a typical supervised technique applied to metabolomics data, was used to construct a model which separated the different groups of samples on the basis of their metabolite features (25, 26). The variable importance in the projection (VIP) scores were calculated to reflect the importance of metabolite features in the model, and features with a VIP ≥ 1.0 and p ≤ 0.05 were selected as discriminating metabolites between groups (16, 27). The discriminating metabolites identification and metabolic pathway analysis were carried out using the methods described in previous studies (28, 29). To identify models with good performance, an algorithm based on Monte-Carlo cross validation (MCCV) coupled with the well-established algorithm Support Vector Machine (SVM) were used following the procedure as described in the protocol (14, 24). The discriminatory power was quantified by multivariate receiver operator curve (ROC) analysis calculating the area under the curve (AUC), sensitivity, specificity, and accuracy using the MetaboAnalyst 4.0 (24). A value of p < 0.05 (two-tailed) was considered statistically significant, and for multiple comparisons, the Benjamini–Hochberg procedure was used for controlling the false discovery rate (FDR).
A total of 60 boys (30 in ASD, 30 in HC group) met the inclusion criteria and were enrolled in this study. Most of the participants (98.3%) were Han Chinese, with one health control (1.67%) from Hui Minority living in China. Descriptive statistics for baseline characteristics are presented in Table 1. The two groups were well-matched for chronological age in a relative narrow range (age range: 2.6~6.7 years). The sample size allowed a statistical power of 0.85 for plasma and urine analysis (software G*Power, estimation for Wilcoxon–Mann–Whitney test, two tails, effect size d = 0.8, α = 0.05). All the children in the ASD group completed the CARS and ADOS assessments, and 29 of them completed the ADI-R assessment. Twenty-three autistic children and 22 HC children completed the GDS assessment. As expected, autistic children got significantly lower scores in the GDS than HC children (p < 0.001).
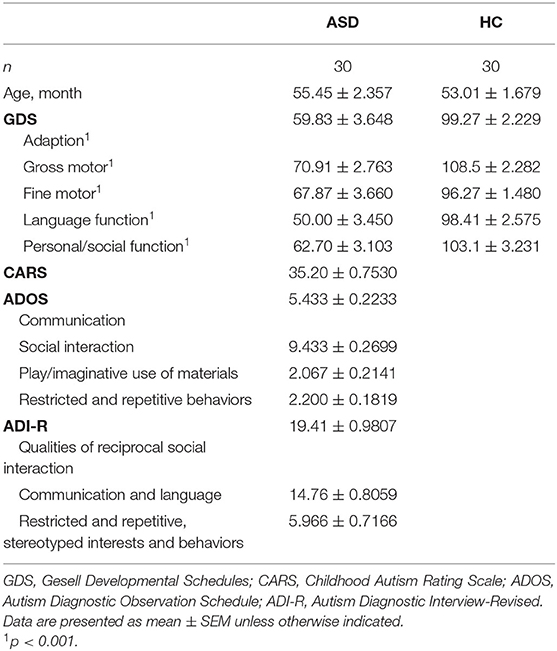
Table 1. Participant demographics.
Plasma and urine metabolic profiling was established in an LC-MS platform to explore metabolic patterns associated with ASD. A total of 2,911 and 3,484 precursor molecules were detected in the positive and negative mode in the plasma samples, and 2,723 and 3,704 precursor molecules were detected in the positive and negative mode in the urine samples, respectively.
As is shown in Figure 1 PCA score plot, when labeling the samples as ASD and HC, no significant patterns of clustering could be detected in either the urine or plasma samples, suggesting that it was not possible to identify a valid separation using this approach. However, it seems that the ASD samples were more concentrated as compare to the scattered pattern of HC samples in plasma.
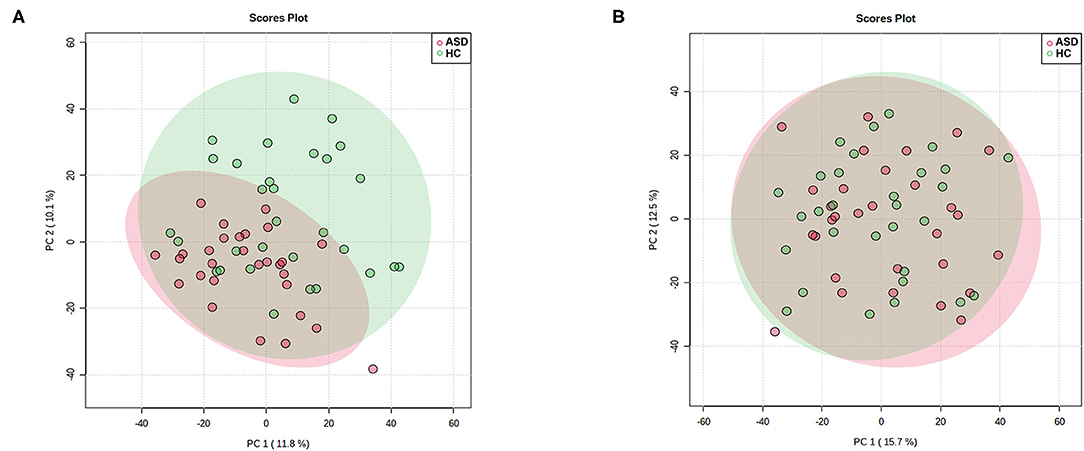
Figure 1. Principal Component Analysis (PCA) score plot in ASD (red) and HC (green) boys. Each point represents the metabolome score of a single individual. (A) Plasma, positive mode; (B) Urine, positive mode. The shaded areas indicate the 95%confidence ellipse regions for each group.
The discriminating metabolites were screened with p ≤ 0.05 and VIP ≥ 1. When comparing the data of the ASD with HC group as detected in the positive mode, it is revealed that levels of 176 metabolites were higher and 50 metabolites were lower in the plasma samples, while levels of 27 and 45 metabolites were shown to be higher and lower in the urine samples (Figure 2A). As demonstrated in Figure 2B, the 2D scores plot constructed using partial least squares discrimination analysis (PLS-DA) with these discriminating metabolites, revealed good separation between ASD and HC groups (R2 = 0.816, Q2 = 0.624, and Accuracy = 0.897).
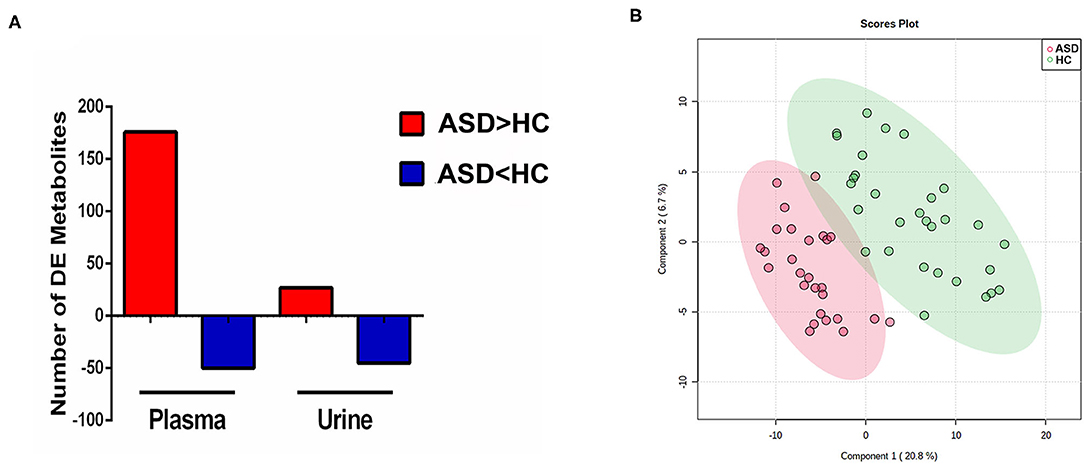
Figure 2. Discriminating metabolites and partial least squares discrimination analysis (PLS-DA). (A) Number of discriminating (DE) metabolites between groups in plasma and urine samples. (B) Partial least squares discrimination analysis (PLS-DA) score plot in ASD (red) and HC (blue) boys. Each point represents the metabolome score of a single individual. The shaded areas indicate the 95%confidence ellipse regions for each group.
A total of 25 and 14 discriminating metabolites were identified in plasma and urine samples, respectively. The Z-scores of the discriminating metabolites associated with ASD were demonstrated in Figure 3. Among them, taurine and catechol were found to be discriminating metabolites in both of the plasma and urine samples. However, levels of taurine and catechol were both found to be higher in plasma samples while lower in urine samples in the ASD as compare to the HC group. The correlation matrices of these discriminating metabolites were demonstrated in Supplementary Figure 1.
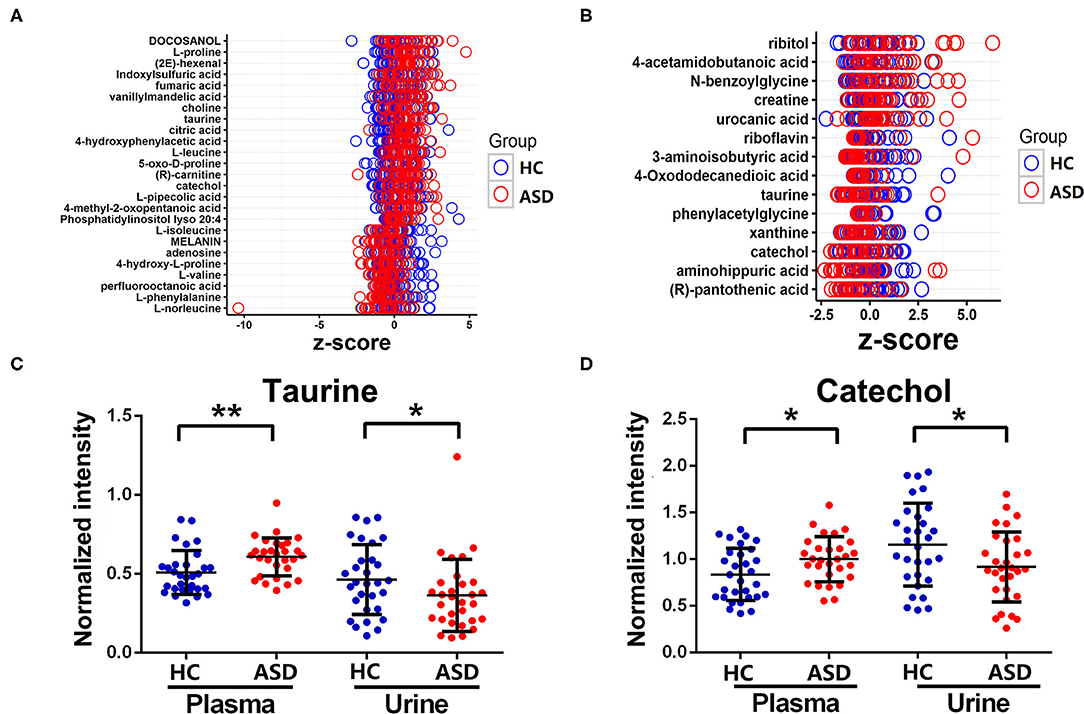
Figure 3. The discriminating metabolites differ between ASD and HC groups. (A,B) Z-scores of the discriminating metabolites were plotted in plasma and urine samples. (C,D) Levels of taurine and catechol in plasma and urine samples. Data are presented as mean ± SD, *p < 0.05, **p < 0.01.
The algorithm of SVM was used to perform potential biomarker analysis together with MCCV through balanced subsampling to identify models with good performance. Based on the cross validation, the multivariate biomarker models using 10 discriminating metabolites achieved an AUC of 0.852 (Figure 4A) with sensitivity of 0.833, specificity of 0.800 and accuracy of 0.817 (Supplementary Table 1). The top 10 significant metabolites ranked based on their frequencies of being selected during cross validation in the models are listed in Figure 4B.
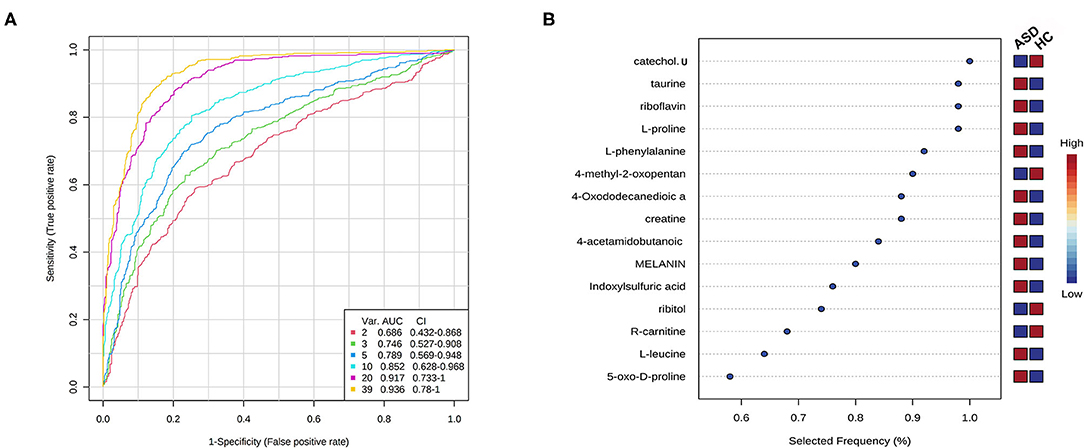
Figure 4. Potential biomarker analysis using SVM algorithm. (A) ROC curves from different biomarker models using different numbers of features. (B) The top 10 significant metabolites ranked based on their frequencies of being selected during cross validation.
To identify the metabolic pathways associated with ASD, the discriminating metabolites were introduced in the pathways enrichment analysis. Results of the enriched pathway analysis using data from plasma samples revealed that the most perturbed metabolic pathway in ASD mainly corresponded to taurine and hypotaurine metabolism, phenylalanine metabolism, arginine and proline metabolism, valine, leucine and isoleucine biosynthesis and degradation. While the metabolic pathways corresponding to taurine and hypotaurine metabolism, pantothenate and CoA biosynthesis, riboflavin metabolism, phenylalanine metabolism, and arginine and proline metabolism were revealed to be perturbed in the ASD urine samples (Figure 5). The key enriched metabolic pathways implicated in ASD are summarized in Figure 6.
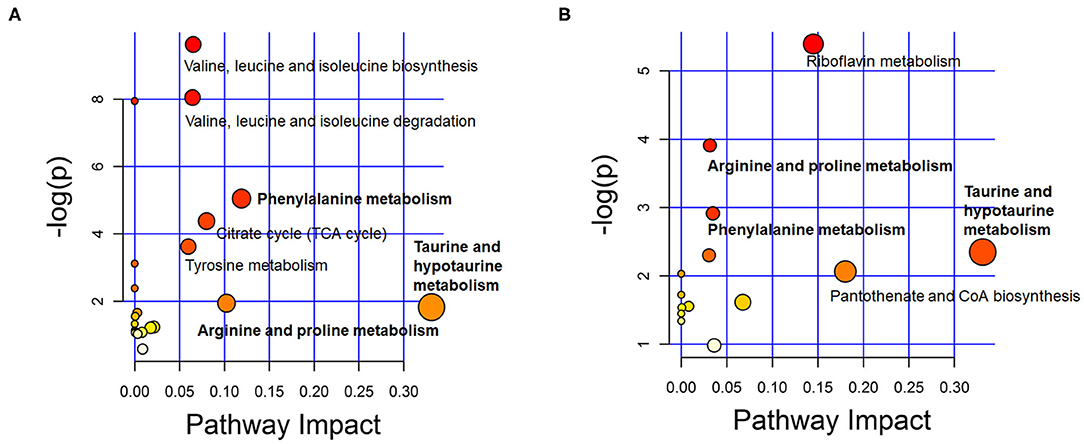
Figure 5. Overview of metabolic pathway analysis plot with MetPA in plasma (A) and urine (B). Color intensity (white to red) reflects increasing statistical significance, while circle diameter covaries with pathway impact.
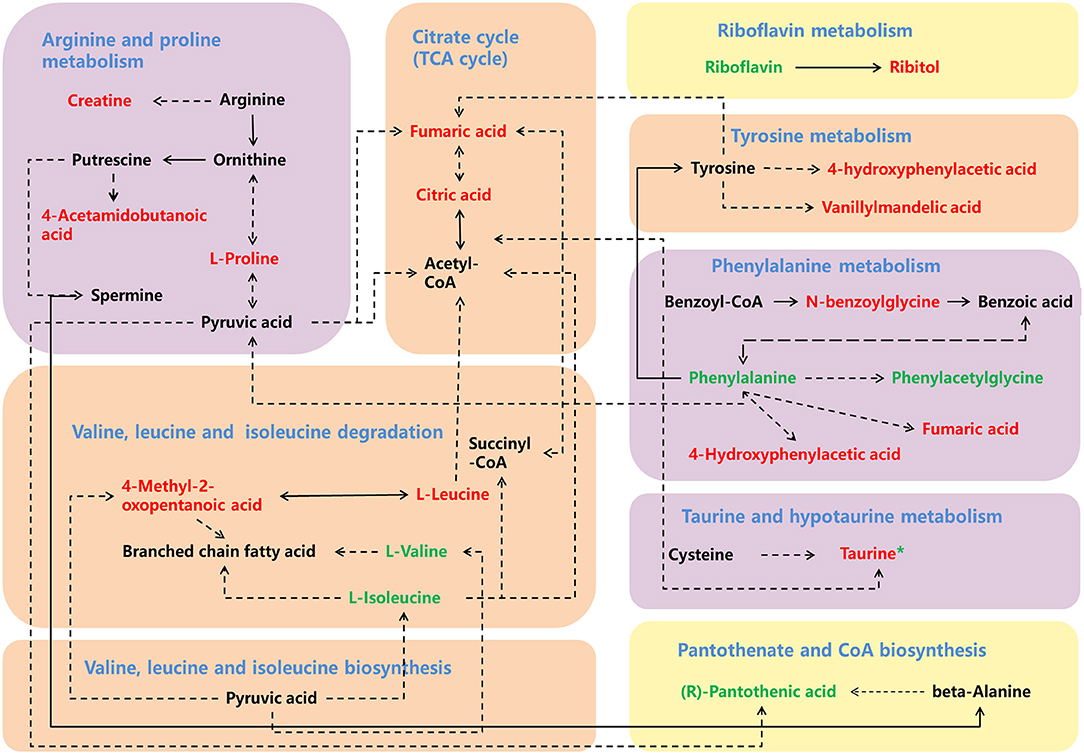
Figure 6. A schema showing the key enriched metabolic pathways implicated in ASD. The increased discriminating metabolites are labeled in red, and decreased discriminating metabolites are labeled in green, while the green * labeled taurine indicates its decreased level in urine. The yellow, orange, and purple backgrounds indicate enriched metabolic pathways in urine, plasma and both urine and plasma samples.
Metabolomics is the study of substrates and products of metabolism, which provides a tool to compare the profiles of small-molecule metabolites and identify their perturbations in metabolic pathways (30, 31). In the present study, levels of 176 and 27 metabolites were found to be higher, while 50 and 45 metabolites were lower in the positive mode in the plasma and urine samples of the ASD children, respectively. Notably, taurine and catechol levels were decreased in urine but increased in plasma in the same cohort of ASD children as compared to HC children. Results of the enriched pathway analysis using discriminating metabolites revealed that the most perturbed metabolic pathway in ASD mainly correspond to taurine and hypotaurine metabolism, phenylalanine metabolism, arginine and proline metabolism, pantothenate and CoA biosynthesis, and riboflavin metabolism.
Since metabolite profiling is sensitive to both genetic and environmental factors, it is considered as a powerful investigative approach with immense biomedical potential which could provide a multifactorial overview of an individual's status (32). Meanwhile, because it is sensitive to many influence factors, it is of great importance to control these confounders, such as age, gender, dietary status and drug intake (33–36). In this study, we strictly controlled these potential confounders to explore meaningful metabolic changes associated with ASD. As a dimensionality-reduction technique, PCA provided a full picture overview of the metabolic characters without artificial interference (24, 25). It seems that the ASD group largely overlapped with HC groups, especially in urine samples. But compared with the scattered distribution pattern in urine samples, the plasma samples of ASD only overlapped with part of the HC group, which suggested that compared with the diversity found in the HC group, children in the ASD group may share more similarities in metabolic patterns. And further analysis of these alterations in metabolic patterns will provide important information for the understanding of the pathogenesis of ASD. Additionally, more discriminating metabolites could be found in plasma than in urine. A relative good separation between the ASD and HC groups was achieved using PLS-DA with these discriminating metabolites. However, as a supervised classification method, the PLS-DA model may be over-fitting to some extent (37).
When comparing the results of the metabolic perturbations in plasma and urine associated with ASD, we found that two discriminating metabolites (taurine and catechol) were identified in both of the plasma and urine samples. As one of the most common amino acids in the brain, taurine can act as a neuromodulator to regulate the balance of excitatory and inhibitory neuronal activity (38, 39). Additionally, it has also been suggested that taurine has many positive effects such as an antioxidant, anti-inflammatory, gut-regulatory and immune modulator which may alleviate some symptoms associated with ASD (38, 40–42). Perturbed taurine levels have been found to be associated with ASD in a number of previous studies (43–48). However, findings regarding the plasma and urine levels of taurine are controversial (40, 43–50). Our results demonstrated that taurine levels were decreased in urine but increased in plasma in ASD children, which is consistent with some of the previous studies (43, 44, 46, 48). The opposite trend found in the urine and plasma samples from ASD children in the same cohort indicated that levels of taurine in the urine and plasma were not parallel, which suggest that the altered metabolic patterns associated with ASD are very complex, and levels of some metabolites in urine may not mirror their levels in plasma. So we cannot infer ASD children are lack of some nutrient substances only based on the lower levels of related metabolites found in urine samples. The importance to have a detailed analysis of the metabolites in different biological samples should be emphasized. Moreover, although there is a consistent opinion that taurine plays a protective role in ASD, and it has been proposed that the elevated plasma taurine levels found in ASD is compensatory against pathogenesis of ASD (such as oxidative stress) (48, 51, 52), the biological significance of taurine in pathogenesis of ASD still needs to be further studied.
Catechol, also known as pyrocatechol and 1,2-dihydroxybenzene, is a naturally occurring and an important industrial chemical (53). Metabolism of catechol involves several enzymes including Catechol-O-methyltransferase (COMT), which catalyzes the O-methylation of various endogenous and exogenous catecholic substrates (54, 55). It has been suggested that altered methylation metabolism of endogenous catechols due to COMT polymorphism may be a risk factor for the development of certain neurodegenerative disorders, as well as ASD (55–59). Additionally, this catechol-metabolizing system may be affected by exogenous factors such as catechol-containing polyphenols, which provide a feedback inhibition of methylation of endogenous catechols in vivo (54, 60). For example, the large amount of dietary catechol and catecholic polyphenols in organ oil or tea may collectively inhibit the methylation of endogenous bioactive catechols (54, 60, 61). Moreover, there is an emerging body of evidences demonstrating alterations in the gut microbiota composition between children with ASD and controls (62–64). Changes of catechol levels may also be related to alterations in gut microbiota, since gut microorganisms play critical roles in the production of catecholic substrates in gut lumen (65, 66), and these biologically active catecholic substrates may also affect the growth rates of some pathogenic bacteria (67, 68). Endogenous catechols in plasma were found to be abnormal in some autistic individuals and levels of catechols and their metabolites were found to be decreased in urine samples in ASD (59, 69). However, only plasma or urine samples were collected and measured in these previous studies. It is noteworthy that the decrease in urine catecholic substrate might accompany an increase in plasma, as observed in another study that simultaneously measured both plasma and urine samples from patients diagnosed with Alzheimer's disease (70). In this study, levels of catechol as well as taurine were also found lower in urine but higher in plasma in the same cohort of ASD children. As suggested by Fonteh et al. (70), the opposite trend in plasma and urine may be related to the facts that plasma contents are regulated by metabolic processes controlling the absorption, transport, degradation, and excretion of these molecules, while concentrations in urine will be influenced by the rate of excretion and reabsorption of these molecules. Certainly, further studies are required to determine the mechanisms behind these phenomena. High levels of catechol and its related metabolites could affect the activity of neurons and were found to be associated with behavior disturbances in ASD and other neuropsychiatric disorders (71–73). In this study, the higher levels in plasma in the ASD group indicated that catechol may cause some adverse health effects. Further studies are necessary to clarify the biological role of catechol in ASD.
Although different discriminating metabolites were found in plasma and urine samples, results of the metabolic pathway analysis revealed that perturbations in pathways corresponding to taurine and hypotaurine metabolism, phenylalanine metabolism and arginine and proline metabolism could be found in both of the plasma and urine samples. The association of ASD and phenylketonuria (PKU), a disease induced by deficiency in the metabolism of phenylalanine, has been well-documented, and children with PKU often show some autistic-like behavior (74–76). Significant differences in urine and plasma levels of phenylalanine have also been found to be associated with ASD in several independent previously published studies (9, 77–82), although some of these results were contradictory, all their data points to the perturbation of phenylalanine metabolism in ASD. Our results further confirmed this association, as perturbed phenylalanine metabolism in ASD was found in both of the metabolic pathway analysis results from the urine and plasma samples. Further studies are warranted to assess the diagnostic value of perturbation in the phenylalanine metabolism, as well as its therapeutic potential (83).
For the arginine and proline metabolism, decreased renal clearance of arginine has been found in ASD which indicated increased arginine transporter activity, and results of research on velocardiofacial (22q11.2 deletion) syndrome suggest that individuals with elevated plasma proline levels and the COMTMET genotype were more likely to present with severe autism symptomatology (84). It has been suggested that proline plays a role in the modulation of brain function including its regulation of the basal function of some glutamate synapses, and abnormally elevated levels of proline in plasma were found to be associated with higher incidence of seizures and intellectual disability in hyperprolinemias, which may be related to a proline-induced reduction in glutamate release (85–87). Reduced glutamate release of the cerebral cortex has been found in the mouse model of ASD (88, 89) and abnormal glutamate concentrations in the brain have also been reported in individuals with ASD (90, 91).
The strength of our study includes: (1) To our knowledge, this is the first study to collectively analyze the untargeted metabolic profiles from both of the plasma and urine samples obtained at the same time point from the same cohort of ASD children, which gave us the opportunity to see a more comprehensive picture of the full metabolic status associated with ASD; (2) Diagnosis of ASD was not only made according to the DSM-IV criteria, but also confirmed with ADOS and ADI-R, which were considered as the gold standard; (3) The participants involved in this study were only boys and were tightly matched in a relatively narrow age range to minimize the potential confounding effects associated with gender and age. However, as a preliminary study, there are also several limitations which ought to be mentioned: (1) The sample size in this study is relatively small, which may decrease the statistical power; (2) There was no validation group in this study to test the results in an independent cohort; (3) Participants in this study were mainly from north China and most of them were from the Han population, and the narrow age range may affect the external validation of the results; (4) Although all the samples were collected after an overnight fasting to minimize the potential effects of food and water intake, variations in children's recent dietary preferences were not strictly controlled in this study. These limitations should be considered when data are interpreted.
These preliminary results, despite the sample size, identified substantial biochemical differences and several metabolic pathways associated with ASD, which may improve our understanding of the biochemical mechanisms of ASD. Further targeted analyses in a larger cohort are needed to validate these preliminary results in this study. Additionally, the ROC curve results have the potential to contribute to the diagnosis of ASD, but merit further investigations in larger cohorts especially among other developmental disorders to assess its specificity and to screen for potential ASD-specific biomarkers. And results from these studies, together with other systems biology approaches such as transcriptomics would also provide new clues for the individualized biomedical treatment for ASD.
In summary, results of the present study suggest that a series of common perturbations in the metabolic profile may exist in children with ASD, which are possibly associated with genetic or epigenetic variations in metabolic enzymes, gastrointestinal dysfunctions, and nutrient deficiency. It also highlights the importance of having a comprehensive analysis of the metabolites in different biological samples to reveal the full picture of the complex metabolic patterns associated with ASD. These results and further related studies would provide new clues for study of the mechanism and systemic biomedical treatment for ASD.
The raw data supporting the conclusions of this article will be made available by the authors, without undue reservation.
The studies involving human participants were reviewed and approved by Peking University Institutional Review Board. Written informed consent to participate in this study was provided by the participants' legal guardian/next of kin.
X-JX, XY, and RZ: conceptualization. X-JX, F-CM, T-JS, and BL: methodology. X-EC and BL: validation. X-JX, JW, and X-EC: formal analysis. XJ-X, X-EC, F-CM, and X-XW: investigation. X-JX and BL: writing—original draft preparation. Y-ZW, JW, and RZ: writing—review and editing. Y-ZW and F-JZ: visualization. XY and RZ: supervision. X-JX and RZ: project administration and funding acquisition. All authors contributed to and approved the final manuscript.
This research was funded by the Key Realm R&D Program of Guangdong Province (2019B030335001), the National Natural Science Foundation of China (81601196), and grants from Beijing Municipal Science and Technology Commission (Z181100001518005) and the National Basic Research Program of China (2017YFA0105201).
The authors declare that the research was conducted in the absence of any commercial or financial relationships that could be construed as a potential conflict of interest.
We thank all the autistic and typically developing children and their families who participant in this study.
The Supplementary Material for this article can be found online at: https://www.frontiersin.org/articles/10.3389/fpsyt.2021.657105/full#supplementary-material
ADI-R, Autism Diagnostic Interview-Revised; ADOS, Autism Diagnostic Observation Schedule; ASD, Autism spectrum disorder; AUC, Area under curve; CARS, Childhood Autism Rating Scale; DDA, Data dependent acquisition; FDR, False discovery rate; GC-MS, Gas chromatography-mass spectrometry; GDS, Gesell Developmental Schedules; HC, Healthy control; LC-MS, Liquid chromatography-mass spectrometry; MCCV, Monte-Carlo cross validation; NMR, Nuclear magnetic resonance; PCA, Principal component analysis; PKU, Phenylketonuria; PLS-DA, Partial least squares discrimination analysis; ROC, Receiver operating characteristic; SVM, Support Vector Machine; UPLC, Ultra performance liquid chromatography; VIP, Variable importance in the projection.
1. Burns CO, Matson JL. An evaluation of the clinical application of the DSM-5 for the diagnosis of autism spectrum disorder. Expert Rev Neurother. (2017) 17:909–17. doi: 10.1080/14737175.2017.1351301
2. Hallmayer J, Cleveland S, Torres A, Phillips J, Cohen B, Torigoe T, et al. Genetic heritability and shared environmental factors among twin pairs with autism. Arch Gen Psychiatry. (2011) 68:1095–102. doi: 10.1001/archgenpsychiatry.2011.76
3. Waye MMY, Cheng HY. Genetics and epigenetics of autism: a review. Psychiatry Clin Neurosci. (2018) 72:228–44. doi: 10.1111/pcn.12606
4. Bai D, Yip BHK, Windham GC, Sourander A, Francis R, Yoffe R, et al. Association of genetic and environmental factors with autism in a 5-country cohort. JAMA Psychiatry. (2019) 76:1035–43. doi: 10.1001/jamapsychiatry.2019.1411
5. Lai MC, Lombardo MV, Baron-Cohen S. Autism. Lancet. (2014) 383:896–910. doi: 10.1016/S0140-6736(13)61539-1
6. McCarty P, Frye RE. Early detection and diagnosis of autism spectrum disorder: why is it so difficult? Semin Pediatr Neurol. (2020) 35:100831. doi: 10.1016/j.spen.2020.100831
7. Rangel-Huerta OD, Gomez-Fernández A, de la Torre-Aguilar MJ, Gil A, Perez-Navero JL, Flores-Rojas K, et al. Metabolic profiling in children with autism spectrum disorder with and without mental regression: preliminary results from a cross-sectional case-control study. Metabolomics. (2019) 15:99. doi: 10.1007/s11306-019-1562-x
8. Cozzolino R, De Magistris L, Saggese P, Stocchero M, Martignetti A, Di Stasio M, et al. Use of solid-phase microextraction coupled to gas chromatography-mass spectrometry for determination of urinary volatile organic compounds in autistic children compared with healthy controls. Anal Bioanal Chem. (2014) 406:4649–62. doi: 10.1007/s00216-014-7855-z
9. Noto A, Fanos V, Barberini L, Grapov D, Fattuoni C, Zaffanello M, et al. The urinary metabolomics profile of an Italian autistic children population and their unaffected siblings. J Matern Neonatal Med. (2014) 27:46–52. doi: 10.3109/14767058.2014.954784
10. Yap IKS, Angley M, Veselkov KA, Holmes E, Lindon JC, Nicholson JK. Urinary metabolic phenotyping differentiates children with autism from their unaffected siblings and age-matched controls. J Proteome Res. (2010) 9:2996–3004. doi: 10.1021/pr901188e
11. Ming X, Stein TP, Barnes V, Rhodes N, Guo L. Metabolic perturbance in autism spectrum disorders: a metabolomics study. J Proteome Res. (2012) 11:5856–62. doi: 10.1021/pr300910n
12. Mavel S, Nadal-Desbarats L, Blasco H, Bonnet-Brilhault F, Barthélémy C, Montigny F, et al. 1H-13C NMR-based urine metabolic profiling in autism spectrum disorders. Talanta. (2013) 114:95–102. doi: 10.1016/j.talanta.2013.03.064
13. Gevi F, Zolla L, Gabriele S, Persico AM. Urinary metabolomics of young Italian autistic children supports abnormal tryptophan and purine metabolism. Mol Autism. (2016) 7:47. doi: 10.1186/s13229-016-0109-5
14. West PR, Amaral DG, Bais P, Smith AM, Egnash LA, Ross ME, et al. Metabolomics as a tool for discovery of biomarkers of autism spectrum disorder in the blood plasma of children. PLoS One. (2014) 9:e112445. doi: 10.1371/journal.pone.0112445
15. Orozco JS, Hertz-Picciotto I, Abbeduto L, Slupsky CM. Metabolomics analysis of children with autism, idiopathic-developmental delays, and Down syndrome. Transl Psychiatry. (2019) 9:243. doi: 10.1038/s41398-019-0578-3
16. Wang H, Liang S, Wang M, Gao J, Sun C, Wang J, et al. Potential serum biomarkers from a metabolomics study of autism. J Psychiatry Neurosci. (2016) 41:27–37. doi: 10.1503/jpn.140009
17. Ferri SL, Abel T, Brodkin ES. Sex differences in autism spectrum disorder: a review. Curr Psychiatry Rep. (2018) 20:9. doi: 10.1007/s11920-018-0874-2
18. May T, Adesina I, McGillivray J, Rinehart NJ. Sex differences in neurodevelopmental disorders. Curr Opin Neurol. (2019) 32:622–6. doi: 10.1097/WCO.0000000000000714
19. Lai MC, Lombardo MV, Auyeung B, Chakrabarti B, Baron-Cohen S. Sex/gender differences and autism: setting the scene for future research. J Am Acad Child Adolesc Psychiatry. (2015) 54:11–24. doi: 10.1016/j.jaac.2014.10.003
20. Rellini E, Tortolani D, Trillo S, Carbone S, Montecchi F. Childhood Autism Rating Scale (CARS) and Autism Behavior Checklist (ABC) correspondence and conflicts with DSM-IV criteria in diagnosis of autism. J Autism Dev Disord. (2004) 34:703–8. doi: 10.1007/s10803-004-5290-2
21. González MC, Vásquez M, Hernández-Chávez M. Autism spectrum disorder: clinical diagnosis and ADOS test. Rev Chil Pediatr. (2019) 90:485–91. doi: 10.32641/rchped.v90i5.872
22. Zander E, Willfors C, Berggren S, Coco C, Holm A, Jifält I, et al. The interrater reliability of the Autism Diagnostic Interview-Revised (ADI-R) in clinical settings. Psychopathology. (2017) 50:219–27. doi: 10.1159/000474949
23. Ball RS. The Gesell developmental schedules: Arnold Gesell (1880-1961). J Abnorm Child Psychol. (1977) 5:233–9. doi: 10.1007/BF00913694
24. Chong J, Xia J. Using MetaboAnalyst 4.0 for Metabolomics data analysis, interpretation, and integration with other omics data. Methods Mol Biol. (2020) 2104:337–60. doi: 10.1007/978-1-0716-0239-3_17
25. Want E, Masson P. Processing and analysis of GC/LC-MS-based metabolomics data. Methods Mol Biol. (2011) 708:277–98. doi: 10.1007/978-1-61737-985-7_17
26. Barker M, Rayens W. Partial least squares for discrimination. J Chemom. (2003) 166–73. doi: 10.1002/cem.785
27. Zhang T, Wu X, Yin M, Fan L, Zhang H, Zhao F, et al. Discrimination between malignant and benign ovarian tumors by plasma metabolomic profiling using ultra performance liquid chromatography/mass spectrometry. Clin Chim Acta. (2012) 413:861–8. doi: 10.1016/j.cca.2012.01.026
28. Liu L, Wang M, Yang X, Bi M, Na L, Niu Y, et al. Fasting serum lipid and dehydroepiandrosterone sulfate as important metabolites for detecting isolated postchallenge diabetes: serum metabolomics via ultra-high-performance LC-MS. Clin Chem. (2013) 59:1338–48. doi: 10.1373/clinchem.2012.200527
29. Cao J, Mi Y, Shi C, Bian Y, Huang C, Ye Z, et al. First-line anti-tuberculosis drugs induce hepatotoxicity: a novel mechanism based on a urinary metabolomics platform. Biochem Biophys Res Commun. (2018) 497:485–91. doi: 10.1016/j.bbrc.2018.02.030
30. Johnson CH, Ivanisevic J, Siuzdak G. Metabolomics: beyond biomarkers and towards mechanisms. Nat Rev Mol Cell Biol. (2016) 17:451–9. doi: 10.1038/nrm.2016.25
31. Wishart DS. Metabolomics for investigating physiological and pathophysiological processes. Physiol Rev. (2019) 99:1819–75. doi: 10.1152/physrev.00035.2018
32. Clayton TA. Metabolic differences underlying two distinct rat urinary phenotypes, a suggested role for gut microbial metabolism of phenylalanine and a possible connection to autism. FEBS Lett. (2012) 586:956–61. doi: 10.1016/j.febslet.2012.01.049
33. Gu H, Pan Z, Xi B, Hainline BE, Shanaiah N, Asiago V, Gowda GAN, et al. 1H NMR metabolomics study of age profiling in children. NMR Biomed. (2009) 22:826–33. doi: 10.1002/nbm.1395
34. Low DY, Lefèvre-Arbogast S, González-Domínguez R, Urpi-Sarda M, Micheau P, Petera M, et al. Diet-related metabolites associated with cognitive decline revealed by untargeted metabolomics in a prospective cohort. Mol Nutr Food Res. (2019) 63:e1900177. doi: 10.1002/mnfr.201900177
35. Pinu FR, Goldansaz SA, Jaine J. Translational metabolomics: current challenges and future opportunities. Metabolites. (2019) 9:108. doi: 10.3390/metabo9060108
36. Guasch-Ferre M, Bhupathiraju SN, Hu FB. Use of metabolomics in improving assessment of dietary intake. Clin Chem. (2018) 64:82–98. doi: 10.1373/clinchem.2017.272344
37. Westerhuis JA, Hoefsloot HCJ, Smit S, Vis DJ, Smilde AK, Velzen EJJ, et al. Assessment of PLSDA cross validation. Metabolomics. (2008) 4:81–9. doi: 10.1007/s11306-007-0099-6
38. El Idrissi A. Taurine regulation of neuroendocrine function. Adv Exp Med Biol. (2019) 1155:977–85. doi: 10.1007/978-981-13-8023-5_81
39. Oja SS, Saransaari P. Significance of taurine in the brain. Adv Exp Med Biol. (2017) 975:89–94. doi: 10.1007/978-94-024-1079-2_8
40. Park E, Cohen I, Gonzalez M, Castellano MR, Flory M, Jenkins EC, et al. Is taurine a biomarker in autistic spectrum disorder? Adv Exp Med Biol. (2017) 975:3–16. doi: 10.1007/978-94-024-1079-2_1
41. Wu G. Important roles of dietary taurine, creatine, carnosine, anserine and 4-hydroxyproline in human nutrition and health. Amino Acids. (2020) 52:329–60. doi: 10.1007/s00726-020-02823-6
42. Schuller-Levis GB, Park E. Taurine and its chloramine: modulators of immunity. Neurochem Res. (2004) 29:117–26. doi: 10.1023/B:NERE.0000010440.37629.17
43. Moreno-Fuenmayor H, Borjas L, Arrieta A, Valera V, Socorro-Candanoza L. Plasma excitatory amino acids in autism. Invest Clin. (1996) 37:113–28.
44. Moreno H, Borjas L, Arrieta A, Sáez L, Prassad A, Estévez J, et al. Clinical heterogeneity of the autistic syndrome: a study of 60 families. Invest Clin. (1992) 33:13–31.
45. Tu WJ, Chen H, He J. Application of LC-MS/MS analysis of plasma amino acids profiles in children with autism. J Clin Biochem Nutr. (2012) 51:248–9. doi: 10.3164/jcbn.12-45
46. Shimmura C, Suda S, Tsuchiya KJ, Hashimoto K, Ohno K, Matsuzaki H, et al. Alteration of plasma glutamate and glutamine levels in children with high-functioning autism. PLoS One. (2011) 6:e25340. doi: 10.1371/journal.pone.0025340
47. Geier DA, Kern JK, Garver CR, Adams JB, Audhya T, Geier MR. A prospective study of transsulfuration biomarkers in autistic disorders. Neurochem Res. (2009) 34:386–93. doi: 10.1007/s11064-008-9782-x
48. Kuwabara H, Yamasue H, Koike S, Inoue H, Kawakubo Y, Kuroda M, et al. Altered metabolites in the plasma of autism spectrum disorder: a capillary electrophoresis time-of-flight mass spectroscopy study. PLoS One. (2013) 8:e73814. doi: 10.1371/journal.pone.0073814
49. Arnold GL, Hyman SL, Mooney RA, Kirby RS. Plasma amino acids profiles in children with autism: potential risk of nutritional deficiencies. J Autism Dev Disord. (2003) 33:449–54. doi: 10.1023/A:1025071014191
50. Aldred S, Moore KM, Fitzgerald M, Waring RH. Plasma amino acid levels in children with autism and their families. J Autism Dev Disord. (2003) 33:93–7. doi: 10.1023/A:1022238706604
51. Zheng HF, Wang WQ, Li XM, Rauw G, Baker GB. Body fluid levels of neuroactive amino acids in autism spectrum disorders: a review of the literature. Amino Acids. (2017) 49:57–65. doi: 10.1007/s00726-016-2332-y
52. Good P. Do salt cravings in children with autistic disorders reveal low blood sodium depleting brain taurine and glutamine? Med Hypotheses. (2011) 77:1015–21. doi: 10.1016/j.mehy.2011.08.038
53. National Center for Biotechnology Information. PubChem Compound Summary for CID 289, Catechol. (2021). Available online at: https://pubchem.ncbi.nlm.nih.gov/compound/Catechol
54. Bai HW, Shim JY, Yu J, Bao TZ. Biochemical and molecular modeling studies of the O-methylation of various endogenous and exogenous catechol substrates catalyzed by recombinant human soluble and membrane-bound catechol-O-methyltransferases. Chem Res Toxicol. (2007) 20:1409–25. doi: 10.1021/tx700174w
55. Zhu B. Catechol-O-Methyltransferase (COMT)-mediated methylation metabolism of endogenous bioactive catechols and modulation by endobiotics and xenobiotics: importance in pathophysiology and pathogenesis. Curr Drug Metab. (2005) 3:321–49. doi: 10.2174/1389200023337586
56. Wang Y-C, Zou Y-B, Xiao J, Pan C-D, Jiang S-D, Zheng Z-J, et al. COMT Val158Met polymorphism and Parkinson's disease risk: a pooled analysis in different populations. Neurol Res. (2019) 41:319–25. doi: 10.1080/01616412.2018.1564183
57. Guo T, Wang W, Liu B, Chen H, Yang C. Catechol-O-methyltransferase Val158Met polymorphism and risk of autism spectrum disorders. J Int Med Res. (2013) 41:725–34. doi: 10.1177/0300060513479871
58. Gadow KD, Roohi J, Devincent CJ, Kirsch S, Hatchwell E. Association of COMT (Val158Met) and BDNF (Val66Met) gene polymorphisms with anxiety, ADHD and tics in children with autism spectrum disorder. J Autism Dev Disord. (2009) 39:1542–51. doi: 10.1007/s10803-009-0794-4
59. Esmaiel NN, Ashaat EA, Mosaad R, Fayez A, Ibrahim M, Abdallah ZY, et al. The potential impact of COMT gene variants on dopamine regulation and phenotypic traits of ASD patients. Behav Brain Res. (2020) 378:112272. doi: 10.1016/j.bbr.2019.112272
60. Kang KS, Yamabe N, Wen Y, Fukui M, Zhu BT. Beneficial effects of natural phenolics on levodopa methylation and oxidative neurodegeneration. Brain Res. (2013) 1497:1–14. doi: 10.1016/j.brainres.2012.11.043
61. Rojas LB, Quideau S, Pardon P, Charrouf Z. Colorimetric evaluation of phenolic content and GC-MS characterization of phenolic composition of alimentary and cosmetic argan oil and press cake. J Agric Food Chem. (2005) 53:9122–7. doi: 10.1021/jf051082j
62. Ding HT, Taur Y, Walkup JT. Gut microbiota and autism: key concepts and findings. J Autism Dev Disord. (2017) 47:480–89. doi: 10.1007/s10803-016-2960-9
63. Mangiola F, Ianiro G, Franceschi F, Fagiuoli S, Gasbarrini G, Gasbarrini A. Gut microbiota in autism and mood disorders. World J Gastroenterol. (2016) 22:361–8. doi: 10.3748/wjg.v22.i1.361
64. Fattorusso A, Di Genova L, Dell'isola GB, Mencaroni E, Esposito S. Autism spectrum disorders and the gut microbiota. Nutrients. (2019) 11:521. doi: 10.3390/nu11030521
65. Asano Y, Hiramoto T, Nishino R, Aiba Y, Kimura T, Yoshihara K, et al. Critical role of gut microbiota in the production of biologically active, free catecholamines in the gut lumen of mice. Am J Physiol Gastrointest Liver Physiol. (2012) 303:G1288–95. doi: 10.1152/ajpgi.00341.2012
66. Strandwitz P. Neurotransmitter modulation by the gut microbiota. Brain Res. (2018) 1693:128–33. doi: 10.1016/j.brainres.2018.03.015
67. Freestone PP, Williams PH, Haigh RD, Maggs AF, Neal CP, Lyte M. Growth stimulation of intestinal commensal Escherichia coli by catecholamines: a possible contributory factor in trauma-induced sepsis. Shock. (2002) 18:465–70. doi: 10.1097/00024382-200211000-00014
68. O'Donnell PM, Aviles H, Lyte M, Sonnenfeld G. Enhancement of in vitro growth of pathogenic bacteria by norepinephrine: importance of inoculum density and role of transferrin. Appl Environ Microbiol. (2006) 72:5097–9. doi: 10.1128/AEM.00075-06
69. Martineau J, Barthélémy C, Jouve J, Muh J-P, LeLord G. Monoamines (serotonin and catecholamines) and their derivatives in infantile autism: age-related changes and drug effects. Dev Med Child Neurol. (1992) 34:593–603. doi: 10.1111/j.1469-8749.1992.tb11490.x
70. Fonteh AN, Harrington RJ, Tsai A, Liao P, Harrington MG. Free amino acid and dipeptide changes in the body fluids from Alzheimer's disease subjects. Amino Acids. (2007) 32:213–24. doi: 10.1007/s00726-006-0409-8
71. Ito I, Maeno T. Catechol: a potent and specific inhibitor of the fast potassium channel in frog primary afferent neurones. J Physiol. (1986) 373:115–27. doi: 10.1113/jphysiol.1986.sp016038
72. Goldstein DS, Cheshire WP. Roles of catechol neurochemistry in autonomic function testing. Clin Auton Res. (2018) 28:273–88. doi: 10.1007/s10286-018-0528-9
73. Misiak B, Stramecki F, Gaweda Ł, Prochwicz K, Sasiadek MM, Moustafa AA, et al. Interactions between variation in candidate genes and environmental factors in the etiology of schizophrenia and bipolar disorder: a systematic review. Mol Neurobiol. (2018) 55:5075–100. doi: 10.1007/s12035-017-0708-y
74. Blau N, Van Spronsen FJ, Levy HL. Phenylketonuria. Lancet. (2010) 376:1417–27. doi: 10.1016/S0140-6736(10)60961-0
75. Mazlum B, Anlar B, Kalkanoglu-Sivri HS, Karli-Oguz K, Özusta S, Ünal F. A late-diagnosed phenylketonuria case presenting with autism spectrum disorder in early childhood. Turk J Pediatr. (2016) 58:318–22. doi: 10.24953/turkjped.2016.03.016
76. De Jaco A, Mango D, De Angelis F, Favaloro FL, Andolina D, Nisticò R, et al. Unbalance between excitation and inhibition in phenylketonuria, a genetic metabolic disease associated with autism. Int J Mol Sci. (2017) 18:941. doi: 10.3390/ijms18050941
77. Li C, Shen K, Chu L, Liu P, Song Y, Kang X. Decreased levels of urinary free amino acids in children with autism spectrum disorder. J Clin Neurosci. (2018) 54:45–9. doi: 10.1016/j.jocn.2018.05.001
78. Zavala De Ferrer M, Castejón HV, Ortega PA, Castejón OJ, Marcano De Hidalgo A, Montiel N. Imbalance of plasma amino acids in patients with autism and subjects with attention deficit/hyperactivity disorder. Rev Neurol. (2001) 33:401–8. doi: 10.33588/rn.3305.2001093
79. Bala KA, Dogan M, Mutluer T, Kaba S, Aslan O, Balahoroglu R, et al. Plasma amino acid profile in autism spectrum disorder (ASD). Eur Rev Med Pharmacol Sci. (2016) 20:923–9. Available online at: https://www.europeanreview.org/wp/wp-content/uploads/923-929.pdf
80. Bugajska J, Berska J, Wojtyto T, Bik-Multanowski M, Sztefko K. The amino acid profile in blood plasma of young boys with autism. Psychiatr Pol. (2017) 51:359–68. doi: 10.12740/PP/65046
81. Shaw W. Increased urinary excretion of a 3-(3-hydroxyphenyl)- 3-hydroxypropionic acid (HPHPA),an abnormal phenylalanine metabolite of Clostridia spp. in the gastrointestinal tract, in urine samples from patients with autism and schizophrenia. Nutr Neurosci. (2010) 13:135–43. doi: 10.1179/147683010X12611460763968
82. Naushad SM, Jain JMN, Prasad CK, Naik U, Akella RRD. Autistic children exhibit distinct plasma amino acid profile. Indian J Biochem Biophys. (2013) 50:474–8. doi: 10.1016/j.crvi.2013.10.005
83. Srikantha P, Hasan Mohajeri M. The possible role of the microbiota-gut-brain-axis in autism spectrum disorder. Int J Mol Sci. (2019) 20:2115. doi: 10.3390/ijms20092115
84. Hidding E, Swaab H, de Sonneville LMJ, van Engeland H, Vorstman JAS. The role of COMT and plasma proline in the variable penetrance of autistic spectrum symptoms in 22q11.2 deletion syndrome. Clin Genet. (2016) 90:420–7. doi: 10.1111/cge.12766
85. Cohen SM, Nadler JV. Proline-induced inhibition of glutamate release in hippocampal area CA1. Brain Res. (1997) 769:333–9. doi: 10.1016/S0006-8993(97)00721-X
86. Phang JM, Hu CA, Valle D. “Disorders of proline and hydroxyproline metabolism.” In: Scriver CR, Beaudet AL, Sly WS, Vallee D, Childs B, Kinzler KW, et al, editors. The Metabolic and Molecular Bases of Inherited Disease, New York, NY: McGraw-Hill (2001) Vol. 2, p. 1821–38.
87. Cohen SM, Nadler JV. Proline-induced potentiation of glutamate transmission. Brain Res. (1997) 761:271–82. doi: 10.1016/S0006-8993(97)00352-1
88. Wei H, Ding C, Jin G, Yin H, Liu J, Hu F. Abnormal glutamate release in aged BTBR mouse model of autism. Int J Clin Exp Pathol. (2015) 8:10689–97. Available online at: http://www.ijcep.com/files/ijcep0012702.pdf
89. Wei H, Ma Y, Ding C, Jin G, Liu J, Chang Q, et al. Reduced glutamate release in adult BTBR mouse model of autism spectrum disorder. Neurochem Res. (2016) 41:3129–37. doi: 10.1007/s11064-016-2035-5
90. Joshi G, Biederman J, Wozniak J, Goldin RL, Crowley D, Furtak S, et al. Magnetic resonance spectroscopy study of the glutamatergic system in adolescent males with high-functioning autistic disorder: a pilot study at 4T. Eur Arch Psychiatry Clin Neurosci. (2013) 263:379–84. doi: 10.1007/s00406-012-0369-9
Keywords: autism spectrum disorder, metabolomics, metabolic profiling, plasma, urinary metabolites, taurine
Citation: Xu X-J, Cai X-E, Meng F-C, Song T-J, Wang X-X, Wei Y-Z, Zhai F-J, Long B, Wang J, You X and Zhang R (2021) Comparison of the Metabolic Profiles in the Plasma and Urine Samples Between Autistic and Typically Developing Boys: A Preliminary Study. Front. Psychiatry 12:657105. doi: 10.3389/fpsyt.2021.657105
Received: 26 January 2021; Accepted: 10 May 2021;
Published: 04 June 2021.
Edited by:
Trevor Ronald Norman, The University of Melbourne, AustraliaReviewed by:
Opal Ousley, Emory University, United StatesCopyright © 2021 Xu, Cai, Meng, Song, Wang, Wei, Zhai, Long, Wang, You and Zhang. This is an open-access article distributed under the terms of the Creative Commons Attribution License (CC BY). The use, distribution or reproduction in other forums is permitted, provided the original author(s) and the copyright owner(s) are credited and that the original publication in this journal is cited, in accordance with accepted academic practice. No use, distribution or reproduction is permitted which does not comply with these terms.
*Correspondence: Rong Zhang, emhhbmdyb25nQGJqbXUuZWR1LmNu
†These authors have contributed equally to this work and share first authorship
Disclaimer: All claims expressed in this article are solely those of the authors and do not necessarily represent those of their affiliated organizations, or those of the publisher, the editors and the reviewers. Any product that may be evaluated in this article or claim that may be made by its manufacturer is not guaranteed or endorsed by the publisher.
Research integrity at Frontiers
Learn more about the work of our research integrity team to safeguard the quality of each article we publish.