 Jiayue He
 Yalin Liu
 Chang Cheng1,2,3
 Shulin Fang
 Xiang Wang
 Shuqiao Yao
- 1Medical Psychological Center, The Second Xiangya Hospital, Central South University, Changsha, China
- 2Medical Psychological Institute of Central South University, Central South University, Changsha, China
- 3National Clinical Research Center for Mental Disorders, The Second Xiangya Hospital, Central South University, Changsha, China
Objective: Rumination is considered as a key process in the mechanism of depression. Assessing rumination is important for both research and clinical practice. The Ruminative Response Scale (RRS) is a widely-used instrument to measure rumination. This study aimed to examine the psychometric properties of the Chinese 10-item Ruminative Response Scale (RRS-10) in a large sample of Chinese undergraduates and depressive patients.
Methods: A total of 1,773 university students and 286 clinical patients with major depressive disorder finished the Chinese version of the RRS10, State Trait Anxiety Inventory (STAI), and Beck Depression Inventory (BDI). A confirmatory factor analysis (CFA) was performed to examine the two-factor structure (reflection and brooding) of the RRS-10. The correlations among RRS-10, STAI, and BDI were explored in two samples. In addition, the measurement invariance of the RRS-10 across gender, time, and groups with and without depressive symptoms were further investigated. The internal consistency and test-retest reliability were also evaluated.
Results: Confirmatory Factor Analysis revealed that the two-factor structure of RRS-10 fitted reasonably both in undergraduates (CFI = 0.933, TLI = 0.905, RMSEA = 0.071, SRMR = 0.035) and depressive patients (CFI = 0.941, TLI = 0.910, RMSEA = 0.077, SRMR = 0.057). The results of the multi-group confirmatory factor analysis supported the full strict invariance across genders and across groups (undergraduates and depressive patients). The full strong invariance over time was also supported by MGCFA. Besides, the RRS-10 showed acceptable internal consistency and good stability.
Conclusions: The RRS-10 has good reliability and validity in different samples and over time, which demonstrated that RRS-10 is a valid measurement instrument to assess rumination.
Introduction
Rumination, defined as repetitive thoughts focusing on negative feelings and their causes, implications, and consequences is a method of coping with a negative mood. Individuals with a ruminative style of negative mood will focus their attention on their negative emotional state and ruminate about the causes of their depression and the features of its consequences so that they unable engage in some happy or neutral activities to get rid of their depression, thus prolonging the duration of depression. In 1987, Susan Nolen-Hoeksema first put forward the response style theory of depression (1). According to this theory, rumination is an important vulnerable factor for depression, which might aggravate and prolong depressive episodes (1–6). Researchers found that ruminative response could predict the severity of depression among clinical and non-clinical samples after 1 year (7). Longitudinal research has also revealed that even when controlling the most basic level of depression, rumination still has a significant effect on depressive symptoms (8–11). These results suggested that rumination is not inherently depressing, but can prolong an existing depressed mood.
On the basis of the response style theory, Nolen-Hoeksema et al. develop the Response Style Questionnaire (RSQ) to evaluate two different response styles of depression: rumination and distraction (12). The Ruminative Response Scale (RRS) was developed from the rumination subscale of the Response Style Questionnaire (RSQ). It has been revised over the years, leading to the current 22-item RRS. The RRS has shown good reliability (Cronbach α = 0.74–0.92, rtest−retest = 0.48–0.76) and good validity in the USA (13, 14), Japan (8), Korea (15), Dutch (16), Brazil (17), France (18), and Spain (19), and in clinical and non-clinical samples (20). The Chinese version of the RRS has been reported to be useful for assessing rumination in a large undergraduate sample (21).
In a principal component analysis study, Roberts et al. (22) determined that the RRS was composed of three dimensions: symptom-based rumination, introspection/self-isolation, and self-blame. Bagby et al. came up with the two-factor structure of RRS among clinical patients, including symptom-focused rumination and self-focused rumination (23). Treynor and his Colleagues found some of the RRS items overlapped with depression scale constructs, and were thus classified as depressed-symptom rumination items (24). Thus, previous studies have removed 12 depression-related items from the RRS and found that the structure of scale, consisting of the remaining 10 items, had two 5-item factors: brooding and reflection (24). The brooding dimension of the RRS-10 refers to “mood pondering” (e.g., “Why do I have problems other people don't have?”), whereas the reflection dimension describes cognitive (as opposed to emotive) reassessment of past and present events, feelings, and behaviors (e.g., “Go someplace alone to think about your feelings”). The original RRS10 two-factor model (Factor 1: brooding; Factor 2: reflection) which was investigated by Treynor has been confirmed in several studies (8, 14, 15, 21). However, there still have been some inconsistencies surrounding the two-factor model. For example, Arana et al. explored the fact that the two-factor structure only retained eight of the original items (excluding item 2 and item 9) (25). A confirmatory study found that the original two-factor model was not confirmed among a community sample (17). A number of studies in recent years have confirmed that different types of rumination have different effects on depression: brooding is a risk factor which may prolong or exacerbate depression, while reflection is a protective factor which does not prolong depression (11, 26). Thus, it is important to determine whether the two-factor structure of rumination is consistent among levels of depression (16). But there has been a relative paucity of research examining the factor structure of the RRS10 in depressive patients.
Another issue that needs to be further investigated is whether RRS-10 has the same structure in different groups and whether items have the same meaning for individuals in different groups. In the research of ruminative response, the comparison of the level of rumination between different groups is usually carried out without the test of measurement invariance. However, to make the scale effective and interpretable between group comparisons, it is necessary to prove whether it has measurement invariance (27). That is to say, measurement invariance is a prerequisite for the comparison of differences between groups (28). Measurement invariance is defined as “a given factorial defined construct has the same measurement parameters across two or more samples (i.e., the loadings, intercepts and residual matrix are equal among different groups)” (29). Without evidence of measurement invariance, it cannot be concluded that group difference in rumination reflected true differences between groups, as the difference may be due to the item bias of the scale (30).
According to the ruminative response style theory of depression, women have been shown to be more likely to ruminate about the causes of their mood than men in the face of depression (31), and it has been suggested that this difference in response styles could explain, at least in part, the gender disparity in adult depression (22, 32–34). To ensure such inter-group difference is valid, and not reflecting an artifact of the instrument, it is necessary to confirm consistency of meaning for the scale's items between groups (35). Thus, to compare gender differences in rumination, it is essential that gender invariance of the scale should be established (36). Previous study has demonstrated that the measurement invariance of the RRS-10 was acceptable across genders among an undergraduate sample (14), but the result was not generalized to clinical populations.
Moreover, to make valid score comparisons over time, it is important to assess whether scale items measure the same construct over time, a property known as longitudinal invariance (37). Although changes in rumination over time have been routinely investigated, few studies have explored the longitudinal invariance of the RRS-10 up to now (38). However, without prior testing of longitudinal measurement invariance, it is not possible to determine whether the time changes observed in a structure are due to real changes or to changes in structure or structural measurements over time (27).
In summary, measurement invariance of the RRS10 across gender was supported in a previous study, but the result was not generalized to clinical populations, whereas little research has examined measurement invariance of the RRS10 over time and between groups with and without depressive symptoms.
Thus, the aims of the present study were 3-fold. First, we tested the reliability of the RRS-10 in undergraduate and depressive patients. Second, we examined the two-factor model of the RRS-10 in the two samples. Third, we explored the measurement invariance of the RRS-10 across gender, time, and groups with and without depressive symptoms.
Materials and Methods
Participants and Procedure
Undergraduate participants were recruited from two Chinese universities in Hunan Province. The scale was completed in the classroom and the data were collected by well-trained psychology researchers. Students who had a history of mental disorder, history of neurological disorder, or intellectual disability were excluded. A total of 1,872 university students were surveyed, 10 of which were excluded due to a history of mental disorder and 89 of which were excluded due to missing data. The final student sample includes 1,773 participants (95% completion rate) who returned valid questionnaires. The mean age of the final sample were 18.86 years [standard deviation (SD) = 1.22], including 853 men with a mean age of 18.69 years (SD = 1.14) and 920 women with a mean age of 19.02 years (SD = 1.27). For test-retest reliability analysis and longitudinal invariance, a subgroup of 633 participants (343 men, 54%; and 290 women, 46%) completed the RRS-10 again 2 months later. They had a mean age of 18.39 years (SD = 0.90).
The clinical sample which consisted of depressive patients was recruited from the psychological clinic of Second Xiangya Hospital. Diagnosis was conducted independently by two psychiatrists using the Structured Clinical Interview for the DSM-IV-TR Axis I Disorders-Patient Edition. All the patients met the depression standard of the DSM-IV-TR. Exclusion criteria were (1) prior DSM-IV-TR Axis I disorder (except depressive disorder); (2) history of alcohol/substance abuse; (3) diagnosed neurological disorder; (4) intellectual disability. A total of 286 depressive patients provided complete data, including 126 men (44.1%) and 160 women (55.9%). They had a mean age of 23.25 (SD = 6.62).
Participants were told that the information in these scales would not be disclosed to anyone outside of the research team and all participants provided informed consent. The Ethics Committee of the Second Xiangya Hospital of Central South University (Code: 025) approved the study. The study was unpaid, and all the participants volunteered to complete the study.
Measures
10-item Ruminative Response Scale (RRS-10)
The 10-item RRS, which was part of the larger Response Styles Questionnaire, is a self-rating scale designed to assess thoughts and behaviors when people feel depressed (12). It has two subscales (Brooding and Reflection) and its items are graded on a scale from 1 (never) to 4 (always), with higher scores indicating a greater rumination tendency. The original RRS10 has been demonstrated to have high internal reliability and good test-retest reliability (15, 19, 20, 24). The Chinese version of RRS-10 was translated from English into Chinese by two psychologists, and then it was translated back into English by a bilingual translator with repeated revisions to ensure translation accuracy. No questionnaire item was removed or altered significantly during translation.
State-Trait Anxiety Inventory (STAI)
The widely used self-reported STAI (39) consists of State Anxiety Inventory (SAI) and Trait Anxiety Inventory (TAI) components for measuring the distinct concepts of state and trait anxiety (e.g., I feel nervous; I worry too much over something that really doesn't matter). Each component scale has 20 items answered on a 1–4 scale, with higher score indicating more severe anxiety symptoms. The STAI has high internal consistency (Cronbach's α: state anxiety = 0.89–0.95; trait anxiety = 0.89–0.92) and good test-retest reliability (r ranging from 0.62 to 0.96 for state anxiety and ranging from 0.84 to 0.98 for state anxiety over periods of 2 to 4 weeks) (40–42). The Chinese version of STAI also has good internal reliability (Cronbach's α: state anxiety = 0.91; trait anxiety = 0.92) and test-retest reliability (r: 0.91 for state anxiety and 0.76 for trait anxiety over 2 weeks) (43). In the present study, the STAI had good internal consistency (Cronbach's α: state anxiety = 0.89; trait anxiety = 0.84).
Beck Depression Inventory (BDI)
The BDI is a multiple-choice self-reporting 21-item scale (44) used primarily to assess the presence and severity of depressive symptoms in the prior 2 weeks in clinical and non-clinical populations (e.g., guilty feelings; loss of pleasure). Each question is answered on a 0–3-point scale of intensity. The BDI total score range is from 0 to 63 points, with higher scores indicating more severe symptoms. The Chinese version of the BDI has good reliability since the Cronbach's α was 0.94 for clinical samples and 0.88–0.94 for non-clinical samples (45). The BDI also exhibited good internal consistency (Cronbach's α = 0.85) in the present study. We used the BDI to assess the convergent validity of the RRS-10 with respect to conceptualization of rumination in relation to depressive mood or depressive symptoms.
Data Analysis
To evaluate the reliability of the RRS-10, we calculated Cronbach's α values, mean inter-item correlations (MICs), split-half reliability, and test-retest reliability. Cronbach's α > 0.70 (>0.60 in some cases) was considered acceptable. MICs in the range of 0.10–0.40 were considered optimal.
To evaluate validity, we examined STAI and BDI score relationships with RRS-10 scores and its subscale. These analyses were conducted in IBM SPSS 20.0. The starting hypothesis was that there is a strong, positive correlation among RRS-10, BDI, and STAI. Moreover, to examine whether depression and anxiety were predicted by demographic variables (gender and age) and rumination, we performed multiple linear regression both in the undergraduate sample and the clinical sample, with the BDI total score and STAI total score as dependent variables, respectively.
Confirmatory factor analysis (CFA) with Weighted Least Squares Estimation was employed to determine the goodness of fit of the two-factor structure model of the RRS-10 in undergraduates and depressive patients to establish well-fitting baseline model. Model fit was assessed based on the comparative fit index (CFI), Tucker-Lewis index (TLI), standardized root mean square residual (SRMR), and root mean square error of approximation (RMSEA) with a 90% confidence interval (CI). The acceptable fit criteria applied were: CFI ≥ 0.90, TLI ≥ 0.90, SRMR ≤ 0.08, and RMSEA ≤ 0.08 (28, 46).
Multigroup CFA (MGCFA) was then used to examine the measurement invariance of the RRS-10 across gender, time, and groups. Four aspects of measurement invariance were tested (47, 48). First, configural invariance (Model 1) was examined to test the consistency latent variable constitution across groups. Second, weak invariance (Model 2) was examined to probe inter-group consistency of factor loading. Third, strong invariance (Model 3) was examined to test whether the intercepts of observed variables were equal across groups. Fourth, strict invariance (Model 4) was examined to test whether error variance was consistent across groups. Measurement invariance was inferred from changes in CFI (ΔCFI), TLI (ΔTLI), and RMSEA (ΔRMSEA) with the following acceptability criteria: ΔCFI ≤ 0.010, ΔTLI ≤ 0.010, and ΔRMSEA ≤ 0.015 (49). CFA and MGCFA were completed in Mplus 7.4.
Results
Reliability
Cronbach's α values, mean inter-item correlations, and split-half reliability for the RRS-10 were reported by sample in Table 1. In both samples, the Cronbach's α values were >0.8 for the whole scale and >0.7 for each dimension. All mean MICs were between 0.310 and 0.400. Split-half reliability was slightly higher in the clinical sample (0.744–0.763) than in the undergraduate sample (0.706–0.729). Good test-retest reliability for the full scale and each dimension were confirmed in the undergraduate sample (Table 1).
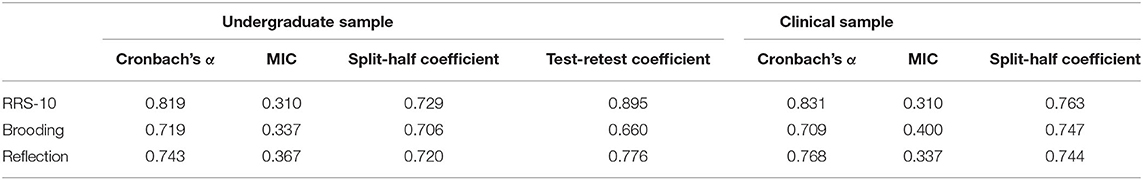
Table 1. Cronbach's α values, mean inter-item correlations, split-half reliability, and test-retest reliability of the RRS-10 and its two dimensions by sample.
Convergent Validity
As shown in Table 2, Pearson analyses demonstrated very significant (p <0.01) positive correlation coefficients among RRS-10 total scale, brooding subscale, reflection subscale, BDI, and STAI scores in both undergraduate sample and clinical sample. These direct correlations indicated good convergent validity of the RRS-10 with depression and anxiety scales.
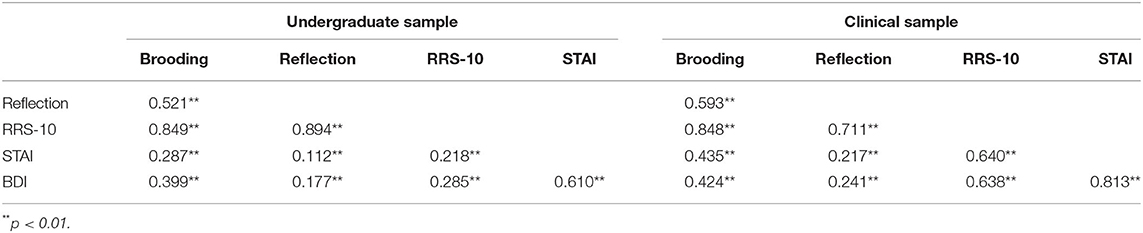
Table 2. Correlations among STAI, BDI, and RRS-10 scores.
We then examined the joint contribution of RRS-10 and demographic variables to predict depressive and anxiety scores through a series of multiple regression analyses. The results in Table 3 showed that gender and brooding subscale scores were significant predictors of BDI total score in the undergraduate sample, whereas gender, age, brooding subscale score, and reflection subscale scores were significant predictors of STAI total score in the undergraduate sample. Only brooding subscale score was a significant predictor of BDI total score and of STAI total score in the clinical sample (Table 3).
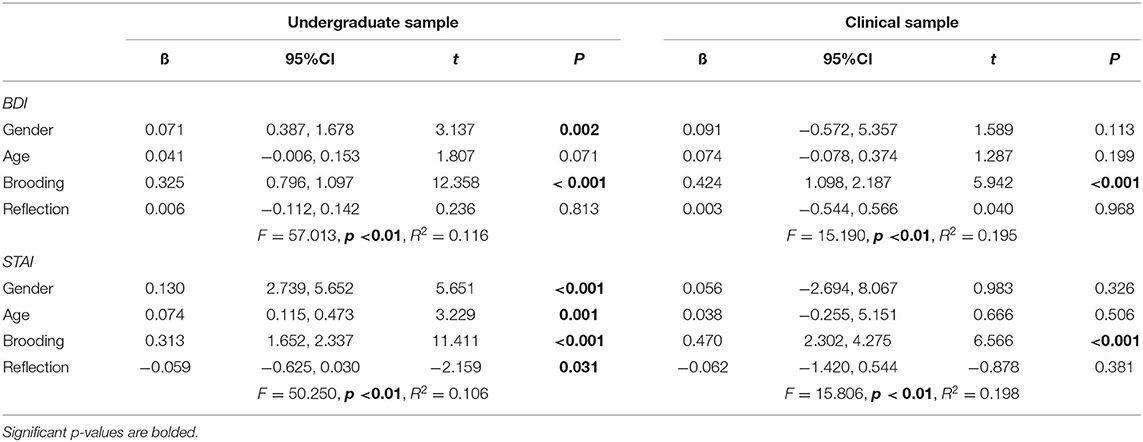
Table 3. Multiple regression analyses with BDI total score (above) and STAI total score (below) as the dependent variable.
CFA
All fit indices of the two-factor model reached our acceptability criteria in the undergraduate sample and clinical sample (Undergraduate sample: CFI = 0.933, TLI = 0.905, RMSEA = 0.071, SRMR = 0.035; Clinical sample: CFI = 0.941, TLI = 0.910, RMSEA = 0.077, SRMR = 0.057) (Table 4). Hence, CFA confirmation of the two-factor structure of the RRS-10 indicated that this model could be used as a baseline model for measurement invariance testing. The factor loadings of each item were shown in Table 5 (The Chinese items were showed in Supplementary Material). All items factor loadings were 0.35 or greater.
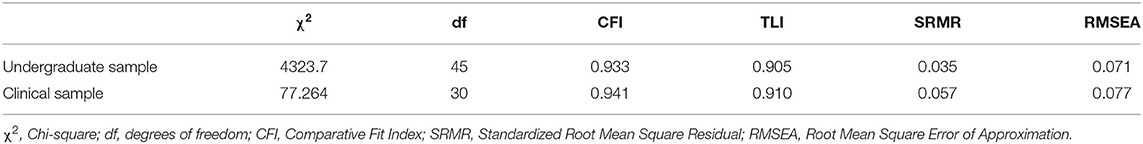
Table 4. Goodness of fit indexes for the two-factor model of the RRS-10.
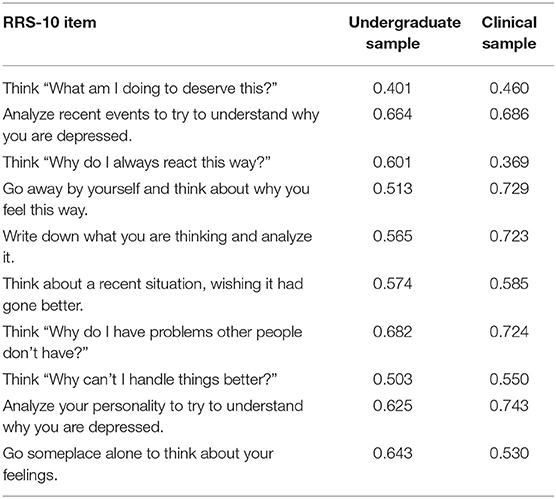
Table 5. The factor loadings of each item in RRS-10.
Measurement Invariance Across Gender
Based on the two-factor model of RRS-10, we proceeded with subsequent measurement invariance testing. Our first model specified configural invariance, meaning that the same factor structure was estimated for women and men; no inter-group constraints were placed on the parameter estimates. All goodness of fit indices obtained met the requirements of configural invariance (Table 6). Thus, configural invariance was established and the model was used as a baseline model for weak invariance (Model 6) analysis, in which factor loading was equalized across the groups. All goodness of fit indices met the requirements of weak invariance (ΔCFI = 0.001, ΔTLI = −0.008, and ΔRMSEA = 0.003). Thus, weak invariance was established between males and females, and strong invariance (Model 3) was examined with equal intercepts across genders. All requirements for goodness of fit indices for the strong invariance test were met (ΔCFI = 0.002, ΔTLI = −0.004, and ΔRMSEA = 0.002). Finally, for strict invariance testing (Model 4), the additional constraint of equal error variance across the two groups was added. All criteria for indices of strict invariance were met (ΔCFI = 0.007, ΔTLI = 0.000, and ΔRMSEA = 0.002), as shown in Table 6, establishing strict invariance for the undergraduate sample. Together, these results support the configural, metric, scalar, and strict invariance of the re-specified two-factor model of the RRS-10 across genders in our undergraduate sample.
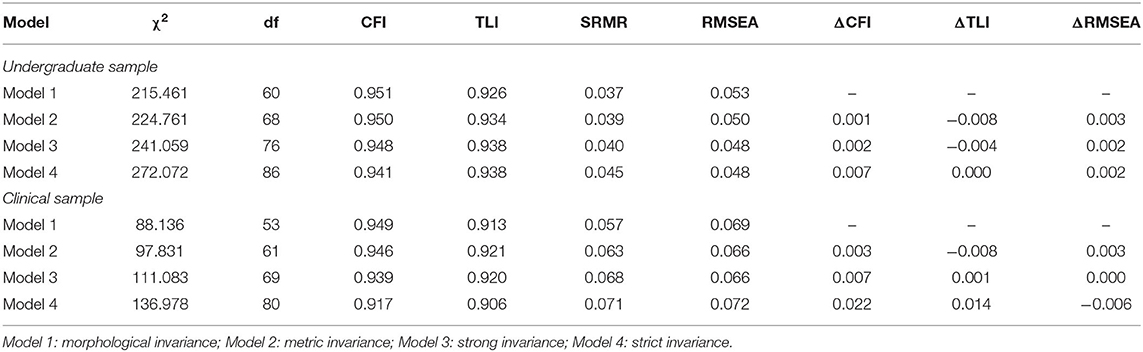
Table 6. Measurement invariance of the RRS-10 across gender.
In our clinical sample, the baseline models were deemed suitable for representing the data for males and for females (fit indices reported in Table 6), providing evidence in support of configural invariance. Furthermore, the changes observed in CFI (<0.010), TLI (<0.010), and RMSEA (<0.015) supported both weak equivalence and strong equivalence of the RRS-10 (Table 6). However, strict invariance was not supported since ΔCFI and ΔTLI >0.01 (ΔCFI = 0.022, ΔTLI = 0.014).
Measurement Invariance Across Time
Model fitting indexes for configural and weak invariance models met our measurement invariance requirements, and the changes in CFI, TLI, and RMSEA values supported weak and strong equivalence of the RRS-10 across the two testing time points (Table 7). Thus, the measurement invariance of the RRS-10 across time was established.
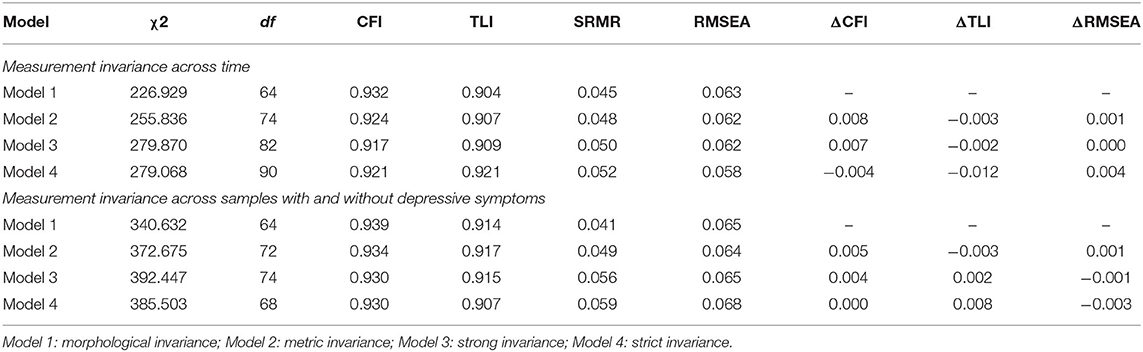
Table 7. Measurement invariance of the RRS-10 across time and across samples with and without depressive symptoms.
Measurement Invariance Across Clinical and Non-clinical Samples
The model fitting indexes for configural and weak invariance models met our measurement invariance requirements, and the changes in TLI, CFI and RMSEA values supported weak, strong, and strict equivalence of the RRS-10 across our non-clinical (undergraduate sample) and clinical samples (depressive patients) shown in Table 7. These results indicated that the RRS-10 exhibited good measurement invariance across clinical (i.e., depressive patients) and non-clinical samples.
Discussion
The current study aimed to examine the reliability and validity of the Chinese RRS-10 in clinical and non-clinical samples. The high internal consistency and test-retest reliability values were obtained in two samples. Then, a CFA was conducted, supporting a similar two-factor structure as that established in previous studies (8, 14, 15, 21, 24). Measurement invariance of the Chinese RRS-10 were well-established across gender, time, and groups with and without depressive symptoms. To our knowledge, this was the first research to explore the measurement invariance across times and different groups (clinical and non-clinical). The present results showed excellent reliability and validity of the RRS-10 in the clinical and non-clinical groups.
For the reliability analysis of the RRS-10, all Cronbach's α coefficients, in both the undergraduate sample and clinical sample, reached acceptable standards (α > 0.70). These results were consistent with previous studies, which reported the internal reliability from 0.74 to 0.92 (8, 13–19). All the mean inter-item coefficients were between 0.10 and 0.40 both in the undergraduate sample and clinical sample and the high test-retest values also indicated good reliability of the RRS-10.
According to the convergent validity, moderate but positive correlations were found between rumination (RRS-10 and its subscales) and psychiatric symptoms (depression and anxiety) in clinical and non-clinical groups, which demonstrate that individuals who had more ruminative thinking seemed to have greater depressive and anxiety symptoms. Previous research has shown a strong link between rumination and psychiatric illness, especially depression (50, 51). Lam et al. (52) found that, in a non-clinical group, RRS scores predicted a more predominant ruminative response style. A clinical research also found a strong association between the RRS score and the duration and severity of depressive episodes in patients with depression.
Furthermore, in multiple regression analyses, we found that the brooding subscale of the RRS-10 was a significant predictor of depression and anxiety symptoms in both undergraduates and clinical samples. The concepts of brooding and reflection in the context of the RRS represent two different types of rumination, with the former encompassing repeated, passive attending to one's own negative emotions and evaluating one's own status and goals harshly. Reflection, on the other hand, involves one's efforts to solve problems and, thereby, alleviate his or her symptoms of depression and anxiety. Brooding is associated with increased negativity bias and negative coping styles, while reflective rumination has a less clear relationship with negative outcomes (53). A meta-analysis indicated that brooding had a moderate effect size for suicidal ideation and history of suicide attempt, but reflection was only associated with suicidal ideation (54). Ricarte et al. also found that anxiety and brooding were positively correlated even after controlling for depression scores (55). Meanwhile, our findings that reflection subscores were associated with STAI scores, but not BDI scores, suggests that reflection may play an important role in anxiety disorders rather than depressive illnesses (56, 57).
Our CFA confirmation of the goodness of fit of the two-factor structure of the Chinese RRS-10 in our undergraduate and clinical samples were consistent with previous RRS factor analysis studies demonstrating a well-stabilized two-factor structure (19). Based on this result, we were comfortable employing the two-factor structure of the RRS-10 as a baseline model for examining measurement invariance.
Importantly, researchers' ability to compare groups in a valid way is dependent upon measurement invariance (30). The present study examined the measurement invariance of the RRS-10 across gender, time, and groups (clinical and non-clinical). Our MGCFA confirmed good morphological, weak, strong, and strict invariance of the Chinese RRS-10 across gender in undergraduate samples, which was consistent with previous studies (14, 21). The configural invariance was supported, which indicated that rumination was conceptualized similarly in women and men which was reflected by two factors measuring brooding and reflection. Besides, there was support for weak invariance, which means that the units of measurement are equal in men and women, that is, the items and potential factors of the scale have the same meaning in men and women (58). Moreover, the present establishment of strong invariance indicated that inter-gender group differences in scores could be interpreted as reflecting true group differences in latent variables, which provided the same reference point between men and women. Intergroup comparisons were meaningful only if the units and reference points are the same. Therefore, it is the premise to compare the latent mean that the weak equivalence and the strong equivalence are satisfied (58). Finally, the strict invariance was supported in women and men which reflected the cross-group difference of latent variable variation. In clinical samples, the strict equivalence was not supported. But the residual equivalence is the most strict equivalence limit and it is not necessary for most research (59). In summary, the results of this study confirmed that the Chinese RRS-10 has strong equivalence, indicating that the scale is effective and interpretable between gender groups.
Regarding measurement invariance over time, our results supported the conclusion that the Chinese RRS-10 had configural, weak, and strong invariance between an initial test and a re-test 2 months later, at least for general population individuals. This confirmation of longitudinal invariance indicated that researchers could be confident that changes in RRS-10 scores over time reflect real changes in rumination over time, rather than an artifact produced by composition instability. Because longitudinal invariance was assessed over a relatively short 2-month time interval, it is impossible to draw conclusions about the stability and structural invariance of RRS-10 over much longer intervals, such as several years or decades. Longer-term research is needed to further verify the longitudinal invariance of RRS-10 over longer periods of time.
The present research also supports the conclusion that the RRS-10 has configural, weak, strong, and strict measurement invariance between non-clinical (undergraduates) and clinical (depressive) samples. These results indicate that the form of latent variables in the RRS-10 is consistent between healthy adults and depressive patients, with equivalent factor loading, intercepts, and error variances of each item. This establishment of scale equivalence allows the inferences that the RRS-10 has the same reference point between clinical and non-clinical populations, and that the relationship between the scale's observation indicators and potential individual characteristics have the same meaning between general population and depressive groups.
Several limitations of our study should be acknowledged. First, the data were obtained principally from self-report measures, which are by nature subjective. Second, we did not control for socioeconomic and demographic variables (e.g., family income, religion, social relationships), which are associated with ruminative response and could affect the results of the RRS-10. Third, the samples only included undergraduate and depressive patients, thus limiting the generalizability of the results. Fourth, the level of rumination was different across cultures, thus, the measurement invariance of the RRS-10 across different cultures could be tested in the future.
Conclusion
The RRS-10 has good psychometric characteristics and measurement invariance across gender, time, and populations with and without depressive symptoms. The present results support the conclusion that the RRS-10 is a valid and reliable self-reported instrument for examining rumination, in relation to depressed mood, in Chinese adults and in patients with depressive symptoms.
Data Availability Statement
The raw data supporting the conclusions of this article will be made available by the authors, without undue reservation.
Ethics Statement
The studies involving human participants were reviewed and approved by the Ethics Committee of the Second Xiangya Hospital of Central South University. The patients/participants provided their written informed consent to participate in this study. Written informed consent was obtained from the individual(s) for the publication of any potentially identifiable images or data included in this article.
Author Contributions
SY supervised the study. JH and YL performed, collected, and wrote the paper. CC and SF contributed to the analysis. XW revised the paper. All co-authors revised and approved the version to be published.
Funding
This research was supported by grants from the National Science and Technology Project for Professional Basic Research (Grant Number: 2015FY111600), the National Natural Science Foundation (Grant Number: 81370034), and the Fundamental Research Funds for the Central Universities of Central South University (Grant Number: 2020zzts284).
Conflict of Interest
The authors declare that the research was conducted in the absence of any commercial or financial relationships that could be construed as a potential conflict of interest.
Acknowledgments
We would like to express our gratitude to all those who helped us during the writing of this thesis.
Supplementary Material
The Supplementary Material for this article can be found online at: https://www.frontiersin.org/articles/10.3389/fpsyt.2021.626859/full#supplementary-material
References
1. Nolen-Hoeksema S. Sex differences in unipolar depression: evidence and theory. Psychol Bull. (1987) 101:259–82. doi: 10.1037/0033-2909.101.2.259
2. Nolen-Hoeksema S, Wisco BE, Lyubomirsky S. Rethiking rumination. Perspect Psychol Sci. (2008) 3:400–24. doi: 10.1111/j.1745-6924.2008.00088.x
3. Watkins ER, Roberts H. Reflecting on rumination: consequences, causes, mechanisms and treatment of rumination. Behav Res Ther. (2020) 127:103573. doi: 10.1016/j.brat.2020.103573
4. Nolen-Hoeksema S, Stice E, Wade E, Bohon C. Reciprocal relations between rumination and bulimic, substance abuse and depressive symptoms in female adolescents. J Abnorm psychol. (2007) 116:195–207. doi: 10.1037/0021-843X.116.1.198
5. Watkins ER. Constructive and unconstructive repetitive thoughts. Psychol Bull. (2008) 134:163–206. doi: 10.1037/0033-2909.134.2.163
6. Abela JRZ, Parkinson C, Stolow D, Starrs C. A test of the integration of the hopelessness and response styles theories of depression in middle adolescence. J Clin Child Adolesc. (2009) 38:354–64. doi: 10.1080/15374410902851630
7. Nolen-Hoeksema S. The role of rumination in depressive disorders and mixed anxiety/depressive symptoms. J Abnorm Psychol. (2000) 109:504–11. doi: 10.1037/0021-843X.109.3.504
8. Hasegawa A, Koda M, Hattori Y, Kondo T, Kawaguchi J. Longitudinal prediction of the brooding and reflection subscales of the Japanese ruminative response sacle for depression. Psychol Rep. (2013) 113:566–85. doi: 10.2466/02.15.PR0.113x24z5
9. Hankin BL. Rumination and depression in adolescents: investigating symptom specificity in a multi-wave prospective study. J Clin Child Adolesc. (2008) 37:701–13. doi: 10.1080/15374410802359627
10. Abela JRZ, Brozina K, Haigh EP. An examination of the response styles theory of depression in third-and seventh-grade children: a short-term longitudinal study. J Abnorm Child psych. (2002) 30:515–27. doi: 10.1023/A:1019873015594
11. Roelofs J, Rood L, Meesters C, te Dorsthorst V, Bogels S, Alloy LB, et al. The influence of rumination and distraction on depressed and anxious mood: a Prospective examination of the response styles theory in children and adolescents. Eur Child Adolesc Psychiatr. (2009) 18:635–42. doi: 10.1007/s00787-009-0026-7
12. Nolen-Hoeksema S. Responses to depression and their effects on the duration of depressive episodes. J Abnorm Psychol. (1991) 100:569–82. doi: 10.1037/0021-843X.100.4.569
13. Cowdrey FA, Park RJ. Assessing rumination in eating disorders: pricipal component analysis of a minimally modified ruminative response scale. Eating Behaviors. (2011) 12:321–4. doi: 10.1016/j.eatbeh.2011.08.001
14. Whisman MA, Miranda R, Fresco DM, Heimberg RG, Jeglic EL, Weinstock LM. Measurement invariance of the ruminative response scale across gender. Assessment. (2020) 27:508–17. doi: 10.1177/1073191118774131
15. Lee S, Kim W. Cross-cultural adaptation, reliability, and validity of the revised Korean version of ruminative response scale. Psychiatry Investig. (2014) 11:59–64. doi: 10.4306/pi.2014.11.1.59
16. Griffith JW, Raes F. Factor structure of the ruminative response scale A community-sample study. Eur J Psychol Assess. (2015) 31:247–53. doi: 10.1027/1015-5759/a000231
17. Lucena-Santos P, Pinto-Gouyeia J, Carvalho SA, Oliveira MD. Is the widely used two-factor structure of the ruminative response scale invariant across different samples of woman? Psychol Psychother. (2018) 91:398–416. doi: 10.1111/papt.12168
18. Parola N, Zendjidjian XY, Alessandrini M, Baumstarck K, Loundou A, Fond G, et al. Psychometric properties of the ruminative response scale-short form in a clinical sample of patients with major depressive disorder. Patient Prefere Adher. (2017) 11:929–37. doi: 10.2147/PPA.S125730
19. Extremera N, Fernandez-Berrocal P. Validity and reliability of Spanish versions of the ruminative responses scale-short form and the distraction responses scale in a sample of Spanish high school and college students. Psychol Rep. (2006) 98:141–50. doi: 10.2466/pr0.98.1.141-150
20. Schoofs H, Hermans D, Raes F. Brooding and reflection as subtypes of rumination: evidence from confirmatory factor analysis in nonclinical samples using the Dutch ruminative response scale. J Psychopathol Behav Assess. (2010) 32:609–17. doi: 10.1007/s10862-010-9182-9
21. Lei XX, Zhong MT, Liu Y, Xi C, Zhu XZ, Yao SQ, et al. Psychometric properties of the 10-item ruminative response scale in Chinese university students. BMC Psychiatry. (2017) 17:152. doi: 10.1186/s12888-017-1318-y
22. Roberts JE, Gilboa E, Gotlib IH. Ruminative response style and vulnerability to episodes of dysphoria: gender, neuroticism, and episode duration. Cogn Ther Res. (1998) 22:401–23. doi: 10.1023/A:1018713313894
23. Bagby RM, Parker JDA. Relation of rumination and distraction with neuroticism and extraversion in a sample of patients with major depression. Cogn Ther Res. (2001) 25:91–102. doi: 10.1023/A:1026430900363
24. Treynor W, Gonzalez R, Nolen-Hoeksema S.. Rumination reconsidered: a psychometric analysis. Cogn Ther Res. (2003) 27:247–59. doi: 10.1023/A:1023910315561
25. Arana FG, Rice KG. Cross-cultural validity of the ruminative response scale in Argentina and the States. Assessment. (2020) 27:309–20. doi: 10.1177/1073191117729204
26. Lo CSL, Ho SMY, Hollon SD. The effeets of rumination and negative cognitive styles on depression: a mediation analysis. Behav Res Ther. (2008) 46:487–95. doi: 10.1016/j.brat.2008.01.013
27. Jovanovic V. Measurement invariance of the Serbian version of the satisfaction with life scale across age, gender and time. Eur J Psychol Assess. (2019) 35:555–63. doi: 10.1027/1015-5759/a000410
28. He JY, Zhong X, Gao YD, Xiong G, Yao SQ. Psychometric properties of the Chinese version of the childhood trauma questionnaire short form (CTQ-SF) among undergraduates and depressive patients. Child Abuse Neglect. (2019) 91:102–8. doi: 10.1016/j.chiabu.2019.03.009
29. Little TD. Mean and covariance structures (MACS) analyses of cross-cultural data: practical and theoretical issues. Multivar Behav Res. (1997) 32:53–76. doi: 10.1207/s15327906mbr3201_3
30. Vandenberg RJ, Lance CE. A review and synthesis of the measurement invariance literature: suggestions, practices, and recommendations for organizational research. Organ Res Methods. (2000) 3:4–70. doi: 10.1177/109442810031002
31. Nolen-Hoeksema S, Parker L, Larson J. Ruminative coping with depressed mood following loss. J Personal Soc Psychol. (1994) 67:92–104. doi: 10.1037/0022-3514.67.1.92
32. Zetsche U, Ehring T, Ehlers A. The effects of rumination on mood and intrusive memories after exposure to traumatic material: an experimental study. J Behav Ther Exp Psychiatr. (2009) 40:499–514. doi: 10.1016/j.jbtep.2009.07.001
33. Yoder JD, Lawrence C.L. Are gender differences in self-reported rumination explained by women's stereotyping? Sex Roles. (2010) 65:94–101. doi: 10.1007/s11199-010-9913-0
34. Wupperman P, Neumann CS. Depressive symptoms as a function of sex-role, rumination, and neuroticism. Pers Indiv Differ. (2006) 40:189–201. doi: 10.1016/j.paid.2005.05.017
35. Byrne BM, Stewart SA. The MACS approach to testing for multigroup invariance of a second-order structure: a walk through the process. Struct Equ Model. (2006) 13:287–321. doi: 10.1207/s15328007sem1302_7
36. Liu JD, Chung PK, Chen WP. Constraints of recreational sport participation: measurement invariance and latent mean differences across sex and physical activity status. Percept Mot Skills. (2014) 119:363–76. doi: 10.2466/06.03.PMS.119c24z0
37. Van de Schoot R, Lugtig P, Hox J. A checklist for testing measurement invariance. Eur J Dev Psychol. (2012) 9:486–92. doi: 10.1080/17405629.2012.686740
38. Lo BCY, Ng TK, So T. Parental demandingness predicts adolescents' rumination and depressive symptoms in a one-year longitudinal study. J Abnorm Child Psych. (2020). doi: 10.1007/s10802-020-00710-y. [Epub ahead of print].
39. Bados A, Gomez-Benito J, Balaguer G. The state-trait anxiety inventory, trait version: does it really measure anxiety? J Pers Assess. (2010) 92:560–7. doi: 10.1080/00223891.2010.513295
40. Spielberger CD. Manual for the State-Trait Anxiety Inventory (Form Y). Menlo Park, CA: Mind Garden (1983).
41. Kvaal K, Ulstein I, Nordhus IH, Engedal K. The Spielberger State-Trait Anxiety Inventory (STAI): the state scale in detecting mental disorders in geriatric patients. Int J Geriatr Psych. (2005) 20:629–34. doi: 10.1002/gps.1330
42. Fountoulakis KN, Papadopoulou M, Kleanthous S, Papadopoulou A, Bizeli V, Nimatoudis L, et al. Reliability and psychometric properties of the Greek translation of the StateTrait Anxiety Inventory form Y: preliminary data. Ann Gen Psychiatr. (2006) 5:2. doi: 10.1186/1744-859X-5-2
43. Ma WF, Liu YC, Chen YF, Lane HY, Lai TJ, Huang LC. Evaluation of psychometric properties of the Chinese mandarin version state-trait anxiety inventory Y form in Taiwanese outpatients with anxiety disorders. J Psychiatr Ment Hlt. (2013) 20:499–507. doi: 10.1111/j.1365-2850.2012.01945.x
44. Beck AT, Brown GK, Steer RA. Manual of beck depression inventory-II. Am Univ Washington DC. (1996) 21:88. doi: 10.1037/t00742-000
45. Wu PC, Huang TW. Gender-related invariance of the Beck Depression Inventory II for Taiwanese adolescent samples. Assessment. (2014) 21:218–26. doi: 10.1177/1073191112441243
46. Hu L, Bentler PM. Cutoff criteria for fit indexes in covariance structure analysis: conventional criteria versus new alternatives. Struct Equ Model Multidiscip J. (1999) 6:1–55. doi: 10.1080/10705519909540118
47. Meredith W. Measurement invariance, factor analysis and factorial invariance. Psychometrika. (1993) 58:525–43. doi: 10.1007/BF02294825
48. Kass RE, Raftery AE. Bayes factors. J Am Stat Assoc. (1995) 90:773–95. doi: 10.1080/01621459.1995.10476572
49. Cheung GW, Rensvold RB. Evaluating goodness-of-fit indexes for testing measurement invariance. Struct Equ Modeling. (2002) 9:233–55. doi: 10.1207/S15328007SEM0902_5
50. Sukhodolsky DG, Golub A, Cromwell EN. Development and validation of the anger rumination scale. Pers Indiv Differ. (2001) 31:689–700. doi: 10.1016/S0191-8869(00)00171-9
51. Broderick PC, Korteland C. Coping styles and depression in early adolescence: relationships to gender, gender role, implicit beliefs. Sex Role. (2002) 46:201–13. doi: 10.1023/A:1019946714220
52. Lam D, Smith N, Checkley S, Rijsdijk F, Sham P. Effect of neuroticism, response style and information processing on depression severity in a clinically depressed sample. Psychol Med. (2003) 33:469–79. doi: 10.1017/S0033291702007304
53. Satyshur MD, Layden EA, Gowins JR, Buchanan A, Gollan JK. Functional connectivity of reflective and brooding rumination in depresses and healthy women. Cogn Affect Behav Ne. (2018) 18:884–901. doi: 10.3758/s13415-018-0611-7
54. Rogers ML, Joiner TE. Rumination, suicidal ideation, and suicide attempts: a meta-analytic review. Rev Gen Psychol. (2017) 21:132–42. doi: 10.1037/gpr0000101
55. Ricarte JJ, Ros L, Latorre JM, Munoz MD, Aguilar MJ, Hernandez JV. Role of anxiety and brooding in specificity of autobiographical recall. Scand J Psychol. (2016) 57:495–500. doi: 10.1111/sjop.12323
56. Hankin BL. Development of sex differences in depressive and co-occurring anxious symptoms during adolescence: descriptive trajectories and potential explanations in a multiwave prospective study. J Clin Child Adolesc. (2009) 38:460–72. doi: 10.1080/15374410902976288
57. Field AP, Morgan J. Post-event processing and the retrieval of autobiographical memories in socially anxious individuals. J Affect Disorders. (2004) 18:647–63. doi: 10.1016/j.janxdis.2003.08.004
58. Schmitt N, Kuljanin G. Measurement invariance: review of practice and implications. Hum Resour Manage R. (2008) 18:210–22. doi: 10.1016/j.hrmr.2008.03.003
Keywords: RRS-10, depression, rumination, factor structure, measurement invariance
Citation: He J, Liu Y, Cheng C, Fang S, Wang X and Yao S (2021) Psychometric Properties of the Chinese Version of the 10-Item Ruminative Response Scale Among Undergraduates and Depressive Patients. Front. Psychiatry 12:626859. doi: 10.3389/fpsyt.2021.626859
Received: 07 November 2020; Accepted: 19 April 2021;
Published: 26 May 2021.
Edited by:
Wissam El-Hage, Université de Tours, FranceReviewed by:
Laurent Boyer, AP-HM Assistance Publique des Hôpitaux de Marseille, FranceAntoine Yrondi, Centre Hospitalier Universitaire de Toulouse, France
Copyright © 2021 He, Liu, Cheng, Fang, Wang and Yao. This is an open-access article distributed under the terms of the Creative Commons Attribution License (CC BY). The use, distribution or reproduction in other forums is permitted, provided the original author(s) and the copyright owner(s) are credited and that the original publication in this journal is cited, in accordance with accepted academic practice. No use, distribution or reproduction is permitted which does not comply with these terms.
*Correspondence: Shuqiao Yao, c2h1cWlhb3lhb0Bjc3UuZWR1LmNu; Xiang Wang, d2FuZzA5MTZ4aWFAZ21haWwuY29t
†These authors have contributed equally to this work