
95% of researchers rate our articles as excellent or good
Learn more about the work of our research integrity team to safeguard the quality of each article we publish.
Find out more
BRIEF RESEARCH REPORT article
Front. Psychiatry , 11 October 2019
Sec. Neuroimaging
Volume 10 - 2019 | https://doi.org/10.3389/fpsyt.2019.00739
This article is part of the Research Topic Progress in Translational Neuroimaging: Integrating Pathways, Systems and Phenomenology in Neurology and Psychiatry View all 20 articles
 Sudhir Karthikeyan1
 Lisa Fiksenbaum1Anahit Grigorian1Hanzhang Lu2
 Bradley J. MacIntosh3,4,5
 Benjamin I. Goldstein1,5,6,7*
Background: Regional cerebral blood flow (CBF) is reportedly altered in both adolescents and adults with bipolar disorder (BD). Whether these CBF differences are part of an overall imbalance in cerebral energy homeostasis remains unknown. Therefore, we examined global cerebral metabolic rate of oxygen consumption (CMRO2) as a physiological index of brain metabolism in adolescents with and without BD.
Methods: One hundred and fifteen adolescents (mean age 17.3 ± 1.4 years), including 58 BD (type I, II, or not otherwise specified [NOS]) and 57 age-matched healthy controls (HCs) participated in this magnetic resonance imaging (MRI) study. Global estimates for venous blood oxygenation (Yv) and grey matter CBF were measured using T2-relaxation-under-spin-tagging (TRUST) and arterial spin labeling (ASL) MRI, respectively. CMRO2 was calculated using the Fick principle of arteriovenous difference to test for a group difference. We also examined CMRO2 in relation to mood states (i.e. euthymic, depressed, or hypomanic/mixed).
Results: Although CBF was significantly higher in BD compared to HCs, there was no group difference in global CMRO2, nor Yv. Meanwhile, Yv significantly decreased with age, and females tended to have greater CBF and CMRO2 in comparison to males. Lastly, there was no significant association between CMRO2 and mood states.
Conclusions: Our results indicate a potential mismatch between cerebral blood supply and oxygen metabolism in BD, suggesting inefficiency in energy homeostasis in the brain. Mapping CMRO2 would provide the spatial resolution to investigate regional alterations in metabolism, particularly in the brain regions where CBF is increased.
Bipolar disorder (BD) is a severe chronic mood disorder associated with an increased risk of developing premature cardiovascular disease (CVD) (1, 2). Indeed, CVD is the leading cause of mortality in BD, despite the increased risk of suicide and prevalence of other comorbidities (3, 4). In recent years, there has been increasing support for the notion regarding vascular pathology as an important neurobiological underpinning of BD (1, 5). This link between vascular pathology and BD is further evidenced by research showing alterations in cerebral blood flow (CBF) in individuals with BD (6). CBF is an important physiological parameter which reflects the supply of oxygen and glucose to the brain and is known to be associated with cardiometabolic risk factors (7). Although the human brain accounts for just 2% of total body mass, it consumes about 20% of the total energy (8). Thus, changes in blood supply may affect energy homeostasis in the brain that is crucial for normal neuronal functioning.
Most studies that have examined CBF in adults with BD have found decreased CBF in frontal and temporal brain regions in BD participants, particularly during depressive episodes, compared to healthy controls (HCs) (6, 9–11). In contrast, the sole study that has investigated CBF in adolescents with BD found region-specific elevation in CBF (12). These findings raise questions as to how alterations in cerebral hemodynamics affect energy homeostasis in the brain. Further research is needed to clarify the relationship between CBF changes and energy homeostasis in individuals with BD.
Multiple lines of evidence suggest that energy metabolism is disturbed in BD and is associated with mitochondrial dysfunction. Early studies using magnetic resonance spectroscopy (MRS) reported a reduction in phosphocreatine levels in the brains of BD patients, indicating inefficient adenosine triphosphate (ATP) synthesis (13, 14). Subsequent genetic studies found that BD is associated with mitochondrial DNA (mtDNA) mutations and polymorphisms (15, 16). In addition, post-mortem brain studies have shown abnormal mitochondrial morphology (17), reduction in mitochondrial protein function, and increased oxidative damage (18) in brains of patients with BD. Furthermore, studies have detected increased lactate concentration in the brain (19) and cerebrospinal fluid of individuals with BD (20), suggesting a shift from oxidative phosphorylation to glycolysis. Consistent with this, findings from positron emission tomography (PET) studies showing altered cerebral glucose metabolism in BD (17, 18) provide additional support for the view that abnormal energy metabolism is a key factor in the pathophysiology of BD.
Cerebral metabolic rate of oxygen consumption (CMRO2) is a measurable index of oxygen utilization in the brain. It is defined as the amount of oxygen consumed per unit mass tissue and per unit time, and reflects oxygen demand in the brain. Regulation of oxygen metabolism is vital for normal neuronal functioning. Altered CMRO2 is reported in studies on aging (21, 22) as well as in several disease states including Alzheimer’s (23), Parkinson’s (24), and multiple sclerosis (25).
CMRO2 is related to the difference in oxygen saturation from artery to vein, known as the oxygen extraction fraction (26). Oxygenated blood that passes through the veins is the venous oxygenation (Yv). Until recently, most studies have relied on PET combined with blood sampling to measure Yv and calculate CMRO2. The use of a radioactive tracer and the invasive nature likely limited its feasibility, especially in children and adolescents. This is reflected by a lack of studies examining brain physiology in youth.
The aim of the present study was to compare CBF, YV, and CMRO2 in adolescents with and without BD. We used a validated T2-relaxation-under-spin-tagging (TRUST) magnetic resonance imaging (MRI) technique to noninvasively measure Yv (27, 28). We also evaluated the relationship between CBF, YV, and CMRO2 and mood states (i.e. euthymic, depressed, or hypomanic/mixed). We hypothesized that BD and HC participants will show differences in both CBF and the rate of oxygen utilization.
One hundred and fifteen English-speaking adolescents between the ages of 13 and 20 years of both sexes and any race/ethnicity were included (58 BD, 57 HCs). BD participants who met criteria for BD [I, II, or not otherwise specified (NOS)] were recruited from a tertiary sub-specialty clinic at Sunnybrook Health Sciences Centre in Toronto, Ontario. HCs without any major mood or psychiatric disorders (i.e. no lifetime mood or psychotic disorders, no recent anxiety disorder or alcohol/drug dependence in the past 3 months) and no first- or second-degree family history of BD or psychotic disorder were recruited from the community. Participants were excluded if they met any of the following criteria: i) unable to provide informed consent; ii) existing cardiac condition, auto-immune illness, or inflammatory illness; iii) currently taking anti-inflammatory, anti-lipidemic, anti-hypertensive agents; iv) contraindications to MRI (e.g. cardiac pacemaker or other implanted device); v) neurological or cognitive impairment; and vi) infectious illness within the past 14 days. Written informed consent was obtained from both participants and their parent/guardian prior to any procedures. All procedures were approved by the research ethics board at Sunnybrook Health Sciences Centre. A semi-structured diagnostic interview was used to assess study requirements.
Psychiatric diagnosis was determined using the Schedule for Affective Disorders and Schizophrenia for School Age Children, Present and Life Version (K-SADS-PL) (29). The K-SADS Depression Rating Scale (DEP-P) (30) and K-SADS Mania Rating Scale (MRS) (31) were used in place of the mood sections of the K-SADS-PL to assess current and lifetime symptoms of depression and mania. Symptom scores during the worst week in the past month were used as a measure of current mood state. Information provided by the participant, as well as their parent/guardian, was incorporated into the final summary score for each scale. BD-I and BD-II diagnosis was determined using the Diagnostic and Statistical Manual of Mental Disorders, 4th Edition (DSM-IV), criteria (32). BD-NOS was operationally defined using criteria outlined in the Course and Outcome of Bipolar Youth (COBY) study (33): i) two DSM-IV manic symptoms (three if only irritable mood is reported), ii) change in functioning, iii) mood and symptom duration of at least 4 h during a 24 h period, and iv) at least four cumulative 24 h periods of episodes that meet the mood, symptom, and functional change criteria over the participant’s lifetime.
MRI was performed on a 3 T MR scanner (Philips Achieva, Philips Healthcare, Best, NL) using an eight-channel phased array RF head coil. The imaging protocol included T1-weighted images for anatomical registration, pseudo-continuous arterial spin labeling (PC-ASL) for CBF measurement, and TRUST for Yv quantification.
Anatomical T1-weighted imaging was performed with high-resolution fast-field echo imaging [repetition time (TR)/echo time (TE)/inversion time (TI)] = 9.5/2.3/1,400 ms, field of view 240 × 191 mm, spatial resolution 0.94 × 1.17 × 1.2 mm, 256 × 164 × 140 matrix, scan duration 8:56 min:s). T1-weighted images were skull-stripped, co-registered to ASL space and standard space, normalized, and parcellated based on tissue type. All of the steps above were performed using Functional Magnetic Resonance Imaging of the Brain (FMRIB) Software Library (FSL) tools.
Gray matter (GM) CBF for the whole brain was measured using ASL. Phase contrast angiography scout images were acquired to visualize the position of the carotid and vertebral arteries that corresponded to the ASL labeling plane, and thereby facilitate ASL quality control. ASL data were acquired with the following parameters: single-shot two-dimensional echo-planar imaging (EPI) (TR/TE = 4,000/9.7 ms, 64 × 64 × 18 matrix, spatial resolution 3 × 3 × 5 mm), 1,650 ms labeling duration, post-label delay of 1,600 ms for the most inferior slice, 30 control-tag image pairs of unlabeled and labeled arterial blood water, and scan duration of 4:08 min:s.
Processing of ASL data was done using FSL tools (12). Images were first co-registered to a reference volume. Signal differences between consecutive control and tag images were obtained to measure the amount of perfused labeled arterial blood and thus provide relative CBF estimates. Signal in GM was optimized by removing images with excess head motion. Each individual’s difference images were converted into a quantitative CBF map by relying on physiological and MR parameters, such as relaxation rates and transit times of the labeled arterial blood, to provide absolute units for the image intensity (ml/100 g/min) (34). A 5 mm smoothing kernel was applied to the CBF maps. GM global signal was reported based on mean CBF values extracted from GM masks that were segmented from the T1-weighted images and subsequently registered to ASL space.
Global cerebral venous oxygenation saturation, Yv, was measured in the superior sagittal sinus (SSS) using the validated TRUST MRI technique (28, 35). First, a single oblique axial imaging slice was positioned parallel to the anterior-commissure posterior-commissure line 20 mm above the sinus confluence. TRUST MRI was performed with the following parameters: voxel size 3.44 × 3.44 × 5 mm3, TR = 3,000 ms, TI = 1,022 ms, labeling thickness = 100 mm, gap = 22.5 mm, effective TE = 0, 40, 80, and 160 ms, and scan duration of 1:20 min:s.
TRUST data were processed using MATLAB scripts as described previously by Lu and colleagues (28, 35). First, a venous blood signal was extracted by pairwise subtraction of control and labeled images. A preliminary region-of-interest (ROI) mask was then manually drawn on the difference images to include the SSS. Within the ROI, four voxels showing the largest difference signals were selected for spatial averaging. A monoexponential function was used to fit the average venous blood signal as a function of TE and thereby obtain a T2 estimate, which was then converted to Yv using a calibration curve. Hematocrit values for T2 calibration were based on laboratory reference values (LifeLabs, Ontario, Canada) accounting for both age and sex (36).
Global CMRO2 was calculated using the Fick principle in units of μmol O2/100 g/min (26):
CBF values were extracted as the average CBF level within the grey mask on a per-participant basis. This single ROI served as a global CBF estimate. Yv was also calculated on a per-participant basis, from within the SSS that drains a large proportion of the venous blood in the brain. Arterial oxygenation (Ya) saturation, which is close to unity, was estimated to be 99% for all participants as it is minimally affected by age (21, 37). The value for Ca, which represents the amount of oxygen molecules that a unit volume of blood can carry, was based on physiological literature and assumed to be 833.7 μmol O2/100 ml blood (38).
All analyses were performed using IBM SPSS Statistics for Windows, version 25 (IBM Corp., Armonk, NY, USA). Comparison of demographic and clinical characteristics between groups was assessed using t-tests or chi-square tests, as appropriate. Group differences in global measures of CBF, Yv, and CMRO2 were investigated using analysis of covariance (ANCOVA), including age and sex as covariates, as these variables are known to have an effect on the physiological parameters (21, 22, 28). Pearson’s correlation was used to investigate the associations between continuous variables. Significance was set at p < 0.05 for all analyses, and values are reported as means ± standard deviation (SD).
Table 1 presents demographic and clinical characteristics. The majority of participants were female (57%) and Caucasian (70%) with a mean age of 17.3 ± 1.40. There were no significant age, race, or sex differences between groups. Mean body mass index (BMI) was significantly higher in BD (24.04 ± 4.51 kg/m2) than HCs (21.44 ± 2.79 kg/m2; t = 3.73, p = 0.012, d = 0.69). As expected, there were multiple significant differences in clinical characteristics such as mood symptoms, medication, and lifetime history of cigarette smoking.
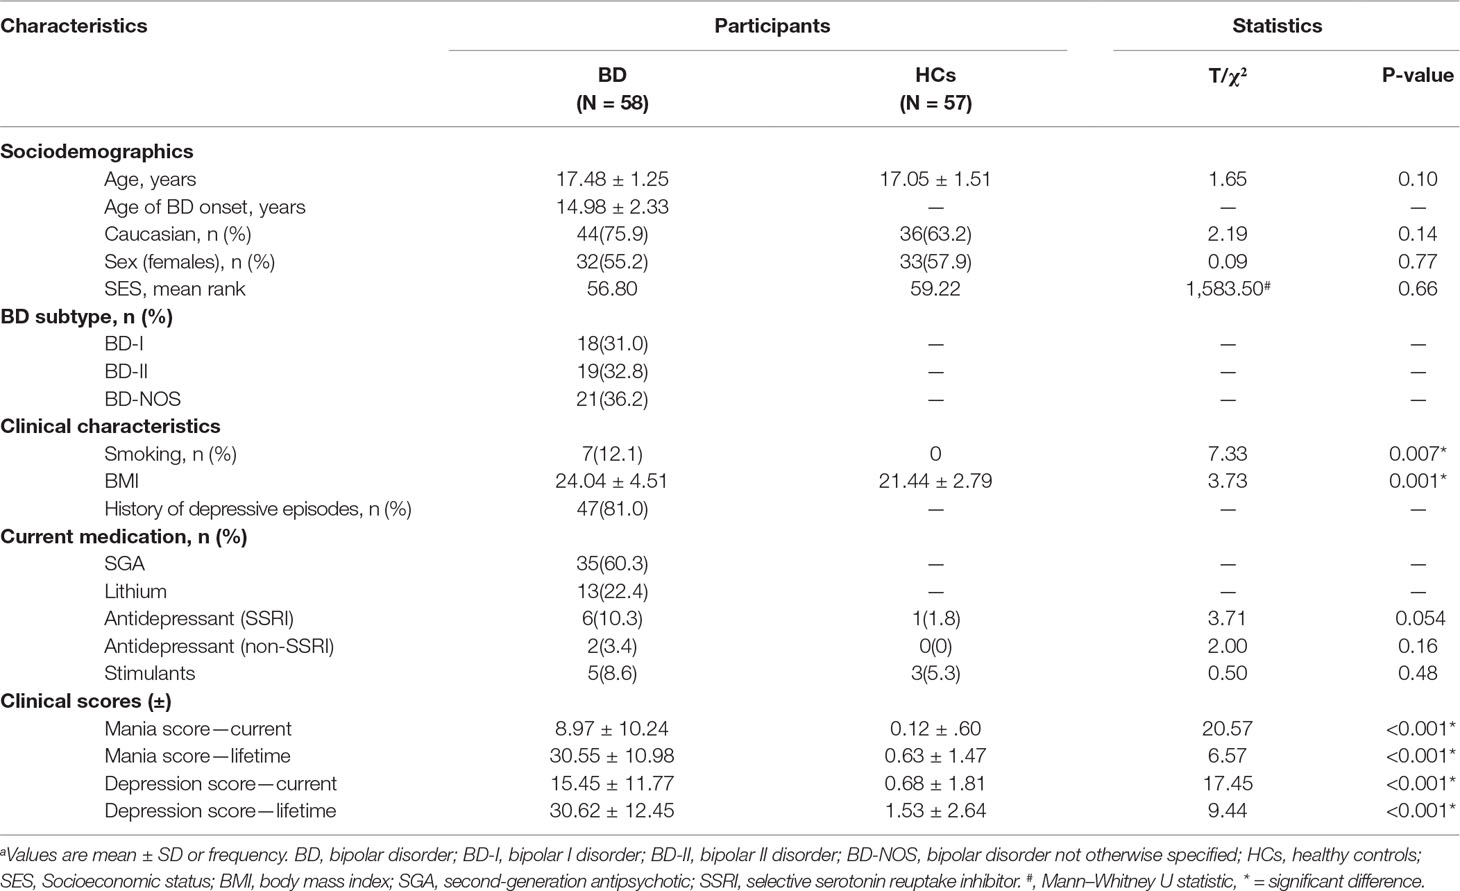
Table 1 Demographic and clinical characteristics.a
There was a significant effect of sex (t = 3.76, p < 0.001, d = 0.69). Overall, females had greater CBF in comparison to males (67.93 ± 12.82 vs. 60.08 ± 9.56 ml/100 g/min, respectively). The BD group had significantly greater global CBF in comparison to HCs, when controlling for age and sex (66.35 ± 12.18 vs. 62.64 ± 11.87 ml/100 g/min, respectively; F = 4.51, p = 0.036, ηp2 = 0.039; Figure 1A). Sex was a significant covariate (F = 13.49, p < 0.001, ηp2 = 0.11). There was no significant association between age and CBF (r = −0.15, p = 0.116; Figure 1B).
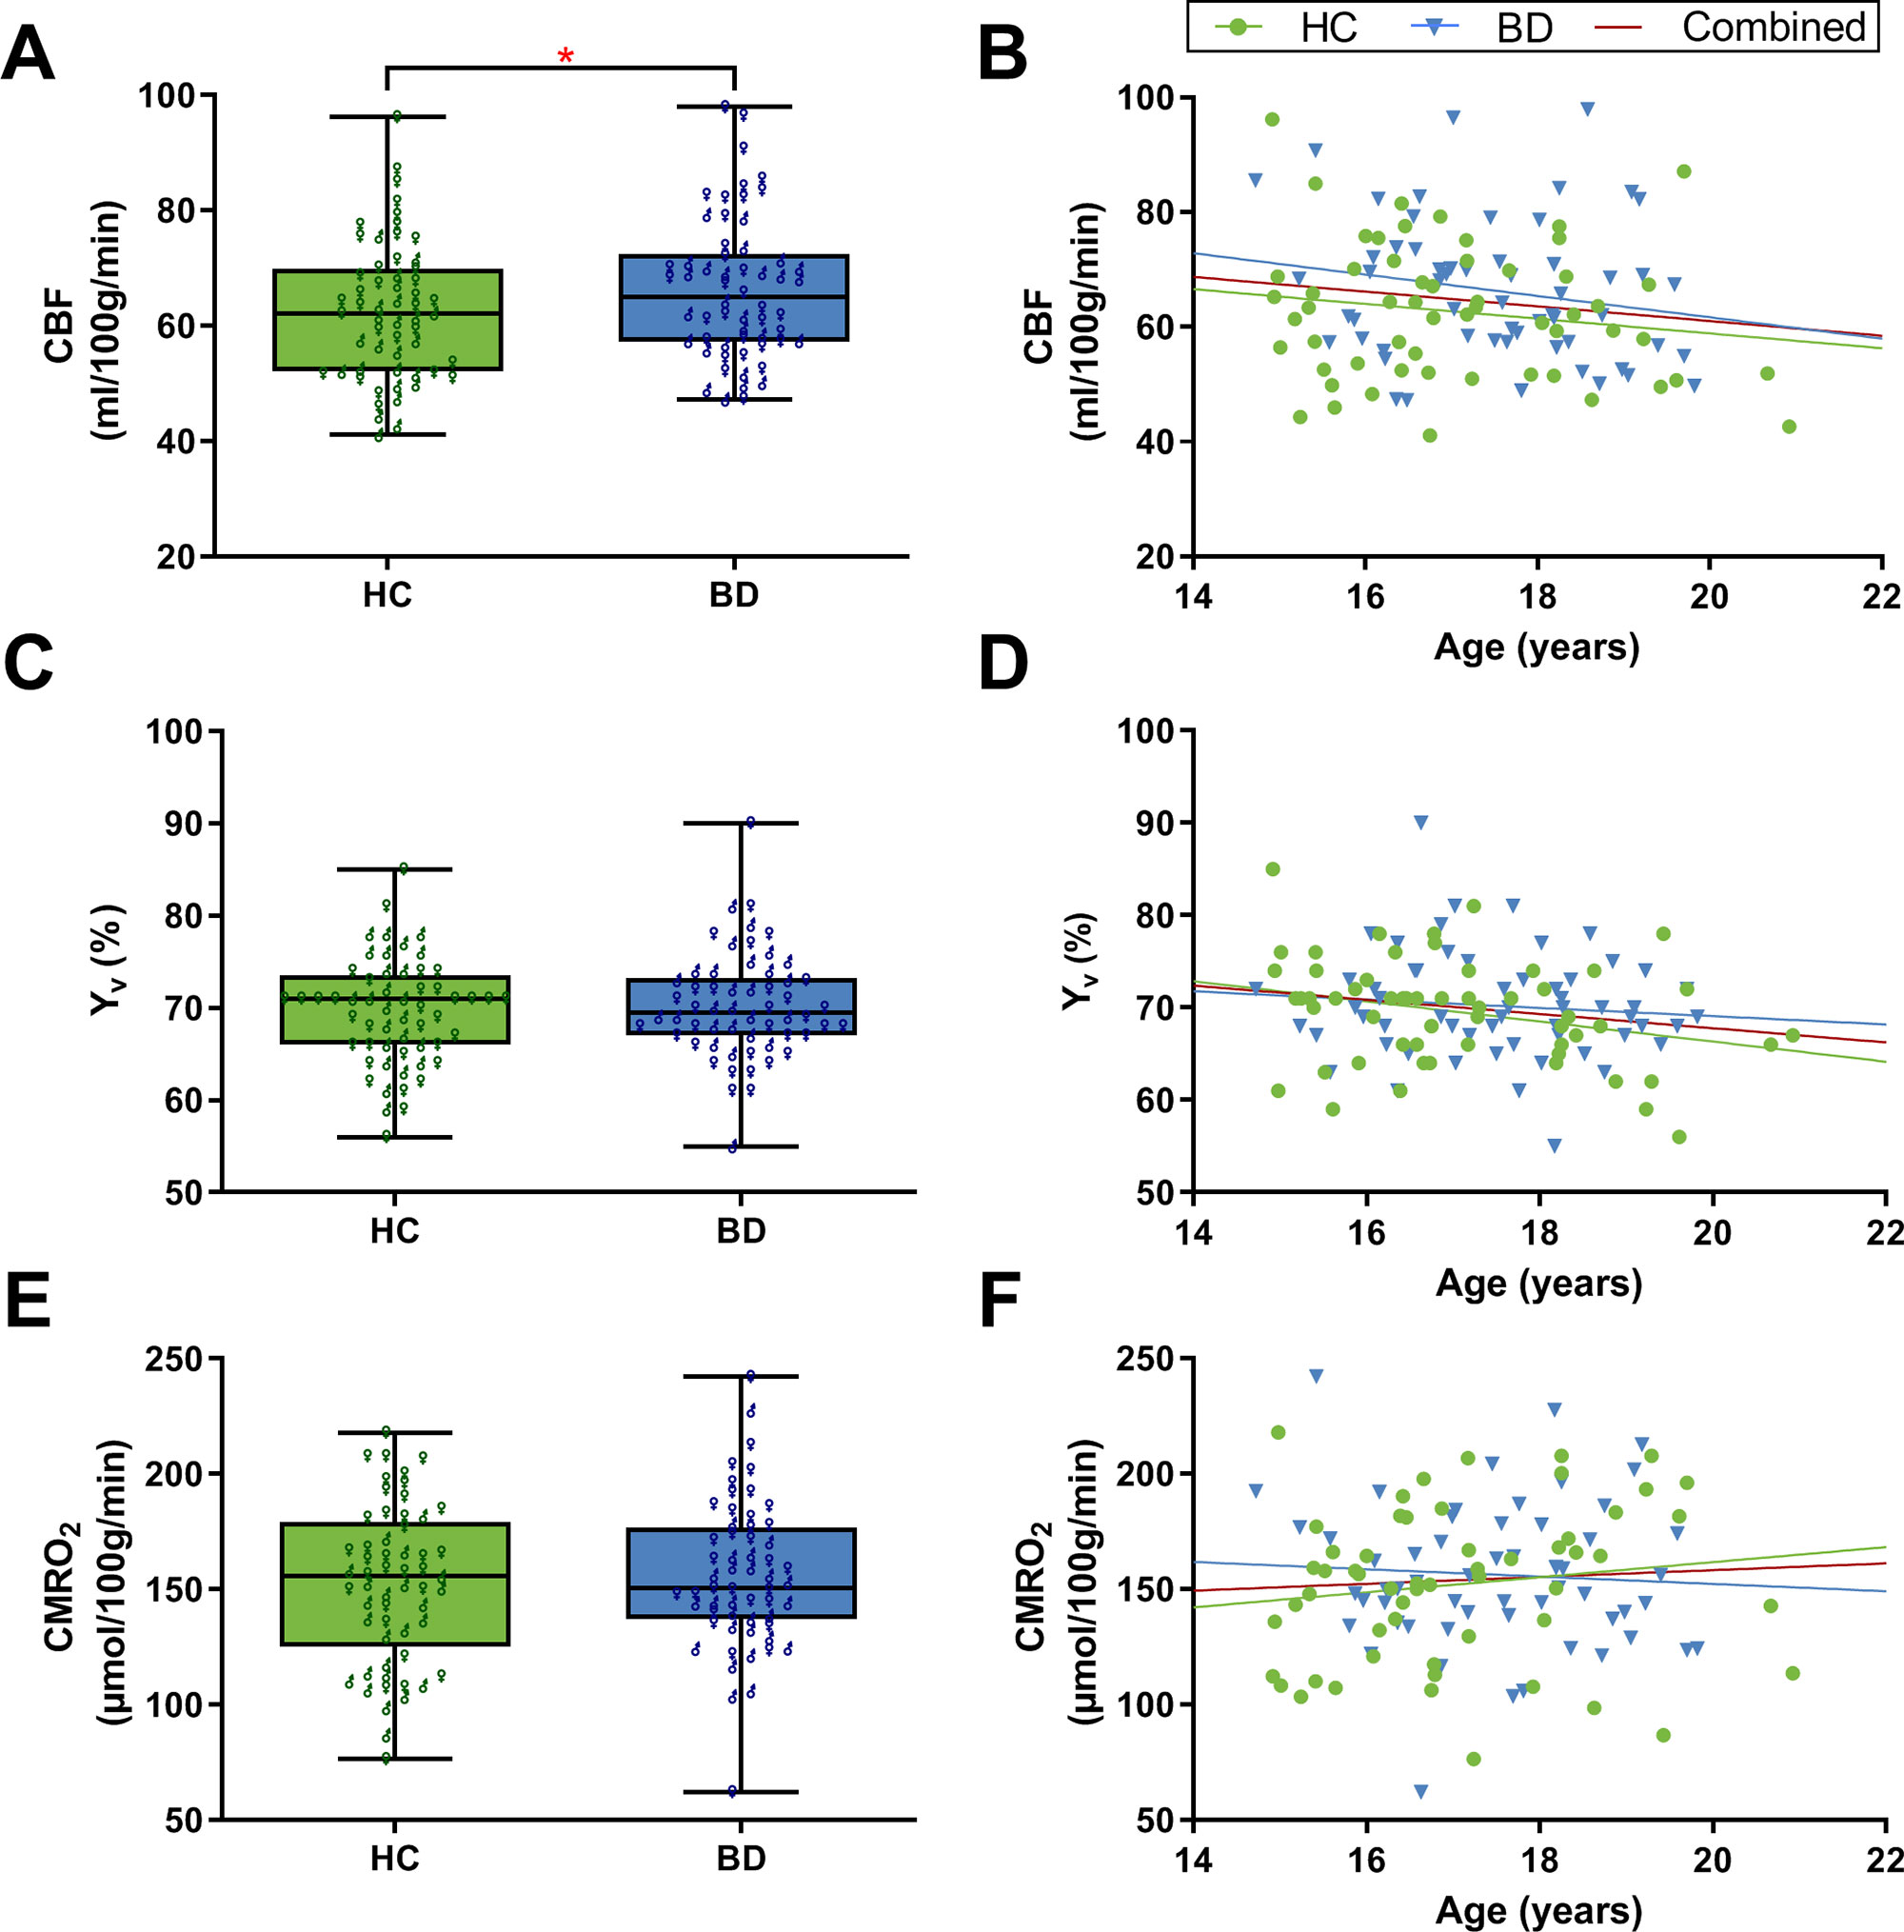
Figure 1 Global grey matter cerebral blood flow (CBF), venous oxygenation (Yv), and cerebral metabolic rate of oxygen (CMRO2). (A) The bipolar disorder (BD) group had significantly greater CBF compared to healthy controls (HCs) (F = 4.51, p = 0.036). CBF was significantly greater in females compared to males (t = 3.76, p < 0.001). (B) There was no significant association between age and CBF. (C) Yv did not significantly differ between BD and HCs. (D) Correlation analysis showed that age has a significant effect on Yv; r = −0.19, p = 0.045. (E) CMRO2 did not significantly differ between BD and HCs. Female participants overall had greater CMRO2 compared to males (t = 4.51, p < 0.001). (F) There was no significant association between age and CMRO2. Panels A, C, and E are box plots with superimposed data points showing distribution of values in BD (n = 58) and HCs (n = 57). Box = 25th and 75th percentiles; horizontal line = median, bars = min and max values; ♂ = male, ♀ = female. Panels B, D, and F are scatter plots showing the relationship between the physiological parameters and age (N = 115). Each marker represents data from one subject.
There was no significant difference in global Yv between BD (70.22 ± 5.74%) and HC adolescents (69.54 ± 5.75%) after controlling for age and sex (F = 0.89, p = 0.349, ηp2 = 0.008; Figure 1C). Age was a significant covariate (F = 4.90, p = 0.029, ηp2 = 0.042). Since there was no significant difference between groups, the association between Yv and age was examined using the whole adolescent population (N = 115). Correlation analysis revealed that age had a significant effect on global Yv (r = −0.19, p = 0.045; Figure 1D). Specifically, there was an age-related decline of global Yv at a rate of 0.77% per year. Furthermore, there was a significant positive correlation between Yv and CBF values across subjects (r = 0.42, p < 0.001).
There was no significant difference in global CMRO2 between BD (156.27 ± 31.45 μmol/100 g/min) and HC adolescents (152.11 ± 33.74 μmol/100 g/min) when controlling for age and sex (F = 0.54, p = 0.47, ηp2 = 0.005; Figure 1E). Sex was a significant covariate (F = 20.67, p < 0.001, ηp2 = 0.157). Overall, female participants had higher CMRO2 compared to males (165.30 ± 33.0 vs. 139.79 ± 25.73 μmol/100 g/min, respectively; t = 4.51, p < 0.001, d = 0.86). There was no significant association between age and CMRO2 (r = 0.06, p = 0.50; Figure 1F).
Global CBF, Yv, and CMRO2 were not significantly correlated with the total mood scores for mania (MRS) or depression (DEP-P) (N = 115, p > 0.05). To assess if the participants’ mood episode at the time of the MRI scan was associated with the cerebral metabolic measures, BD adolescents were further classified into three groups using their mood scores: presently hypomanic/mixed (MRS ≥12 with or without DRS ≥13; n = 23), presently depressed (DRS ≥13 and MRS ≤11; n = 17), and presently euthymic (DRS <12 and MRS ≤11; n = 18). Comparison of BD participants in the different mood states did not reveal any significant differences in the measurements for global Yv, CBF, and CMRO2 when controlling for age and sex (Table 2).
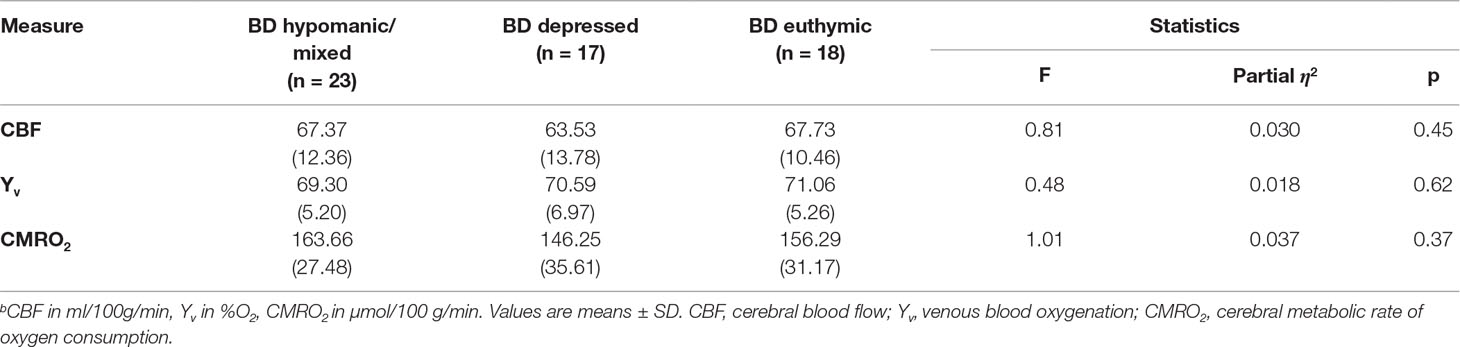
Table 2 CBF, Yv, and CMRO2 across mood states.b
Smoking is a potential confounding variable that might influence cerebral hemodynamics and oxygen metabolism. Sensitivity analysis was therefore conducted to examine the effect of excluding the smokers (n = 7) in the BD group. Exclusion of these participants did not change the results for any of the above analyses.
A large number of BD participants were using various medication including second-generation antipsychotics (SGAs; 60%) and lithium (22%; Table 1). To examine the effect of medication on the MRI measures, ANCOVA analysis was rerun covarying for medication usage in addition to age and sex. Current SGA use was a marginally significant covariate of Yv (F = 4.06, p = 0.046) but not CBF or CMRO2. Lithium use was not significantly associated with any of the three measures.
To the best of our knowledge, this is the first study to characterize cerebral oxygen metabolism in BD as well as in an adolescent population. We hypothesized that individuals with BD would show alterations in baseline CMRO2 to reflect the change in CBF observed in prior studies (12, 39). Interestingly, our results demonstrate that although there is an increase in CBF among BD adolescents, the rate of global oxygen metabolism is unchanged. This imbalance between blood supply and oxygen consumption in the BD brain may reflect inefficiency in energy metabolism and the presence of some compensatory process to maintain CMRO2. Alternative interpretations of this finding are discussed herein.
We did not observe a group effect of CMRO2, which is to say that this largely global measure of oxygen consumption is not different between BD and HCs. The total GM CBF was significantly higher in BD compared to controls. This would in principle contribute to an increased CMRO2 in BD, but this CBF group effect was a fairly modest effect size, whereas Yv was not significantly different between groups. Therefore, since CBF and Yv are used together to calculate CMRO2, this helps to explain why there was no significant oxygen consumption group effect.
The relationship between CBF and CMRO2 has been the topic of investigation for several decades. It is widely accepted that there is tight coupling between CBF and CMRO2 at baseline (40). However, multiple studies have shown that there is an “uncoupling” between CBF and CMRO2 during neuronal activation (41–44). Specifically, the increase in CBF during activation has been observed to be significantly greater than the increase in CMRO2. In our study, although we were examining baseline physiology in the absence of neural stimulation, our results showed a significant increase in CBF without any changes in CMRO2, which appears to be similar to this phenomenon. If BD adolescents indeed have altered coupling between CBF and CMRO2 at baseline, it remains to be seen how this will affect CBF/CMRO2 coupling during neural stimulation. Our finding of an increase in CBF in the absence of alterations in CMRO2 can also be related to the phenomenon observed in hypercapnia experiments where there is a hypercapnia-induced increase in CBF with negligible change in CMRO2 (45, 46).
Another plausible interpretation of our results is that the increase in baseline CBF in BD might exist to serve functions other than oxygen metabolism. In addition to oxygen, the blood also carries and delivers glucose, the main source of energy for the brain. Similar to CMRO2, the cerebral glucose metabolic rate of glucose (CMRglu) represents another important index of neural function and energy homeostasis. However, unlike CMRO2, it is widely accepted that there is a tight coupling between CMRglu and CBF during neural activation. Indeed, in their seminal work, Fox and colleagues demonstrated that the increase is CBF (50%) during neural activation is associated with a similar increase in CMRglu (51%) but a far more muted increase in CMRO2 (5%) (42). Thus, it is possible that the increase in CBF observed in our BD participants might be related to alterations in CMRglu.
Molecular studies examining mitochondrial function and oxidative stress provide strong evidence showing that energy metabolism is disturbed in BD (18, 47). In addition, studies have reported elevated lactate concentration in the brain (19) and cerebrospinal fluid (20) of individuals with BD. Furthermore, metabolomic analysis has found increased serum levels of pyruvate, the end product of glycolysis and the main fuel input for the citric acid cycle (CAC), in BD patients (48). Taken together, these findings suggest that there is a shift in metabolism from oxidative phosphorylation to the less-efficient glycolysis pathway in the brain of BD patients (49). Whereas the complete oxidation of glucose yields large amounts of energy in the form of ATP (30–36 ATP), glycolysis only produces 2 ATP (50). Thus, the brain of BD individuals may require more fuel in the form of glucose to meet the high energy demands of the brain. The increase in CBF observed in our study might reflect a compensatory mechanism in place to increase glucose delivery to the brain of BD participants. This is in line with our hypothesis discussed earlier that the increase in CBF observed in BD participants may serve functions other than oxygen metabolism. Future studies that relate CMRO2 with arterial lactate-to-glucose ratios in BD are warranted.
Although we did not observe a difference in global CMRO2 between groups, it is possible that alterations in oxygen metabolism may exist and are localized to specific brain regions in BD. Multiple studies have demonstrated structural changes, more specifically GM volume reduction in specific regions of the brain (i.e. anterior cingulate cortex, middle frontal gyrus) of patients with mood disorders (51, 52). Furthermore, in our prior study examining CBF in BD adolescents, we found that CBF was significantly increased and localized in brain regions including the medial frontal and middle cingulate regions compared to HCs (12). Thus, it is can be expected that these brain regions that show structural changes and region-specific elevation in CBF will also have localized changes in energy metabolism. The current TRUST MRI acquisition provides only a global estimate of CMRO2; thus, we are unable to provide insight on regional changes.
A recent study from our group identified that CBF is altered according to mood states in adolescents with BD (39). Therefore, in the present study, we similarly divided our BD participants into three groups, euthymic, depressed, or manic/hypomanic/mixed, to explore the possibility that CMRO2 might also vary by mood state. We did not detect any significant differences in CBF, Yv, or CMRO2 between the three BD groups. As discussed earlier, it is likely that alterations in these physiological parameters may be localized rather than occur at a global level. Indeed, the mood state–related changes in CBF observed in the study mentioned were localized to certain brain regions (i.e. anterior cingulate cortex).
We observed an age-related decline in Yv, which is a novel finding for this age group but is consistent with results from previous studies on normal adult aging (21, 28). This indicates that a greater fraction of oxygen is extracted by the brains of older individuals, which suggests alterations in oxygen demand with age. Interestingly, the rate of decline observed in our adolescent population is much greater (0.77% per year) than that reported in one study conducted on an older population (0.14% per year in ages 20–89 years) (21). This may be reflected by the fact that the developing brain undergoes extensive metabolic changes that persist until 16–18 years of age (53). In contrast to Yv, we did not observe any significant association between age and CBF or age and CMRO2. A number of studies have previously reported a decline in CBF with age (22, 54, 55). While our age range spanned early adolescence to young adulthood (14–21 years), in actuality, the vast majority of participants were in mid-adolescence (17.3 ± 1.4 years); as such, the age variance across participants was likely not sufficient to detect an effect of age on CBF. We observed a significant positive association between CBF and Yv, which is consistent with prior findings in adults (56). Literature on age-related changes in CMRO2 is inconsistent, with some studies reporting increased CMRO2 with age (21, 22), while others have reported no change (57, 58) or even a decrease in CMRO2 across the life span (37, 59).
We found that adolescent females have greater CBF and CMRO2 compared to males. This finding is in line with recent studies conducted on older healthy cohorts (21, 22). Although it is not fully understood why such sex differences exist, a few hypotheses have been proposed. First, as females tend to have lower hematocrit values, it is thought that more CBF might be needed to carry an equivalent amount of oxygen as compared to males (21, 60). Others have attributed the higher baseline metabolic rate in women to the effect of hormones (i.e. estrogen) (61). In addition, differences in brain structure and size might also be a factor that reflects the observed sex-related differences.
There are some limitations to address in the present study. As described earlier, the TRUST MRI technique is limited to global estimations of Yv and CMRO2, as measurement is confined to a large terminal draining veins (i.e. SSS). Thus, we were unable to obtain information on any potential regional metabolic changes. Moreover, it is important to note that although our ROI for TRUST, the SSS, drains most of the cerebral cortex, not all of the cerebral blood is drained through this sinus (e.g. deep cerebral regions drain through the straight sinus instead). Therefore, Yv might be underestimated in deeper cerebral regions. Second, our estimate of global CBF was based solely on ROI analysis of GM regions and does not account for CBF in white matter. Third, we did not measure Ya using pulse oximetry for participants in this study and therefore estimated it to be a constant value of 99% based on physiological literature. The effect of this is likely to be minimal, as Ya has been observed to be close to unity and minimally affected by age (21, 37). Similarly, we estimated hematocrit values (used for T2 calibration for TRUST) using laboratory reference values accounting for both age and sex instead of blood sampling to keep our study procedures completely noninvasive. Lastly, a large portion of our BD participants were using medication that might have impacted our findings. Indeed, medication use has previously been shown to influence CBF as well as cerebral metabolism (62–64).
In conclusion, this study demonstrates that cerebral oxygen utilization is not altered in adolescents with BD, despite the increased CBF observed in this population. Our results provide new insight on baseline energy homeostasis processes in BD. Furthermore, we found sex differences in that female adolescents overall have higher CBF and CMRO2 than males. In addition, a rapid decrease of Yv from adolescence to young adulthood was observed. Although the TRUST technique used herein offers several advantages that include noninvasiveness, speed (∼1.5 min scan), and feasibility in children and adolescents, it is limited to global estimations of Yv and CMRO2. Research is currently underway to develop noninvasive MRI techniques for 3-D brain oxygenation mapping that permits Yv quantification in both large sinuses as well as smaller cortical veins (65). Future studies that use these novel techniques are warranted to examine if there are any region-specific metabolic changes in BD.
The datasets generated for this study will not be made publicly available. We did not obtain consent from our participants for sharing of data when the study was conceived, so we cannot provide raw participant-level data.
The studies involving human participants were reviewed and approved by Sunnybrook Health Sciences Centre Research Ethics Board. Written informed consent to participate in this study was provided by the participants’ legal guardian/next of kin.
SK performed data processing and analysis, interpreted results, and prepared the figures and manuscript. LF assisted with statistical analysis and revised the manuscript. AG helped with data processing and revised the manuscript. HL provided technical guidance and revised the manuscript. BG and BM contributed to study conception and experimental design and assisted with manuscript preparation.
This research was supported by a grant to BIG from the Ontario Mental Health Foundation and Canadian Institutes of Health Research (CIHR). BJM received a National Alliance for Research on Schizophrenia & Depression (NARSAD) Independent Investigator Award from the Brain and Behavior Foundation.
The authors declare that the research was conducted in the absence of any commercial or financial relationships that could be construed as a potential conflict of interest.
The authors thank Garry Detzler and Ruby Endre for MRI data collection and Dr. Andrew Robertson for his technical assistance. We would also like to thank all our participants and the staff at the Center for Youth Bipolar Disorder.
1. Goldstein BI, Carnethon MR, Matthews KA, McIntyre RS, Miller GE, Raghuveer G, et al. Major depressive disorder and bipolar disorder predispose youth to accelerated atherosclerosis and early cardiovascular disease. Circulation (2015) 132:965–86. doi: 10.1161/CIR.0000000000000229
2. Goldstein BI, Fagiolini A, Houck P, Kupfer DJ. Cardiovascular disease and hypertension among adults with bipolar I disorder in the United States. Bipolar Disord (2009) 11:657–62. doi: 10.1111/j.1399-5618.2009.00735.x
3. Schaffer A, Isometsä ET, Tondo L, Moreno D, Turecki G, Reis C, et al. International Society for Bipolar Disorders Task Force on Suicide: meta-analyses and meta-regression of correlates of suicide attempts and suicide deaths in bipolar disorder. Bipolar Disord (2015) 17:1–16. doi: 10.1111/bdi.12271
4. Westman J, Hällgren J, Wahlbeck K, Erlinge D, Alfredsson L, Ösby U. Cardiovascular mortality in bipolar disorder: a population-based cohort study in Sweden. BMJ Open (2013) 3:e002373. doi: 10.1136/bmjopen-2012-002373
5. Beyer JL, Young R, Kuchibhatla M, Krishnan KRR. Hyperintense MRI lesions in bipolar disorder: a meta-analysis and review. Int Rev Psychiatry (2009) 21:394–409. doi: 10.1080/09540260902962198
6. Toma S, MacIntosh BJ, Swardfager W, Goldstein BI. Cerebral blood flow in bipolar disorder: a systematic review. J Affect Disord (2018) 241:505–13. doi: 10.1016/j.jad.2018.08.040
7. Jennings JR, Heim AF, Kuan DCH, Gianaros PJ, Muldoon MF, Manuck SB. Use of total cerebral blood flow as an imaging biomarker of known cardiovascular risks. Stroke (2013) 44:2480–5. doi: 10.1161/STROKEAHA.113.001716
8. Attwell D, Laughlin SB. An energy budget for signaling in the grey matter of the brain. J Cereb Blood Flow Metab (2001) 21:1133–45. doi: 10.1097/00004647-200110000-00001
9. Bhardwaj R, Chakrabarti S, Mittal BR, Sharan P. A single photon emission computerized tomography (SPECT) study of regional cerebral blood flow in bipolar disorder. World J Biol Psychiatry (2010) 11:334–43. doi: 10.3109/15622970802575977
10. Ito H, Kawashima R, Awata S, Ono S, Sato K, Goto R, et al. Hypoperfusion in the limbic system and prefrontal cortex in depression: SPECT with anatomic standardization technique. J Nucl Med (1996) 37:410–4.
11. Drevets WC, Price JL, Simpson JR, Todd RD, Reich T, Vannier M, et al. Subgenual prefrontal cortex abnormalities in mood disorders. Nature (1997) 386:824–7. doi: 10.1038/386824a0
12. MacIntosh BJ, Shirzadi Z, Scavone A, Metcalfe AW, Islam AH, Korczak D, et al. Increased cerebral blood flow among adolescents with bipolar disorder at rest is reduced following acute aerobic exercise. J Affect Disord (2017) 208:205–13. doi: 10.1016/j.jad.2016.08.060
13. Kato T, Takahashi S, Shioiri T, Inubushi T. Brain phosphorous metabolism in depressive disorders detected by phosphorus-31 magnetic resonance spectroscopy. J Affect Disord (1992) 26:223–30. doi: 10.1016/0165-0327(92)90099-R
14. Kato T, Takahashi S, Shioiri T, Murashita J, Hamakawa H, Inubushi T. Reduction of brain phosphocreatine in bipolar II disorder detected by phosphorus-31 magnetic resonance spectroscopy. J Affect Disord (1994) 31:125–33. doi: 10.1016/0165-0327(94)90116-3
15. Kato T, Stine OC, McMahon FJ, Crowe RR. Increased levels of a mitochondrial DNA deletion in the brain of patients with bipolar disorder. Biol Psychiatry (1997) 42:871–5. doi: 10.1016/S0006-3223(97)00012-7
16. Kato T, Kunugi H, Nanko S, Kato N. Mitochondrial DNA polymorphisms in bipolar disorder. J Affect Disord (2001) 62:151–64. doi: 10.1016/S0165-0327(99)00173-1
17. Cataldo AM, McPhie DL, Lange NT, Punzell S, Elmiligy S, Ye NZ, et al. Abnormalities in mitochondrial structure in cells from patients with bipolar disorder. Am J Pathol (2010) 177:575–85. doi: 10.2353/ajpath.2010.081068
18. Andreazza AC, Shao L, Wang J-F, Young LT. Mitochondrial complex I activity and oxidative damage to mitochondrial proteins in the prefrontal cortex of patients with bipolar disorder. Arch Gen Psychiatry (2010) 67:360–8. doi: 10.1001/archgenpsychiatry.2010.22
19. Dager SR, Friedman SD, Parow A, Demopulos C, Stoll AL, Lyoo IK, et al. Brain metabolic alterations in medication-free patients with bipolar disorder. Arch Gen Psychiatry (2004) 61:450–8. doi: 10.1001/archpsyc.61.5.450
20. Regenold WT, Phatak P, Marano CM, Sassan A, Conley RR, Kling MA. Elevated cerebrospinal fluid lactate concentrations in patients with bipolar disorder and schizophrenia: implications for the mitochondrial dysfunction hypothesis. Biol Psychiatry (2009) 65:489–94. doi: 10.1016/j.biopsych.2008.11.010
21. Lu H, Xu F, Rodrigue KM, Kennedy KM, Cheng Y, Flicker B, et al. Alterations in cerebral metabolic rate and blood supply across the adult lifespan. Cereb Cortex (2011) 21:1426–34. doi: 10.1093/cercor/bhq224
22. Peng SL, Dumas JA, Park DC, Liu P, Filbey FM, McAdams CJ, et al. Age-related increase of resting metabolic rate in the human brain. Neuroimage (2014) 98:176–83. doi: 10.1016/j.neuroimage.2014.04.078
23. Ogawa M, Fukuyama H, Ouchi Y, Yamauchi H, Kimura J. Altered energy metabolism in Alzheimer’s disease. J Neurol Sci (1996) 139:78–82. doi: 10.1016/0022-510X(96)00033-0
24. Borghammer P, Vafaee M, Ostergaard K, Rodell A, Bailey C, Cumming P. Effect of memantine on CBF and CMRO2 in patients with early Parkinson’s disease. Acta Neurol Scand (2008) 117:317–23. doi: 10.1111/j.1600-0404.2007.00943.x
25. Ge Y, Zhang Z, Lu H, Tang L, Jaggi H, Herbert J, et al. Characterizing brain oxygen metabolism in patients with multiple sclerosis with T2-relaxation-under-spin-tagging MRI. J Cereb Blood Flow Metab (2012) 32:403–12. doi: 10.1038/jcbfm.2011.191
26. Kety SS, Schmidt CF. The effects of altered arterial tensions of carbon dioxide and oxygen on cerebral blood flow and cerebral oxygen consumption of normal young men. J Clin Invest (1948) 27:484–92. doi: 10.1172/JCI101995
27. Lu H, Xu F, Grgac K, Liu P, Qin Q, van Zijl P. Calibration and validation of TRUST MRI for the estimation of cerebral blood oxygenation. Magn Reson Med (2012) 67:42–9. doi: 10.1002/mrm.22970
28. Liu P, Dimitrov I, Andrews T, Crane DE, Dariotis JK, Desmond J, et al. Multisite evaluations of a T2-relaxation-under-spin-tagging (TRUST) MRI technique to measure brain oxygenation. Magn Reson Med (2016) 75:680–7. doi: 10.1002/mrm.25627
29. Kaufman J, Birmaher B, Brent D, Rao U, Flynn C, Moreci P, et al. Schedule for Affective Disorders and Schizophrenia for School-Age Children—Present and Lifetime Version (K-SADS-PL): initial reliability and validity data. J Am Acad Child Adolesc Psychiatry (1997) 36:980–8. doi: 10.1097/00004583-199707000-00021
30. Chambers WJ, Puig-Antich J, Hirsch M, Paez P, Ambrosini PJ, Tabrizi MA, et al. The assessment of affective disorders in children and adolescents by semistructured interview. Test–retest reliability of the Schedule for Affective Disorders and Schizophrenia for School-Age Children, Present Episode Version. Arch Gen Psychiatry (1985) 42:696–702. doi: 10.1001/archpsyc.1985.01790300064008
31. Axelson D, Birmaher BJ, Brent D, Wassick S, Hoover C, Bridge J, et al. A preliminary study of the Kiddie Schedule for Affective Disorders and Schizophrenia for School-Age Children mania rating scale for children and adolescents. J Child Adolesc Psychopharmacol (2003) 13:463–70. doi: 10.1089/104454603322724850
32. American Psychiatric Association. Diagnostic and statistical manual of mental disorders, fourth edition, text revision (DSM-IV-TR). 4th ed. Arlington, VA, DC: American Psychiatric Association (2000). doi: 10.1176/appi.books.9780890423349
33. Birmaher B, Axelson D, Strober M, Gill MK, Valeri S, Chiappetta L, et al. Clinical course of children and adolescents with bipolar spectrum disorders. Arch Gen Psychiatry (2006) 63:175–83. doi: 10.1001/archpsyc.63.2.175
34. Alsop DC, Detre JA, Golay X, Günther M, Hendrikse J, Hernandez-Garcia L, et al. Recommended implementation of arterial spin-labeled perfusion MRI for clinical applications: a consensus of the ISMRM perfusion study group and the European consortium for ASL in dementia. Magn Reson Med (2015) 73:102–16. doi: 10.1002/mrm.25197
35. Lu H, Ge Y. Quantitative evaluation of oxygenation in venous vessels using T2-relaxation-under-spin-tagging MRI. Magn Reson Med (2008) 60:357–63. doi: 10.1002/mrm.21627
36. LifeLabs. Test information directory. Available at: http://tests.lifelabs.com/test_information.aspx?id=26967&view=reporting [Accessed June 1, 2018].
37. Leenders KL, Perani D, Lammertsma AA, Heather JD, Buckingham P, Healy MJ, et al. Cerebral blood flow, blood volume and oxygen utilization. Normal values and effect of age. Brain (1990) 113:27–47. doi: 10.1093/brain/113.1.27
39. Toma S, MacIntosh B, Grigorian A, Fiksenbaum L, Robertson A, Goldstein BI. F133. Cerebral blood flow is altered according to mood states in adolescents with bipolar disorder. Biol Psychiatry (2019) 85:S265. doi: 10.1016/j.biopsych.2019.03.670
40. Gusnard DA, Raichle ME. Searching for a baseline: Functional imaging and the resting human brain. Nat Rev Neurosci (2001) 2:685–94. doi: 10.1038/35094500
41. Fox PT, Raichle ME. Focal physiological uncoupling of cerebral blood flow and oxidative metabolism during somatosensory stimulation in human subjects. Proc Natl Acad Sci U S A (1986) 83:1140–4. doi: 10.1073/pnas.83.4.1140
42. Fox PT, Raichle ME, Mintun MA, Dence C. Nonoxidative glucose consumption during focal physiologic neural activity. Science (1988) 241:462–4. doi: 10.1126/science.3260686
43. Kastrup A, Krüger G, Neumann-Haefelin T, Glover GH, Moseley ME. Changes of cerebral blood flow, oxygenation, and oxidative metabolism during graded motor activation. Neuroimage (2002) 15:74–82. doi: 10.1006/nimg.2001.0916
44. Seitz RJ, Roland PE. Vibratory stimulation increases and decreases the regional cerebral blood flow and oxidative metabolism: a positron emission tomography (PET) study. Acta Neurol Scand (1992) 86:60–7. doi: 10.1111/j.1600-0404.1992.tb08055.x
45. Chen JJ, Pike GB. Global cerebral oxidative metabolism during hypercapnia and hypocapnia in humans: implications for BOLD fMRI. J Cereb Blood Flow Metab (2010) 30:1094–9. doi: 10.1038/jcbfm.2010.42
46. Davis TL, Kwong KK, Weisskoff RM, Rosen BR. Calibrated functional MRI: mapping the dynamics of oxidative metabolism. Proc Natl Acad Sci U S A (1998) 95:1834–9. doi: 10.1073/pnas.95.4.1834
47. Clay HB, Sillivan S, Konradi C. Mitochondrial dysfunction and pathology in bipolar disorder and schizophrenia. Int J Dev Neurosci (2011) 29:311–24. doi: 10.1016/j.ijdevneu.2010.08.007
48. Yoshimi N, Futamura T, Kakumoto K, Salehi AM, Sellgren CM, Holmén-Larsson J, et al. Blood metabolomics analysis identifies abnormalities in the citric acid cycle, urea cycle, and amino acid metabolism in bipolar disorder. BBA Clin (2016) 5:151–8. doi: 10.1016/j.bbacli.2016.03.008
49. Kim Y, Santos R, Gage FH, Marchetto MC. Molecular mechanisms of bipolar disorder: progress made and future challenges. Front Cell Neurosci (2017) 11:30. doi: 10.3389/fncel.2017.00030
50. Magistretti PJ, Allaman I. A cellular perspective on brain energy metabolism and functional imaging. Neuron (2015) 86:883–901. doi: 10.1016/j.neuron.2015.03.035
51. Bora E, Fornito A, Yücel M, Pantelis C. Voxelwise meta-analysis of gray matter abnormalities in bipolar disorder. Biol Psychiatry (2010) 67:1097–105. doi: 10.1016/j.biopsych.2010.01.020
52. Kandilarova S, Stoyanov D, Sirakov N, Maes M, Specht K. Reduced grey matter volume in frontal and temporal areas in depression: contributions from voxel-based morphometry study. Acta Neuropsychiatr (2019) 31(5):252–57. doi: 10.1017/neu.2019.20
53. Chugani HT. A critical period of brain development: studies of cerebral glucose utilization with PET. Prev Med (Baltim) (1998) 27:184–8. doi: 10.1006/pmed.1998.0274
54. Bertsch K, Hagemann D, Hermes M, Walter C, Khan R, Naumann E. Resting cerebral blood flow, attention, and aging. Brain Res (2009) 1267:77–88. doi: 10.1016/j.brainres.2009.02.053
55. Chen JJ, Rosas HD, Salat DH. Age-associated reductions in cerebral blood flow are independent from regional atrophy. Neuroimage (2011) 55:468–78. doi: 10.1016/j.neuroimage.2010.12.032
56. Xu F, Ge Y, Lu H. Noninvasive quantification of whole-brain cerebral metabolic rate of oxygen (CMRO2) by MRI. Magn Reson Med (2009) 62:141–8. doi: 10.1002/mrm.21994
57. Itoh M, Hatazawa J, Miyazawa H, Matsui H, Meguro K, Yanai K, et al. Stability of cerebral blood flow and oxygen metabolism during normal aging. Gerontology (1990) 36:43–8. doi: 10.1159/000213174
58. Catchlove SJ, Macpherson H, Hughes ME, Chen Y, Parrish TB, Pipingas A. An investigation of cerebral oxygen utilization, blood flow and cognition in healthy aging. PLoS One (2018) 13:e0197055. doi: 10.1371/journal.pone.0197055
59. Aanerud J, Borghammer P, Chakravarty MM, Vang K, Rodell AB, Jónsdottir KY, et al. Brain energy metabolism and blood flow differences in healthy aging. J Cereb Blood Flow Metab (2012) 32:1177–87. doi: 10.1038/jcbfm.2012.18
60. Shaw TG, Mortel KF, Meyer JS, Rogers RL, Hardenberg J, Cutaia MM. Cerebral blood flow changes in benign aging and cerebrovascular disease. Neurology (1984) 34:855–62. doi: 10.1212/WNL.34.7.855
61. Baxter LR, Mazziotta JC, Phelps ME, Selin CE, Guze BH, Fairbanks L. Cerebral glucose metabolic rates in normal human females versus normal males. Psychiatry Res (1987) 21:237–45. doi: 10.1016/0165-1781(87)90028-X
62. Chen Y, Wan HI, O’Reardon JP, Wang DJJ, Wang Z, Korczykowski M, et al. Quantification of cerebral blood flow as biomarker of drug effect: arterial spin labeling phMRI after a single dose of oral citalopram. Clin Pharmacol Ther (2011) 89:251–8. doi: 10.1038/clpt.2010.296
63. Preskorn SH, Raichle ME, Hartman BK. Antidepressants alter cerebrovascular permeability and metabolic rate in primates. Science (1982) 217:250–2. doi: 10.1126/science.7089562
64. Drevets WC, Bogers W, Raichle ME. Functional anatomical correlates of antidepressant drug treatment assessed using PET measures of regional glucose metabolism. Eur Neuropsychopharmacol (2002) 12:527–44. doi: 10.1016/S0924-977X(02)00102-5
Keywords: bipolar disorder, adolescent, cerebral metabolic rate of oxygen, CMRO2, cerebral blood flow, venous oxygenation, TRUST MRI
Citation: Karthikeyan S, Fiksenbaum L, Grigorian A, Lu H, MacIntosh BJ and Goldstein BI (2019) Normal Cerebral Oxygen Consumption Despite Elevated Cerebral Blood Flow in Adolescents With Bipolar Disorder: Putative Neuroimaging Evidence of Anomalous Energy Metabolism. Front. Psychiatry 10:739. doi: 10.3389/fpsyt.2019.00739
Received: 03 July 2019; Accepted: 16 September 2019;
Published: 11 October 2019.
Edited by:
Joaquim Radua, August Pi i Sunyer Biomedical Research Institute (IDIBAPS), SpainReviewed by:
Drozdstoy Stoyanov Stoyanov, Plovdiv Medical, University, BulgariaCopyright © 2019 Karthikeyan, Fiksenbaum, Grigorian, Lu, MacIntosh and Goldstein. This is an open-access article distributed under the terms of the Creative Commons Attribution License (CC BY). The use, distribution or reproduction in other forums is permitted, provided the original author(s) and the copyright owner(s) are credited and that the original publication in this journal is cited, in accordance with accepted academic practice. No use, distribution or reproduction is permitted which does not comply with these terms.
*Correspondence: Benjamin I. Goldstein, YmVuamFtaW4uZ29sZHN0ZWluQHN1bm55YnJvb2suY2E=
Disclaimer: All claims expressed in this article are solely those of the authors and do not necessarily represent those of their affiliated organizations, or those of the publisher, the editors and the reviewers. Any product that may be evaluated in this article or claim that may be made by its manufacturer is not guaranteed or endorsed by the publisher.
Research integrity at Frontiers
Learn more about the work of our research integrity team to safeguard the quality of each article we publish.