 Xiao Li
 Huaqing Meng1
 Yixiao Fu
 Lian Du
 Qibin Chen
94% of researchers rate our articles as excellent or good
Learn more about the work of our research integrity team to safeguard the quality of each article we publish.
Find out more
ORIGINAL RESEARCH article
Front. Psychiatry, 01 March 2019
Sec. Neuroimaging
Volume 10 - 2019 | https://doi.org/10.3389/fpsyt.2019.00007
This article is part of the Research TopicBrain and Somatization Symptoms in Psychiatric DisordersView all 28 articles
To explore the alteration of global functional connectivity density (gFCD) in depressive patients after modified electroconvulsive therapy (MECT) and analyze the relationship between gFCD and clinical outcome. Thirty-seven subjects were evaluated based on the diagnostic criteria of the International Classification of Diseases-10 (ICD-10), consisting of a depressive group (24 patients after follow-ups) and a healthy control group with 13 normal individuals. All participants received Hamilton Depression Scale (HAMD) scores and resting-state functional magnetic resonance imaging scans. The gFCD significantly increased in the posterior-middle insula, the supra-marginal gyrus and the dorsal medial prefrontal cortex (dmPFC) before MECT treatment compared to healthy controlled patients. The gFCD statistically expanded in the perigenual anterior cingulate cortex (pgACC), the orbitofrontal cortex bilaterally and the left-supra-marginal gyrus after MECT, and it decreased notably in the posterior insula. The gFCD in the pgACC and the right orbital frontal cortex of depressive group before MECT showed a positive correlation with HAMD scores with treatment. Conforming to the impact of gFCD in depressive patients after MECT, the aforementioned brain region may become an indicator of MECT effect.
Major depressive disorder (MDD) is one of the most common mental disorders; however, limited therapeutic options are available, creating an enormous individual and societal burden. An estimated 30% of patients with MDD still suffer from functional impairment and antidepressant drugs are only partially effective (1). Modified Electroconvulsive therapy (MECT) is known as a useful treatment for MDD and works by eliciting controlled, transient seizures in both acute and maintenance sessions (2). Several meta-analyses have confirmed the antidepressant effectiveness of MECT for depression (3–5).
However, not all patients respond to MECT. Approximately only 50% of patients experience remission when receiving right-unilateral MECT with optimal parameters, and the specific neural mechanism of action still remains unclear. Until now, the modulatory effect of MECT on brain functional connectivity density (FCD) has only been reported in a few studies. Some found the dorsal-lateral prefrontal cortex (DLPFC) was crucial for achieving a therapeutic response by MECT (6–8). Previous studies have shown symptom recovery in some regions, such as the amygdala or the subgenual anterior cingulated cortex (sgACC) (9, 10). Cano et al. (11) found that substantial intra-limbic functional connectivity (FC) decreases predicted a later increase in limbic–prefrontal FC, which could predict clinical improvement at the end of a course of ECT.
As a voxel-wise, data-driven method, functional connectivity density mapping (FCDM) is widely used to test the density distribution of whole-brain resting-state FC (12–14), such as resting-state global functional connectivity density (rs-gFCD). Rs-gFCD is been referred to as the level of centrality (15) or intrinsic connectivity contrast (16). For some neuropsychiatric disorders, rs-gFCD was suggested to be a biomarker (15, 17, 18). Increased FCDs shows the elevated number and strength of FC may indicate its important role for understanding the mechanism in these brain areas. Kandilarova et al. (19) found, according to spectral dynamic causal modeling, that significantly reduced strength of the connection from the MFG (i.e., dorsolateral prefrontal cortex) to the anterior insula was shown in patients, and a strong connection was found between the anterior insula and the amygdala. This research may be used to predict treatment response.
Neuroimaging research of ECT has particularly assessed brain function before and after treatment (20–22), but have not tried to characterize functional changes occurring at various treatment phases. These measurements may have important clinical utility as an outcome predictor (23) and may help to reveal the mechanism of antidepressant treatments.
In this study, we hypothesized that a complex interaction between MECT-induced gFCD changes and clinical improvement will emerge in patients with MDD. Therefore, to demonstrate this relationship, we assessed a group of patients with MDD and compared them to healthy controls. We used functional magnetic resonance imaging to examine developments in global functional connectivity density and assessed alterations in Hamilton depression scale (HAMD) scores during MECT. We measured gFCD in the depressive group before MECT and in the healthy controls, and after 8 courses of MECT, we tested gFCD in the depressive group again. The specific objectives of the study were as follows: [1) to assess changes in specific regions throughout the course of ECT and [2) to expose the relationship between ECT-induced gFCD changes and clinical response.
Twenty-four patients and 13 demographically similar healthy control subjects received informed consent forms for participation in the research, which was approved by the First Affiliated Hospital of Chongqing Medical University. All the methods followed relevant regulations. Diagnostic assessment and response were assessed by experienced psychiatrists in depression and relevant scales. All the patients would take a clinical assessment before ECT including routine blood testing, chest X-rays, and brain CT scans (11). They were all experiencing MDD as defined by the ICD-10 and were screened using the Hamilton Depression Scale (pre-ECT 31.3 ± 8.6; post-ECT8.58 ± 5.62; healthy-control 2.21 ± 1.25). Subjects were excluded if they: (i) had a neurological or serious physical condition or any history of alcohol or drug abuse, or any other somatic diseases, or morphological anomalies of the brain, (ii) had any surgically-placed electronic or metal materials that might interfere with fMRI assessment, (iii) slept while scanning and/or (iv) had head motion exceeding 3 mm in translation or 3 degrees in rotation. The Local Medical Ethics Committee of the First Affiliated Hospital of Chongqing Medical University reviewed and confirmed the study protocol. Written informed consent was obtained from all subjects.
The patients underwent modified bi-frontotemporal ECT which was conducted using a Thymatron (TM) DGx (Somatics LLC, Lake Bluff, IL, USA), which is the brief-pulse, constant-current apparatus at the psychiatry department of the First Affiliated Hospital of Chongqing Medical University (24). The first three courses of ECT took place on continued days and the left courses of ECT were performed every 2 days, and it would have a break on weekends. After eight courses, ECT was continued if depressive symptoms had not changed sufficiently, as determined by a clinician, with a maximum of 12 courses of ECT. The initial dosage was confirmed based on age, weight and sex. Anesthesia was induced with succinylcholine (0.5–1 mg/kg) and diprivan (1.5–2 mg/kg).
A 3.0 Tesla MRI system (GE Signa) was used to obtain imaging data in the First Affiliated Hospital of Chongqing Medical University. Patients were asked to close their eyes peacefully and to keep their heads stable throughout MRI process and keep awake. After the MRI scan, they would be asked whether they had fallen asleep during the process (24). Resting-state fMRI images were collected using the following EPI sequence: repetition time: 2000 ms; echo time: 30 ms; flip angle: 90°; field of view: 240 × 240 mm2; matrix: 64 × 64; slice thickness: 5 mm; and number of slices: 33 axial slices. Two hundred volumes were obtained, resulting in a 400s scan time, then 3D T1-weighted anatomical images were collected (repetition time: 8.35 ms; flip angle: 12°; echo time: 3.27 ms; field of view: 240 × 240 mm2; matrix: 256 × 256; slice thickness: 1 mm; and the number of sagittal slices is 156) (25).
Data Processing & Analysis of Brain Imaging (DPABI) was used to assess resting-state data (26). The first 10 volumes of the functional images were abandoned to account for signal equilibrium (27). Slice timing and head motion correction were conducted in sequence for the remaining time points. The covariates, including head motion, white matter signal and cerebrospinal fluid signal, were regressed out from the time series of every voxel. Here, the Friston 24-parameter model was used to regress out head motion effects. To decrease effects of high-frequency noise and low-frequency drift, a 0.01–0.1 Hz band-pass filter was used. The registered images were spatially normalized to the Montreal Neurological Institute (MNI) template. The images were resampled to 3-mm cubic voxels. To smooth the normalized images, a 6-mm full width at half maximum Gaussian kernel was used. Additionally, the scrubbing procedure was employed, excluding any volume with a frame-wise dependent value exceeding 0.5, with the two subsequent volumes and one preceding volume. Finally, normalization quality was monitored by checking the normalization images subject by subject (28).
We used the DPARSF toolbox to calculate the functional connectivity density (FCD) of each voxel. High FCDs indicates increased strength and number of the respective FC, showing its significance in the brain. Between all the brain voxels, Pearson's correlation coefficients were calculated, so that the whole-brain functional connectivity matrix for each subject could be constructed. The degree centrality maps were computed using 0.3 (we also used 0.4 as the threshold for determining edges and found the results was similar) as the threshold for determining edges (12). Thus, the whole-brain maps were obtained by computing the number of voxels where the connections with other voxels in the BOLD time series exceeded the threshold in a whole-brain weighted graph.
First, the two-sample T-Test was selected to test the group differences in gFCD between pre-ECT MDD patients and the control group in a voxel-wise manner by using a general linear model with age, gender, and the motion (Mean FD) as nuisance covariates. A correction for multiple comparisons was performed using p < 0.05 with family-wise error (FWE), which is correct at the voxel level. Second, to investigate the therapeutic effect of ECT, the paired sample T-test was also used to test the differences between MDD before treatment and after treatment using ECT in a voxel-wise manner. Because the results may be easily impacted by noise, a conservative statistical threshold was specified at cluster level p < 0.05, which is correct with an underlying voxel level of p < 0.001(AlphaSim corrected) using DPABI (26) software. Additionally, one-way ANOVA was performed to test the difference in the ROI regions based on previous paired sample t results (pre-treatment vs. post-treatment) among the healthy controls, pre-treatment MDD and post-treatment MDD.
The statistical analysis of one-way ANOVA was implemented by SPSS 20 (IBM SPSS Statistics for Windows, Version 20.0, IBM Corp, Armonk, NY, USA). To characterize the relationship between HAMD scores and pre-/post- treatment, we computed Pearson's correlation analysis. Each group was compared with others by using a Bonferroni post hoc test with p < 0.05.
The psychological measurements and demographic data are listed in Table 1. In comparison with the healthy controls and post-treatment depressive subjects, the pre-treatment depressive subjects had more serious depressive symptoms according to HAMD scores. One-way ANOVA analyses indicated that the scores on the HAMD were remarkably different among the three groups (F = 232.4, p < 0.001). A pairwise comparison found that post-treatment periods were characterized by significantly lower depressive symptoms than pre-treatment intervals (F = −22.8, p < 0.001), yet subjects in the post-treatment stage still experienced markedly higher depressive symptoms compared to healthy control subjects (F = 6.4, p < 0.001). The depressive group and the healthy controls did not differ considerably with age (t = −0.55, p = 0.59) or sex (t = −0.81, p = 0.43). Compared with the healthy controls, the depressive patients had more years of education (t = −3.7, p < 0.001). The individual scores from the HAMD of all participants are shown along with the mean in Table 1, excluding 6 patients who refused further treatment because of symptom recovery at an early stage.
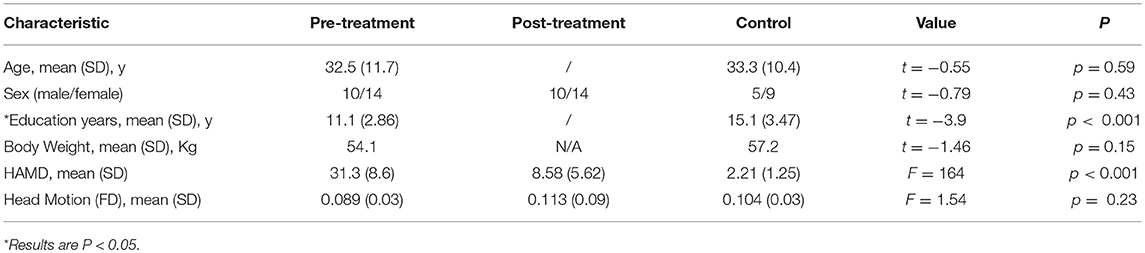
Table 1. The demographic data and psychological measurements of the healthy controls, pre-treatment and post-treatment depressive subjects.
In contrast with the healthy controls, the depressive patients in the pre-treatment phase exhibited a significantly increased gFCD in the posterior-middle insula, supra-marginal gyrus, and dorsal medial prefrontal cortex (all p < 0.05 with family wise error corrected, Figure 1). No regions showed decreased gFCD under the same statistical threshold.
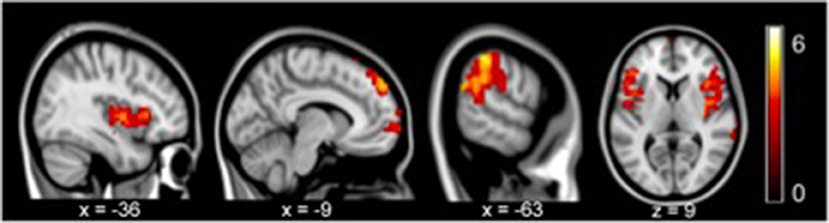
Figure 1. gFCD in pre-treatment revealed significant increases in the posterior-middle insula, supramarginal gyrus, and dorsal medial prefrontal cortex compared to the controls (p < 0.05, FEW).
Compared to the depressive patients in the pre-treatment period, the post-treatment depressive patients exhibited an obviously increased gFCD in the perigenual anterior cingulate cortex (pgACC), orbitofrontal cortex bilaterally and the left-supra-marginal gyrus. Moreover, depressive patients in the post-treatment stage exhibited decreased gFCD in the posterior insula compared to the pre-treatment phase (AlphaSim corrected p < 0.001 under voxel level uncorrected and cluster level under p < 0.05 familywise error corrected, Figure 2; Table 2).
Figure 2. gFCD of the depressive group statistically increased in the perigenual anterior cingulate cortex (pgACC), orbitofrontal cortex bilaterally and the left-supramarginal gyrus after MECT (p < 0.05, FEW). (A) Statistical increased gFCD in these regions post treatment. (B) Statistical decreased gFCD in these regions post treatment.
Table 2. Significant difference between different groups in global functional connectivity density (gFCD).
The results from the correlation analyses revealed that the gFCD activity in the pgACC (r = 0.46, p = 0.024) and right orbital frontal cortex (r = 0.5, p = 0.013) in the pre-treatment interval had a significant correlation with the post-treatment period HAMD scores (see Figure 3). However, there was no correlation between the gFCD pre-MECT and HAMD scores pre-MECT (p > 0.05). There was also no noticeable correlation between post-treatment gFCD and HAMD scores. The changes of gFCD and the differences of HAMD scores also had no significant correlation. These results indicated that the gFCD activity present in pre-treatment may predict the post-treatment outcome.
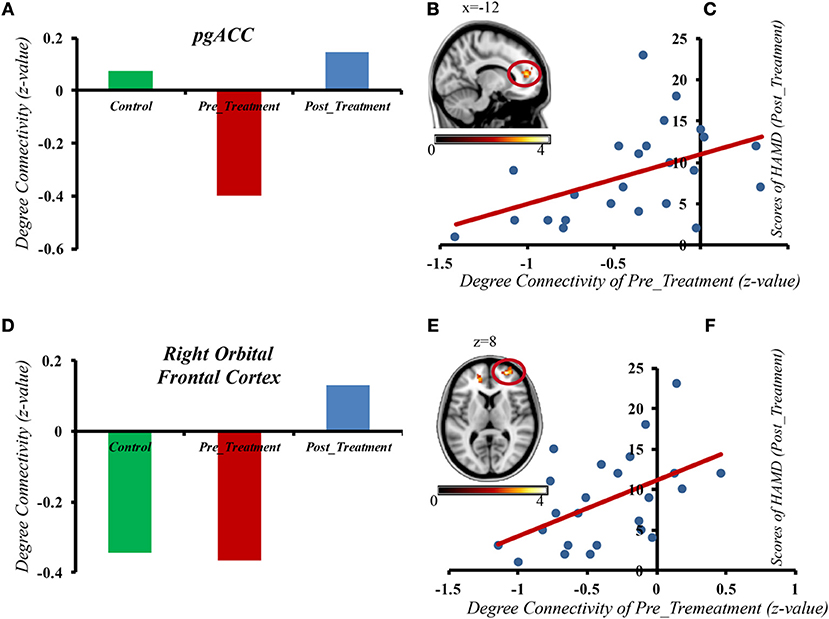
Figure 3. The gFCD in the pgACC and right orbital frontal cortex of depressive patients before MECT shows a positive correlation with HAMD scores after treatment. (A) gFCD in pgACC in three different groups. (B) gFCD in pgACC. (C) The gFCD in the pgACC of depressive patients pre MECT shows a positive correlation with HAMD scores post treatment. (D) gFCD in Right Orbital Frontal Cortex in three different groups. (E) gFCD in Right Orbital Frontal Cortex. (F) The gFCD in the Right Orbital Frontal Cortex of depressive patients pre MECT shows a positive correlation with HAMD scores post treatment.
In the present study, we assessed the gFCD changes in patients with MDD before and after MECT. The results demonstrated that, compared to the healthy controls, there was increased gFCD in the posterior-middle insula, supra-marginal gyrus, and dorsal medial prefrontal cortex of pre-ECT MDD patients.
The post-treatment results exhibited significantly increased gFCD in the perigenual anterior cingulate cortex (pgACC), orbitofrontal cortex bilaterally and the left-supra-marginal gyrus. These upshots were associated with decreased HAMD scores, and statistical analysis demonstrated that such connectivity changes were related to clinical outcome.
The orbitofrontal cortex (OFC) is important in complex human behaviors. OFC cortico-striatal circuits are consistently involved in many mental disorders, such as depression. Structurally, the OFC reveals remarkable decreased volumes in medication-naïve MDD patients compared to MDD patients who take medications (29). Additionally, Webb et al. (30) found higher depressive symptoms were related to reduce gray matter volume in the left rACC (extending into the OFC). Likewise, significant decreases have been observed not only in OFC gray matter, but also in the ventral striatum and amygdala in MDD patients (30, 31). Furthermore, the changes may last through the whole life. According to a previous study, no significant differences were observed in total gray matter volume of OFC, or in total OFC volume between MDD children and healthy controls (32). Interestingly, Rajkowska et al. (33) obtained post-mortem samples from elderly depressed patients that showed that the density of pyramidal neurons in the OFC was particularly low, which shows more severe neuronal pathology changes in older MDD patients than in younger patients. Studies show that, compared with control subjects, significant hyperactivity is observed in the mOFC and VMPFC for MDD patients (34–40). At the same time, some research shows that, for medication-naïve MDD patients, the resting cerebral blood flow (rCBF) of the OFC was upregulated, while after taking antidepressants, reduced metabolism was observed in these regions (41). Thus, there is a positive correlation with MDD patients. Nevertheless, the correlation between symptom severity and rCBF of these areas remains somewhat of a mystery. This research suggests that activation of these areas can be a complemental reaction for decreasing negative emotional action. Specifically, some results revealed an inverse correlation between decreased functional connectivity within the medial division of the orbitofrontal circuit and the severity of symptoms, which matches our conclusions (42).
Some large trials demonstrated that pre-treatment regional insula activity could prognosticate the specific treatment that would be efficacious at the individual patient level. Dunlop et al. (43) found preliminary evidence that a putative right anterior insula metabolism biomarker could predict treatment outcomes, even in children (43). Belden et al. (44) found there was some kind of correlation between structural abnormalities of anterior insula volume and the neurobiology of depression from early childhood. Consequently, the function and structure of insula are significant for presaging the clinical outcomes of depression. Some previous studies indicated that low functional connectivity density in the insula leads to better clinical outcomes in MDD, but there is no research to reveal upregulated connectivity in ACC/VMPFC, PCC/pC, dACC and insula within RSNs that are correlated with MDD pathology. Regression results showed that areas related to clinical response overlapped mostly with areas that exhibited abnormal connectivity. ACC/VMPFC, dACC and the left insula are the hub areas of the default mode network (DMN) and SN. These areas displayed prominent performance (highest sensitivity = 100% and highest specificity = 82%) in distinguishing therapeutic effect (45). Some recent researches specified that, in contrast with MDD patients who not attempted suicide, those who have attempted suicide showed hyper-activity resting-state functional connectivity (RSFC) of the left amygdala with the right insula (46). Our corollary showed increased gFCD in the insula before treatment, which matches previous studies.
Chaotic network connectivity is observed in MDD core networks, which include DMN, of which the dorsal medial prefrontal cortex (dmPFC) is one part. Both pharmaceutical treatments and electroconvulsive therapy and repetitive transcranial magnetic stimulation can work in DMN. One previous study showed that, after using rTMS just in the dmPFC region, the symptoms became better (47). Previous studies have demonstrated abnormal changes in resting-state functional connectivity strength in several brain regions and brain networks (48–50); research has further shown that resting-state functional connectivity density is mainly located in the medial prefrontal cortex, posterior cingulated cortex, precuneus and occipital lobe. MDD patients show lower medial prefrontal cortex volumes. Research on a non-clinical sample found that, in the dorsal medial prefrontal cortex, male subjects with higher levels of depressive qualities seem to have lower volumes of gray matter (51). Even in a subclinical sample, the dorsal medial prefrontal cortex was shown to be a potentially significant biomarker for treatment outcomes in depression. In our study, we found increased gFCD in dmPFC in depressive patients. These outcomes match some previous research, such as how—compared with healthy control group—increased within-network connectivity was observed in the dmPFC of MDD patients (52), and another study showed increased resting-state FC between the medial prefrontal cortex and other DMN structures in patients who suffered from major depressive episodes (53). So, we predict increased gFCD exists not only in dmPFC its own, but also dmPFC with other brain regions.
Previous studies indicated that abnormal structure of the anterior cingulate cortex (ACC) is also frequently linked with major depression disorder (54–56). Dysfunction in networks including the ACC and caudate nucleus has been demonstrated to underlie many core symptoms of MDD such as anhedonia, decreased energy and intellectual disability (7). In addition, Wu et al. (57) found a remarkble reduction of functional connectivity strength (FCS) in sgACC in MDD patients. Taken together, this research supports a neurotrophic model of MDD and antidepressant effects, showing that ECT may cause functional alterations within prefrontal and limbic areas.
Furthermore, we also found that gFCD in the pgACC and the right orbital frontal cortex of depressive patients before ECT had a positive correlation with HAMD scores after treatment. Previous research has shown that the alteration of limbic and prefrontal networks is continuous during symptom remission. Early antidepressant effects can be observed at the limbic level, and the following effects can be observed in the PFC (6, 11, 58). Cano et al. (11) found that early, substantial decreased intralimbic FC significantly exhibited a subsequent increase in limbic–prefrontal FC, which meant better clinical outcomes could come from an ECT session. The gFCD in the pgACC and the right orbital frontal cortex of depressive patients before MECT showed a positive correlation with HAMD scores after treatment, which suggests that functional disturbances in MDD may be associated with compensatory activity enhancement in some regions. In severe depression, the compensatory enhancement is more obvious. Our results may provide evidence for finding a new predictor of treatment outcome.
In the present study, our research focuses on describing treatment outcomes with gFCD and MECT. However, previous studies have shown that regardless of function or structure, the regional insula, ACC, OFC, supra-marginal gyrus, and dorsal medial prefrontal cortex may be important biomarkers for treatment outcomes of depression. Some studies have shown decreased gFCD in the left occipital lobe of depressive patients while our study found that the gFCD in the pgACC and right orbital frontal cortex of depressive patients before MECT demonstrated a positive correlation with HAMD scores after treatment, suggesting that the level of gFCD in the pgACC and right orbital frontal cortex may also be core indicators of treatment outcome.
This study has some limitations. These include the small number of patients; replication with a larger sample is warranted and the healthy control sample was also small. We did not add a subgroup analysis and there were no other psychopathological or neurocognitive assessments in our research, and we did not follow the healthy controls; therefore, further research is needed.
We found abnormal gFCD in the posterior-middle insula, supra-marginal gyrus, and dorsal medial prefrontal cortex in depressive patients after MECT. MECT influenced brain gFCD in depressive patients by increasing gFCD in the perigenual anterior cingulate cortex (pgACC), orbitofrontal cortex bilaterally and the left-supra-marginal gyrus while decreasing gFCD in the posterior insula after 8 courses of MECT. The gFCD in the pgACC and right orbital frontal cortex of depressive patients before MECT revealed a positive correlation with treatment outcome, demonstrating that the above brain region may be a strong indicator of MECT effect.
XL contributed to data collection and wrote the paper. HM, YF, LD, HQ, TQ, and QC helped revise the paper. ZZ and QL designed the experiment and revised the paper.
The National Science and Technologic of China (2015BAI13B02).
The authors declare that the research was conducted in the absence of any commercial or financial relationships that could be construed as a potential conflict of interest.
This work was supported by a grant from the National Science and Technology Program of China (2015BAI13B02), the Foundation of the First Affiliated Hospital of Chongqing Medical University (PYJJ2017-27), the Pre-research Natural Science Foundation of Chongqing Medical University (NSFYY201607) and the Medical research project of the Chongqing Health and Family Planning Commission (2017MSXM024).
1. Rush AJ, Trivedi MH, Wisniewski SR, Nierenberg AA, Stewart JW, Warden D, et al. Acute and longer-term outcomes in depressed outpatients requiring one or several treatment steps: a STAR D report. Am J Psychiatry. (2006) 163:1905–7. doi: 10.1176/ajp.2006.163.11.1905
2. Fink M, Taylor MA. Electroconvulsive therapy: evidence and challenges. J Am Med Assoc. (2007) 298:330–2. doi: 10.1001/jama.298.3.330
3. The UK ECT Review Group. Efficacy and safety of electroconvulsive therapy in depressive disorders: a systematic review and meta-analysis. Lancet. (2003) 361:799–8. doi: 10.1016/S0140-6736(03)12705-5
4. Pagnin D, de Queiroz V, Pini S, Cassano GB. Efficacy of ECT in depression: a meta-analytic review. J ECT. (2004) 20:13–20. doi: 10.1097/00124509-200403000-00004
5. Weiner R, Lisanby SH, Husain MM, Morales OG, Maixner DF, Hall SE, et al. Electroconvulsive therapy device classification: response to FDA advisory panel hearing and recommendations. J Clin Psychiatry. (2013) 74:38–42. doi: 10.4088/JCP.12cs08260
6. Mayberg HS. Modulating dysfunctional limbic-cortical circuits in depression: towards development of brain-based algorithms for diagnosis and optimized treatment. Br Med Bull. (2003) 65:193–207. doi: 10.1093/bmb/65.1.193
7. Price JL, Drevets WC. Neurocircuitry of mood disorders. Neuropsychopharmacology (2010) 35:192–216. doi: 10.1038/npp.2009.104
8. Lu Q, Li H, Luo G, Wang Y, Tang H, Han L, et al. Impaired prefrontalamygdala effective connectivity is responsible for the dysfunction of emotion process in major depressive disorder: a dynamic causal modeling study on MEG. Neurosci Lett. (2012) 523:125–30. doi: 10.1016/j.neulet.2012.06.058
9. Seminowicz DA, Mayberg HS, McIntosh AR, Goldapple K, Kennedy S, Segal Z, et al. Limbic-frontal circuitry in major depression: a path modeling metanalysis. Neuroimage. (2004) 22:409–18. doi: 10.1016/j.neuroimage.2004.01.015
10. Anand A, Li Y, Wang Y, Wu J, Gao S, Bukhari L, et al. Antidepressant effect on connectivity of the mood-regulating circuit: an fMRI study. Neuropsychopharmacology. (2005) 30:1334–44. doi: 10.1038/sj.npp.1300725
11. Cano M, Cardoner N, Urretavizcaya M, Martínez-Zalacaín I, Goldberg X, Via E, et al. Modulation of limbic and prefrontal connectivity by electroconvulsive therapy in treatment-resistant depression: a preliminary study. Brain stimuli. (2016) 9:65–71. doi: 10.1016/j.brs.2015.08.016
12. Tomasi D, Volkow ND. Functional connectivity density mapping. Proc Natl Acad Sci USA. (2010) 107:9885–90. doi: 10.1073/pnas.1001414107
13. Tomasi D, Volkow ND. Association between functional connectivity hubs and brain networks. Cereb Cortex. (2011) 21:2003–13. doi: 10.1093/cercor/bhq268
14. Tomasi D, Volkow ND. Functional connectivity hubs in the human brain. Neuroimage. (2011) 57:908–17. doi: 10.1016/j.neuroimage.2011.05.024
15. Buckner RL, Sepulcre J, Talukdar T, Krienen FM, Liu H, Hedden T, et al. Cortical hubs revealed by intrinsic functional connectivity: mapping, assessment of stability, and relation to Alzheimer's disease. J Neurosci. (2009) 29:1860–73. doi: 10.1523/JNEUROSCI.5062-08.2009
16. Martuzzi R, Ramani R, Qiu M, Shen X, Papademetris X, Constable RT. A whole-brain voxel based measure of intrinsic connectivity contrast reveals local changes in tissue connectivity with anesthetic without a priori assumptions on thresholds or regions of interest. Neuroimage. (2011) 58:1044–50. doi: 10.1016/j.neuroimage.2011.06.075
17. Tomasi D, Shokri-Kojori E, Volkow ND. High-resolution functional connectivity density: hub locations, sensitivity, specificity, reproducibility, and reliability. Cereb Cortex. (2015) 26:3249–59. doi: 10.1093/cercor/bhv171
18. Zhuo C, Zhu J, Wang C, Qu H, Ma X, Qin W. Different spatial patterns of brain atrophy and global functional connectivity impairments in major depressive disorder. Brain Imaging Behav. (2017) 11:1678–89. doi: 10.1007/s11682-016-9645-z
19. Kandilarova S, Stoyanov D, Kostianev S, Specht K. Altered resting state effective connectivity of anterior insula in depression. Front. Psychiatry. (2018) 9:83. doi: 10.3389/fpsyt.2018.00083
20. Beall EB, Malone DA, Dale RM, Muzina DJ, Koenig KA, Bhattacharrya PK, et al. Effects of electroconvulsive therapy on brain functional activation and connectivity in depression. J ECT. (2012) 28:234–41. doi: 10.1097/YCT.0b013e31825ebcc7
21. Perrin JS, Merz S, Bennett DM, Currie J, Steele DJ, Reid IC, et al. Electroconvulsive therapy reduces frontal cortical connectivity in severe depressive disorder. Proc Natl Acad Sci USA. (2012) 109:1464–8. doi: 10.1073/pnas.1117206109
22. Abbott CC, Lemke NT, Gopal S, Thoma RJ, Bustillo J, Calhoun VD, et al. Electroconvulsive therapy response in major depressive disorder: a pilot functional network connectivity resting state fMRI investigation. Front Psychiatry. (2013) 4:10. doi: 10.3389/fpsyt.2013.00010
23. Papakostas GI, Fava M. Predictors, moderators, and mediators (correlates) of treatment outcome in major depressive disorder. Dialog Clin Neurosci. (2008) 10:439–51. Available online at: https://www.ncbi.nlm.nih.gov/pmc/articles/PMC3181892/
24. Du L, Qiu H, Liu H, Zhao W, Tang Y, Fu Y, et al. Changes in Problem-Solving Capacity and Association With Spontaneous Brain Activity After a Single Electroconvulsive Treatment in Major Depressive Disorder. J ECT. (2016) 32:49–54. doi: 10.1097/YCT.0000000000000269
25. Du L, Liu H, Du W, Chao F, Zhang L, Wang K, et al. Stimulated left DLPFC-nucleus accumbens functional connectivity predicts the anti-depression and anti-anxiety effects of rTMS for depression. Transl Psychiatry. (2018) 7:3. doi: 10.1038/s41398-017-0005-6
26. Yan CG, Wang XD, Zuo XN, Zang YF. DPABI: Data Processing & Analysis for (Resting-State) Brain Imaging. Neuroinformatics. (2016) 14:339–51. doi: 10.1007/s12021-016-9299-4
27. Tian X, Wei D, Du X, Wang K, Yang J, Liu W, et al. Assessment of trait anxiety and prediction of changes in state anxiety using functional brain imaging: a test-retest study. Neuroimage. (2016) 133:408–16. doi: 10.1016/j.neuroimage.2016.03.024
28. Liu W, Liu H, Wei D, Sun J, Yang J, Meng J, et al. Abnormal degree centrality of functional hubs associated with negative coping in older Chineseadults who lost their only child. Biol Psychol. (2015) 112:46–55. doi: 10.1016/j.biopsycho.2015.09.005
29. Bora E, Harrison BJ, Davey CG, Yücel M, Pantelis C. Meta-analysis of volumetric abnormalities in cortico-striatal-pallidal-thalamic circuits in major depressive disorder. Psychol Med. (2012) 42:671–81. doi: 10.1017/S0033291711001668
30. Webb CA, Weber M, Mundy EA, Killgore WD. Reduced gray matter volume in the anterior cingulate, orbitofrontal cortex and thalamus as a function of mild depressive symptoms: a voxel-based morphometric analysis. Psychol Med. (2014) 44:2833–43. doi: 10.1017/S0033291714000348
31. Koolschijn PC, van Haren NE, Lensvelt-Mulders GJ, Hulshoff Pol HE, Kahn RS. Brain volume abnormalities in major depressive disorder: a meta-analysis of magnetic resonance imaging studies. Hum Brain Mapp. (2009) 30:3719–35. doi: 10.1002/hbm.20801
32. Chen HH, Rosenberg DR, MacMaster FP, Easter PC, Caetano SC, Nicoletti M, et al. Orbitofrontal cortex volumes in medication naïve children with major depressive disorder: a magnetic resonance imaging study. J Child Adolesc Psychopharmacol. (2008) 18:551–6. doi: 10.1089/cap.2007.053
33. Rajkowska G, Miguel-Hidalgo JJ, Dubey P, Stockmeier CA, Krishnan KR. Prominent reduction in pyramidal neurons density in the orbitofrontal cortex of elderly depressed patients. Biol Psychiatry. (2005) 58:297–306. doi: 10.1016/j.biopsych.2005.04.013
34. Baxter LR, Schwartz JM, Phelps ME, Mazziotta JC, Guze BH, Selin CE, et al. Reduction of prefrontal cortex glucose metabolism common to three types of depression. Arch Gen Psychiatry. (1989) 46:243–50. doi: 10.1001/archpsyc.1989.01810030049007
35. Drevets WC, Videen TO, Price JL, Preskorn SH, Carmichael ST, Raichle ME. A functional anatomical study of unipolar depression. J Neurosci. (1991) 12:3628–41. doi: 10.1523/JNEUROSCI.12-09-03628.1992
36. Biver F, Goldman S, Delvenne V, Luxen A, De Maertelaer V, Hubain P, et al. Frontal and parietal metabolic disturbances in unipolar depression. Biol Psychiatry. (1994) 36:381–8. doi: 10.1016/0006-3223(94)91213-0
37. Galynker II, Cai J, Ongseng F, Finestone H, Dutta E, Serseni D. Hypofrontality and negative symptoms in major depressive disorder. J Nucl Med. (1998) 39:608–12.
38. Mayberg HS, Lozano AM, Voon V, McNeely HE, Seminowicz D, Hamani C, et al. Deep brain stimulation for treatment-resistant depression. Neuron. (2005) 45:651–60. doi: 10.1016/j.neuron.2005.02.014
39. Nofzinger EA, Buysse DJ, Germain A, Price JC, Meltzer CC, Miewald JM, et al. Alterations in regional cerebral glucose metabolism across waking and non-rapid eye movement sleep in depression. Arch Gen Psychiatry. (2005) 62:387–96. doi: 10.1001/archpsyc.62.4.387
40. Greicius MD, Flores BH, Menon V, Glover GH, Solvason HB, Kenna H, et al. Resting-state functional connectivity in major depression: abnormally increased contributions from subgenual cingulate cortex and thalamus. Biol Psychiatry. (2007) 62:429–37. doi: 10.1016/j.biopsych.2006.09.020
41. Drevets WC, Price JL, Simpson JR, Todd RD, Reich T, Vannier M, et al. Subgenual prefrontal cortex abnormalities in mood disorders. Nature. (1997) 386:824–7. doi: 10.1038/386824a0
42. Cheng W, Rolls ET, Qiu J, Liu W, Tang Y, Huang CC, et al. Medial reward and lateral non-reward orbitofrontal cortex circuits change in opposite directions in depression. Brain (2016) 139:3296–309. doi: 10.1093/brain/aww255
43. Dunlop BW, Kelley ME, McGrath CL, Craighead WE, Mayberg HS. Preliminary findings supporting insula metabolic activity as a predictor of outcome to psychotherapy and medication treatments for depression. J Neuropsychiatry Clin Neurosci. (2015) 27:237–9. doi: 10.1176/appi.neuropsych.14030048
44. Belden AC, Barch DM, Oakberg TJ, April LM, Harms MP, Botteron KN, et al. Anterior insula volume and guilt: neurobehavioral markers of recurrence after early childhood major depressive disorder. JAMA Psychiatry. (2015) 72:40–8. doi: 10.1001/jamapsychiatry.2014.1604
45. Ge R, Blumberger DM, Downar J, Daskalakis ZJ, Dipinto AA, Tham JCW, et al. Abnormal functional connectivity within resting-state networks is related to rTMS-based therapy effects of treatment resistant depression: a pilot study. J Affect Disord. (2017) 218:75–81. doi: 10.1016/j.jad.2017.04.060
46. Kang SG, Na KS, Choi JW, Kim JH, Son YD, Lee YJ. Resting-state functional connectivity of the amygdala in suicide attempters with major depressive disorder. Prog Neuropsychopharmacol Biol Psychiatry. (2017) 77:222–7. doi: 10.1016/j.pnpbp.2017.04.029
47. Dunlop K, Gaprielian P, Blumberger D, Daskalakis ZJ, Kennedy SH, Giacobbe P, et al. MRI-guided dmPFC-rTMS as a treatment for treatment-resistant major depressive disorder. J Vis Exp. (2015) 11:53129. doi: 10.3791/53129
48. Cordes D, Haughton V, Carew JD, Arfanakis K, Maravilla K. Hierarchical clustering to measure connectivity in fMRI resting-state data. Magn Reson Imaging. (2002) 20:305–17. doi: 10.1016/S0730-725X(02)00503-9
49. Mezer A, Yovel Y, Pasternak O, Gorfine T, Assaf Y. Cluster analysis of resting-state fMRI time series. Neuroimage. (2009) 45:1117–25. doi: 10.1016/j.neuroimage.2008.12.015
50. Zhuo C, Zhu J, Qin W, Qu H, Ma X, Tian H, et al. Functional connectivity density alterations in schizophrenia. Front Behav Neurosci. (2014) 8:404. doi: 10.3389/fnbeh.2014.00404
51. Carlson JM, Depetro E, Maxwell J, Harmon-Jones E, Hajcak G. Gender moderates the association between dorsal medial prefrontal cortex volume and depressive symptoms in a subclinical sample. Psychiatry Res. (2015) 233:285–8. doi: 10.1016/j.pscychresns.2015.06.005
52. Zhu X, Zhu Q, Shen H, Liao W, Yuan F. Rumination and default mode network subsystems connectivity in first-episode, drug-naive young patients with major depressive disorder. Sci Rep. (2017) 7:43105. doi: 10.1038/srep43105
53. Zhang B, Li S, Zhuo C, Li M, Safron A, Genz A, et al. Altered task-specific deactivation in the default mode network depends on valence in patients with major depressive disorder. J Affect Disord. (2017) 207:377–83. doi: 10.1016/j.jad.2016.08.042
54. Lorenzetti V, Allen NB, Fornito A, Yücel M. Structural brain abnormalities in major depressive disorder: a selective review of recent MRI studies. J Affect Disord. (2009) 117:1–17. doi: 10.1016/j.jad.2008.11.021
55. Rogers MA, Kasai K, Koji M, Fukuda R, Iwanami A, Nakagome K, et al. Executive and prefrontal dysfunction in unipolar depression: a review of neuropsychological and imaging evidence. Neurosci Res. (2004) 50:1–11. doi: 10.1016/j.neures.2004.05.003
56. Drevets WC, Price JL, Furey ML. Brain structural and functional abnormalities in mood disorders: implications for neurocircuitry models of depression. Brain Struct Funct. (2008) 213:93–118. doi: 10.1007/s00429-008-0189-x
57. Wu H, Sun H, Xu J, Wu Y, Wang C, Xiao J, et al. Changed hub and corresponding functional connectivity of subgenual anterior cingulate cortex in major depressive disorder. Front Neuroanat. (2016) 10:120. doi: 10.3389/fnana.2016.00120
Keywords: depression, electroconvulsive therapy, brain, functional connectivity, fMRI methods
Citation: Li X, Meng H, Fu Y, Du L, Qiu H, Qiu T, Chen Q, Zhang Z and Luo Q (2019) The Impact of Whole Brain Global Functional Connectivity Density Following MECT in Major Depression: A Follow-Up Study. Front. Psychiatry 10:7. doi: 10.3389/fpsyt.2019.00007
Received: 20 May 2018; Accepted: 07 January 2019;
Published: 01 March 2019.
Edited by:
Chao-Gan Yan, Chinese Academy of Sciences, ChinaReviewed by:
Wei Deng, Sichuan University, ChinaCopyright © 2019 Li, Meng, Fu, Du, Qiu, Qiu, Chen, Zhang and Luo. This is an open-access article distributed under the terms of the Creative Commons Attribution License (CC BY). The use, distribution or reproduction in other forums is permitted, provided the original author(s) and the copyright owner(s) are credited and that the original publication in this journal is cited, in accordance with accepted academic practice. No use, distribution or reproduction is permitted which does not comply with these terms.
*Correspondence: Zhiwei Zhang, emhhbmd6aGl3ZWlAaG9zcGl0YWwuY3FtdS5lZHUuY24=
Qinghua Luo, bHVvcWluZ2h1YUBob3NwaXRhbC5jcW11LmVkdS5jbg==
Disclaimer: All claims expressed in this article are solely those of the authors and do not necessarily represent those of their affiliated organizations, or those of the publisher, the editors and the reviewers. Any product that may be evaluated in this article or claim that may be made by its manufacturer is not guaranteed or endorsed by the publisher.
Research integrity at Frontiers
Learn more about the work of our research integrity team to safeguard the quality of each article we publish.