 John M. de Figueiredo
- The School of Law and Fuqua School of Business, Duke University, Durham, NC, United States
This paper examines state level lobbying data to determine how budgeting affects the timing, intensity and composition of lobbying expenditures. Using a database of all available lobbying expenditures in the U.S. states ranging up to 25 years, the paper shows interest group lobbying increases substantially during the budgeting process, and the budgeting process is unlike other issues lobbyists face. Spikes in lobbying during budgeting are driven primarily by business groups, and these business groups account for most of the changes on the margin in lobbying activity. Moreover, even groups relatively unaffected by budgets lobby more intensely during legislative budgeting, consistent with the “Christmas tree” effect of appropriations and budget bills.
1 Introduction
One of the primary instruments interest groups use to influence policy is the lobbying of legislators. Lobbying in this paper is defined as the direct and private transfer of information to politicians by special interests to influence legislative outcomes. In this sense, lobbying is meant to include reports, arguments, messages, and information that interest groups provide directly and privately to legislators and their staffs. It excludes campaign contributions made to a legislators, public advertising, and grassroots organization of employees or members.1 It also excludes illegal activities such as bribes, kickbacks, quid pro quos, and other forms of monetary and non-monetary compensation prohibited by law.
There is a substantial empirical literature on lobbying in both the political science and economics disciplines employing data generated by legislative requirements for disclosure of lobbying activity. [See de Figueiredo and Richter (2014) for a summary of this literature]. The largest number of papers in this “disclosure data” category exploit the semi-annual disclosure reports required by the Lobbying Disclosure Act of 1995 (and its subsequent 1996 technical amendments) passed by the U.S. Congress. These papers examine the lobbyists, expenditures, and policy proposals targeted by interest groups at the U.S. federal level (e.g., de Figueiredo and Silverman, 2006; Richter et al., 2009; Bertrand et al., 2014; Kim, 2017).2 A second and highly related set of papers has recently tapped a dataset created by the Foreign Agent Registration Act (FARA) to examine how specific foreign countries and foreign firms lobby legislators in the U.S. federal government (e.g., You, 2020, 2023; Grotteria et al., 2022).
A third vein of empirical research explores how interest groups attempt to influence bureaucrats through ex parte and other forms of lobbying, or through legislative lobbying to subsequently influence U.S. federal government agencies. These papers tend to be agency-specific, with the institutional details of the agency policymaking process used by the researcher to assist in identifying the intensity and effects of lobbying (e.g., de Figueiredo and Tiller, 2001; de Figueiredo and Kim, 2004; Barber and Weschle, 2023). A fourth set of empirical papers examine lobbying at the U.S. state level, often employing rich descriptions of lobbying in state legislatures or state-specific disclosure data (e.g., Nownes et al., 2008; Nownes and Newmark, 2012; Thieme, 2020). Finally, as more countries across the world embrace transparency in disclosures of interest group influence activities, an increasing number of researchers are able to conduct informational lobbying studies based on disclosure data in many countries and supranational bodies (e.g., Espinosa et al., 2023).
As this brief literature review highlights, there is a substantial and growing empirical literature in economics and political science examining lobbying at many levels. What is common in this literature is that these papers tend to be confined to a single institutional venue—whether it be a U.S. state, the U.S. federal government, a single bureaucratic agency, or a specific country or supranational political unit.3 What the lobbying literature is largely missing is a comparative statistical analysis of interest group behavior across institutional venues using archival data. This paper takes a step toward addressing this gap in the literature.
In particular, this paper examines interest group lobbying of U.S. state legislatures across a number of U.S. states. The paper employs one dataset of aggregate interest group lobbying by state by year, and a second dataset of thousands of individual interest groups lobbying expenditures in each specific U.S. state aggregated to the state level in each year. It seeks to examine the regularities and commonalities in interest group lobbying behavior in a comparative context, across a number of different governmental and institutional settings.
States provide a nice laboratory for a comparative study of lobbying because of the substantial variation in institutional features across the states. States differ in their legislative structures, legislative rules and procedures, and in the timing of the legislative matters under consideration. They also differ in their lobbying procedures, lobbying disclosure rules, and the types of interest groups that inhabit the state. Not only is there institutional variation across states, in addition, no state has an institutional structure and issue set that is identical to the U.S. Federal Government. In this sense, states are a natural venue for a comparative institutional lens. This paper, in particular, attempts to answer two questions for scholars in a comparative context: when do interest groups lobby, and what determines the intensity of that lobbying?
Rather than take a single-issue view of this question as most papers do on the topic, this paper examines the level of aggregate lobbying expenditures by interest groups. We can find some initial traction on these questions with an examination of the voting literature. An oft-documented fact in the retrospective voting literature is that voters return legislators to office who have delivered favorable policy to constituents during their previous term (Key, 1964). These backward looking voters are heavy discounters, valuing recent policy-delivery by legislators more highly than those policies implemented farther in the past (Downs, 1957; Fiorina, 1981). Legislators, recognizing this voter behavior, have an incentive and desire to pass legislation for which they can credit-claim close to their impending re-election (Levitt and Snyder, 1997; Achen and Bartels, 2004). This model would then suggest that interest groups (assuming they provide legislators with information that enhance their re-election prospects)4 should attempt to influence legislators when these legislators are ready to pass legislation. That is, interest groups increase their lobbying efforts close to elections because this is the time when politicians are trying to credit-claim for legislation that voters will attribute to the legislators.
We can examine this hypothesis by turning to the primary archival dataset that scholars of interest group lobbying have employed—the federal lobbying data. Since 1996, federal law has required lobbyists and clients to report the amount of money they spend on lobbying at the federal level. In Figure 1A, we present a time series of aggregate total lobbying using this data.5 Because this data is only available for a small number of years, it is not possible to conduct a reliable statistical analysis of the results.
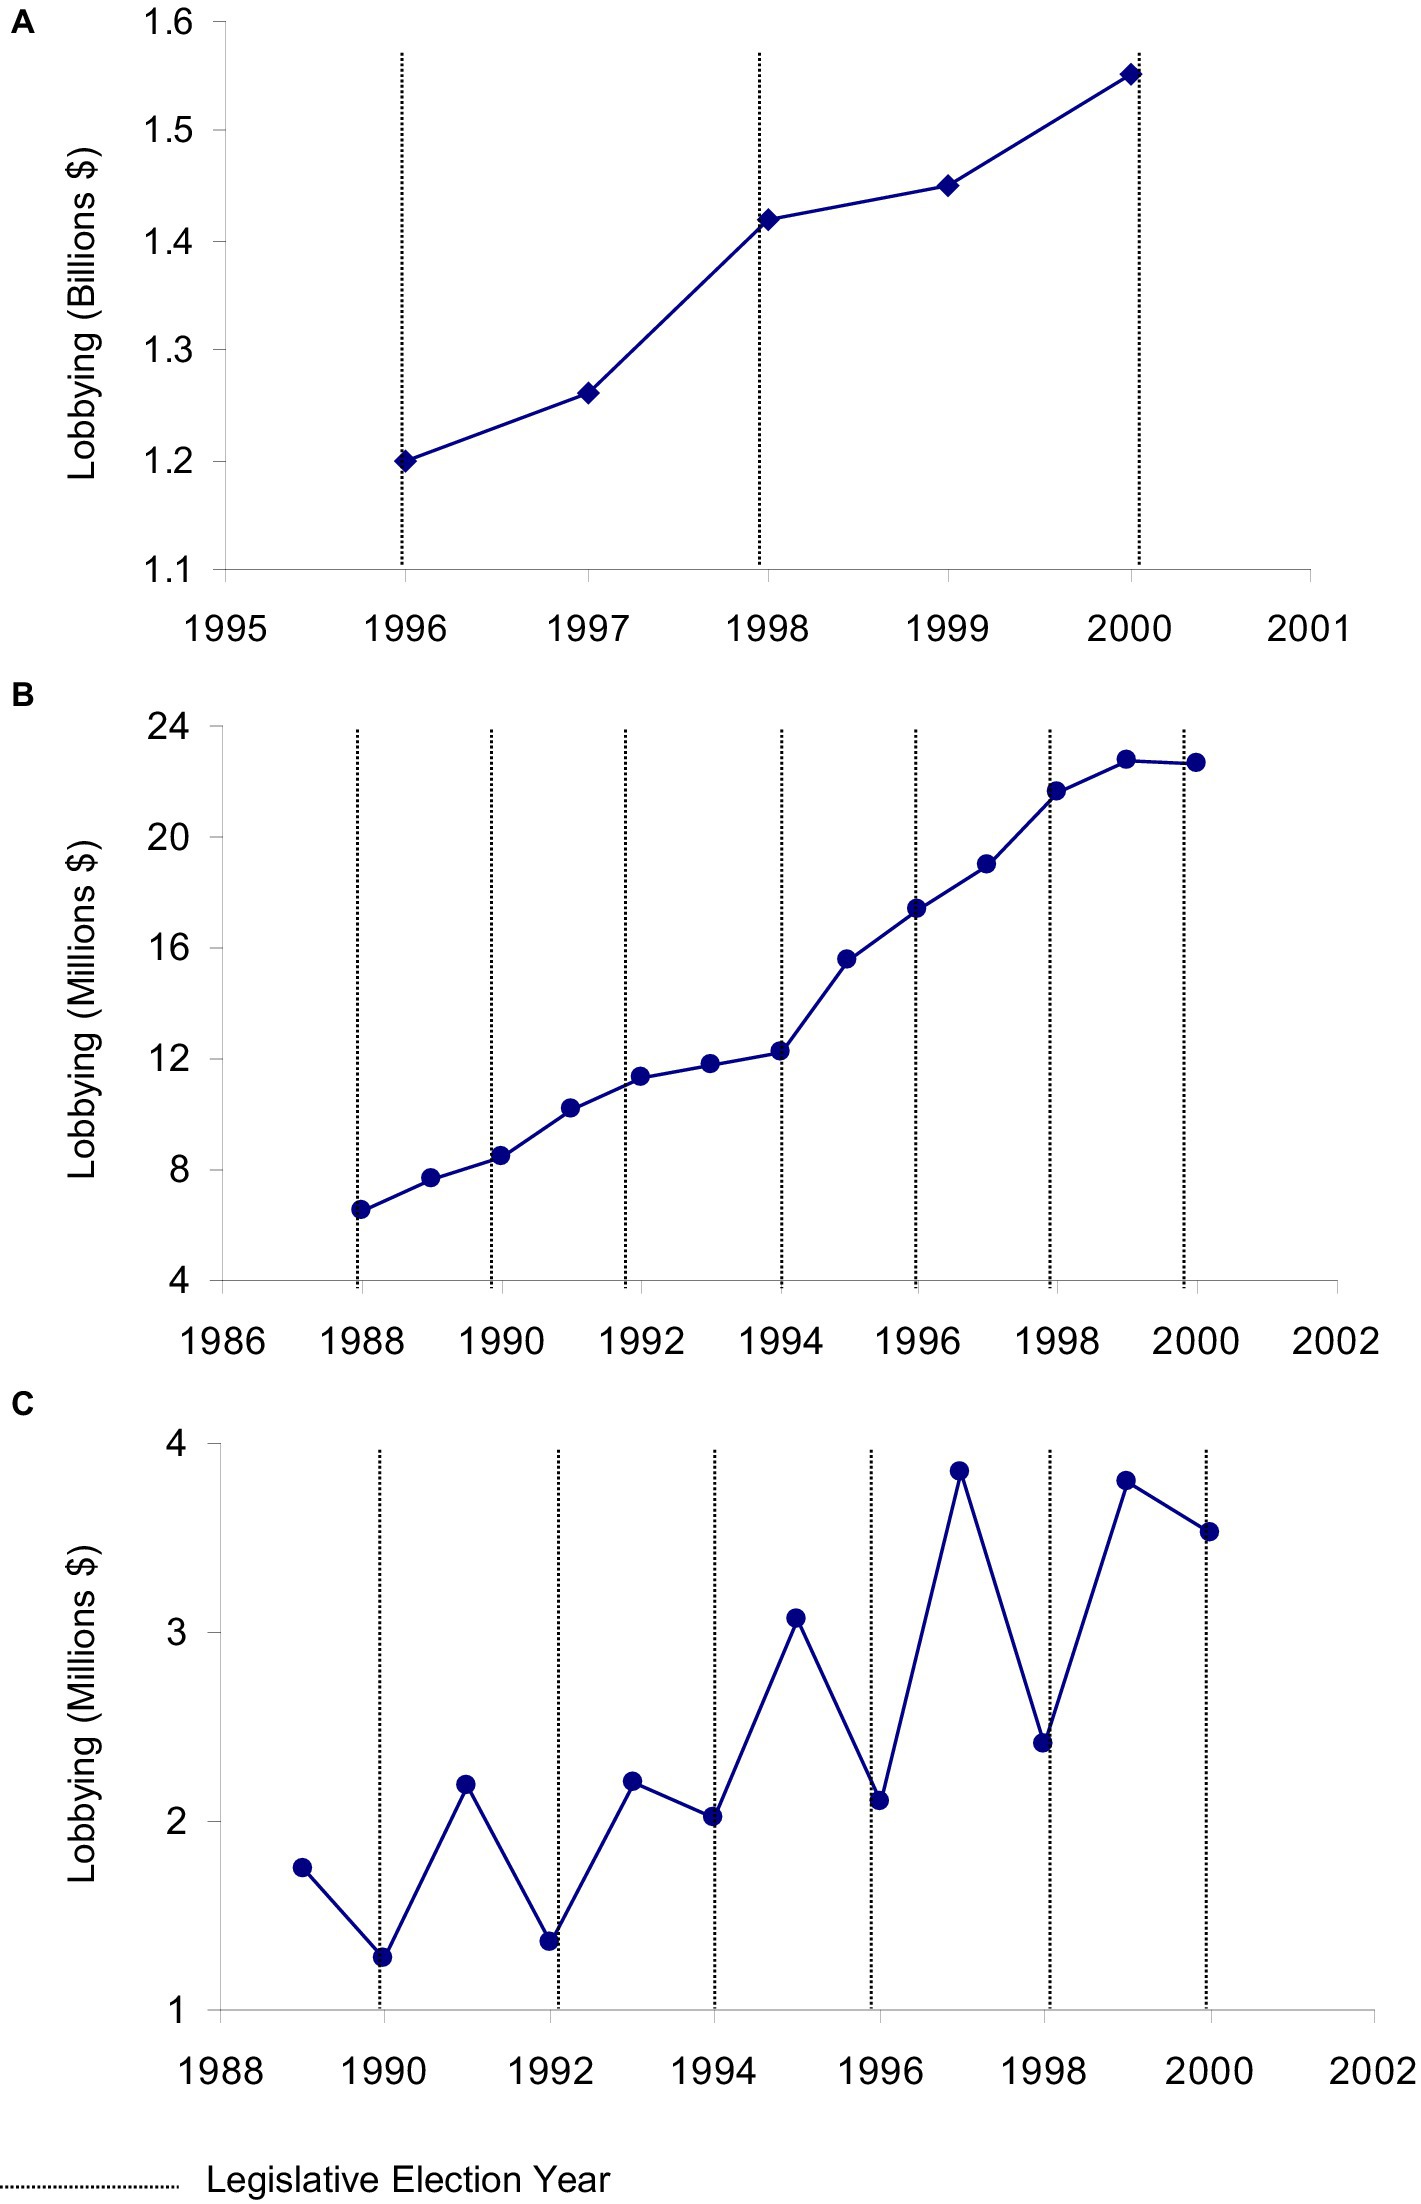
Figure 1. (A) Federal lobbying expenditures. (B) Maryland lobbying expenditures. (C) Maine lobbying expenditures.
However, suppose we wish to expand this analysis beyond the single time series of the federal level. Lobbying expenditures in the states would seem to be a reasonable candidate to for more data. In Figure 1B, we illustrate total aggregate lobbying expenditures over time in Maryland. In this data, like the federal data, we see a short moving average with little discernible pattern other than a steady increase in lobbying expenditures.
We can contrast the timing of lobbying effort in Maryland to Maine. Figure 1C presents the Maine data, which exhibits a very different pattern of lobbying expenditures over time. Not only is there a “saw tooth” pattern of lobbying effort, the pattern is precisely the opposite of the maintained hypothesis—there are troughs during elections, but peaks in the off-election year.
This then leads us to revisit the core research question: what drives the intensity and timing of interest group lobbying? Moreover, are particular types of interest groups causing the peaks and troughs in the data observed in Figure 1C?
To answer these questions, we analyze the rise and fall of predictable policy windows in the states. In particular, this paper argues that the timing and macro-trends in lobbying data will be largely determined by the budgeting process. In fact, the recurring budgeting and appropriations process not only creates these policy windows, budgeting is more important for interest group lobbying efforts than other issues, such as minimum wage increases or redistricting. From a comparative institutional lens, the paper also shows that other than session length, most other institutional features of states have no statistical effect on the timing and intensity of lobbying.
Although there have been very interesting descriptive and discursive case studies written on the role of interest groups in the budgeting process (see Wildavsky, 1979) there has been less empirical statistical research with archival data that has examined the influence of lobbying on the budget process.6 Baumgartner and Leech (1998), in their analysis of 15 direct congressional lobbying studies “which comprise all such studies that have been printed in major political science and economics journals during the past 20 years, as well as all other … lobbying studies cited in those articles (p. 128),” finds only three (Smith, 1984; Quinn and Shapiro, 1990; Wright, 1990) addressed taxation. None of these, however, examined lobbying expenditures.7 Baumgartner and Leech (2001), in their examination of counts of lobbying disclosure reports, did find that disclosure reports cited budgeting as the issue-area most lobbied.8 Despite this, Leech et al. (2005) argue that it is not budgets that draw lobbyists into the fray, but “attention” to issues by legislators.9 Richter et al. (2009) and La Pira et al. (2012) also found that budget issues, government monies, and tax issues will draw interest group attention.
The largest challenge to identifying the patterns observed in these two papers, and in Figure 1, is that the forum in which scholars have empirically examined lobbying—the federal government—is a single legislative institution (n = 1) with a very short time series of lobbying data. There is not a sufficient cross-section or time-series of data to statistically examine variation in lobbying expenditures as they relate to the budgeting process of legislatures. To remedy this problem, this paper introduces a dataset of lobbying in each of the states. The paper offers aggregate level data on 38 states, and more granular data on nine of those states (de Figueiredo and Cameron, 2014).10 These states have different legislative features, different electoral features and different budgeting processes.
The non-survey, empirical data literature on state level lobbying is a bit more robust than the federal lobbying papers in the area.11 Perhaps the most well-known work on this topic has been conducted by Lowery and Gray (1996). This work and others (Hunter et al., 1991; Brasher et al., 1999; Gray et al., 2004) have extensively examined the number of interest group lobbying registrations across the states. Taking registrations at periodic intervals, the authors have developed a theory of interest representation based upon the population ecology variables of competition and legitimation. This data has been used to explore a number of factors affecting the number of interest groups in states. While these papers have extended our comparative work in the area of interest groups, papers that measure the actual lobbying expenditures (or other continuous measure of effort) of interest groups in a large cross-section or panel of states are elusive. Finally, these papers have not examined budgeting issues.
The current paper follows from de Figueiredo and Cameron (2014) who develop a model of endogenous cost lobbying, based on Grossman and Helpman (2001). They then use state level lobbying expenditure data to test the predictions of the model. They find substantial support for the “burning money” signaling model. Their paper examines lobbying expenditures by only multi-state firm and union interest groups. The current paper extends to all interest groups, no matter their geographical presence, and further segments and categorizes the groups according to their industry/interest and type.
Thus the current paper makes a number of empirical contributions. It begins by documenting the patterns of lobbying expenditures in the states over time. The panel nature of the dataset enables us to examine statistically the determinants of the timing of legislative lobbying.12 The paper then decomposes the aggregate state lobbying data into component parts. It examines the extent to which different types of groups alter their lobbying patterns to take advantage of the budgeting process.
Building upon a well-documented literature that has examined the micro-foundations of lobbying, this paper examines the sources of institutional variation and features that drive aggregate levels of lobbying effort. The paper demonstrates that the budgeting process is a magnet for special interests, more so than other issues, causing these groups to substantially increase their lobbying effort. Contrary to the initial hypothesis, lobbying actually slightly decreases in election years, relative to off-election years. Indeed, few other institutional features affect the intensity of lobbying. We find that business groups, which account for 86% of the lobbying expenditures in the nine states for which we have detailed data, are the prime drivers behind the increased lobbying during legislative budgeting. However, business groups have much lower variation in lobbying effort from year to year than any other category of special interests. These latter two results combined suggest that small changes in business group lobbying can have big effects on overall lobbying expenditures. In addition, groups substantially influenced by the state budget and groups substantially influenced by regulation both increase lobbying during budget years. This latter result is consistent with the policy windows literature. Finally, we note that some laws governing disclosure of interest group activities show no measurable effect on the total amount of lobbying activity disclosed. Taken together, the statistics demonstrate that the structural features of budgeting have the largest effect on the timing and intensity of interest group lobbying expenditures, and that businesses drive these patterns.
In the next section, the paper outlines a theoretical framework. Section 3 describes the core data, methods, and empirical results. Sections 4 examines what types of groups are driving the variation in lobbying effort. The paper concludes in Section 5.
2 Theoretical framework
Although there are a number of theories of interest group activity, there are no formal or informal theories (of which we are aware) on the timing of interest group lobbying.13 There is, however, a common thread in the literature that argues interest groups become active when policy windows open (Kingdon, 2003). Policy windows are those time periods when there exists a favorable climate for new legislation or changes to old legislation. Legislators focus more of their attention on the issue at hand, and are disposed to consider whether and how the policy should be changed (Baumgartner and Jones, 1993).
In this literature, policy windows arise through three main processes. First, policy windows arise through the political entrepreneurship of legislators and the “offensive” activity of interest groups in creating these windows (Kroszner and Stratmann, 1998). Interest groups generate and disseminate information to create a climate for an opening of the window (Fenno, 1973). By this mechanism, policy windows are created endogenously, through the planning and agenda setting of interest groups and legislators (Kollman, 1997). A second method by which policy windows arise is through exogenous and or environmental events which refocus legislator attention on a given policy area (Price, 1978). For example, the September 11 attacks upon the World Trade Centers created a policy window for the airlines and homeland security, the Enron and MCI accounting scandals created a policy window for “good governance” interest groups, and the eastern seaboard electrical grid failure created a policy window for both the energy industry and environmentalists. In this approach to policy windows, special interests are largely viewed as opportunists, targeting their lobbying efforts when these exogenous events happen (Walker, 1991). A final third mechanism by which recurring policy windows arise is through structural, legislated, or procedural mechanisms. That is, features of political institutions determine the creation of policy windows, and thus the timing of interest group activities. These predictable policy windows may be micro-structural policy windows, usually created legislatively, that pertain to a given piece of legislation or issue area (Kingdon, 2003, p. 186–189). For example, in the 1990s, the granting of most-favored-nation (MFN) trade status to China required annual renewal, creating a recurring policy window for legislators to act. Alternatively, these recurring policy windows may be macro-structural windows, usually determined constitutionally or procedurally, that affect a large number of issues before the legislature.14
This paper will highlight one particular predictable window: budgeting. The budget cycle is the single feature of the American political system that, we will argue, will draw out more lobbying than any other window.15 The budget has a number of features that causes interest groups to gravitate toward lobbying. First, whereas most policy windows occur sporadically or quasi-randomly, budgeting is on a predictable cycle. Second, it can be used to directly appropriate governmental funds for a given group or coalition. Third, it essentially forces program re-evaluation. Fourth, it is a “Christmas tree,” upon which to hang all sorts of riders and proposals. In essence, the budget becomes the single bill for interest groups, of all stripes, to lobby to obtain their favored proposals. These features make it particularly and, for our purposes, predictably attractive for interest groups to lobby for their favored policies.
There are, very broadly speaking, two categories of proposals that pass through legislatures. The first are budgetary proposals, and the second are non-budgetary and regulatory proposals. Budgetary proposals must be passed in the years that the legislature is required to pass a new budget and appropriation for the government. There is a policy window which is open at this time, and it is uncertain if this budgetary policy window will be opened up at any other time. Regulatory proposals, however, can be passed at any time. They can be passed in budget years as a rider to the budget bill, or in non-budget years as a standalone proposal. Unlike a standalone bill, the budget bill is a “train pulling out of the station” and must pass the legislature. Thus, many scholars believe that it is easier and requires less effort to attach riders to the budget bill than it is to pass a bill by itself (Oleszek, 1996; Krutz, 2001).
If this true, we can exploit this variation to argue that this cost differential will drive lobbying expenditures. In particular, in years when the budget is being considered, we should see an increase in regulatory legislative lobbying, and in off-budget years, should see a decline in regulatory legislative lobbying, if the costly solo-bill passage is a correct characterization of the legislative process. The same pattern should be expected for budgetary lobbying as well.
3 Core empirical analysis
3.1 Data
The panel dataset employed in this section to examine these budget hypotheses comprises state-year aggregate lobbying expenditures across all states where available. The total aggregate lobbying expenditure by state by year was obtained from each state (either the Ethics Commission or the relevant office). Thirty-seven states provided us with the data. The remaining states either did not collect the data, or collected but did not keep or would not release the data. The range of time periods is 3 to 25 years of data for each state. Appendix A1 lists the states and years of data used. All data are converted to year 2000 real dollars, deflated by the consumer price index (CPI-U). To create our dependent variable for the statistical analyses, we take the log of the state’s per capita lobbying expenditure in a given year. A full description of all the data and the data sources is provided in Appendix A2.
There are three sets of independent variables. The first set measures the electoral factors that might affect interest group activity. This includes variables on whether there is an election in the current time period for legislative seats, whether there is unified government, whether there is Democratic unified government, and the size of the majorities in the House and Senate of each state.16 A second set of variables includes characteristics of the institutional design and legislative process of each state. These variables measure the number of days that legislature met in regular session or special session,17 and whether the state is required to create a new budget in a particular year. The effect of the budget variable is the one of which is of most interest. A final set of variables provides control for the state characteristics that move over time, such as the state’s per capita income. We also include variables for the year and the year-squared. Descriptive statistics for the variables are found in Appendix A3.
3.2 Descriptive data
To capture the variation in the timing of lobbying effort, we analyze three representative states: New York, Wisconsin, and Oregon. These have been chosen because they represent three different institutional structures of the legislative process. New York has annual regular sessions and annual budgeting; Wisconsin has annual regular sessions and biennial budgeting and Oregon has biennial regular sessions and biennial budgeting. We provide the data in Figure 2. What is striking about these three graphs is their responsiveness to the budgeting process. While New York sees a steady increase in real lobbying expenditures, Oregon’s and Wisconsin’s lobbying expenditures increase substantially in budget years, and drop in off-budget years. In addition, comparing Oregon to Wisconsin, we seem to see a regular session effect as well. This descriptive data provides initial support for a theory that institutional design may affect interest group effort, and in particular, budgeting may be the focal point for interest groups. However, to more thoroughly examine the hypotheses presented, we turn to a multivariate statistical analysis.
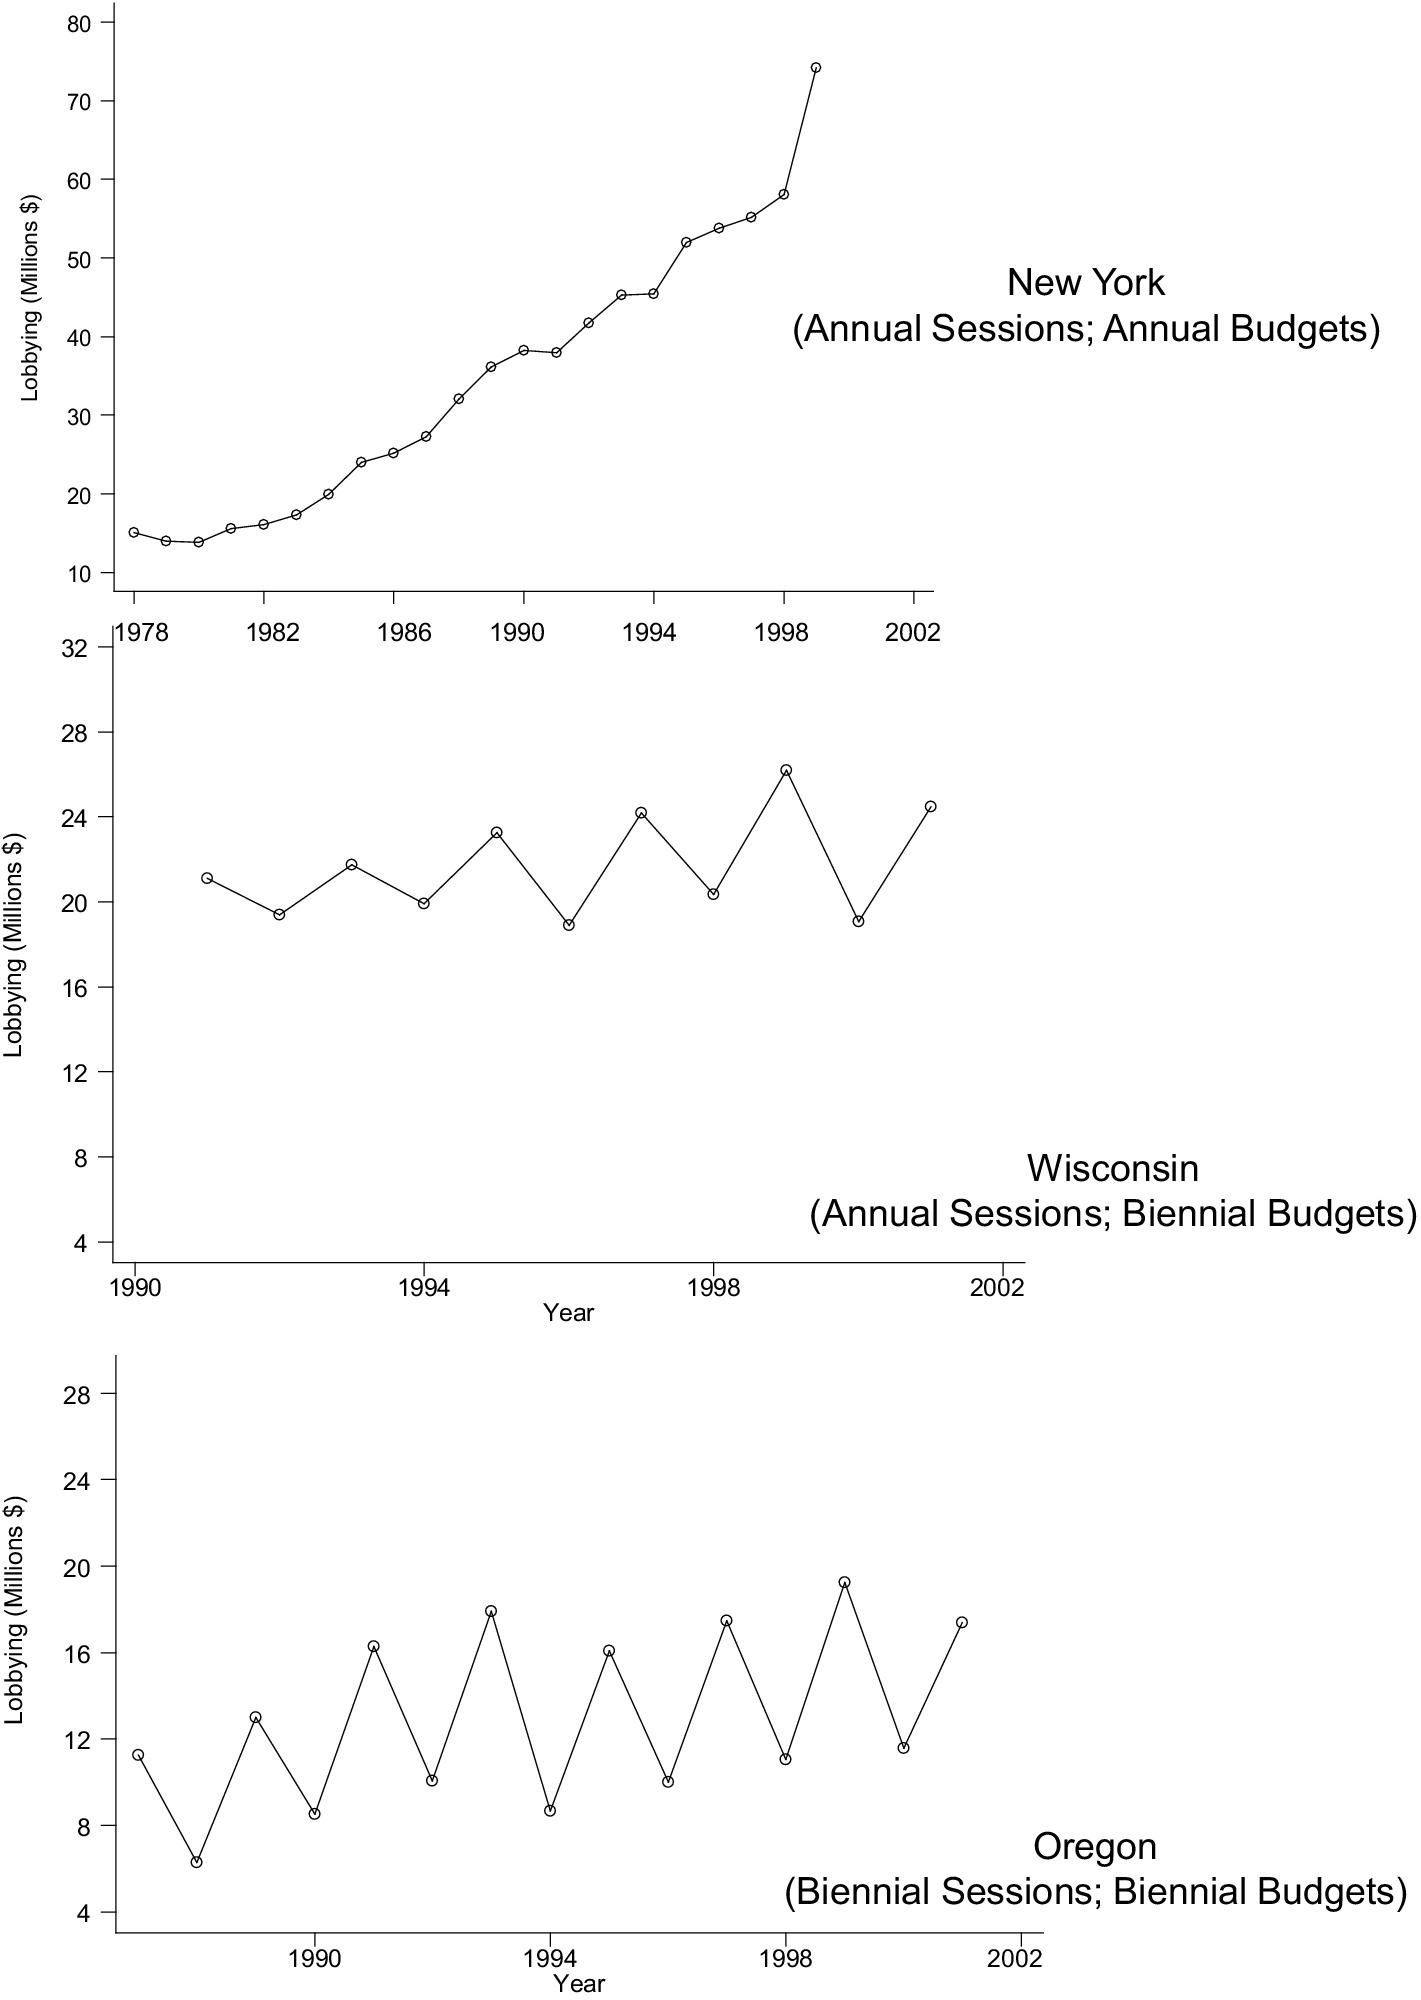
Figure 2. Aggregate lobbying expenditures.
3.3 Methods
In order to examine the effect of budgeting on lobbying, we conduct an OLS regression on panel data. One concern that naturally arises in this kind of panel study is that states differ widely in their lobbying disclosure rules. What is considered lobbying in one state is not necessarily considered lobbying in another state, and thus need not be reported. To control for this, we use state fixed-effects in our statistical analyses. The fixed effects estimation controls for differences across states, and allows us to measure within state variation over time with panel data methods (Hsiao, 2002). In later specifications, we explore random-effects models as well.
3.4 Results
Table 1 provides initial results.18 The dependent variable is the log of annual, per capita interest group lobbying expenditures. Model 1 includes the control variables [Ln (per capita income], Year, and Year2)19 with the electoral variables (Election Year, Size of House Majority, Size of Senate Majority, Unified Government, and Democratic Unified). Model 2 includes the control variables with the legislative structure variables (Budget Year, Regular Session Days, and Special Session Days). Model 3 includes all three sets of variables. All models include state fixed effects for the 37 states considered. A positive coefficient on a variable means an increase in the variable increases the amount of lobbying within a state relative to mean level of lobbying for that state; a negative coefficient means an increase in the variable of interest decreases the amount of lobbying. Standard errors of the coefficients are listed in parenthesis below the coefficient estimates. Statistical significance at the 99%, 95%, and 90% level are noted.
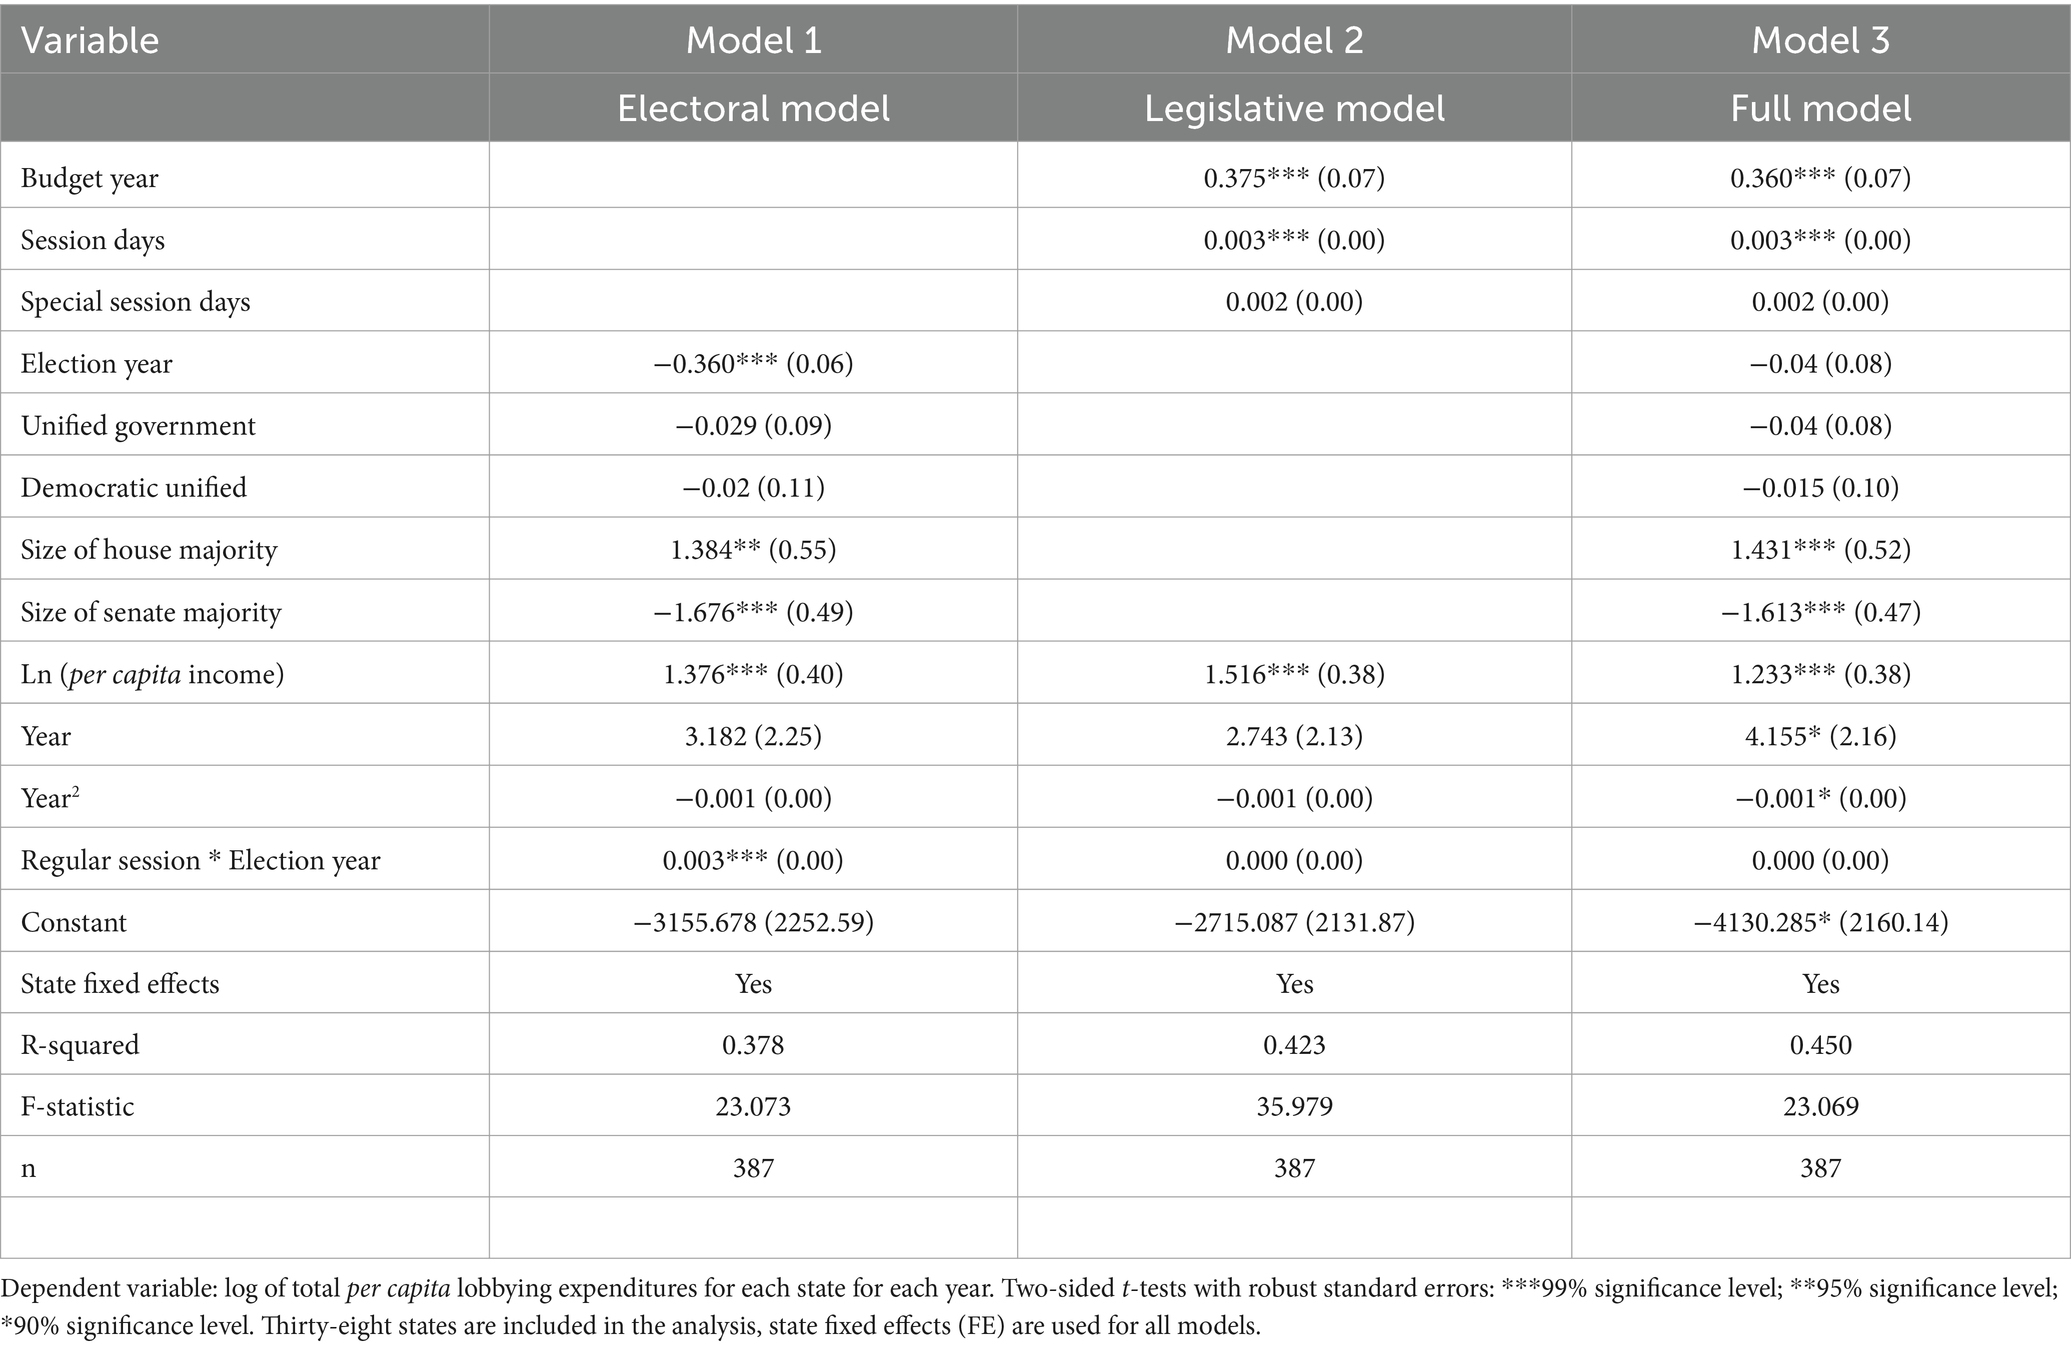
Table 1. Electoral and institutional determinants of aggregate lobbying expenditures.
We begin by discussing the income variable. Per capita income has a large effect on expected lobbying expenditures in all the models. A 1% increase in a given state’s per capita income results in an approximately 3.4% increase in lobbying. This result is similar in sign, but greater in magnitude, to a result found for PAC contributions in earlier work (Ansolabehere et al., 2003), where per capita income has substantial power in explaining the levels of campaign contributions in gubernatorial campaigns.
We turn now to electoral variables. In Model 1, the coefficients on Election Year, Size of House Majority and Size of Senate Majority are statistically significant. According to this model, elections cause lobbying to decrease by 30%, including the partial marginal effect of the interaction term. While a large majority in the state house causes lobbying to increase, a large majority in the state senate causes lobbying to decrease. This result is robust across Model 3 as well. Note that whether the government is unified or not has no statistical effect on lobbying expenditures.
We then add the institutional structure variables in Models 2 and 3; here we obtain some interesting effects. We discuss the results of Model 3, as it is similar to Model 2. First, the average amount of time a legislature is in session in this dataset is 64 days. A 10-day (16%) increase in the average number of days in a session results in a 3% increase in lobbying expenditures by interest groups. This effect, which holds when we control for special sessions, is statistically significant at the 99% level of confidence. A budget year, however, will independently cause a 43% increase in lobbying expenditures. This effect, too, is statistically significant at the 99% level. Another way of framing how large the budget effect is, would be to say that on the margin, a budget year has the same effect on lobbying expenditures as an additional 143 days in a legislative session. This overwhelming impact of the budget on lobbying is one of the main findings of this paper. It cannot really be observed in the federal lobbying data because Congress meets and budgets on an annual basis. The budgeting process, as Kingdon has pointed out, attracts interest groups and results in substantially higher lobbying effort by these groups.
Note that once we control for both electoral and legislative structural factors in Model 3, the coefficient on Election Year and the Election-Session interactive term, sums to a negative marginal effect for elections, but is not statistically significant. Taken together, these results suggest that the length of sessions and budgeting bring out interest group activity in the legislature.
3.5 Robustness and extensions
In order to check the robustness of the results presented in Table 1, we conduct a number of tests whose results we present in Table 2. First, we are concerned that the data may not be stationary.20 To control for this, we run a differences regression, differencing all variables by 1 year. The results of this method are presented in Model 4. The effect of budgeting is still positive and statistically significant, though the magnitude of the effect drops—budgeting now causes a 25% increase in lobbying. However, this coefficient is still much larger than the effect of session length.
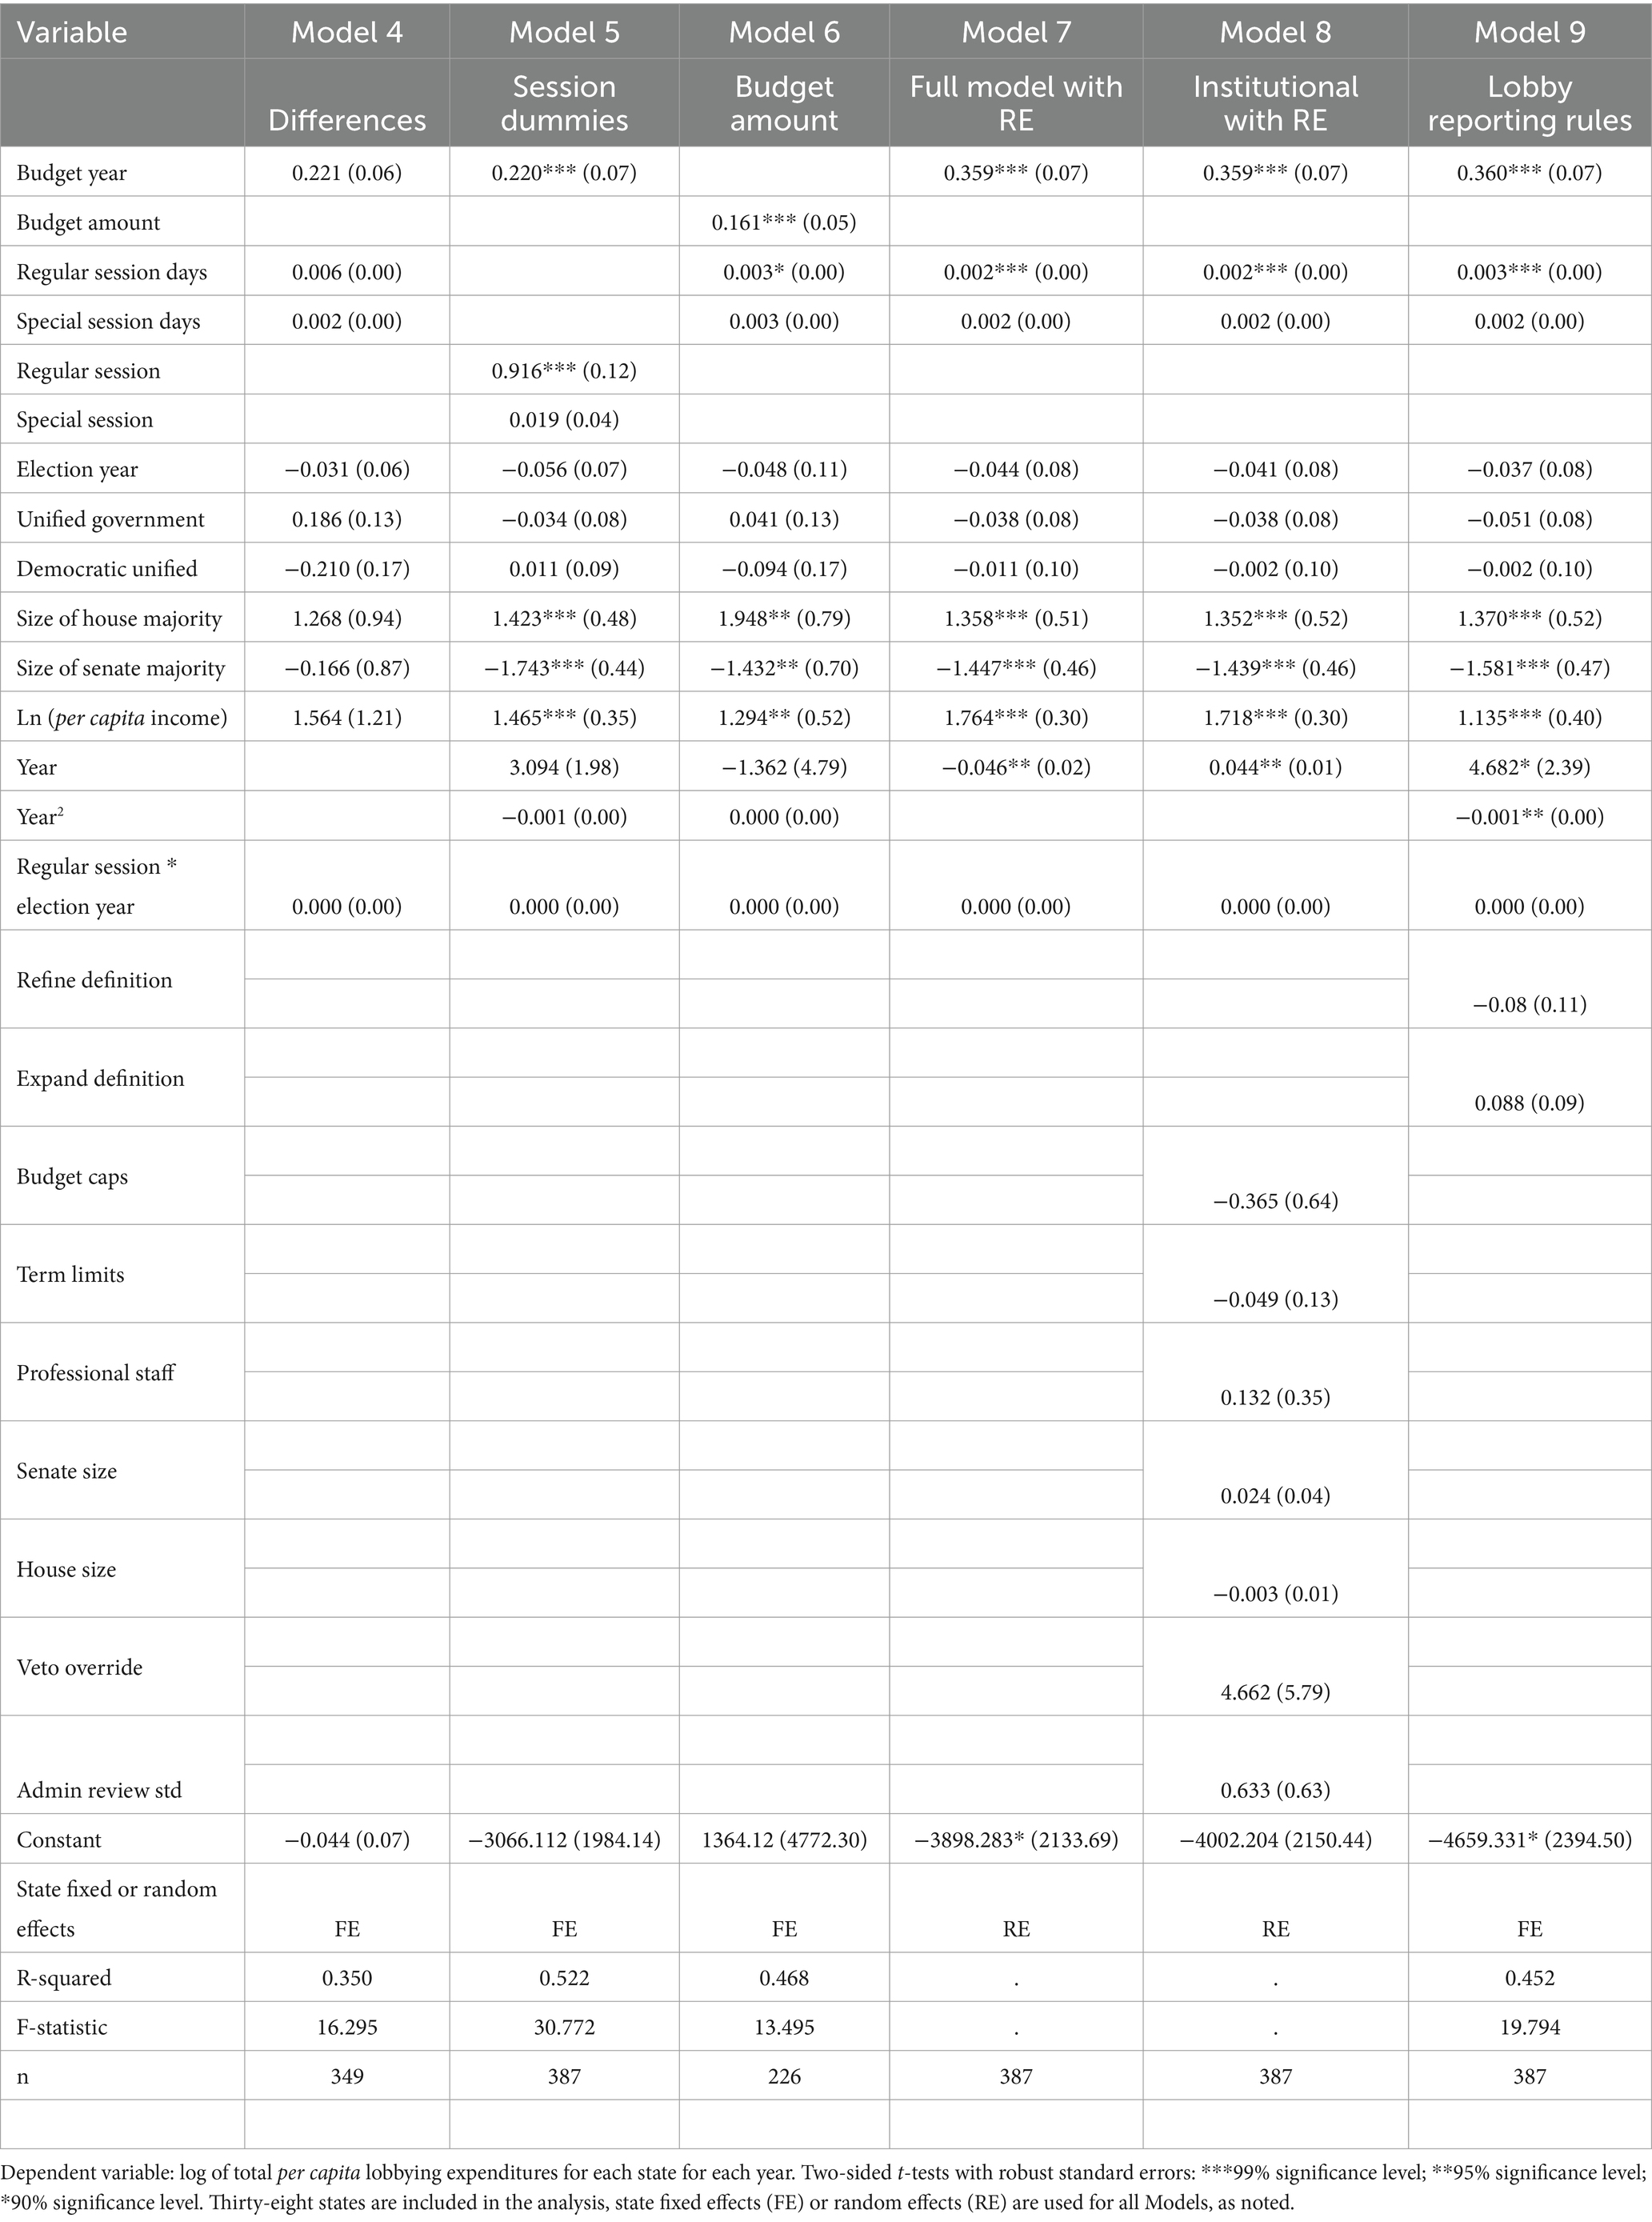
Table 2. Robustness of determinants of aggregate lobbying expenditures.
A second concern is that session length may not be a good measure of the effect of sessions. Rather, using dummy variables may be preferable. Hence we re-run Model 3 using dummy variables for regular and special sessions. (Using dummies for long and short session do not change the results). We report the results in Model 5. We find in both specifications, the results are very similar to the results presented in Model 4, with both Budget Year and Regular Session driving the amount of lobbying expenditures.
Third, we explore the possibility that the size of the budget is what drives aggregate lobbying expenditures. To this end, we construct a variable that represents the amount of the budget under consideration in each year.21 We present the results in Model 6 of Table 2 with caution, only as a robustness check, because the size of the budget may be endogenous to lobbying effort. With that caveat, we note that a 1% increase in the budget is associated with a 17% increase in per capita lobbying expenditures. This is consistent with results in the earlier models. The effect of Regular Session is the same as in previous models. The Election Year variable and the interactive variable are not statistically significant in any specifications, but their magnitudes are almost the same as before.
Fourth, there may be other institutional features that affect lobbying that have been missed in the main analysis. These institutional features differ substantially across states and create more variation for a comparative institutional analysis. We have cataloged six types of institutional structures that might affect the intensity and timing of lobbying: the presence of budget caps (Primo, 2003), legislative term limits (Besley and Case, 1995; Primo and Milyo, 2004), the degree of professionalization of legislators (Fiorina, 1994), the number of seats in the state house and senate chambers, the size of the veto-proof majority (Holburn and Bergh, 2004), and the ease with which the legislature can overturn administrative agencies (Weingast and Moran, 1983). We measure these variables as noted in Appendix 2. One problem with including them in the statistical analysis, however, is that these do not change within a state over time. Therefore, one cannot use state fixed effects in a regression if one hopes to include these variables. However, one can use a random effects model.
To test the robustness of the random effects model, Model 7 replicates Model 3 using random effects. The coefficient estimates and the statistical significance of those coefficients are very close across the models. A Hausman specification test indicates that we cannot reject the hypothesis that the coefficients of the fixed effects and random effects models are the same at the 95% level of confidence. Having established the comparability of the random effects and fixed effects model, we then include in Model 8 the variables measuring the additional institutional features using random effects. None of the additional institutional structure variables have statistically significant coefficients, suggesting we can reject the hypothesis that they influence total lobbying expenditures at the 95% level of confidence.
A fifth possibility is that variation in lobbying disclosure regulations are driving the result. This comparative analysis is related to the debate in corruption on transparency (OECD, 2013). Some authors have suggested that tighter lobbying disclosure regulations result in less lobbying because disclosure can tarnish the reputation of the lobbyists and the lobbying profession (Brinig et al., 1993). Other authors have argued that lobbying regulations have little effect on lobbying firms (Lowery and Gray, 1997). These papers cite as evidence for these points of view the number of lobbyists registered. In conducting this robustness check, we also hope to contribute to the empirical evidence in this debate by employing, as the dependent variable, actual lobbying expenditures.
There are two general types of lobbying disclosure rules. The first are the types that expand the definition of lobbying. These include new rules that include small gifts to legislators as lobbying expenditures, rules that include certain types of events as lobbying expenditures, and rules that expand the definition of lobbying activities (such as to include any meetings with legislators rather than just those to discuss a specific bill). These types of changes in lobbying rules should result in an increase in lobbying expenditures disclosed. A second type of disclosure rule is one that does not expand the definition of lobbying, but requires groups to disclose their lobbying expenditures in a more detailed and refined way. For example, rules that require interest groups to categorize their lobbying expenditures and rules that require lobbying groups disclose their source of funding should not increase disclosed lobbying expenditures per se, but should offer the public more disclosure on the current expenditures.
In Model 9, we replicate the base Model 3 using these variables. Neither type of disclosure law has an effect on the reported amount of lobbying activity by interest groups.
This result is consistent with Lowery and Gray (1997) who show that tougher lobbyist registration rules in the state have no effect on the number of lobbying registrations, but inconsistent with Brinig et al. (1993). We can make a similar statement about the effect of disclosure laws on the reported amount of lobbying. On the whole, these sets of laws lead to no change in the disclosed aggregate lobbying expenditures. This, however, does not mean that there is no change in lobbyist behavior (as has been argued in earlier work), only that whatever changes there are do not show up in disclosed aggregate lobbying expenditures.
Overall, this section supports the previous results that the budgeting process is the primary driver of changes in total aggregate lobbying expenditures. Moreover, other institutional features, such as budget caps, term limits, professionalization of legislatures, and lobbying disclosure rules have little impact on disclosed lobbying expenditures.
3.6 Is budgeting more important than other issues?
While we show that substantial increases in lobbying expenditures are caused by budgeting and not by session length or other structural or electoral features, is the effect of budgeting large relative to other recurring policy windows? To explore this, we examine two issues that recur within legislatures—redistricting and state minimum wage increases. We replicate Model 3, adding, sequentially, whether a state was being redistricted, and whether a state had a minimum wage increase (separate from a federal minimum wage increase). Both issues recur periodically and are likely to attract substantial amounts of lobbying.
Table 3 presents the results. Model 10 includes the redistricting variable, while Model 11 includes the minimum wage variable. Note that neither issue causes a statistically significant increase in aggregate per capita lobbying expenditures. In addition, the large effect of budgeting persists in both specifications. Budgeting is unique in its large effect on lobbying effort.
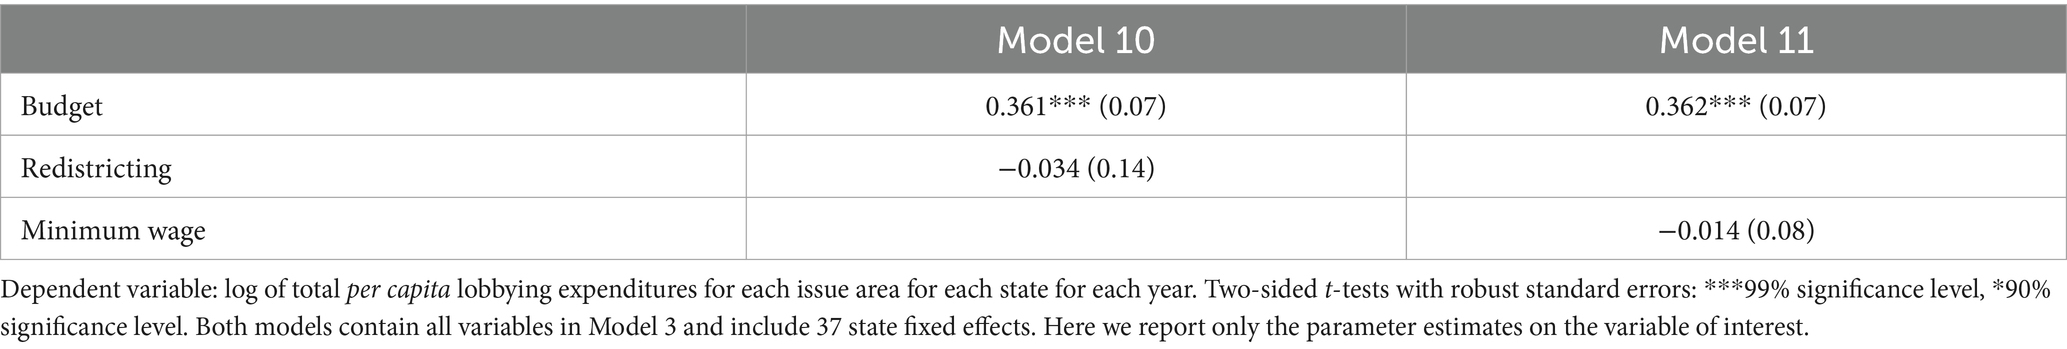
Table 3. Budget vs. other issues.
4 Groups that create the pattern
Having demonstrated that budgets draw interest groups to lobby legislatures, we now want to understand which groups create this pattern in the data. To do this, we rely on more granular data for nine states who agreed to provide us with data. These nine states’ Ethics Commission keep time-series data on each individual interest group’s lobby expenditure each year (for 4 to 10 years). There are over 35,000 interest group-state-year observations of expenditures, covering more than 5,000 separate state-level interest groups.
4.1 Similarities to political action committees
In order to benchmark the aggregate lobbying data, we begin by comparing the lobbying efforts of interest groups to campaign finance contributions of interest groups. We use the classification system used by scholars of political action committee (PAC) contributions (e.g., Ansolabehere et al., 2002) and the Federal Election Commission (2003) that categorizes each of the interest groups into one of four areas: businesses, trade associations, membership/ideological groups, and unions. We have added a “government” category as well because lobbying by state agencies or city governments is required to be reported in many states. This categorization of lobbying expenditures allows us to compare our results to the PAC literature.
First we describe the lobbying data. Reported per capita lobbying expenditures differ vastly by state from $0.01 to $18.32, with a mean of $2.44. A variety of reasons exist for this variation, not the least of which is the laws regarding disclosure. Within states, however, there can still be substantial variation in lobbying across different categories of interest groups and across years. Table 4 uses our preliminary categorization of groups to identify the expenditures for each group for all years’ data available for the nine states for which we have this data. While one must be careful when comparing amounts across states (because of different disclosure rules), comparisons within state do provide a snapshot of lobbying effort. Here we see that in every state, firms and trade associations account for no less than 80% (86% average) of lobbying expenditure. Unions spend less than 4.2% of total lobbying expenditures in each state. Membership groups account for 3%–15% of total lobbying expenditures.22
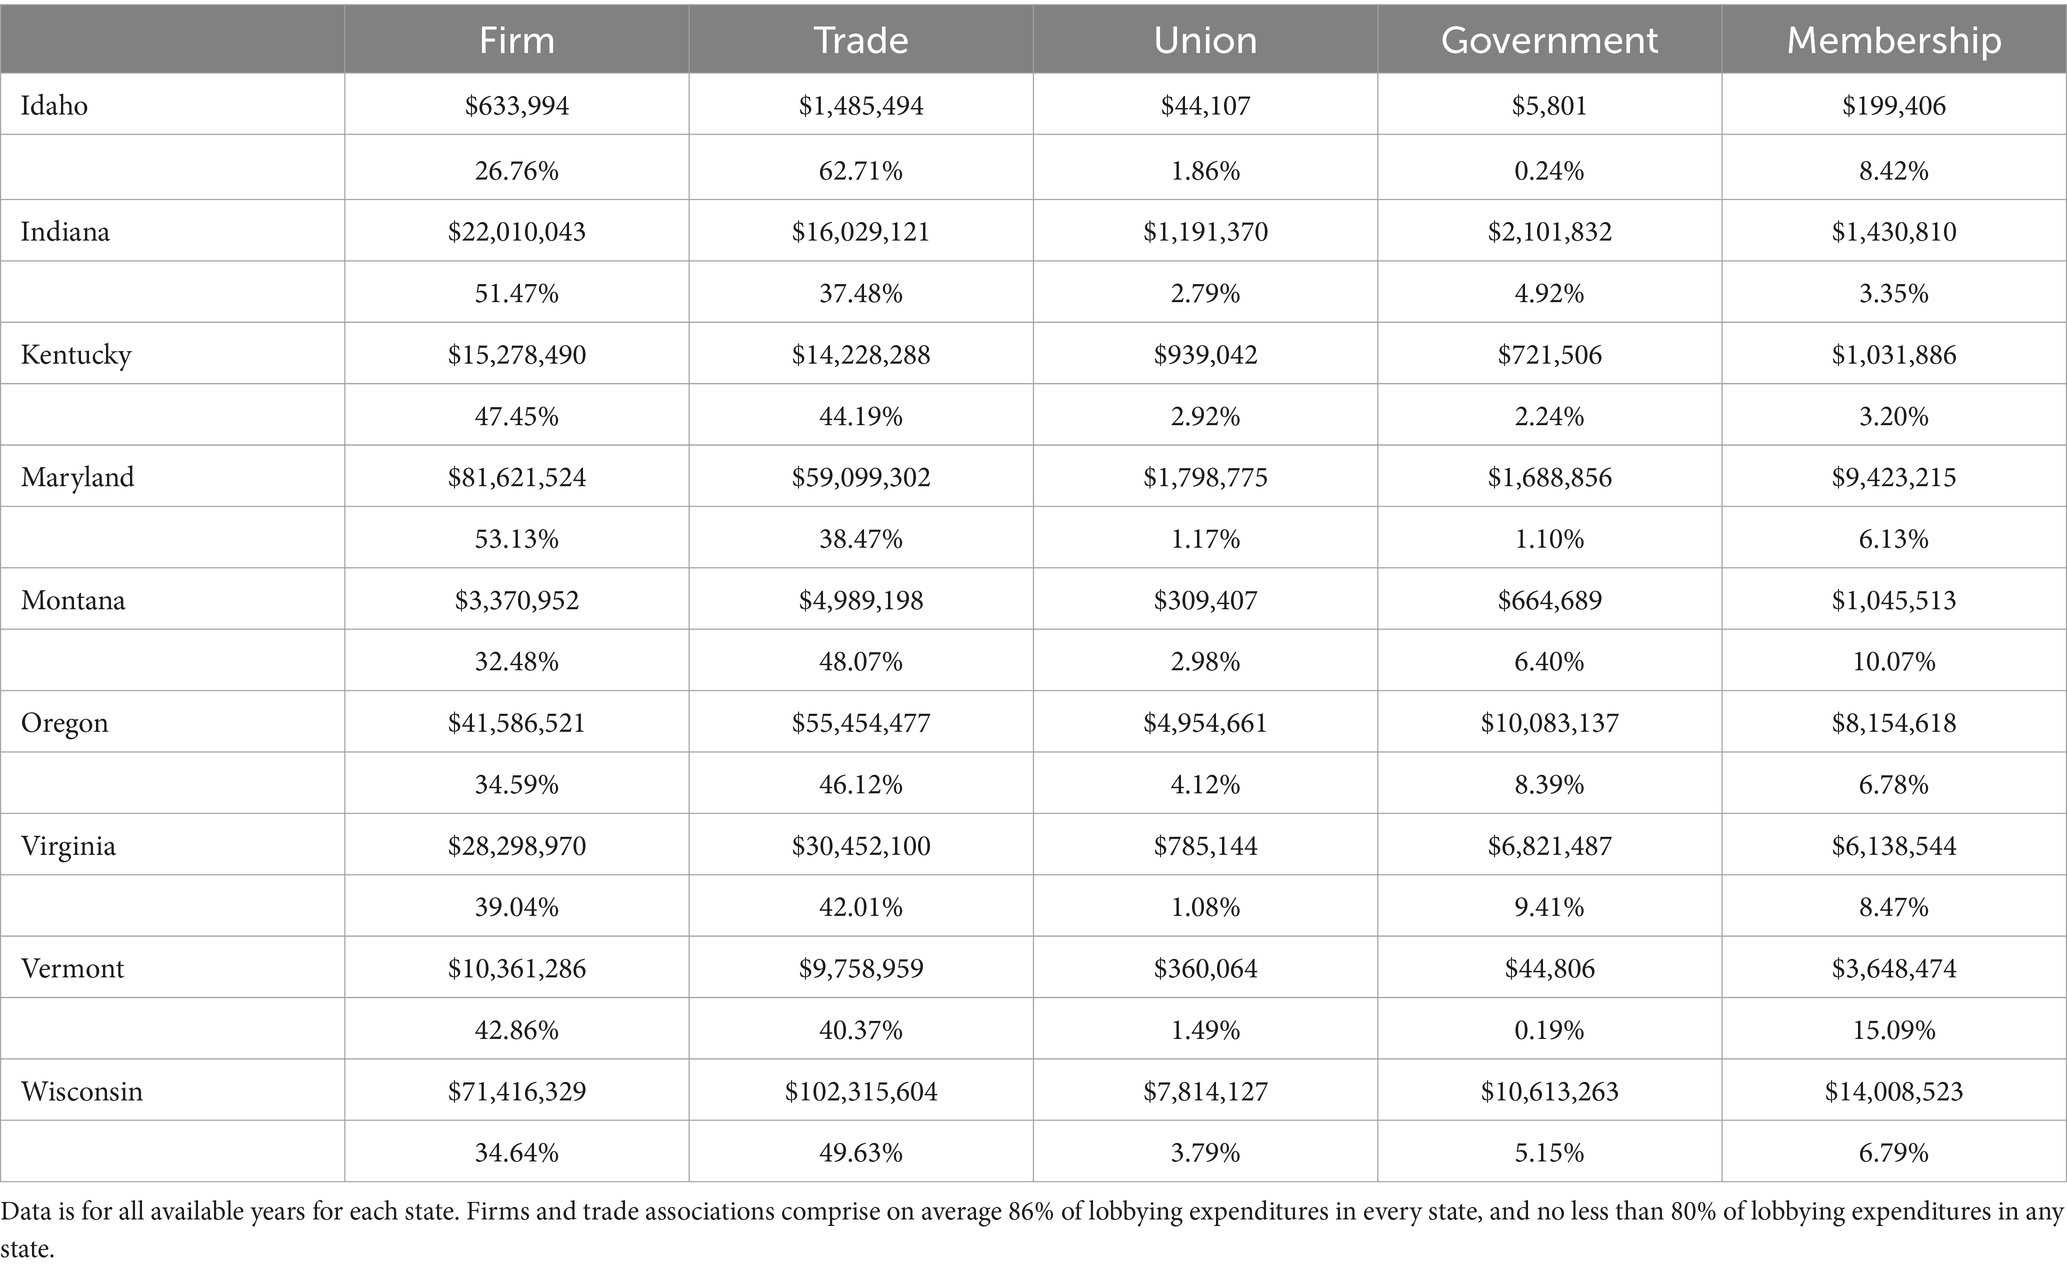
Table 4. Total lobbying expenditures by interest group category.
In Table 5, we contrast the distribution of lobbying expenditures with PAC contributions. The data sources are listed in the table.23 At the federal level, business (corporations and trade associations) comprise 67% of PAC giving, while they comprise 84% of lobbying expenditures. At the state level, these business groups comprise 62% of special interest contributions, but 86% of lobbying expenditures. Labor groups comprise 9% of federal PAC contributions, and 6% of federal lobbying, while at the state level, labor groups comprise 16% of special interest contributions to campaigns and only 2% of lobbying expenditures. Finally, although membership and ideological groups make up a roughly equivalent percentage of campaign finance contributions at the federal and state level (22%–23%), they represent 7% of lobbying expenditures at the state level and only 2% at the federal level. Overall, these results suggest that lobbying is largely a business phenomenon at both the state and federal level, but the business community focuses more on lobbying and less on campaign finance at the state level than the federal level.24
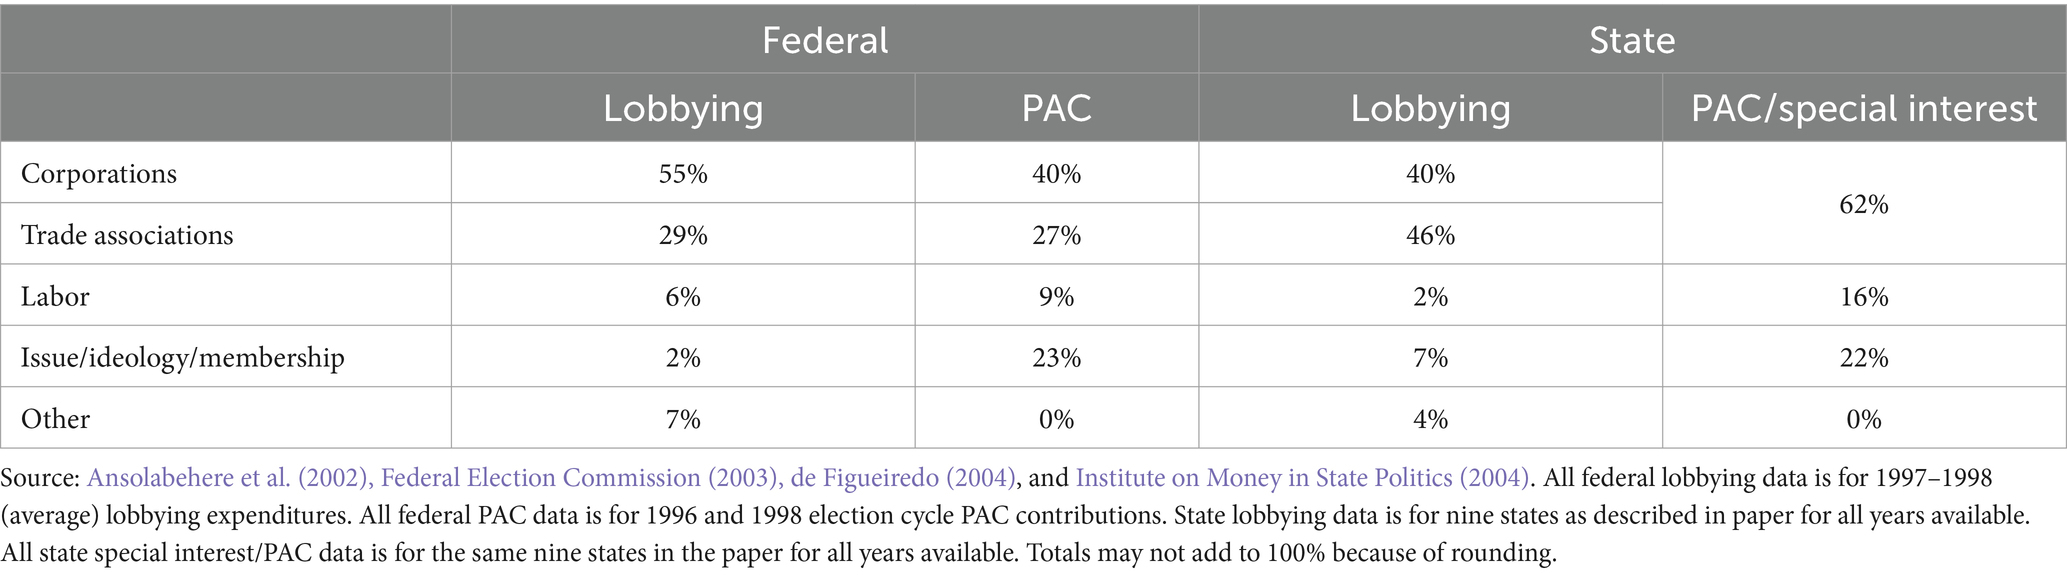
Table 5. Distribution of total lobbying expenditures and special interest/PAC expenditures at the federal and state level.
4.2 Group type and lobbying timing
Taking the categorization given above, we examine whether different types of groups time their lobbying in systematically discernible ways. To analyze this question, we sum each category of groups’ expenditures, so that we know how much unions are spending in each state by year; how much membership groups are spending in each state by year, etc. From this, we create a set of new dependent variables for the next set of regressions to try to identify the underlying patterns of lobbying. We aggregate the lobbying expenditures by interest group category by state on a per capita basis and take logs. We now take this as our dependent variable and re-run Model 3 to see if certain groups are driving the aggregate pattern of lobbying observed. In this section, each observation is a state, year, interest-group-type aggregate lobbying expenditure. Again, we use OLS with state fixed effects in the regressions.
Because only nine states are reported here, there are only 53 observations. With 13 explanatory variables and nine fixed effects, there are not many degrees of freedom, meaning that the standard errors are likely to be large. With this caveat, we present our results in Table 6.
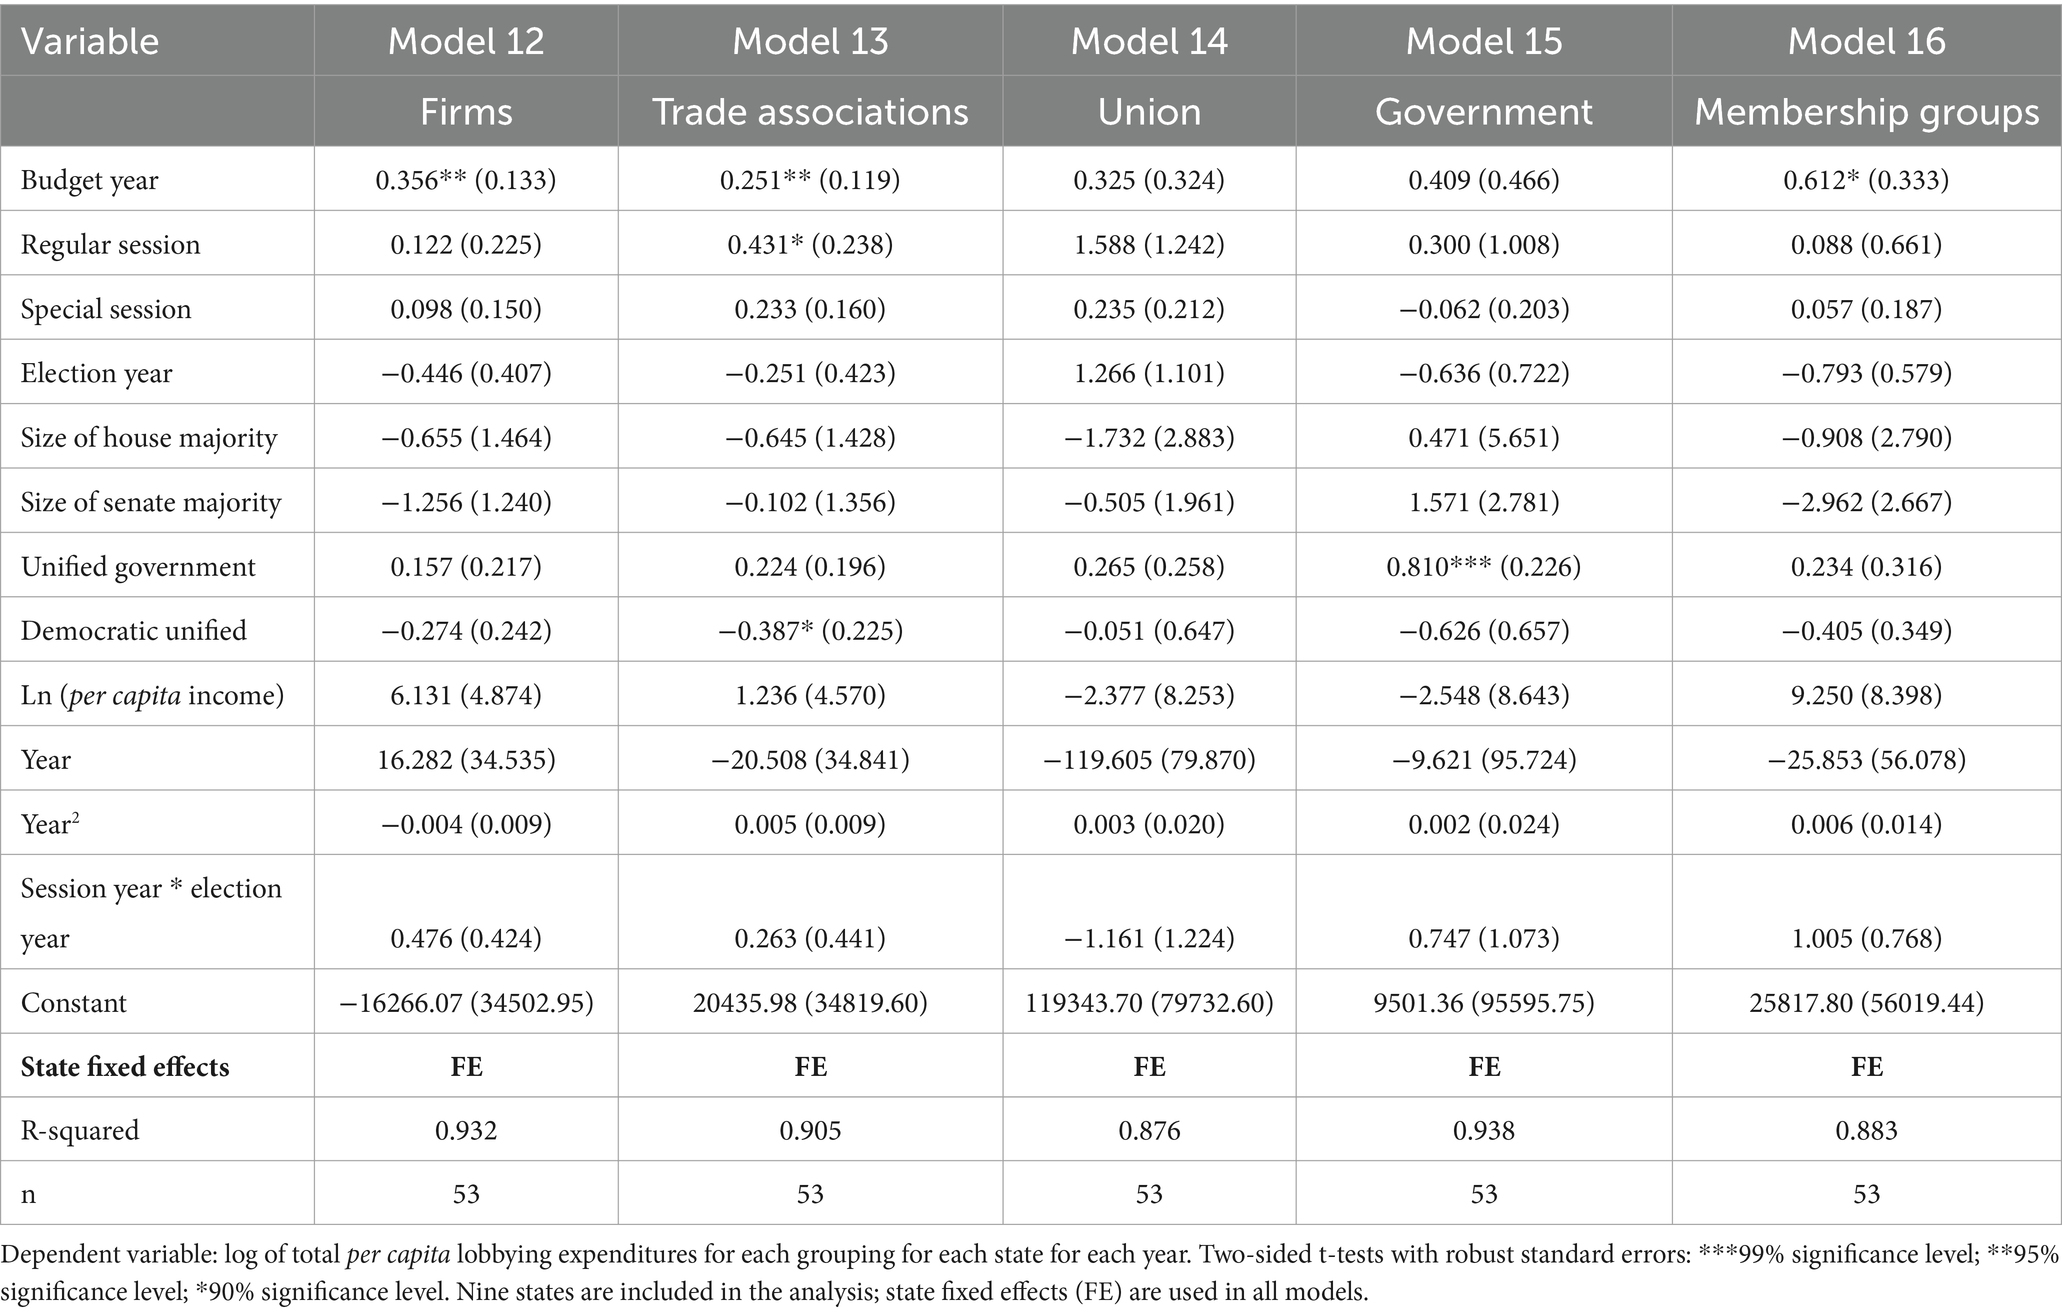
Table 6. State level lobby expenditure by group category.
Model 12 includes lobbying by firms, Model 13 includes lobbying by trade associations, Model 14 uses lobbying by unions, Model 15 uses lobbying by government agencies, and Model 16 uses lobbying by membership groups. In all the models the coefficients on Budget Year and Regular Session are positive. In Models 12 and 13 (collectively business), per capita lobbying expenditures are 40% higher for firms and 28% higher for trade associations in budget years than non-budget years. These results are statistically significant at the 95% level of confidence. In Models 14, 15, and 16, we see that per capita lobbying expenditures are 38% higher, 50% higher, and 84% higher for unions, governments, and membership groups, respectively, in budget years relative to non-budget years. These coefficients, however, do not reach the standard levels of statistical significance, perhaps because of the few degrees of freedom. Although a handful of other coefficients are statistically significant, there is no systematic pattern. However, it is worthwhile noting that unions are the only type of interest group that have a positive coefficient on Election Year and negative coefficient on the interaction term. In addition, government interest groups increase their lobbying substantially during periods of unified government.
Taken together, these results lead us to a number of interpretations of the data. First, all groups lobby at substantially higher levels when the legislature is in regular session, but none of the coefficients are statistically significant at the 95% level. Second, the increase in lobbying expenditures during budget years seems to be driven by business, and not by unions or government agencies. This result is in slight contrast to Nownes and Freeman (1998) who, in their survey of 896 lobbyists and organizations in three states, found that no significant variation in the lobbying techniques used by different types of groups—particularly with respect to direct lobbying.25 Third, given the relative magnitude of the budget coefficients of the five models, businesses exhibit lower variation in lobbying expenditures from year to year than other organizations. This fact, combined with the fact that business accounts for over 80% of lobbying expenditures (noted in the previous section), suggests that businesses maintain a continued presence in state capitals, lobbying on a regular basis, while other groups maintain a more sporadic lobbying effort. Moreover, when budgets arise, businesses raise their lobbying expenditures somewhat. However, because businesses represent such a large percentage of total lobbying expenditures, the 30%–35% increase in lobbying expenditures they engage in during budget years means they create a large increase in aggregate state lobbying expenditures. Fundamentally, the spikes seen in the biennial budgeting states shown in Figures 1, 2 are generated by business interest groups.
4.3 Extension: issue areas and lobbying timing
Although businesses are driving the spikes and troughs in lobbying, in a final empirical analysis, we examine the extent to which groups affected by different policies of government time their lobbying differentially. We do this by examining the timing of lobbying by issue area. We classify each interest group in these nine states as primarily concerned with 1 of 32 issue areas. We then create two main, mutually exclusive “types” of interest group categories: (1) groups which are affected by both budgetary and regulatory rules of the state, and (2) groups which are affected primarily by regulatory rules.
To implement this, we use a classification system developed by Gray et al. (2004). Gray et al. obtained the names of every interest group that was registered to lobby at the state level in 1997 (over 34,000 in total). They then categorized each group by topic area they identified. We have taken the Gray et al. coding and merged it into our file, adding eight additional categories to obtain more fine-grained detail. However, we have panel data, and new interest groups enter every year into each state. For those groups not in the Gray et al. database, we conducted web searches to identify the groups using this classification system. Table 7 presents the classification.
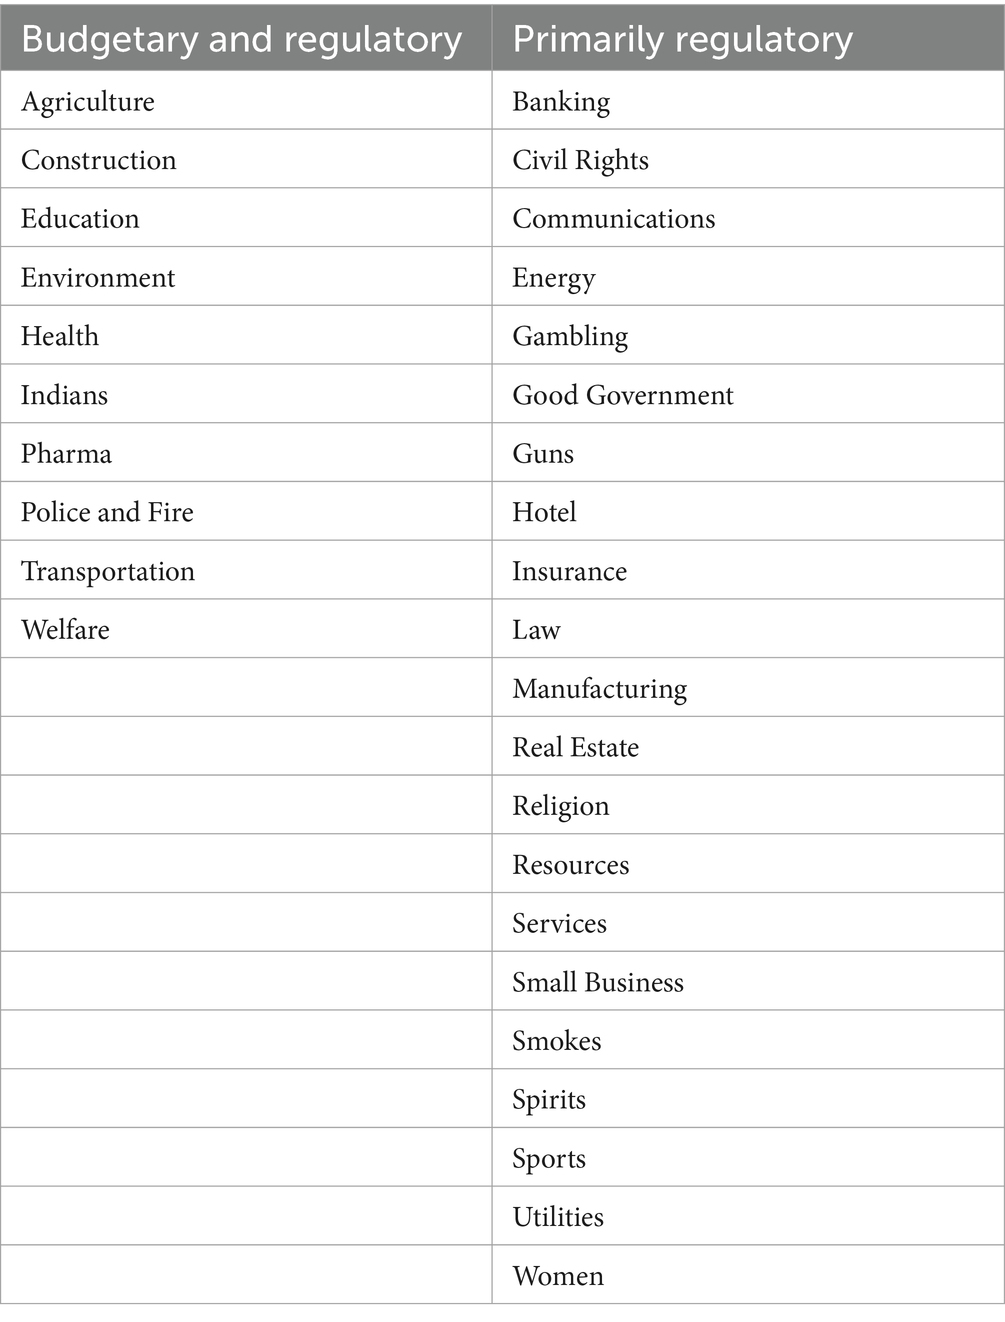
Table 7. Classification of issue areas.
We recognize this classification is somewhat stylized and rough. In reality, there is a continuum between how much an interest group is affected by budgets and how much an interest group is affected by regulation. We do believe to a first approximation, however, that these budget categories reflect where the preponderance of state’s influence is on the special interest’s business (e.g., education is both budgetary and regulatory, while insurance is primarily regulatory).
As before, we sum each topic area’s expenditures, so that we know how much agriculture is spending in each state by year; how much health groups are spending in each state by year, etc. for the nine states. We aggregate the lobbying expenditures by issue by state by year on a per capita basis and take logs to create the final dependent variables, and run models similar to the previous section, using OLS with both state and issue area fixed effects.
As noted in the theory section, budget issues, which can only be handled within the budget framework, should result in more lobbying within the legislature during budget years than non-budget years. Regulatory issues, however, can be passed at any time. Given the budgetary process creates a global policy window, the costs to passing policy proposals that are attached as riders to the budget, rather than stand-alone bills, has a substantially lower cost. Thus, from a cost perspective, interest groups are more likely to have success passing regulatory rules during budgeting, and therefore we should see an increase in regulatory lobbying during budget years, holding other factors constant.26
Table 8 presents the results. The sample frame for Model 17 is all groups that have both budgetary and regulatory issues before state legislatures (the first column of Table 7), while the sample frame for Model 18 is all groups that have primarily regulatory issues before the state legislatures (the second column of Table 7). The dependent variable is the amount of lobbying by each interest group in each respective grouping. Model 17 presents the results for budgetary and regulatory issues and Model 18 presents the results for primarily regulatory issues.27 In Model 17, the coefficient on Budget Year is positive and statistically significant. There is, not surprisingly, a 39% increase in lobbying by groups concerned with budgetary and regulatory (Table 7, first column) issues during budget years. There is a 50% decrease in lobbying by these same groups during election years, though a session during an election year leads to slightly more lobbying on net (through the interactive effect). Unified government of either party leads to 46% more lobbying than during spells of divided government.
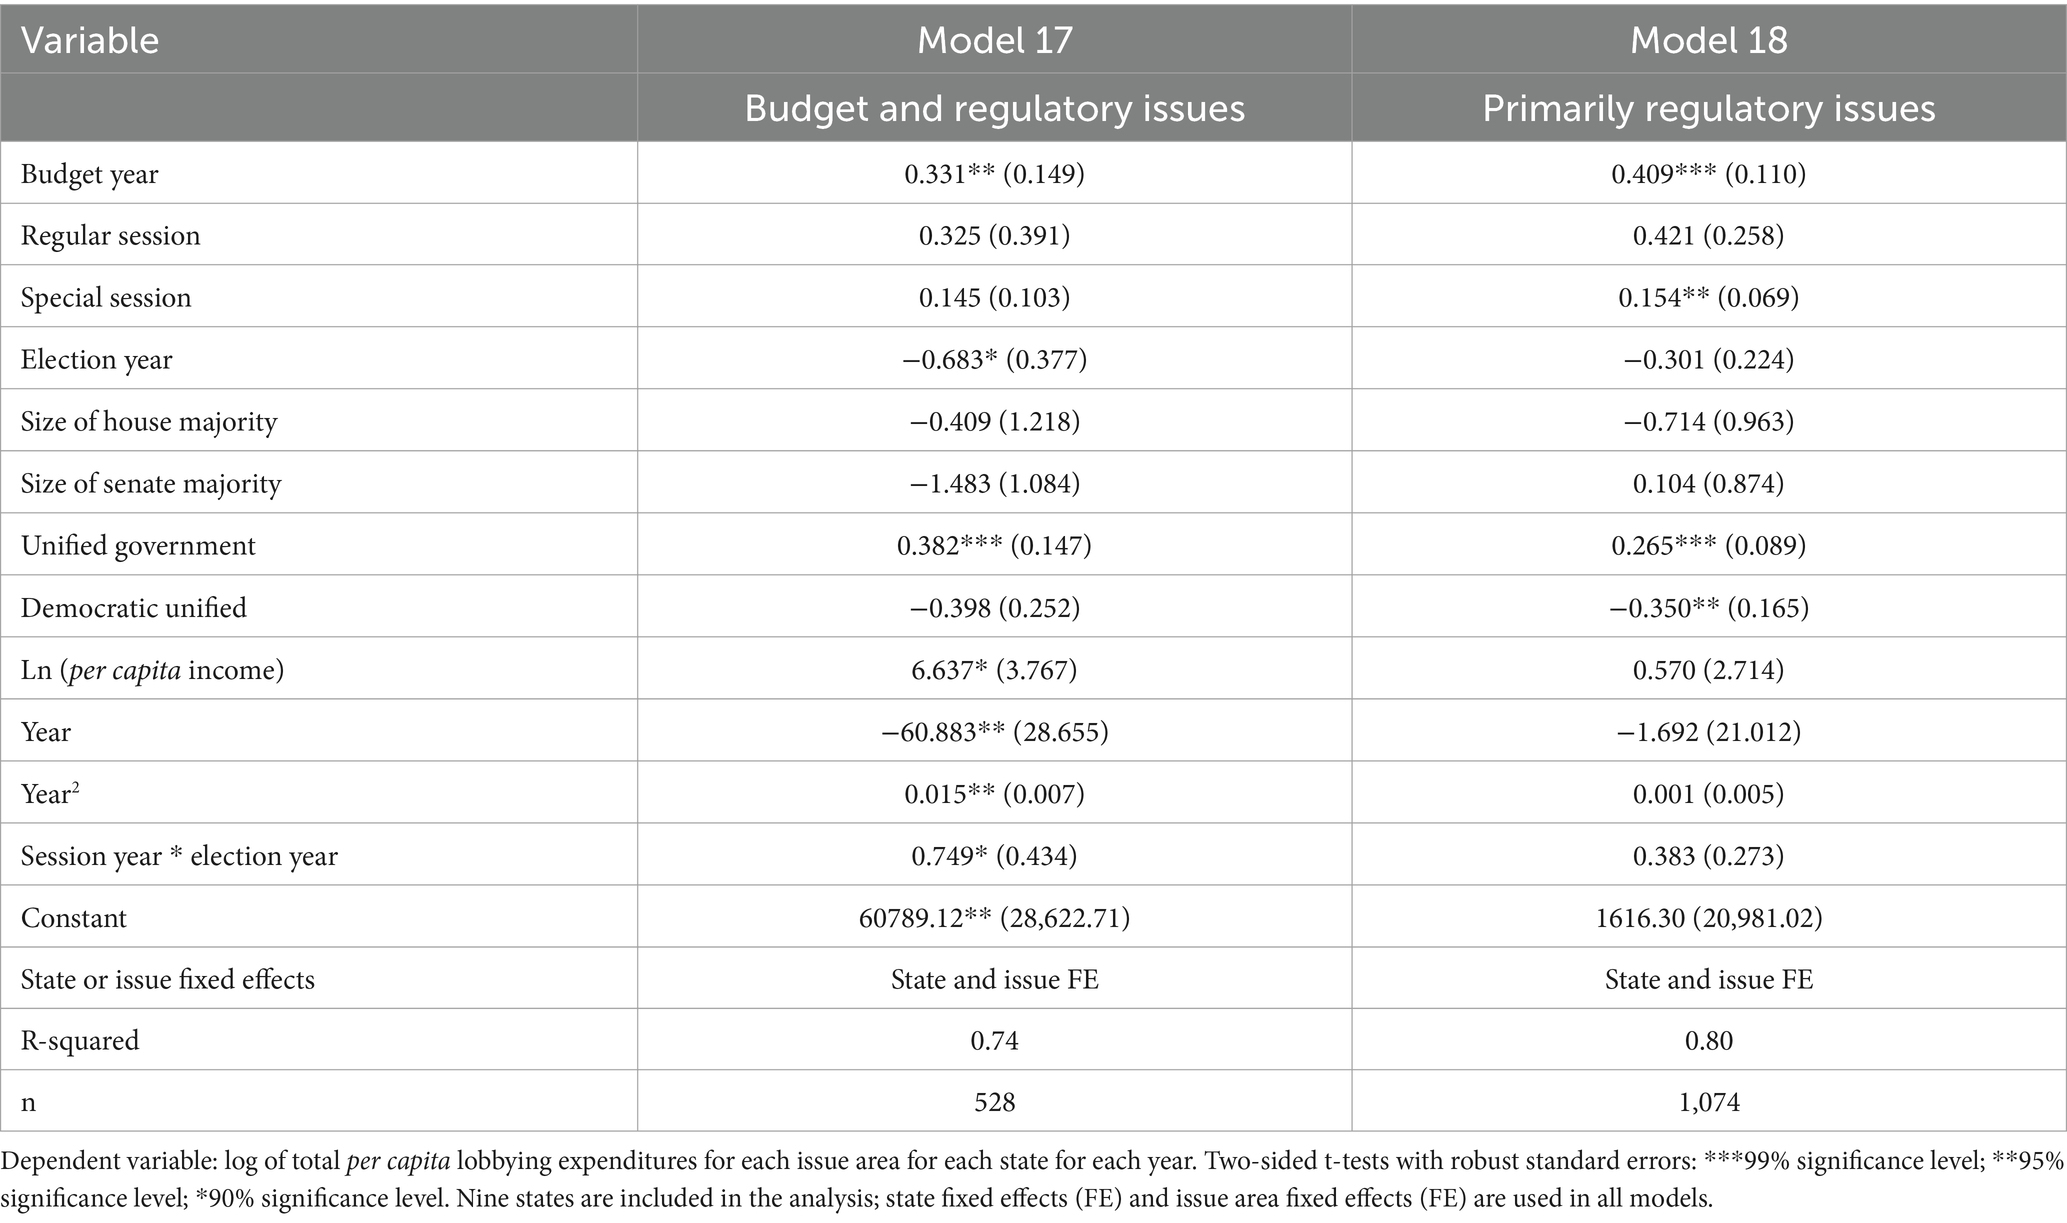
Table 8. State level lobby expenditure by issue area.
Many of the results in Model 18 are similar. Groups that are concerned primarily about regulatory issues lobby even more in budget years, on the margin, than those concerned about budgets. There is 49% increase in lobbying for these primarily regulatory groups (Table 7, second column) during budget years, an increase which is statistically significant at the 99% level. Special sessions also result in more regulatory lobbying. The Election Year coefficients are not statistically significant. Republican unified government results in 30% additional lobbying than non-unified government, while Democratic unified government results in 9% less lobbying than non-unified government. This latter result actually points to groups affected by regulation may be lobbying heavily for deregulation rather than regulation. In sum, despite having fewer budgetary concerns, groups primarily affected by regulations do more lobbying during budgetary years and during Republican unified government.
Overall, these final results paint an interesting picture of the composition of the lobbying effort by interest groups. While groups affected by the budget do increase their lobbying expenditures during budget years, groups not affected by the budget also increase their lobbying expenditures during budget years. Though not a definitive test of policy windows, the results are consistent with interest groups pressing legislators to attach riders to the budget as a less costly mechanism for passing regulation and deregulation than is passing the same bill in stand-alone form. The fact that regulatory lobbying picks up when there is Republican unified government is also an indication that groups seeking lower hurdles for regulation may be lobbying during this opportune moment—when friends in office are passing must-pass budgetary legislation—offering a good time for attaching riders to the budget bill.
5 Conclusion
This paper complements the extensive micro-oriented (or single vote or single-issue) literature on interest groups by examining through a comparative lens the macro-determinants and timing of interest group lobby. In doing so, it has argued that the budgeting process is unique in its effect on the timing of interest group lobbying in many institutional contexts. Employing a dataset of lobbying at the state level, the paper exploits cross-state and time-series variation in a comparative analysis to determine how features of government affect lobbying expenditures. The paper demonstrates that interest groups increase their activities substantially when the legislature is in regular session and when the legislature is engaged in budgeting. It also demonstrates that much of this budget year effect can be explained by business and trade groups expanding lobbying efforts during budget years. Unions and government agencies do not increase lobbying efforts during this time. Moreover, businesses, which comprise on average 86% of all lobbying expenditures within a given state, have much lower variance in lobbying than other groups. This is consistent with the idea that businesses maintain a steady and continued presence in legislatures of all types, while other types of interest groups expand and contract their lobbying as their resources and the issues that interest them, rise and decline in the legislature.
Moreover, both budget-related lobbying and regulatory lobbying increase during budget years. Groups affected by budgets have no other time to lobby; groups affected by regulation will find the budget to be a low cost vehicle for passing their favored programs. One reason for this is that regulatory groups may be encouraging legislators to use the budget as a vehicle on which to attach non-budgetary riders.
An additional result of the paper is that elections have a negative or no (in the interaction term) effect on timing of lobbying, contrary to some received wisdom. It is clear that the variation in institutional structure of state governments allows us to see structural policy windows that might not otherwise be discernible. Hence, the comparative empirical lens is attractive. The results presented here are a first step in the more depth and comparative determinants of interest group lobbying effort. Future work could consider more comprehensive and detailed models of lobbying, pull apart in more detail the components of lobbying in budget years, and examine the differences in budgetary and regulatory lobbying.
Authors note
An earlier version of this paper can be found at de Figueiredo (2004).
Data availability statement
Publicly available datasets were analyzed in this study as noted. The lobbying data are available at the state lobbying disclosure offices.
Author contributions
JF: Writing – original draft.
Funding
The author(s) declare that no financial support was received for the research, authorship, and/or publication of this article.
Acknowledgments
I would like to thank Jim Alt, Steve Ansolabehere, Chuck Cameron, Daniel Diermeier, Tim Groseclose, Rob Lowry, David Primo, Jim Snyder, Jesper Sorensen, and Ezra Zuckerman for useful discussions. In addition, seminar participants at MIT, Wharton, Rochester, Stanford, Wharton, and the ALEA have provided helpful comments. I would also like to thank officials at the state ethics commissions and other lobbying disclosure agencies for providing me with data for this paper.
Conflict of interest
The author declares that the research was conducted in the absence of any commercial or financial relationships that could be construed as a potential conflict of interest.
Publisher’s note
All claims expressed in this article are solely those of the authors and do not necessarily represent those of their affiliated organizations, or those of the publisher, the editors and the reviewers. Any product that may be evaluated in this article, or claim that may be made by its manufacturer, is not guaranteed or endorsed by the publisher.
Supplementary material
The Supplementary material for this article can be found online at: https://www.frontiersin.org/articles/10.3389/fpos.2024.1288798/full#supplementary-material
Footnotes
1. ^This is the scope of the definition that most state Ethics Commissions and agencies use to define lobbying activity. For empirical reasons, we adhere to this general definition.
2. ^This data is now widely and easily available at www.lobbyview.org.
3. ^Thieme (2020) examines three states using state level disclosure data.
4. ^There are many theoretical models suggesting interest groups are concerned about legislator’s re-election prospects and provide information to enhance it. This is just one of many possible ways interest groups might behave.
5. ^The data came from the Center for Responsive Politics (www.opensecrets.org).
6. ^There have been a variety of surveys on interest group lobbying, including Milbraith (1963), Scholzman and Tierney (1986), and Walker (1991), to name just a few. Surveys are an important data source in this literature.
7. ^Smith (1995) reaches similar conclusions in his examination of statistical studies of lobbying.
8. ^While these papers have extended our comparative work in the area of interest groups, they have generally limited their analysis to the count of lobbying groups, and from that, sometimes make inference about the intensity interest group activity. Whether this latter step is valid is an open question. This paper addresses these issues.
9. ^In this paper, the effect of budgets is very small, sometimes positive and sometimes negative, and sometimes statistically significant and sometimes not.
10. ^Nownes and Freeman (1998, p. 110) note, in a critique of surveys to date, “In closing, we wish to note that our findings strongly imply that we must develop new ways to gather information about interest group activity. Why? [O]ur results show that the practice of presenting groups with a list of techniques and asking them which they use has become arachaic. In many (if not most) cases, this ‘laundry list’ approach leads to a ‘yes, we use all of the above’ response.”
11. ^Wiggins et al. (1992) utilizes interviews and surveys. Enlightening case studies include Hrebenar (1992) and Hrebenar and Thomas (1993a,b).
12. ^Snyder (1992) and Stratmann (1998) have examined the timing of PAC contributions.
13. ^de Figueiredo and Kim (2004) develop a theory of the timing of regulatory lobbying, and Austen-Smith (1993) has developed a model of lobbying for agenda setting and then for votes, however, this is usually considered within the same bill.
14. ^Bennedsen and Feldmann (2002) examine the differences in the incentive to lobby across presidential and parliamentary systems.
15. ^Kingdon (2003, p. 188) discusses this.
16. ^Coates (1995) has argued that legislators with large majorities and secure seats may behave differently than legislators without these benefits.
17. ^We use days of the session because we worry that in budget years, the legislature may be in session for longer periods of time, and the fact that they are in session for a greater number of days drives the increased lobbying expenditure, not the budgeting. In robustness checks, we also use session and special session dummies. Some legislatures measure their sessions in calendar days, some measure the session as legislative days, and other measure the session in both. For those that measure it both, we found that on average, the number of legislative days were 40% of the number of calendar days. We normalize the number of days accordingly to get comparability across legislatures.
18. ^The Center for Public Integrity collects data on state lobbying expenditures. Their data does not go as far back in history as the data presented in this paper. In addition, their data has inconsistencies within a handful of states. When we run the statistical tests on their data, the coefficients have the same signs, often do not reach the standards levels of statistical significance. This is likely due to the fact that they have approximately 60% of the data presented here, and thus the t-tests do not have sufficient power.
19. ^Year and Year2 are included to control for linear and nonlinear time trends effects in the data.
20. ^Dickey-Fuller tests on each of the series shows that some of the very long series are non-stationary.
21. ^We take the amount of the budget in any given year. For those with biennial budgets, a problem arises. In the off-years, the budget is zero. We could model this, but then if we take logs, these observations disappear. Moreover the results, if we just use budget levels, are similar to the dummy variable specification. To address this concern, we use 90% of the two-year budget in the budgeted year, and 10% of the budget in the second year. The rationale is that in any given off-year, up to 10% of the budget can be re-budgeted during special session to accommodate fiscal needs. Thus, the amount of budget up for grabs is about 10% of the entire budget. We then adjust the budget for per capita spending then take logs.
22. ^Whether this means that business interests exert more influence in lobbying than do labor and issue groups is unclear. Only future study will allow us to understand this question. Moreover, this preliminary finding helps to explain the findings of earlier studies that document business interests having far more lobbyist registrations than labor and membership groups. This higher number of registrations is manifested in more lobbying expenditures.
23. ^The data on state PAC/Special Interest money is approximate. The Institute of Money in State Politics (IMSP) hires contractors to collect data from the states on all state campaign finance contributions. We have checked their data with state records (collected by the state election commissions) and with Jensen and Beyle (2003) and find that they are somewhat close—approximately within 5–10% of each other. We then used the classification system from the IMSP to classify the state PAC data. Ideological and Party Groups were classified as Ideological/Membership. Unions and Civil Service/Retirement groups were classified as Unions. All others were classified as corporations and trade associations collectively. The data in Table 5 provide the detailed data on the state level for the nine states listed in Table 4.
24. ^Leech et al. (2005) find that business lobbying is a significant component of overall lobbying at the federal level.
25. ^Nownes and Freeman (1998) examine the number of different techniques used, rather than the intensity of those techniques. To the extent that this paper measures the intensity of different forms of direct lobbying, it would suggest that mere 0–1 variables that ask “did you do X?” offer more detail on some dimensions, but less detail than the current data in other dimensions.
26. ^On the other hand, in a retrospective voting model with heavy discounting, legislators may get more credit for passing legislation close to the election rather than in previous time periods. If this is the case, then legislators benefit more passing legislation close to the election rather than earlier. In a biennial budgeting state, higher benefit would be conveyed in the off-budget year (or the election year). This would lead to higher incentive to pass bills in the off-budget year. Which effect dominates is an empirical matter. If we see regulatory groups lobbying more heavily in budget years, we assume that the “rider” effect dominates. However, if we see regulatory groups lobbying more heavily in election years, then the “retrospective voting” effect dominates.
27. ^One concern that may arise is that budget years sometimes have longer sessions than non-budget years. To control for this, we replaced the session year variable with short session and long session variables and re-run the regressions. The results are similar.
References
Achen, C. H., and Bartels, L. M. (2004). “Musical chairs: Pocketbook voting and the limits of democratic accountability,” In: Princeton University Working Paper.
Ansolabehere, S., de Figueiredo, J. M., and Snyder, J. (2003). Why is there so little money in U.S. politics? J. Econ. Perspect. 17, 105–130. doi: 10.1257/089533003321164976
Ansolabehere, S., Snyder, J., and Tripathi, S. (2002). Are campaign contributions and lobbying expenditures linked? Bus. Polit, 4. 131–155.
Austen-Smith, D. (1993). Information and influence: lobbying for agendas and votes. Am. J. Polit. Sci. 37, 799–834. doi: 10.2307/2111575
Barber, B., and Weschle, S. (2023). “The enemy of my enemy is my friend: Competitor lobbying and regulatory fines,” In: IE Business School Working Paper.
Baumgartner, F. R., and Jones, B. D. (1993). Agendas and instability in American politics. Chicago: University of Chicago Press.
Baumgartner, F. R., and Leech, B. L. (1998). Basic interests: The importance of groups in politics and in political science. Princeton: Princeton University Press.
Baumgartner, F. R., and Leech, B. L. (2001). Issue niches and policy bandwagons: patterns of interest group involvement in National Politics. J. Theor. Polit. 63, 1191–1213. doi: 10.1111/0022-3816.00106
Bennedsen, M., and Feldmann, S. E. (2002). Lobbying legislatures. J. Polit. Econ. 110, 919–946. doi: 10.1086/340775
Bertrand, M., Bombardini, M., and Trebbi, F. (2014). Is it whom You know or what You know? An empirical assessment of the lobbying process. Am. Econ. Rev. 104, 3885–3920. doi: 10.1257/aer.104.12.3885
Besley, T., and Case, A. (1995). Does electoral accountability affect economic policy choices? Evidence from gubernatorial term limits. Q. J. Econ. 110, 769–798. doi: 10.2307/2946699
Brasher, H., Lowery, D., and Gray, V. (1999). State lobby registration data: the anomalous Case of Florida (and Minnesota too!). Legis. Stud. Q. 24, 303–314. doi: 10.2307/440313
Brinig, M. F., Holcombe, R. G., and Schwartzstein, L. (1993). The regulation of lobbyists. Public Choice 77, 377–384. doi: 10.1007/BF01047876
Coates, D. (1995). Electoral support and the capture of legislators: evidence from North Carolina’s vote on radioactive waste disposal. Rand J. Econ. 26, 502–518. doi: 10.2307/2556000
de Figueiredo, J. M. (2004). “The timing, intensity, and composition of interest group lobbying: an analysis of structural policy windows in the states,” In: National Bureau of Economic Research Working Paper #10588.
de Figueiredo, J. M., and Cameron, C. M. (2014). Endogenous cost lobbying. In: Princeton University Working Paper.
de Figueiredo, J. M., and Kim, J. K. (2004). When do firms hire lobbyists? The Organization of Lobbying at the Federal Communications Commission. Ind. Corp. Chang. 13, 883–900. doi: 10.1093/icc/dth035
de Figueiredo, J. M., and Richter, B. K. (2014). Advancing the empirical research on lobbying. Annu. Rev. Polit. Sci. 17, 163–185. doi: 10.1146/annurev-polisci-100711-135308
de Figueiredo, J. M., and Silverman, B. S. (2006). Academic earmarks and the returns to lobbying. J. Law Econ. 49, 597–626. doi: 10.1086/508248
de Figueiredo, J. M., and Tiller, E. H. (2001). The structure and conduct of lobbying: an empirical analysis of corporate lobbying at the Federal Communications Commission. J. Econ. Manag. Strateg. 10, 91–122. doi: 10.2139/ssrn.229484
Espinosa, M., Sung, E., and Rath, J. (2023). “New facts about European lobbying,” In: Bocconi University Working Paper.
Federal Election Commission (2003). PAC activity increases in 20002 election cycle : Press Release of the FEC and Accompanying Data. Available at: https://www.fec.gov/updates/pac-activity-increases-for-2002-elections/
Fiorina, M. P. (1981). Retrospective voting in American National Elections. New Haven: Yale University Press.
Fiorina, M. P. (1994). Divided government in the American states: a Byproduct of legislative professionalism? Am. Polit. Sci. Rev. 88, 304–316. doi: 10.2307/2944705
Gray, V., Lowery, D., McNoldy, T., Newmark, A., and Wolak, J. (2004). Much of politics is still local: multi-state lobbying in state interest communities. Legis. Stud. Q. 27, 527–556. doi: 10.3162/036298002X200710
Grotteria, M., Miller, M., and Lakshmi Naaraayanan, S. (2022). Foreign influence in US politics. In: Wharton School of Business Working Paper.
Holburn, A., and Bergh, V. (2004). Influencing agencies through pivotal political institutions: evidence from the U.S. accounting industry. J. Law Econ. Org. 20, 458–483. doi: 10.1093/jleo/ewh042
Hrebenar, R. (1992). Interest group politics in southern states. Tuscaloosa, Alabama: University of Alabama Press.
Hrebenar, R., and Thomas, C. (1993a). Interest group politics in the Midwestern states. Ames, Iowa: Iowa State Press.
Hrebenar, R. J., and Thomas, C. S. (1993b). Interest group politics in the Northeastern states. University Park, PA: Penn State Press.
Hunter, K. G., Wilson, L. A., and Brunk, G. G. (1991). Societal complexity and interest-group lobbying in the American states. J. Theor. Polit. 53, 488–503. doi: 10.2307/2131769
Institute on Money in State Politics (2004). Available at: http://www.followthemoney.org/
Jensen, J. M., and Beyle, T. (2003). Of footnotes, missing data, and lessons for 50-state data collection: the gubernatorial campaign finance project, 1977-2001. State Polit Policy Q 3, 203–214. doi: 10.1177/153244000300300204
Key, V. O. (1964). The responsible electorate: Rationality in presidential voting 1936–1960. Cambridge, MA: Harvard University Press.
Kim, I. S. (2017). Political cleavages within industry: firm-level lobbying for trade liberalization. Am. Polit. Sci. Rev. 111, 1–20. doi: 10.1017/S0003055416000654
Kollman, K. (1997). Inviting friends to lobby: interest groups, ideological bias, and congressional committees. Am. J. Polit. Sci. 41, 519–544. doi: 10.2307/2111775
Kroszner, R., and Stratmann, T. (1998). Interest group competition and the Organization of Congress: theory and evidence from financial services’ political action committees. Am. Econ. Rev. 88, 1163–1187.
Krutz, G. S. (2001). Tactical Maneuvering on omnibus bills in congress. Am. J. Polit. Sci. 45, 210–223. doi: 10.2307/2669368
La Pira, T. M., Thomas, H. F., and Baumgartner, F. R. (2012). The two worlds of lobbying: The Core-periphery structure of the interest group system. Working Paper. Available at http://ssrn.com/abstract=2245065
Leech, B. L., Baumgartner, F. R., La Pira, T., and Semanko, N. A. (2005). Drawing lobbyists to Washington: government activity and interest-group mobilization. Polit. Res. Q. 58, 19–30. doi: 10.1177/106591290505800102
Levitt, S. D., and Snyder, J. M. (1997). The impact of Federal Spending on house election outcomes. J. Polit. Econ. 105, 30–53. doi: 10.1086/262064
Lowery, D., and Gray, V. (1996). The population ecology of interest representation. Ann Arbor: University of Michigan Press.
Lowery, D., and Gray, V. (1997). How some rules just Don’t matter: the regulation of lobbyists. Public Choice 91, 139–147. doi: 10.1023/A:1017909514423
Nownes, A. J., and Freeman, P. (1998). Interest group activity in the states. J. Theor. Polit. 60, 86–112. doi: 10.2307/2648002
Nownes, A. J., and Newmark, A. (2012). “Interest groups in the states” in Politics in the American states. eds. V. Gray and R. L. Hanson. 10th ed (Washington, DC: CQ Press).
Nownes, A. J., Thomas, C. S., and Hrebenar, R. J. (2008). “Interest groups in the states” in Politics in the American states. eds. V. Gray and R. L. Hanson. Ninth ed (Washington, DC: CQ Press), 98–126.
OECD (2013). Forum on transparency and integrity in lobbying, agenda and presentation. Available at: http://www.oecd.org/gov/ethics/lobbying-forum.htm
Price, D. E. (1978). Policy making in congressional committees: the impact of ‘environmental’ factors. Am. Polit. Sci. Rev. 72, 548–574. doi: 10.2307/1954110
Primo, D. (2003). "Stop us before we spend again: Institutional constraints on U.S. state spending." In: University of Rochester, Department of Political Science Working Paper.
Primo, D., and Milyo, J. (2004). “Campaign finance and political efficacy: Evidence from the states,” In: University of Chicago, Harris School Working Paper.
Quinn, D. P., and Shapiro, R. Y. (1990). Business political power: the Case of taxation. Am. Polit. Sci. Rev. 85, 851–874. doi: 10.2307/1963853
Richter, B. K., Samphantharak, K., and Timmons, J. F. (2009). Lobbying and taxes. Am. J. Polit. Sci. 53, 893–909. doi: 10.1111/j.1540-5907.2009.00407.x
Scholzman, K. L., and Tierney, J. T. (1986). Organized interests and American democracy. New York: Harper and Row.
Smith, R. A. (1984). Advocacy, interpretation, and influence in the U.S. congress. Am. Polit. Sci. Rev. 78, 44–63. doi: 10.2307/1961248
Smith, R. A. (1995). Interest group influence in the U.S. congress. Legis. Stud. Q. 20, 89–139. doi: 10.2307/440151
Snyder, J. M. (1992). Long-term investing in politicians; or, give early, give often. J Law Econ 35, 15–43. doi: 10.1086/467243
Stratmann, T. (1998). The market for congressional votes: is timing of contributions everything? J Law Econ 41, 85–113. doi: 10.1086/467385
Thieme, S. (2020). Moderation or strategy? Political giving by corporations and trade groups. J. Theor. Polit. 82:1171. doi: 10.1086/707619
Walker, J. L. (1991). Mobilizing interest groups in America: Patrons, professions, and social movements. Ann Arbor: University of Michigan Press.
Weingast, B., and Moran, M. (1983). Bureaucratic discretion or congressional control? Regulatory policymaking by the Federal Trade Commission. J. Polit. Econ. 91, 765–800. doi: 10.1086/261181
Wiggins, C. W., Hamm, K., and Bell, C. G. (1992). Interest group and party influence agents in the legislative process: a comparative state analysis. J. Theor. Polit. 54, 82–100. doi: 10.2307/2131644
Wright, J. (1990). Contributions, lobbying, and committee voting in the U.S. house of representatives. Am. Polit. Sci. Rev. 84, 417–438. doi: 10.2307/1963527
You, H. Y. (2020). Foreign agents registration act: a User’s guide. Interes. Groups Advocacy 9, 302–316. doi: 10.1057/s41309-020-00100-1
Keywords: lobbying, interest groups, budgets, policy windows, state legislatures
Citation: de Figueiredo JM (2024) Budgets and the timing, intensity, and composition of interest group lobbying in the U.S. states. Front. Polit. Sci. 6:1288798. doi: 10.3389/fpos.2024.1288798
Edited by:
Anthony Nownes, The University of Tennessee, Knoxville, United StatesCopyright © 2024 de Figueiredo. This is an open-access article distributed under the terms of the Creative Commons Attribution License (CC BY). The use, distribution or reproduction in other forums is permitted, provided the original author(s) and the copyright owner(s) are credited and that the original publication in this journal is cited, in accordance with accepted academic practice. No use, distribution or reproduction is permitted which does not comply with these terms.
*Correspondence: John M. de Figueiredo, amRlZmlnQGR1a2UuZWR1