 Dan Wang
 Ying Ma2
95% of researchers rate our articles as excellent or good
Learn more about the work of our research integrity team to safeguard the quality of each article we publish.
Find out more
ORIGINAL RESEARCH article
Front. Plant Sci. , 06 February 2025
Sec. Plant Genetics, Epigenetics and Chromosome Biology
Volume 16 - 2025 | https://doi.org/10.3389/fpls.2025.1533824
Rhododendron dauricum L. is one of the most important ornamental plants in Northeast China for its beautiful flowers. Wild R. dauricum populations are mainly distributed in Greater and Lesser Khingan Mountains in Heilongjiang, China. The diversity of R. dauricum germplasm resources in these areas has not been determined and it can be dynamic due to increasing climate change and human activities, which poses a challenge to effective conservation efforts. To promote genetic diversity conservation and develop new R. dauricum varieties, we performed a systematic morphological and molecular evaluation of R. dauricum populations in the in 13 populations. The results showed significant inter- and intra-population variations. Clustering revealed 3 major groups. Importantly, plants showing extreme variations in flower color and flower number were used to further develop two new cultivars 'Ao Xue' and 'Yanricai', respectively. In addition, nine SSR markers exhibited polymorphism among the 13 populations, and 25 alleles were found. The Shannon information index (I) was 0.6359, and the polymorphism information index (PIC) was 0.3460. The genetic diversity index (Nei's) was 0.3575, and the observable heterozygosity (Ho, 0.2514) was lower than the expected heterozygosity (He, 0.3722). The average genetic differentiation coefficient (Fst) among populations was 0.6556. Several populations with relatively high genetic diversity including Huzhong, Tahe, and Hongxing were identified. We also found that SSR-based clustering generally follows the geographical distances among the populations. Lastly, we identified two SSR markers that were highly correlated with flower color and leaf aspect ratio. Together, our data provided useful information on the germplasm distribution and variation evolution of R. dauricum, which will be valuable for cultivar improvement, protection, and future diversity conservation efforts.
Rhododendron dauricum L. is a cold-resistant deciduous semi-evergreen shrub in Northeast China (Ye et al., 2020). R. dauricum blooms in early spring and the captivating flower color endows it with high ornamental values. Breeding efforts have made R. dauricum popular in landscaping and the cut-flower industry, especially in Heilongjiang, China. R. dauricum also showed high medicinal values, making it an important economic plant. Ecologically, R. dauricum is the dominant species in the understory shrub layer in the cold temperate coniferous/mixed coniferous forests and thus plays an important role in maintaining ecosystem stability. For example, the dense foliage of R. dauricum provides shelter and nesting sites for a diverse array of wildlife. The showy flowers attract pollinators such as bees and insects and thus promote the reproduction of many plant species. The extensive root system can influence the soil conditions by releasing organic compounds and interacting with soil microorganisms (Bai et al., 2011). Given its striking flowers, medicinal uses, and multifaceted ecological roles, there is a growing research interest in R. dauricum.
One factor contributing to the aesthetic appeal of R. dauricum is the extensive variations in plant morphology. The leaves of R. dauricum exhibit a range of shapes and sizes. More importantly, floral diversity can be reflected in many aspects including the petal arrangement, flower size, and coloration, which ranges from pink, purple, to white (Wang et al., 2022). Meanwhile, R. dauricum can thrive in many distinct natural habitats including the understory of forests, meadows, and mountainous regions across northeast Aisa. For example, R. dauricum grows in a wide latitude and altitude ranges (e.g., 200- 1000 m above sea level). R. dauricum can also grow in forests and woodlands along with other trees such as Larix gmelinii, Betula dahurica, Quercus mongolica, Rosa davurica, and Sambucus williamsii. The ability of R. dauricum to colonize diverse habitats underscores its ecological resilience and strong adaptability to different climatic conditions and soil types. It thus raises an interesting question on the putative associations between morphological diversity and the various ecological factors.
There were a few studies examining the genetic diversity of plants in the genus Rhododendron. For example, Zhao used AFLP to study seven wild populations of R. concinnum in the Qinling area and found that intra-population variation was the major source of genetic diversity (Zhao et al., 2012). Xiao et al. used both SRAP and ISSR markers to analyze the genetic diversity of different species within the genus Rhododendron (Xiao et al., 2015, 2016). The results showed extensive genetic diversity at the species level. Similarly, the genetic diversity of five natural populations of R. fortunei in Zhejiang Province, China was assessed using ISSR markers, revealing a greater inter-population variation than intra-population variation (Jin et al., 2006). Additionally, the genetic diversity of several other species in the same genus including R. latoucheae, R. hybridum, R. shanii, R. schlippenbachii, R. sinofalconeri, and R. aureum has been reported (Zhao et al., 2010; Ji et al., 2010; Peng et al., 2010; Wu et al., 2013; Zhang et al., 2012, 2021; Zong et al., 2014). Overall, these studies supported the notion that plants in the genus Rhododendron are rich in genetic diversity. However, very few studies has assessed the diversity using morphological traits and molecular markers.
The Greater and Lesser Khingan Mountains are the northern boundary of R. dauricum in China, in which R. dauricum plays an extremely important role in maintaining the stability of the region's fragile ecosystem. With shrinking natural habitats and human destruction, R. dauricum is under great threat and the germplasm diversity is unknown. This calls for an urgent need to study the population diversity of R. dauricum for practical conservation efforts. Thus, this study aimed to conduct a comprehensive survey of the diversity of R. dauricum in the Greater and Lesser Khingan Mountains. We measured various phenotypical traits in 13 representative populations and collected samples for SSR analysis. With detailed variance analysis, we found traits showing the greatest dispersion and populations exhibiting the highest level of variations.
Data on the distribution of R. dauricum in seven forestry bureaus in the Greater Khingan Mountains was retrieved (Supplementary Table S1). Plants from the following 13 locations were selected for phenotyping and molecular analysis (Supplementary Figure S1, Supplementary Table S2): Daling (DL), Hongwei (HW), Jiagedaqi (JGDQ), Tahe (TH), Huzhong (HZ), Taoshan (TS), Jinshantun (JST), Hongxing (HX), Meixi (MX), Youhao (YH), Mordauga (MEDG), Haolibao (HLB), and Delbuer (DEBE). They covered the Greater Khingan (DL, HW, JGDJ, TH, and HZ), the Lesser Khingan (TS, JST, HX, MX, and YH), and Inner Mongolia regions (MEDG, HLB, and DEBE) that were representative of the natural habitats of R. dauricum. For each population, 30 sampling blocks (5 m x 5 m for each) with an inter-block space of 30 m were set. Data were collected on individual plants of 10-12 years. Sampling was performed on May, 2022.
A digital caliper or metric tape was used to measure plant height, ground diameter, and various leaf/flower parameters. Three randomly selected branches were used to measure the ground diameter. Leaves from the current-year branches were measured according to the DUS guidelines developed for R. dauricum. Three flowers from each plant were selected to measure the flower diameter. Color determination was performed according to the standards of the Royal Horticultural Society. Specifically, scores 1-3 were assigned to plants with the following flower groups (Figure 1): the red-purple (level I), purple (level II), and purple-violet (level III) groups, respectively. In addition, a score of 4 was assigned to white variants (level IV).
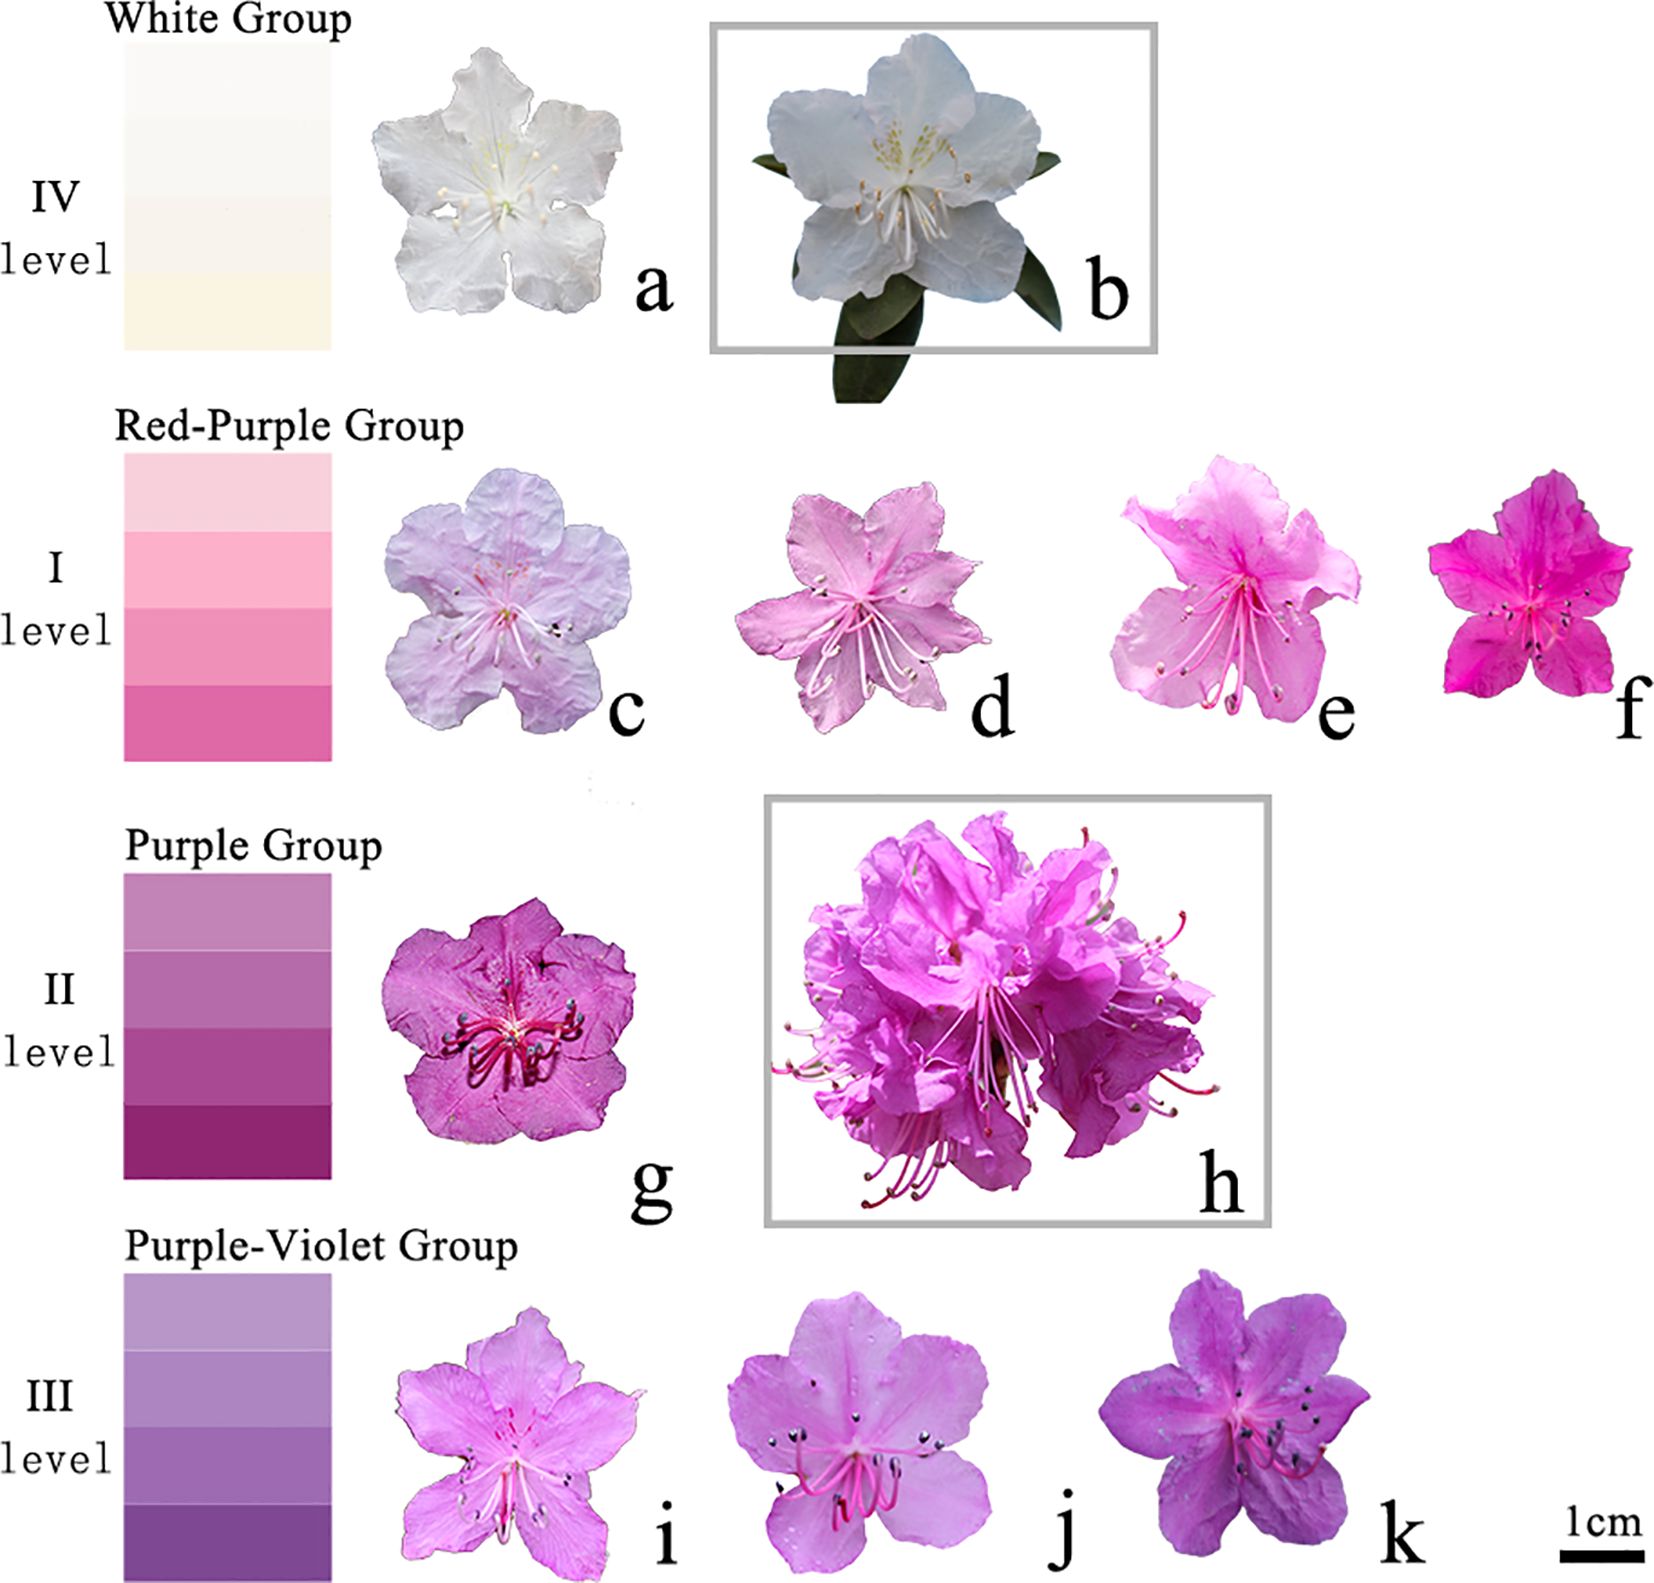
Figure 1. Polymorphism of flower color. IV level (A, B). White group; I level (C-F). Red purple group; II level (G, H). Purple group; III level (I-K). Purple blue group; (B) A new cultivar 'Ao xue'; (H) A new cultivar 'Yanricai'.
We used nine traits for our survey: flower color, flower amount, flower diameter, plant height, ground diameter, branch number, leaf length, leaf width, and leaf aspect ratio. Flower traits were selected because they are the key features determining the ornamental value of R. dauricum. Other traits were selected due to their importance to the overall plant shape and the commercial potential of R. dauricum.
Dormant branches were sampled in February, 2022 and then stored at room temperature to break dormancy. Flower buds were removed, and the branches were hydro-cultured. Newly emerged leaves (3 to 4 cm long) were used for DNA extraction. Thirty samples were collected for each of the 13 populations. DNA extraction was conducted using the CTAB method (Xiao et al., 2007) with 0.5 g of leaves per sample.
A total of 68 SSR markers were obtained from species closely related to R. dauricum (Yang et al., 2018; Zhang et al., 2016; Zhou et al., 2019). These primers were first tested in two plants randomly selected from the 13 populations. Out of these 68 primers (the primer information is shown in Supplementary Table S3), 13 showed bright and repeatable bands with polymorphism and were used for further analysis of the 390 samples (30 samples per population; 13 populations). Information on the available primer sequence, length, repeat motifs, and annealing temperature were summarized in Supplementary Table S4. For PCR amplification, reactions were performed in 20 μL consisting of 5X PCR buffer, forward primer, reverse primer, DNA template, PCR Enhancer, probe, and H2O. The reactions were carried out with the following steps: pre-denaturation at 95°C for 15 min, followed by 35 cycles of amplification (95°C: 30 s, 56°C: 30 s, and 72°C: 30 s); and final extension at 72°C for 3 min. After amplification, electrophoresis detection was performed using the ABI3130xl gene sequencer.
Morphological data was processed with Excel, Spass, and NTSYS (Rohlf, 2000). The degree of dispersion was measured using the coefficient of variation (CV). A two-factor nested design variance analysis was performed to determine the inter- and intra-population variations (Li et al., 2002). The unweighted paired arithmetic mean (UPGMA) method was used for clustering analysis based on the phenotypical data. The neighbor-joining (NJ) method with pair-wise Euclidean distance was used to construct a dendrogram. Associations between phenotypical data and ecological factors including longitude, latitude, altitude, temperature, and precipitation were determined by calculating the Pearson's Correlation coefficient.
The data matrix of the SSR experiment was used to calculate various parameters to infer genetic diversity using Popgene32 and Powermarkersoftware (Liu and Muse, 2005; Yeh et al., 1999). These parameters included number of alleles (Na), number of effective alleles (Ne), expected heterozygosity (He), observed heterozygosity (Ho), Shannon's information index (I), percentage of polymorphic sites (PPL), Nei's gene diversity index (H) (Masatoshi, 1973), gene flow (Nm), gene frequency, site polymorphism information content (PIC) value, genetic differentiation index (Fst). The Chi-square test was used to determine statistical significance. TASSEL was used to determine the correlation between genotype data and phenotypic traits.
We first surveyed the distribution of R. dauricum in seven forestry bureaus in the Greater Khingan Mountains (Supplementary Table S1). A total area of 860,994 hectares of R. dauricum was recorded across the seven forestry bureaus. Wild populations of R. dauricum are distributed within 122°18'28''E to125°18'37''E and 50°12'21''N to 53°24'17''N, which spans the middle temperate zone and cold temperate zone. R. dauricum can grow in multiple habitats including mining sites, volcanic rocks, sunny slopes, forests (Betula platyphylla and Larix gmelinii), and riverbanks (Figure 2). The altitude range is 200 m to 1300 m, although 400 m to 800 m is the preferred altitude. R. dauricum thrives in full sun but can tolerate shade. It was usually found in patches with very few individual plants scattered.
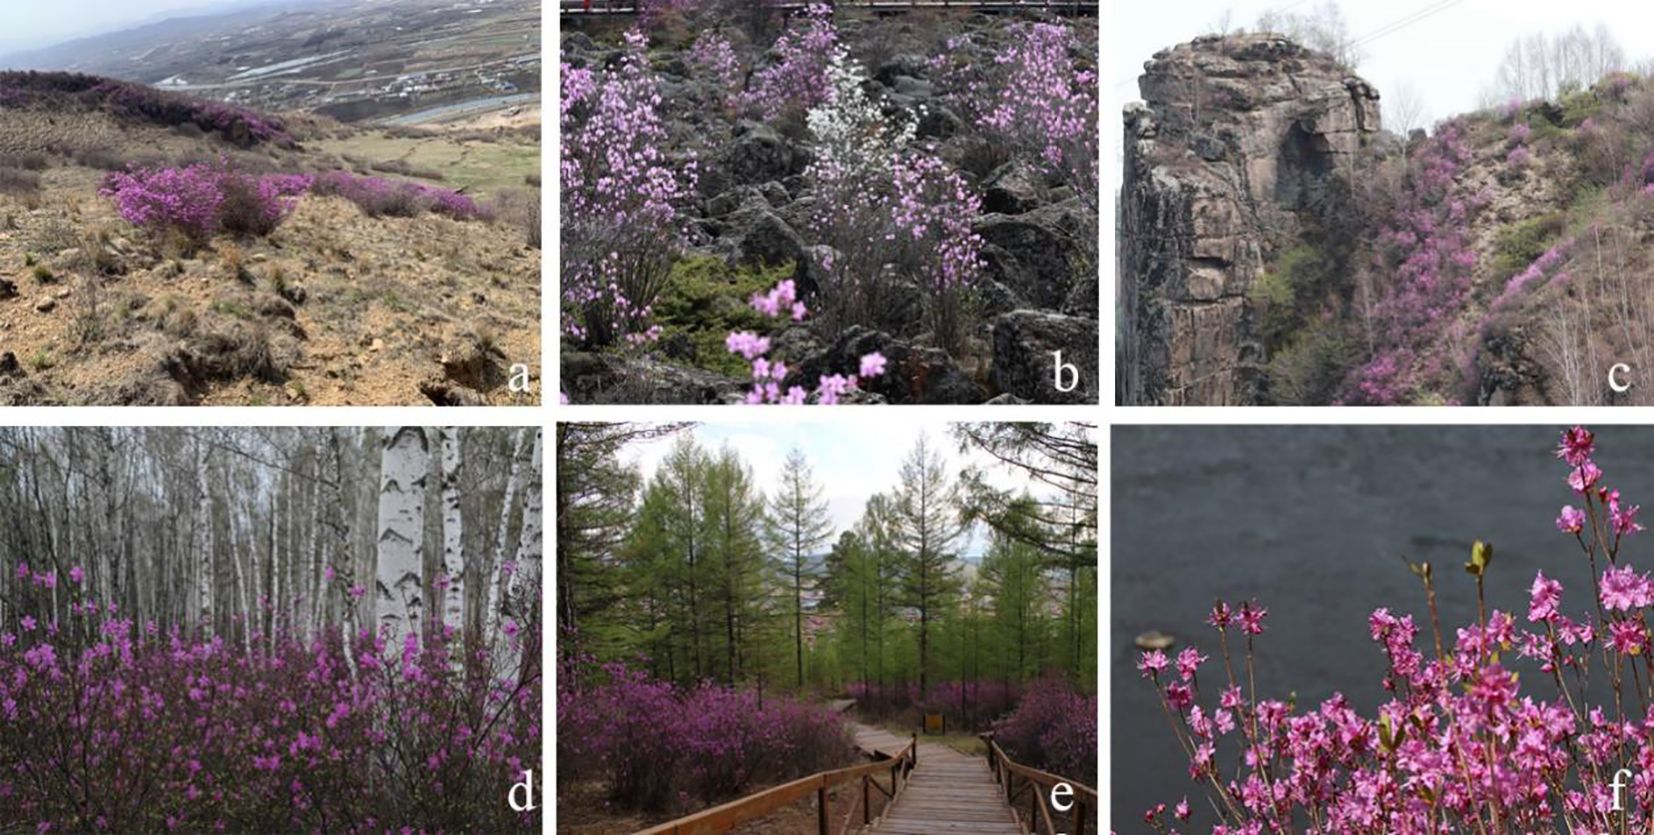
Figure 2. Several representative habitat types of R. dauricum. (A) Mining site; (B) Volcanic rock; (C) Sunny slopes; (D) Under the Betula platyphylla forest; (E) Under the Larix gmelinii forest; (F) River bank.
A great degree of variation in flowers was observed in the natural populations of R. dauricum. First, the corolla was usually shallowly lobed, but deeply or completely lobed corolla was also observed. Five-lobed corollas were the most common ones, while six- or seven-lobed were rare. The flower diameter was 2.5 to 3.5 cm with some reaching up to 4 cm. The number of flowers on a single branch ranged from 1-4. Based on the geographic locations, R. dauricum can bloom between late April and early May (Early), from May 1 to May 10 (Middle), and after middle May (Late). In addition, a secondary bloom may occur after the end of September (Secondary).
The flower color varied from white, light purple, pink-purple, purple-red, and purple (Figure 1). Interestingly, we found a white variety, which was distinct from R. dauricum in terms of corolla color, anther color, filament color, branch color, spot color, and leaf color. This variety had been named R. dauricum var. Album (Wilson, 1923). In addition, we found yellow-green spots on some of the white-flowered R. dauricum, which had been used to develop 'Ao Xue' via tissue culture and propagation (Wang et al., 2022). Another variety we found showed spherical inflorescences with 8-14 flowers on the same branch, which were significantly more than that in a typical R. dauricum. These plants were used to develop a new variety 'Yanricai' (Wang et al., 2023), which had been registered to the Royal Horticultural Society. The numerous flowers make it a variety of high ornamental value.
To determine the phenotypic trait diversity of the 13 populations, we measured nine traits and summarized their mean values (Table 1) and coefficient of variations (CVs, Table 2). Based on the inter-population variation, the nine traits were ranked in the order of flower color > flower number > ground diameter > leaf width > branch number > leaf length > leaf aspect ratio > flower diameter > plant height. Of particular interest to us were flower color and number, which showed CVs of 0.2651 and 0.1974, respectively, indicating a large degree of heterogeneity among the populations. It is noteworthy that variations existed for traits showing a small degree of CVs. For instance, the plant height ranged from 158.64 cm (HZ) to 185 cm (MEDG) despite a low inter-population CV (0.0688). We also found that the overall inter-population CV was population-dependent, with HZ and HX showing the largest degree of variations (CVs of 0.1838 and 0.1799 respectively).
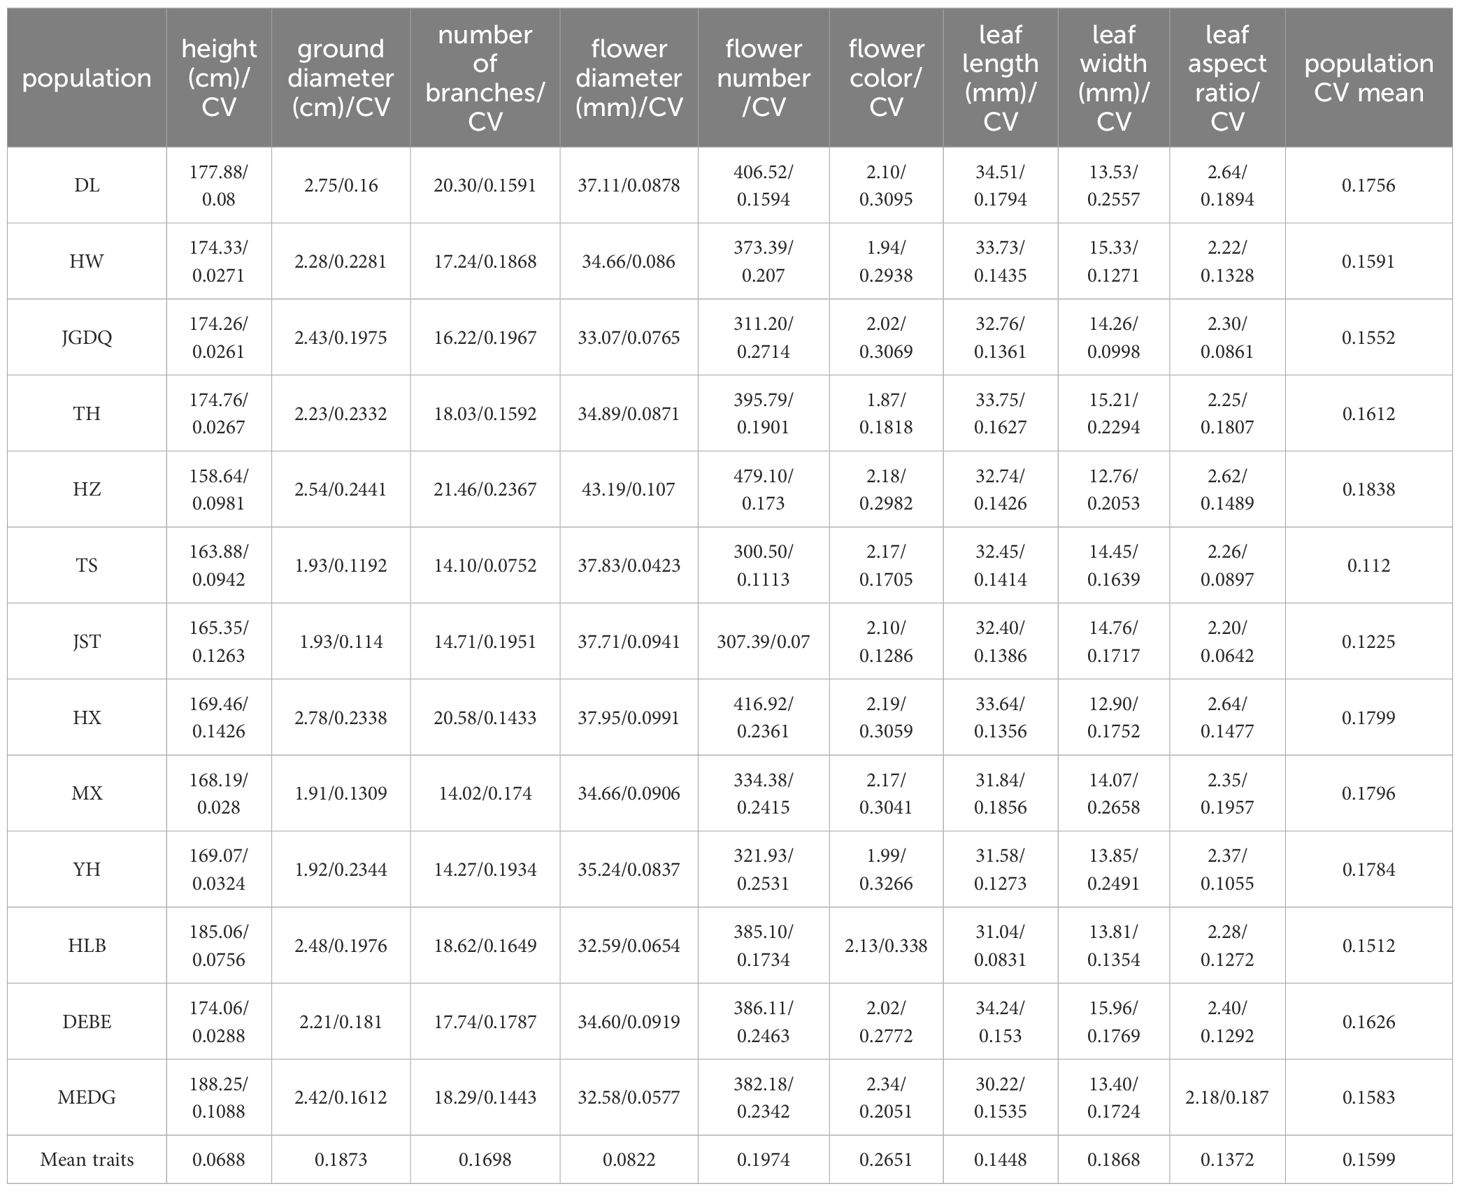
Table 1. The mean of phenotypical traits and Coefficients of variation (CV) of 13 R. dauricum populations.
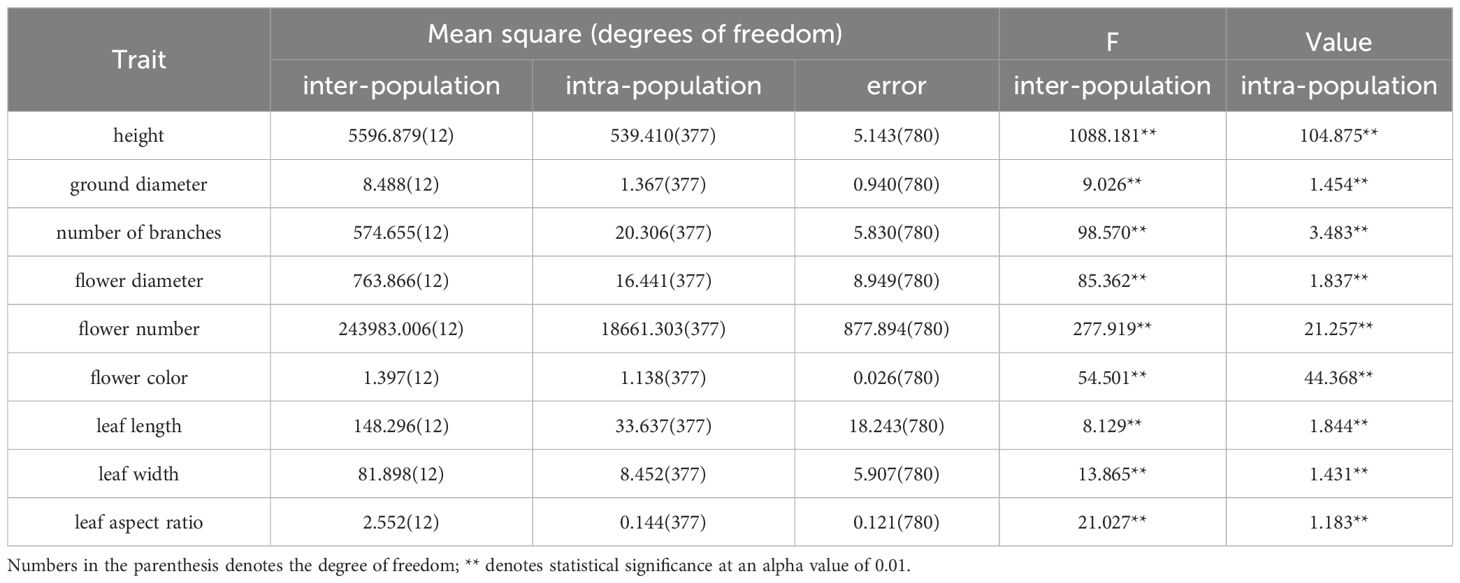
Table 2. Nested ANOVA of phenotypic characteristics between and within populations of R. dauricum.
To further determine the inter- and intra-population variations, we performed the nested design variance analysis and found that all the nine traits showed significant variations at both the inter- and intra-population levels (α = 0.01; Table 2). At the inter-population level, the F statistics ranked the nine traits in the order of plant height > flower number > branch number > leaf length > leaf width > flower diameter > flower color > ground diameter > leaf aspect ratio. At the intra-population level, the order of F values from large to small was plant height > flower color > flower number > number of branches > leaf length > flower diameter > ground diameter > leaf width > leaf aspect ratio.
Correlations between the nine traits and various ecological factors of the sampling site were summarized in Table 3. First, several traits including plant height, ground diameter, branch number, and flower number were negatively correlated to longitude, while flower diameter showed a positive correlation with longitude. Second, plant height, ground diameter, branch number, flower number, and leaf length showed significant positive correlations with the latitude, confirming that R. dauricum prefers habits of high latitudes. Third, plant height, branch number, and flower number were extremely significantly positively correlated with the altitude, whilst leaf length and flower diameter decreased as the altitude increased. Fourth, the annual average temperature showed a positive impact on several traits (flower diameter and leaf length) and a negative one on others (plant height, ground diameter, branch number, flower color, and flower number). Lastly, the annual precipitation showed a positive correlation with flower diameter and negative correlations with plant height, ground diameter, and branch number.
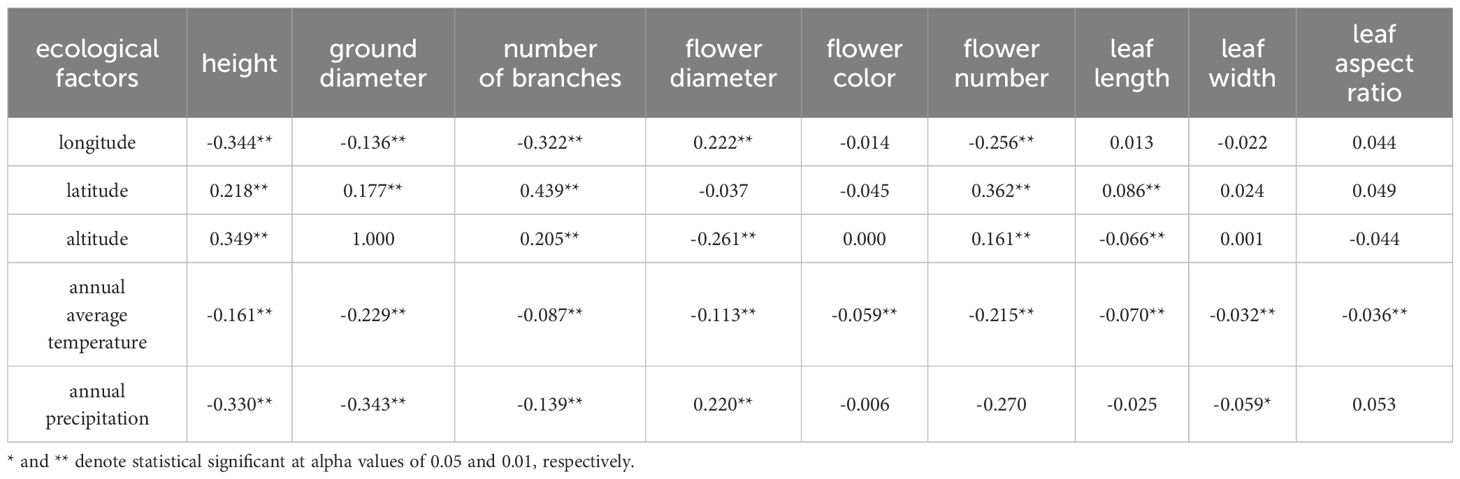
Table 3. Correlation analysis between phenotypic characteristics and ecological factors of R. dauricum.
The greater the genetic distance, the smaller the genetic consistency, which proves that the farther the genetic relationship between the two; on the contrary, when the genetic distance is smaller, the greater the genetic consistency, the higher the genetic relationship. It can be seen from the Table 4 that the genetic distance between HX and DL was 0.0417, the genetic identity was 0.9592, and the genetic relationship between them was the closest. The genetic distance and genetic identity between JGDQ and MEDG were 0.4463 and 0.64, and the genetic relationship between them was the farthest.
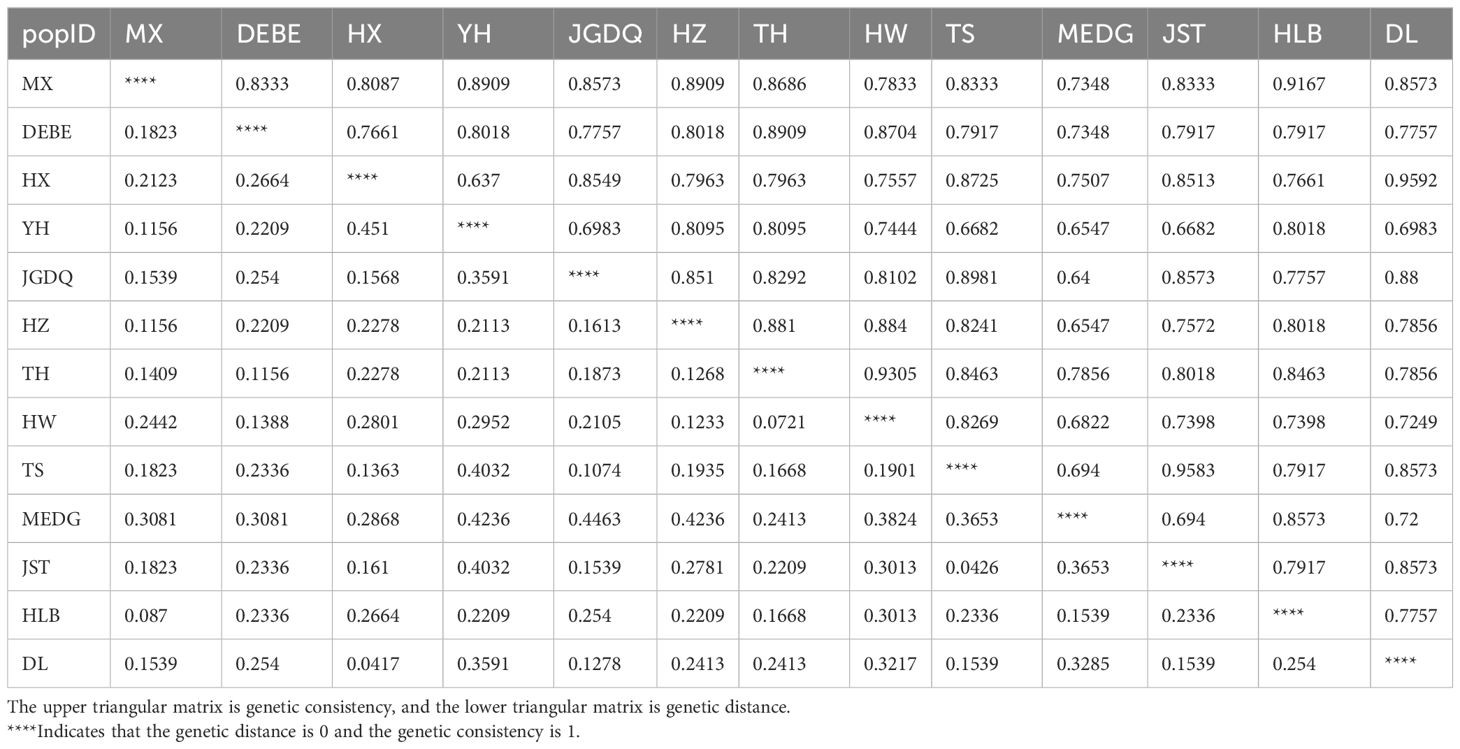
Table 4. Analysis of genetic distance and genetic consistency.
The UPGMA dendrogram constructed by similarity coefficient data obviously showed that three clusters were formed when the similarity coefficient was 1.30 (Figure 3). The resulting dendrogram revealed three major groups. The first group consisted of MEDG, HLB, HZ, DL, and HX. The second group comprised MX, YH, TS, and JST. The third group included JGDQ, DEBE, HW, and TH. The group 1 accessions were mainly R. dauricum collected from the western Greater Khingan Mountains, HX accessions were also assigned into this groups. All four Lesser Khingan Mountains accessions were classed to group 2. The R. dauricum genotypes of group 3 were primarily collected from the east of the Greater Khingan Mountains. While most populations clustered according to geographical distance, there were exceptions. This indicated a discontinuity in the phenotypic trait variation of the 13 populations.
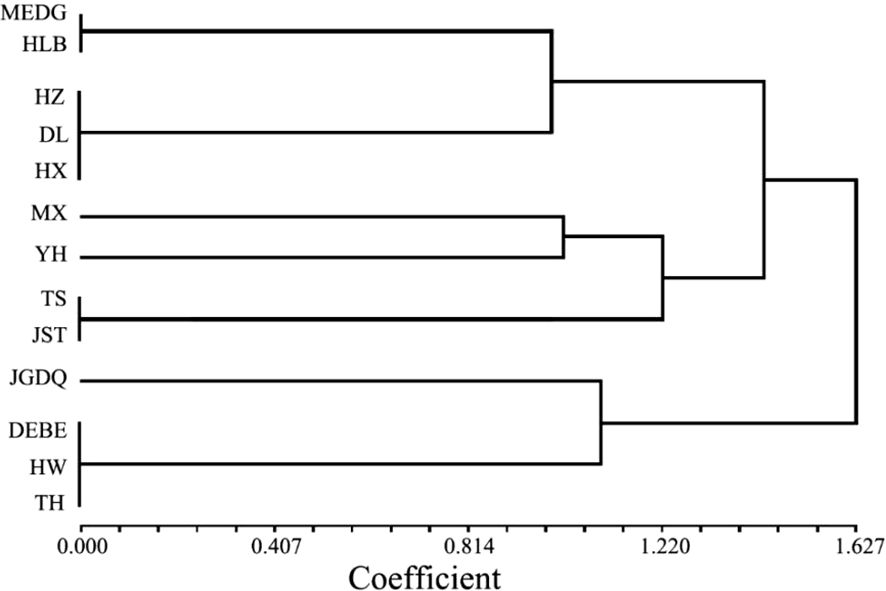
Figure 3. UPGMA cluster based on the phenotypic characteristics of 13 populations in R. dauricum. Sample codes in this image represent the same R. dauricum samples as Supplementary Figure S1.
Cross-species microsatellite markers are powerful for studying the genetic diversity of species whose genome information is unavailable. We randomly selected 68 pairs of published SSR primers from the same genus and found that the majority resulted in positive PCR bands (41 out of 68). This supports the conserveness in the flanking sequences of SSR among closely related species (Guo, 2007; Nie, 2013; Wang et al., 2010a, 2016, 2010b). Based on the band clarity, we selected 13 SSR markers to further evaluate the genetic diversity of 390 individuals from the 13 populations (Table 5). Four markers including Rd-SSR-43, Rd-SSR-60, Rd-SSR-9, and Rd-SSR-65 resulted in a single band, indicating monomorphism of the locus. Nine pairs of SSR primers (Rd-SSR-53, Rd-SSR-34, Rd-SSR-51, Rd-SSR-38, Rd-SSR-59, Rd-SSR-57, Rd-SSR-16, Rd-SSR-66, and Rd-SSR-19) showed multiple bands and thus polymorphism among the 13 populations.
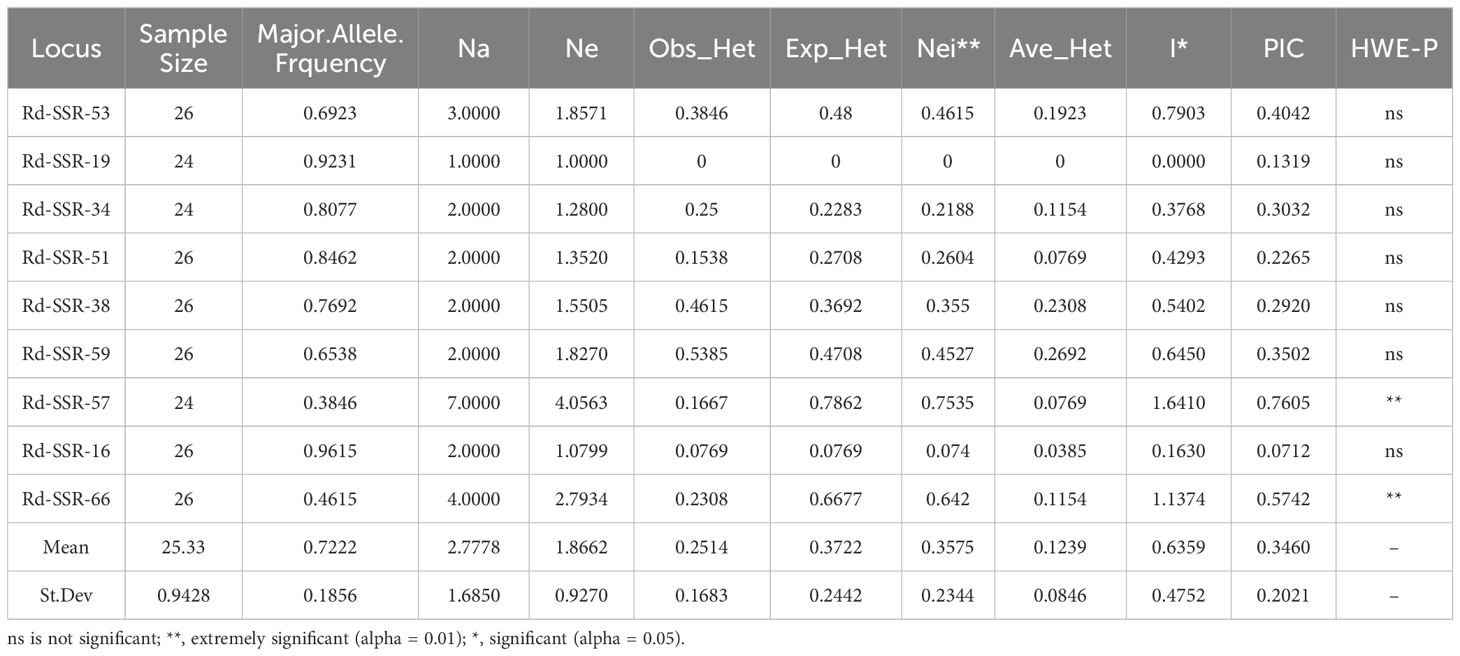
Table 5. Genetic diversity of 9 SSR marker in 13 R. dauricum populations.
The nine pairs of polymorphic primers covered 25 alleles, with 1-7 alleles per marker. The number of effective alleles ranged from 1 to 4.0563 (mean of 1.8662). The Shannon information index I ranged from 0 to 1.6410 (mean of 0.4752). Polymorphism information index (PIC) ranged from 0.0712 to 0.7605, identifying Rd-SSR-57 and Rd-SSR-66 as the preferred markers for genetic diversity studies in R. dauricum. The observable heterozygosity (Ho) ranged from 0 to 0.5385 (mean = 0.2514) and the expected heterozygosity (He) ranged from 0 to 0.7862 (mean = 0.3722), suggesting the presence of inbreeding and genetic variation among the populations. This was further confirmed by the average heterozygosity (Ave_Het), which ranged from 0 to 0.2692. In addition, the genetic diversity index Nei ranged from 0 to 0.7535 (mean = 0.3575) and indicated that the genetic diversity varied greatly among the alleles.
We also determined the genetic diversity among the 13 R. dauricum populations (Table 6). The average number of alleles is about 15 with HZ and TH populations showing 18 alleles. There was a general agreement between the observed heterozygosity and the expected heterozygosity, indicating random breeding of these populations. JGDQ and DL showed the lowest observed heterozygosity, and HZ and TH showed the largest. Accordingly, HZ and TH showed the highest Nei's gene diversity index values (0.1923 for both).
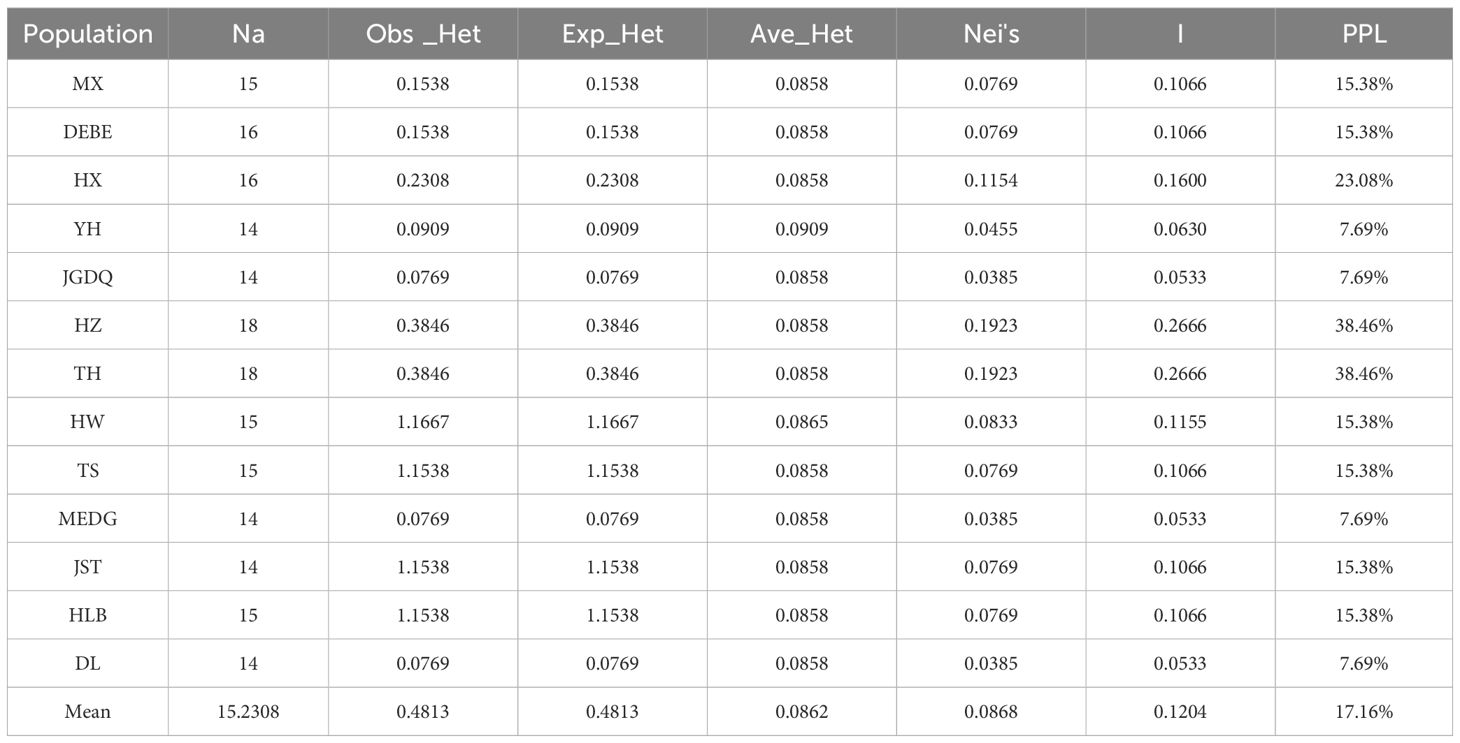
Table 6. Genetic diversity of 13 R. dauricum populations.
Pearson correlation analysis of genetic and geographic distances was performed using Origin. The results are shown in Figure 4A (r=0.1112) and Figure 4B (r=0.0499), which shows that there is a certain correlation between genetic distance and geographic distance between populations, but the correlation is not significant. This indicates that genetic variation has little correlation with geographic distance. This may result in lower gene exchange between populations, leading to genetic differentiation between populations.
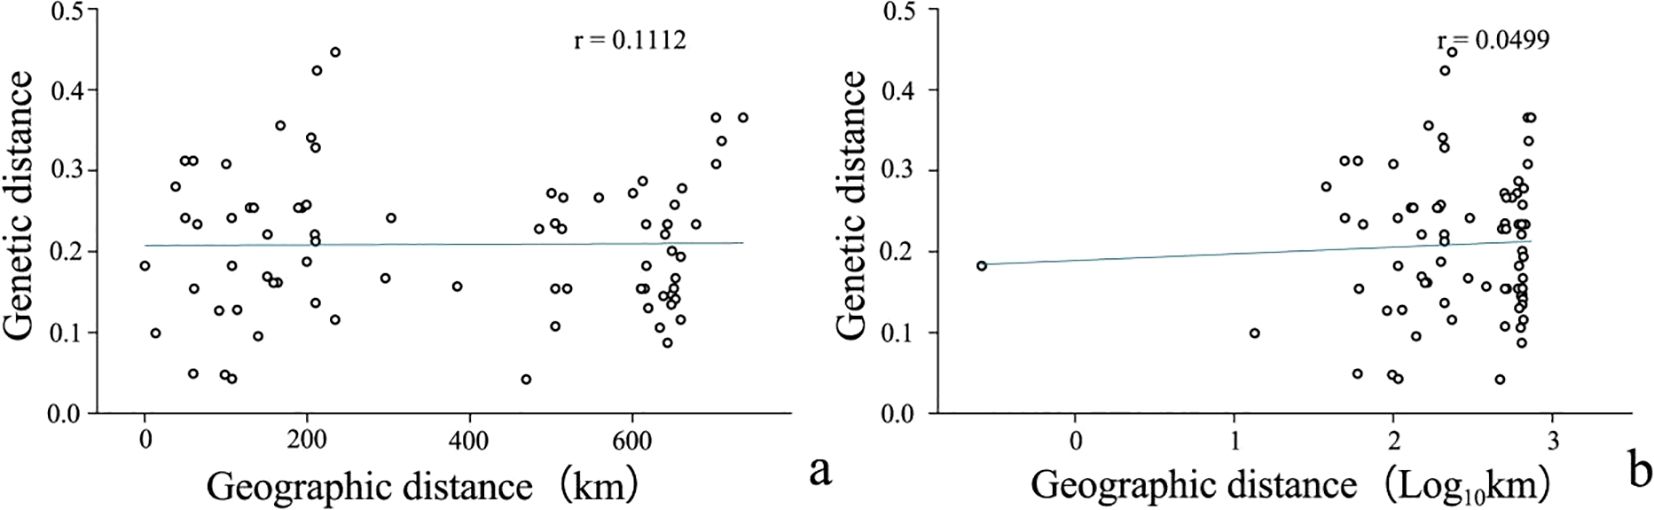
Figure 4. Correlation between genetic distane(log) and geographical distance(log) of R. dauricum populations. (A) Correlation between genetic distance and geographical distance; (B) Correlation between genetic distance log and geographical distance log.
Next, we used Nei's F statistic to analyze the SSR data and found that the Fst values ranged between 0.35 and 1 (Table 7), with an average inter-population Fst of 0.6556. Thus, the within-population variance (34.44%) was lower than the between-population variance (65.56%). Clustering analysis revealed three groups in the phylogenetic tree (Figure 5, Supplementary Table S5) with a clear separation among HLB, MEDG, and the remaining 11 populations. The relatively large genetic distance between HLB/MEDG and other populations can also be reflected in the principal coordinate plot (Figure 6). Overall, we observed an increase in genetic distance among the populations as their geographical distance increased, consistent with the geographical distance model (Jiang et al., 2016). Similar genetic backgrounds were found in relatively close populations, for example, between HW and TH, HLB and MEDG, JST and TS, and MX and YH. However, deviation from this model was also common, such as HZ clustered closely with MX although they were geographically distant. Many factors including human activities and insect pollination may be behind this, which requires further investigation.
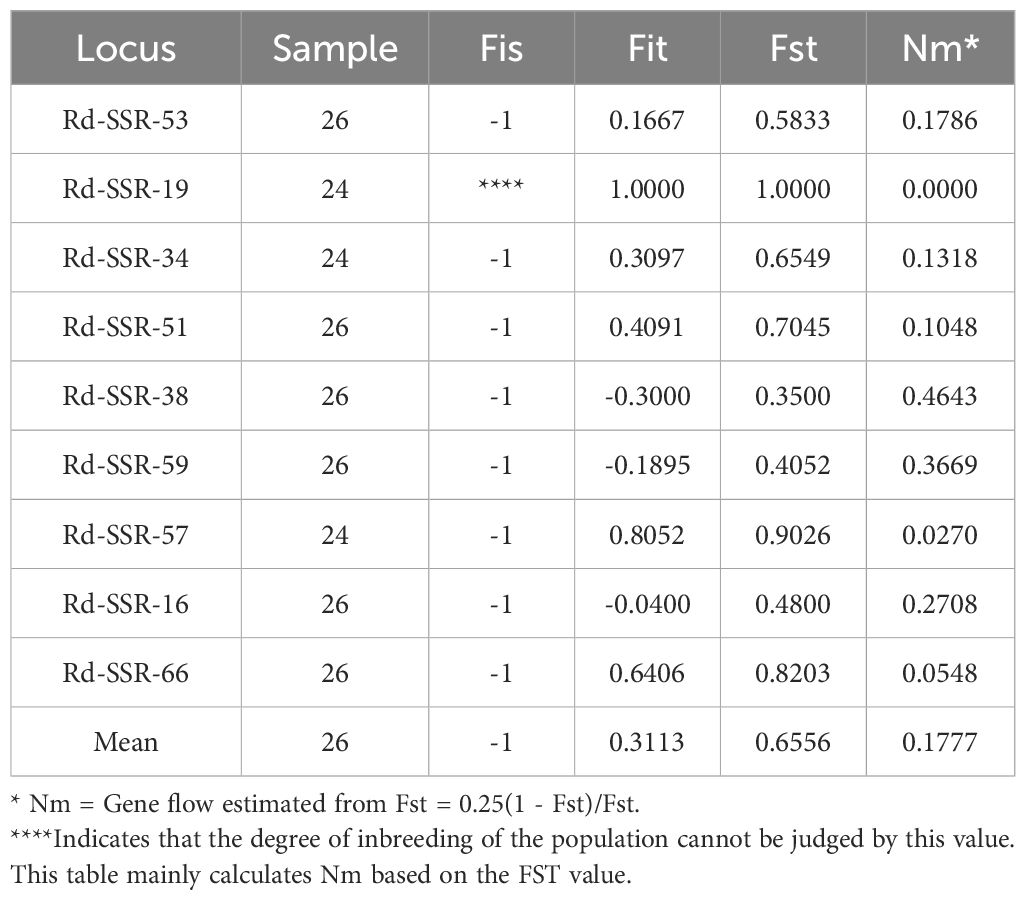
Table 7. F Statistics and gene flow analysis of microsatellite sites.
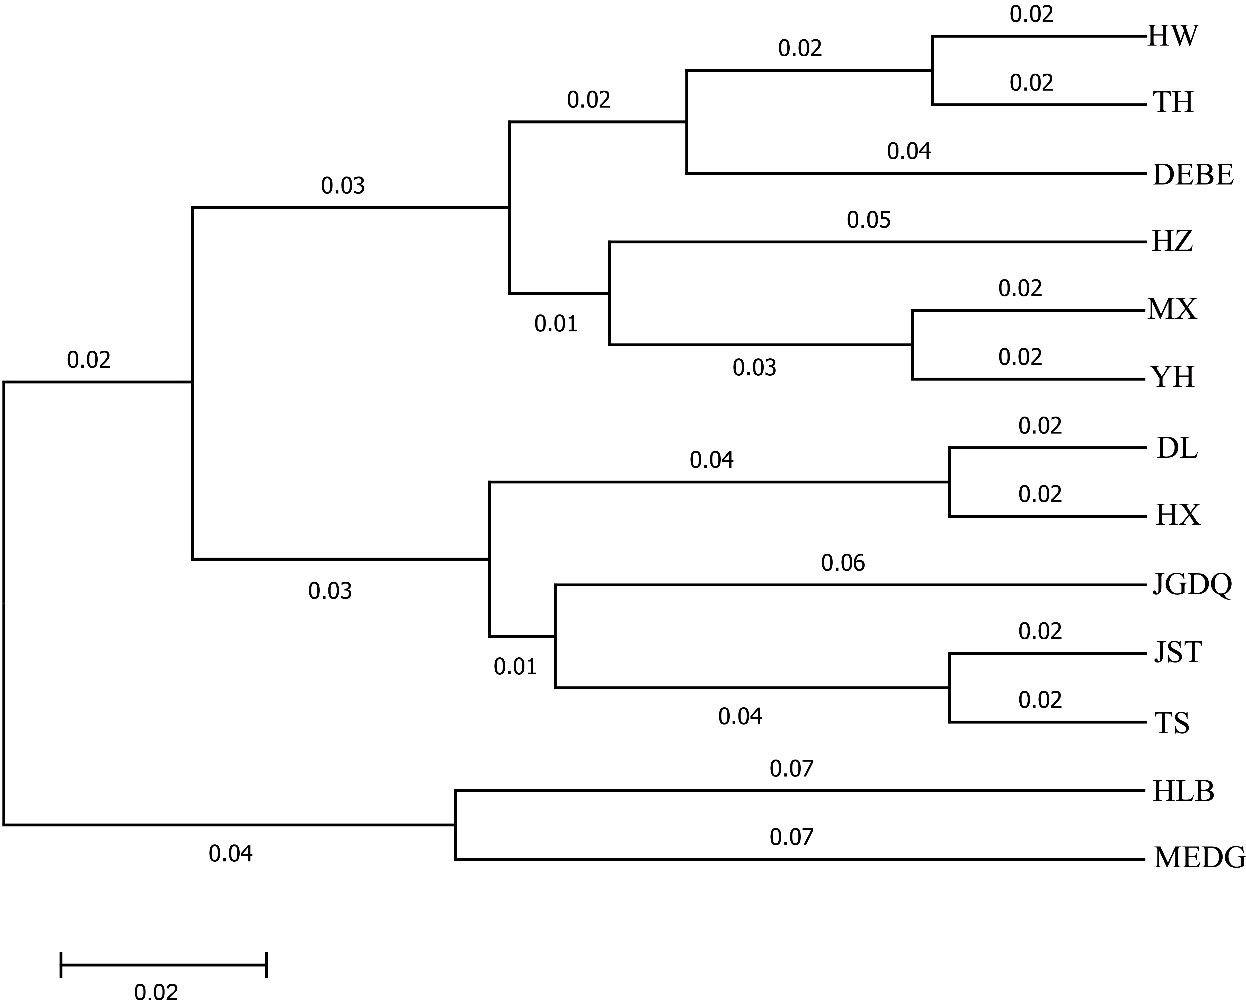
Figure 5. Cluster diagram genetic distance among R. dauricum populations.
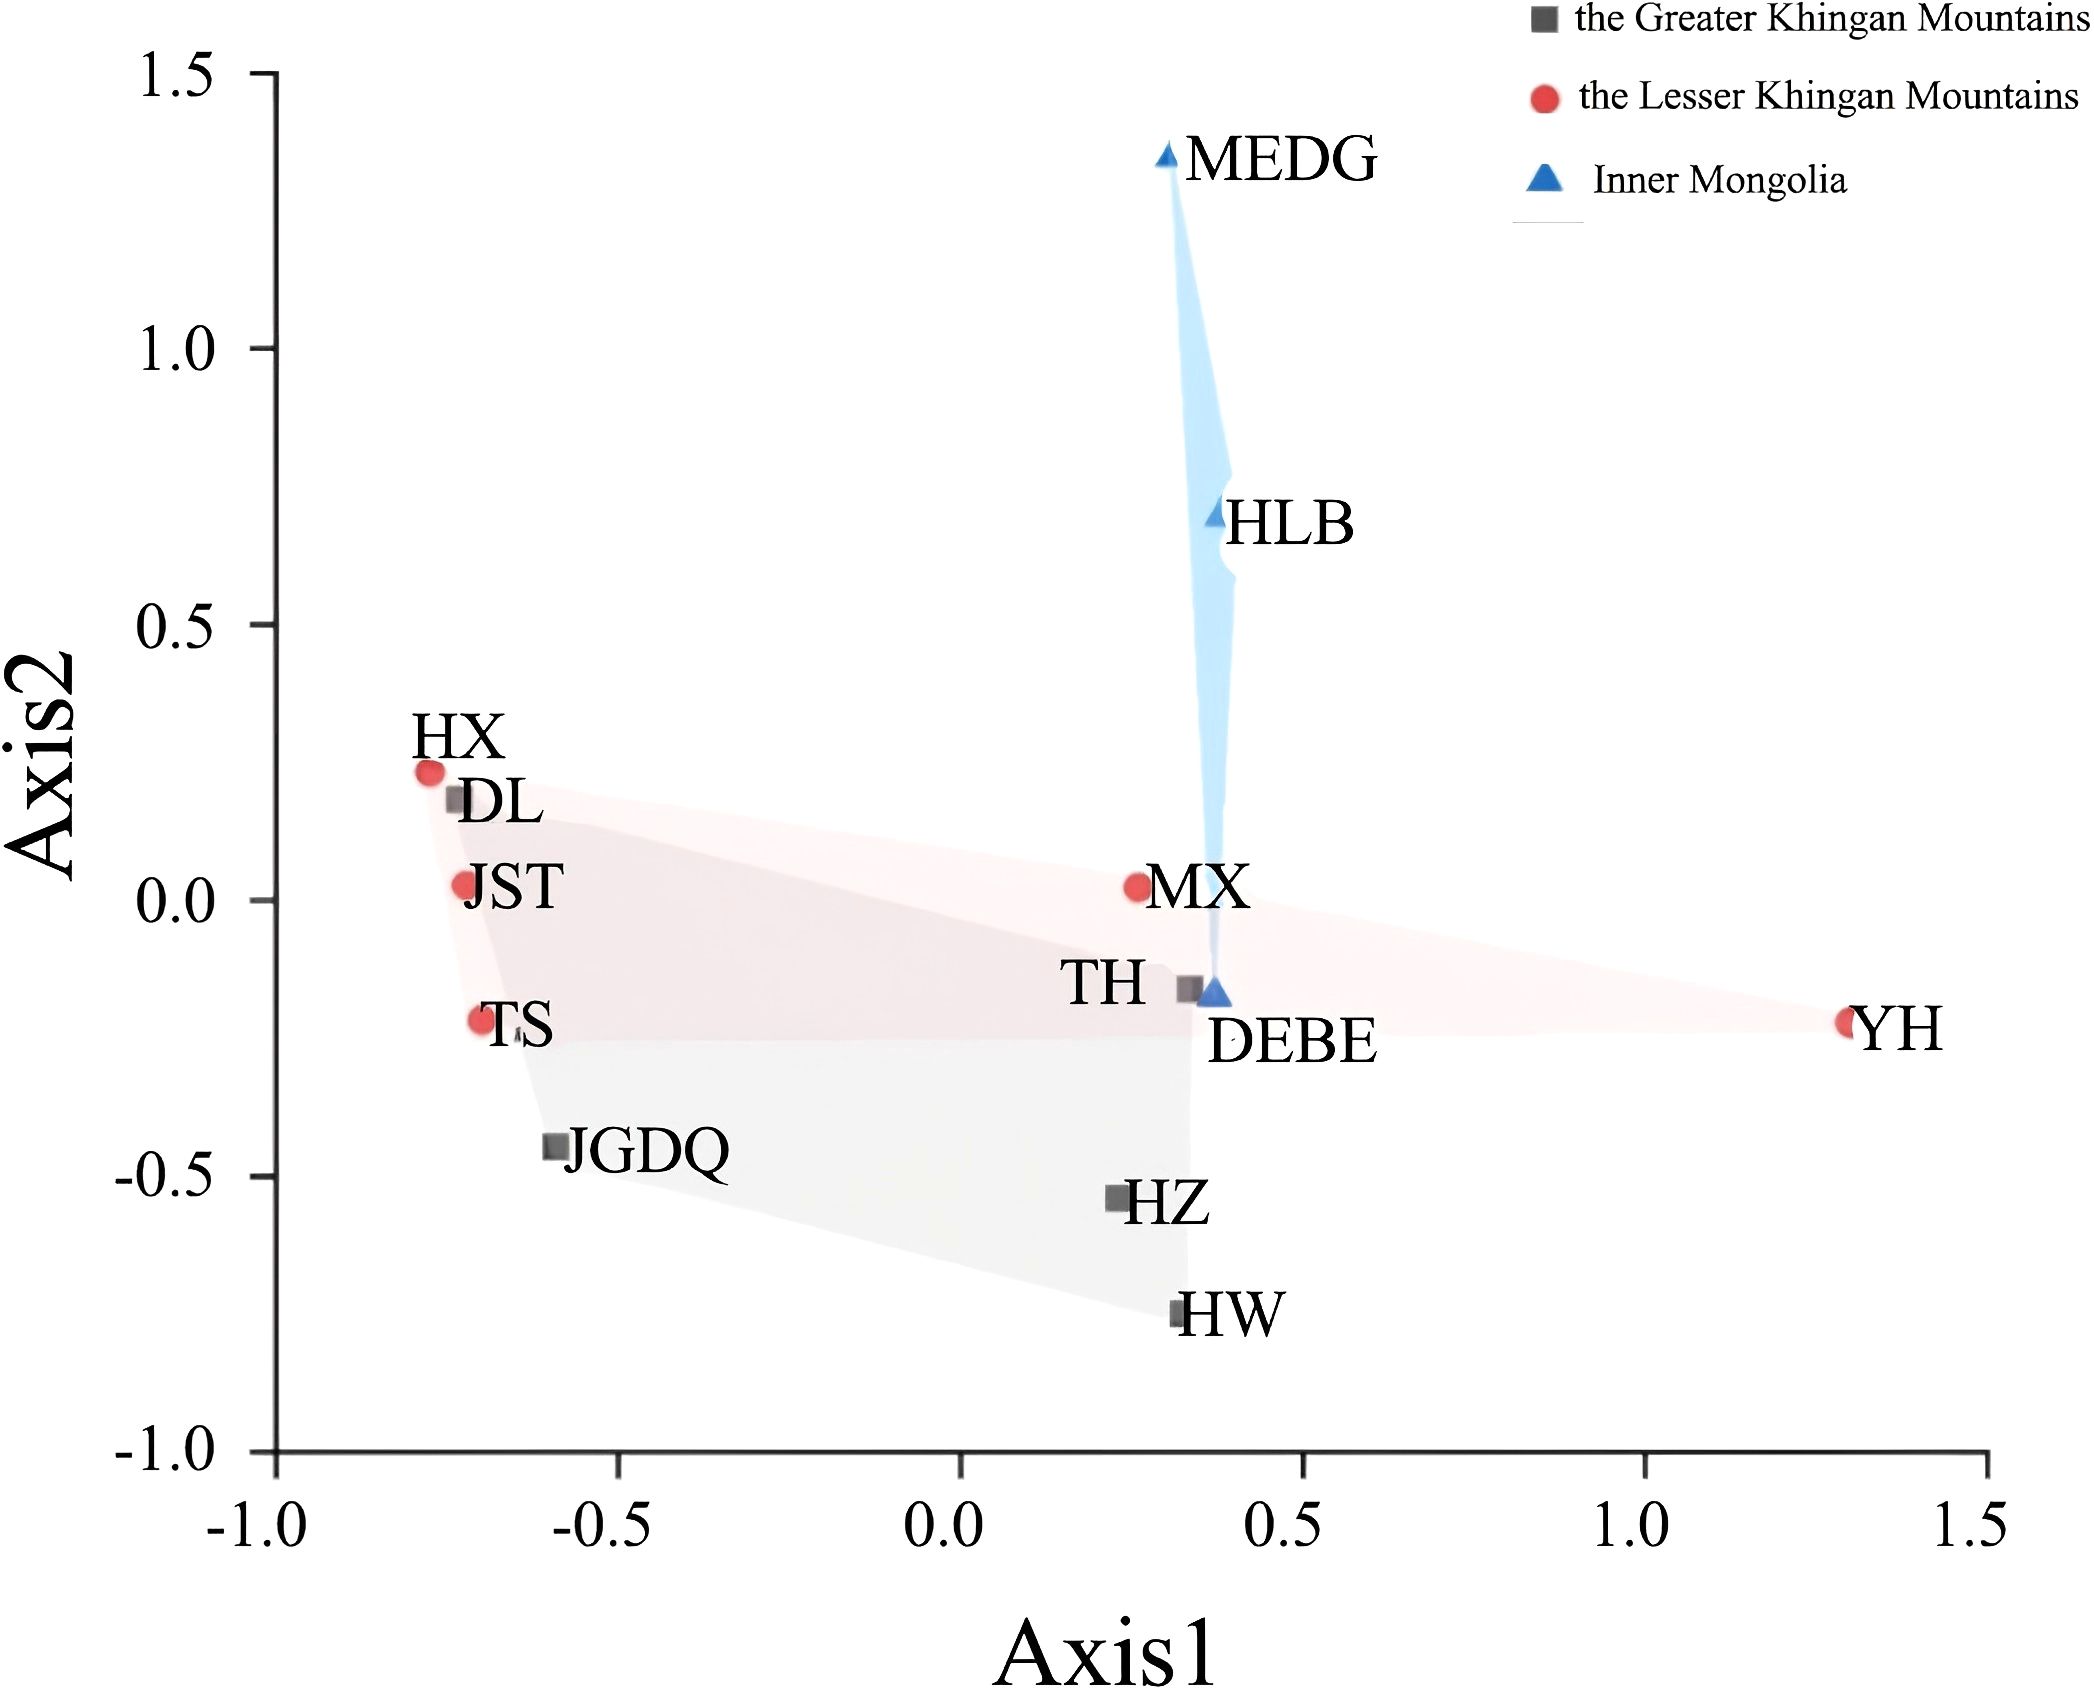
Figure 6. Principal coordinate analysis. Points of different colors and shapes represent sample groups in different environments.
We next used GLM to determine the association between SSRs and phenotypic traits and found that 3 loci with statistical significance (p < 0.05, Table 8): Rd-SSR-57 for leaf aspect ratio, ground diameter, branch number, and flower number; Rd-SSR-66 for flower color and plant height; and Rd- SSR-34 for plant height and flower diameter (Supplementary Figure S2). The explanation rate of phenotypic variation by individual SSRs ranged from 0.3179 to 0.7110 (Table 8). Among them, Rd-SSR-66 showed an explanation rate of 0.7110 for flower color, while both Rd-SSR-66 and Rd-SSR-57 were significantly correlated with flower color and leaf aspect ratio (Q < 0.1). Further analysis revealed a significant variance in flower based on Rd-SSR-66 genotypes, with genotypes 244:244, 230:230 and 227:230 showing darker flower color in TH, HW, DEBE, YH and 227:227 and 227:236 corresponding to lighter flower color values in MEDG and HLB (Figure 7A). For Rd-SSR-57, a significant difference was found in leaf length-to-width ratio between TS/JST and the remaining populations (P =0.0008, Figure 7B).
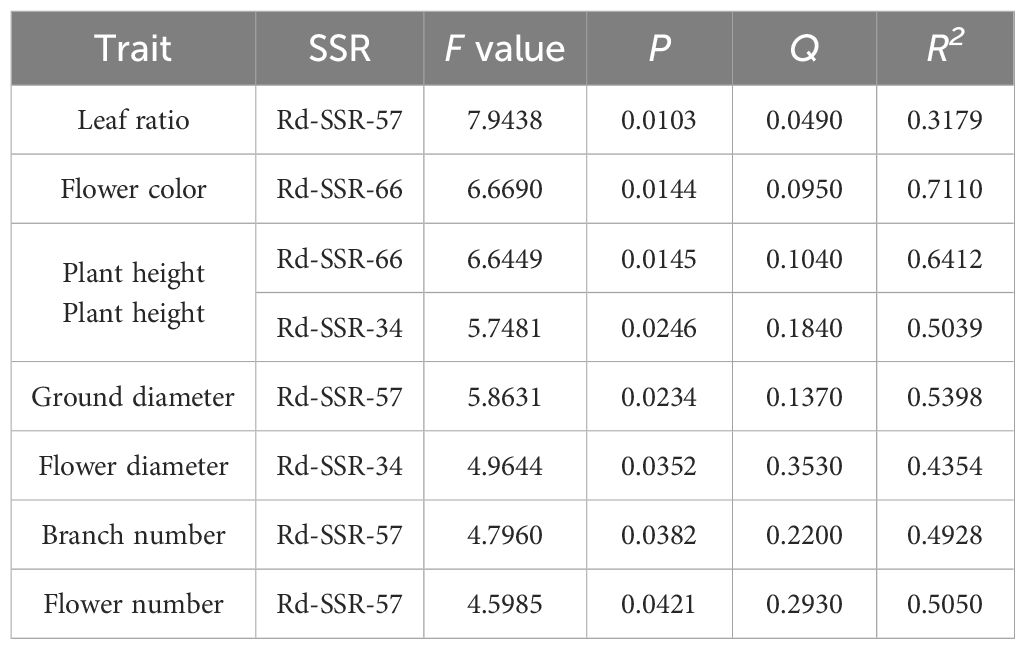
Table 8. Trait-marker association analysis based on GLM model.
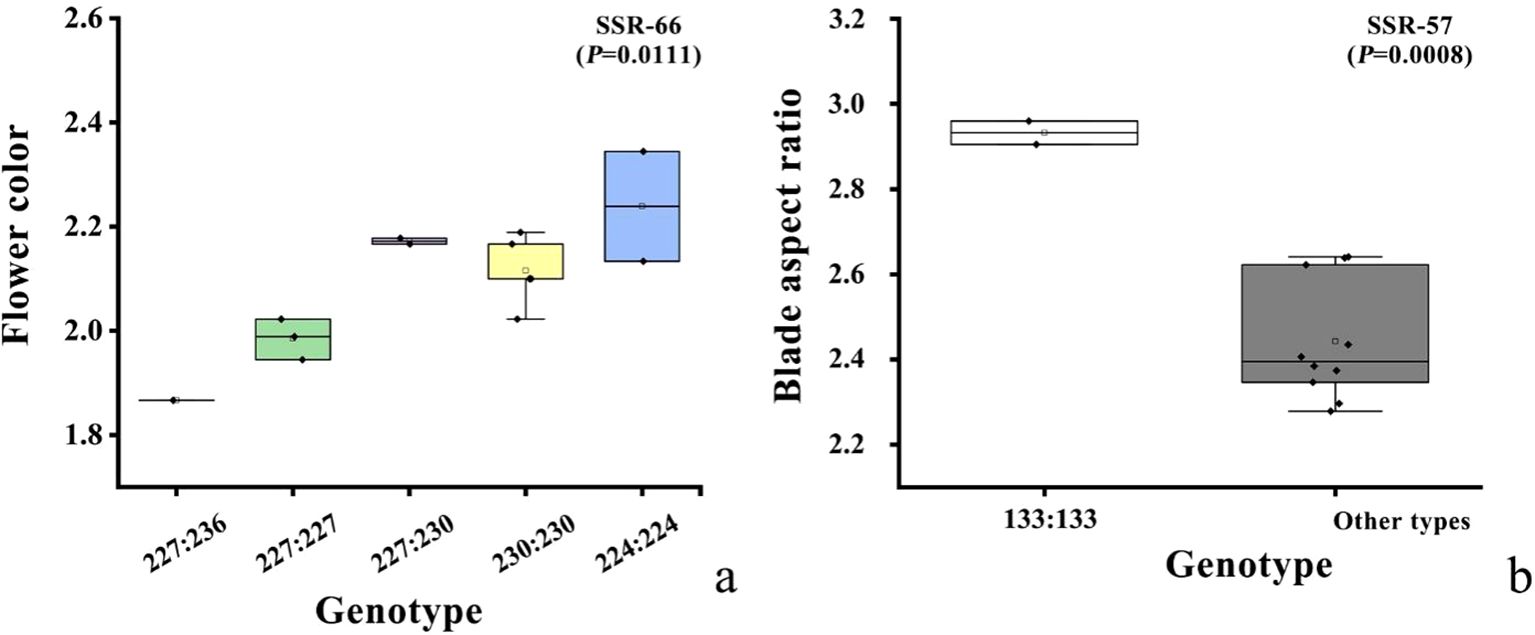
Figure 7. Box diagrams showing the distribution of flower color (A) and leaf aspect ratio (B) across genetic background.
In our study, the nine SSR markers covered 25 alleles with a PIC value of 0.3460 and an average Shannon information index I of 0.6359. At the population level, the average expected heterozygosity was 0.4813, and the average percentage of polymorphic sites was 17.16%. These numbers were lower compared to those reported in a previous study by Jiang et al (Jiang et al., 2016). The discrepancy could be attributed to differences in the population location and size in the two studies (Supplementary Figure S3). Population size is of particular importance because a small population size will reduce the evolutionary potential of wild species and thus the genetic diversity (Frankham, 1996). In addition, previous research showed that the genetic background of R. dauricum populations in the Greater and Lesser Khingan Mountains is similar (Yang et al., 2020) and they are all derived from Siberian flora. There was no expansion in the wild habitats of R. dauricum after the Ice Age (Jiang et al., 2016). Thus, genetic exchange among different populations was unlikely, causing isolated refugia. In supporting of this, our data demonstrated that the genetic imprints from different refuges still profoundly affect the population structure of R. dauricum in Northeast China.
Our data indicated a great inter-population variation with a Fst value of 0.6556. This was different from Jiang et al. (Fst = 0.2089). Again, the inconsistency can stem from variations in sampling and the choice of molecular markers. In addition, a low Nm value of 0.1777 from our analysis suggested a low level of gene flow among the populations. This is supported by the fact that R. dauricum assumes habitats of distinct geological conditions. Thus, long-term geographical isolation and natural selection promote divergences. Accordingly, our data showed a certain correlation between genetic distance and geographical distance (Figure 4), but it is not significant. The same reason could explain the results of the clustering analysis, in which most populations clustered in accordance to geographical distances with some expectations. For example, HW and TH, JST and TS, MX and YH, HLB and MEDG, are all clustered together for geographic proximity, which is consistent with the phenotypic markers(Figure 5). Exceptions were indeed observed, For example, HX and DL are not clustered by geographic distance, possibly due to human activities or animal migration.
We found both common and unique patterns in the clustering results based on either phenotypic or molecular data. However, discrepancies were also obvious including the grouping of HZ, DL, and HX in phenotypic clustering and the separation of HZ from DL and HX in clustering results based on SSR data. The inconsistency is not uncommon, as reported in previous studies. It can be caused by several factors. Phenotypic traits are extremely susceptible to external conditions including environmental factors (Zheng et al., 2016). By contrast, molecular markers are more stable but the selected ones in any study may not be strongly associated with the phenotypic traits. In fact, one major limitation of this study is that only 9 SSR markers were used here, which resulted in only a small set of detectable alleles. Regardless of the methodology used, both data in our study showed a high level of genetic diversity among the 13 populations and identified populations that should be prioritized for conservation efforts (e.g.,HZ and HX). In addition, we found a high correlation between flower color, leaf length-to-width ratio, and molecular markers. Thus, the two methods provided complementary information.
Research results indicate that (Lu et al., 2022), due to the ‘self-thinning effect’, the population of R. dauricum in Greater Khingan Mountains shows a declining trend, with the number of juvenile individuals decreasing and the number of older individuals increasing over time in the middle and lower elevation birch forests. This suggests that changes in the population of R. dauricum are influenced not only by external factors such as human activity but also by internal natural dynamics of the population itself (Zhang et al., 2004).
On one hand, human activities are a major external factor increasing survival pressure and reducing the population size of R. dauricum. The plant forms flower buds by late summer, which need to overwinter and bloom the following spring. However, human activity, such as breaking branches in winter, severely impacts flowering and seed production the next year, hindering population reproduction. Additionally, the damaged forest understory resources cannot quickly recover, leading to insufficient reserves of seedlings and young trees, creating significant gaps, and in some cases, even causing resource extinction through excessive harvesting. This severely disrupts the balance of the forest ecosystem and affects population numbers. Furthermore, global warming is contributing to the marshification of R. dauricum habitats, which is another external factor leading to population decline.
On the other hand, the internal factors contributing to the vulnerability of R. dauricum are primarily influenced by seed reproductive capacity and viability, pollinators, and seed physiological ecology. In wild populations of R. dauricum, seedling numbers are low, and some individuals rely on clonal reproduction to maintain population renewal, with seedlings exhibiting slow growth. This could be due to a thick litter layer or competition for resources from other species within the same community, leading to difficulties in seed germination and severe limitations on seedling growth, making population recovery challenging.
Previous studies have shown that R. dauricum is self-affection and, in the wild, its main pollination method involves cross-pollination assisted by pollinators, consistent with the reproductive systems of other species within the Rhododendron genus (Mejías et al., 2002; Zhang et al., 2021). The survey also revealed that while there are various flower-visiting insect species, the effective pollinators are primarily bumblebees (Fenster et al., 2004; Xiaoling et al., 2011). Additionally, the flowering period is only 7 to 10 days and occurs in the early spring of the northeastern forest region, often experiencing late spring cold snaps. This results in frequent pollination failures and severe reproductive disorders, hindering the population's ability to reproduce and regenerate.
Since our data showed that the within-population variation is the major contributor to the genetic diversity of R. dauricum, future conservation effort should prioritize populations with a high level of diversity. Accordingly, priority should be given to HZ, TH, and HX. Human interference should be minimized in these areas. In addition, inter-population mating can be considered to promote gene exchange. With the help of field reintroduction and population reconstruction, the wild population will be gradually regenerated and restored.
The present study underscores that both phenotypic traits and molecular marker analysis can reflect the high genetic diversity of R. dauricum in the Huzhong,Tahe and Hongxing populations. Therefore, priority should be given to protecting these populations. Simultaneously obtaining two latent sites with high significance for leaf aspect ratio and flower color, respectively. It can be used to distinguish differences between populations and molecular marker assisted breeding.
The original contributions presented in the study are included in the article/Supplementary Material, further inquiries can be directed to the corresponding author/s.
DW: Conceptualization, Data curation, Formal analysis, Funding acquisition, Investigation, Methodology, Project administration, Resources, Software, Supervision, Validation, Visualization, Writing – original draft, Writing – review & editing. YM: Investigation, Writing – review & editing. XZ: Investigation, Methodology, Writing – review & editing. LW: Data curation, Formal analysis, Writing – review & editing.
The author(s) declare financial support was received for the research, authorship, and/or publication of this article. This research was funded by the Opening Project of State Key Laboratory of Tree Genetics and Breeding (No. K2024106), the National Key Research and Development Program of China (No. 2016YFC0500306), and the Research Project for Heilongjiang Provincial Scientifific Institutes (No. CZKYF2020B011).
The authors declare that the research was conducted in the absence of any commercial or financial relationships that could be construed as a potential conflict of interest.
The author(s) declare that no Generative AI was used in the creation of this manuscript.
All claims expressed in this article are solely those of the authors and do not necessarily represent those of their affiliated organizations, or those of the publisher, the editors and the reviewers. Any product that may be evaluated in this article, or claim that may be made by its manufacturer, is not guaranteed or endorsed by the publisher.
The Supplementary Material for this article can be found online at: https://www.frontiersin.org/articles/10.3389/fpls.2025.1533824/full#supplementary-material
Bai, K. Z., Gao, R. H., Zhang, Q. L., Kang, L. (2011). Study on relationship between the key species of Larix gmelinii forest and Rhododendron plant. J. Inner Mongolia Agric. Univ. 32 (2), 31–37. doi: CNKI:SUN:NMGM.0.2011-02-009
Fenster, C. B., Armbruster, W. S., Wilson, P., Dudash, M. R., Thomson, J. D. (2004). 392 Pollination Syndromes and Floral Specialization. Ann. Rev. Ecol. Evol. Syst. 35 (1), 75–403. doi: 10.1146/annurev.ecolsys.34.011802.132347
Frankham, R. (1996). Relationship of genetic variation to population size in wildlife. Conserv. Biol. 10 (6), 1500–1508. doi: 10.1046/j.1523-1739.1996.10061500.x
Guo, D. (2007). Development of the microsatellite primer in plant. J. Anhui Agric. Sci. 18, 5361–5363. doi: 10.13989/j.cnki.0517-6611.2007.18.012
Ji, W., Jin, D., Li, H. (2010). Genetic diversity and relatives analysis of Rhododendron schlippenbachin Maxim. based on RAPD. J. Northeast Agric. Univ. 41 (12), 30–33. doi: 10.19720/j.cnki.issn.1005-9369.2010.12.007
Jiang, N., Man, L., Zhang, W., Dong, H. X., Wang, H. Y., Li, M. R., et al. (2016). Chloroplast view of the population genetics and phylogeography of a widely distributed shrub species, Rhododendron dauricum (Ericaceae). Am. Soc. Plant Toxonomists. 41 (3), 626–633. doi: 10.1600/036364416X692343
Jin, Z. X., Li, J. M., Gu, Q. P. (2006). Genetic diversity in the natural populations of Rhododendron fortunei revealed by ISSR molecular markers. Acta Hortic. Sin. 33 (6), 1263–1267. doi: 10.16420/j.issn.0513-353x.2006.06.020.
Li, B., Gu, W., Lu, B. (2002). A study on phenotypic diversity of seeds and cones characteristies in Pinus bungeana. Biodiversity Sci. 10 (2), 181–188. doi: 10.17520/biods.2002023
Liu, K., Muse, S. V. (2005). PowerMarker: an integrated analysis environment for genetic marker analysis. Bioinformatics 21 (9), 2128–2129. doi: 10.1093/bioinformatics/bti282
Lu, Y. P., Chen, W., Wang, X. L., Gao, Z., He, X. Y. (2022). Demography anlysis of Rhododendron dauricum (Ericaceae) population in the Great Khingan Mountains based on life table. Acta Ecologica Sin. 42 (13), 1–11. doi: 10.5846/stxb202105101218
Masatoshi, N. (1973). Analysis of gene diversity in subdivided populations. Proc. Nat. Acad. Sci. 70 (12), 3321–3323. doi: 10.1073/pnas.70.12.3321
Mejías, J. A., Arroyo, J., Ojeda, F. (2002). Reproductive ecology of Rhododendron ponticum (Ericaceae) in relict Mediterranean populations. Bot. J. Linnean Soc. 140 (3), 297–311. doi: 10.1046/j.1095-8339.2002.00103.x
Nie, L. (2013). The study of cross-species amplification of polymorphic microsatellite markers from Pelodiscus sinensis. J. Biol. 30 (1), 27–30+38. doi: 10.3969/j.issn.2095-1736.2013.01.027
Peng, C., Zhang, X., Yang, Y., Cheng, D., Li, L., Song, C. (2010). Study on the genetic diversity of ancient commynity of Rhododendron simsii Planch. from Macheng of Hubei. Hubei Forestry Sci. Technol. 164 (4), 26–30+63. doi: 10.3969/j.issn.1004-3020.2010.04.007.
Wang, D., Ma, Y., Zhao, X., Liu, G., Wang, L., Wang, F. (2023). Yanricai: A new cultivar of Rhododendron dauricum L. With dense flowers. Hortscience 58 (1), 141–142. doi: 10.21273/HORTSCI16914-22
Wang, D., Yang, Y., Li, F., Zhou, S., Liu, G., Yang, J., et al. (2022). ‘Ao Xue’: A new Rhododendron cultivar. HortScience 57 (2), 330–331. doi: 10.21273/HORTSCI16289-21
Wang, S., Luo, L., Zeng, Y., Jin, W., Xiang, F., Fang, Y. (2016). Study on cross-species amplification of polymorphic simple sequence repeat markers FromRhododendron simsii. Northern Horticulture 03, 100–103.
Wang, S. Z., Lei, P., Kan, H., Chen, C., Ding, Y. (2010a). Development and characterization of polymorphic microsatellite markers in Momordica charantia (Cucurbitaceae). Am. J. Bot. 97 (8), e75–78. doi: 10.3732/ajb.1000153
Wang, X. Q., Huang, Y., Long, C. L. (2010b). Cross-amplification and characterization of microsatellite loci for the genus Rhododendron. Hortscience 45 (9), 1394–1397. doi: 10.21273/HORTSCI.45.9.1394
Wilson, E. H. (1923). The rhododendrons of Northeastern Asia exclusive of those belonging to the subgenus anthodendron. J. Arnold Arboretum. 4 (1), 33–56. doi: 10.5962/p.317971
Wu, Y., Tao, Q., Li, B., Xu, D. (2013). An optimal SRAP-PCR system of Rhododendron hybridum and its genetic diversity analysis with SRAP marker. J. Zhejiang A&F Univ. 30 (6), 844–851. doi: 10.11833/j.issn.2095-0756.2013.06.007
Xiao, K., Ge, X., Li, X., Tang, Y. (2007). Improved CTAB method for extracting total DNA from Dendrobium nobile Lindl. J. Gui Yang Med. Coll. 32 (2), 213–214. doi: 10.19367/j.cnki.1000-2707.2007.02.037
Xiao, Z., Su, J. L., Liu, X. Q., Li, C., He, L. S., Chen, S. P. (2015). Analysis of genetic diversity of Rhododendron germplasm resources based on ISSR markers. Acta Agriculturae Jiangxi 27 (11), 6–10. doi: 10.19386/j.cnki.jxnyxb.2015.11.002.
Xiao, Z., Su, J. L., Liu, X. Q., Li, C., He, L. S., Chen, S. P. (2016). SRAP analysis of genetic relationships among Rhododendron species. Jiangsu J. Agric. Sci. 32 (2), 442–447. doi: 10.3969/j.issn.1000-4440.2016.02.031.
Xiaoling, T., Yongpeng, M., Changqin, Z., Gengguo, T., Jingli, Z (2011). Recent advance of 461 reproductive biology in Rhododendron L. J. Nanjing Forestry University 462 (Natural Science Edition) 35 (3), 124–128. doi: 10.3969/j.issn.1000-2006.2011.03.026
Yang, B., Xu, Q., Niu, M., Lou, X., Huang, H., Tong, Z., et al. (2018). Transcriptome SSR analysis and molecular marker development of Rhododendron fortunei Lindl. J. Nucl. Agric. Sci. 32 (12), 2335–2345. doi: 10.11869/j.issn.100-8551.2018.12.2335
Yang, B., Zhang, G., Guo, F., Wang, M., Wang, H., Xiao, H. (2020). A Genomewide Scan for Genetic Structure and Demographic History of Two Closely Related Species, Rhododendron dauricum and R. mucronulatum (Rhododendron, Ericaceae). Front. Plant Sci. 11, 1093. doi: 10.3389/fpls.2020.01093
Ye, C., Jin, M., Li, R., Sun, J., Wang, R., Wang, J., et al. (2020). Phytochemical and chemotaxonomic study on the leaves of Rhododendron dauricum L. Biochem. Systematics Ecol. 90, 104038. doi: 10.1016/j.bse.2020.104038
Yeh, F., Yang, R., Boyle, T. (1999). POPGENE Version 1.32 Microsoft Windows-based freeware for populations genetic analysis (Edmonton: University of Alberta).
Zhang, C. Q., Gao, L. M., Xue, R. G., Yang, J. Q. (2004). A general review of the research and conservation statue of Chinese rhododendron. Guangxi Sci. 11 (4), 354–359+362. doi: 10.3969/j.issn.1005-9164.2004.04.021
Zhang, L., Wang, J., Xie, W., Cai, Y., Song, J., Peng, L., et al. (2016). Ancestor parents speculation for alpine Rhododendron hybrids based on the pedigree and SSR markers. Acta Bot. Borea. Occident. Sin. 36 (12). doi: 10.7606/j.issn.1000-4025.2016.12.2421
Zhang, X., Zhang, X.-J., Ma, Y.-P., Li, Z.-H., Wan, Y.-M., Ma, H. (2021). Genetic diversity assessment of Rhododendron sinofalconeri with genotyping by sequencing(GBS). Bull. Botanical Res. 41 (3), 429–435. doi: 10.7525/j.issn.1673-5102.2021.03.491013
Zhang, C., Zhao, H., Li, M., Xu, M., Liu, X. (2012). RAPD analysis of genetic diversity of Rhododendron chrysanthum Pall. populations in different altitude. J. Agric. Sci. Yanbian Univ. 34 (1), 46–50. doi: 0.13478/j.cnki.jasyu.2012.01.016
Zhao, X., Jin, Z., Li, J., Tan, T. (2010). ISSR analysis of genetic diversity in Rhododendron latoucheae. Jiangsu Agric. Sci. 3, 34–36. doi: 10.15889/j.issn.1002-1302.2010.03.099.
Zhao, B., Si, G. C., Gu, X., L., Z. Y. (2012). Population variation analysis of seven Rhododendron concinnum wild populations in Qinling Mountains. Bull. Botanical Res. 32 (5), 561–566. doi: 10.7525/j.issn.1673-5102.2012.05.010
Zheng, D., Tianhai, Y., Zhili, Z., Changzhi, D., Liangshang, X. (2016). Study on Genetic Diversity and Relationship for the Hainan lsland Landraces of Cucurbita moschata. J. Nucl. Agric. Sci. 30 (05), 869–877. doi: 10.11869/j.issn.100-8551.2016.05.0869
Zhou, X., Wang, H., Li, F., Zhang, K., Wang, Y., Ya, H. (2019). Development of Polymorphic SSR Markers in Rhododendron henanense subsp. lingbaoense Based on RAD-seq. J. Agric. Biotechnol. 27 (1), 55–62. doi: 10.3969/j.issn.1674-7968.2019.01.006
Keywords: Rhododendron dauricum L., phenotypic diversity, genetic diversity, population structure, SSR
Citation: Wang D, Ma Y, Zhao X and Wang L (2025) Genetic diversity of Rhododendron dauricum based on morphological traits and SSR markers. Front. Plant Sci. 16:1533824. doi: 10.3389/fpls.2025.1533824
Received: 25 November 2024; Accepted: 10 January 2025;
Published: 06 February 2025.
Edited by:
Bozena Kolano, University of Silesia in Katowice, PolandReviewed by:
Ruirui Huang, University of San Francisco, San Francisco, United StatesCopyright © 2025 Wang, Ma, Zhao and Wang. This is an open-access article distributed under the terms of the Creative Commons Attribution License (CC BY). The use, distribution or reproduction in other forums is permitted, provided the original author(s) and the copyright owner(s) are credited and that the original publication in this journal is cited, in accordance with accepted academic practice. No use, distribution or reproduction is permitted which does not comply with these terms.
*Correspondence: Ling Wang, d2FuZ2xpbmdobGpAbmVmdS5lZHUuY24=
Disclaimer: All claims expressed in this article are solely those of the authors and do not necessarily represent those of their affiliated organizations, or those of the publisher, the editors and the reviewers. Any product that may be evaluated in this article or claim that may be made by its manufacturer is not guaranteed or endorsed by the publisher.
Research integrity at Frontiers
Learn more about the work of our research integrity team to safeguard the quality of each article we publish.