 Rong Chen1,2,3,4
 Rui Rao1,2,3,4
 Chun Wang1,2,3,4
 Dongbo Zhu1,2,3,4Fen Yuan1,2,3,4
 Liangliang Yue1,2,3,4*
- 1Yunnan Key Laboratory of Plateau Wetland Conservation, Restoration and Ecological Services, Southwest Forestry University, Kunming, China
- 2National Plateau Wetlands Research Center, Southwest Forestry University, Kunming, China
- 3National Wetland Ecosystem Fixed Research Station of Yunnan Dianchi, Southwest Forestry University, Kunming, China
- 4Dianchi Lake Ecosystem Observation and Research Station of Yunnan Province, Kunming, China
Introduction: Garuga forrestii W. W. Sm. is a tree species of the Burseraceae family, endemic to China, found in hot/warm-dry valleys. This species plays a crucial role in maintaining biodiversity in these ecosystems.
Methods: We performed de novo assembly of the Garuga forrestii mitochondrial genome using PMAT (v.1.5.4), resulting in a typical circular molecule of 606,853 bp. The genome consists of 31 tRNA genes, 3 rRNA genes, 35 protein-coding genes, and 1 pseudogene. The study also investigates RNA editing sites and evolutionary patterns.
Results: The mitochondrial genome exhibits a low proportion of repetitive sequences (3.30%), suggesting a highly conserved structure. A high copy number of the trnM-CAT gene (4 copies) is noted, which may contribute to genomic rearrangement and adaptive evolution. Among the 476 RNA editing sites, hydrophilic-hydrophobic and hydrophobic-hydrophobic editing events are most common, accounting for 77.10%. Negative selection predominates among most genes (Ka/Ks < 1), while a few genes (e.g., matR, nad3, rps1, rps12, and rps4) show signs of positive selection (Ka/Ks > 1), potentially conferring evolutionary advantages. Additionally, a significant A/T bias is observed at the third codon position. Phylogenomic analysis supports the APG IV classification, with no evidence of horizontal gene transfer.
Discussion: This mitochondrial genome offers valuable insights into the adaptive mechanisms and evolutionary processes of Garuga forrestii. It enhances our understanding of the species' biogeography in tropical Southeast Asia and Southwest China, providing key information on the evolutionary history of this genus.
1 Introduction
Garuga forrestii, Burseraceae, is a deciduous tree species up to more than 25 meters high, endemic to southwest China, thrives in valley habitats at elevations ranging from 900 to 2400 meters above sea level, sometimes dominates the upper slopes of savannas in river valleys (Tiamiyu et al., 2021). This species is primarily distributed in the warm valleys of Sichuan and Yunnan provinces, particularly along the Jinshajiang, Yangbijiang, Lancangjiang, Honghe rivers, and their major tributaries. Remarkably, G. forrestii represents the sole species of the Burseraceae family found beyond the Tropic of Cancer, with its northernmost distribution reaching latitudes above 28°N in Leibo, Sichuan. The species flowers in the period between March and April, preceding the onset of the monsoon season, with fruiting occurring from May to September. G. forrestii has been identified as a promising candidate for ecological restoration, particularly for riparian vegetation rehabilitation and riverbank stabilization in valley environments. The fruits of the tree serve as an important food source for a variety of avian and mammalian species, thus playing a role in maintaining faunal population sizes. Despite its ecological importance, a recent phylogenomic study of G. forrestii and other related species within the Burseraceae family revealed intricate evolutionary patterns, with notable discrepancies between plastid and nuclear genomic datasets (Zhu et al., 2024). However, mitochondrial genomic data for this species remain absent, representing a significant gap in current research and a promising direction for future investigation.
Mitochondria play crucial roles in plant development and reproduction by participating in energy production, metabolism, and maintaining cellular homeostasis through their semi-autonomous genetic system (He et al., 2020; Ke et al., 2023). Each plant species has a unique mitochondrial genome, known for extreme variations in size, structural complexity, mutation rates, as well as its ability to absorb foreign DNA (Petersen et al., 2020). These differences are primarily attributable to repetitive sequences, including elements resulting from horizontal gene transfer (HGT), introns, and DNA segments transferred from chloroplast (cp) and nuclear genomes (Gandini et al., 2019; Tanaka et al., 2012).
Horizontal gene transfer (HGT), particularly involving transfers between mitochondria, is now recognized as a significant driver of evolution in land plant (Yue et al., 2012; Gandini and Sanchez-Puerta, 2017). Pant mitochondrial genomes exhibit structural complexity and size variation, while their protein-coding genes evolve slowly and are less susceptible to substitution saturation, making them ideal for phylogenetic studies in higher taxonomic categories (Dong et al., 2022). However, most of the mitochondrial genomes are characterized by abundant repeat sequences which facilitate recombination and contribute to dynamic structural rearrangements, such as the formation of subgenomic circles and isomers (Guo et al., 2024; Feng et al., 2024). An example of this complexity is observed in Gastrodia elata, whose mitochondrial genome contains 19 subgenomes, including 12 circular and 7 linear forms (Yuan et al., 2018).
Frequent recombination and the high prevalence of simple sequence repeats (SSRs) drive the structural diversity observed in plant mitochondrial genomes. SSRs also serve as markers for studying genetic diversity and species identification (Ma et al., 2016), and homologous recombination involving these repeats has been documented across numerous plant species (Mower et al., 2012; Xu et al., 2013). Recombination between primary and secondary conformations further complicates sequencing, particularly in angiosperms.
Another important feature of mitochondrial genomes is RNA editing, which refers to the programmed modification of the RNA nucleotide sequence relative to the corresponding DNA sequence. This process encompasses two main types of nucleotide changes: insertion/deletion and substitution (Goremykin et al., 2008). This process is widespread and highly variable in mitochondria (Bi et al., 2016). These RNA modifications, which often result in non-synonymous substitutions at the first and second codon positions, can influence gene expression and impact phylogenetic analyses (Dong et al., 2022; Goremykin et al., 2008).
In this study, we presented the first complete mitochondrial genome of G. forrestii, provide a comprehensive analysis of its features, including the proportions of repetitive sequences, RNA editing, codon usage, collinearity, gene transfers from chloroplasts to mitochondria, nucleotide diversity, selection pressures, and phylogenomic relationships. The primary objectives of this study were: 1) to characterize the mitochondrial genome of G. forrestii, and 2) to elucidate the evolutionary dynamics of its mitochondrial genome within the context of the Sapindales order.
2 Materials and methods
2.1 Plant material and DNA extraction
Fresh leaves of G. forrestii were collected from Yangwu, Xinping County, Yunnan, China (102°7′41.75″E, 24°1′54.84′N). A voucher specimen (yue187 Specimen No. 202382702-2) was deposited at the College of Wetland, Southwest Forestry University, Kunming, China (email:bWNtMTgyMTM4MzU4MTdAMTI2LmNvbQ==). The mitochondrial genome data of G. forrestii was generated by Biomarker Technologies (www.biomarker.com.cn) using the PacBio HiFi (CCS) library construction and sequencing service. Through PacBio third-generation sequencing and post-sequencing quality control, a total of 15,498,150,008 bp of CCS data was obtained. Transcriptome sequencing yielded 34.60 million reads, with a total of 10.37 Gb of clean data. The average data output per sample was 10.37 Gb, with a Q30 base percentage of 93.37% or higher.
2.2 Mitochondrial genome assembly and annotation
We performed de novo assembly of the G. forrestii mitochondrial genome using PMAT (v.1.5.4) (Bi et al., 2024) with the command PMAT autoMito -I -o -st -g -m. Genome visualization was carried out using Bandage (v0.8.1) (Wick et al., 2015). To ensure a pure mitochondrial genome assembly, chloroplast and nuclear genome fragments were manually removed using the command PMAT graphBuild -c -a -gs -rs -o -s, resulting in a graphical representation of the mitochondrial genome.Annotation of the G. forrestii mitochondrial genome was conducted using coding gene sequences from Arabidopsis thaliana (NC037304.1) as references. Protein-coding genes (PCGs) were identified using the Geseq tool (Tillich et al., 2017; https://chlorobox.mpimp-golm.mpg.de/geseq.html) and IPMGA (http://www.1kmpg.cn/ipmga/). For tRNA annotation, we used tRNAscan-SE (v.1.4) (Lowe and Eddy, 1997) with default parameters, while rRNA annotation was performed using BLASTN (v.2.10.1) (Chen et al., 2015). Manual corrections to the annotation were made using Apollo (v.1.11.8) (Lee et al., 2009) to address any errors detected during the process (Darling et al., 2019).The mitochondrial genome map was generated using OGDRAW (v.1.3.1) (https://chlorobox.mpimp-golm.mpg.de/ogdraw.html). Subsequently, the chloroplast genome of G. forrestii was assembled using Oatk (v.1.0) (https://github.com/c-zhou/oatk) and annotated with Geseq. Both the annotated mitochondrial and chloroplast genomes of G. forrestii have been deposited in GenBank.
2.3 Detection of RNA editing events in G. forrestii mitogenome
we extracted the coding sequences (CDs) of each protein-coding gene (PCG) with 100 bp-long flanking regions as reference sequences (Yang et al., 2023). We then mapped strand-specific RNA-seq reads to these reference sequences using HISAT2 (v 2.2.1) (Chen et al., 2015; Kim et al., 2015), with the parameters “–rna-strandness RF –sensitive –no-mixed –no-discordant” (The minicircular and extremely heteroplasmic mitogenome of the holoparasitic plant Rhopalocnemis phalloides). DNA sequencing reads were mapped to the reference sequences extracted above using BWA (v0.7.12-r1039) (Li and Durbin, 2009), and REDItools v2 was used to detect RNA editing sites based on the mapping results (Picardi and Pesole, 2013). Finally, REDItools (v 2.0) was used to extract unidentified SNP sites, and IGV software (v 2.15.1) (Milne et al., 2010) was used to visualize the positioning results of RNA editing sites.
2.4 Analysis of relative synonymous codon usage and repeated sequences
We used PhyloSuite (v1.2.2) (Zhang et al., 2019) to extract protein-coding sequences (PCGs) from the mitochondrial genome of G. forrestii. Codon usage bias in the PCGs of G. forrestii and H. rhamnoides was analyzed, with relative synonymous codon usage (RSCU) values calculated using MEGA (v7.0.26) (Kumar et al., 2016). These values were then visualized for intuitive interpretation using the RNArtist web platform (https://github.com/fjossinet/RNArtist).The repeat sequences in the mitochondrial genome of G. forrestii were identified using the MISA online tool. SSR frequencies were determined based on the criteria set by Beier et al. (2017), with the minimum repeat numbers defined as 10, 5, 4, 3, 3, and 3 for mono-, di-, tri-, tetra-, penta-, and hexanucleotide repeats, respectively. Tandem repeats exceeding six base pairs were detected using Tandem Repeats Finder (v4.09) (Benson, 1999) with a match score threshold of 95%. Dispersed repeats were identified using BLASTN (v2.10.1) (Chen et al., 2015), applying a word size of 7 and an E-value threshold of 1e-5. The spatial distribution of all repeat types was visualized using Circos (v0.69-5).
2.5 Homologous fragment analysis and nucleotide diversity analysis
Homologous gene sequences from mitochondrial genomes of various species were aligned using MAFFT (v7.310) (Katoh and Standley, 2013) with default parameters. Fragments exhibiting significant variation were identified, and highly divergent sequences from each mitochondrial genome were extracted using Geneious (v9.0.2) (Kearse et al., 2012). To identify the most similar sequences for ancestral tracing, nucleotide BLAST searches were conducted on these sequences using the online BLAST tool (https://blast.ncbi.nlm.nih.gov/Blast.cgi), optimized for highly similar matches. Ultra-divergent loci with poor alignment quality were filtered using Gblocks (Castresana, 2000) in accordance with the PhyloSuite pipeline (v1.2.2) (Zhang et al., 2019). Gblocks filtering parameters were set to require at least 10 sequences per block and a maximum of 8 consecutive non-conserved positions. Homologous fragments in the mitochondrial and chloroplast genomes of G. forrestii were analyzed using BLASTN (v2.7.1+) (Chen et al., 2015), with homologous sequences identified based on a minimum similarity of ≥70% and an E-value threshold of ≤1e-5. The filter length thresholds were set at ≥30 bp for comparisons between chloroplasts and mitochondria, and ≥1000 bp for comparisons involving mitochondria and the whole genome, following the criteria described by Cheng et al. (2023).The identified homologous sequences were visualized using Circos (v0.69-5) (http://circos.ca/software/download/). Nucleotide diversity (Pi) was calculated using DnaSP (v5) (Librado and Rozas, 2009) with sliding window analysis parameters of 100–200 bp, overlapping windows of 10–20 bp, and nucleotide diversity as the chosen statistical measure.
2.6 Comparative genomic analysis
In this study, we performed collinearity analysis on G. forrestii to examine its mitochondrial genome, while acknowledging the limited available data for the Burseraceae family, and even for Sapindales as a whole. To enhance the reliability of our analysis, we selected eight fully annotated mitochondrial genomes from closely related species within the Sapindales order. Focusing on these closely related species allowed for a more accurate identification of conserved genomic structures and evolutionary patterns. In contrast, the inclusion of distantly related species would have introduced greater variability, complicating the interpretation of collinearity features. The species included in this analysis are Mangifera indica (NC035239.1), Anacardium occidentale (NC035235.1), Nitraria tangutorum (MK431824.1), Peganum harmala (MK431826.1), Sapindus mukorossi (NC050850.1), Handeliodendron bodinieri (NC054241.1), Citrus unshiu (NC057142.1), and Citrus sinensis (NC037463.1). These species were chosen to represent key evolutionary lineages within the Sapindales, providing a comprehensive view of mitochondrial genome structure and evolution across the order.
To investigate the molecular evolution of the mitochondrial genomes, we calculated the Ka (nonsynonymous substitutions), Ks (synonymous substitutions), and the Ka/Ks ratio for each gene. The Ka/Ks ratio is a critical metric for understanding evolutionary dynamics at the molecular level (Yang and Nielsen, 2000; Zhang et al., 2006). A Ka/Ks ratio of 1 indicates neutral selection, where mutations do not affect the fitness of the organism. A Ka/Ks ratio greater than 1 (Ka/Ks > 1) suggests positive selection, indicating that the gene has undergone adaptive evolutionary changes. Conversely, a Ka/Ks ratio less than 1 suggests purifying selection (Hurst, 2002; Wang et al., 2010), where deleterious mutations are removed from the gene pool by natural selection. The calculated Ka/Ks values were then visualized using box plots generated with the R package ggplot2 (Wickham, 2011), providing a clear representation of the selection pressures acting on each gene. To analyze gene sequence similarities and differences across various species, MUMmer (version 4.0.0beta2) (Darling et al., 2018) was used to generate dot plots for sequence alignment, aligning the G. forrestii genome with those of other species using the maxmatch parameter. BLASTN (version 2.10.1) was employed to identify homologous sequences between G. forrestii and other species, with parameters set to a word length of 7 bases, an E-value threshold of 1e-5, and a minimum alignment length of 300 bp to illustrate homologous relationships in the figures.
2.7 Phylogenetic analysis
The mitochondrial phylogenomic tree was reconstructed using 15 samples, including G. forrestii and other 12 species from Sapindales (Supplementary Table 1) and Prunus schneideriana (NC065066.1) and Eriobotrya japonica (NC045228.1) from the Rosaceae were selected as outgroups. The sequences of these mitochondria were aligned using MAFFT (v. 7.310) (Katoh and Standley, 2013). A maximum likelihood (Atkins et al., 2020) tree was reconstructed using the software IQ-TREE 2 (Lanfear et al., 2020) following a substitution model selected automatically by IQ-TREE 2 with an ultra-bootstrap simulation of 1000 replications. The phylogenomic tree was visualized using Figtree (v. 1.4.4) (http://tree.bio.ed.ac.uk/software/figtree/) (Poon et al., 2010).
3 Results
3.1 Features of the G. forrestii mitochondrial genome
We generated 13G data from the PacBio platform to assemble the mitochondrial genome of G. forrestii. The mitochondrial genome of G. forrestii is a circular molecule of 606,853 bp in length (Figure 1). The genome has a GC content of 44.77% and an AT content of 55.23%. A total of 70 genes were identified, including 31 tRNA genes (2,307bp), 3 rRNA genes (5,174bp), 35 protein-coding genes (PCGs) (31,065bp), and 1 pseudogene (7,481bp). The mitochondrial genome was deposited onto GenBank with the accession number of CRR1274107.
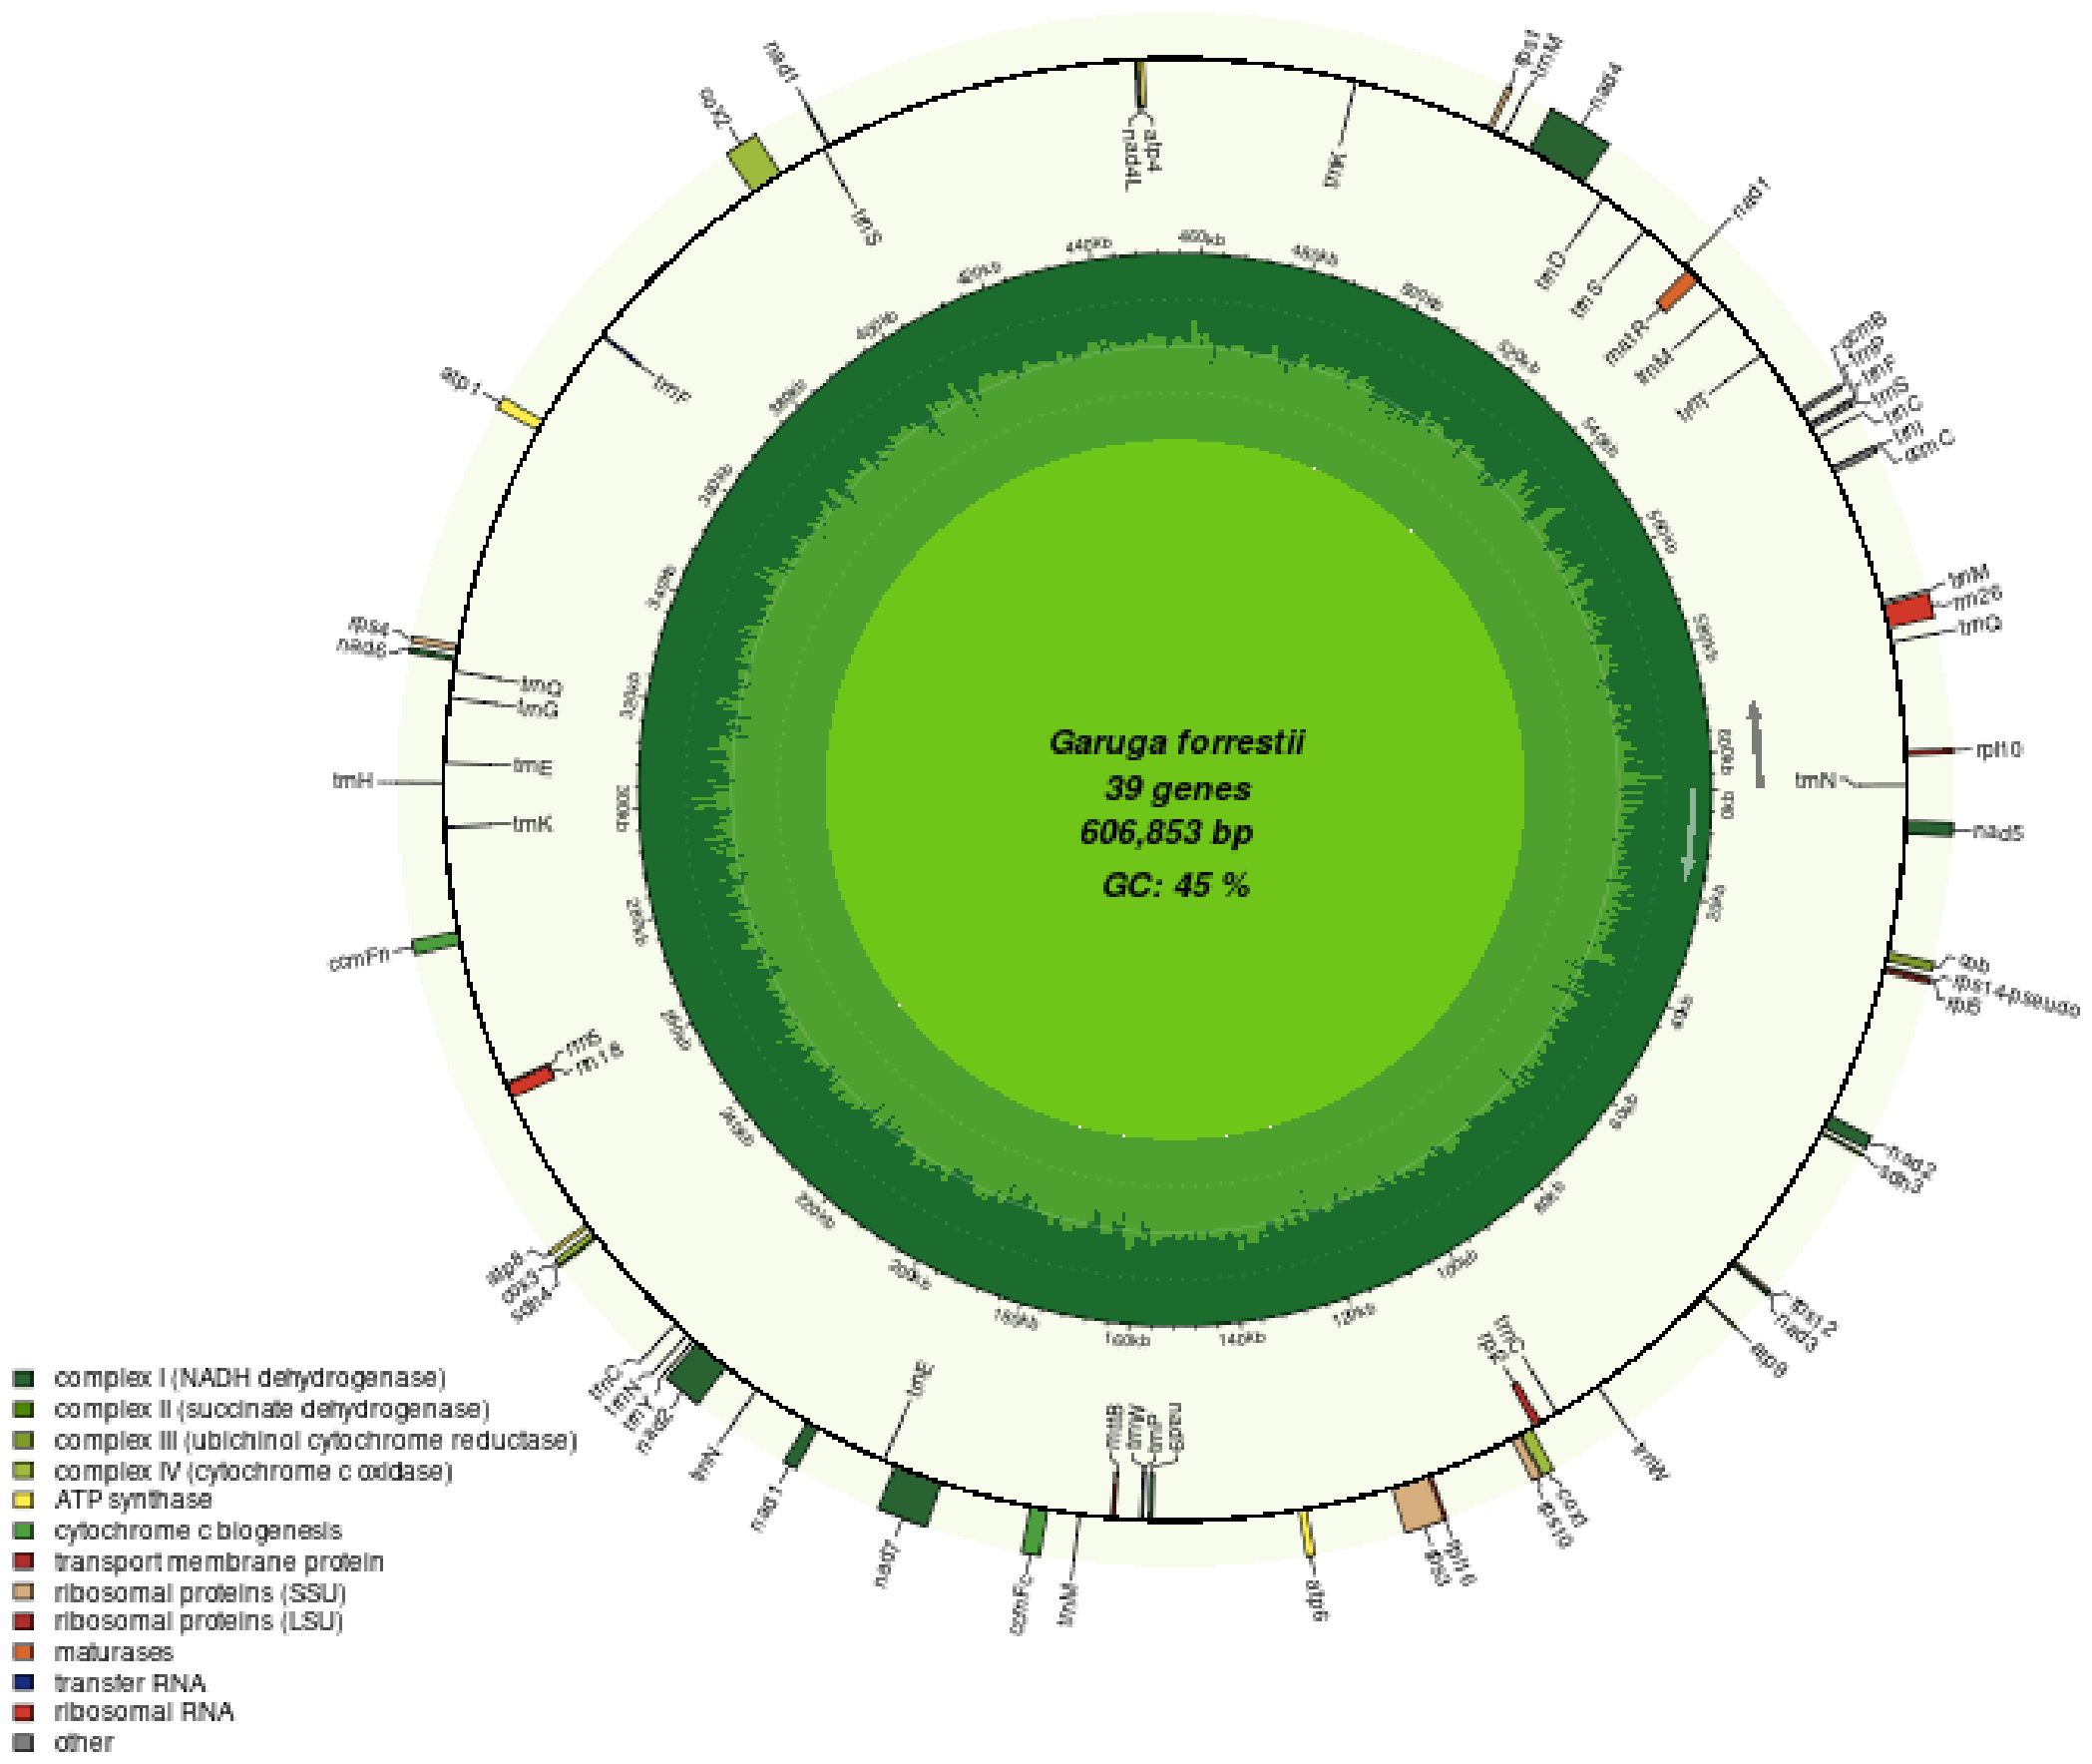
Figure 1. Mitochondrial genome map of G. forrestii. Genes transcribed in the clockwise direction are located on the inner circle, while those transcribed counterclockwise are on the outer circle. The innermost light green ring indicates the GC content across the genome.
The encoded proteins can be divided into 26 core mitochondrial genes (which typically refer to genes that are directly involved in mitochondrial energy production and basic biological functions) and 9 non-core mitochondrial genes. The core mitochondrial genome of G. forrestii includes 5 ATP synthases, 4 cytochrome c biosynthesis enzymes, 1 ubiquinol cytochrome c reductase, 3 cytochrome c oxidases, 9 NADH dehydrogenases, 1 maturation enzyme, 1 membrane transport protein, and 2 succinate dehydrogenases. The non-core mitochondrial genes consist of 4 large subunit ribosomal proteins (LSU) and 5 small subunit ribosomal proteins (SSU). The mitochondrial genome of G. forrestii exhibited multiple copies of several genes (Table 1). There were 4 copies of trnM-CAT in Transfer RNAs, 3 copies each of trnC-GCA and trnN-GTT, and 2 copies each of trnE-TTC, trnK-TTT, trnP-TGG, and trnQ-TTG. we identified multiple introns across all mitochondrial genes, including 4 introns in NADH dehydrogenase (nad1, nad2, nad5, nad7), 3 introns in NADH dehydrogenase (nad4), and 1 intron each in Cytochrome c biogenesis (ccmFc), Cytochrome c oxidase (cox2), Ribosomal proteins (rps10, rps3), and Transfer RNAs (trnF-GAA, trnI-TAT). a pseudogene of Small Subunit Ribosomal Protein (rps14) was also observed.
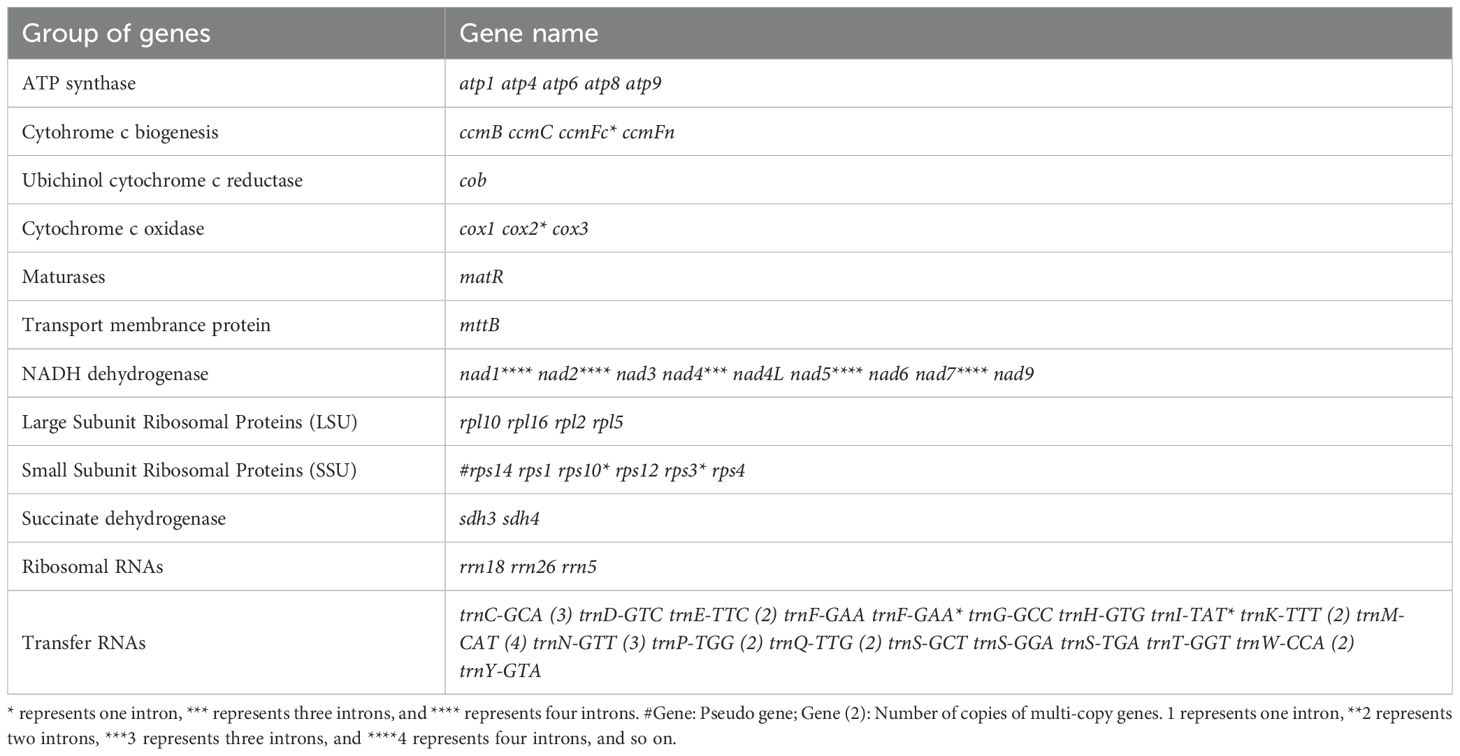
Table 1. Gene composition in the mitogenome of G. forrestii..
3.2 Repetitive sequence and codon usage analysis
A total of 484 SSR loci were identified (Figure 2A), including 232 simple repeats, 209 dispersed repeat sequences, and 43 tandem repeat sequences. The total length of the repeat sequences is 20,041 bp, account for 3.30% of the mitochondrial genome. The total length of tandem repeats is 910 bp, comprising only 0.15% of the mitochondrial genome. Among the different types of repeat sequences, tandem repeats are the least common at 8.88%, while simple repeats are the most prevalent, comprising 47.93%. We identified 232 SSR loci in the G. forrestii mitochondrial genome: 69 monomers, 49 dimers, 36 trimers, 59 tetramers, 13 pentamers, and 26 hexamers (Figure 2B). Monomers and tetramers were the most abundant, together accounting for 55.17% of the total SSRs. Pentamers and hexamers were the least frequent, comprising only 8.18%. We detected 209 dispersed repeat sequences of 30 bp or more, with the longest of 966 bp, including 120 palindromic repeats and 89 reverse repeats. 43 tandem repeats were identified, ranging from 12 to 51 bases; 18 showed a 100% match rate, the lowest was 78%, and over half exceeded 90% (Figure 2C; Supplementary Tables 2, 3).
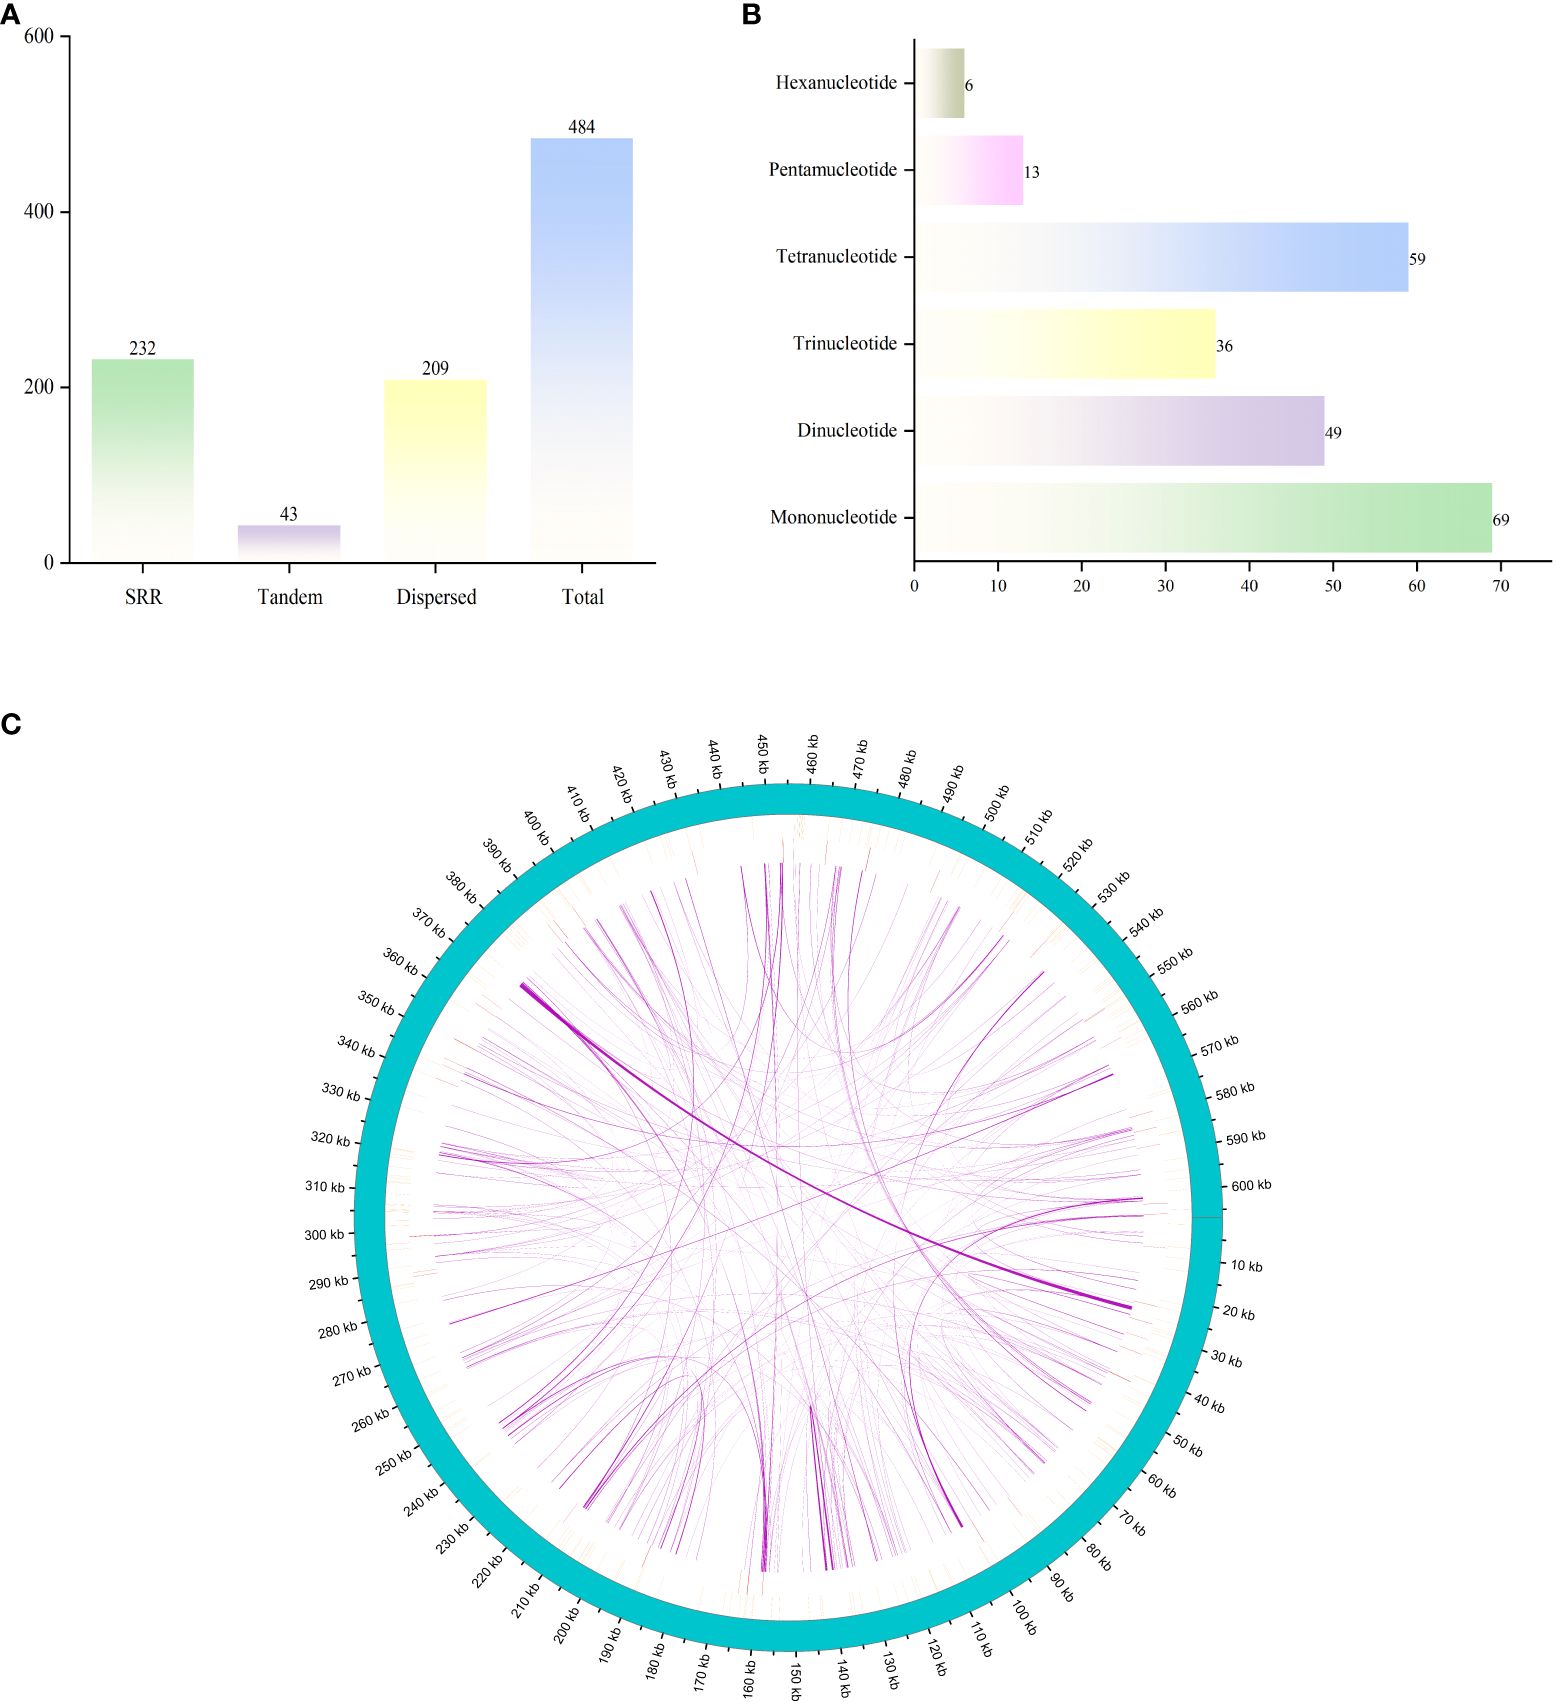
Figure 2. Distribution of repetitive sequences in the mitochondrial genome of G. forrestii. (A) Types and numbers of repetitive sequences. (B) Distribution of simple sequence repeats. (C) Positions of repetitive sequences along the genome. The outermost sky-blue circle represents the genome scale. Simple repeats are shown in blue, tandem repeats in red, and dispersed repeats in the innermost circle.
A total of 20 types of amino acids (excluding stop codons) and a total of 10,355 codons were found in the mitochondrial genome of G. forrestii. The main start codon is AUG, with an RSCU value of 1, while the stop codons are UAA, UGA, and UAG. Each amino acid can be encoded by multiple codons. The three most commonly used amino acids are leucine (Leu), serine (Ser), and arginine (Arg), each with 6 codons. In contrast, tryptophan (Trp) and methionine (Met) each have only 1 codon (Figure 3). The RSCU value measures codon usage frequency, with values greater than 1 indicating higher-than-expected usage. In this genome, 12 amino acids have RSCU values greater than 1, including Asp (GAU), Glu (GAA), His (CAU), Ile (AUU), Leu (UUA), Asn (AAU), Gln (CAA), Arg (AGA), Ser (UCU), Thr (ACU), and Tyr (UAU). Additionally, there are 34 amino acids with RSCU values less than 1 (Supplementary Table 4).
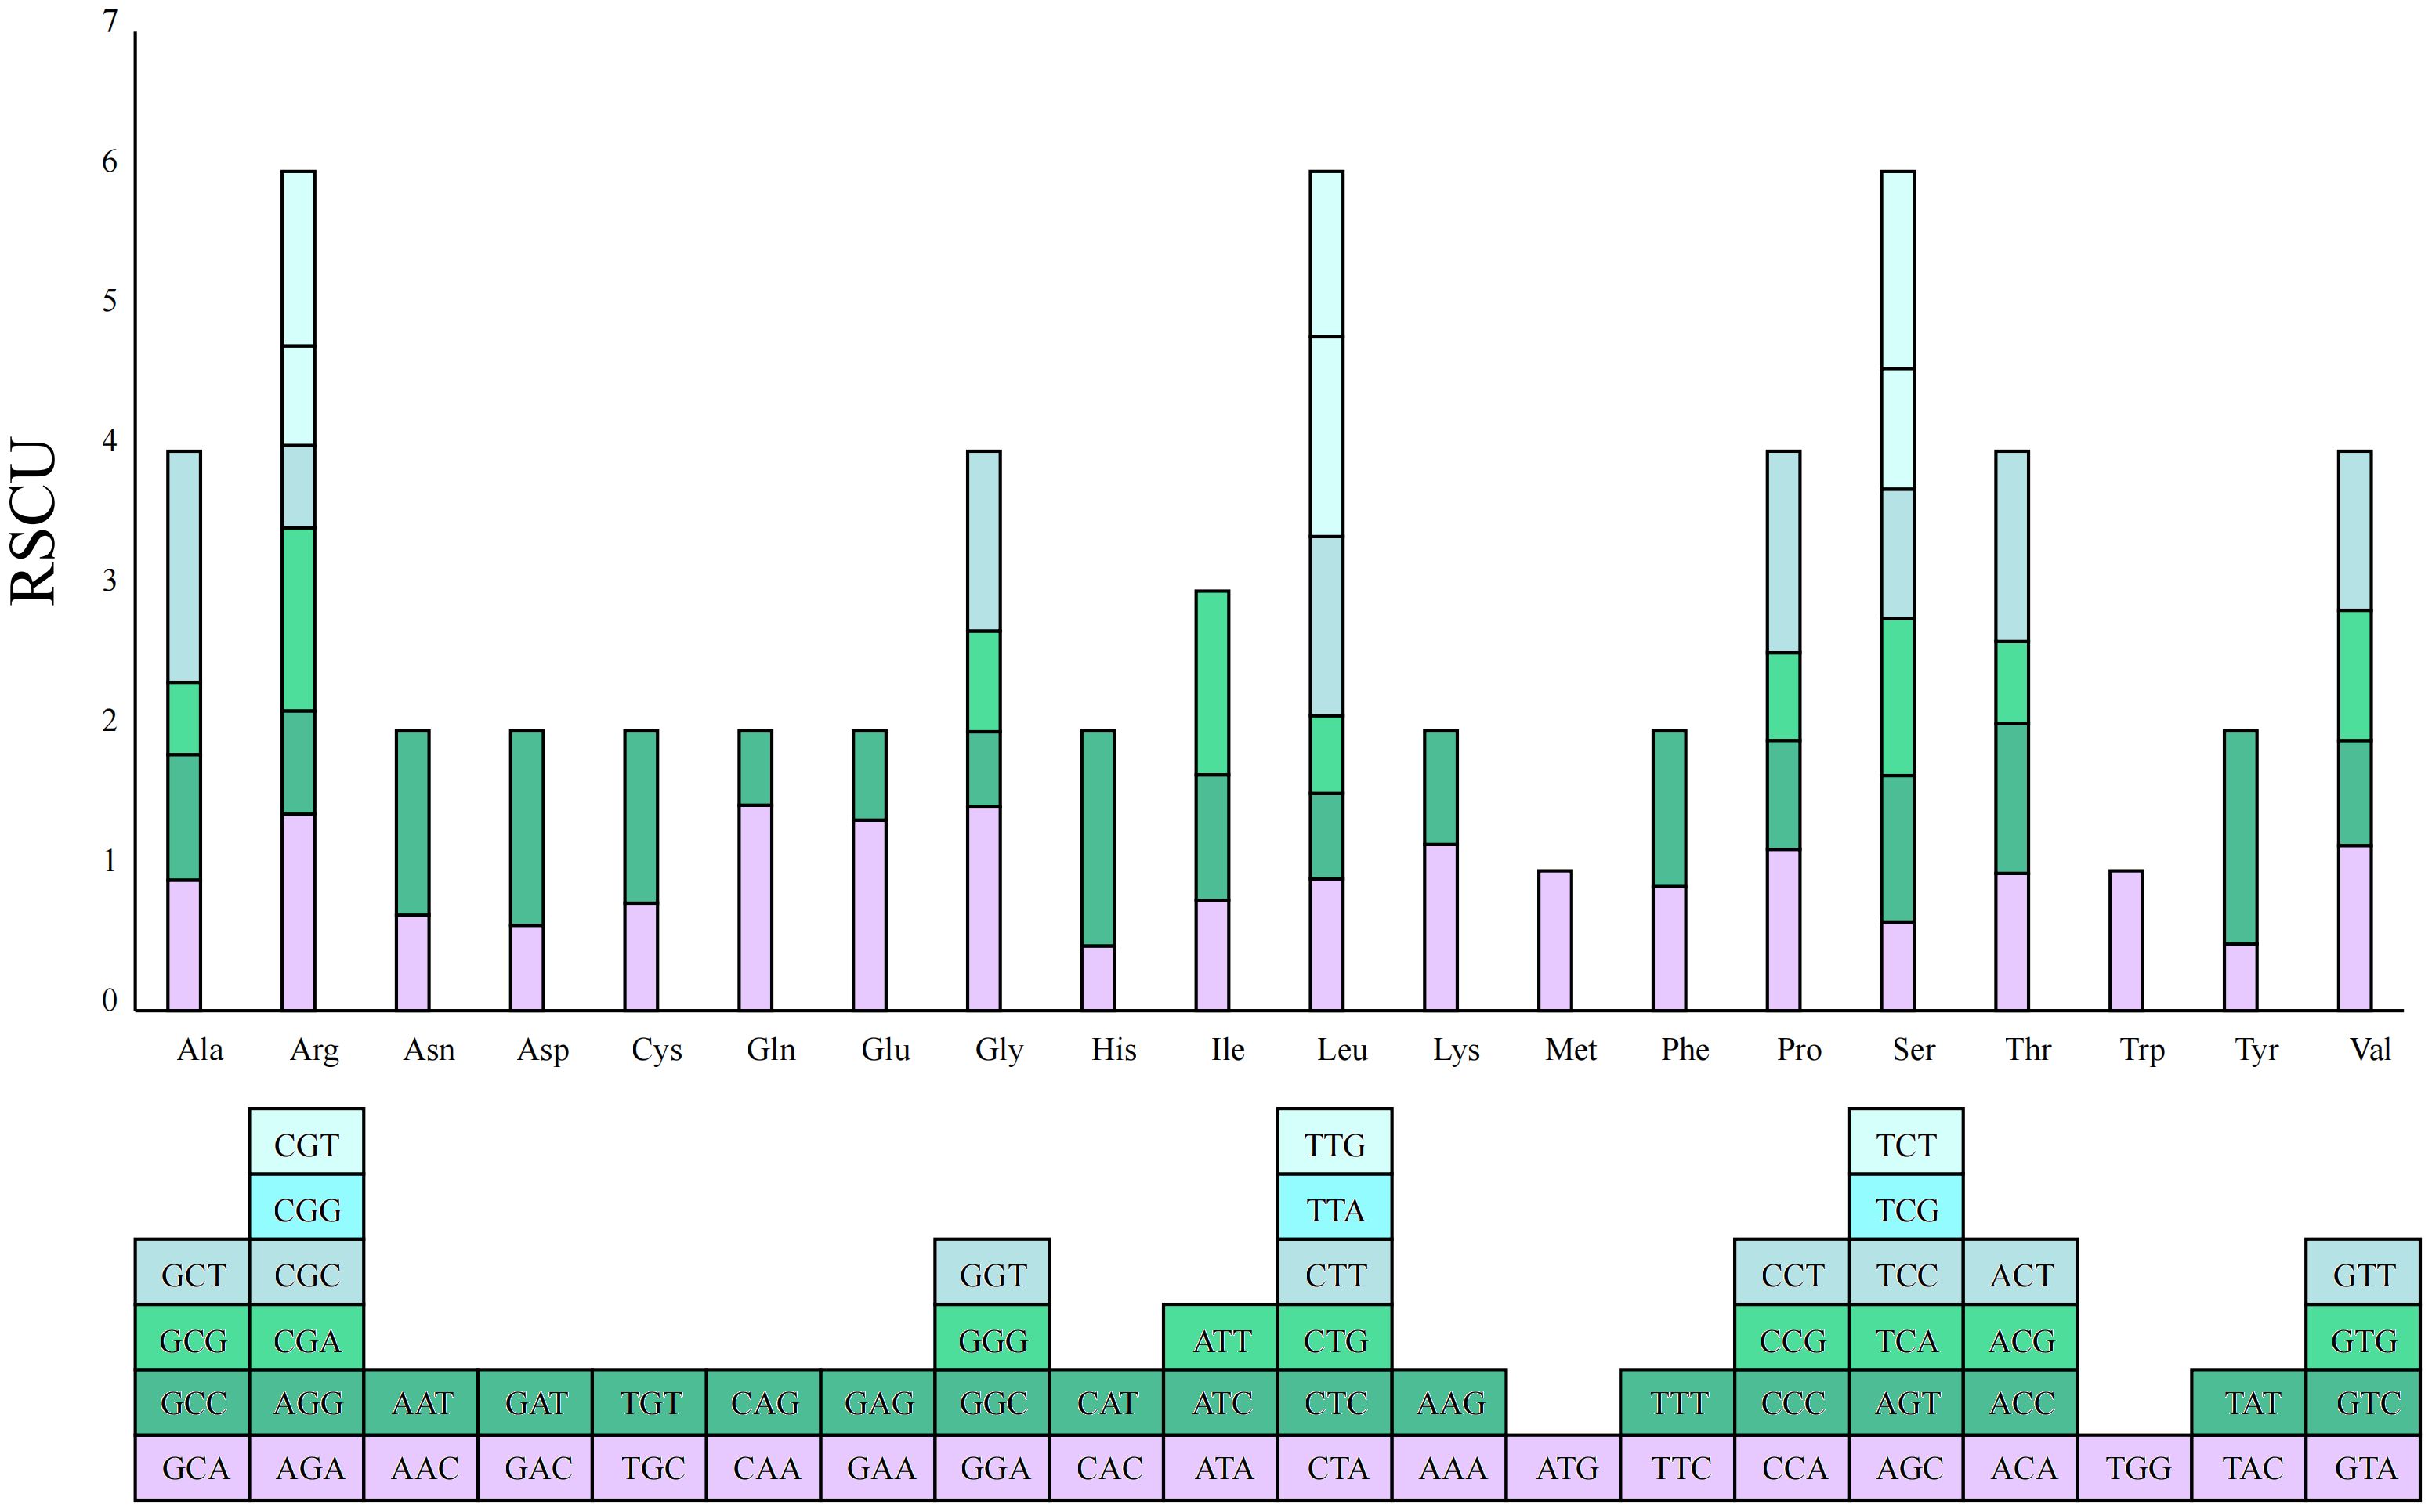
Figure 3. RSCU values for the G. forrestii mitochondrial genome. The X-axis represents the amino acids, while the RSCU values reflect the observed frequency of each codon relative to its expected frequency under uniform synonymous codon usage.
3.3 RNA editing events
We identified 476 RNA editing sites across 33 protein-coding genes (PCGs) in the mitochondrial genome of G. forrestii (Supplementary Table 5). Among the 33 PCGs, nine genes have over 20 RNA editing sites: atp6, ccmB, ccmC, ccmFn, nad1, nad2, nad4, nad5, and nad7. Eleven genes have more than 10 RNA editing sites: atp4, ccmFc, cob, cox1, cox2, cox3, matR, mttB, nad4L, nad6, and rps4. The remaining 13 genes contain fewer than 10 RNA editing sites (Figure 4A).
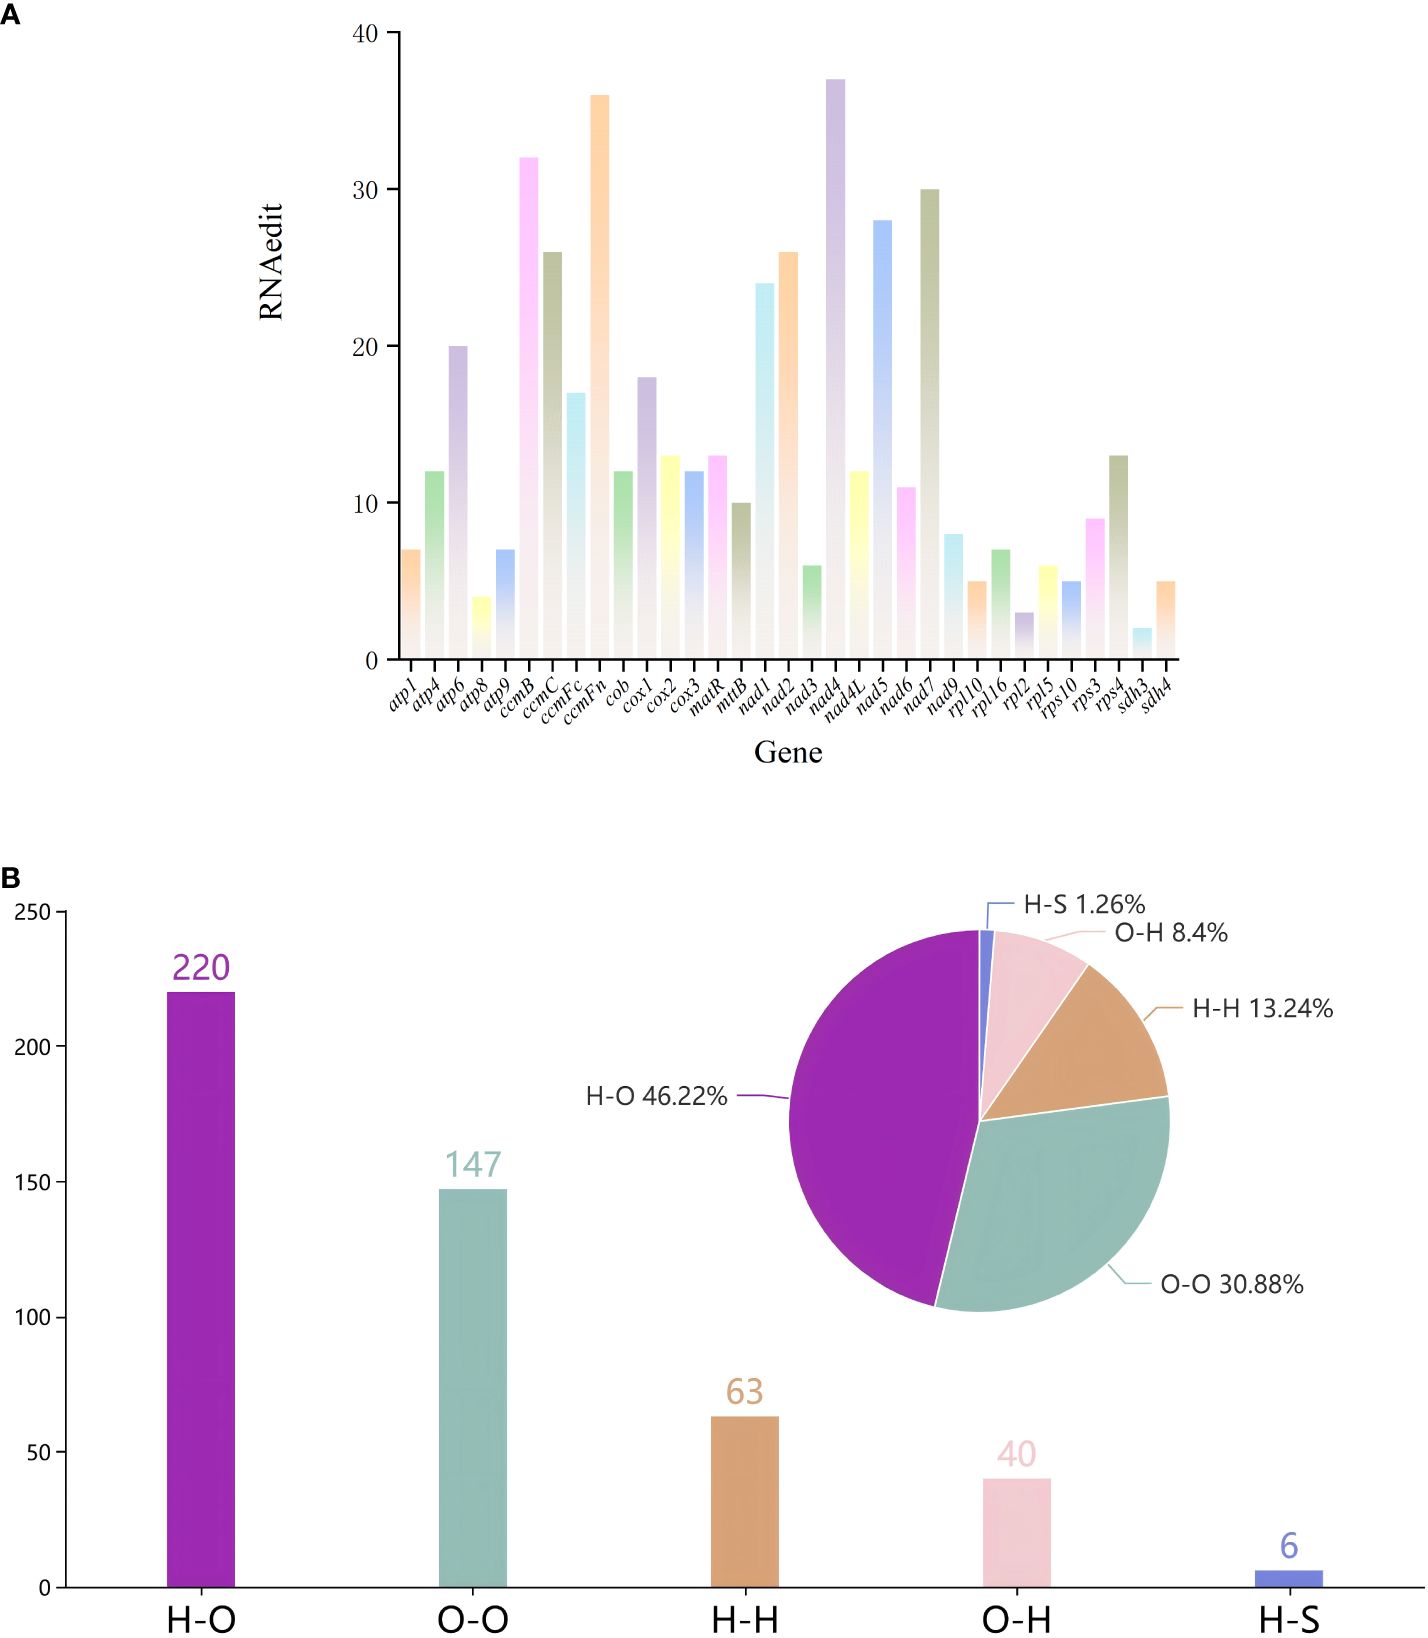
Figure 4. RNA editing events in the mitochondrial genome of G. forrestii. (A) Number of RNA editing sites in all PCGs. (B) Types of amino acid substitutions resulting from RNA editing: H-H, Hydrophilic-Hydrophilic; H-O, Hydrophilic-Hydrophobic; H-S, Hydrophilic-Stop; O-H, Hydrophobic-Hydrophilic; and O-O, Hydrophobic-Hydrophobic.
All the 476 RNA editing sites revealed four major types of editing. Hydrophilic-hydrophilic editing occurred 63 times, accounting for 13.24% of the total. Hydrophilic-hydrophobic editing was the most frequent, occurring 220 times, of 46.22% of the total. This type of editing substitutes a hydrophilic amino acid with a hydrophobic one, for example, ACA (threonine, T) is edited to ATA (isoleucine, I). Hydrophilic-stop editing appeared 6 times, accounting for 1.26% of the total. Hydrophobic-hydrophilic editing was observed 40 times, comprising 8.40% of the total. Hydrophobic-hydrophobic editing occurred 147 times, representing 30.88% of the total (Figure 4B; Supplementary Table 6).
3.4 Collinearity among the mitochondrial genomes
In our analysis of the homologous regions within the mitochondrial genome of G. forrestii and eight other species, we noted significant differences in the arrangement of these regions. Using G. forrestii as a reference, the proportion of homologous sequences in the other species ranged from 25.69% to 39.26%, with lengths varying between 160,667 and 244,984 base pairs (Supplementary Table 7). G. forrestii exhibits a high degree of similarity with Spondias tuberosa and Spondias mombin, suggesting a stronger genetic relationship between these species. Conversely, when examining each species individually, Nitraria tangutorum demonstrated an impressive similarity of 46.73% to G. forrestii, indicating a robust differentiation and close evolutionary relationship. Other species such as Citrus maxima and Limonia acidissima displayed relatively low levels of similarity, highlighting their more distant genetic connections to G. forrestii (Figure 5).
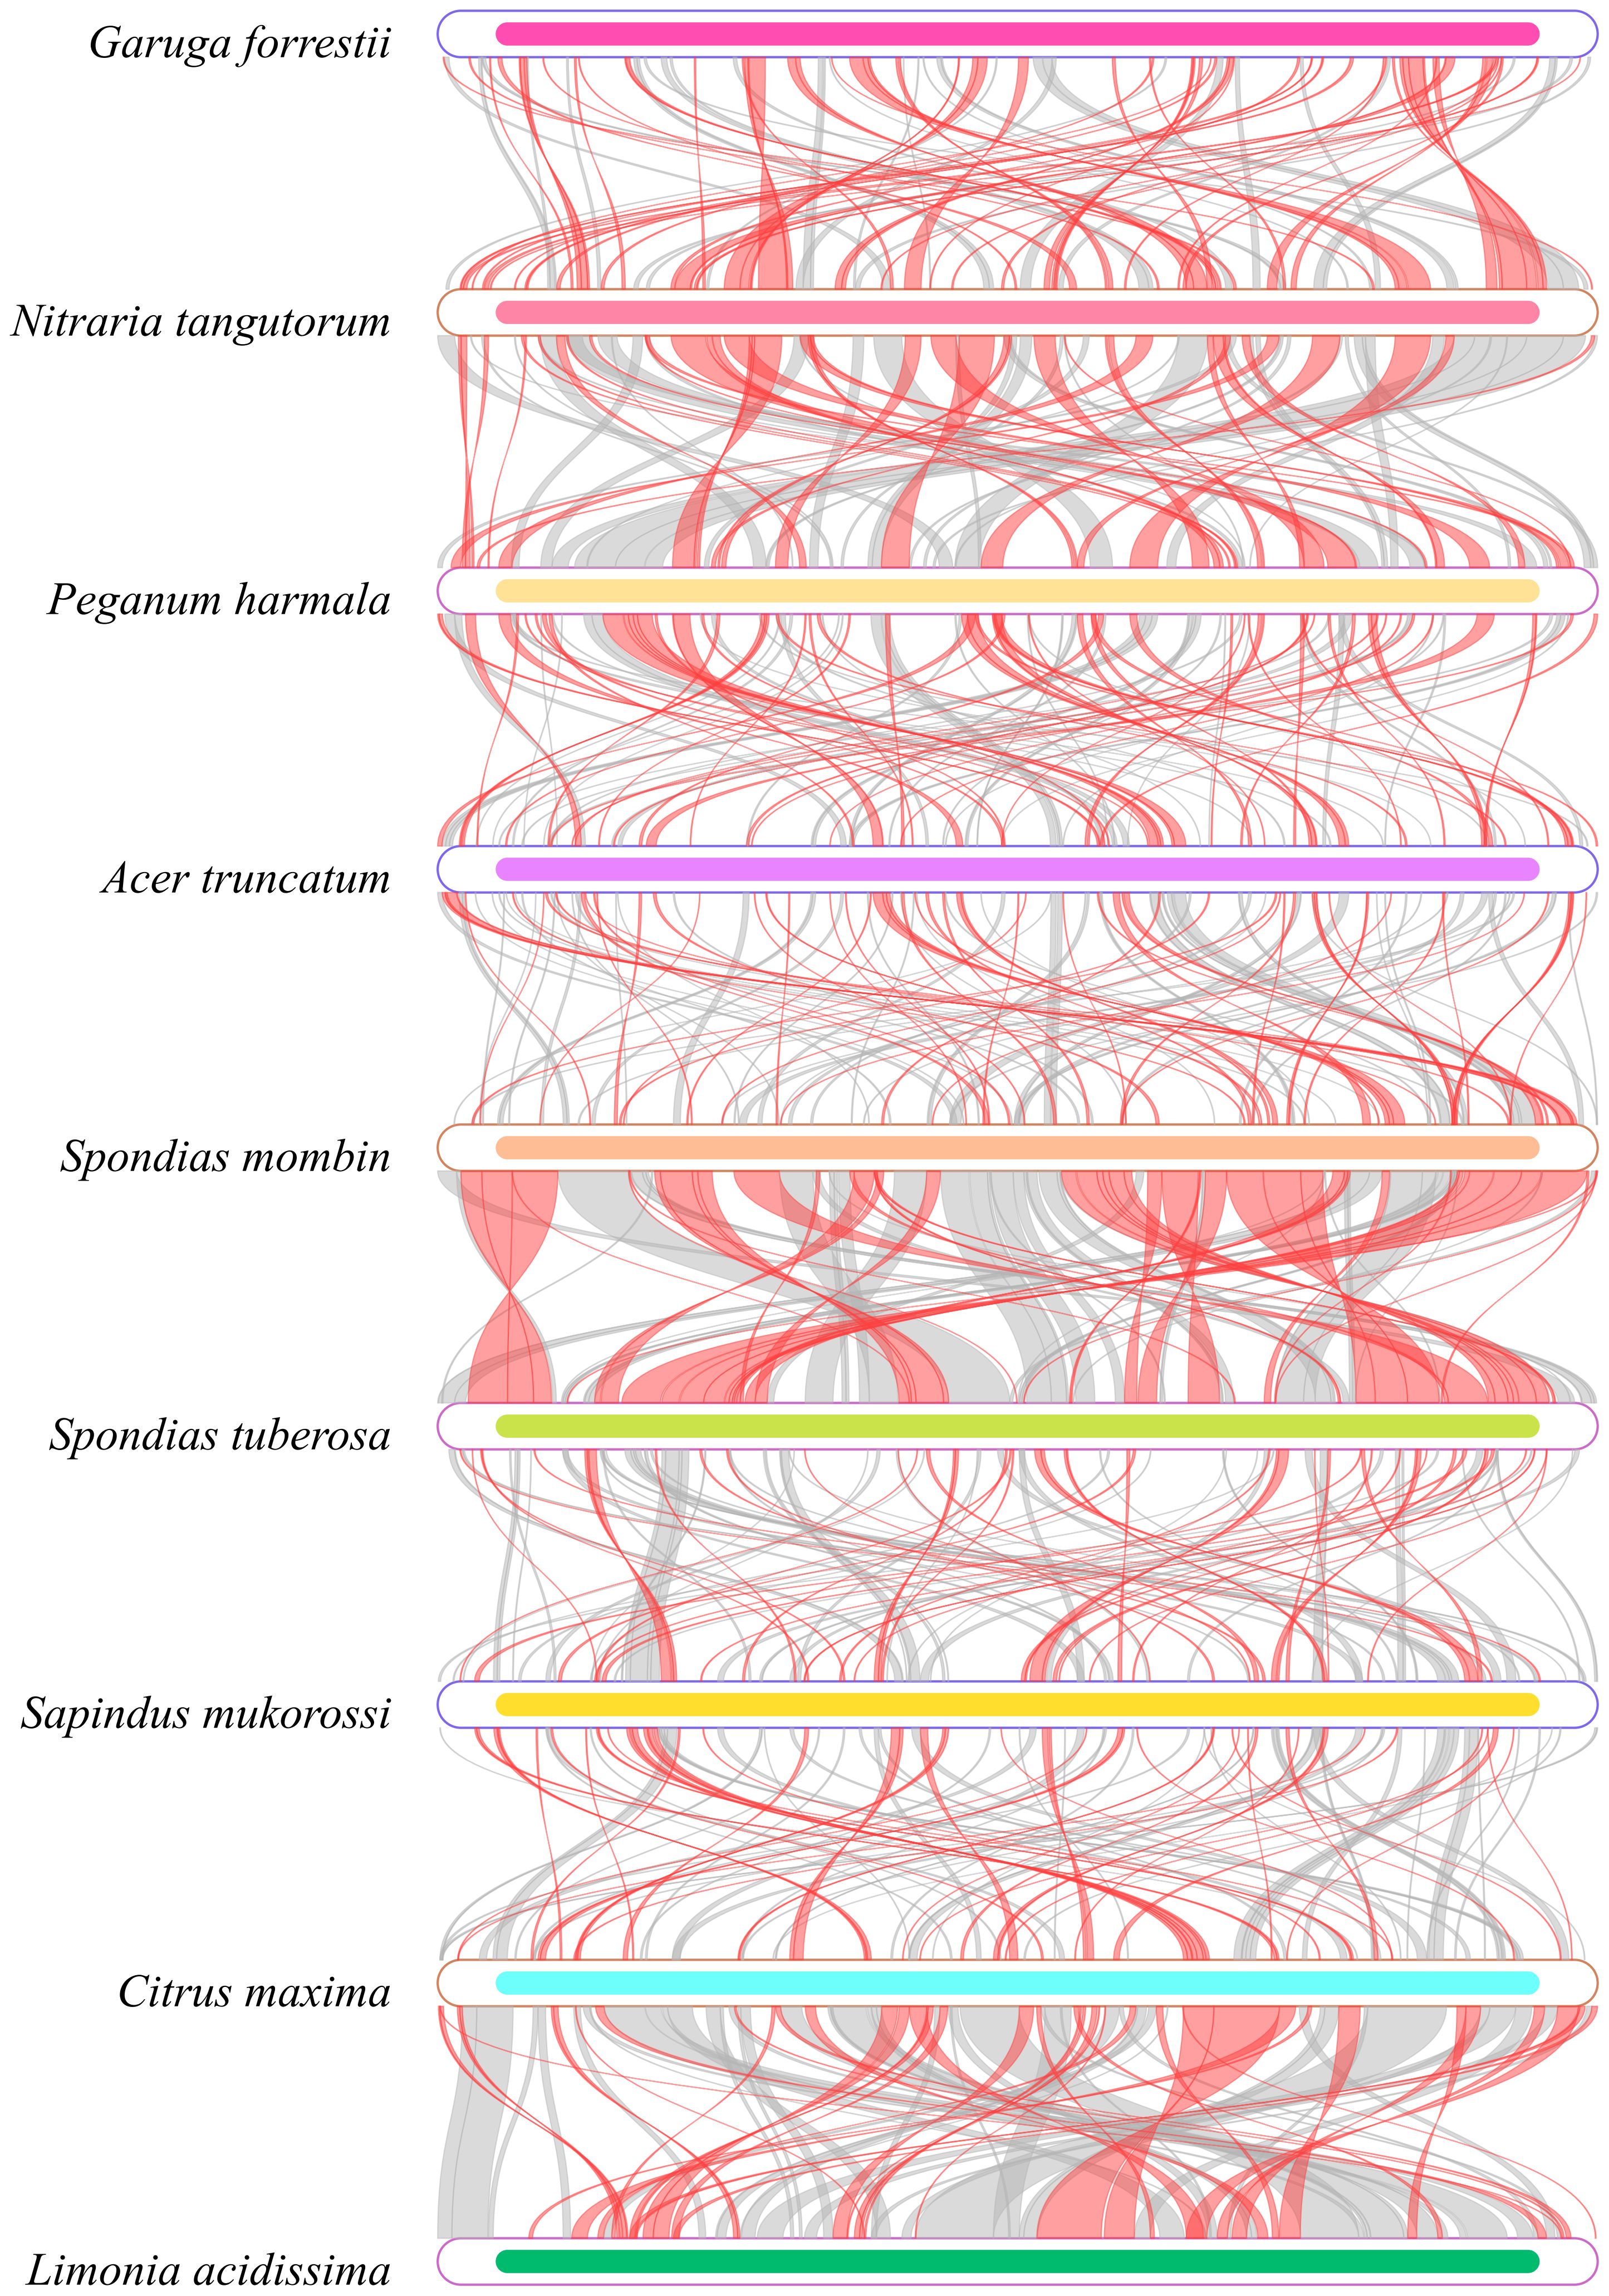
Figure 5. Homology map of the G. forrestii genome compared to related species. Boxes represent genomes, with connecting lines showing homologous regions. Red arcs indicate inversions, and gray arcs denote high homology.
3.5 Homologous fragments
In the mitochondrial and chloroplast genomes of G. forrestii, we identified 49 homologous fragments with a total length of 37,937 bp (Supplementary Table 8). The proportion of homologous sequences in the chloroplast genome was 22.93%. Genes completely located within these homologous sequences include various tRNA genes and functional genes (such as atpE, psbD, accD). Genes partially located within the homologous sequences and their proportions include ndhC (62.81%), rbcL (71.29%). In the mitochondrial genome, the proportion of homologous sequences was 5.05%, with genes completely located in these sequences including tRNA genes (such as trnM-CAT, trnT-GGT). Genes partially located within the homologous sequences and their proportions include rrn18 (43.72%) and trnN-GTT (98.61%) (Figure 6; Supplementary Table 9).
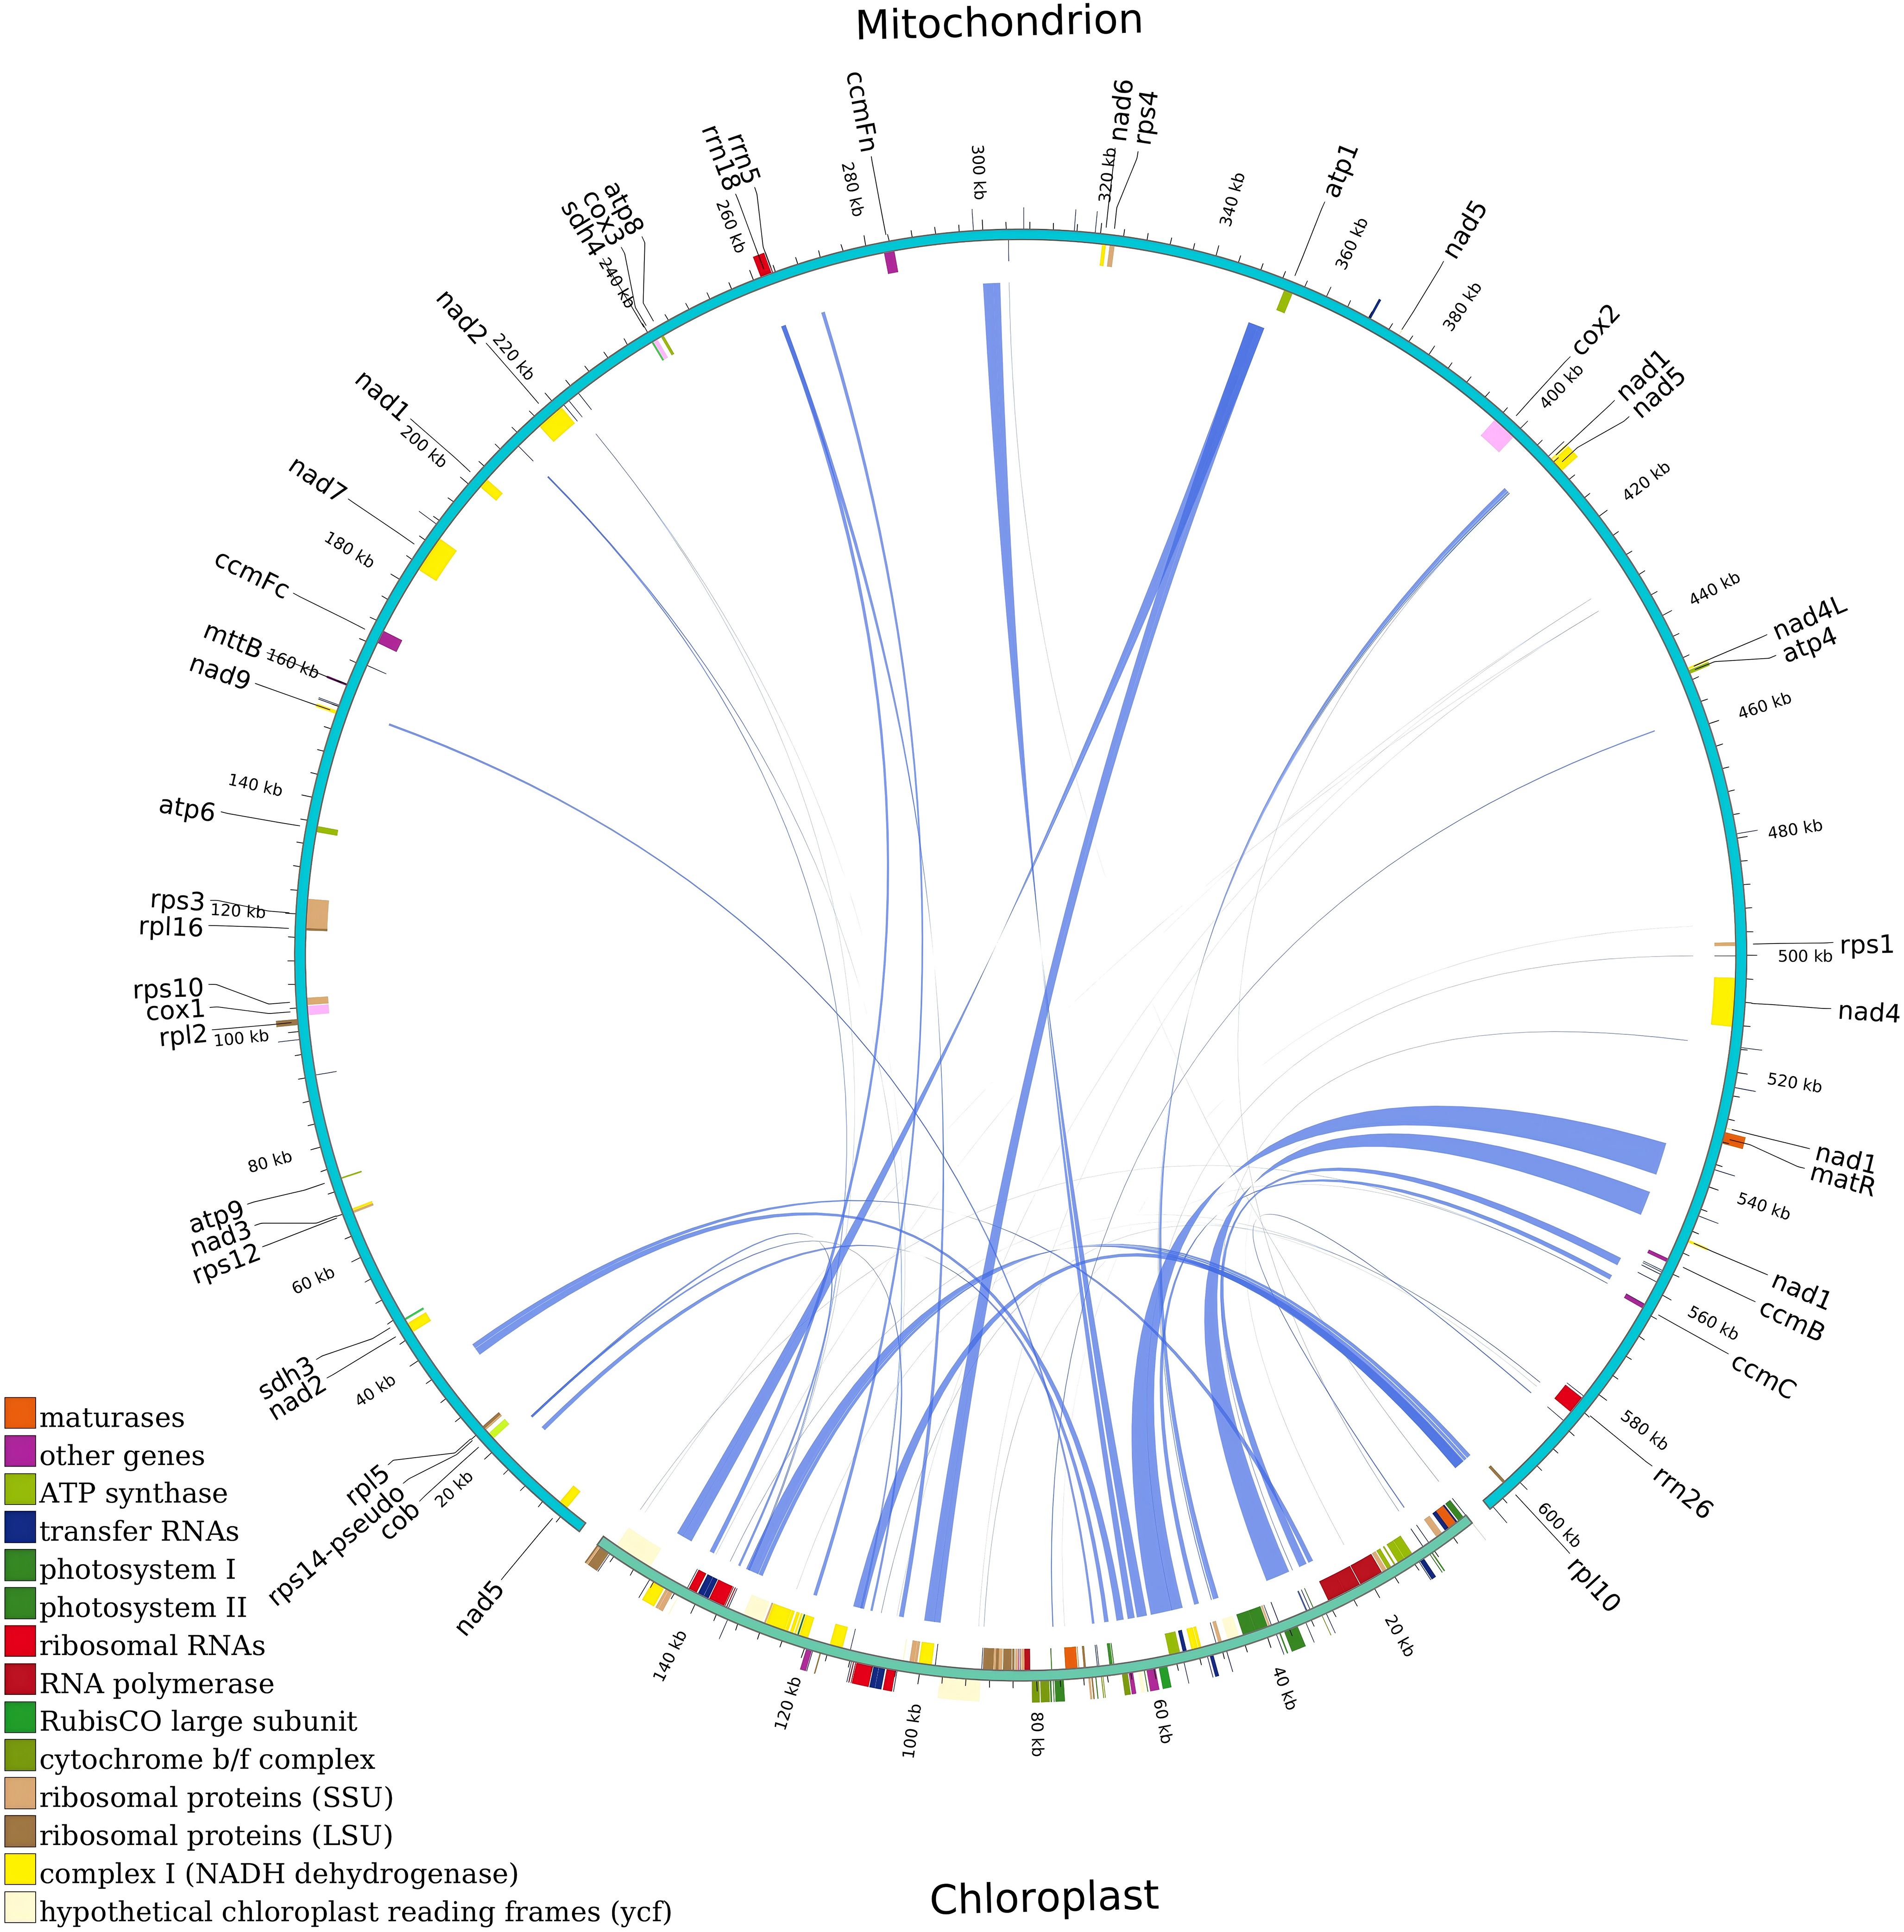
Figure 6. Homologous fragments of chloroplast and mitochondrial gene sequences in G. forrestii. Chloroplast and mitochondrial sequences are marked, with homologous genes from the same complex shown in the same color. Connecting lines represent homologous sequences.
3.6 Nucleotide diversity and selection pressure (Ka/Ks) analysis
The variable region lengths of G. forrestii ranged from 123 to 3256 bp, and the total number of mutations varied from 2 to 132. Most genes were found to have Pi values below 0.040, with the highest recorded in rps1 (0.046) and the lowest in nad4L (0.005). A total of 21 genes were identified with mutations exceeding the average of 36, with rps3 having the highest count of 132, and rrn5 the lowest count of 2. 15 genes were found to have lengths exceeding the average of 1075 bp, with rrn26 being the longest (3256 bp) and rrn5 the shortest (123 bp) See (Figures 7A, B).
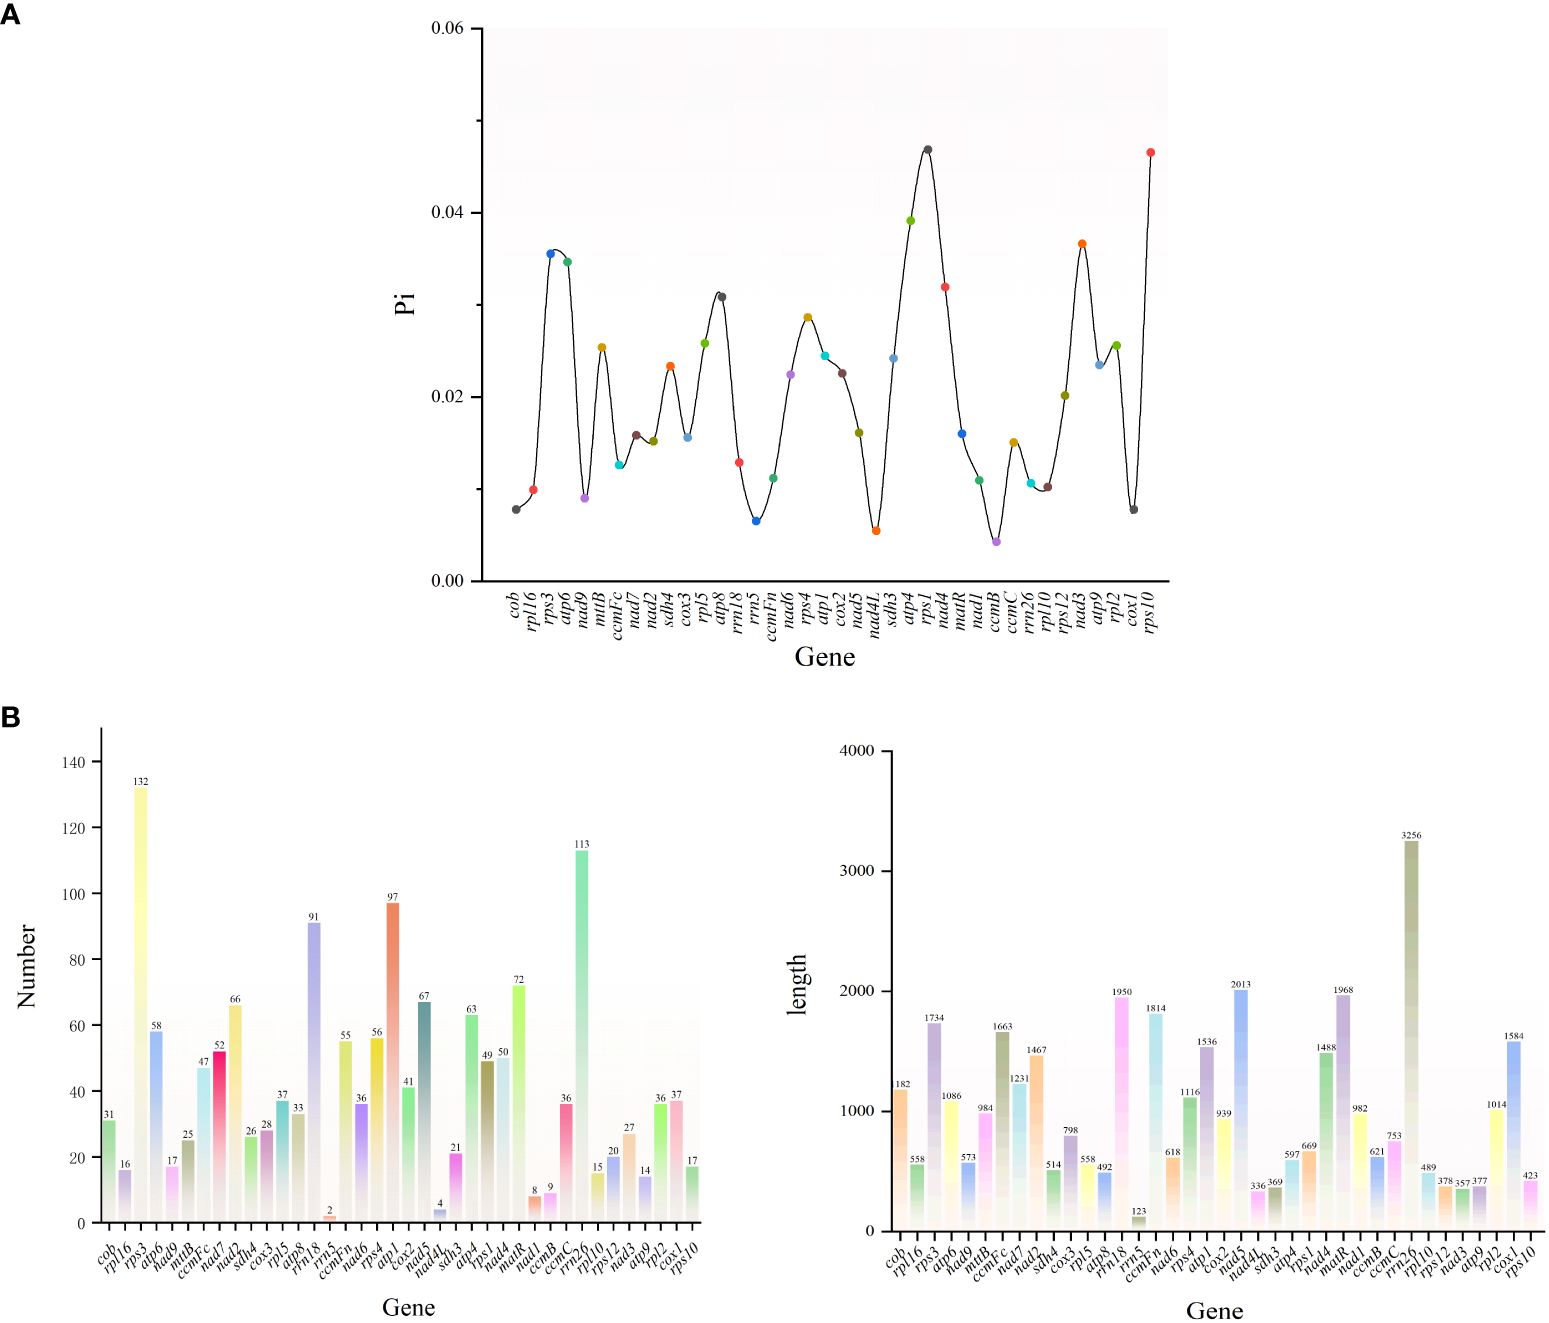
Figure 7. (A) Nucleotide diversity (Pi) of the mitochondrial genome of G. forrestii. (B) Genes of the mitochondrial genome of G. forrestii, showing the number and relative lengths of each gene.
To assess the evolutionary selective pressures on mitochondrial protein-coding genes (PCGs) in closely related species, we calculated the ratio of nonsynonymous substitutions (Ka) to synonymous substitutions (Ks) (Ka/Ks). In the analysis of 35 PCGs from G. forrestii and 8 other Burseraceae species, most genes showed evidence of purifying selection (Ka/Ks < 1), suggesting that conservative evolutionary pressures were dominant. However, several genes, such as matR, nad3, rps1, rps12, and rps4, exhibited Ka/Ks ratios greater than 1, indicating their involvement in specific adaptive evolutionary processes (see Figure 8). Notably, the cox1 gene displayed the lowest Ka/Ks value (0.067) across all species examined, indicating that it has experienced strong purifying selection and remains highly conserved throughout evolution.
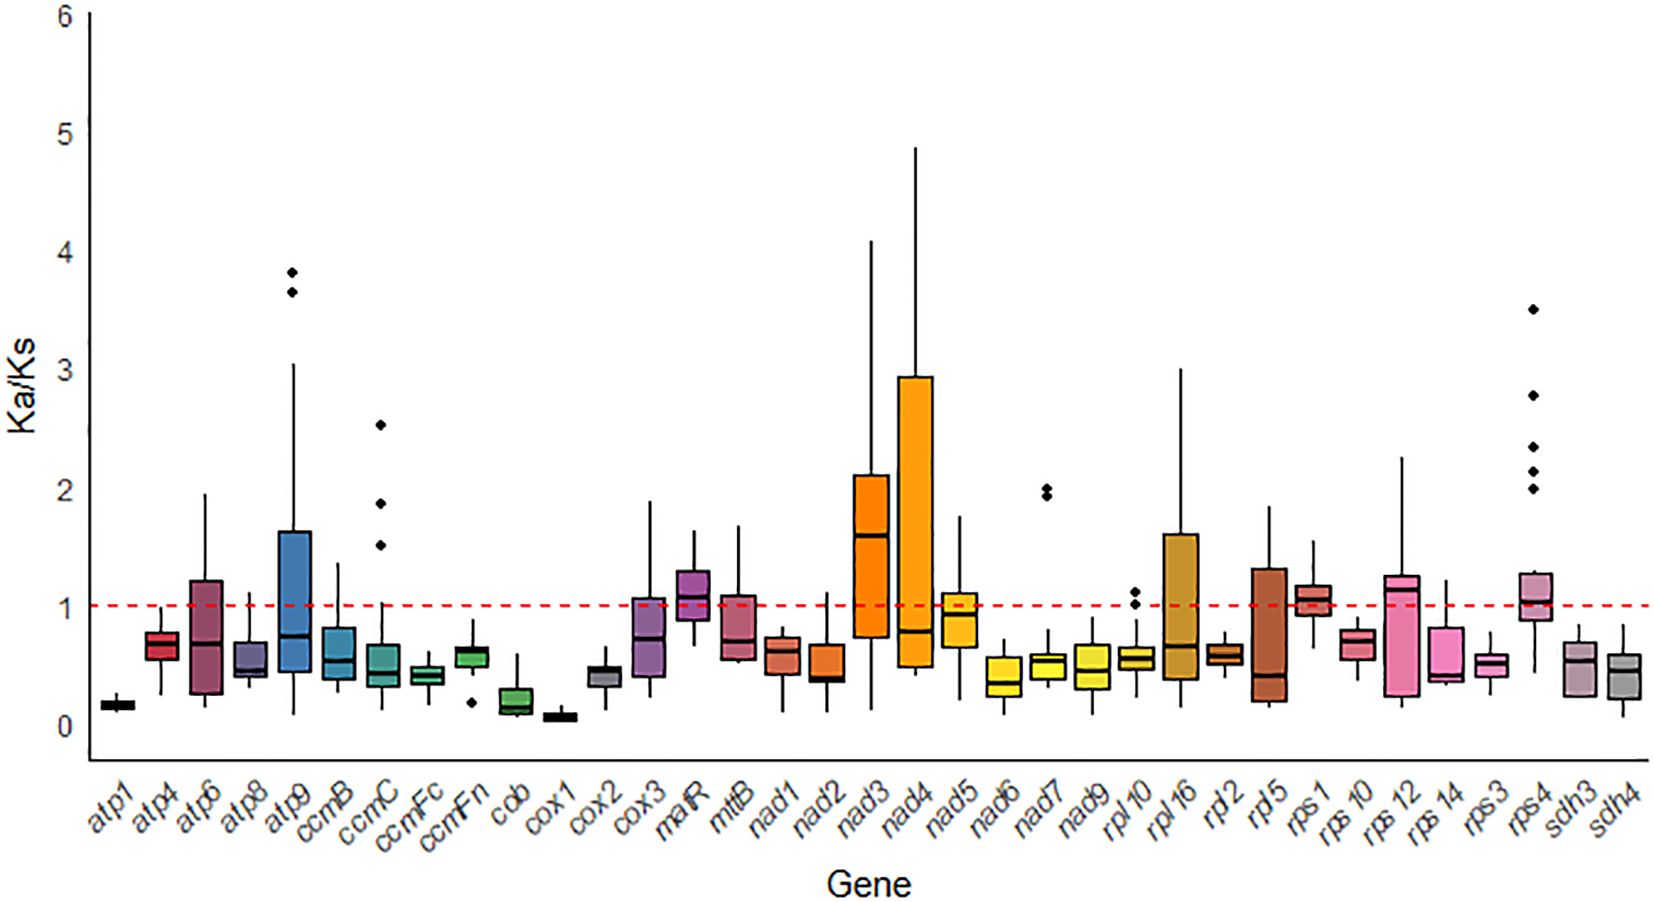
Figure 8. Box plot of pairwise Ka/Ks ratios for mitochondrial genes across eight Sapindales species.
3.7 Phylogenomic of mitochondrial
Phylogenetic analysis was performed for 15 species in the Sapindales order, with Rosaceae as the outgroup (Supplementary Table 1). As shown in Figure 9, Nitraria tangutorum, Peganum harmala were highly supported to cluster at the basal position. Burseraceae (G. forrestii) was determined to be a monophyletic group with a high bootstrap support of 92, indicating a close relationship with Anacardiaceae (Spondias mombin and Spondias tuberosa). Four species in the Rutaceae family (Citrus maxima, Citrus unshiu, Citrus sinensis, and Limonia acidissima) all had bootstrap support of 100. The mitochondrial phylogenetic genome tree was consistent with the topology of APG IV.
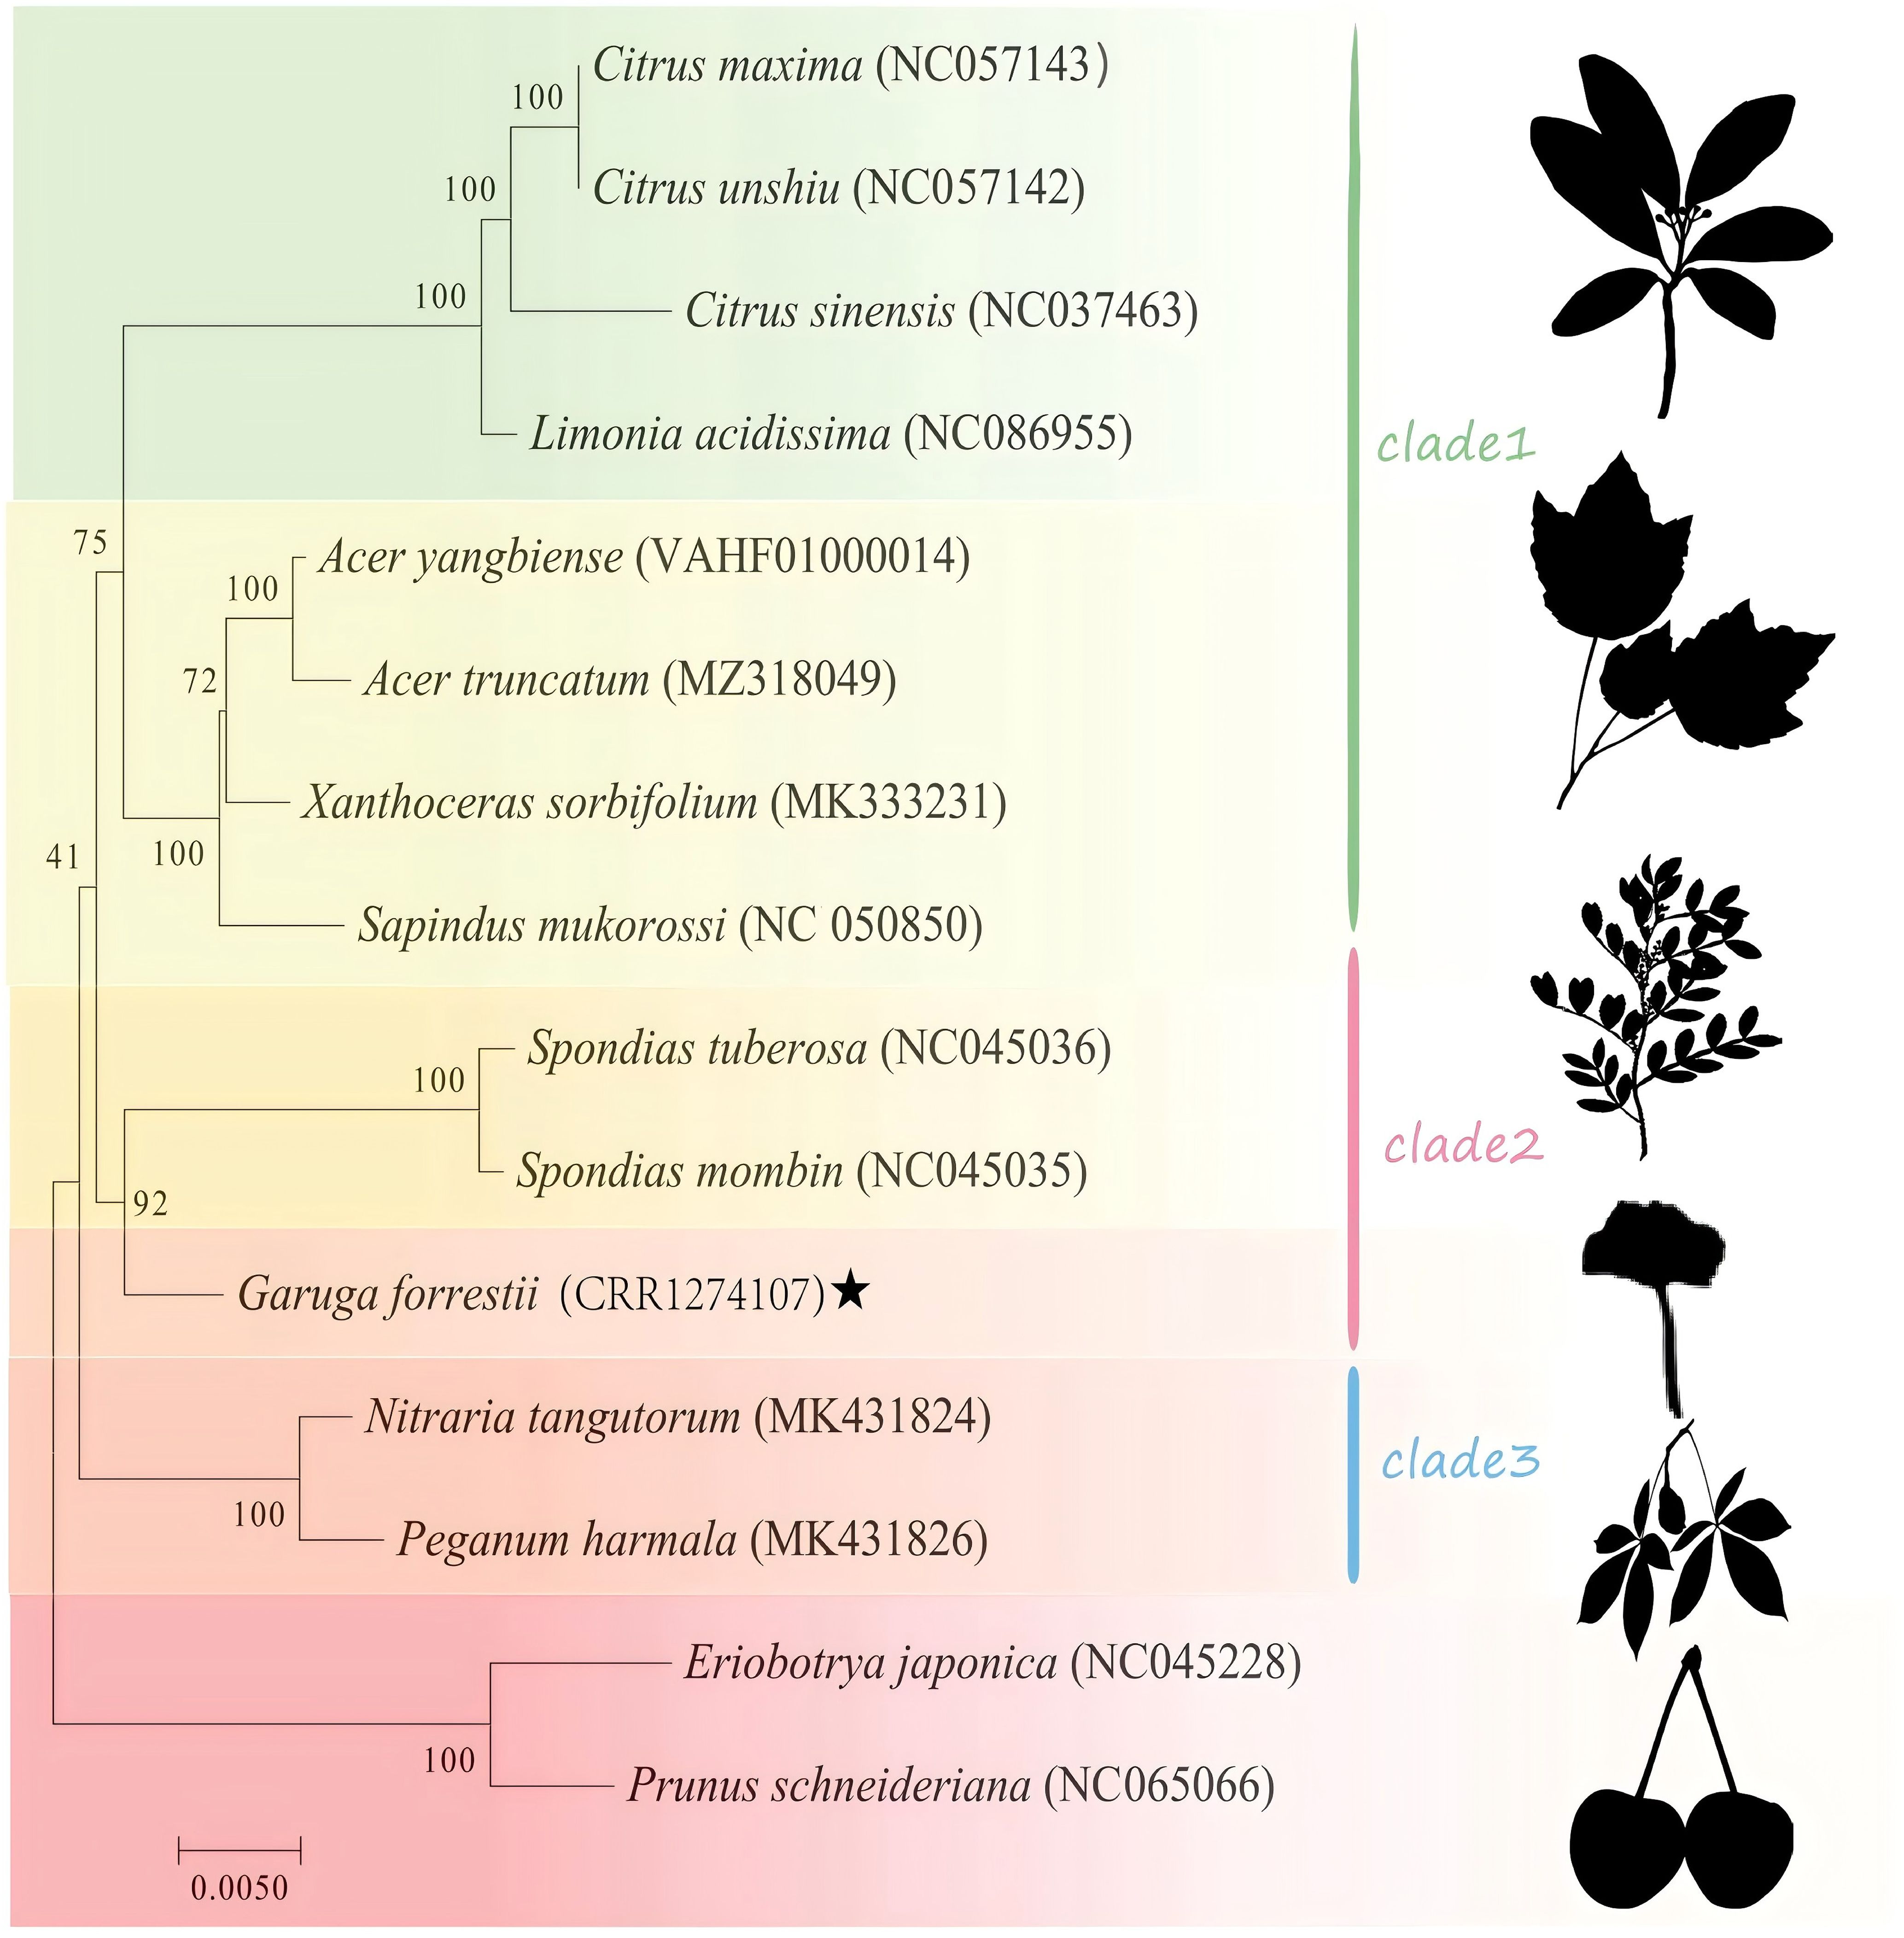
Figure 9. Phylogenetic tree of mitochondrial genes for 15 species, with bootstrap support values shown as percentages from 1,000 replicates. Species within the same family are indicated by the same color block, with G. forrestii highlighted by ★.
4 Discussion
4.1 Features of mitochondrial genome of G. forrestii
Mitochondria are the energy-producing organelles in plants, essential for supporting vital life processes. Plant mitochondria genomes that are more complex than those of animals, characterized by extensive variation in genome size, sequence organization, repetitive content, and highly conserved coding sequences (Zhou et al., 2022). Due to high recombination frequency, plant mitochondrial genomes exhibit dynamic structures with various conformations within mitochondria, including multiple forms such as master circles, subgenomic circles, and linear molecules. For example, cucumber (Cucumis sativus) possesses three circular molecules (Alverson et al., 2011), whereas rice (Oryza sativa) displays a linear structure (Notsu et al., 2002). In this study, the mitochondrial genome of G. forrestii shows the typical circular structure found in terrestrial plants, with a length of 606,853 bp and a GC content of 45%, similar to Gleditsia sinensis (594,121 bp; 45.3%) (Yang et al., 2021). The plant mitochondrial genome, as a fascinating molecular entity, has sparked widespread research interest regarding how the high variability of its non-coding regions and structural mutations are generated, repaired, retained, and fixed (Wang et al., 2024a). The size of plant mitochondrial genomes varies significantly among different species, with differences reaching up to 200-fold (Wang et al., 2024a). Generally, plant mitochondrial genomes contain a large amount of non-coding DNA sequences, which occupy a substantial proportion of the genome and contribute to its overall size (Shidhi et al., 2021). Among reported plant mitochondrial genomes, the longest is 11.3 Mb (Silene conica) (Gray et al., 2012), while the shortest is 0.66 Mb (Viscum scurruloideum) (Skippington et al., 2015). Compared to the mitochondrial genome lengths of related plants in the Sapindales available in the NCBI database (see Supplementary Table 11), the mitochondrial genome of G. forrestii (606,853 bp) is of moderate size. Furthermore, G. forrestii contains 35 protein-coding genes (PCGs), a number comparable to that of other angiosperms, such as Cymbidium ensifolium (35 PCGs) (Shen et al., 2024).
4.2 Comparative analysis of the mitochondrial genome of G. forrestii
Repeat sequences are commonly found in mitochondrial genomes, including tandem repeats, short repeats, and large repeats (Gualberto et al., 2014; Guo et al., 2017). Previous studies have demonstrated that repetitive sequences are crucial for gene expression and regulation (Shapiro and von Sternberg, 2005). They are also a major driving force for gene diversification and evolution (Lynch and Conery, 2000). We identified 120 forward repeats and 89 reverse repeats, but no complementary or palindromic repeats were found. The existence of these repetitive sequences may play a key role in the structural complexity and evolutionary dynamics of the genome. Over time, these sequences may dynamically alter the structure and conformation of the mitochondrial genome, driving its rearrangement and evolution. We observed duplications in several genes within the mitochondrial genome of G. forrestii, a phenomenon also documented in other species (Yang et al., 2022; Lu et al., 2023). These duplications are thought to arise from horizontal gene transfer (HGT) or mtDNA recombination during evolutionary processes (Yu et al., 2023; Zeng et al., 2024). Previous studies have highlighted that mitochondrial repetitive sequences harbor substantial genetic information and play a critical role in intramolecular recombination (Xu et al., 2013). Notably, the trnM-CAT gene appears four times in the mitochondrial genome of G. forrestii, a pattern also observed in Hippophae tibetana (Zeng et al., 2024), suggesting that this gene may play an important role in the biology of G. forrestii.
RNA editing occurs in the post-transcripe protein folding, which is associated with a decrease in the overall stability of protein structures (Capella-Gutiérrez et al., 2009; Bi et al., 2019). Among the four major editing types internal process of chloroplast (cp) and mitochondrial (mt) genomes in higher plants and can alter the genetic information at the mRNA level, enabling more efficient protein folding (Bi et al., 2016). In our study, we predicted 476 RNA editing sites in the G. forrestii mitochondrial genome, less than that of Oryza sativa (491) (Notsu et al., 2002), more than that of Arabidopsis thaliana (441) (Unseld et al., 1997). We also conducted a search on Google Scholar, retrieving 30 results (Supplementary Table 12). The highest RNA editing events count was 2023, while the lowest was 93, most of values ranging from 400-600, 24 of all 30 reports, 80%. Our results fall within this range, further corroborating the relevance and consistency of our findings. RNA editing recognition is crucial for understanding the mitochondrial genome of G. forrestii. Since RNA editing can alter amino acids, it often changes their physical and chemical properties, thus affecting protein function. In G. forrestii, we found that hydrophilic-hydrophobic and hydrophobic-hydrophobic edits were the most common, accounting for 77.10%. This supports the connection between amino acid hydrophobicity and protein folding, as well as the formation of secondary structures (Li et al., 2016). Nearly 50.00% of the sites are located at the second codon position, with more than half of the amino acids showing hydrophobicity changes (Benson, 1999). The usage frequency (RSCU) of Ala (1.6528 > 1) (Sharp et al., 1986) is significantly higher than that of other amino acids, indicating that it may play a more important role in protein synthesis (Deb et al., 2021). Compared to the first and second codon positions, the third codon position shows a strong A/T bias, containing more compact information sites (Xue et al., 2022), which is commonly observed in the mitochondrial genomes of other plant species (Shidhi et al., 2021). This is considered a result of the long-term evolutionary process by which plants adapt to their environment (Romero, 2000).
Ka/Ks analysis and the comparison of genomic features with other plant mitochondrial genomes help to provide a comprehensive understanding of plant mitochondrial evolution (Ye et al., 2017). Most of the protein-coding genes (PCGs) in G. forrestii show evidence of purifying selection (Ka/Ks < 1) during evolution, indicating that the PCGs in the mitochondrial genome are relatively conserved. Consistent with the evolutionary patterns observed in most angiosperms, most PCGs have undergone neutral and negative selection (Yang and Nielsen, 2000; Bi et al., 2016; Cheng et al., 2021). However, genes such as matR, nad3, rps1, rps12, and rps4 have undergone positive selection during evolution. Positive selection pressure has also been reported in other plant species for genes like matR, nad6, ccmF, ccmB, mttB during evolution (Cheng et al., 2021a; Ni et al., 2022; Ke et al., 2023a; Xia et al., 2023). A low nuclear-tide diversity (Pi < 0.04) indicated limited genetic variation in mitochondrial genome of G. forrestii.
4.3 Homology and phylogeny of the G. forrestii mitochondrial genome
Homologous sequence analysis plays a crucial role in phylogenetic tree construction, providing reliable data support for understanding gene evolutionary history and evolutionary relationships between species (Kapli et al., 2020). Through homology analysis, it is possible to reveal complex ancestral evolutionary trends and independent gene loss patterns (Sjölander, 2004). By combining the genetic distance matrix and homology data of G. forrestii, we found a positive correlation between the homologous regions (Figure 5), with lengths ranging from 160,667 to 244,984. G. forrestii shows a high degree of similarity with Nitraria tangutorum and Peganum harmala, suggesting a close relationship between them. This is consistent with their positions in the APG IV angiosperm phylogenetic tree (Group et al., 2016).
The mitochondrial genome of higher plants evolves slowly and has a low mutation rate (Gray et al., 2012; Wang et al., 2024b), making it an ideal tool for phylogenetic studies (Liu et al., 2013). Mitochondrial DNA sequences serve as valuable markers in phylogenetic reconstruction, as described in other taxa by Hiesel et al. (1994) and Burger et al. (2003). In this study, phylogenetic analysis was conducted on the mitochondrial genome of G. forrestii and the mitochondrial genomes of 14 other plant species based on information obtained from the mitochondrial genome. The evolutionary relationships among these species align with the topology of the phylogenetic tree, indicating consistency between traditional taxonomy and molecular classification. However, the node where Clade 1 and Clade 2 (Figure 9) was diverged, is poorly supported by ultra-bootstrap tests (only 41%). To test the effects of horizontal gene transfer (HGT) on phylogenetic reconstruction, we performed a BLAST analysis on highly variable loci, but found no evidence of HGT signals. All the high informative segments are all from most related taxa (Supplementary Tables 14; Supplementary Figures 2–14). After filtering for highly variable loci, we observed that bootstrap probabilities did not improve significantly, increasing by only 5% (see Supplementary Figure 15). Substitution saturation may be the primary reason for this lower support, while the distant relationships between species and the incompleteness of the data could also contribute significantly. This highlights the potential of using information obtained from the mitochondrial genome in plant phylogenetic studies. These findings lay a foundation for understanding evolutionary relationships within Burseraceae. However, with few representative mitochondrial genomes available, more sequencing is needed to better resolve the phylogeny and evolution of the family. Expanding sequenced lineages will deepen our understanding of genome evolution (Wang et al., 2024a).
Data availability statement
The raw sequence data reported in this paper have been deposited in the Genome Sequence Archive (Genomics, Proteomics & Bioinformatics 2021) in National Genomics Data Center (Nucleic Acids Res 2022), China National Center for Bioinformation / Beijing Institute of Genomics, Chinese Academy of Sciences (GSA: CRA021850) that are publicly accessible at https://ngdc.cncb.ac.cn/gsa.
Author contributions
RC: Conceptualization, Data curation, Formal analysis, Investigation, Methodology, Project administration, Resources, Software, Supervision, Validation, Visualization, Writing – original draft, Writing – review & editing. RR: Conceptualization, Data curation, Formal analysis, Investigation, Methodology, Project administration, Resources, Software, Supervision, Validation, Visualization, Writing – review & editing, Writing – original draft. CW: Conceptualization, Data curation, Formal analysis, Supervision, Validation, Writing – review & editing. DZ: Conceptualization, Data curation, Formal analysis, Software, Supervision, Validation, Writing – review & editing. FY: Conceptualization, Formal analysis, Investigation, Supervision, Validation, Writing – review & editing. LY: Conceptualization, Data curation, Formal analysis, Funding acquisition, Investigation, Methodology, Project administration, Resources, Software, Supervision, Validation, Visualization, Writing – original draft, Writing – review & editing.
Funding
The author(s) declare financial support was received for the research, authorship, and/or publication of this article. The authors would like to thank Jinlong Dong (Xishuangbanna Tropical Botanical Garden) for his invaluable assistance with the collection. This study was supported by the National Natural Science Foundation of China (grant No. 42161015) and the Key Project of Basic Research of Yunnan Province, China (grant No. 202301AS070001).
Conflict of interest
The authors declare that the research was conducted in the absence of any commercial or financial relationships that could be construed as a potential conflict of interest.
Generative AI statement
The author(s) declare that no Generative AI was used in the creation of this manuscript.
Publisher’s note
All claims expressed in this article are solely those of the authors and do not necessarily represent those of their affiliated organizations, or those of the publisher, the editors and the reviewers. Any product that may be evaluated in this article, or claim that may be made by its manufacturer, is not guaranteed or endorsed by the publisher.
Supplementary material
The Supplementary Material for this article can be found online at: https://www.frontiersin.org/articles/10.3389/fpls.2024.1509669/full#supplementary-material
References
Alverson, A. J., Rice, D. W., Dickinson, S., Barry, K., Palmer, J. D. (2011). Origins and recombination of the bacterial-sized multichromosomal mitochondrial genome of cucumber. Plant Cell 23, 2499–2513. doi: 10.1105/tpc.111.087189
Atkins, H. J., Bramley, G. L., Johnson, M. A., Kartonegoro, A., Nishii, K., Kokubugata, G., et al. (2020). A molecular phylogeny of Southeast Asian Cyrtandra (Gesneriaceae) supports an emerging paradigm for Malesian plant biogeography. Front. Biogeogr. 12, 1948–6596. doi: 10.21425/F5FBG44148
Beier, S., Thiel, T., Münch, T., Scholz, U., Mascher, M., Valencia, A. (2017). MISA-web:a web server for microsatellite prediction. Bioinformatics 33, 2583–2585. doi: 10.1093/bioinformatics/btx198
Benson, G. (1999). Tandem repeats finder: a program to analyze DNA sequences. Nucleic Acids Res. 27, 573–580. doi: 10.1093/nar/27.2.573
Bi, C., Paterson, A. H., Wang, X., Xu, Y., Wu, D., Qu, Y., et al. (2016). Analysis of the complete mitochondrial genome sequence of the diploid cotton gossypium raimondiiby comparative genomics approaches. BioMed. Res. Int. 2016, 1–18. doi: 10.1155/2016/5040598
Bi, C., Paterson, A. H., Wang, X., Xu, Y., Wu, D., Qu, Y. (2019). Corrigendum to Analysis of the complete mitochondrial genome sequence of the diploid cotton Gossypium raimondii by comparative genomics approaches. BioMed Res. Int. 2019. doi: 10.1155/2019/4689654
Bi, C. W., Shen, F., Han, F. C., Qu, Y. S., Hou, J., Xu, K. W., et al. (2024). PMAT: an efficient plant mitogenome assembly toolkit using low-coverage HiFi sequencing data. Horticulture Res. 11, uhae023. doi: 10.1093/hr/uhae023
Burger, G., Gray, M. W., Franz Lang, B. (2003). Mitochondrial genomes: anything goes. Trends Genet. 19, 709–716. doi: 10.1016/j.tig.2003.10.012
Capella-Gutiérrez, S., Silla-Martínez, J. M., Gabaldón, T. (2009). trimAl: a tool for automated alignment trimming in large-scale phylogenetic analyses. Bioinformatics 25, 1972–1973. doi: 10.1093/bioinformatics/btp348
Castresana, J. (2000). Selection of conserved blocks from multiple alignments for their use in phylogenetic analysis. Mol. Biol. Evolution 17, 540–552. doi: 10.1093/oxfordjournals.molbev.a026334
Chen, Y., Ye, W., Zhang, Y., Xu, Y. (2015). High speed BLASTN: an accelerated MegaBLAST search tool. Nucleic Acids Res. 43, 7762–7768. doi: 10.1093/nar/gkv784
Cheng, Y., He, X. X., Priyadarshani, S. V. G. N., Wang, Y., Ye, L., Shi, C., et al. (2021). Assembly and comparative analysis of the complete mitochondrial genome of. BMC Genomics 22, 1–15. doi: 10.1186/s12864-021-07490-9
Cheng, S., Xu, Z., Bian, S. Z., Chen, X., Shi, Y. F., Li, Y. R., et al. (2023). The STROMICS genome study: deep whole-genome sequencing and analysis of 10K Chinese patients with ischemic stroke reveal complex genetic and phenotypic interplay. Cell Discovery 9, 75. doi: 10.1038/s41421-023-00582-8
Darling, A. E., Dunn, N. A., Unni, D. R., Diesh, C., Munoz-Torres, M., Harris, N. L., et al. (2019). Apollo: Democratizing genome annotation. PloS Comput. Biol. 15, e1006790. doi: 10.1371/journal.pcbi.1006790
Darling, A. E., Marçais, G., Delcher, A. L., Phillippy, A. M., Coston, R., Salzberg, S. L., et al. (2018). MUMmer4: A fast and versatile genome alignment system. PloS Comput. Biol. 14, e1005944. doi: 10.1371/journal.pcbi.1005944
Deb, B., Uddin, A., Chakraborty, S. (2021). Composition, codon usage pattern, protein properties, and influencing factors in the genomes of members of the family Anelloviridae. Arch. Virol. 166, 461–474. doi: 10.1007/s00705-020-04890-2
Dong, S. S., Li, H. L., Goffinet, B., Liu, Y. (2022). Exploring the impact of RNA editing on mitochondrial phylogenetic analyses in liverworts, an early land plant lineage. J. Syst. Evol. 60, 16–22. doi: 10.1111/jse.12706
Feng, G. Y., Jiao, Y. J., Ma, H. Z., Bian, H. Y., Nie, G., Huang, L. K., et al. (2024). The first two whole mitochondrial genomes for the genus species: assembly and comparative genomics analysis. BMC Genomics 25, 235. doi: 10.1186/s12864-024-10145-0
Gandini, C. L., Sanchez-Puerta, M. V. (2017). Foreign plastid sequences in plant mitochondria are frequently acquired via mitochondrion-to-mitochondrion horizontal transfer. Sci. Rep. 7, 43402. doi: 10.1038/srep43402
Gandini, C. L., Garcia, L. E., Abbona, C. C., Sanchez-Puerta, M. V. (2019). The complete organelle genomes of Physochlaina orientalis: Insights into short sequence repeats across seed plant mitochondrial genomes. Mol. Phylogenet. Evol. 137, 274–284. doi: 10.1016/j.ympev.2019.05.012
Goremykin, V. V., Salamini, F., Velasco, R., Viola, R. (2008). Mitochondrial DNA of vitis vinifera and the issue of rampant horizontal gene transfer. Mol. Biol. Evolution 26, 99–110. doi: 10.1093/molbev/msn226
Gray, M. W., Sloan, D. B., Alverson, A. J., Chuckalovcak, J. P., Wu, M., McCauley, D. E., et al. (2012). Rapid evolution of enormous, multichromosomal genomes in flowering plant mitochondria with exceptionally high mutation rates. PloS Biol. 10, e1001241. doi: 10.1371/journal.pbio.1001241
Group, T. A. P., Chase, M. W., Christenhusz, M. J. M., Fay, M. F., Byng, J. W., Judd, W. S., et al. (2016). An update of the Angiosperm Phylogeny Group classification for the orders and families of flowering plants: APG IV. Botanical J. Linn. Society 181, 1–20. doi: 10.1111/boj.12385
Gualberto, J. M., Mileshina, D., Wallet, C., Niazi, A. K., Weber-Lotfi, F., Dietrich, A. (2014). The plant mitochondrial genome: dynamics and maintenance. Biochimie 100, 107–120. doi: 10.1016/j.biochi.2013.09.016
Guo, S., Li, Z. Y., Li, C. L., Liu, Y., Liang, X. L., Qin, Y. M. (2024). Assembly and characterization of the complete mitochondrial genome of. Plant Cell Rep. 43, 77. doi: 10.1007/s00299-023-03126-2
Guo, W., Zhu, A., Fan, W., Mower, J. P. (2017). Complete mitochondrial genomes from the ferns Ophioglossum californicum and Psilotum nudum are highly repetitive with the largest organellar introns. New Phytologist 213, 391–403. doi: 10.1111/nph.14135
He, C., Yue, H., Xu, L., Liu, Y., Song, Y., Tang, C., et al. (2020). siRNA release kinetics from polymeric nanoparticles correlate with RNAi efficiency and inflammation therapy via oral delivery. Acta Biomater. 103, 213–222. doi: 10.1016/j.actbio.2019.12.005
Hiesel, R., von Haeseler, A., Brennicke, A. (1994). Plant mitochondrial nucleic acid sequences as a tool for phylogenetic analysis. Proc. Natl. Acad. Sci. 91, 634–638. doi: 10.1073/pnas.91.2.634
Hurst, L. D. (2002). The Ka/Ks ratio: diagnosing the form of sequence evolution. Trends Genet. 18, 453–454. doi: 10.1016/s0168-9525(02)02722-1
Kapli, P., Yang, Z., Telford, M. J. (2020). Phylogenetic tree building in the genomic age. Nat. Rev. Genet. 21, 428–444. doi: 10.1038/s41576-020-0233-0
Katoh, K., Standley, D. M. (2013). MAFFT multiple sequence alignment software version 7: improvements in performance and usability. Mol. Biol. Evolution 30, 772–780. doi: 10.1093/molbev/mst010
Ke, S.-J., Liu, D.-K., Tu, X.-D., He, X., Zhang, M.-M., Zhu, M.-J., et al. (2023). Apostasia mitochondrial genome analysis and monocot mitochondria phylogenomics. Int. J. Mol. Sci. 24, 7837. doi: 10.3390/ijms24097837
Kearse, M., Moir, R., Wilson, A., Stones-Havas, S., Cheung, M., Sturrock, S., et al. (2012). Geneious Basic: An integrated and extendable desktop software platform for the organization and analysis of sequence data. Bioinformatics 28, 1647–1649. doi: 10.1093/bioinformatics/bts199
Kim, D., Langmead, B., Salzberg, S. L. (2015). HISAT: a fast spliced aligner with low memory requirements. Nat. Method 12, 357–360. doi: 10.1038/nmeth.3317
Kumar, S., Stecher, G., Tamura, K. (2016). MEGA7: molecular evolutionary genetics analysis version 7.0 for bigger datasets. Mol. Biol. Evolution 33, 1870–1874. doi: 10.1093/molbev/msw054
Lanfear, R., von Haeseler, A., Woodhams, M. D., Schrempf, D., Chernomor, O., Schmidt, H. A., et al. (2020). IQ-TREE 2: new models and efficient methods for phylogenetic inference in the genomic era. Mol. Biol. Evolution 37, 1530–1534. doi: 10.1093/molbev/msaa015
Lee, E., Harris, N., Gibson, M., Chetty, R., Lewis, S. (2009). Apollo: a community resource for genome annotation editing. Bioinformatics 25, 1836–1837. doi: 10.1093/bioinformatics/btp314
Li, H., Durbin, R. (2009). Fast and accurate short read alignment with Burrows–Wheeler transform. Bioinformatics 25, 1754–1760. doi: 10.1093/bioinformatics/btp324
Li, Z., Liu, Z., Zhong, W., Huang, M., Wu, N., Xie, Y., et al. (2016). Large-scale identification of human protein function using topological features of interaction network. Sci. Rep. 6, 37179. doi: 10.1038/srep37179
Librado, P., Rozas, J. (2009). DnaSP v5: a software for comprehensive analysis of DNA polymorphism data. Bioinformatics 25, 1451–1452. doi: 10.1093/bioinformatics/btp187
Liu, G., Cao, D., Li, S., Su, A., Geng, J., Grover, C. E., et al. (2013). The complete mitochondrial genome of Gossypium hirsutum and evolutionary analysis of higher plant mitochondrial genomes. PloS One 8, e69476. doi: 10.1371/journal.pone.0069476
Lowe, T. M., Eddy, S. R. (1997). tRNAscan-SE: a program for improved detection of transfer RNA genes in genomic sequence. Nucleic Acids Res. 25, 955–964. doi: 10.1093/nar/25.5.955
Lu, G., Zhang, K., Que, Y., Li, Y. (2023). Assembly and analysis of the first complete mitochondrial genome of Punica granatum and the gene transfer from chloroplast genome. Front. Plant Sci. 14. doi: 10.3389/fpls.2023.1132551
Lynch, M., Conery, J. S. (2000). The evolutionary fate and consequences of duplicate genes. Science 290, 1151–1155. doi: 10.1126/science.290.5494.1151
Ma, Q., Li, S., Bi, C., Hao, Z., Sun, C., Ye, N. (2016). Complete chloroplast genome sequence of a major economic species, Ziziphus jujuba (Rhamnaceae). Curr. Genet. 63, 117–129. doi: 10.1007/s00294-016-0612-4
Milne, I., Bayer, M., Cardle, L., Shaw, P., Stephen, G., Wright, F., et al. (2010). Tablet—next generation sequence assembly visualization. Bioinformatics 26, 401–402. doi: 10.1093/bioinformatics/btp666
Mower, J. P., Case, A. L., Floro, E. R., Willis, J. H. (2012). Evidence against Equimolarity of Large Repeat Arrangements and a Predominant Master Circle Structure of the Mitochondrial Genome from a Monkeyflower (Mimulus guttatus) Lineage with Cryptic CMS. Genome Biol. Evolution 4, 670–686. doi: 10.1093/gbe/evs042
Ni, Y., Li, J., Chen, H., Yue, J., Chen, P., Liu, C. (2022). Comparative analysis of the chloroplast and mitochondrial genomes of Saposhnikovia divaricata revealed the possible transfer of plastome repeat regions into the mitogenome. BMC Genomics 23, 570. doi: 10.1186/s12864-022-08821-0
Notsu, Y., Masood, S., Nishikawa, T., Kubo, N., Akiduki, G., Nakazono, M., et al. (2002). The complete sequence of the rice (Oryza sativa L.) mitochondrial genome: frequent DNA sequence acquisition and loss during the evolution of flowering plants. Mol. Genet. Genomics 268, 434–445. doi: 10.1007/s00438-002-0767-1
Petersen, G., Anderson, B., Braun, H.-P., Meyer, E. H., Møller, I. M. (2020). Mitochondria in parasitic plants. Mitochondrion 52, 173–182. doi: 10.1016/j.mito.2020.03.008
Picardi, E., Pesole, G. (2013). REDItools: high-throughput RNA editing detection made easy. Bioinformatics 29, 1813–1814. doi: 10.1093/bioinformatics/btt287
Poon, A. F. Y., Price, M. N., Dehal, P. S., Arkin, A. P. (2010). FastTree 2 – approximately maximum-likelihood trees for large alignments. PloS One 5, e9490. doi: 10.1371/journal.pone.0009490
Romero, H. (2000). Codon usage in Chlamydia trachomatis is the result of strand-specific mutational biases and a complex pattern of selective forces. Nucleic Acids Res. 28, 2084–2090. doi: 10.1093/nar/28.10.2084
Shapiro, J. A., von Sternberg, R. (2005). Why repetitive DNA is essential to genome function. Biol. Rev. 80, 227–250. doi: 10.1017/S1464793104006657
Sharp, P. M., Tuohy, T. M. F., Mosurski, K. R. (1986). Codon usage in yeast: cluster analysis clearly differentiates highly and lowly expressed genes. Nucleic Acids Res. 14, 5125–5143. doi: 10.1093/nar/14.13.5125
Shen, B., Shen, A., Liu, L., Tan, Y., Li, S., Tan, Z. (2024). Assembly and comparative analysis of the complete multichromosomal mitochondrial genome of Cymbidium ensifolium, an orchid of high economic and ornamental value. BMC Plant Biol. 24, 255. doi: 10.1186/s12870-024-04962-4
Shidhi, P. R., Biju, V. C., Anu, S., Vipin, C. L., Deelip, K. R., Achuthsankar, S. N. (2021). Genome characterization, comparison and phylogenetic analysis of complete mitochondrial genome of reveals highly rearranged gene order in. Life-Basel 11, 769. doi: 10.3390/life11080769
Sjölander, K. (2004). Phylogenomic inference of protein molecular function: advances and challenges. Bioinformatics 20, 170–179. doi: 10.1093/bioinformatics/bth021
Skippington, E., Barkman, T. J., Rice, D. W., Palmer, J. D. (2015). Miniaturized mitogenome of the parasitic plant Viscum scurruloideum is extremely divergent and dynamic and has lost all nad genes. Proc. Natl. Acad. Sci. 112, E3515–E3524. doi: 10.1073/pnas.1504491112
Tanaka, Y., Tsuda, M., Yasumoto, K., Yamagishi, H., Terachi, T. (2012). A complete mitochondrial genome sequence of Ogura-type male-sterile cytoplasm and its comparative analysis with that of normal cytoplasm in radish (Raphanus sativus L.). BMC Genom. 13, 352. doi: 10.1186/1471-2164-13-352
Tiamiyu, B. B., Ngarega, B. K., Zhang, X., Zhang, H., Kuang, T., Huang, G.-Y., et al. (2021). Estimating the potential impacts of climate change on the spatial distribution of Garuga forrestii, an endemic species in China. Forests 12, 1708. doi: 10.3390/f12121708
Tillich, M., Lehwark, P., Pellizzer, T., Ulbricht-Jones, E. S., Fischer, A., Bock, R., et al. (2017). GeSeq – versatile and accurate annotation of organelle genomes. Nucleic Acids Res. 45, W6–W11. doi: 10.1093/nar/gkx391
Unseld, M., Marienfeld, J. R., Brandt, P., Brennicke, A. (1997). The mitochondrial genome of Arabidopsis thaliana contains 57 genes in 366,924 nucleotides. Nat. Genet. 15, 57–61. doi: 10.1038/ng0197-57
Wang, J., Kan, S., Liao, X., Zhou, J., Tembrock, L. R., Daniell, H., et al. (2024a). Plant organellar genomes: much done, much more to do. Trends Plant Sci. 29, 754–769. doi: 10.1016/j.tplants.2023.12.014
Wang, D., Zhang, Y., Zhang, Z., Zhu, J., Yu, J. (2010). KaKs_Calculator 2.0: A toolkit incorporating gamma-series methods and sliding window strategies. Genomics Proteomics Bioinf. 8, 77–80. doi: 10.1016/S1672-0229(10)60008-3
Wang, J., Zou, Y., Mower, J. P., Reeve, W., Wu, Z. (2024b). Rethinking the mutation hypotheses of plant organellar DNA. Genomics Commun. 1, e003. doi: 10.48130/gcomm-0024-0003
Wick, R. R., Schultz, M. B., Zobel, J., Holt, K. E. (2015). Bandage: interactive visualization of de novo genome assemblies. Bioinformatics 31, 3350–3352. doi: 10.1093/bioinformatics/btv383
Xia, C., Li, J., Zuo, Y., He, P., Zhang, H., Zhang, X., et al. (2023). Complete mitochondrial genome of Thuja sutchuenensis and its implications on evolutionary analysis of complex mitogenome architecture in Cupressaceae. BMC Plant Biol. 23, 84. doi: 10.1186/s12870-023-04054-9
Xu, Y., Chang, S., Wang, Y., Lu, J., Gai, J., Li, J., et al. (2013). The mitochondrial genome of soybean reveals complex genome structures and gene evolution at intercellular and phylogenetic levels. PloS One 8, e56502. doi: 10.1371/journal.pone.0056502
Xue, J. Y., Dong, S. S., Wang, M. Q., Song, T. Q., Zhou, G. C., Li, Z., et al. (2022). Mitochondrial genes from 18 angiosperms fill sampling gaps for phylogenomic inferences of the early diversification of flowering plants. J. Systematics Evolution 60, 773–788. doi: 10.1111/jse.12708
Yang, H. Y., Chen, H. M., Ni, Y., Li, J. L., Cai, Y. S., Wang, J. H., et al. (2023). Mitochondrial genome sequence of (Lamiales: lamiaceae) suggests diverse genome structures in cogeneric species and finds the stop gain of genes through RNA editing events. Int. J. Mol. Sci. 24, 5372. doi: 10.3390/ijms24065372
Yang, H., Li, W., Yu, X., Zhang, X., Zhang, Z., Liu, Y., et al. (2021). Insights into molecular structure, genome evolution and phylogenetic implication through mitochondrial genome sequence of Gleditsia sinensis. Sci. Rep. 11, 14850. doi: 10.1038/s41598-021-93480-6
Yang, Z., Ni, Y., Lin, Z., Yang, L., Chen, G., Nijiati, N., et al. (2022). De novo assembly of the complete mitochondrial genome of sweet potato (Ipomoea batatas [L.] Lam) revealed the existence of homologous conformations generated by the repeat-mediated recombination. BMC Plant Biol. 22, 285. doi: 10.1186/s12870-022-03665-y
Yang, Z., Nielsen, R. (2000). Estimating synonymous and nonsynonymous substitution rates under realistic evolutionary models. Mol. Biol. Evolution 17, 32–43. doi: 10.1093/oxfordjournals.molbev.a026236
Ye, N., Wang, X., Li, J., Bi, C., Xu, Y., Wu, D., et al. (2017). Assembly and comparative analysis of complete mitochondrial genome sequence of an economic plant Salix suchowensis. PeerJ 5, e3148. doi: 10.7717/peerj.3148
Yu, R., Chen, X., Long, L., Jost, M., Zhao, R., Liu, L., et al. (2023). De novoAssembly and comparative analyses of mitochondrial genomes in piperales. Genome Biol. Evolution 15, e0141329. doi: 10.1093/gbe/evad041
Yuan, Y., Jin, X., Liu, J., Zhao, X., Zhou, J., Wang, X., et al. (2018). The Gastrodia elata genome provides insights into plant adaptation to heterotrophy. Nat. Comm. 9, 1615. doi: 10.1038/s41467-018-03423-5
Yue, J., Hu, X., Sun, H., Yang, Y., Huang, J. (2012). Widespread impact of horizontal gene transfer on plant colonization of land. Nat. Commun. 3, 1152. doi: 10.1038/ncomms2148
Zeng, Z. F., Zhang, Z. Y., Tso, N., Zhang, S. T., Chen, Y., Shu, Q., et al. (2024). Complete mitochondrial genome of: insights into adaptation to high-altitude environments. Front. Plant Sci. 15. doi: 10.3389/fpls.2024.1449606
Zhang, Z., Chuang, Y.-H., Huang, N., Mitch, W. A. (2019). Predicting the contribution of chloramines to contaminant decay during ultraviolet/hydrogen peroxide advanced oxidation process treatment for potable reuse. Environ. Sci. technol. 53, 4416–4425. doi: 10.1021/acs.est.8b06894
Zhang, Z., Li, J., Yu, J. (2006). KaKs_Calculator: calculating Ka and Ks through model selection and model averaging. Genomics Proteomics Bioinf. 4, 259–263. doi: 10.1016/S1672-0229(07)60007-2
Zhou, D., Liu, Y., Yao, J., Yin, Z., Wang, X., Xu, L., et al. (2022). Characterization and phylogenetic analyses of the complete mitochondrial genome of sugarcane (Saccharum spp. Hybrids) line A1. Diversity 14, 333. doi: 10.3390/d14050333
Keywords: Garuga forrestii, mitochondrial genome, phylogenomic, adaptation, repetitive sequence
Citation: Chen R, Rao R, Wang C, Zhu D, Yuan F and Yue L (2025) Features and evolutionary adaptations of the mitochondrial genome of Garuga forrestii W. W. Sm. Front. Plant Sci. 15:1509669. doi: 10.3389/fpls.2024.1509669
Received: 11 October 2024; Accepted: 18 December 2024;
Published: 20 January 2025.
Edited by:
Zhiqiang Wu, Chinese Academy of Agricultural Sciences, ChinaReviewed by:
Jian-Li Zhao, Yunnan University, ChinaXuezhu Liao, Shenzhen University, China
Yan-Yan Liu, Henan Agricultural University, China
Copyright © 2025 Chen, Rao, Wang, Zhu, Yuan and Yue. This is an open-access article distributed under the terms of the Creative Commons Attribution License (CC BY). The use, distribution or reproduction in other forums is permitted, provided the original author(s) and the copyright owner(s) are credited and that the original publication in this journal is cited, in accordance with accepted academic practice. No use, distribution or reproduction is permitted which does not comply with these terms.
*Correspondence: Liangliang Yue, eXVlbGlhbmdsaWFuZ0Bzd2Z1LmVkdS5jbg==