- Shanxi Key Laboratory of Germplasm Resources Innovation and Utilization of Vegetable and Flower, College of Horticulture, Shanxi Agricultural University, Taigu, China
Introduction: NAC (NAM, ATAF, and CUC) transcription factor family, one of the important switches of transcription networks in plants, functions in plant growth, development, and stress resistance. Night lily (Hemerocallis citrina) is an important horticultural perennial monocot plant that has edible, medicinal, and ornamental values. However, the NAC gene family of night lily has not yet been analyzed systematically to date.
Methods: Therefore, we conducted a genome-wide study of the HcNAC gene family and identified a total of 113 HcNAC members from the Hemerocallis citrina genome.
Results: We found that 113 HcNAC genes were unevenly distributed on 11 chromosomes. Phylogenetic analysis showed that they could be categorized into 16 instinct subgroups. Proteins clustering together exhibited similar conserved motifs and intron–exon structures. Collinearity analysis indicated that segmental and tandem duplication might contribute to the great expansion of the NAC gene family in night lily, whose relationship was closer with rice than Arabidopsis. Additionally, tissue-specific pattern analysis indicated that most HcNAC genes had relatively higher expression abundances in roots. RNA-Seq along with RT-qPCR results jointly showed HcNAC genes expressed differently under drought and salinity stresses. Interestingly, HcNAC35 was overexpressed in watermelon, and the stress resilience of transgenic lines was much higher than that of wild-type watermelon, which revealed its wide participation in abiotic stress response.
Conclusion: In conclusion, our findings provide a new prospect for investigating the biological roles of NAC genes in night lily.
1 Introduction
Transcription factors (TFs), known as master regulators of gene expression, bind to the specific responsive elements within the promoters of target functional genes. A series of plant-specific TFs, such as bHLH, bZIP, ARF, DREB, MYC, AP2/EREBP, WRKY, and NAC, regulate many biological processes (Deng et al., 2016; Droge-Laser et al., 2018; Erpen et al., 2018; Ohta et al., 2018; Li et al., 2019; Luo et al., 2020; Yao et al., 2020). The NAC gene family, one of the largest TF superfamilies of TFs in plants, was named from NAM (petunia no apical meristem), AF1/2 (A. thaliana transcriptional activator 1/2) and cup-shaped cotyledon (Han et al., 2023). The NAC gene family was widely characterized in dicotyledonous and monocotyledonous based on the availability of complete plant genome sequences. Among these plant species, 117 in Arabidopsis (Ooka et al., 2003), 151 in rice (Nuruzzaman et al., 2010), 152 in soybean (Le et al., 2011), 251 in switchgrass (Yan et al., 2017), 72 in perennial ryegrass (Nie et al., 2020), 93 in tomato (Jin et al., 2020), 180 in apple (Su et al., 2013), 170 in poplar (Meng L. et al., 2022), 74 in grape (Wang N. et al., 2013), 183 genes in white pear (Gong et al., 2019), and 154 in tobacco (Li et al., 2018) were investigated.
Typically, NAC protein mainly contained a highly conserved DNA-binding domain (BD) at the N terminus and a diverse C-terminal transcriptional activation region (TR) (Ooka et al., 2003; Puranik et al., 2012). Therefore, the NAC TFs are involved in various processes including growth, development, and stress responses (Puranik et al., 2012). The crucial role of NAC TFs in secondary cell wall development is discovered through establishing gene regulatory networks in Arabidopsis (Taylor-Teeples et al., 2015). ONAC127 and ONAC129 function indispensably in seed germination by directly targeting OsMST6 and OsSWEET4 (Ren et al., 2021). AtNAC1 coordinates with the SCR/SHR-CYCD6 to regulate the maturation of the root ground tissue in Arabidopsis (Xie et al., 2023). AtNAC056 upregulates the expression of NIA1 by directly binding to its promoter, promoting root growth (Xu et al., 2022). The NAC family members ZmNAC126, BnaNAC60, MdNAC4, and LpNAL were involved in leaf senescence by positively regulating the expression of SAGs and CGGs (Yang et al., 2020; Yan et al., 2021; Wen et al., 2022; Yu et al., 2022). AdNAC2 and AdNAC72 indirectly regulate the ethylene pathway by respectively regulating the promoter and transcript of AdMsrB1 (Fu et al., 2021). NAC68 positively regulates sugar accumulation and IAA levels and improves fruit quality and seed development in watermelon (Wang et al., 2021).
As the main environmental stress elements, extreme temperatures, high salinity, drought, and other abiotic stresses have unfavorable effects on agricultural crop production either alone or in combination (Bashir et al., 2019). Several researches have suggested the implication of NAC TFs in response to abiotic stress in plants. For instance, NAC25 and NAC28 in bananas negatively regulated cold tolerance through phospholipid degradation-related pathways (Song C. B. et al., 2022). SlNAM3 in tomatoes enhances cold resistance (Dong et al., 2022). LlNAC014 senses high temperatures by binding directly to the promoter cis-element CTT(N7) AAG (Wu et al., 2022). ZmNAC074 positively regulates thermotolerance in maize (Xi et al., 2022). RcNAC72 enhances drought tolerance by interacting with RcDREB1A in roses (Jia et al., 2022). Overexpression of OsNAC2 improved drought resistance by inhibiting ROS accumulation (Li et al., 2022). SlNAC10 could enhance salt tolerance when ectopically overexpressed in Arabidopsis (Du et al., 2022). Overexpression of IbNAC3 in Arabidopsis can confer tolerance to salinity stress by integrating ABA-signaling pathway (Meng X.Q. et al., 2022). Therefore, the multiple functions of NAC in plants need to be continuously explored.
Chinese night lily (Hemerocallis citrina Baroni, 2n = 22), one of the most important horticultural perennial crops in northeastern China, has edible, medicinal, and ornamental purposes (Cao et al., 2024). Night lily is also named long yellow daylily, exhibiting widespread involvements in abiotic stress responses (Zhang et al., 2023). In recent years, the production and consumption of night lily have increased with its dried immature flower buds as a primary food source (Zuo et al., 2024). Therefore, it is essential to investigate stress tolerances to improve the yield of night lily products and byproducts. Draft genome sequences of night lily released in 2021 have provided researchers with vital resources for genome-wide analysis of multiple gene families with specific functions (Qing et al., 2021). However, no systematic analysis of the night lily NAC TFs was performed. In the current study, 113 HcNAC genes representing 16 subgroups were identified. A comprehensive analysis of chromosomal distributions, phylogenetic relationships, domain analysis, motif compositions, gene structures, cis-acting elements in promoters, gene duplications, and collinearity analysis was completed. We also analyzed the night lily NACs tissue-specific expression profiles by RNA sequencing (RNA-Seq) and further quantitative reverse transcription polymerase chain reaction (RT-qPCR) verification. In addition, both transcriptome data and qPCR results showed that some HcNAC genes in addition to HcNAC35 might response to abiotic stress treatments. Moreover, we examined the function of HcNAC35 gene through ectopically overexpression in watermelon given higher sensitivity of watermelon to abiotic stress compared with most other crops (Lv et al., 2016). Our results showed that overexpression of HcNAC35 could enhance abiotic tolerances especially salinity stress, which unveiled crucial mechanisms of night lily NAC-mediated response to salinity stress. Overall, the study provided valuable information relevant and a theoretical foundation for the functional investigation of night lily NAC family members.
2 Materials and methods
2.1 Identification and sequence analysis of HcNAC genes
To identify HcNAC genes, we downloaded the files of H. citrina including the genome sequences, coding sequences (CDS), and protein sequences from NCBI (https://www.ncbi.nlm.nih.gov/assembly/GCA_017893485.1) (Qing et al., 2021). Hidden Markov model (HMM) files were constructed based on the NAM domain (PF02365) retrieved from the Pfam website (https://pfam.xfam.org/). The conserved NAM domain was utilized to search for HcNAC protein sequences by a program of HMMER3.0 (E-value ≤ 10−5). Then, the physicochemical property prediction of HcNAC protein sequences was detected using TBtools software (Chen et al., 2020). The secondary structure prediction was performed by the online website (https://npsa-prabi.ibcp.fr/NPSA/npsa_sopma.html). WoLF PSORT software online (https://wolfpsort.hgc.jp/) was used to predict the subcellular localization of HcNAC proteins.
2.2 Chromosomal location, phylogeny, and gene structure analysis of the NAC family genes in night lily
We obtained the genome annotation GFF3 file of the NAC genes in night lily from the NCBI database, which was used for mapping the HcNAC gene chromosomal positions using one small program (Gene Location Visualize from GTF/GFF) of TBtools. A. thaliana, O. sativa, and C. lanatus NAC proteins were obtained from the Arabidopsis Information Resource (http://www.Arabidopsis.org/), rice genome annotation (http://rice.plantbiology.msu.edu/), and Cucurbit Genomics Database (http://cucurbitgenomics.org/), respectively (Ooka et al., 2003; Nuruzzaman et al., 2010; Lv et al., 2016). Combined with identified HcNAC proteins, a phylogenetic tree was constructed using the MEGA11.0.13 integrated tool by the Neighbor-Joining method (Kumar et al., 2016). The tree nodes were evaluated by 5,000 bootstrap replicates. HcNAC gene structure was analyzed using the Visualize Gene Structure of TBtools applets.
2.3 Gene motif, conserved domain, genome synteny, and Ka/Ks analysis
Gene-conserved motif prediction was performed via the MEME tool (http://meme-suite.org/index.html) with default settings. NCBI conserved domain database was used to predict the conserved domains of the HcNACs. Genome synteny analysis was made as described previously (Sun et al., 2017). We used Advanced Circos and dual synteny plot of TBtools software to show homologous gene pairs. Nonsynonymous (Ka) and synonymous (Ks) rates among protein sequences were used to assess the DNA sequence evolution. To appraise the divergence of duplicated night lily NAC genes, the selective strength was estimated by calculating the Ka/Ks ratio between paralogous gene pairs using the Simple Ka/Ks Calculator Tool (NG) in TBtools. Ka/Ks larger than 1 indicates positive selection, Ka/Ks less than 1 indicates purifying selection, and Ka/Ks equal to 1 indicates neutral mutation (Zhang and Yu, 2006).
2.4 Functional enrichment and cis-acting element analysis
Gene functional enrichment analysis was performed to reveal the biological processes, cellular components, and molecular functions of the HcNAC genes using STRING (https://cn.string-db.org/). The results were visualized using microscopic letter website (http://www.bioinformatics.com.cn/). For the cis-acting element analysis, about 2,000 base pairs of promoter regions upstream from the initiation codon of HcNAC genes were extracted and then analyzed by the PlantCARE database (http://bioinformatics.psb.ugent.be/webtools/plantcare/html/) to hunt for promoter cis-elements (Lescot et al., 2002).
2.5 Plant materials and stress treatments
In this study, H. citrina was used as treated plant species and cultivated in the experimental base. We chose F1 hybrid population 116 as the treated material based on its moderate resistance to abiotic stresses, obtained by Dongzhuang Huanghua as the female parent and Chonglihua as the male parent. Scapes were taken as explants for tissue cultivation (Zuo et al., 2024). These obtained seedlings were cultured in a 28°C growing box with the 16 h light/8 h dark condition and treated with Hoagland solution respectively containing 20% PEG6000 and 250 mM NaCl after 4 weeks old (Cao et al., 2024). Roots were collected at different time points with the same interval and frozen at a lower temperature than −70°C immediately for later use.
2.6 Transcriptome sequencing analysis
To investigate the transcriptional dynamics of the HcNAC genes in different tissues, bud, tender leaf, mature leaf, tender scape, mature scape, tender root, and mature root were collected and then sent to BMK Biotechnology Company for transcriptome sequencing analysis (NCBI accession: PRJNA1154842). We also chose collected roots of five groups (0, 24, 48, 72, and 108 h) under drought stress (NCBI accession: PRJNA1154840) and five groups (0, 24, 48, 72, and 96 h) under salinity stress for RNA-Seq analysis (NCBI accession: PRJNA1154841). All samples were designed for three replicates. Raw data were performed quality control checks through FastQC and filtered by Trimmomatic 0.36 using the quality control results (Bolger et al., 2014). HISAT2 2.2.1 was used to map the paired-end clean reads to the H. citrina reference genome (Kim et al., 2015). DESeq2 1.30.1 were used to determine differentially expressed genes with the analysis of variance (ANOVA) method (p.adjust < 0.05, |Log2FC| ≥ 1.5) (Love et al., 2014). The fragments per kilobase per million mapped fragments (FPKM) values of HcNAC genes were summed and used for measuring the transcript abundance of HcNACs. The heat map was generated with log2FPKM values to visualize different expression levels.
2.7 Reverse-transcription quantitative real-time PCR analysis
RT-qPCR analysis was carried out according to previously reported with little modification (Hu et al., 2016). The cDNA was synthesized by reverse transcription of high-quality RNA using the TIANScript II RT Kit by the corresponding instructions (TianGen, Beijing, China). RT-qPCR–specific primers, designed using Primer Premier 5, were shown in Supplementary Table S11. The gene expression levels were detected using a LightCycler480 II (Roche, Basel, Switzerland). FastKing One-Step SYBR Green Kit (TianGen, Beijing, China) was used for RT-qPCR reactions, and the calculation of the gene expression levels was analyzed through the 2−ΔΔCt Method. Significant difference in gene expression levels between the two treatment groups was analyzed by a one-way ANOVA analysis of variance method with Duncan test at a p-value < 0.05. Gene expression was analyzed using three independent biological repeats. To normalize expression levels of the selected HcNAC genes, HcACTIN gene was used as an internal control (Cao et al., 2024).
2.8 Construction of HcNACs (HcNAC35 and HcNAC71) transient expression vector and subcellular localization
HcNAC35 and HcNAC71 fragments with KpnI and XhoI restriction sites were obtained by conventional PCR. The plasmid pSuper1300 with Green Fluorescent Protein (GFP) was digested with these two enzymes to get the linear vector fragment, which was subsequently ligated with the target fragments using pEASY-Basic Seamless Cloning and Assembly Kit (TransGen, Beijing, China). Constructed fusion expression plasmids including pSuper1300-HcNAC35-GFP and pSuper1300-HcNAC71-GFP were transformed into tobacco leaf cells by the Agrobacterium-mediated transient transformation. After 48–60 h of dark culture, GFP fluorescence signals were captured using a laser fluorescence microscope (Zeiss LSM800). Relative primers were listed in Supplementary Table S11.
2.9 Overexpression vector construction and transformation of HcNAC35 in watermelon
The full-length CDS with the BamHI and KpnI restriction sites of HcNAC35 were amplified for constructing an overexpression vector and then cloned into a 1305.4-with Green Fluorescent Protein (GFP) vector to carry out sequencing Tongchuan verification. The resulting construct 1305.4-HcNAC35-GFP was transformed into Agrobacterium tumefaciens strain EHA105 to perform genetic transformation using an optimized transformation system in watermelon Tongchuan (TC) (Cao et al., 2022). Transgenic plants were screened by GFP observation and PCR analysis. Wild-type (WT) TC and transgenic plants were transplanted and cultivated in the same growing conditions. Primers referred to in the experiment were given in Supplementary Table S11.
2.10 Measurements of some physiological indicators
The levels of MDA (malondialdehyde) were assessed using the thiobarbituric acid method as described in previous study (Hu et al., 2019). Approximately 0.2 g leaf samples of both salinity-stressed and unstressed plants were collected and ground with 2 ml of ice-cold 0.5% TCA (trichloroacetic acid). The homogenates were centrifuged at 7,000 rpm for 15 min at 4°C. A 1.5-ml volume of the supernatant and 1.5 ml of 8% TCA containing 0.5% thiobarbituric acid were mixed, and boiled for 10 min. The homogenate cooled to ambient temperature was centrifuged at 7,000 rpm for 15 min. Absorbance was measured at 450, 532, and 600 nm.
The level of O2− was also determined as previously described (Hu et al., 2019). Leaf samples (0.3 g per sample) were ground with 2 ml of ice and precooled 50 mM phosphate buffer solution (PBS, pH 7.8). The homogenates were then centrifuged at 10,000 rpm for 20 min at 4°C. A 1 ml of the supernatant, 250 μL of hydrochloride hydroxylamine, and 750 μL of 65 mM PBS (pH 7.8) were mixed and incubated for 1 h at 25°C. Then, a 1 ml of the reaction mixture, 1 ml of 7 nM α-naphthylamine, and 1 ml of 17 nM paminobenzenesulfonic acid were mixed and incubated for 30 min at 25°C. Finally, the absorbance was measured at 530 nm. The O2− content was calculated using a standard curve relating O2− concentration to absorbance. H2O2 was assessed using Micro Hydrogen Peroxide (H2O2) Assay Kit (Solarbio, Beijing, China). Absorbance was recorded at 450, 532, and 600 nm using an Infinite M200 microplate reader (Tecan, Männedorf, Switzerland).
3 Results
3.1 Genome-wide identification, feature, and phylogenetic analysis of the NAC family in night lily
Multiple sequence alignment analysis was performed, followed by a total of 113 complete non-redundant NAC genes identified based on the PlantTFDB database and the reported H. citrina genome (Qing et al., 2021). The chromosomal distributions of genes showed that they were unequally dispersed across LG1-LG11 with gene counts ranging from 4 to 19. These genes were designated HcNAC1-HcNAC113 according to their chromosomal positions (Figure 1). The full length of encoded HcNAC proteins varied significantly from 94 to 1,285 amino acid residues. Physicochemical properties were further analyzed based on their protein sequences, with molecular weights ranging from 10.7 to 141.9 kDa, and theoretical pI values from 4.42 to 10.4 (Supplementary Table S1). The secondary structure including alpha helix, beta-turn, random coil, and extended strand was listed in Supplementary Table S2. The subcellular localization prediction indicated that most HcNAC proteins were localized in the nucleus region, but the others were mainly in either chloroplast or cytoplasm.
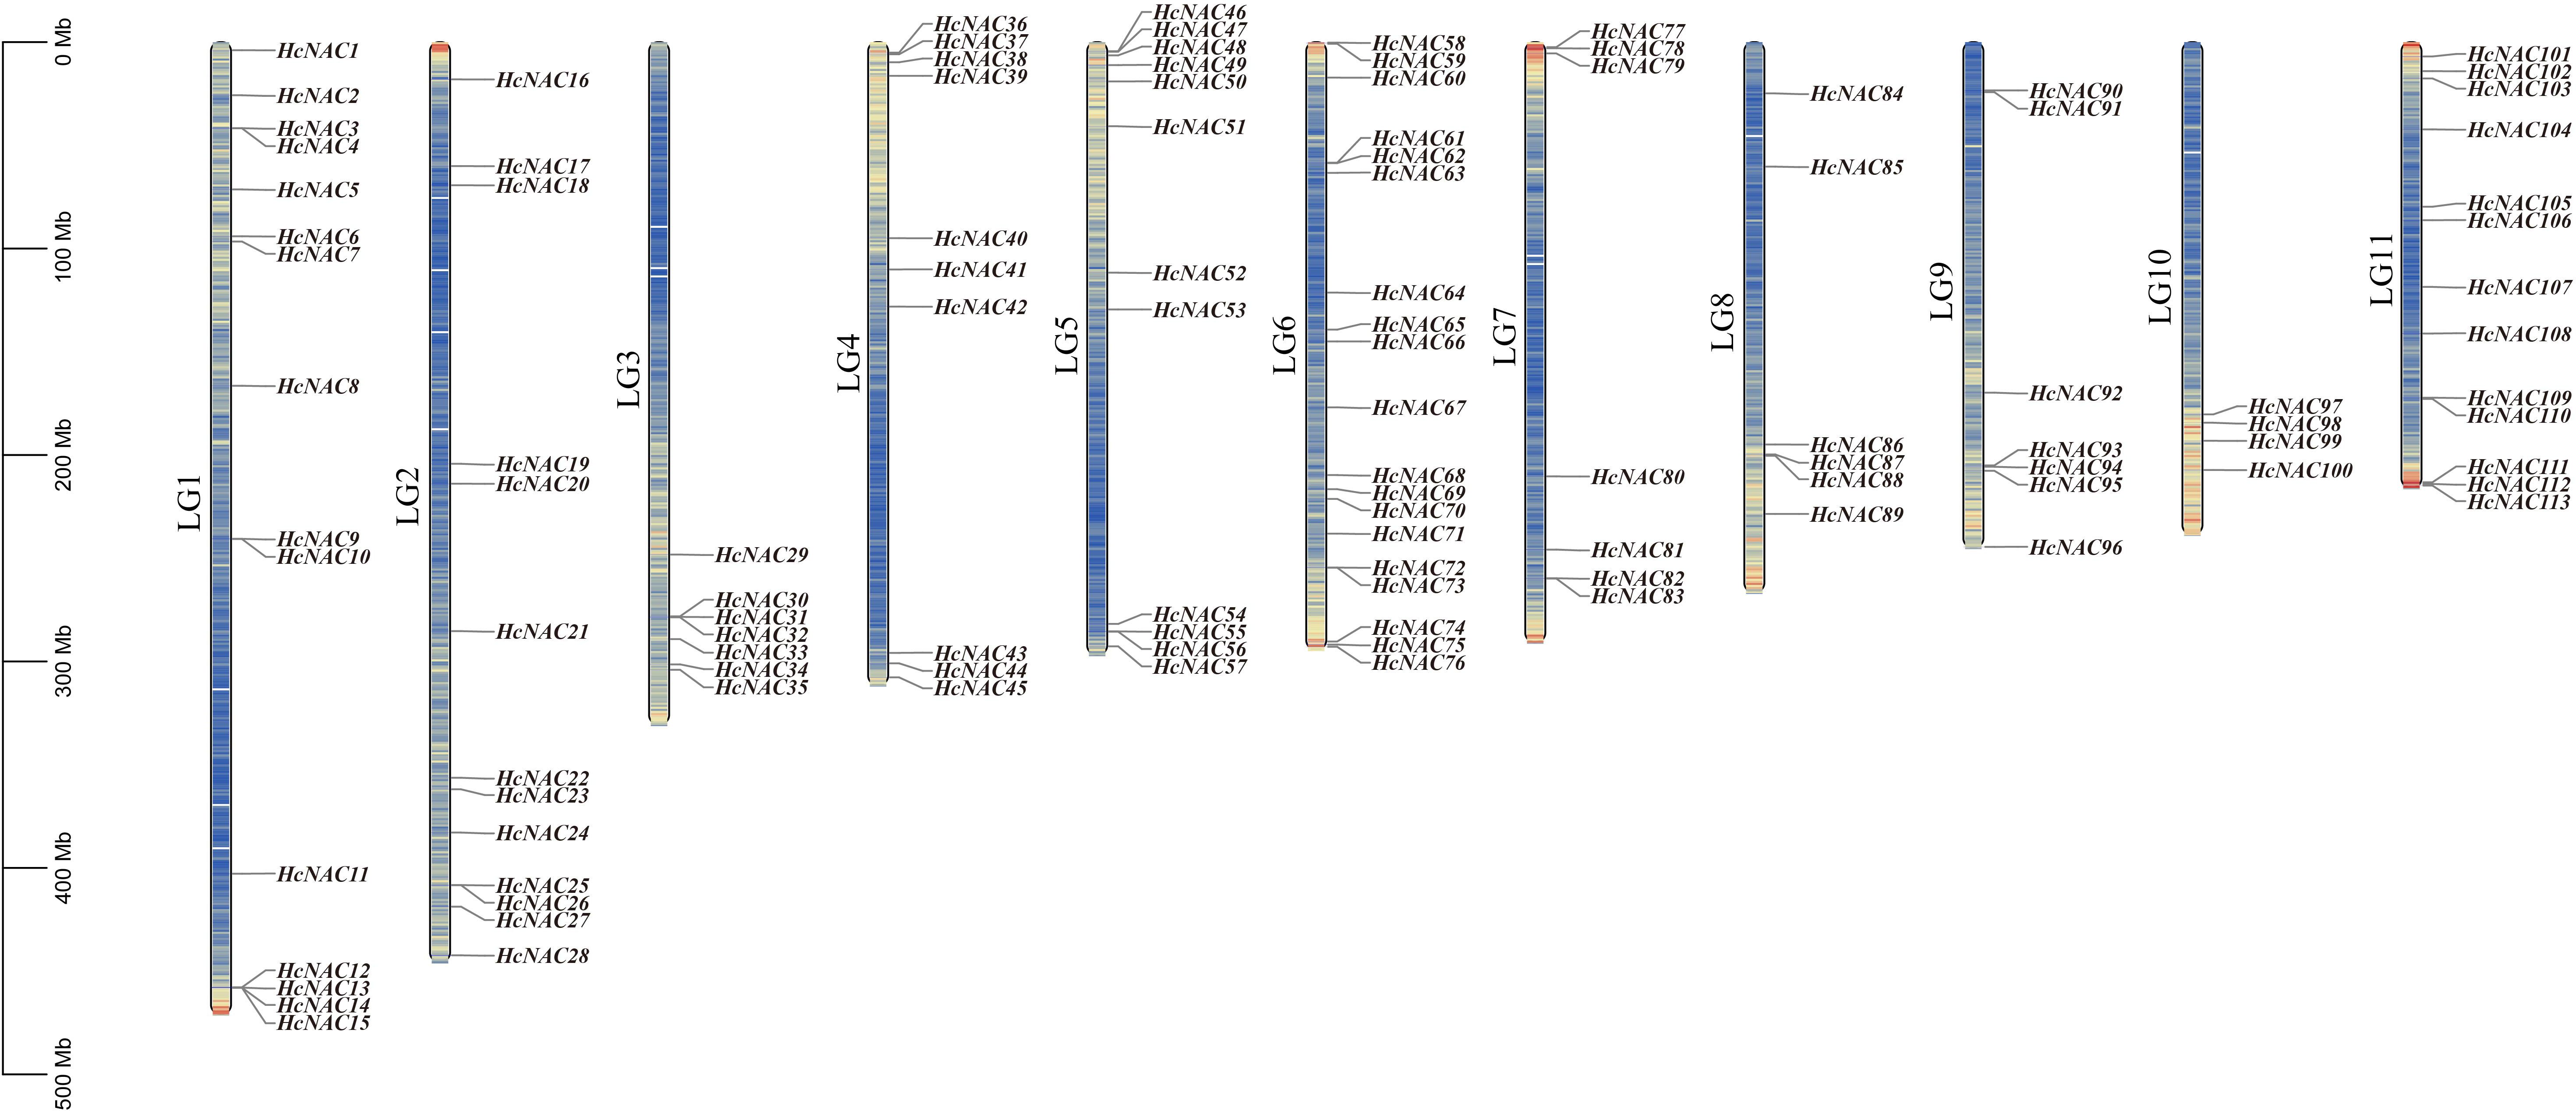
Figure 1. Locations of HcNAC genes on chromosomes (LG1-11). The gene and chromosome names were labeled on the left of each strip. A chromosome length of 100 Mb was used as the basic unit. Lines and different colors inside the LGs indicated gene density differences.
To explore the evolutionary relationships among H. citrina NAC TFs, a phylogenetic tree was established using the NAC protein sequences from H. citrina, C lanatus, O. sativa, and A. thaliana (Figure 2). The protein sequences (ClaNACs, AtNACs, OsNACs) involved in tree construction are listed in Supplementary Table S3. The phylogenetic analysis indicated that 113 HcNAC proteins tightly clustered with ClaNAC, AtNAC, and OsNAC proteins possessed 16 subgroups except the NAC-B and NAC-G subgroup, which suggested evolutionary conservation of the HcNAC gene family. The NAC-L subgroup comprised 17 HcNACs, 7 ClaNACs, 7 OsNACs, and 14 AtNACs, belonging to the divided largest subfamily. The NAC-D subgroup consisted of six OsNAC genes, but only two HcNACs, two ClaNACs, and two AtNAC genes. In the NAC-B subgroup, 27 OsNACs, 1 ClaNAC, and 1 AtNAC gene were found while no NAC gene was in H. citrina. The NAC-G subgroup contained six AtNACs and two OsNAC genes, but no ClaNACs and HcNAC genes. The types and number of genes within each subfamily varied greatly. HcNAC TF was absent in the NAC-B and NAC-G subgroups, which implies that these groups might be lost in night lily during evolution.
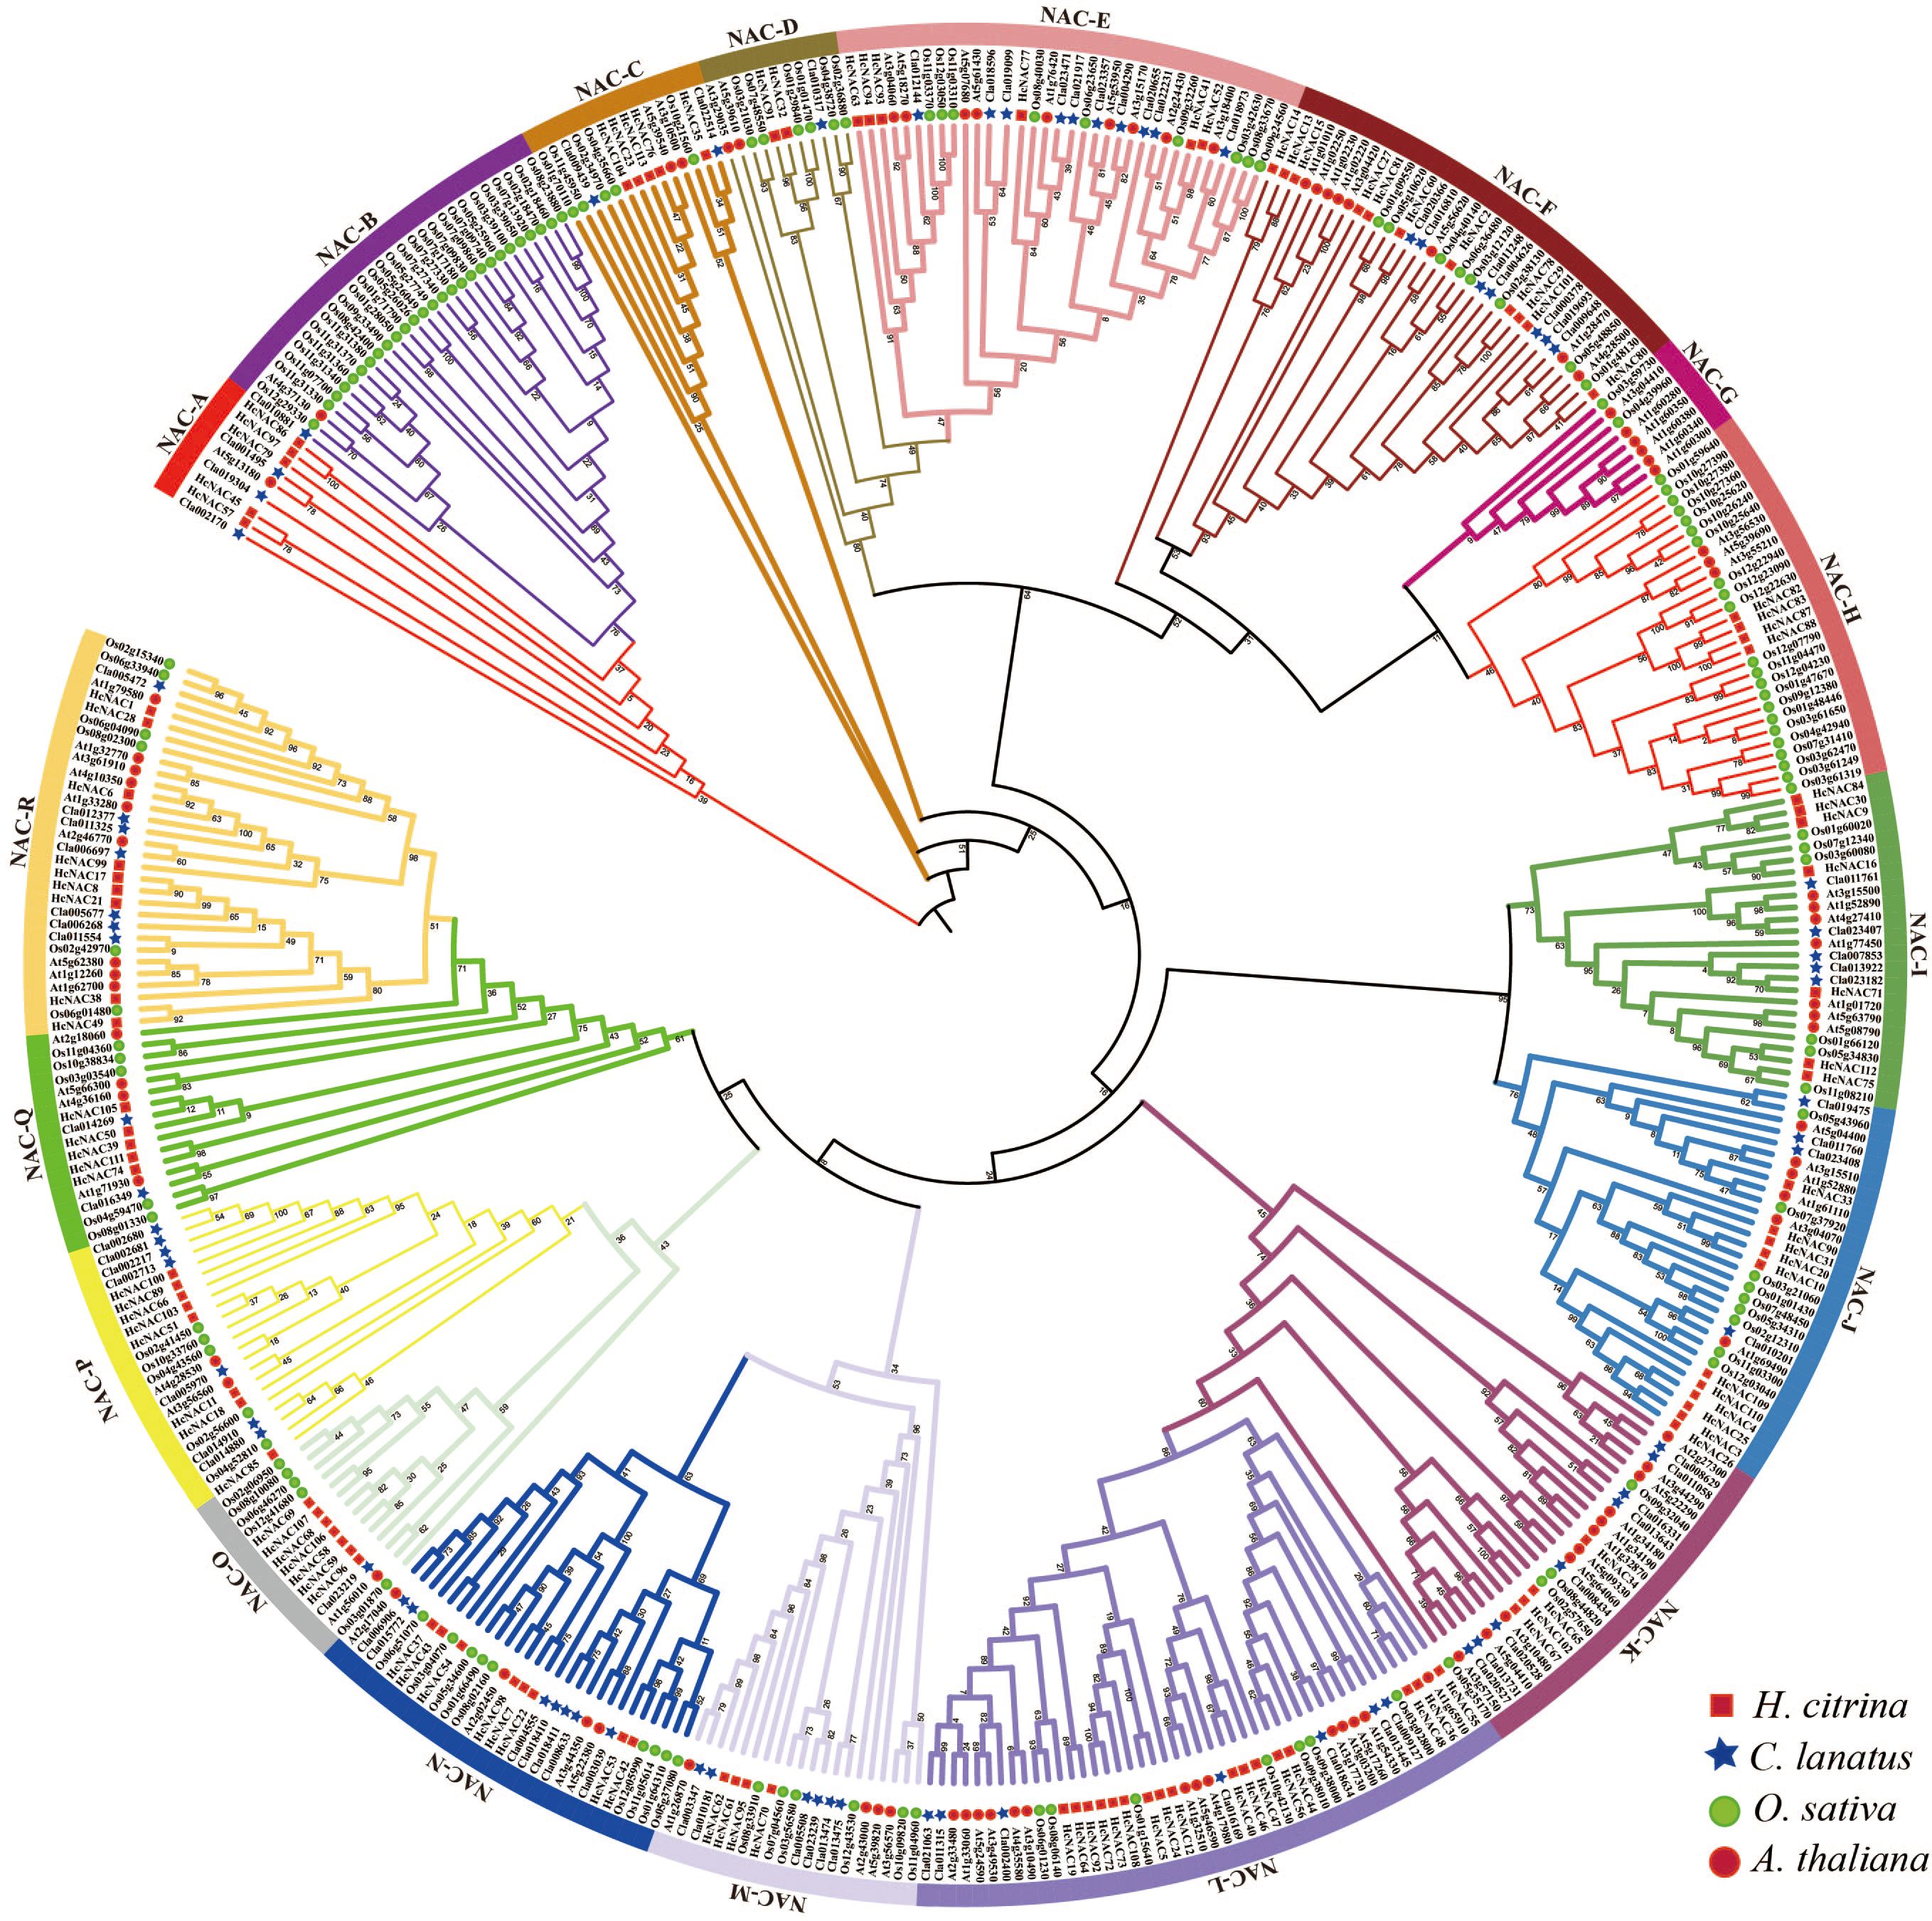
Figure 2. Phylogeny of the HcNACs in night lily, watermelon, and representative plants, including monocot O. sativa and eudicot A. thaliana. NAC genes of H. citrina (Hc), C. lanatus (Cla), O. sativa (Os), and A. thaliana (At), were clustered into 18 clades (A–R). H. citrina (red square), C. lanatus (blue pentagram), O. sativa (green circle), A. thaliana (red circle).
3.2 Domains, conserved motifs, and gene structural analysis of HcNAC genes
To further investigate the evolutionary conservation of HcNAC genes, multiple sequence alignment was conducted to explore the homologous domain features and frequency of amino acids, exhibiting high-sequence homology in the same subgroup and showing a bit of difference in the conservatisms of some amino acids among HcNAC proteins of different subgroups (Figure 3A). According to the above results of sequence alignment, we carried out conserved domain prediction (Figure 3B). NAM domain for DNA binding was detected in 112 NAC proteins. In addition, HcNAC16 had an incomplete subdomain named NAM superfamily. The results indicated that strong sequence conservation existed in their evolutionary process. The NAM domain was the core region for investigating the biological functions of NAC proteins in H. citrina.
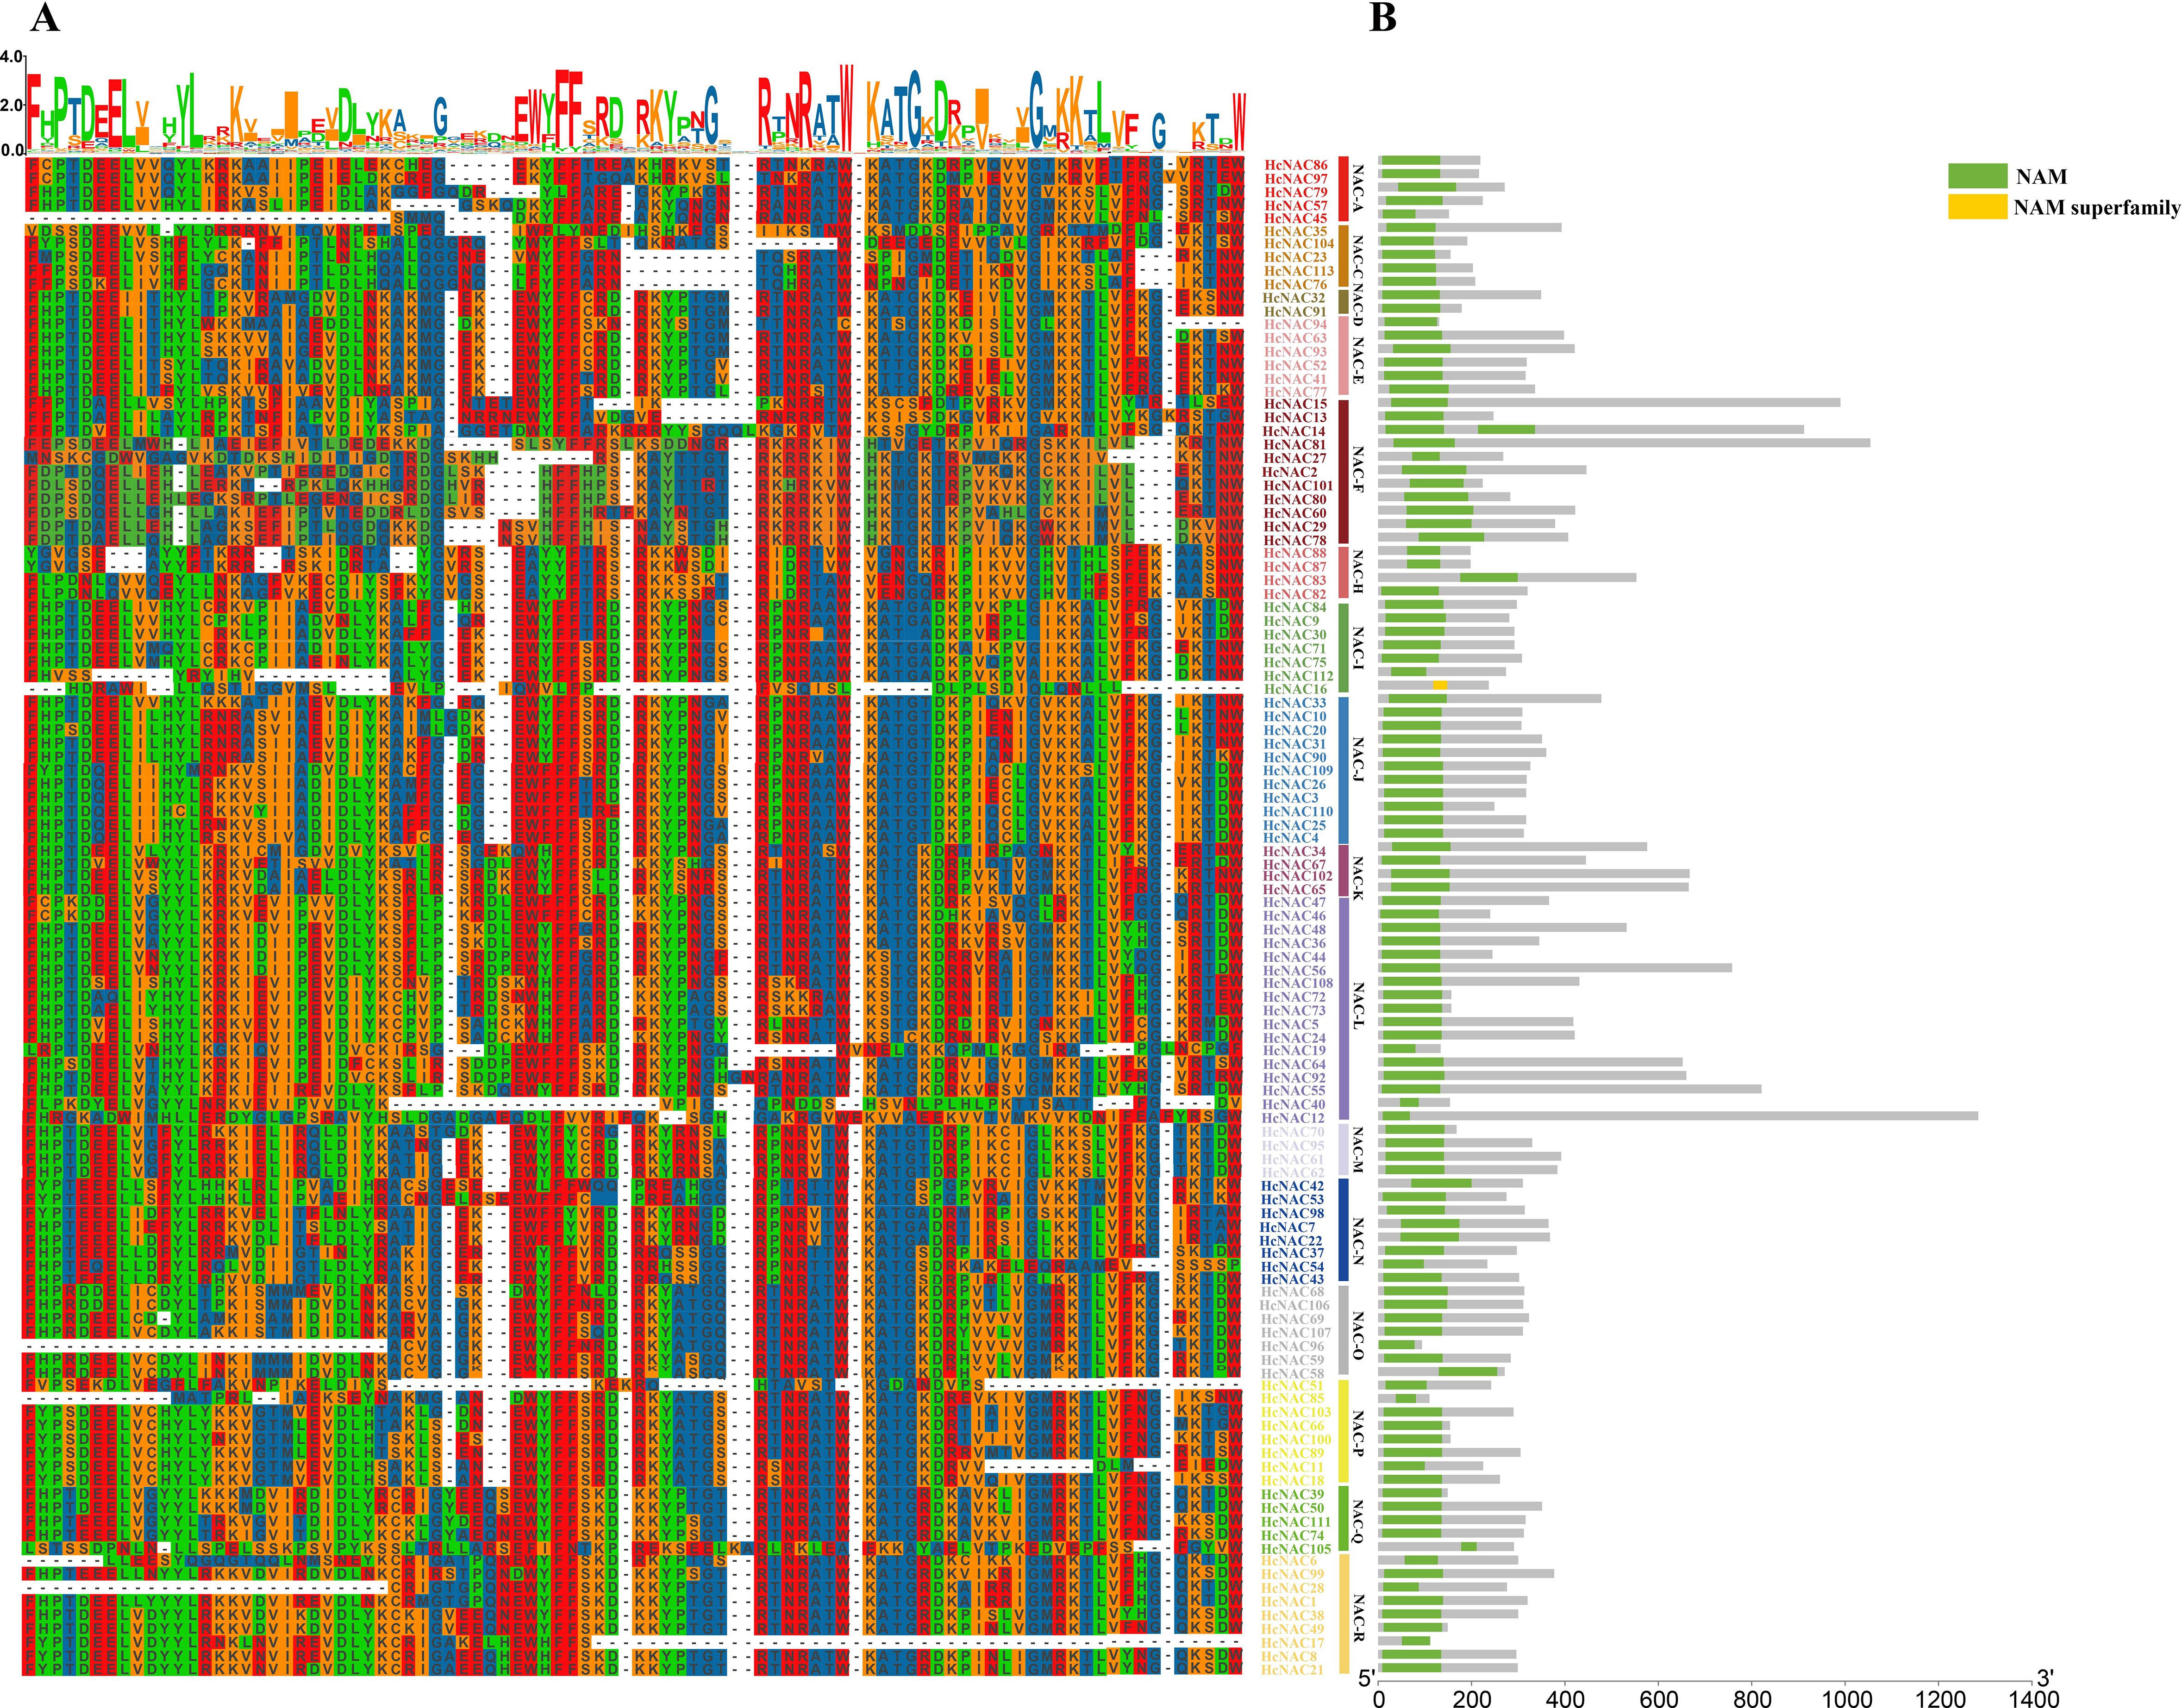
Figure 3. Multiple sequence alignment and conserved domains of 113 HcNAC proteins based on clustering results. (A) Protein sequence alignment in H. citrina. Incomplete or no N-terminal domain sequences were omitted from the alignment. (B) Distribution of conserved domains of 113 HcNAC proteins.
An analysis of gene motifs may help to better understand the diversity of the HcNAC proteins. The 113 HcNAC TFs were divided into 16 subgroups in the NJ phylogenetic tree. Among them, the NAC-L subgroup was the highest in numbers and NAC-D was the lowest with only two members (Figure 4A), consistent with the clustered results in Figure 2. As shown in Figure 4B, 10 different conserved motifs were obtained in HcNACs using MEME online software, and 53 of 113 HcNAC proteins contained 8 common motifs except for motifs 3 and 9, suggesting their important biological functions to be determined. However, motif 9 was exclusive to the NAC-F subgroup (HcNAC2, HcNAC27, HcNAC29, HcNAC60, HcNAC78, HcNAC80, and HcNAC81), indicating the specific functions of different subgroups might be owing to specific motifs. Intron/exon compositions were analyzed to gain the evolution information of HcNAC members (Figure 4C). Of the 113 HcNACs, more than 50% contained three code sequences. The number of intron regions was mainly 2 and varied from 1 to 12, proving that significant variation existed in the gene structure of HcNAC genes. Additionally, genes within each subgroup were similar in intron–exon structures. These results suggested that HcNACs clustered in the same subgroup shared similar conserved motifs and exon–intron organizations.
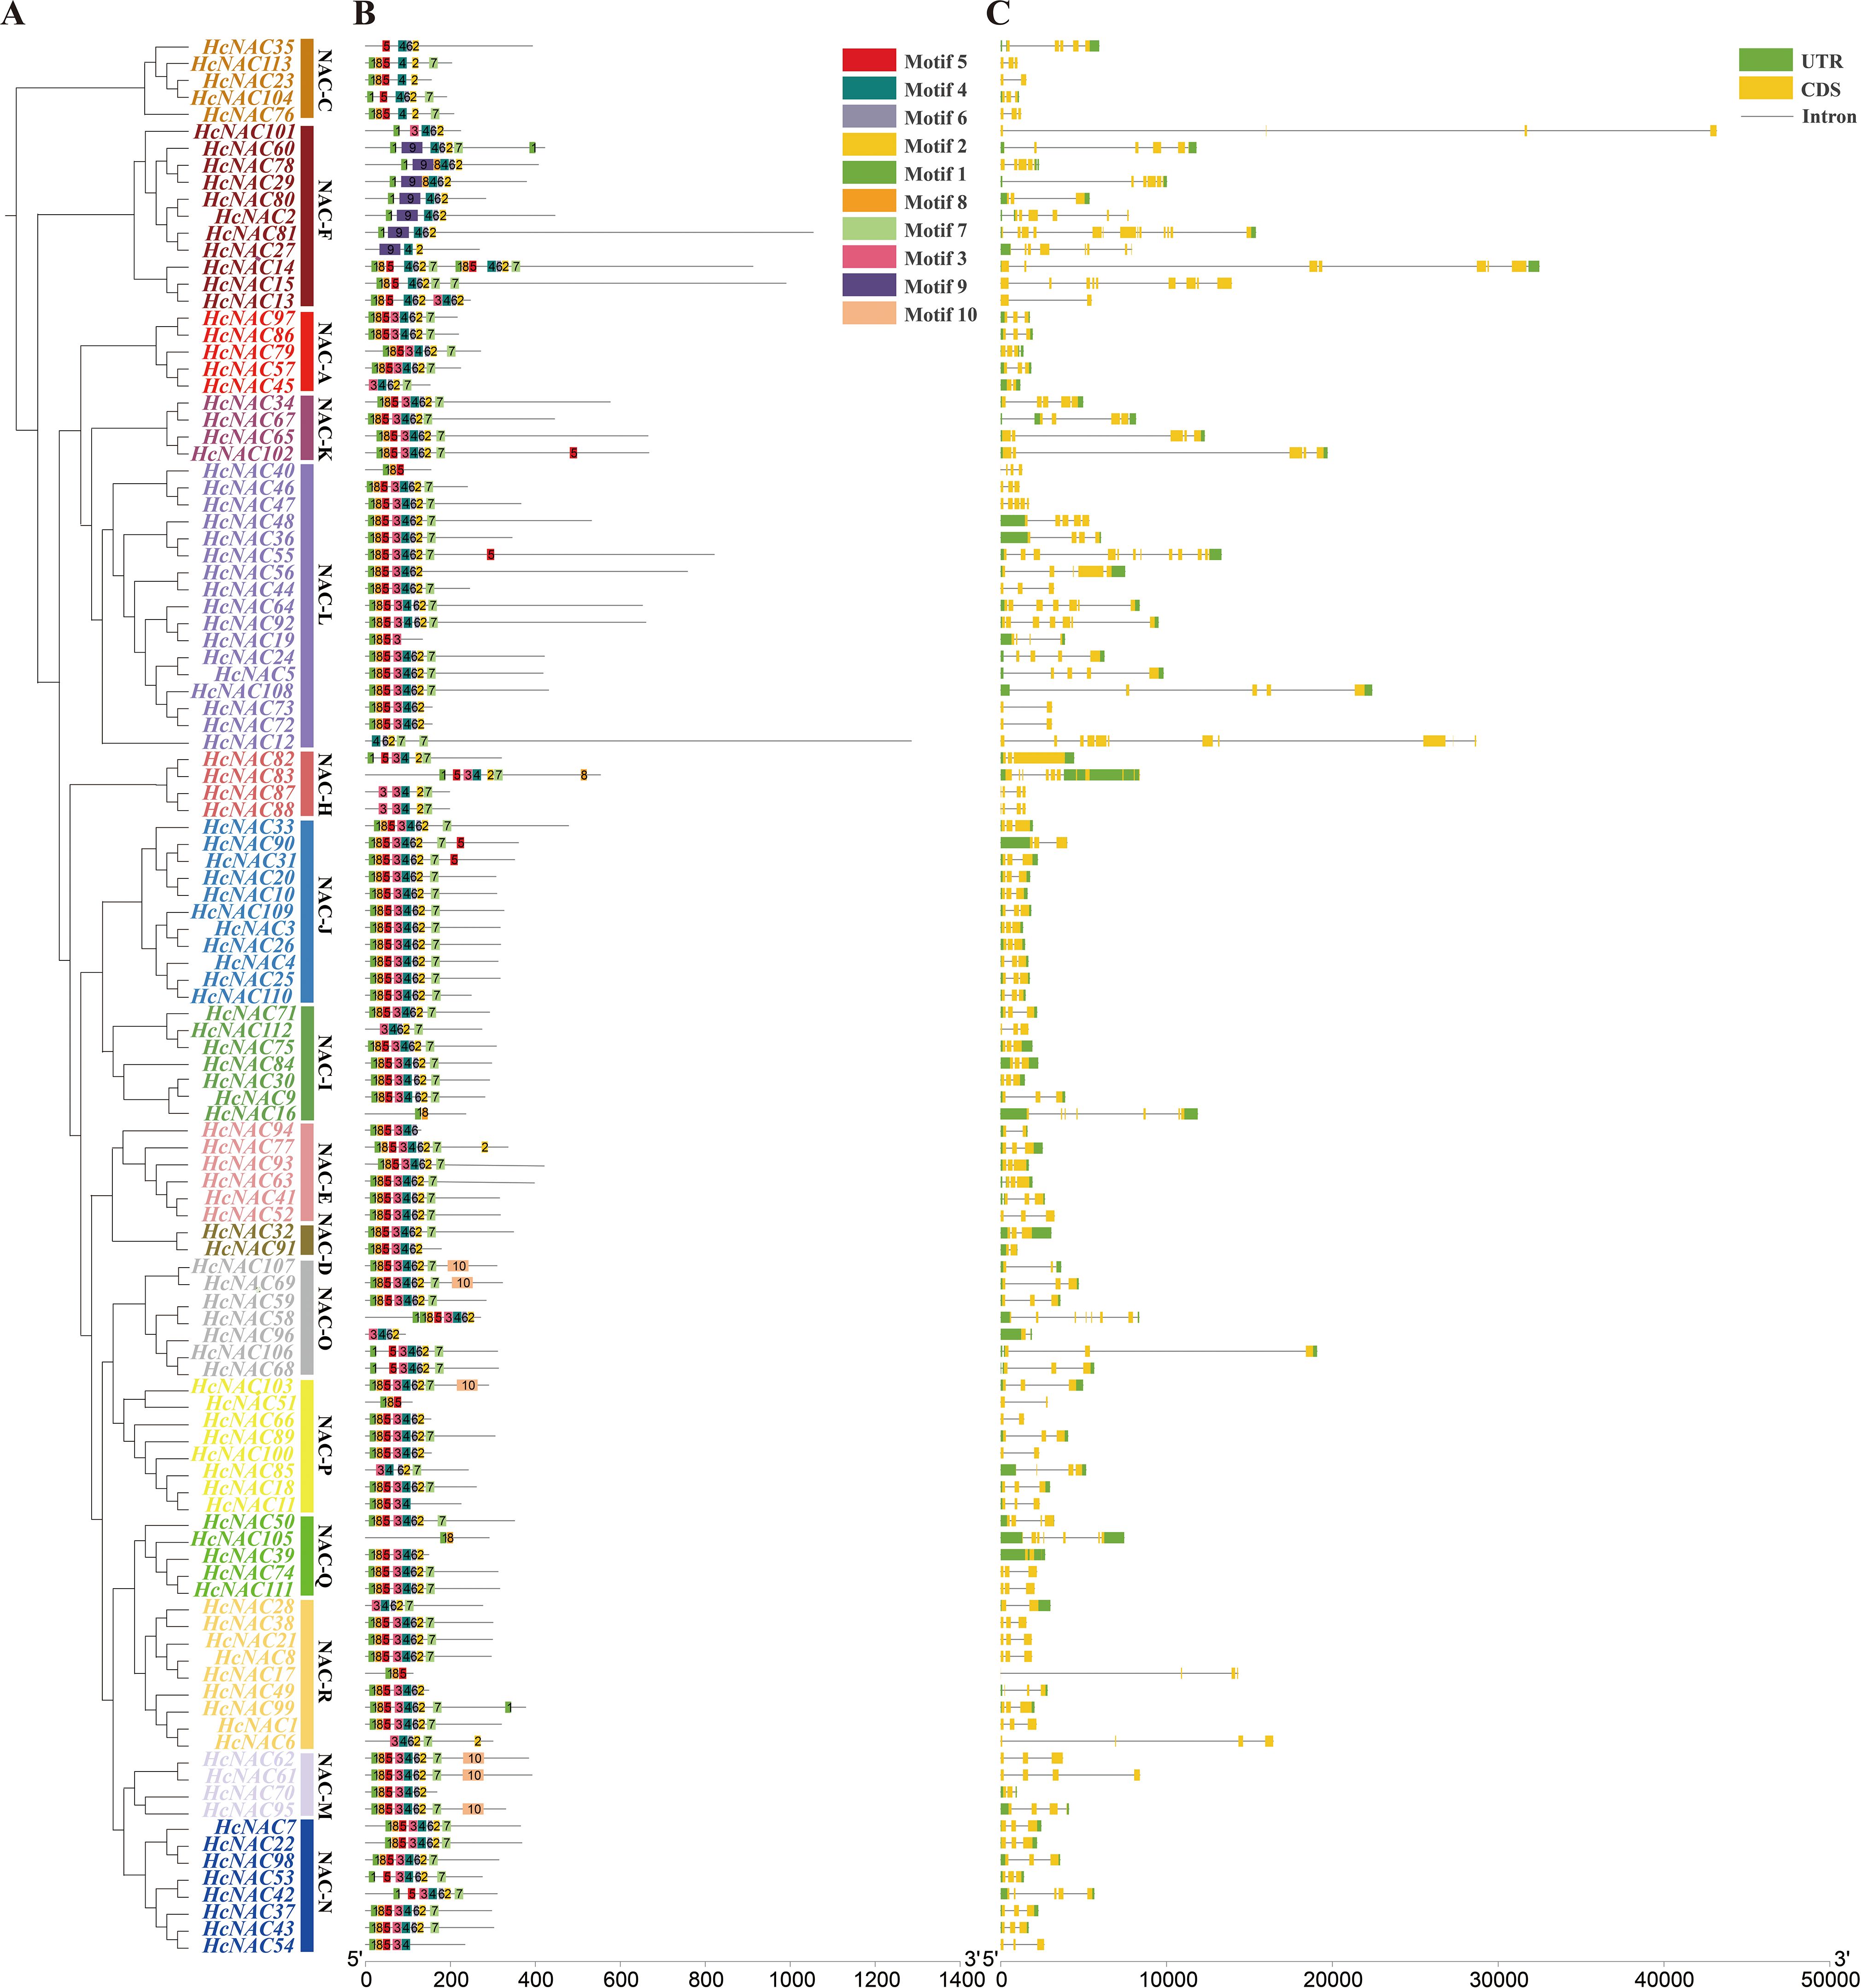
Figure 4. Phylogenetic tree, conserved protein motif, and gene structure analysis of H. citrina NAC family. (A) Clusters of the HcNAC proteins. The 16 subgroups were indicated (NAC-A, C–F, and H–R) and marked with different colors. (B) The distribution of putative conserved motifs of HcNAC proteins. (C) Structural variations in the genetic exon–intron regions, including untranslated regions (UTRs, green rectangle), CDSs (yellow rectangle), and introns (black line).
3.3 Gene duplication and collinearity analysis of HcNACs in H. citrina, A. thaliana, and O. sativa
As effective methods for inferring the evolutionary history of species genome, intra- and inter-species collinear analysis are indispensable to address the study of NAC family expansions (Qiao et al., 2019). Through the annotation and intragenomic synteny analysis of HcNAC genes, 78 syntenic pairs were identified, among which two pairs of tandemly duplicated genes were detected (Figure 5A). It can be seen that tandem duplication and segment duplication might be major driving forces that form the expansion of the HcNAC gene family. Comparative syntenic maps of night lily with one monocot (O. sativa) and one dicot (A. thaliana) were constructed (Figure 5B). As a result, a comparison between night lily and O. sativa showed that 85 orthologous gene pairs were presented, whereas 21 HcNAC genes formed collinearity pairs with NAC genes from A. thaliana. The number of collinear NAC genes was higher in O. sativa than in A. thaliana, reflecting the closer relationship between night lily and monocots. The Ka, Ks, and Ka/Ks ratio, measurements of the protein conservation, were used to determine whether selective pressures occurred on genes encoding the HcNAC proteins (Figure 5C and Supplementary Table S4). The Ka/Ks value of only one HcNAC gene pair was greater than 1, which signified strong positive selection. The remaining genes were subjected to purification selection considering Ka/Ks ratios less than 0.5. The results revealed that the HcNAC gene family was mainly affected by purifying selection in evolutionary selection.
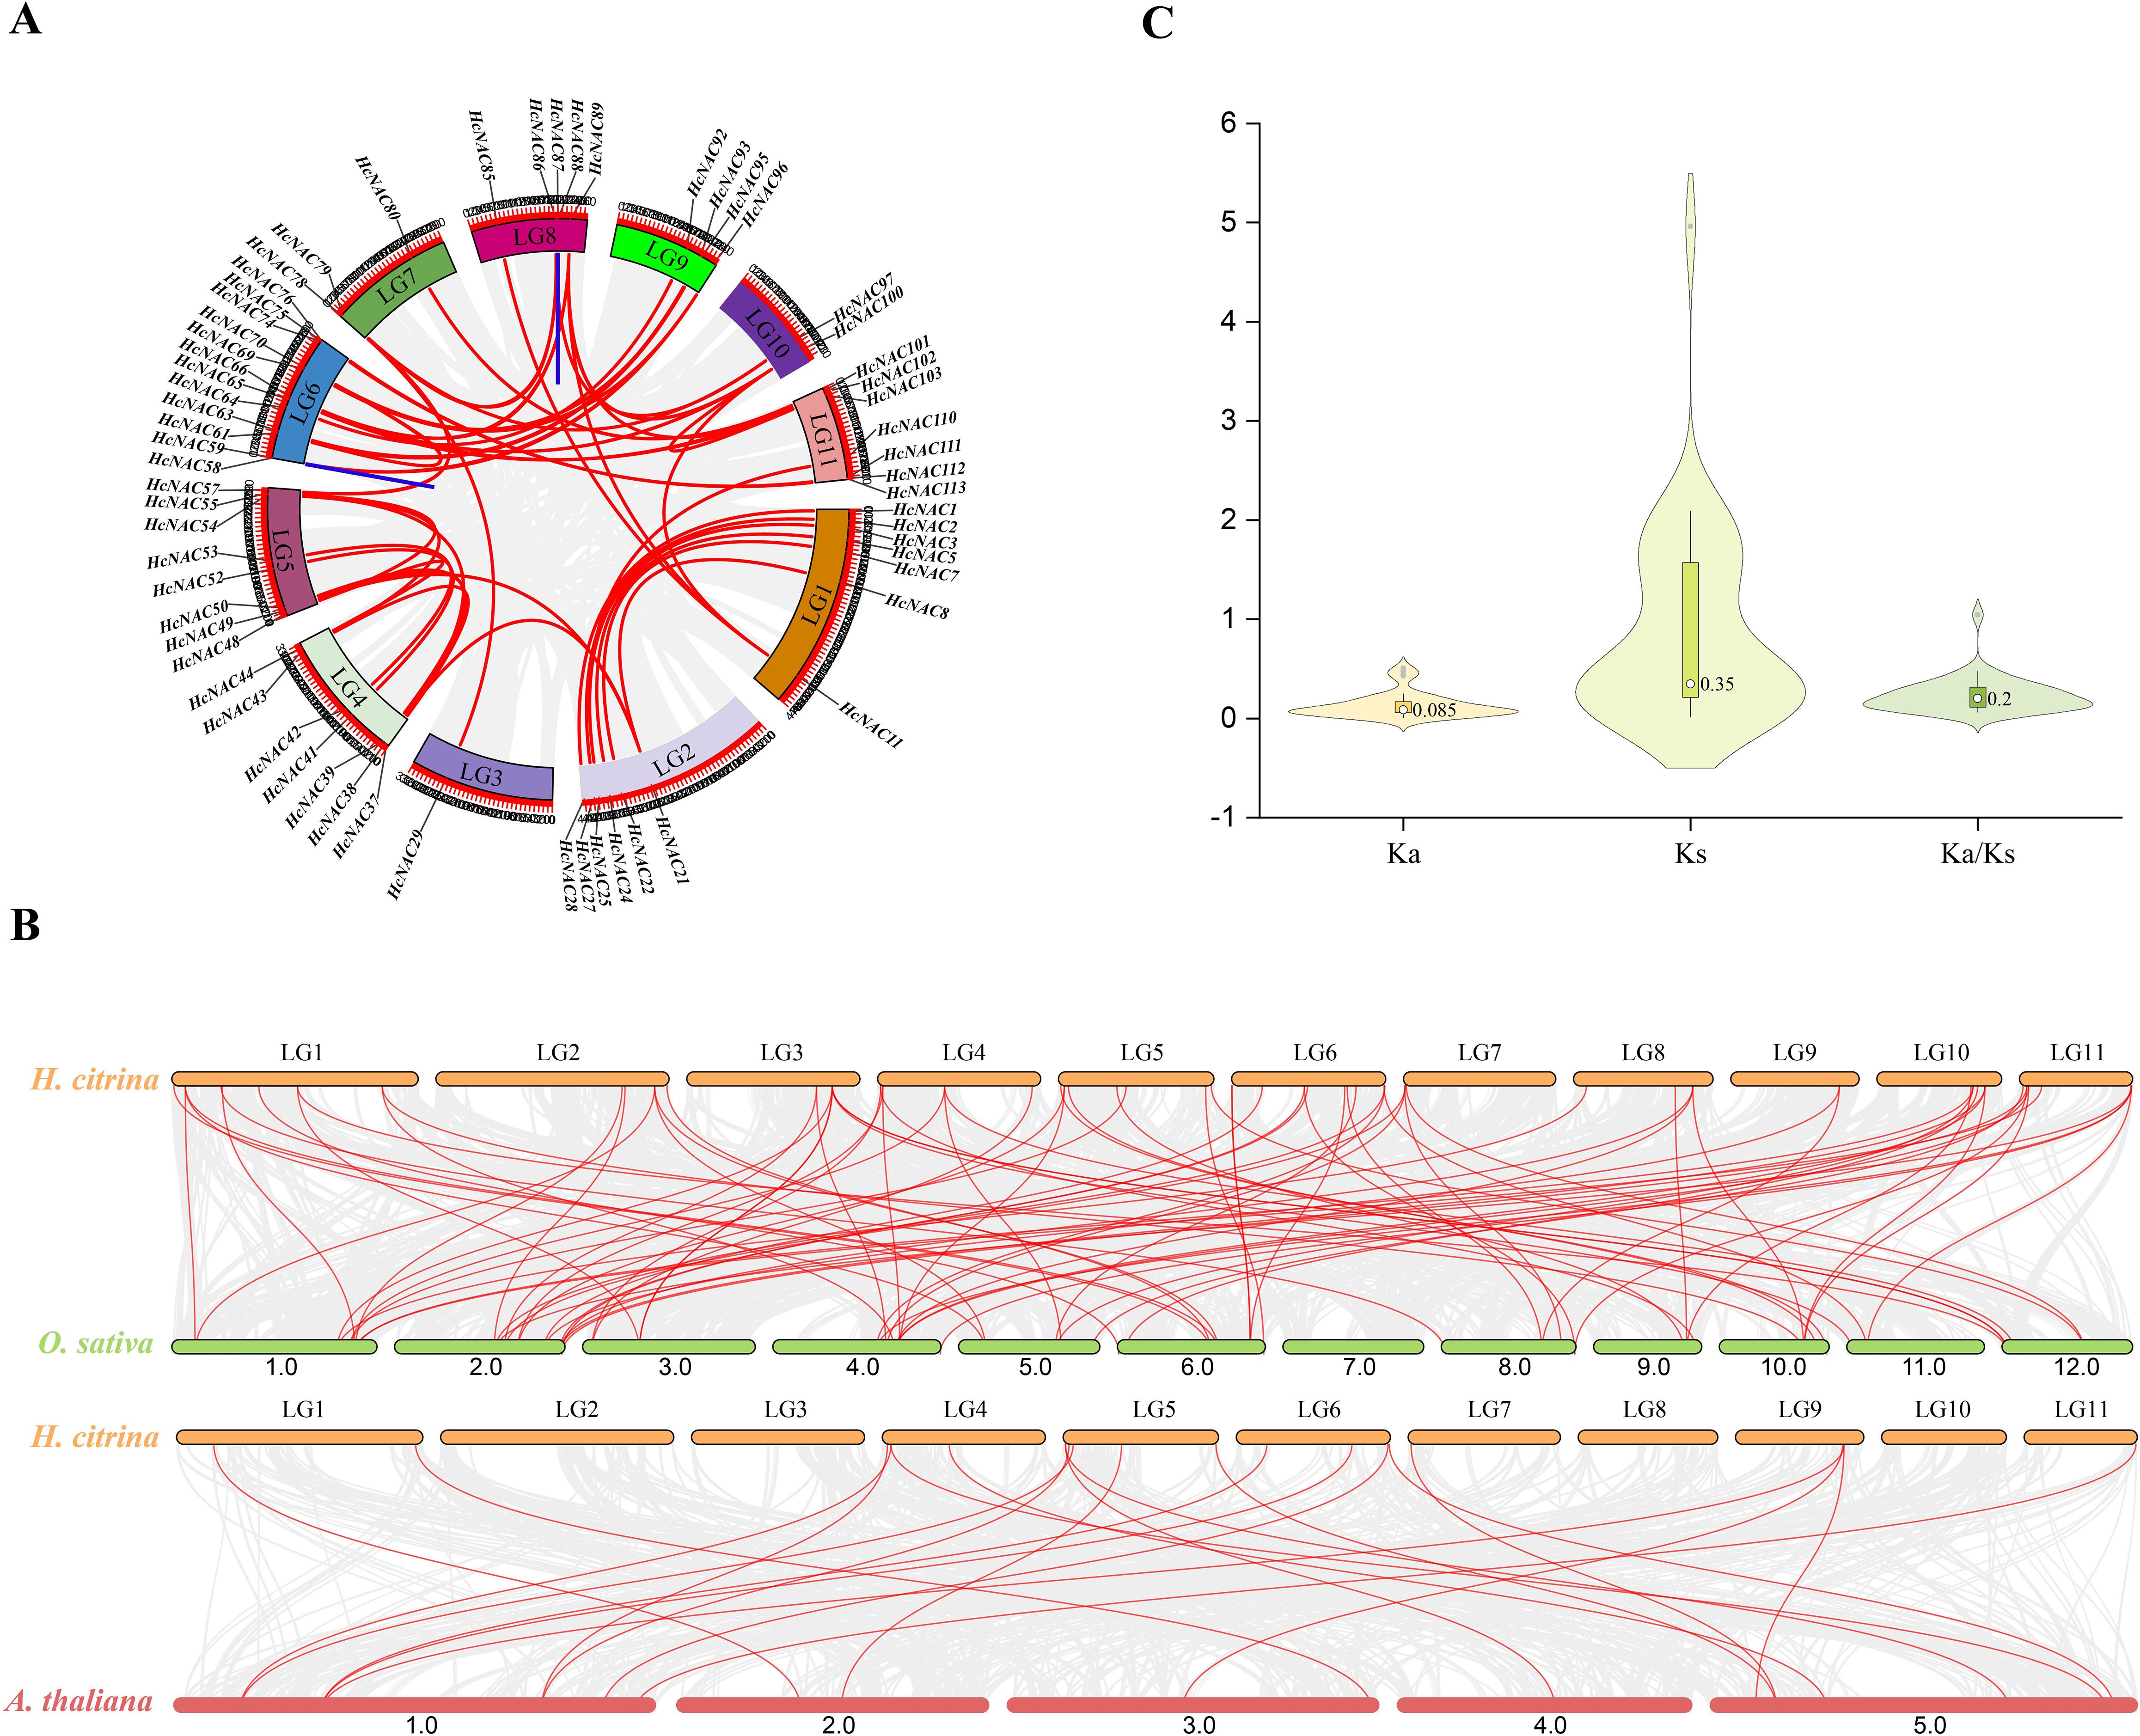
Figure 5. Collinearity analysis of NAC gene and Ka/Ks value in H. citrina. (A) Schematic representations for distribution and inter-chromosomal relationships of NACs in the H. citrina genome. The duplicated gene pairs were displayed in red lines, while the tandemly duplicated gene pairs were displayed in blue. (B) Synteny analysis between the NAC genes of H. citrina and two other representative plants including O. sativa and A. thaliana. (C) The Ka, Ks, and Ka/Ks values of NAC genes in H. citrina.
3.4 Functional Gene Ontology, and Kyoto Encyclopedia of Genes and Genomes enrichment of HcNACs
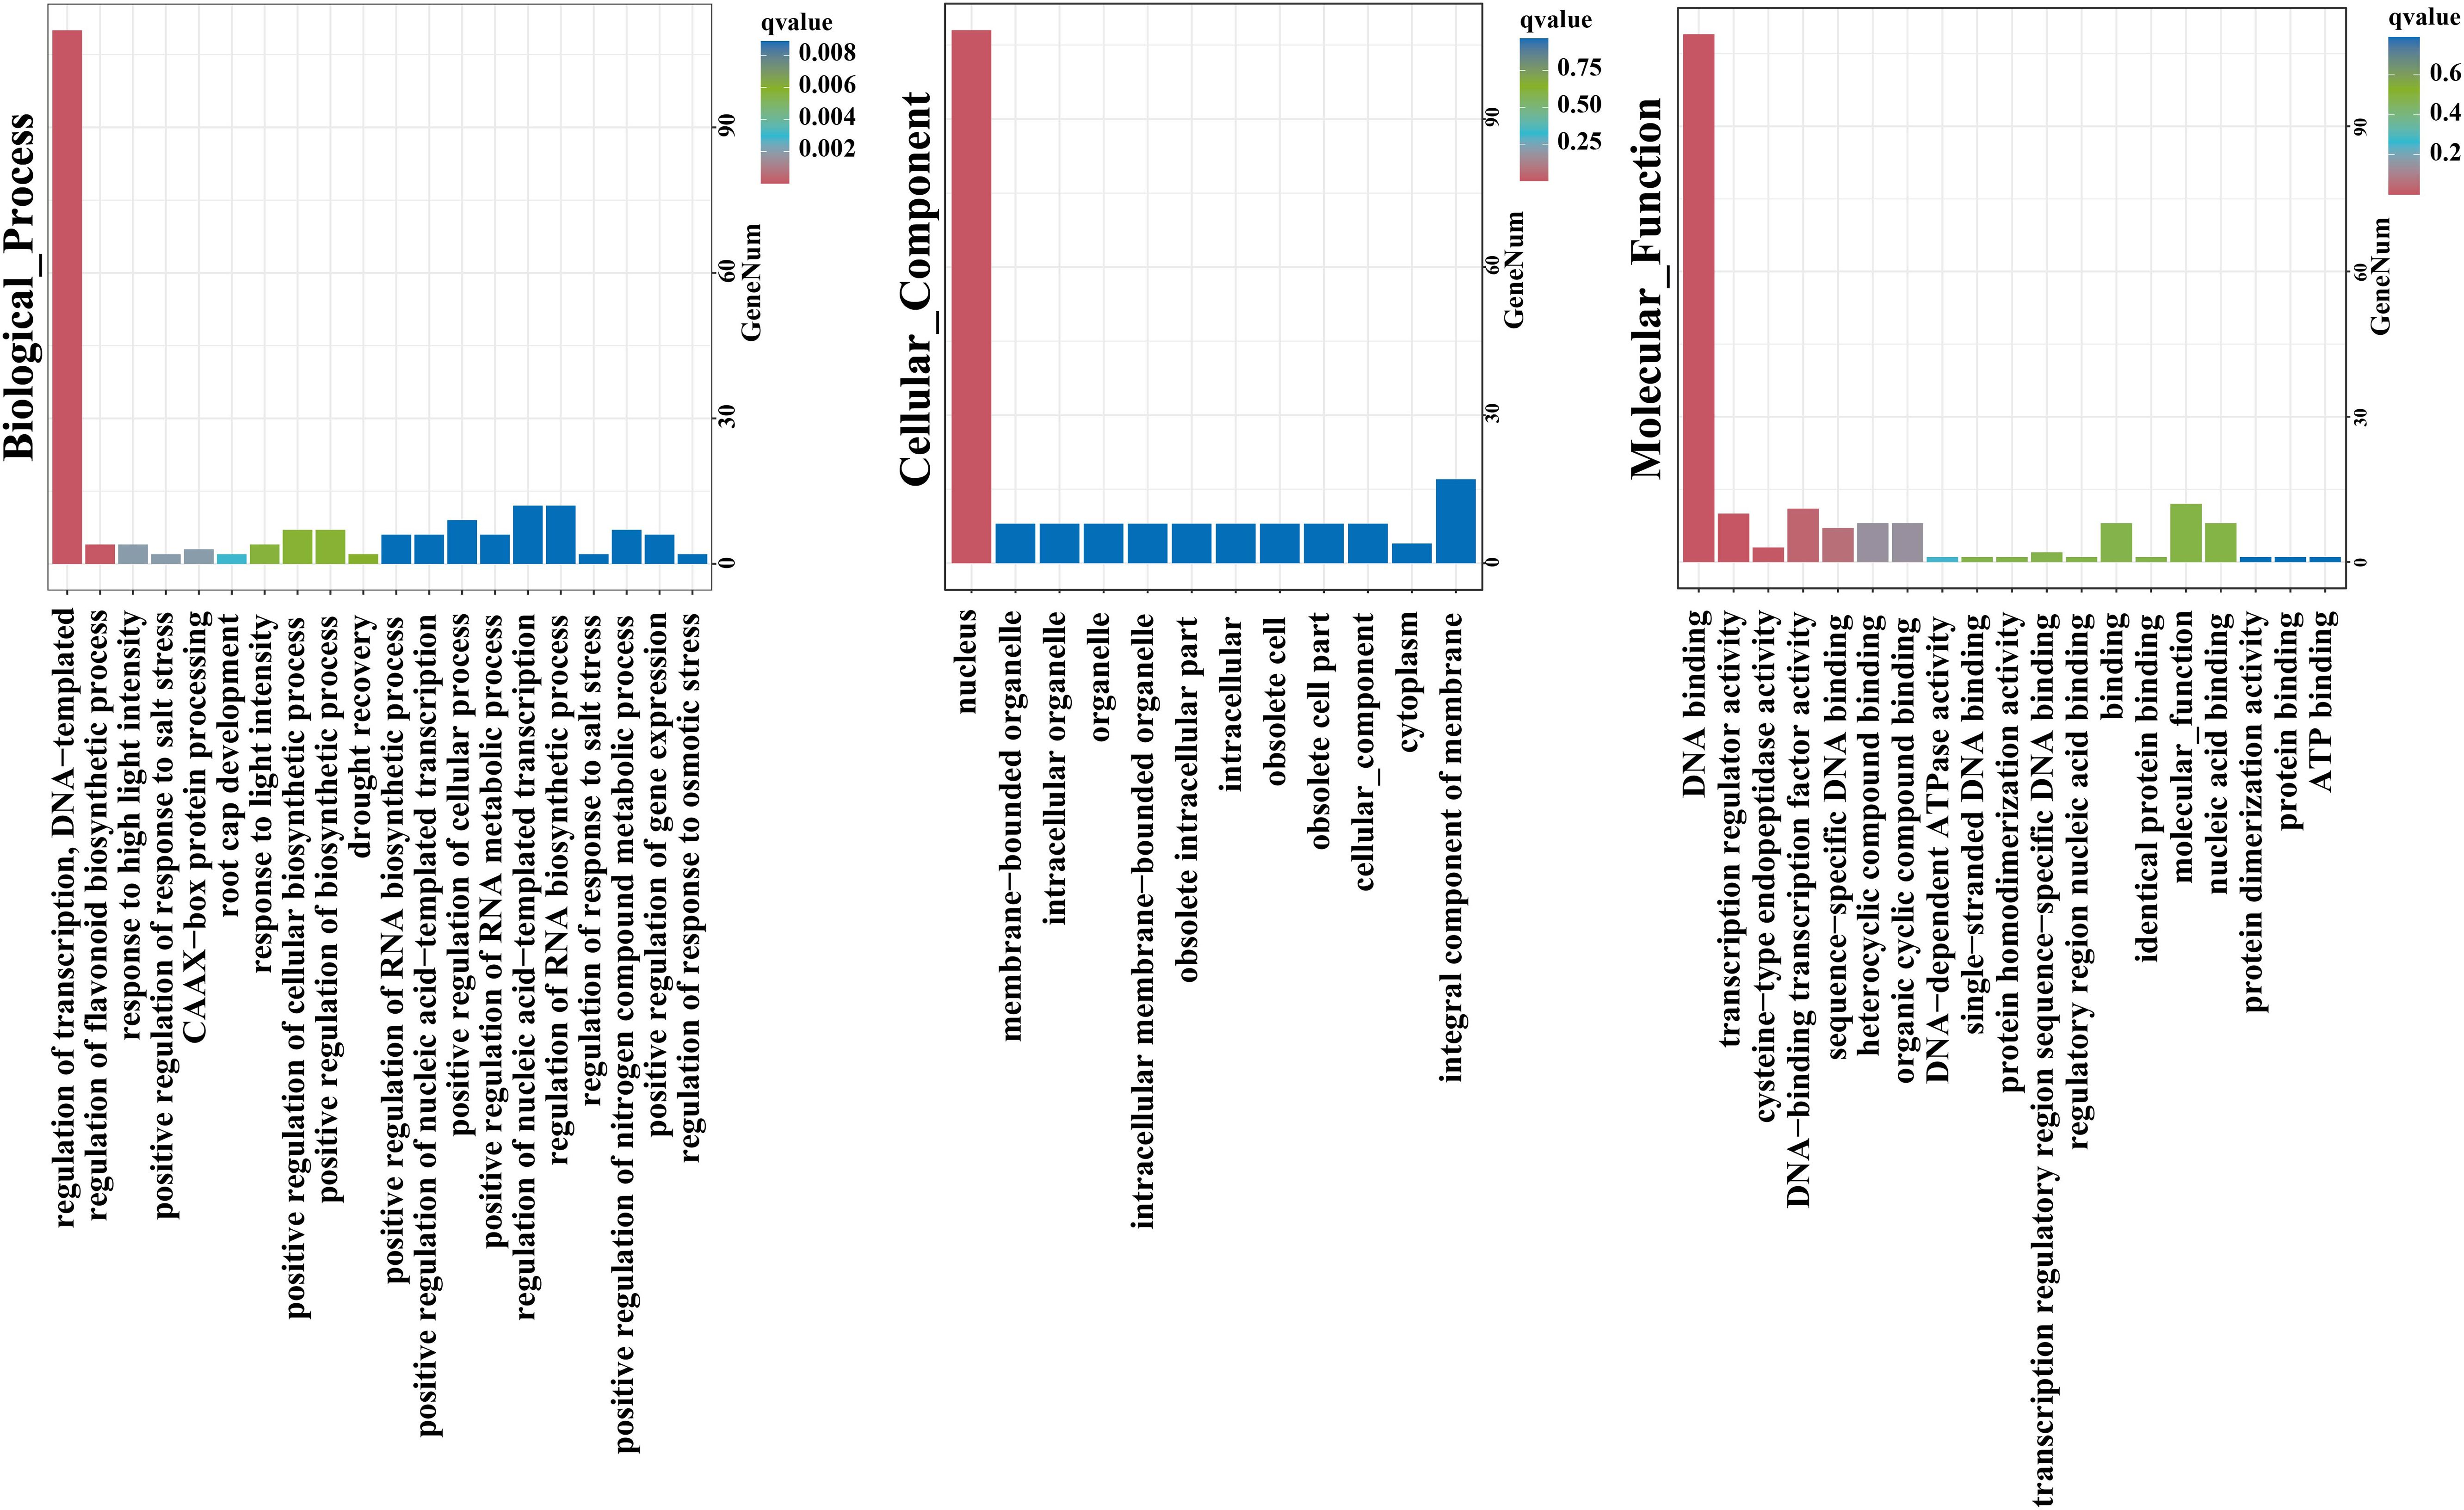
Gene Ontology (GO) analysis of 113 HcNACs were subsequently performed to exposit biological processes, molecular functions, and cellular components (Figure 6). The enrichment results showed that the cellular component was mainly the nucleus, accounting for 108 of 113. HcNAC34, HcNAC42, HcNAC87, HcNAC88, and HcNAC94 were not enriched. For the category of biological process, all other NAC proteins except HcNAC33, HcNAC34, and HcNAC42 of night lily were enriched in the regulation of transcription. Furthermore, some HcNAC proteins were enriched in the regulation of nucleic acid–templated transcription, regulation of RNA biosynthetic process, and response to abiotic stresses. The main enriched function was functional DNA binding, accounting for 109 of 113 total functions, and either HcNAC34, HcNAC42, HcNAC80, or HcNAC106 were enriched. The next most enriched function was DNA-binding TF activity (total of 11 of 113). Kyoto Encyclopedia of Genes and Genomes (KEGG) enrichment analysis showed that most HcNACs except HcNAC106 were not involved in any pathway (Supplementary Table S5). The HcNAC protein GO enrichment information was provided in Supplementary Table S5.
3.5 Expression patterns of HcNAC genes in different tissues and cis-regulatory element analysis in promoter regions
Seven different tissues, including bud, tender leaf, mature leaf, tender root, mature root, tender scape, and mature scape were used to check the tissue-specific expressions of the identified 113 HcNACs. RNA-Seq data were shown in Supplementary Table S6. Based on the analysis, the expression of HcNAC genes was detected in selected tissues, whereas their expression levels varied considerably (Supplementary Figure S1). Except for eight of the HcNACs not having expression data, the expressions of remaining genes in roots were relatively higher than the other tissues. Furthermore, 21 of 105 genes showed high transcript abundances in all tissues. To validate the RNA-Seq result, 16 HcNACs were selected for RT-qPCR analysis (Figure 7A). The expression levels were consistent with those from RNA-Seq data (Figure 7B). The results described herein represented that HcNACs might perform distinct functions through different tissues and be worth further studies.
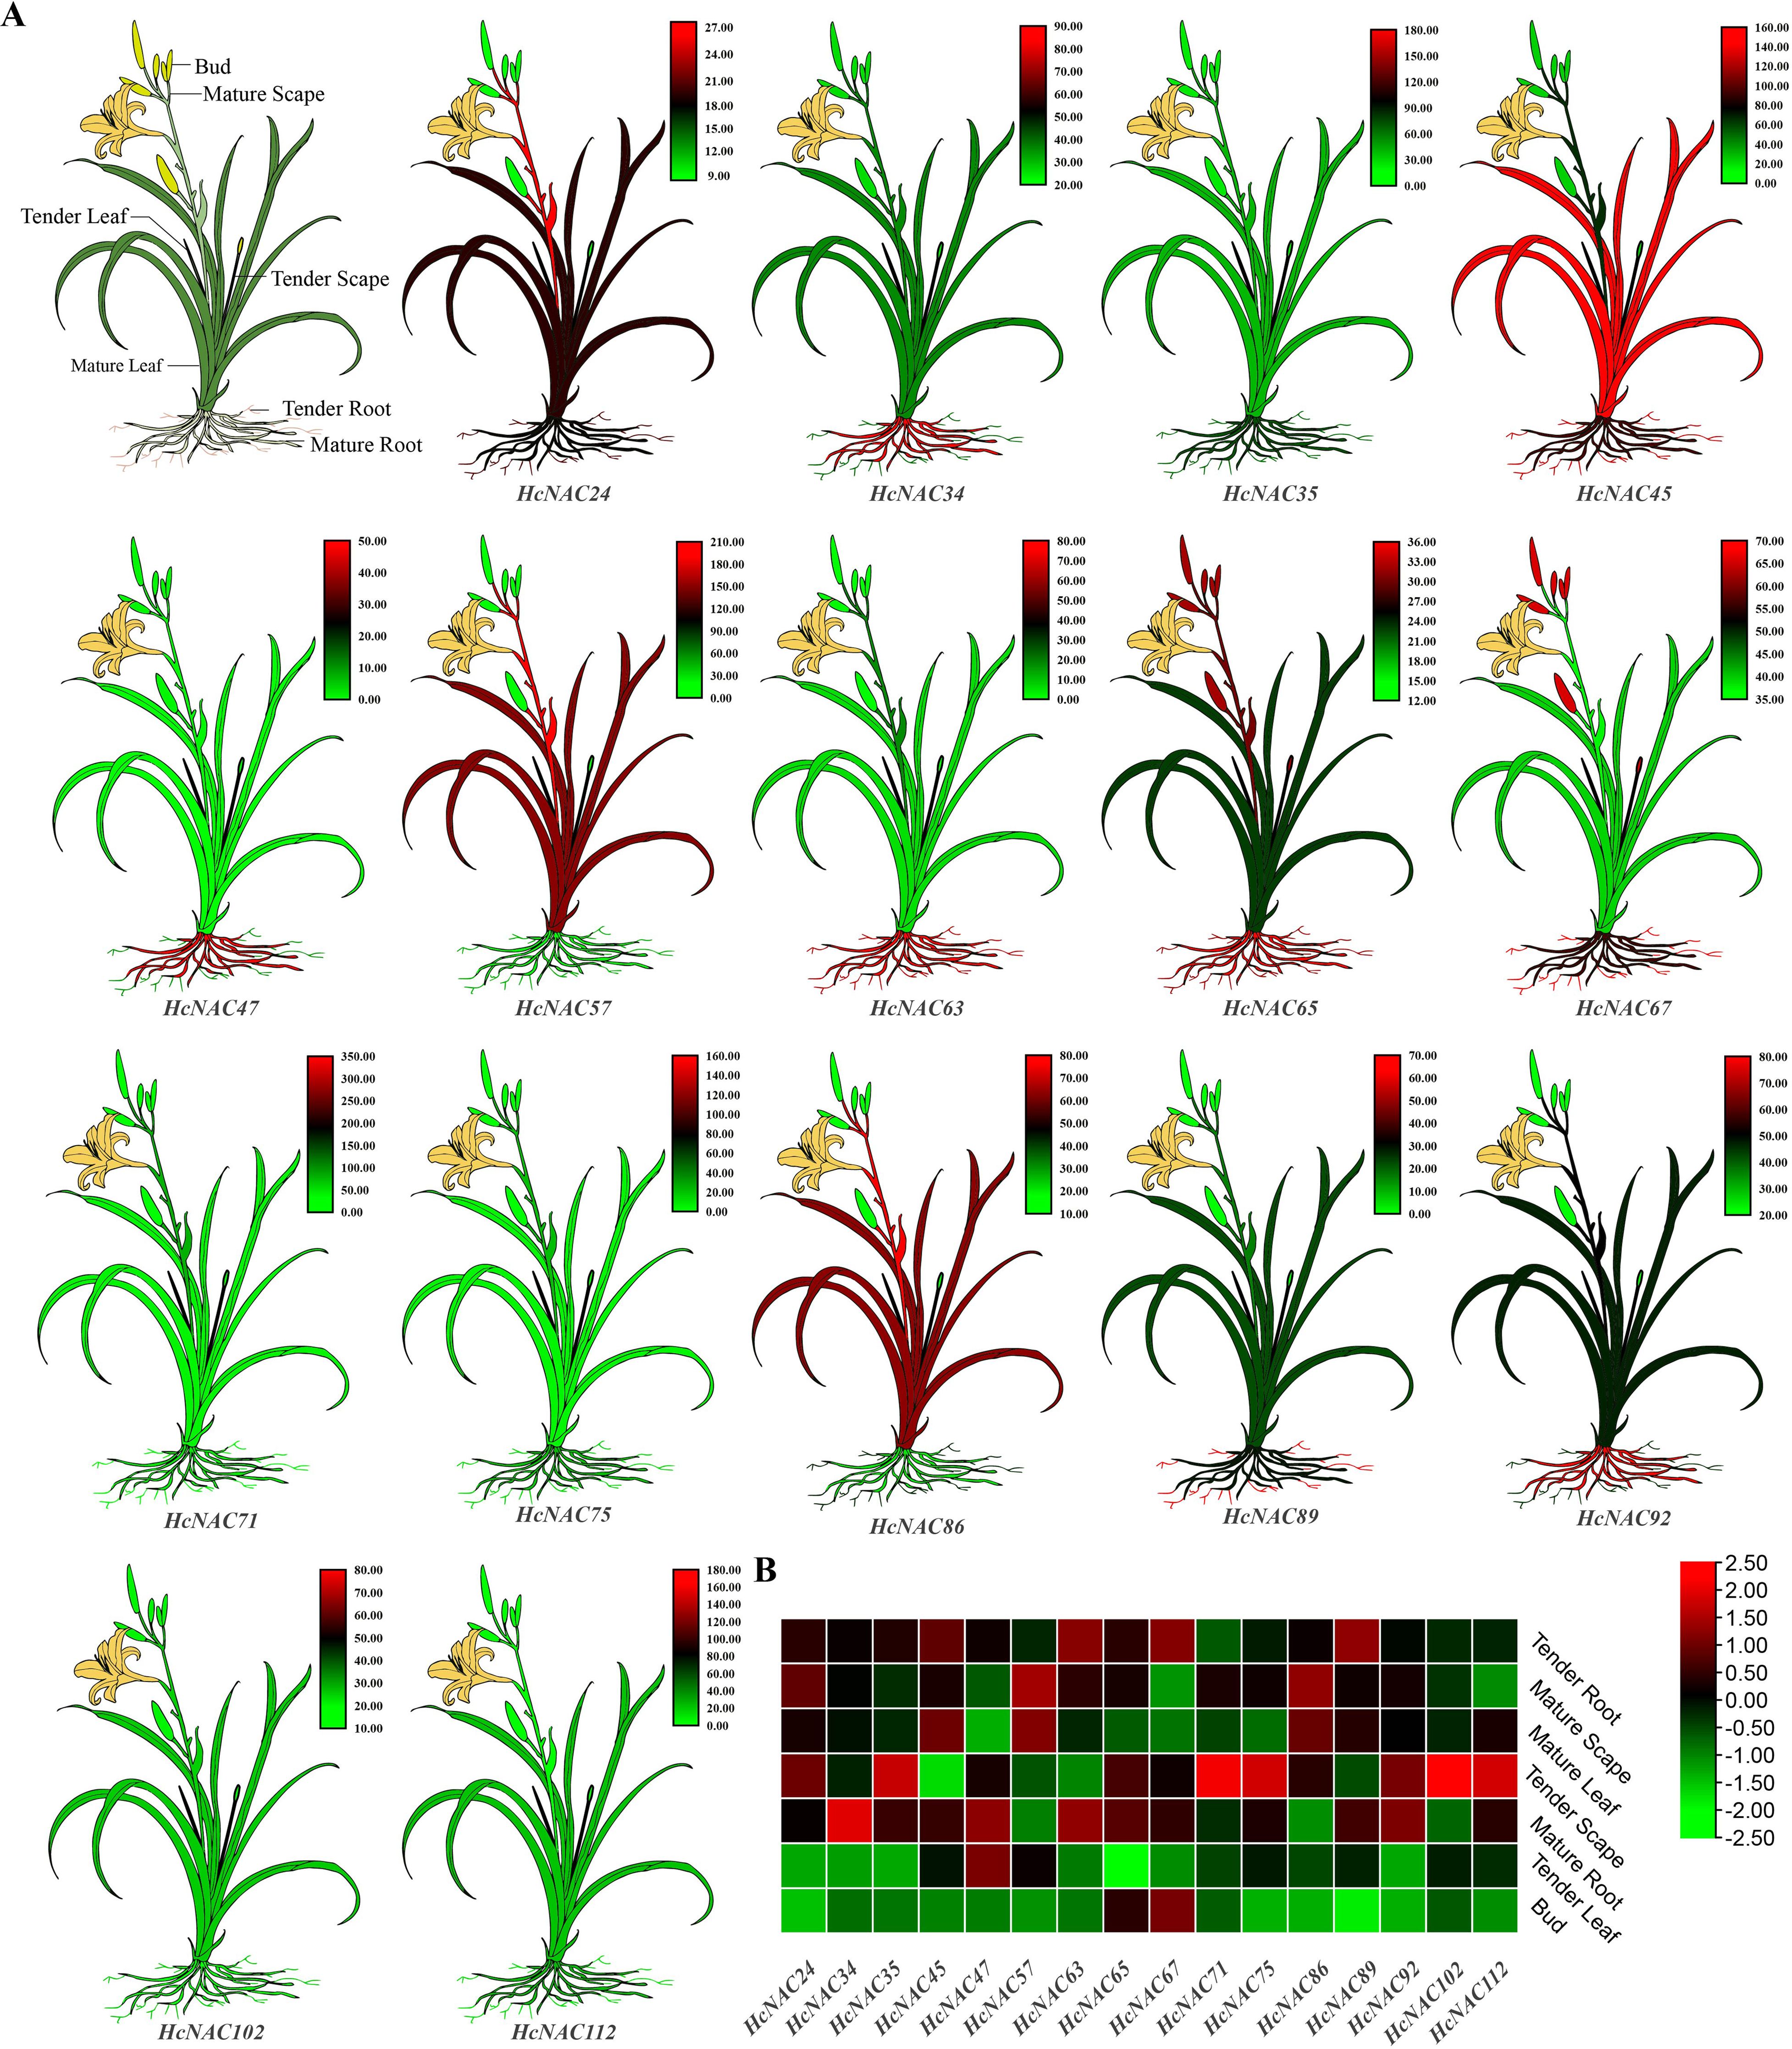
Figure 7. Diagram and expression heat maps of the selected HcNAC genes in different tissues. (A) Diagram for various tissues of night lily. Annotation of different tissues was shown in the first figure. The remaining 16 plants represented cartoon heat maps with red representing high gene expression and green representing low expression by RT-qPCR. (B) Expression heat map of 16 HcNACs in different tissues based on RNA-Seq data.
To elucidate the potential transcriptional regulation of HcNAC genes, cis-acting elements of the upstream promoter regions (2,000 base pairs) were classified and analyzed (Figure 8 and Supplementary Table S8). A total of 115 abundant regulatory elements were detected via the online PlantCARE database, HcNAC111 hosted 295 cis-elements whose number was the largest (Supplementary Table S7). We selected 21 typical responsive cis-elements to further unveil transcriptional regulation of HcNAC genes (Figure 7; Supplementary Table S8). All HcNAC genes had regulatory elements linked to stress response, involving defense and stress, wound, drought, and low-temperature responsive elements. In addition, elements of CAT-box, circadian, GCN4_motif, and O2-site were identified as key regulars of plant development. Light-response covered TCT-motif, TGA-elements, G-box, and SpI elements. Hormone-related elements were associated with auxin, abscisic acid, gibberellin, salicylic acid, and MeJA, respectively, CGTCA-motif, ABRE, AuxRR-core, GARE-motif, and P-box. Our analysis revealed the presence of different types of cis-acting elements in the HcNAC gene family, which potentially regulate plant growth and development, and in response to hormone and abiotic stress.
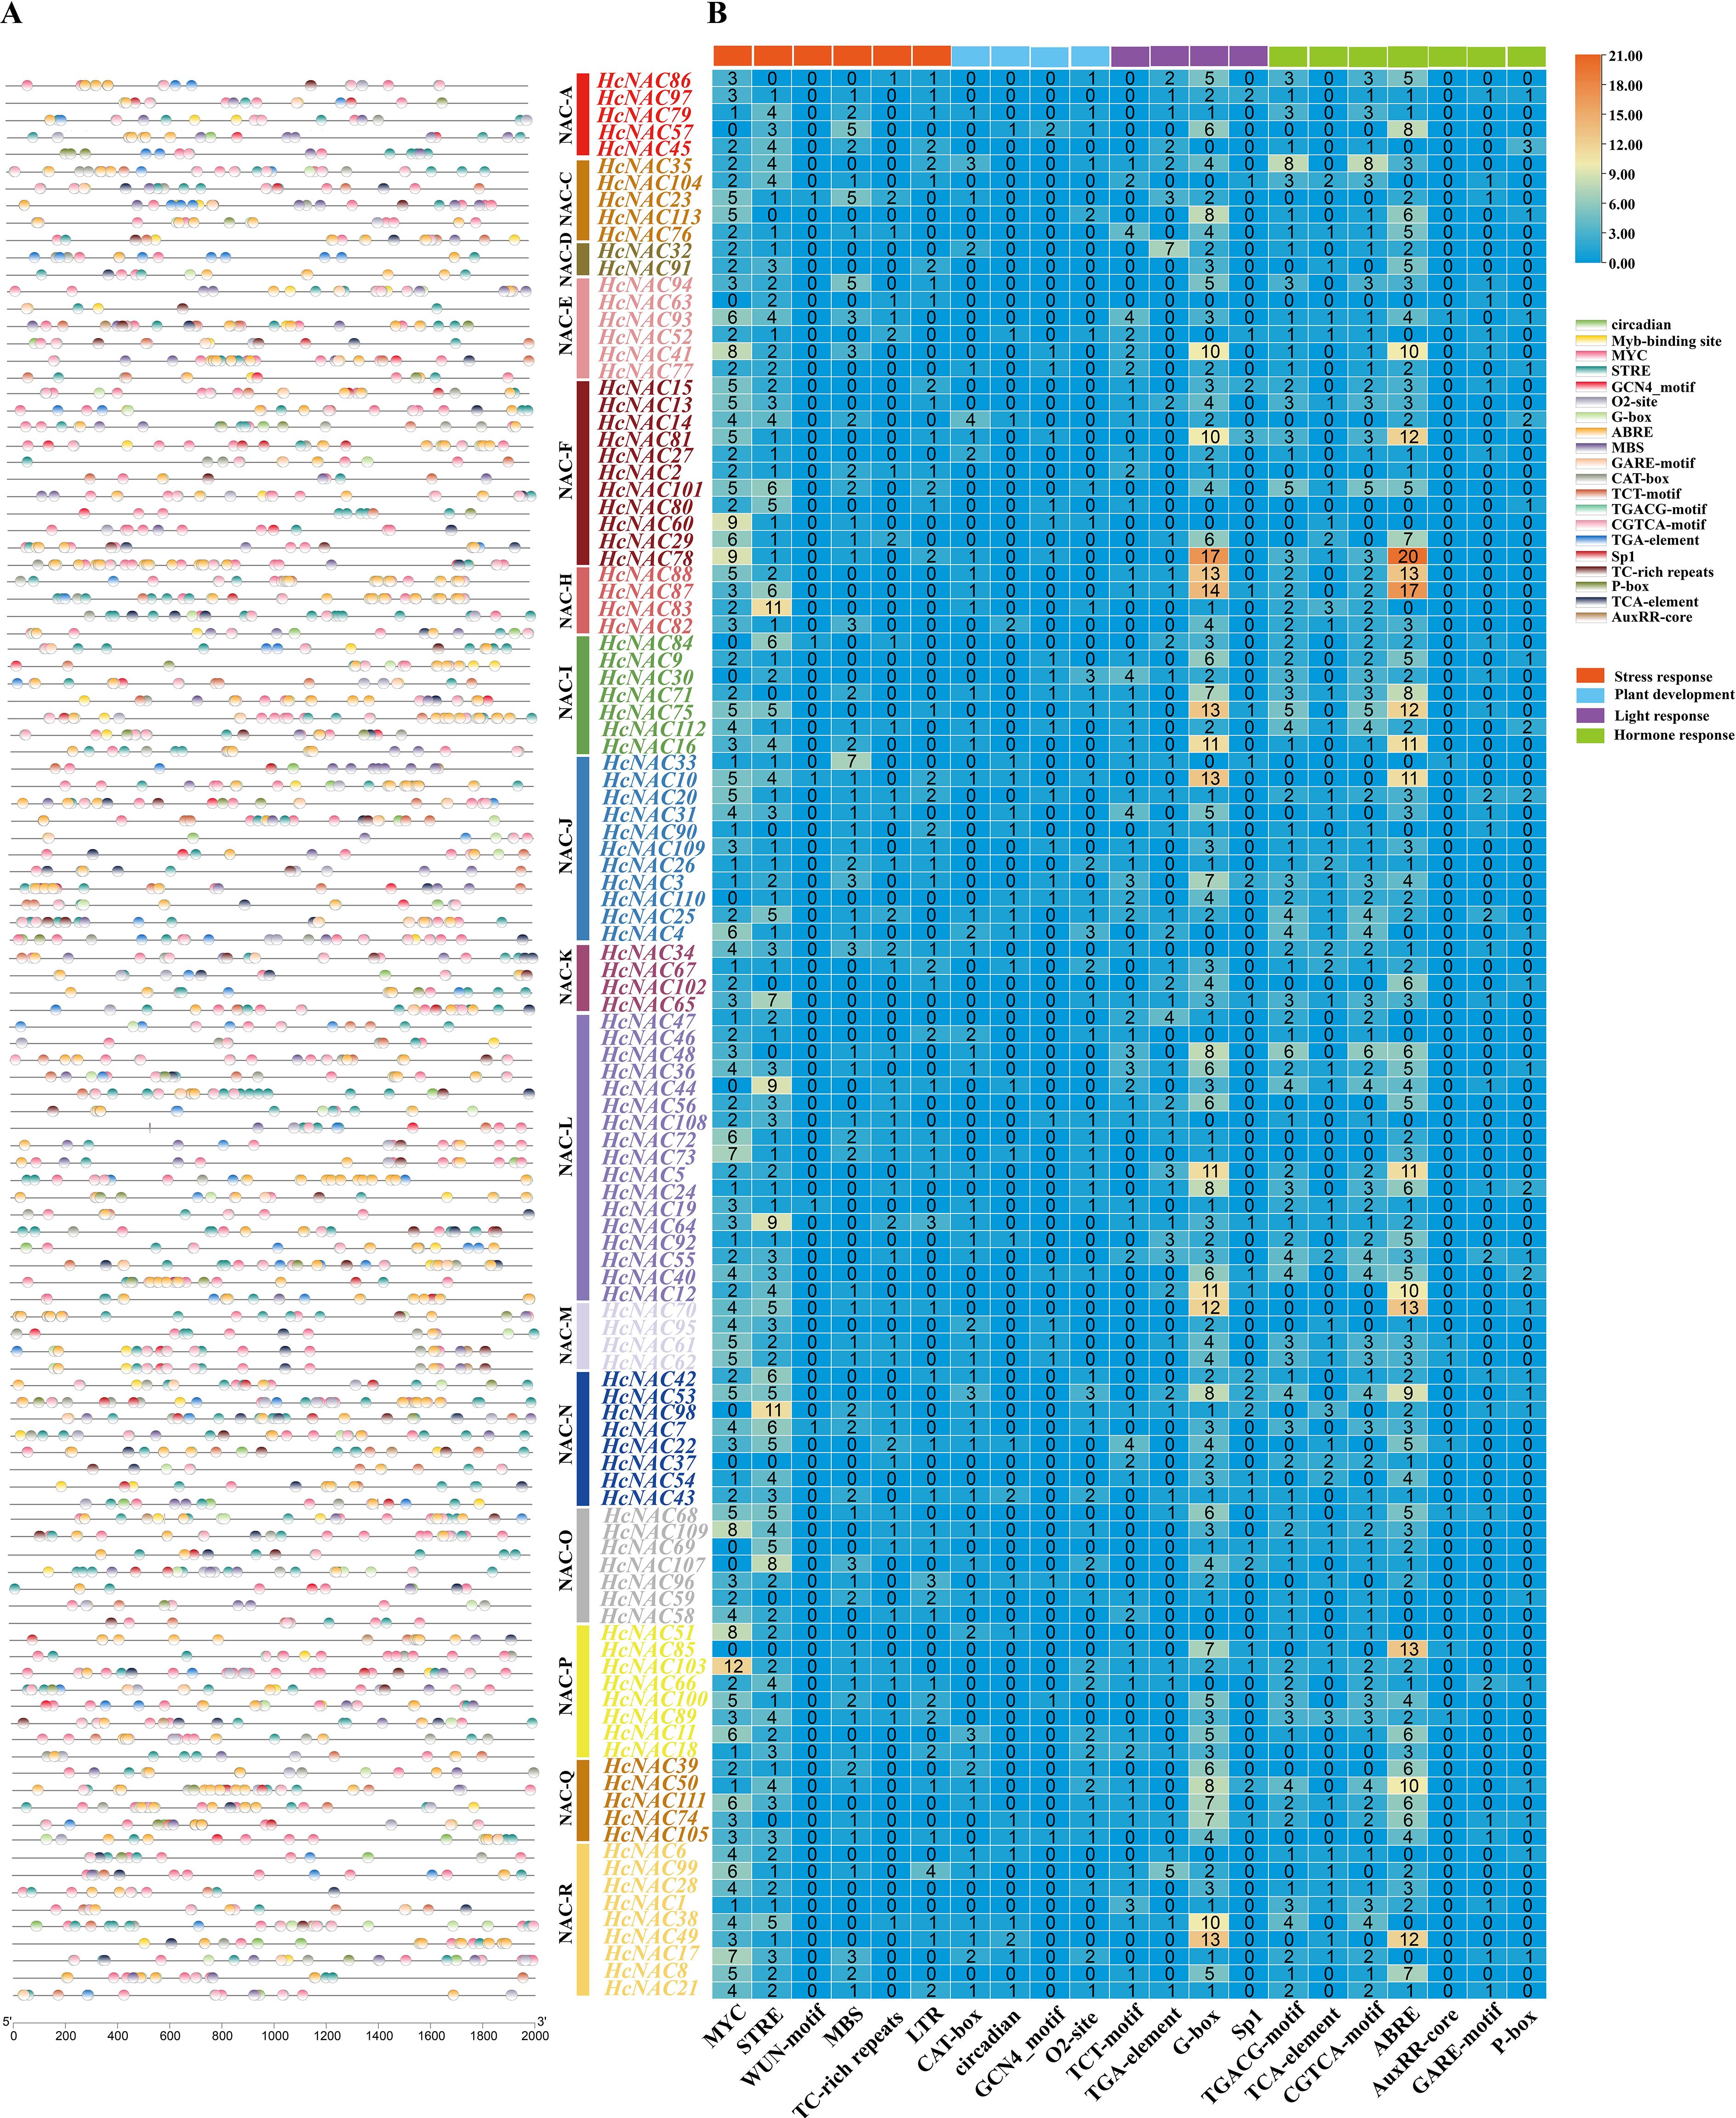
Figure 8. Distributions and numbers of cis-acting elements of the HcNAC genes. (A) The positions of diverse cis-acting elements in the promoter region. HcNACs belonging to different subgroups were denoted with different colors. (B) The corresponding number of cis-acting elements in the promoter region of each HcNAC gene.
3.6 Expression profiles of HcNAC genes under drought and salinity stresses
To better illustrate the possible roles of HcNACs in abiotic stress, we collected night lily roots to carry out RNA-Seq sequencing to identify the expression patterns of HcNAC genes after drought (PEG) treatment for 0–108 h and salt (NaCl) treatment for 0–96 h. The expressions of night lily HcNACs under drought stress were shown in Supplementary Tables S9, S10 under salinity stress. In 16 subgroups, a total of 12 HcNACs of night lily were detected with no expressions when suffering from drought while 11 were under salinity stress (Figures 9A, B). As the treatment time increased from 0 to 108 h under drought stress and 96 h under salinity stress, 10 HcNAC genes were upregulated and 5 genes were downregulated, among which HcNAC57 and HcNAC86 belonging to the NAC-A subgroup exhibited the opposite trends under two stresses. The results from RNA-Seq data revealed that the HcNAC genes were likely to function distinguishably in response to different abiotic stresses.
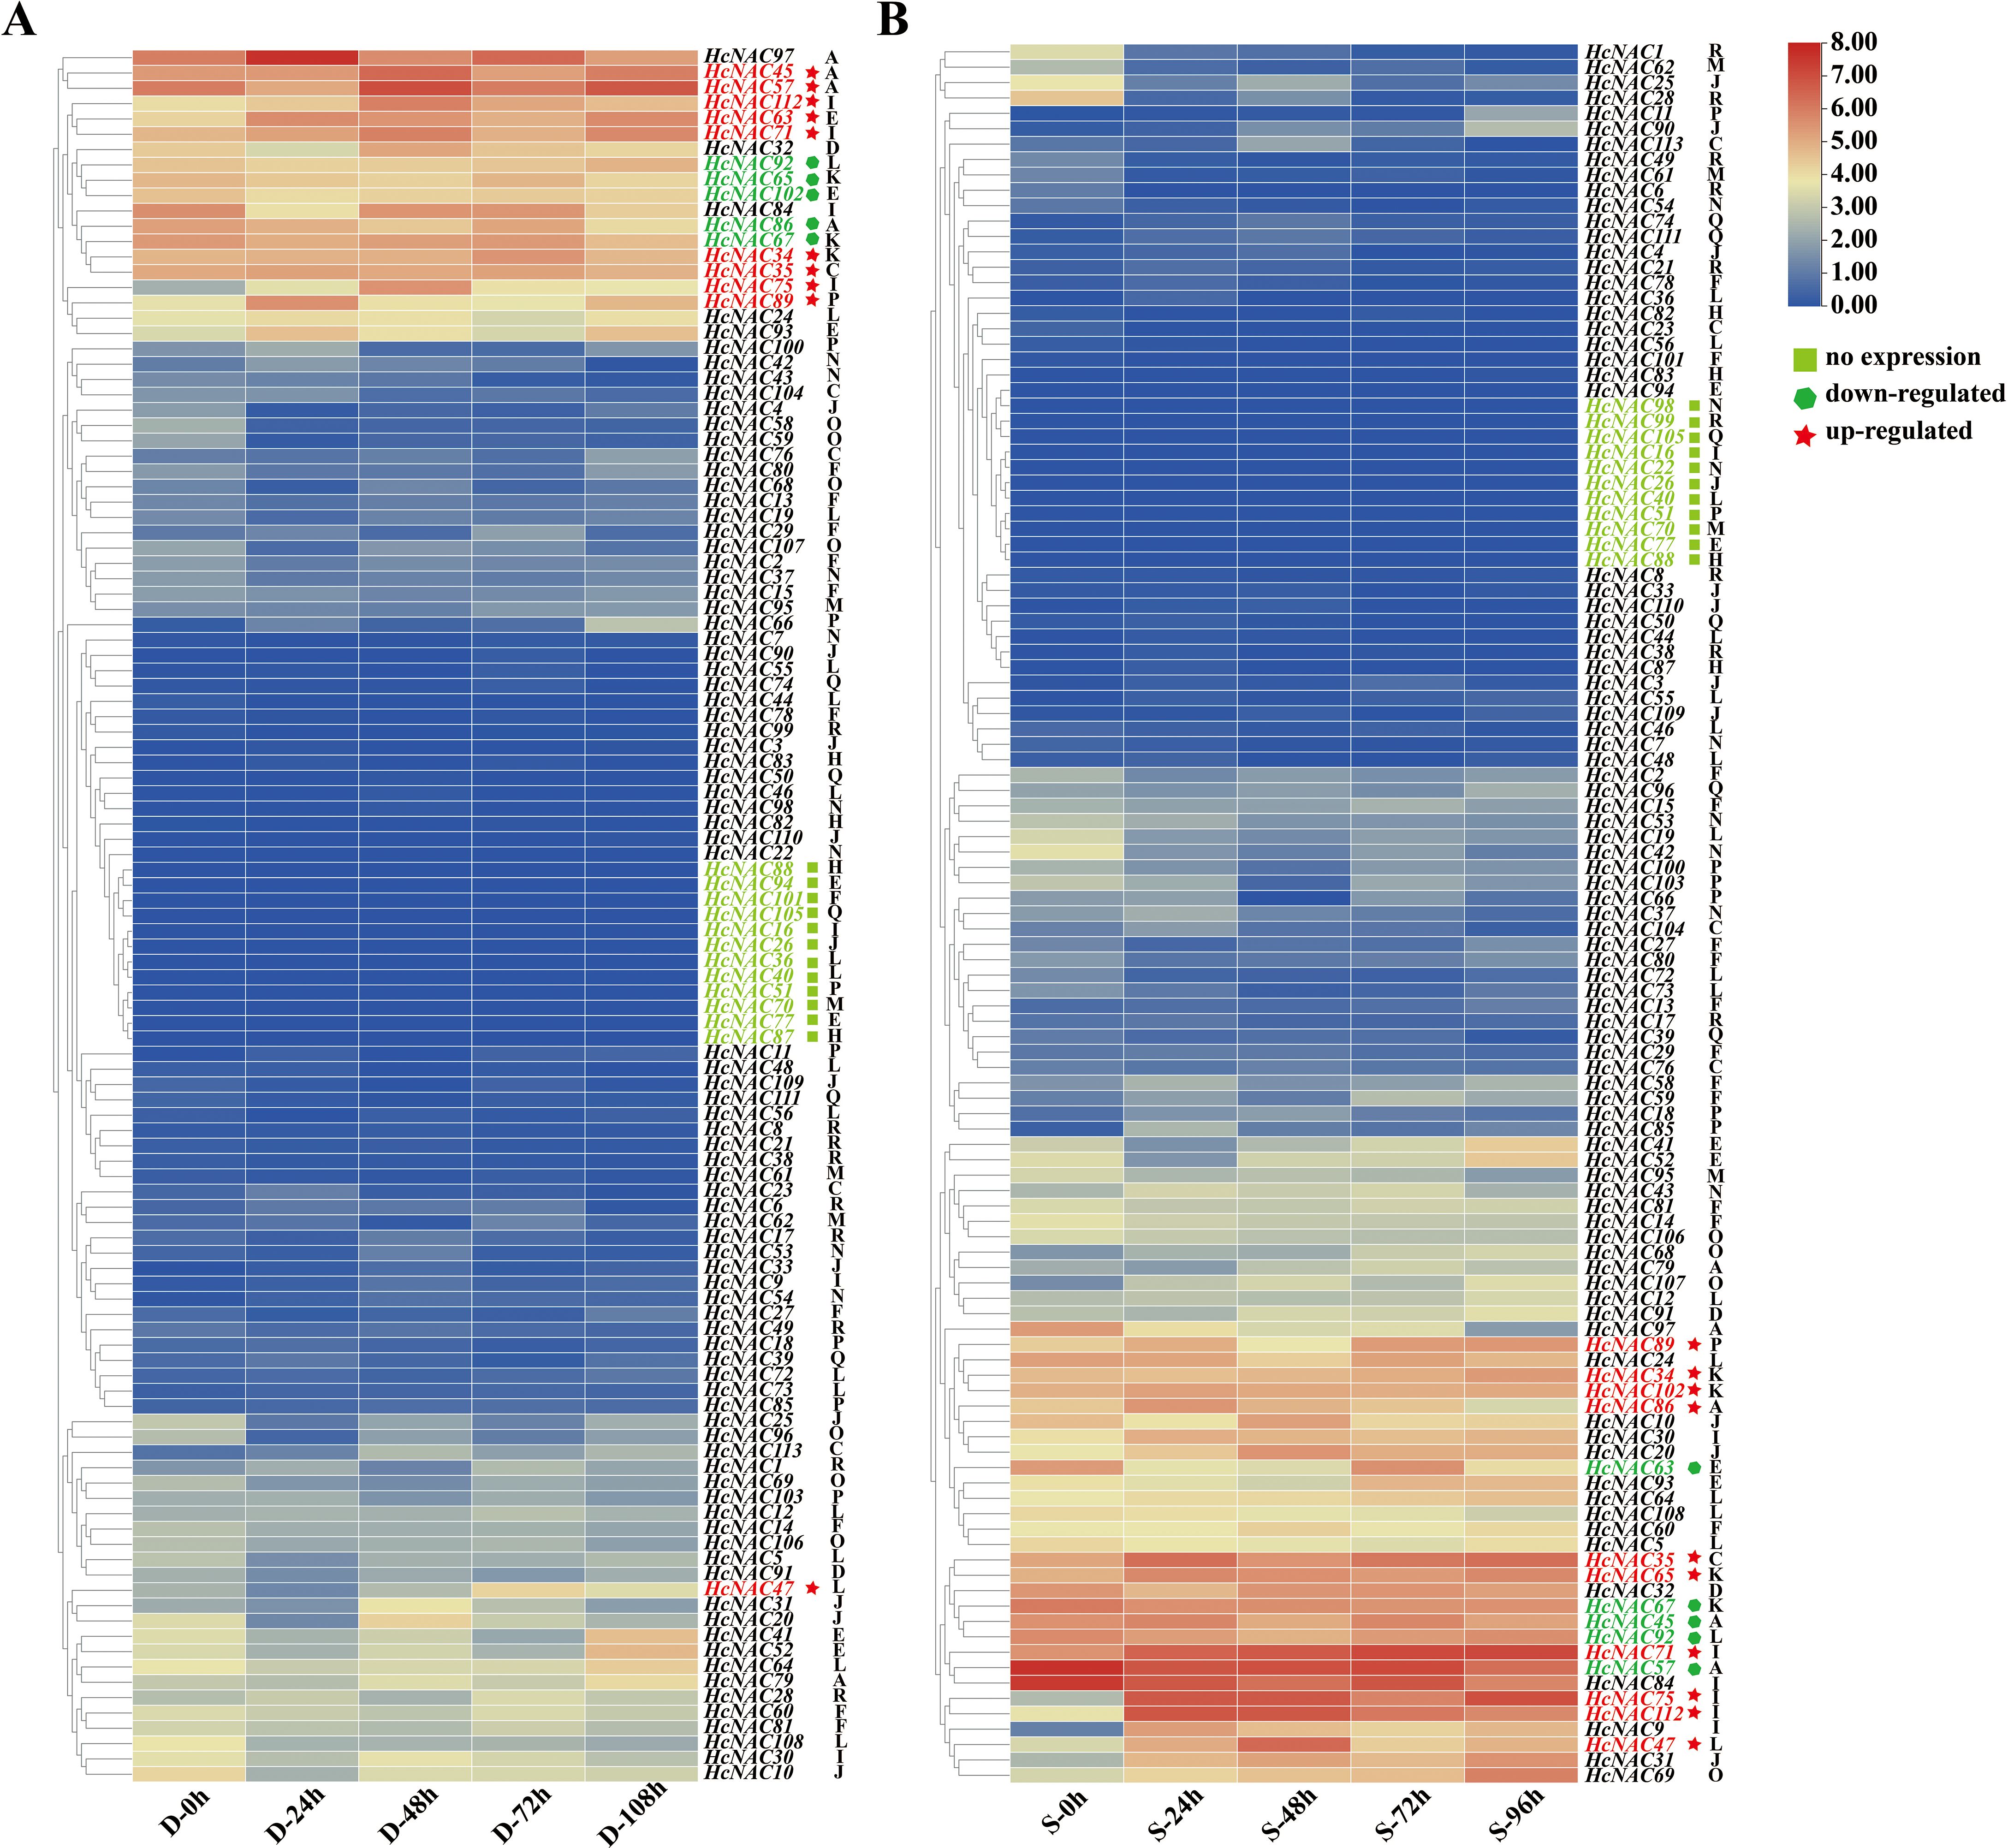
Figure 9. Expression analysis of HcNACs under abiotic stresses based on RNA-Seq data. (A, B) Expression heat maps of HcNACs under drought (A) and salinity (B) stresses. Hierarchical clustering was used in the data analysis. A, C–F, and H–R represented 16 subgroups based on phylogenetic analysis. Red and blue colors indicated high- and low-expression levels calculated with log2FPKM values. Different types of genes in expression were marked with different shapes and colors.
According to the analysis of cis-elements of upstream 2,000 bp sequence of night lily NAC genes (Figure 8 and Supplementary Table S8), most of HcNACs in 16 subgroups contained six general stress response elements: MYC, stress response element (STRE), WUN-motif, MYB-binding sites (MBS), TC-rich repeat (cis-acting factor involved in defense and stress response), and low-temperature response motif (LTR). They accounted for 40%, 34%, 1%, 12%, 5%, and 8% of the total number of cis-elements identified in abiotic and biotic stress categories, respectively. In 16 genes which showed high expression in different tissues and abiotic stresses, the number of stress response elements ranged from 2 to 14. Among them, seven HcNAC genes (HcNAC34, HcNAC35, HcNAC45, HcNAC57, HcNAC65, HcNAC75, and HcNAC89) contain more stress response elements than other genes. HcNAC63 in the NAC-E subgroup did not contain MYC response element involved in abiotic stress response. Three genes (HcNAC71, HcNAC86, and HcNAC102) did not contain STRE response element. It was speculated that HcNACs might be involved in diverse abiotic stress responses and regulatory pathways.
Several NAC genes have been reported to regulate the growth and development of plants against abiotic stress (Huang et al., 2013). To gain insights into the putative functions of HcNAC genes in growth and development, the transcription levels of 16 genes, which showed significant expression disparities under PEG treatment, were scrutinized by RT-qPCR (Figure 10A). HcNAC65, HcNAC86, and HcNAC102 were downregulated. On the contrary, seven HcNAC genes (HcNAC34, HcNAC35, HcNAC47, HcNAC63, HcNAC75, HcNAC89, and HcNAC112) showed an increasing trend with time extension after treatment. Furthermore, HcNAC35 showed the most significant upregulation by drought stress. Therefore, HcNAC35 was considered a candidate gene for abiotic stress responses, and further studies of the gene expression during PEG treatment were needed. The results hinted at the consistency of RT-qPCR and transcriptome results under drought stress (Figures 10A, B), which provided a crucial reference for functional gene selection in the NAC gene family of H. citrina.
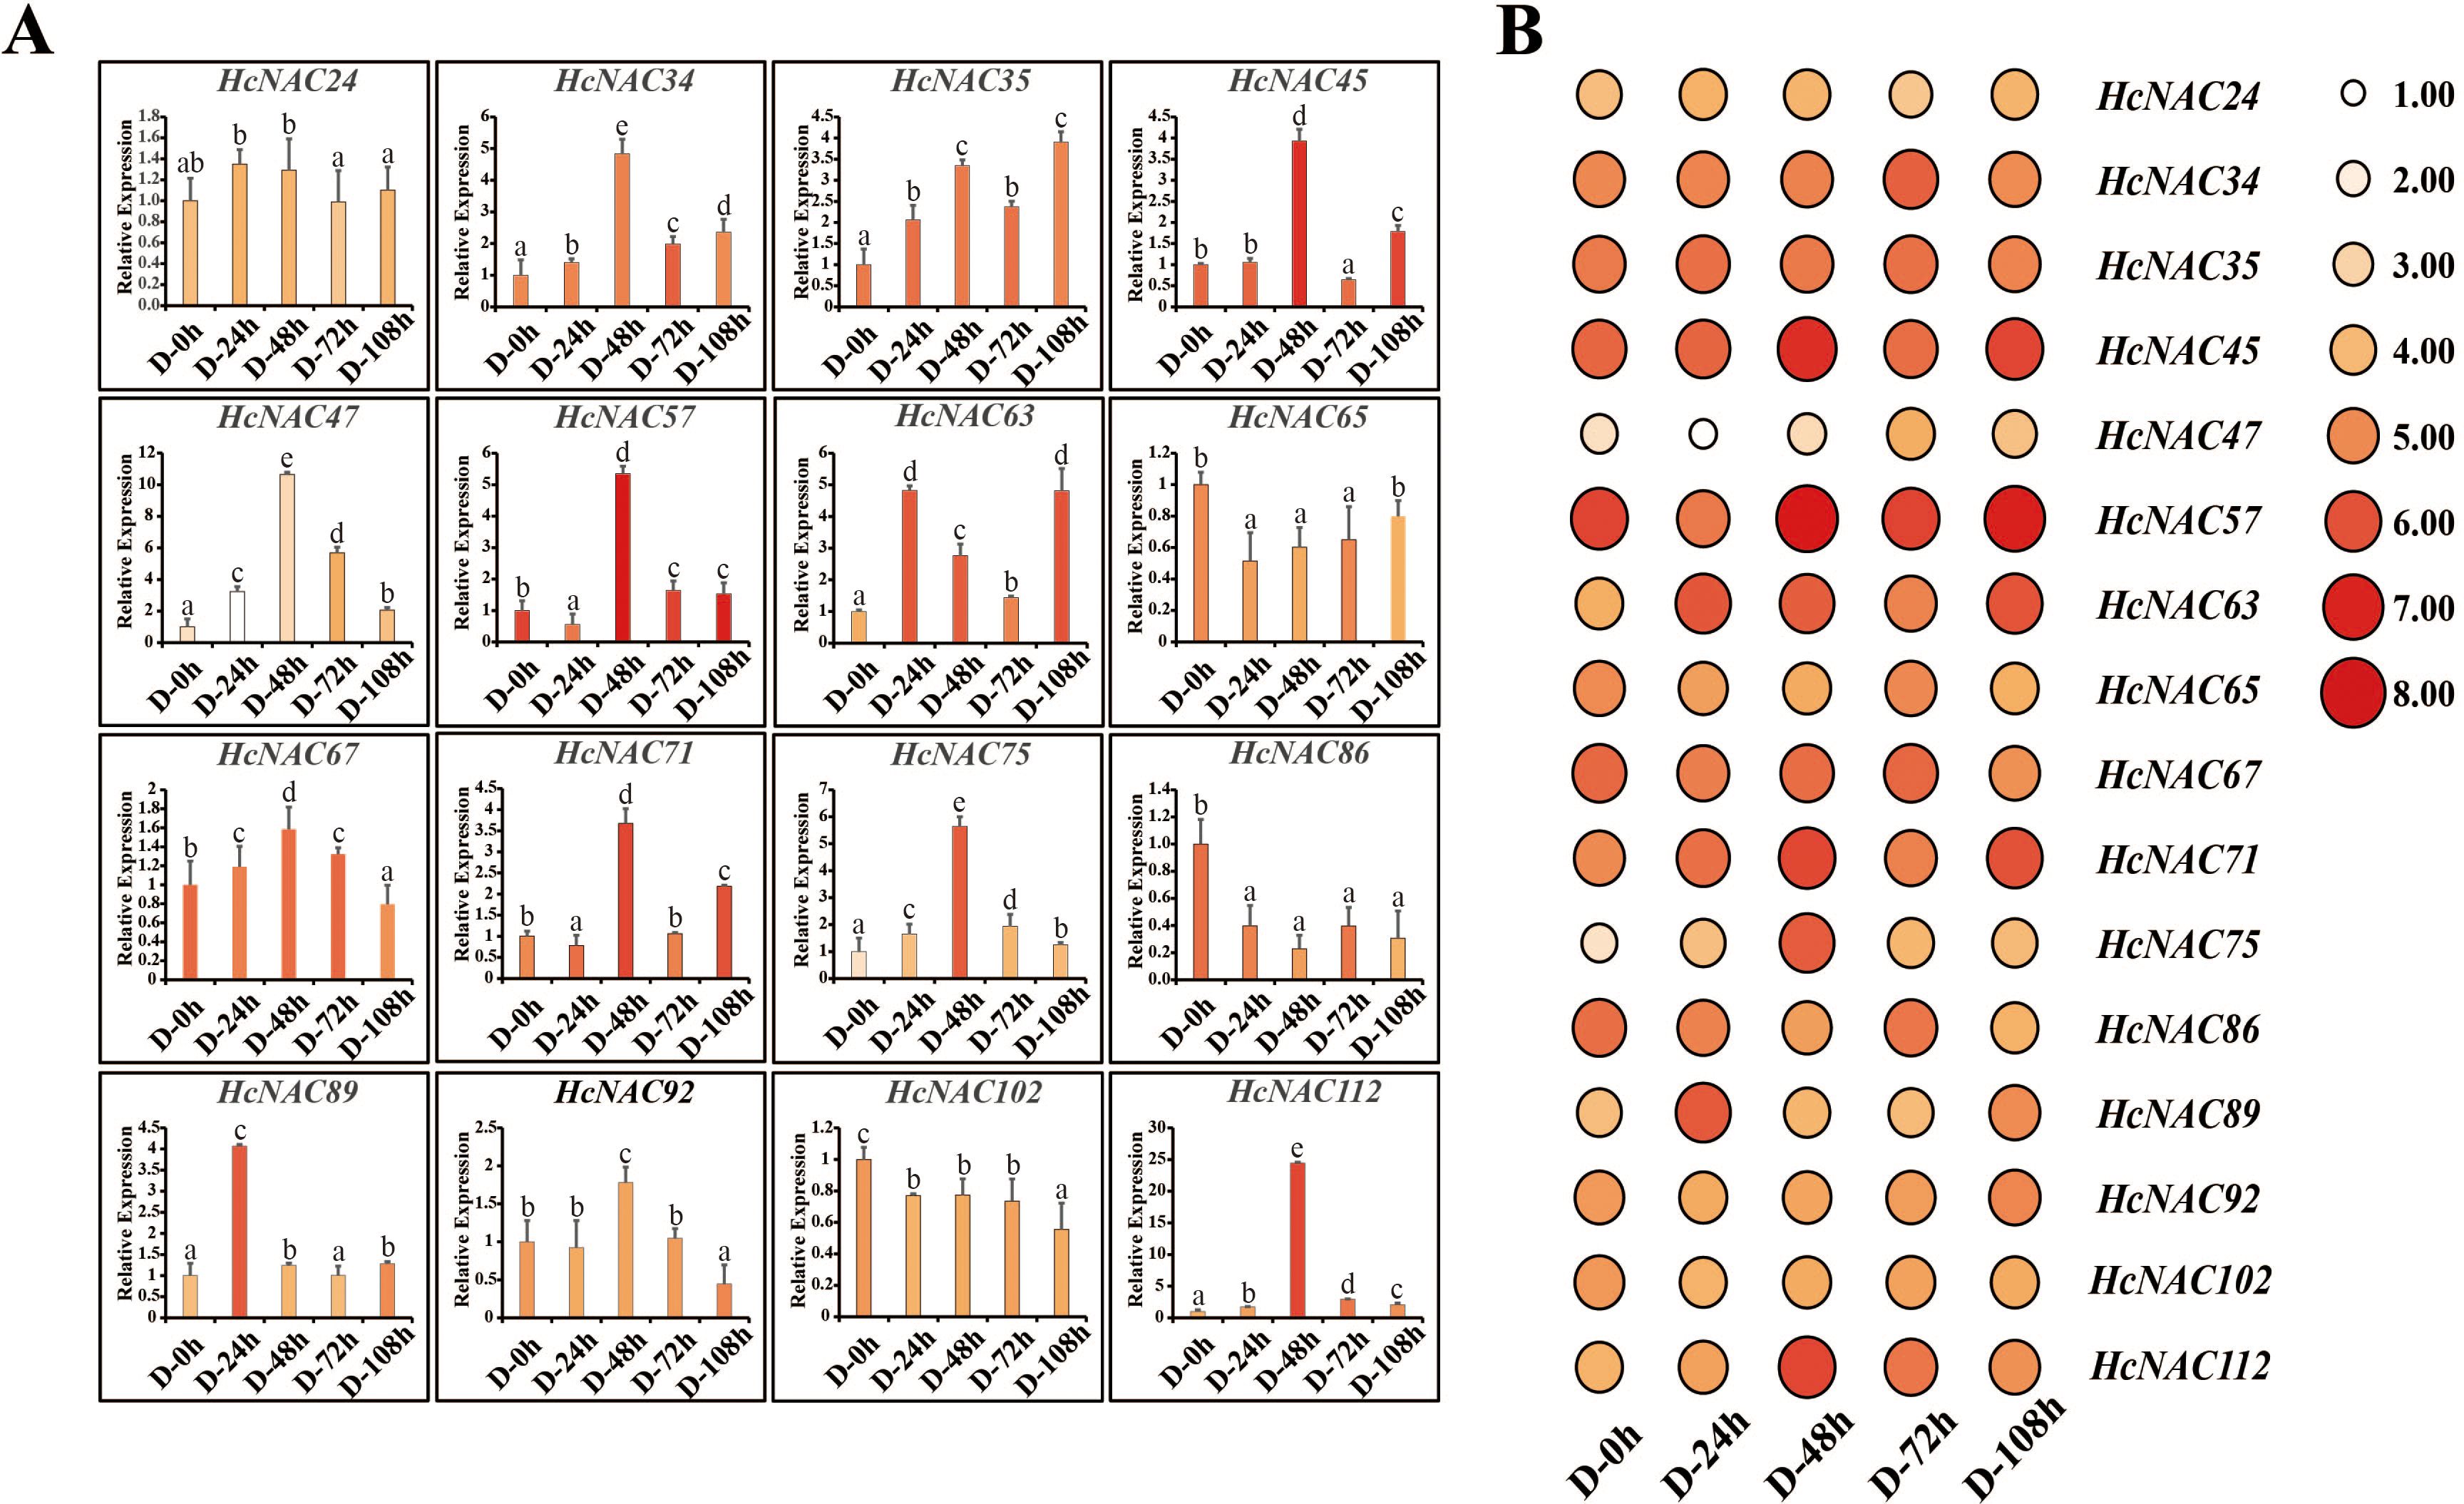
Figure 10. The expression of 16 HcNAC genes under drought stress (20% PEG) for 0–108 h in roots. (A) Expression levels of the HcNACs after drought treatment by RT-qPCR. The lowercase letters indicated statistically significant differences (p < 0.05). (B) Expression patterns of the HcNACs after drought treatment based on transcriptome data.
For salinity stress, we also performed RT-qPCR experiments to confirm the data accuracy of the selected 16 genes. As observed in Figure 11A, the expression of HcNAC57 displayed a decrease of twofold to threefold obviously while HcNAC67 was downregulated slightly, being suppressed at all processing times. In contract, eight genes (HcNAC35, HcNAC47, HcNAC65, HcNAC71, HcNAC75, HcNAC89, HcNAC102, and HcNAC112) exhibited upregulation after NaCl treatment. Notably, the expression of HcNAC35 and HcNAC71 were significantly increased by threefold to sevenfold at 24–96 h of treatment in response to salinity stress. Therefore, the consistency was equally manifested between RNA-Seq and qPCR results under salinity stress (Figures 11A, B), indicating that the sequencing data were highly reproducible. Overall, the expression patterns of HcNAC genes under different stress conditions proved that down- or up-expressed genes might engage in various stress responses.
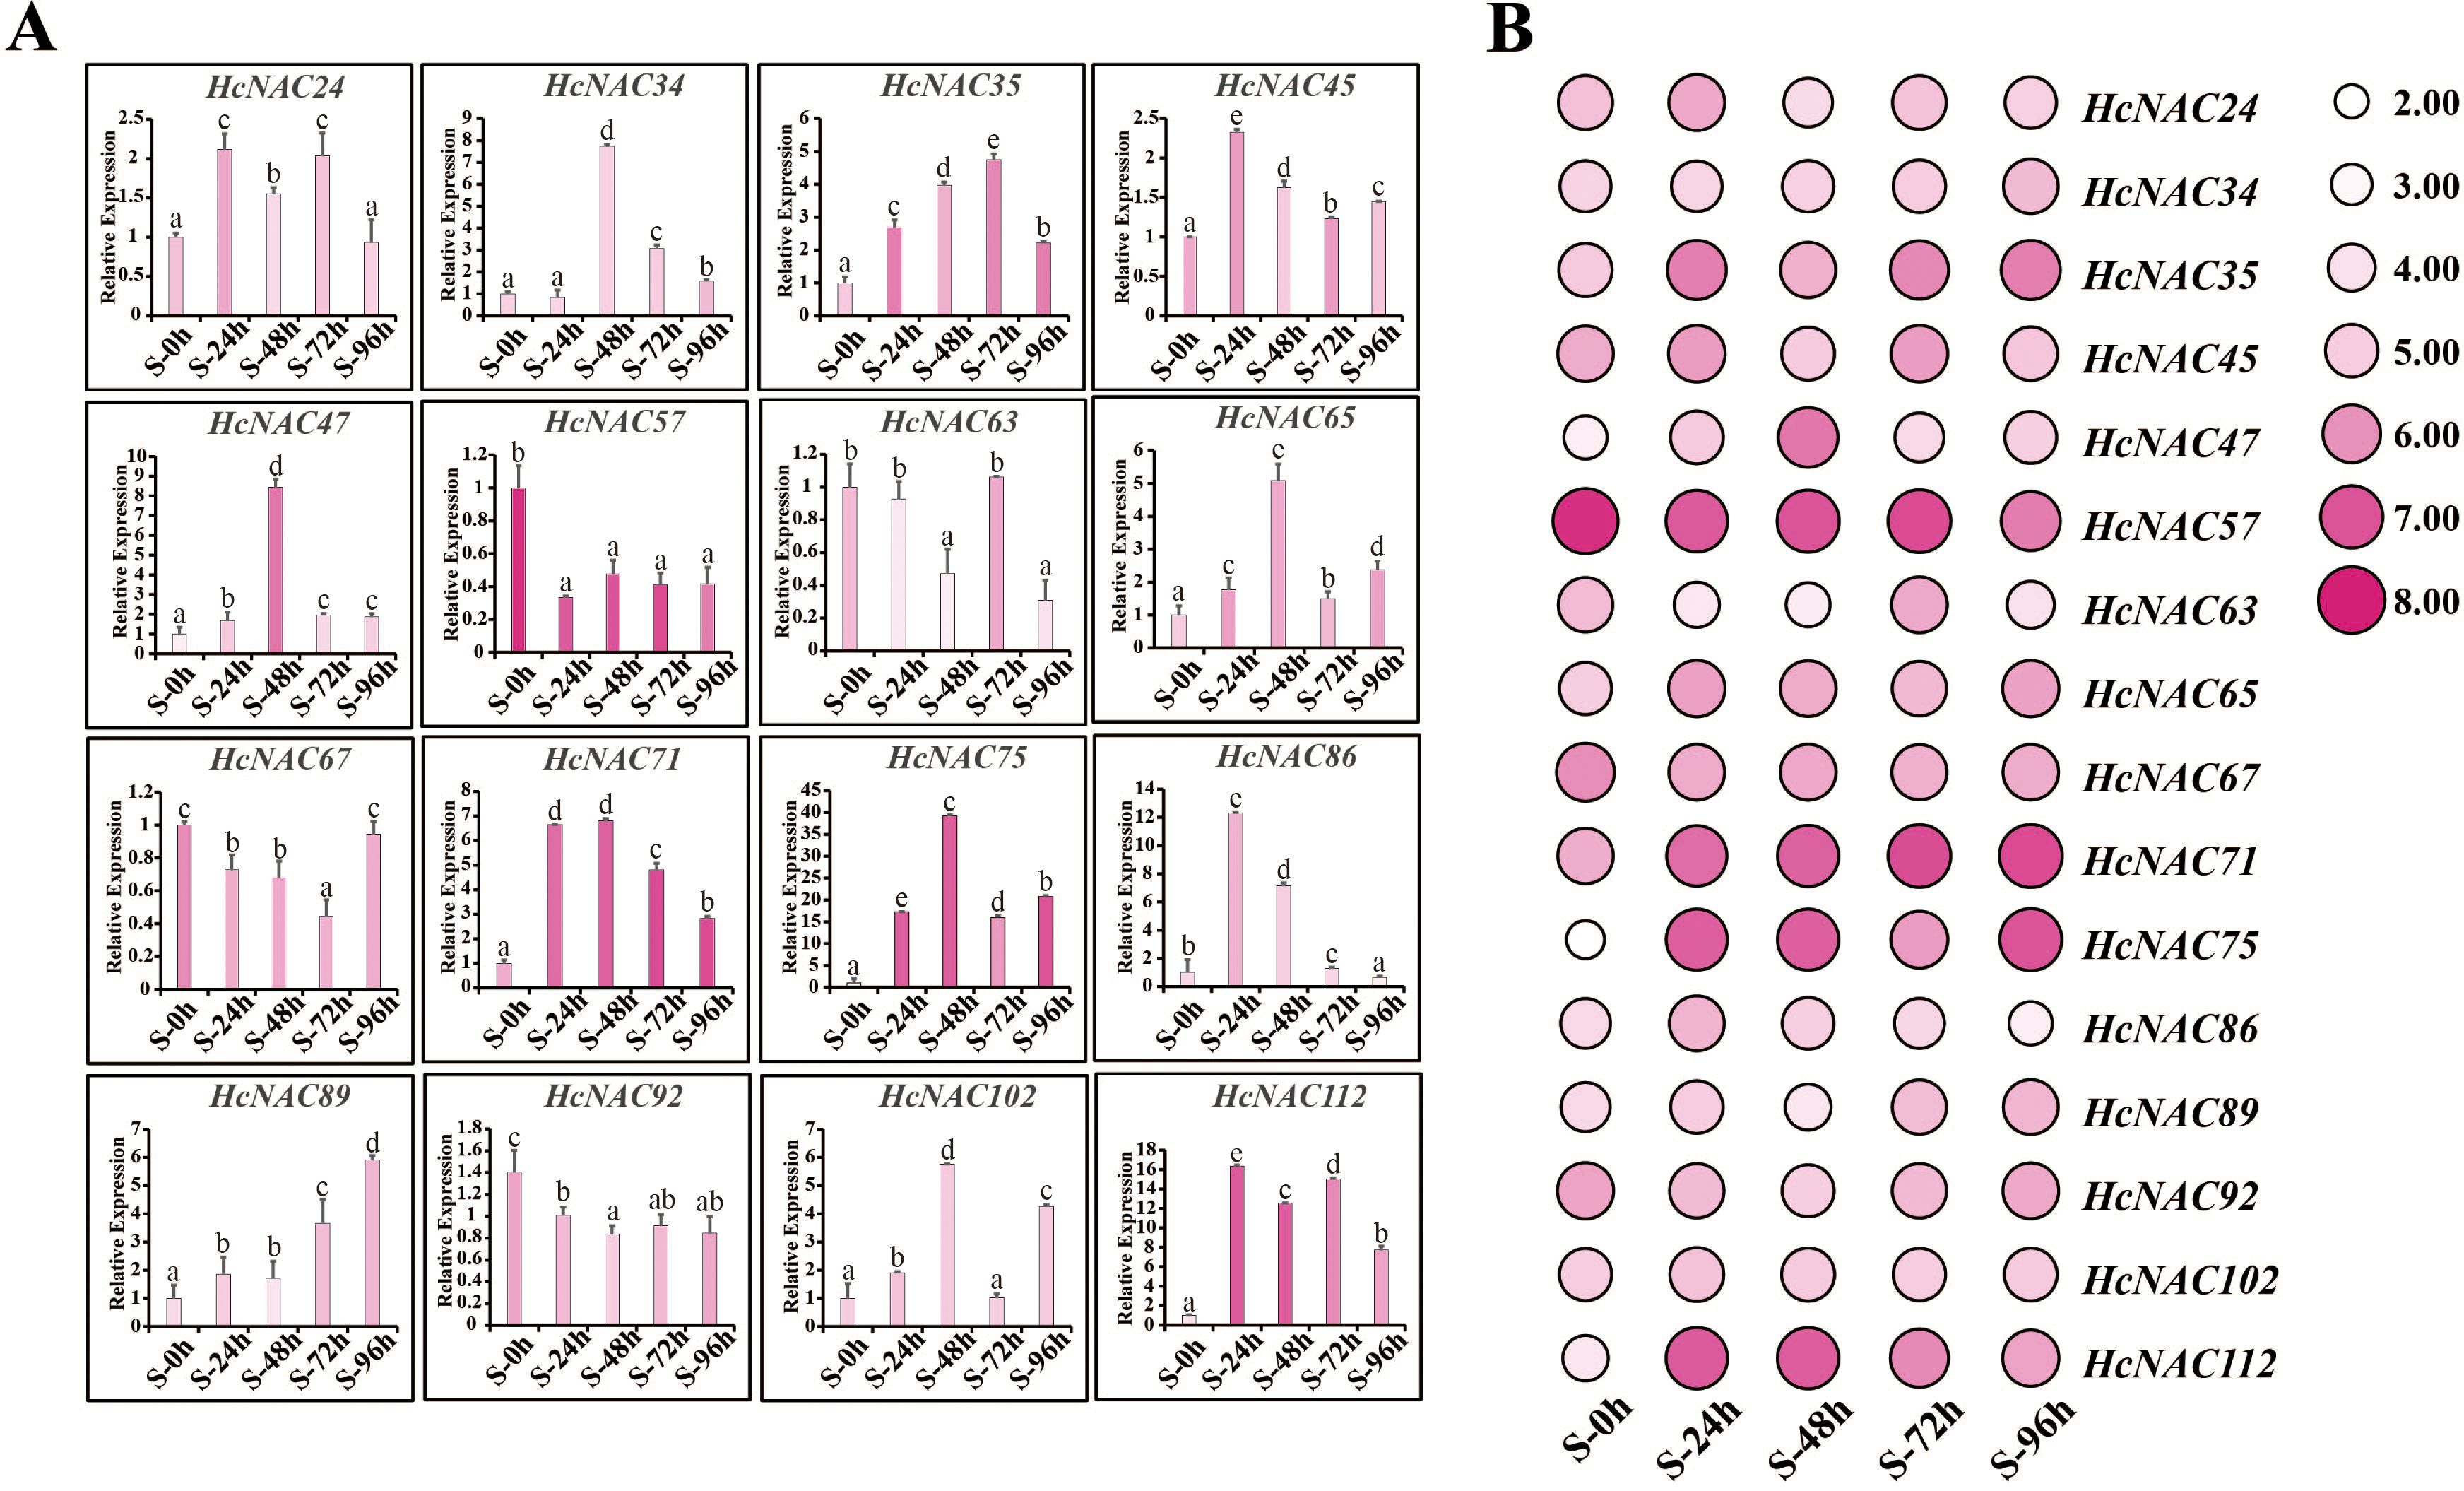
Figure 11. Expression levels of the selected HcNAC genes under salinity stress (250 mM NaCl) for 0–96 h in roots. (A) Relative expression levels of the HcNACs after salt treatment by RT-qPCR. The lowercase letters indicated statistically significant differences (p < 0.05). (B) Expression patterns of the HcNACs after salt treatment based on RNA-Seq data.
3.7 Subcellular localization of HcNAC35 and HcNAC71
Subcellular localization is known to be used to predict protein function. As one of the gene families classified into the TFs, most HcNAC genes in addition to HcNAC35 and HcNAC71 were predicted to locate in the nucleus (Supplementary Table S2). To test the accuracy of predicted results, we selected HcNAC35 and HcNAC71, which exhibited distinct patterns in expression under drought and salt treatment, to construct HcNACs-GFP fusion proteins. As shown in Figure 12, the results of the empty vector showed that strong fluorescence signals could be detected in the nucleus, cytoplasm, and cell membrane when pSuper1300-GFP was transformed. The signal location of HcNAC35-GFP and HcNAC71-GFP was only within the nucleus, which was the same as the predictions. It is speculated that HcNAC35 and HcNAC71 may play a role in the nuclear regulation as typical TFs, and the deep specific functions remain to be uncovered in future studies.
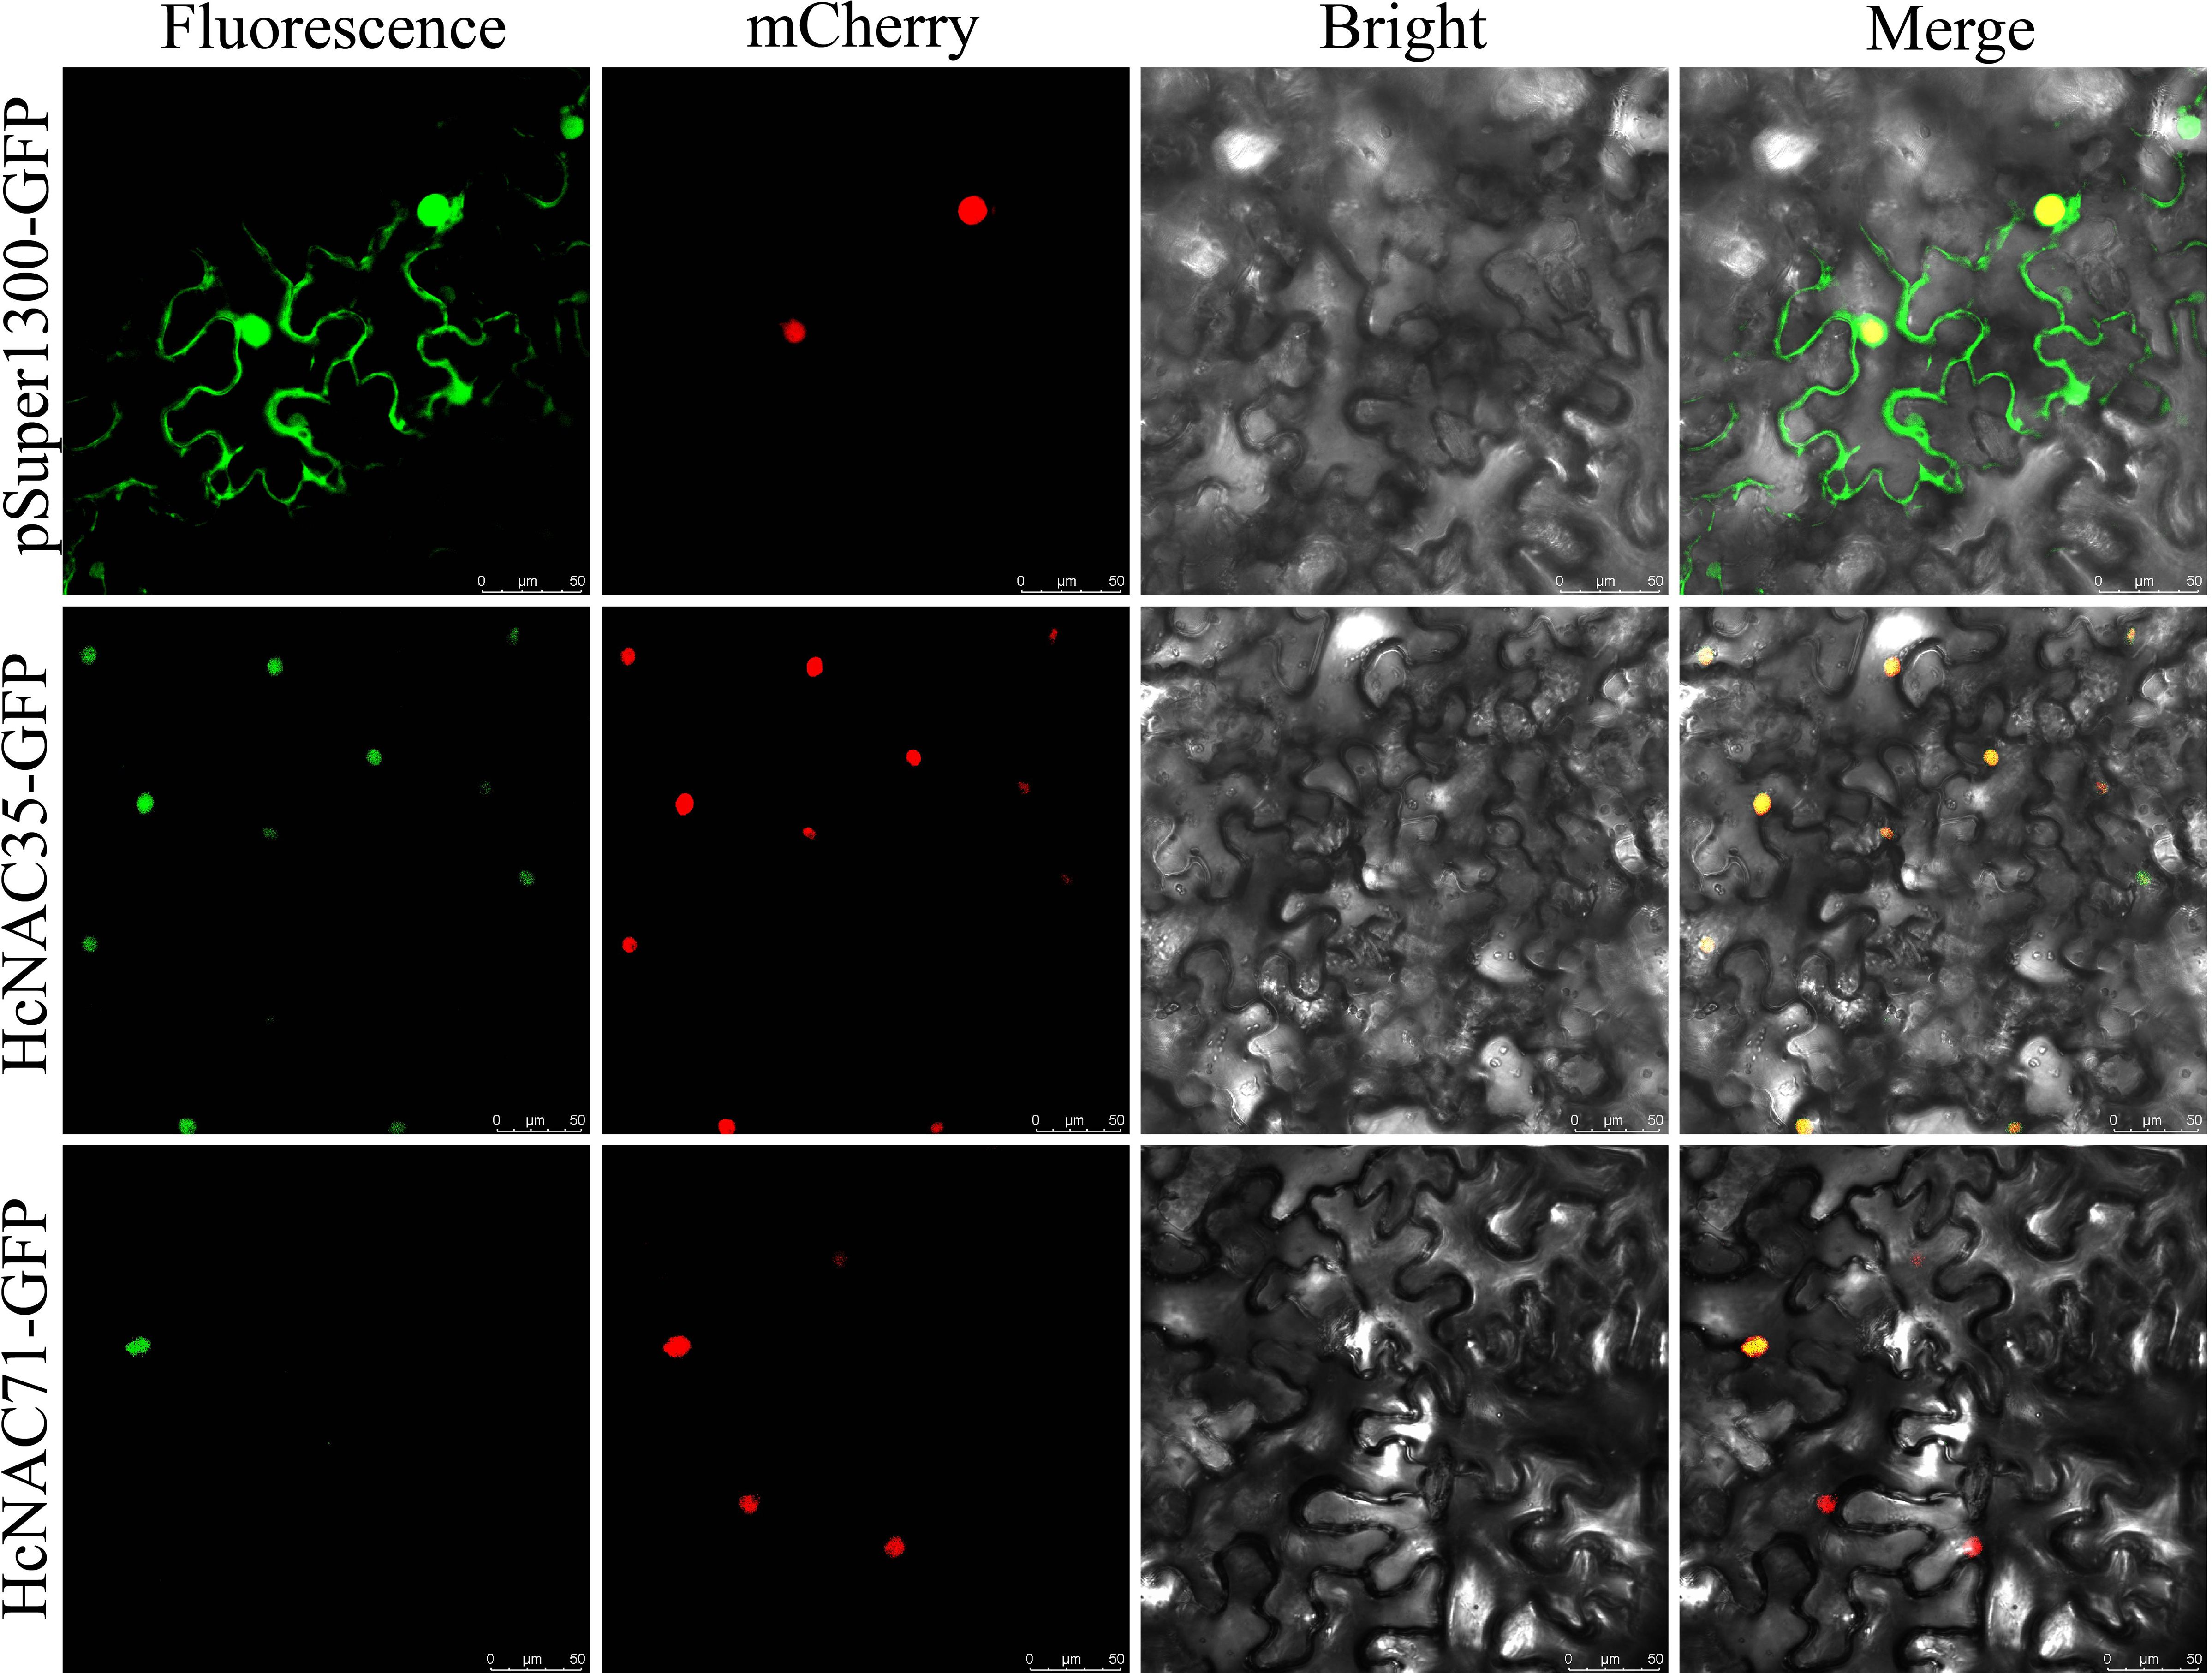
Figure 12. Subcellular localization of HcNAC35 and HcNAC71. Empty pSuper1300:GFP was used as the negative control. The second panel mCherry represented a positive marker for the nucleus. The merged image (rightmost panel) indicated the fusion of GFP (green fluorescence), mCherry (red fluorescence), and bright field. Bar = 50 μm.
3.8 Overexpression of HcNAC35 improved drought and salt tolerance in watermelon
Previous experiments have implied that HcNAC35 exhibited significant upregulation under drought and salt treatments. To investigate the biological function of HcNAC35 in watermelon abiotic stress responses, we generated HcNAC35-OE plants in the TC watermelon genetic background. Based on expression levels of HcNAC35, two independent transgenic lines were chosen for further analysis. The RT-qPCR results showed that the transcript abundance of HcNAC35 in the OE-1 and OE-2 plants was about 4.82-fold and 6.25-fold higher than WT plants, respectively (Figure 13A).
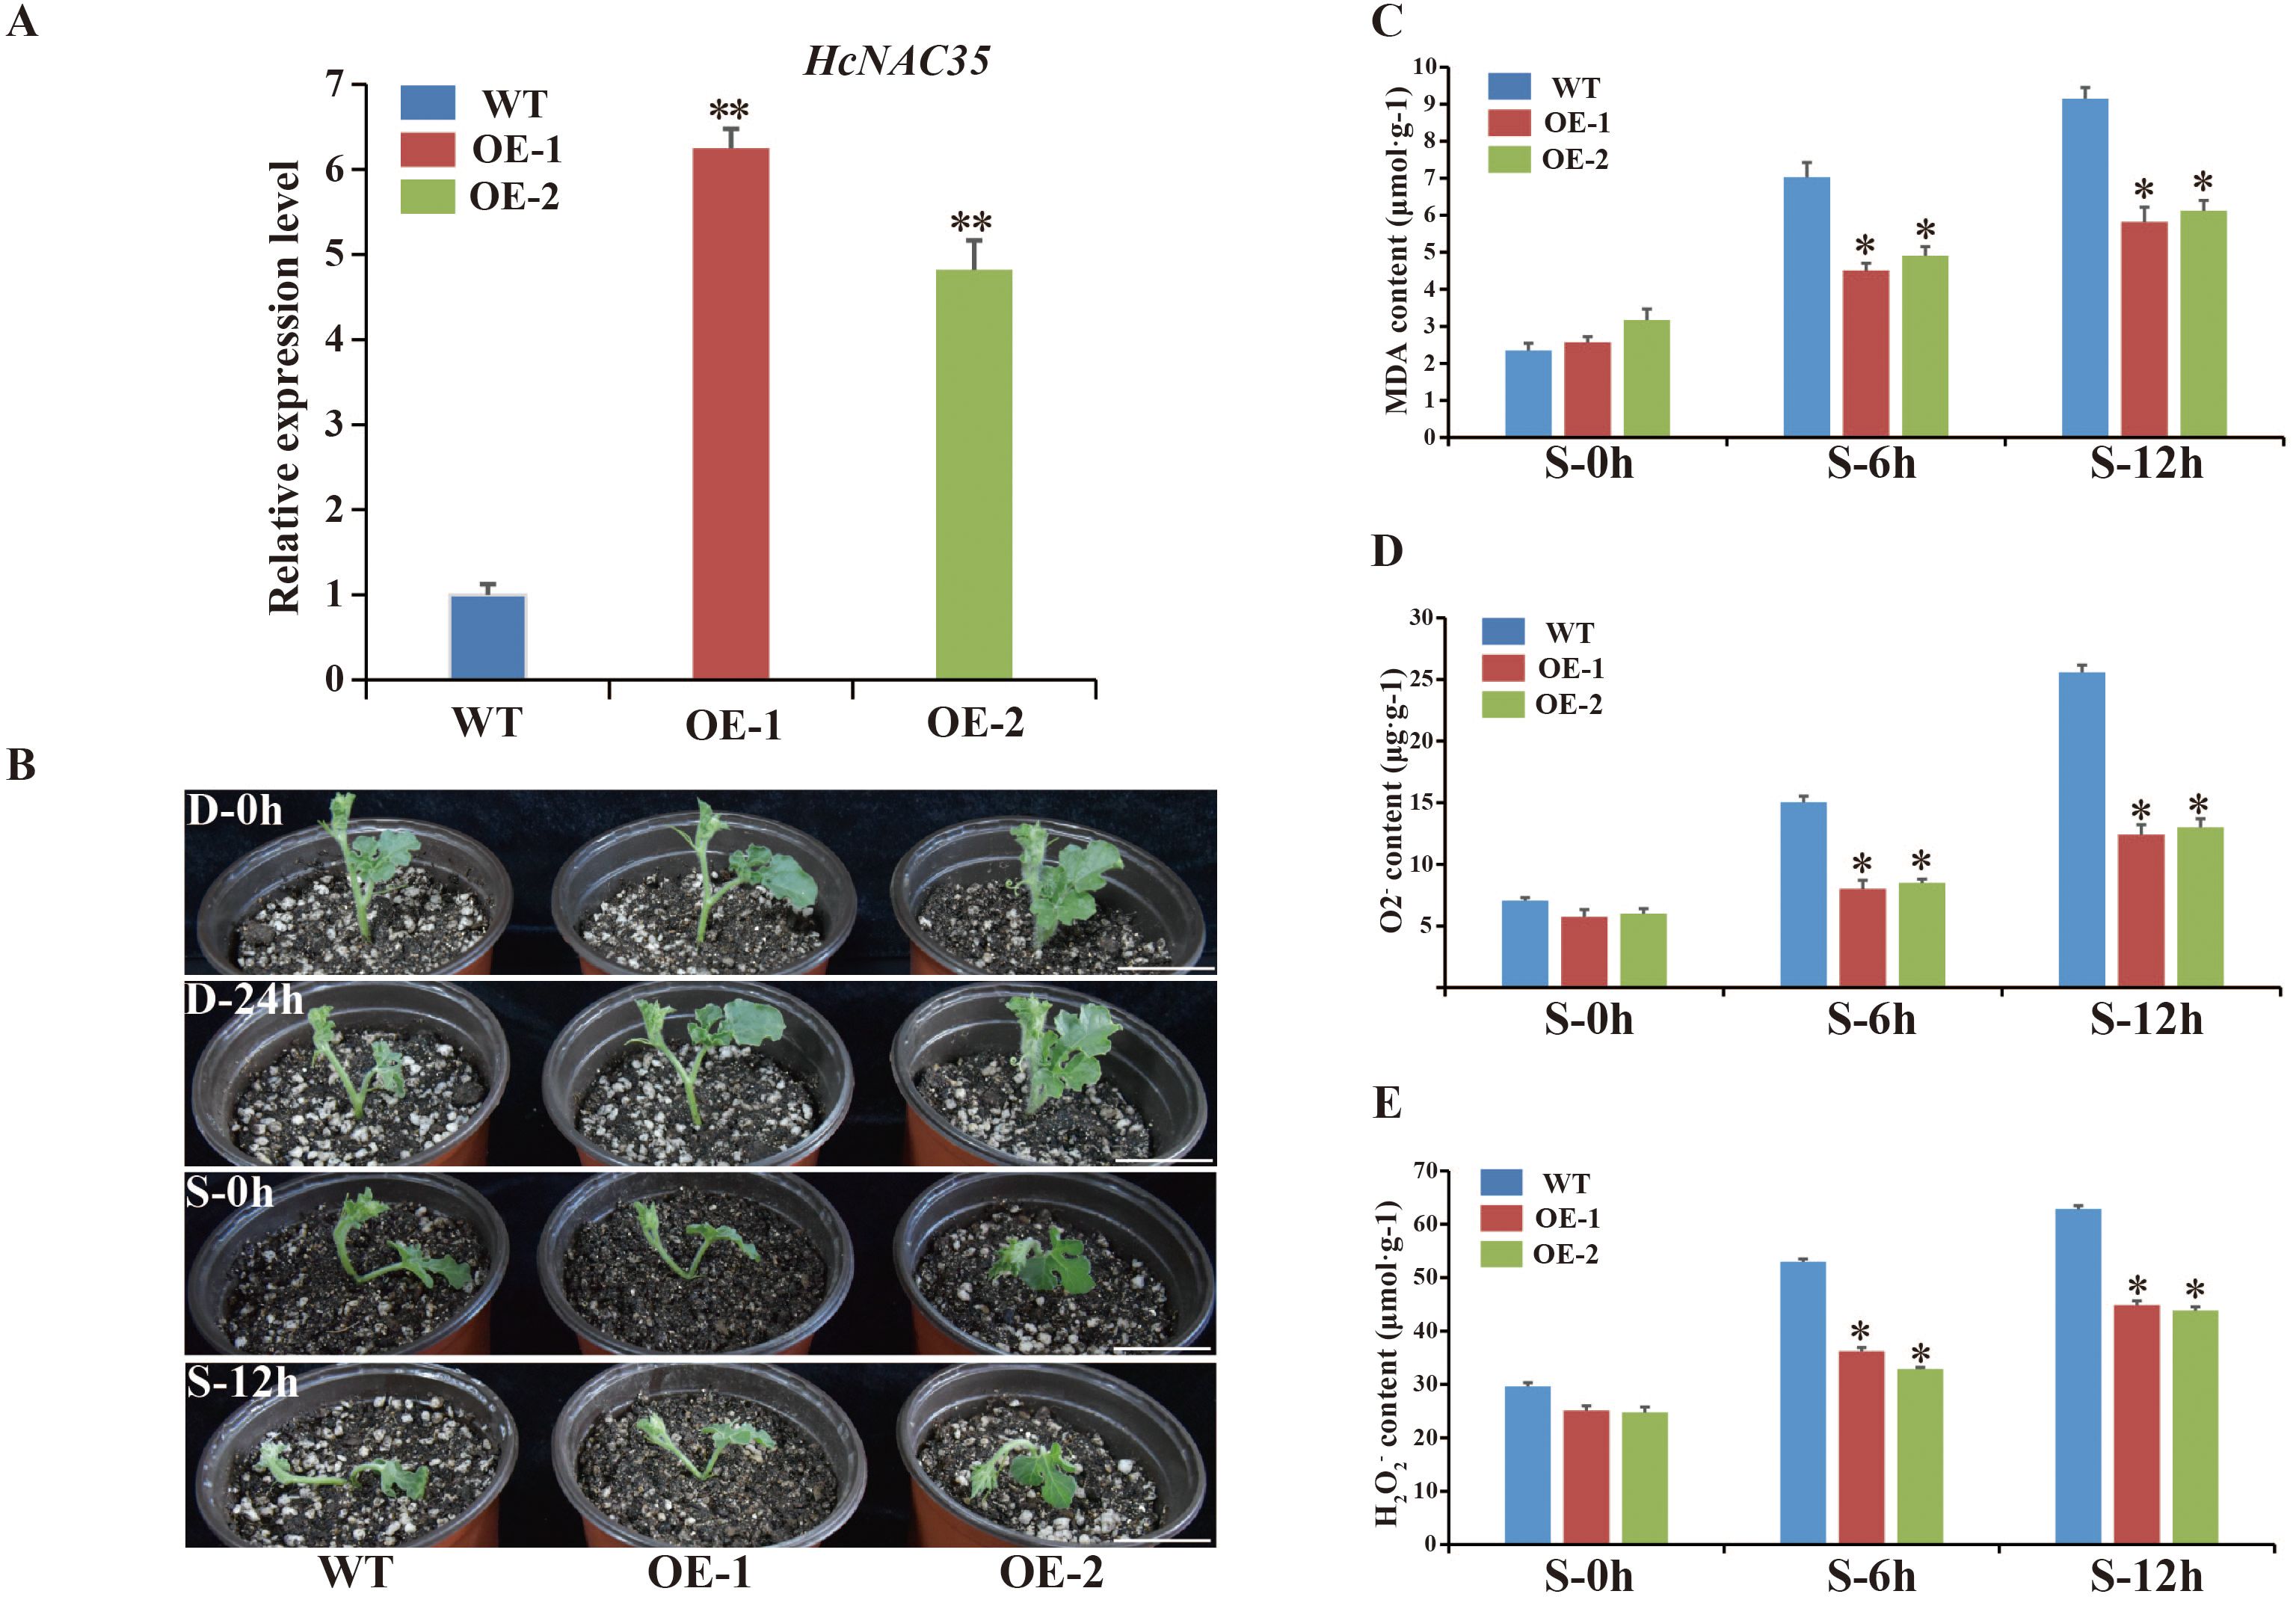
Figure 13. Performance and responses of HcNAC-OE plants of watermelon to salt and drought stresses. (A) Relative expression of HcNAC35 among WT and OE plants by RT-qPCR. (B) The phenotypes of the WT and HcNAC-OE plants under abiotic stress conditions (D, drought; S, salt). Bar = 4 cm. (C–E) MDA (C), O2− (D), and H2O2 (E) contents in leaves from plants under normal and salt stress. The significant variations were marked by asterisk(s) (*p < 0.05, **p < 0.01).
To further assess whether alteration of HcNAC35 expression affects drought and salinity stress tolerance, we treated 4-week-old HcNAC35-OE plants and WT seedlings with 25% PEG and 250 mM NaCl, respectively (Figure 13B). The obvious wilting was observed in the shoot tips (STs) and leaves of WT seedlings after 12 h under 250 mM NaCl treatment, while STs and leaves of OE seedlings showed little damage. Additionally, visible damage was also caused in WT seedlings when 0–24 h under 25% PEG treatment. The phenotype observation indicated that HcNAC35 might play a critical role in response to abiotic stresses, especially salinity stress.
As indicators of membrane peroxidation, contents of MDA were measured to further evaluate the damage degree under salinity stress. MDA levels increased in all treated plants, but 30% and 38% lower in the OE plants than those of WT plants when 0–12 h after salt treatment (Figure 13C), indicating that the overexpression of HcNAC35 contributed to decreased damage under salinity stress. The levels of superoxide radicals (O2−) were determined to explore the change of sensitivity caused by altered redox status in OE plants under salinity stress. HcNAC35-overexpressing plants showed lower O2- and H2O2 contents during salinity stress than the TC plants (Figures 13D, E). These results indicated that overexpression of HcNAC35 increased the tolerances of watermelon to salt and drought stresses to different degrees.
4 Discussion
With members further supplemented by transcriptome and genome analysis, the NAC family has become one of the largest families of plant-special transcriptional regulators. As important switches to accurately regulate gene expression, NACs play pivotal roles in regulating plant development and various physiological processes in response to abiotic stress (Kumar et al., 2021; Singh et al., 2021). NAM, ATAF1/2, and CUC2 constitute the NAC acronym, and they were initially discovered to hold a common conserved NAC domain (Souer et al., 1996; Aida et al., 1997; Ooka et al., 2003). The NAC TF family, identified in a variety of species, remains undescribed in night lily so far (Ooka et al., 2003; Nuruzzaman et al., 2010; Su et al., 2013; Wang N. et al., 2013; Le et al., 2011; Yan et al., 2017; Li et al., 2018; Gong et al., 2019; Jin et al., 2020; Li et al., 2020; Nie et al., 2020; Zong et al., 2020; Li et al., 2021; Meng L. et al., 2022). Based on previously reported genome sequences, 113 NAC gene family members were identified and randomly distributed on 11 chromosomes (Figure 1), similar to the corresponding families of other angiosperms in classification standard and number (Huang et al., 2013; Liu et al., 2023). This may reflect the relative stability of the HcNAC family evolution process. A total of 18 subgroups were classified among H. citrina, O. sativa, A. thaliana, and C. lanatus. However, the number of four species in individual subgroups was discrepant (Figure 2), indicating that although different NAC family proteins originate from the same ancestor, they evolve distinguishably among species.
Extensive variations existed in protein length, predicted molecular weight, and isoelectric point (Supplementary Table S1). In contrast, of identified 113 HcNAC genes, NAM domain was detected in 112 NAC proteins, and more than 50% contained two CDS regions (Figures 3, 4), indicating relative conservation of gene structures and functions of the NAC family. The diversity of gene structure occurs in the evolutionary process of numerous gene families, which is valuable for excavating potential new functions to adjust to environmental changes (Liu et al., 2023). In general, the members belonging to the same phylogenetic group possess a high degree of similarity in gene structure and conserved motif (Figure 4), suggesting they have a closer phylogenetic relationship (Zhang et al., 2014). Motifs made up of short sequences are involved in important biological processes. The conserved motif analysis of HcNACs showed high coverage to the conserved protein region. Moreover, members of different subfamilies may contain non-identical motifs, but hold the DNA binding domain, consistent with those reported in Liriodendron (Liu et al., 2023).
Currently, duplication events of NAC genes including segmental and tandem duplications have been widely reported in different plant species (Li et al., 2020; Shan et al., 2020). In our study, 2 tandem and 78 segmental duplication events were screened out in the HcNAC genes (Figure 5A), revealing that segmental duplication might be the main force for forming and expanding the NAC gene families (Song H.Y. et al., 2022). The collinear relationships of NACs between night lily and monocotyledon NAC family were found to be greater, and less with dicotyledon (Figure 5B), which may be associated with the classification of monocot and dicot plants produced by angiosperms during long-term natural selection and evolution (Xiong et al., 2024). In particular, the high similarity between homologous gene pairs was detected in constructed gene structures and predicted protein properties. This result suggests that duplicate genes derived from the progenitors can evolve separately simultaneously and show few changes (Wang et al., 2010). We calculated the Ka/Ks value for selective pressure analysis, finding purifying selection as a primary force in the evolutionary process of NAC genes in night lily (Figure 5C and Supplementary Table S4), concluding that they might retain primitive functions from their ancestry (Li et al., 2016).
To be public knowledge, gene functional enrichment analysis is a requisite method to elaborate the biological processes and signaling pathway. In this study, we found that members of the identified HcNAC gene family were widely involved in abiotic stress responses and regulation of transcription (Figure 6 and Supplementary Table S5), indicating their potentially significant roles in dealing with abiotic stress. The promoter structures and their regulatory pathways are tightly associated with many plant traits (Wu et al., 2018). Multiple regulatory elements with central physiological functions in the HcNAC promoters implied that HcNACs might respond to various internal factors (growth and development) and external factors (abiotic stresses) (Figure 8 and Supplementary Table S8). Our results revealed that HcNAC35 contained eight stress response elements (two MYC, four STRE, and two LTR), similar to seven stress response elements (three MYC, one STRE, two LTR, and one MBS) of the homolog At3g10500 (ANACO53) in Arabidopsis (Olivier et al., 2016). Taken together, it is noteworthy that these genes might play conserved functions in stress responses across species (Cao et al., 2024).
The analysis of expression patterns can be one effective way to explore the functions and evolutionary relationships of gene families (Wang Y. et al., 2013). Our study implied that most of the HcNAC genes displayed tissue-specific expression through RNA-Seq and RT-qPCR analysis (Figure 7 and Supplementary Figure S1); furthermore, the relatively higher expressions were preferentially concentrated on roots. These results provided useful clues for understanding gene functions concerning specific physiological processes. Several researches have been conducted to find out the roles of NAC TFs in coping with diverse stresses, such as salinity, drought, and flooding (Singh et al., 2021; Puranik et al., 2012; Yuan et al., 2020). Likewise, RNA-Seq and RT-qPCR were also combined to check the expression patterns of HcNAC genes under two abiotic stresses (Figure 9 and Supplementary Tables S10, S11). The expressions of most HcNAC genes changed dramatically at 48 h after drought and salinity stresses, which might be due to the sudden increase of osmotic pressure, leading to the reduction of enzymatic activity in the plant. We speculated that the defense system of the plant has been fully activated after stress treatment for about 72 h, and gene expressions related to stress response in addition to HcNACs were enhanced through signal transmission. In particular, the expression levels of HcNAC35 and HcNAC71 holding the NAM domain fluctuated significantly (Figures 10, 11), implying that they might perform remarkable functions as TFs in response to diverse abiotic stresses. Furthermore, our investigation shows most NAC TFs including NAC35 and NAC71 in night lily have been predicted to locate in the nucleus, consistent with our experimental results (Figure 12). Overexpression of HcNAC35 in watermelon further indicated the strong resistance to abiotic stresses (Figure 13). However, whether notable developmental anomalies are caused remains to be continuously explored based on other phenotypes of HcNAC35-OE plants in subsequent growth and development. Thus, further investigations are needed to clarify the cellular mechanisms of the HcNAC35 regulatory gene in watermelon.
5 Conclusions
In this study, a genome-wide characterization of NAC TFs was comprehensively performed in night lily. We identified 113 HcNACs encoding NAC TFs, which were unevenly distributed across 11 chromosomes. Based on the evolutionary relationship, HcNACs could be divided into 18 distinct subgroups. The identified HcNAC proteins have a closer evolutionary relationship with O. sativa proteins, suggesting their higher similarities with NACs of monocots in the natural selection and evolution. The identified cis-acting elements were predicted to regulate different biological processes, reflecting the diversification of HcNAC genes in function. Our RNA-Seq data and RT-qPCR results identically showed that HcNAC genes expressed specifically and distinctly in different tissues. Moreover, HcNACs especially HcNAC35 and HcNAC71 might be involved in response to environmental stresses, including drought and salinity. Overexpression of HcNAC35 in watermelon enhanced abiotic stress tolerances, especially salinity, and might affect leaf development. These results help to elucidate the response of HcNAC35 to abiotic stress and set the stage for further functional research on NAC35 in perennial crops. However, whether these NAC TFs perform regulatory roles in the growth and development of night lily remains to be further confirmed in future studies.
Data availability statement
The data presented in the study are deposited in the NCBI repository, accession numbers PRJNA1154840, PRJNA1154841, and PRJNA1154842.
Author contributions
LC: Data curation, Methodology, Writing – original draft, Investigation. JW: Investigation, Writing – original draft, Methodology. SR: Investigation, Writing – original draft. YJ: Investigation, Writing – original draft. YL: Investigation, Writing – original draft. SY: Investigation, Writing – original draft. JY: Investigation, Writing – original draft. XG: Investigation, Writing – original draft. XH: Investigation, Writing – original draft. JX: Conceptualization, Project administration, Writing – original draft. SL: Conceptualization, Data curation, Investigation, Methodology, Project administration, Writing – original draft, Writing – review & editing. GX: Conceptualization, Methodology, Project administration, Writing – review & editing.
Funding
The author(s) declare that financial support was received for the research, authorship, and/or publication of this article. This research was funded by the Shanxi Agricultural Key Core Technology Research Project, grant number NYGG18; the Shanxi Key Research and Development Project, grant number 202102140601009; the Biological Breeding Engineering Program of Shanxi Agricultural University, grant number YZGC122; and the Shanxi Modern Agro-industry Technology Research System Project, grant number 2024CYJSTX08.
Conflict of interest
The authors declare that the research was conducted in the absence of any commercial or financial relationships that could be construed as a potential conflict of interest.
Publisher’s note
All claims expressed in this article are solely those of the authors and do not necessarily represent those of their affiliated organizations, or those of the publisher, the editors and the reviewers. Any product that may be evaluated in this article, or claim that may be made by its manufacturer, is not guaranteed or endorsed by the publisher.
Supplementary material
The Supplementary Material for this article can be found online at: https://www.frontiersin.org/articles/10.3389/fpls.2024.1474589/full#supplementary-material
References
Aida, M., Ishida, T., Fukaki, H., Fujisawa, H., Tasaka, M. (1997). Genes involved in organ separation in Arabidopsis: an analysis of the cup-shaped cotyledon mutant. Plant Cell. 9, 841–857. doi: 10.1105/tpc.9.6.841
Bashir, K., Matsui, A., Rasheed, S., Seki, M. (2019). Recent advances in the characterization of plant transcriptomes in response to drought, salinity, heat, and cold stress. F1000Res 8, F1000 Faculty Rev–658. doi: 10.12688/f1000research.18424.1
Bolger, A. M., Lohse, M., Usadel, B. (2014). Trimmomatic: a flexible trimmer for Illumina sequence data. Bioinformatics 30, 2114–2120. doi: 10.1093/bioinformatics/btu170
Cao, L. H., Wang, J. Y., Wang, L. X., Liu, H. L., Wu., W. J., Hou, F. F., et al. (2024). Genome-wide analysis of the SWEET gene family in Hemerocallis citrina and functional characterization of HcSWEET4a in response to salt stress. BMC Plant Biol. 24, 661. doi: 10.1186/s12870-024-05376-y
Cao, L. H., Wei, W., Shen, J. J., Li, Z., Xu, Z. M. (2022). Study on the optimization of transformation systems in watermelon. Vegetable Res. 2, 12. doi: 10.48130/VR-2022-0012
Chen, C., Chen, H., Zhang, Y., Thomas, H. R., Frank, M. H., He, Y., et al. (2020). TBtools: an integrative toolkit developed for interactive analyses of big biological data. Mol. Plant 13, 1194–1202. doi: 10.1016/j.molp.2020.06.009
Deng, J., Li, M., Huang, L. Y., Yang, M., Yang, P. F. (2016). Genome-wide analysis of the R2R3 MYB subfamily genes in lotus (Nelumbo Nucifera). Plant Mol. Biol. Rep. 34, 1016–1026. doi: 10.1007/s11105-016-0981-3
Dong, Y. F., Tang, M. J., Huang, Z. L., Song, J. N., Xu, J., Ahammed, G. J., et al. (2022). The miR164a-NAM3 module confers cold tolerance by inducing ethylene production in tomato. Plant J. 111, 440–456. doi: 10.1111/tpj.15807
Droge-Laser, W., Snoek, B. L., Snel, B., Weiste, C. (2018). The Arabidopsis bZIP transcription factor family-an update. Curr. Opin. Plant Biol. 45, 36–49. doi: 10.1016/j.pbi.2018.05.001
Du, X. R., Su, M. X., Jiao, Y., Xu, S. X., Song, J. Q., Wang, H. F., et al. (2022). A transcription factor SlNAC10 gene of Suaeda liaotungensis regulates proline synthesis and enhances salt and drought tolerance. Int. J. Mol. Sci. 23, 9625. doi: 10.3390/ijms23179625
Erpen, L., Devi, H. S., Grosser, J. W., Dutt, M. (2018). Potential use of the DREB/ERF, MYB, NAC and WRKY transcription factors to improve abiotic and biotic stress in transgenic plants. Plant Cell Tissue Organ Cult. 132, 1–25. doi: 10.1007/s11240-017-1320-6
Fu, B. L., Wang, W. Q., Liu, X. F., Duan, X. W., Allan, A. C., Grierson, D., et al. (2021). An ethylene-hypersensitive methionine sulfoxide reductase regulated by NAC transcription factors increases methionine pool size and ethylene production during kiwifruit ripening. New Phytol. 232, 237–251. doi: 10.1111/nph.17560
Gong, X., Zhao, L. Y., Song, X. F., Lin, Z. K., Gu, B. J., Yan, J. X., et al. (2019). Genome-wide analyses and expression patterns under abiotic stress of NAC transcription factors in white pear (Pyrus bretschneideri). BMC Plant Biol. 19, 161. doi: 10.1186/s12870-019-1760-8
Han, K. J., Zhao, Y., Sun, Y. H., Li, Y. (2023). NACs, generalist in plant life. Plant Biotechnol. J. 21, 2433–2457. doi: 10.1111/pbi.14161
Hu, H. Y., He, X., Tu, L. L., Zhu, L. F., Zhu, S. T., Ge, Z. H., et al. (2016). GhJAZ2 negatively regulates cotton fiber initiation by interacting with the R2R3-MYB transcription factor GhMYB25-like. Plant J. 88, 921–935. doi: 10.1111/tpj.13273
Hu, T. X., Wang, Y. Q., Wang, Q. Q., Dang, N. N., Wang, L., Liu, C. C., et al. (2019). The tomato 2-oxoglutarate-dependent dioxygenase gene SlF3HL is critical for chilling stress tolerance. Hortic. Res. 6, 45. doi: 10.1038/s41438-019-0127-5
Huang, G. Q., Li, W., Zhou, W., Zhang, J. M., Li, D. D., Gong, S. Y., et al. (2013). Seven cotton genes encoding putative NAC domain proteins are preferentially expressed in roots and in responses to abiotic stress during root development. Plant Growth Regul. 71, 101–112. doi: 10.1007/s10725-013-9811-x
Jia, X., Zeng, Z., Lyu, Y. M., Zhao, S. W. (2022). Drought-responsive NAC transcription factor RcNAC72 is recognized by RcABF4, interacts with RcDREB2A to enhance drought tolerance in Arabidopsis. Int. J. Mol. Sci. 23, 1755. doi: 10.3390/ijms23031755
Jin, J. F., Wang, Z. Q., He, Q. Y., Wang, J. Y., Li, P. F., Xu, J. M., et al. (2020). Genome-wide identification and expression analysis of the NAC transcription factor family in tomato (Solanum lycopersicum) during aluminum stress. BMC Genom. 21, 288. doi: 10.1186/s12864-020-6689-7
Kim, D., Langmead, B., Salzberg, S. L. (2015). HISAT: a fast spliced aligner with low memory requirements. Nat. Methods 12, 357–360. doi: 10.1038/nmeth.3317
Kumar, R., Das, S., Mishra, M., Choudhury, D. R., Sharma, K., Kumari, A., et al. (2021). Emerging roles of NAC transcription factor in medicinal plants: progress and prospects. 3 Biotech. 11, 1–14. doi: 10.1007/s13205-021-02970-x
Kumar, S., Stecher, G., Tamura, K. (2016). MEGA7: molecular evolutionary genetics analysis version 7.0 for bigger datasets. Mol. Biol. Evol. 33, 1870–1874. doi: 10.1093/molbev/msw054
Le, D. T., Nishiyama, R., Watanabe, Y., Mochida, K., Yamaguchi-Shinozaki, K., Shinozaki, K., et al. (2011). Genome-wide survey and expression analysis of the plant-specific NAC transcription factor family in soybean during development and dehydration stress. DNA Res. 18, 263–276. doi: 10.1093/dnares/dsr015
Lescot, M., Dehais, P., Thijs, G., Marchal, K., Moreau, Y., Van de Peer, Y., et al. (2002). PlantCARE, a database of plant cis-acting regulatory elements and a portal to tools for in silico analysis of promoter sequences. Nucleic Acids Res. 30, 325–327. doi: 10.1093/nar/30.1.325
Li, B., Fan, R. Y., Yang, Q. S., Hu, C. H., Sheng, O., Deng, G. H., et al. (2020). Genome-wide identification and characterization of the NAC transcription factor family in Musa Acuminata and expression analysis during fruit ripening. Int. J. Mol. Sci. 21, 634. doi: 10.3390/ijms21020634
Li, Y. X., Han, S. C., Sun, X. M., Khan, N. U., Zhong, Q., Zhang, Z. Y., et al. (2022). Variations in OsSPL10 confer drought tolerance by directly regulating OsNAC2 expression and ROS production in rice. J. Integr. Plant Biol. 65, 918–933. doi: 10.1111/jipb.13414
Li, W., Li, X. X., Chao, J. T., Zhang, Z. L., Wang, W. F., Guo, Y. F. (2018). NAC family transcription factors in tobacco and their potential role in regulating leaf senescence. Front. Plant Sci. 9. doi: 10.3389/fpls.2018.01900
Li, P. X., Peng, Z. Y., Xu, P. L., Tang, G. Y., Ma, C., Zhu, J. Q., et al. (2021). Genome-wide identification of NAC transcription factors and their functional prediction of abiotic stress response in peanut. Front. Genet. 12. doi: 10.3389/fgene.2021.630292
Li, S., Wang, N., Ji, D. D., Xue, Z. R., Yu, Y. C., Jiang, Y. P., et al. (2016). Evolutionary and functional analysis of membrane-bound NAC transcription factor genes in soybean. Plant Physiol. 172, 1804–1820. doi: 10.1104/pp.16.01132
Li, J., Xiong, Y. C., Li, Y., Ye, S. Q., Yin, Q., Gao, S. Q., et al. (2019). Comprehensive analysis and functional studies of WRKY transcription factors in Nelumbo nucifera. Int. J. Mol. Sci. 20, 5006. doi: 10.3390/ijms20205006
Liu, S. Q., Guan, Y. L., Weng, Y. H., Liao, B. J., Tong, L., Hao, Z. D., et al. (2023). Genome-wide identification of the NAC gene family and its functional analysis in Liriodendron. BMC Plant Biol. 23, 415. doi: 10.1186/s12870-023-04415-4
Love, M. I., Huber, W., Anders, S. (2014). Moderated estimation of fold change and dispersion for RNA-seq data with DESeq2. Genome Biol. 15, 550. doi: 10.1186/s13059-014-0550-8
Luo, P., Li, Z. Y., Chen, W., Xing, W., Yang, J., Cui, Y. Y. (2020). Overexpression of RmICE1, a bHLH transcription factor from Rosa multifora, enhances cold tolerance via modulating ROS levels and activating the expression of stress-responsive genes. Environ. Exp. Bot. 178, 104160. doi: 10.1016/j.envexpbot.2020.104160
Lv, X. L., Lan, S. R., Guy, K. M., Yang, J. H., Zhang, M. F., Hu, Z. Y. (2016). Global expressions landscape of NAC transcription factor family and their responses to abiotic stresses in Citrullus lanatus. Sci. Rep. 6, 30574. doi: 10.1038/srep30574
Meng, L., Chen, S. Y., Li, D. W., Huang, M. R., Zhu, S. (2022). Genome-wide characterization and evolutionary expansion of poplar NAC transcription factors and their tissue-specifc expression profiles under drought. Int. J. Mol. Sci. 24, 253. doi: 10.3390/ijms24010253
Meng, X. Q., Liu, S. Y., Zhang, C. B., He, J. N., Ma, D. F., Wang, X., et al. (2022). The unique sweet potato NAC transcription factor IbNAC3 modulates combined salt and drought stresses. Plant Physiol. 191, 747–771. doi: 10.1093/plphys/kiac508
Nie, G., Yang, X. Y., Yang, Z. F., Zhong, M. Y., Zhu, Y. Q., Zhou, J., et al. (2020). Genome-wide investigation of the NAC transcript factor family in perennial ryegrass (Lolium perenne L.) and expression analysis under various abiotic stressor. Genomics 112, 4224–4231. doi: 10.1016/j.ygeno.2020.06.033
Nuruzzaman, M., Manimekalai, R., Sharoni, A. M., Satoh, K., Kondoh, H., Ooka, H., et al. (2010). Genome-wide analysis of NAC transcription factor family in rice. Gene 465, 30–44. doi: 10.1016/j.gene.2010.06.008
Ohta, M., Sato, A., Renhu, N., Yamamoto, T., Oka, N., Zhu, J. K., et al. (2018). MYC-type transcription factors, MYC67 and MYC70, interact with ICE1 and negatively regulate cold tolerance in Arabidopsis. Sci. Rep. 8, 11622. doi: 10.1038/s41598-018-29722-x
Olivier, V. A., De, C., Aneta, I., Simon, R. L., Frank, V. B., Harvey, A., et al. (2016). Mitochondrial and chloroplast stress responses are modulated in distinct touch and chemical inhibition phases. Plant Physiol. 171, 2150–2165. doi: 10.1104/pp.16.00273
Ooka, H., Satoh, K., Doi, K., Nagata, T., Otomo, Y., Murakami, K., et al. (2003). Comprehensive analysis of NAC family genes in Oryza sativa and Arabidopsis thaliana. DNA Res. 10, 239–247. doi: 10.1093/dnares/10.6.239
Puranik, S., Sahu, P. P., Srivastava, P. S., Prasad, M. (2012). NAC proteins: regulation and role in stress tolerance. Trends Plant Sci. 17, 369–381. doi: 10.1016/j.tplants.2012.02.004
Qiao, X., Li, Q. H., Yin, H., Qi, K. J., Li, L. T., Wang, R. Z., et al. (2019). Gene duplication and evolution in recurring polyploidization—diploidization cycles in plants. Genome Biol. 20, 38. doi: 10.1186/s13059-019-1650-2
Qing, Z. X., Liu, J. H., Yi, X. X., Liu, X. B., Hu, G. A., Lao, J., et al. (2021). The chromosome-level Hemerocallis citrina Borani genome provides new insights into the rutin biosynthesis and the lack of colchicine. Hortic. Res. 8, 89. doi: 10.1038/s41438-021-00539-6
Ren, Y., Huang, Z. Q., Jiang, H., Wang, Z., Wu, F. S., Xiong, Y. F., et al. (2021). A heat stress responsive NAC transcription factor heterodimer plays key roles in rice grain filling. J. Exp. Bot. 72, 2947–2964. doi: 10.1093/jxb/erab027
Shan, Z. Y., Jiang, Y. M., Li, H. Q., Guo, J. J., Dong, M., Zhang, J. N., et al. (2020). Genome-wide analysis of the NAC transcription factor family in broomcorn millet (Panicum miliaceum L.) and expression analysis under drought stress. BMC Genom. 21, 96. doi: 10.1186/s12864-020-6479-2
Singh, S., Koyama, H., Bhati, K. K. K., Alok, A. (2021). Correction to: the biotechnological importance of the plant-specific NAC transcription factor family in crop improvement. J. Plant Res. 134, 643. doi: 10.1007/s10265-021-01270-y
Song, H. Y., Liu, Y. L., Dong, G. Q., Zhang, M. H., Wang, Y. X., Xin, J., et al. (2022). Genome-wide characterization and comprehensive analysis of NAC transcription factor family in Nelumbo nucifera. Front. Genet. 13. doi: 10.3389/fgene.2022.901838
Song, C. B., Wu, M. B., Zhou, Y., Gong, Z. H., Yu, W. W., Zhang, Y., et al. (2022). NAC-mediated membrane lipid remodeling negatively regulates fruit cold tolerance. Hortic. Res. 9, uhac039. doi: 10.1093/hr/uhac039
Souer, E., Van, H. A., Kloos, D., Mol, J., Koes, R. (1996). The no apical meristem gene of Petunia is required for pattern formation in embryos and flowers and is expressed at meristem and primordia boundaries. Cell 85, 159–170. doi: 10.1016/S0092-8674(00)81093-4
Su, H. Y., Zhang, S. Z., Yuan, X. W., Chen, C. T., Wang, X. F., Hao, Y. J. (2013). Genome-wide analysis and identification of stress-responsive genes of the NAM-ATAF1,2-CUC2 transcription factor family in apple. Plant Physiol. Biochem. 71. doi: 10.3389/fpls.2023.1189038
Sun, H., Chen, L., Li, J. Y., Hu, M. L., Ullah, A., He, X., et al. (2017). The JASMONATE ZIM-domain gene family mediates JA signaling and stress response in cotton. Plant Cell Physiol. 58, 2139–2154. doi: 10.1093/pcp/pcx148
Taylor-Teeples, M., Lin, L., de Lucas, M., Turco, G., Toal, T. W., Gaudinier, A., et al. (2015). An Arabidopsis gene regulatory network for secondary cell wall synthesis. Nature 517, 571–575. doi: 10.1038/nature14099
Wang, Y., Fan, G. Y., Liu, Y. M., Sun, F. M., Shi, C. C., Liu, X., et al. (2013). The sacred lotus genome provides insights into the evolution of flowering plants. Plant J. 76, 557–567. doi: 10.1111/tpj.12313
Wang, K., Guo, W. Z., Yang, Z. J., Hu, Y., Zhang, W. P., Zhou, B. L., et al. (2010). Structure and size variations between 12A and 12D homologous chromosomes based on high-resolution cytogenetic map in allotetraploid cotton. Chromosoma 119, 255–266. doi: 10.1007/s00412-009-0254-0
Wang, J. F., Wang, Y. P., Zhang, J., Ren, Y., Li, M. Y., Tian, S. W., et al. (2021). The NAC transcription factor ClNAC68 positively regulates sugar content and seed development in watermelon by repressing ClINV and ClGH3.6. Hortic. Res. 8, 214. doi: 10.1038/s41438-021-00710-z
Wang, N., Zheng, Y., Xin, H. P., Fang, L. C., Li, S. H. (2013). Comprehensive analysis of NAC domain transcription factor gene family in Vitis vinifera. Plant Cell Rep. 32, 61–75. doi: 10.1007/s00299-012-1340-y
Wen, B. B., Gong, X. Y., Tan, Q. P., Zhao, W. Z., Chen, X. D., Li, D. M., et al. (2022). MdNAC4 interacts with MdAPRR2 to regulate nitrogen deficiency-induced leaf senescence in apple (Malus domestica). Front. Plant Sci. 13. doi: 10.3389/fpls.2022.925035
Wu, R., Duan, L., Pruneda-Paz, J. L., Oh, D. H., Pound, M., Kay, S., et al. (2018). The 6xABRE synthetic promoter enables the spatiotemporal analysis of ABA-mediated transcriptional regulation. Plant Physiol. 177, 1650–1665. doi: 10.1104/pp.18.00401
Wu, Z., Li, T., Xiang, J., Teng, R. D., Zhang, D. H., Teng, N. J. (2022). A lily membrane-associated NAC transcription factor LlNAC014 is involved in thermotolerance via activation of the DREB2-HSFA3 module. J. Exp. Bot. 74, 945–963. doi: 10.1093/jxb/erac436
Xi, Y., Ling, Q. Q., Zhou, Y., Liu, X., Qian, Y. X. (2022). ZmNAC074, a maize stress-responsive NAC transcription factor, confers heat stress tolerance in transgenic Arabidopsis. Front. Plant Sci. 13. doi: 10.3389/fpls.2022.986628
Xie, C. T., Li, C. L., Wang, F. X., Zhang, F., Liu, J. J., Wang, J. X., et al. (2023). NAC1 regulates root ground tissue maturation through coordinating with SCR/SHR-CYCD6;1 module in Arabidopsis. Mol. Plant 16, 709–725. doi: 10.1016/j.molp.2023.02.006
Xiong, R. Q., Peng, Z. H., Zhou, H., Xue, G. X., He, A. L., Yao, X., et al. (2024). Genome-wide identification, structural characterization and gene expression analysis of the WRKY transcription factor family in pea (Pisum sativum L.). BMC Plant Biol. 24, 113. doi: 10.1186/s12870-024-04774-6
Xu, P. P., Ma, W., Hu, J. B., Cai, W. M. (2022). The nitrate-inducible NAC transcription factor NAC056 controls nitrate assimilation and promotes lateral root growth in Arabidopsis thaliana. PloS Genet. 18, e1010090. doi: 10.1371/journal.pgen.1010090
Yan, J. L., Chen, Q. Q., Cui, X., Zhao, P. Y., Gao, S. D., Yang, B., et al. (2021). Ectopic overexpression of a membrane-tethered transcription factor gene NAC60 from oilseed rape positively modulates programmed cell death and age-triggered leaf senescence. Plant J. 105, 600–618. doi: 10.1111/tpj.15057
Yan, H. D., Zhang, A. L., Ye, Y. T., Xu, B., Chen, J., He, X. Y., et al. (2017). Genome-wide survey of switchgrass NACs family provides new insights into motif and structure arrangements and reveals stress-related and tissue-specific NACs. Sci. Rep. 7, 3056. doi: 10.1038/s41598-017-03435-z
Yang, Z., Wang, C. Q., Qiu, K., Chen, H. R., Li, Z. Q., Li, X., et al. (2020). The transcription factor ZmNAC126 accelerates leaf senescence downstream of the ethylene signaling pathway in maize. Plant Cell Environ. 43, 2287–2300. doi: 10.1111/pce.13803
Yao, S., Wu, F., Hao, Q. Q., Ji, K. S. (2020). Transcriptome-wide identification of WRKY transcription factors and their expression profiles under different types of biological and abiotic stress in Pinus massoniana Lamb. Genes (Basel). 11, 1386. doi: 10.3390/genes11111386
Yu, G. H., Xie, Z. N., Lei, S. S., Li, H., Xu, B., Huang, B. R. (2022). The NAC factor LpNAL delays leaf senescence by repressing two chlorophyll catabolic genes in perennial ryegrass. Plant Physiol. 189, 595–610. doi: 10.1093/plphys/kiac070
Yuan, C. L., Li, C. J., Lu, X. D., Zhao, X. B., Yan, C. X., Wang, J., et al. (2020). Comprehensive genomic characterization of NAC transcription factor family and their response to salt and drought stress in peanut. BMC Plant Biol. 20, 454. doi: 10.1186/s12870-020-02678-9
Zhang, W., Wang, F. H., Chen, Y. W., Niu, X. R., Li, C. Y., Yang, X., et al. (2023). Identification and analysis of the expression of microRNAs during the low-temperature dormancy release of Tulipa thianschanica seeds. Agronomy 13, 3067. doi: 10.3390/agronomy13123067
Zhang, S. Z., Xu, R. R., Gao, Z., Chen, C. T., Jiang, Z. S., Shu, H. R. (2014). A genome-wide analysis of the expansin genes in Malus x Domestica. Mol. Genet. Genomics 289, 225–236. doi: 10.1007/s00438-013-0796-y
Zhang, Z., Yu, J. (2006). Evaluation of six methods for estimating synonymous and nonsynonymous substitution rates. Genom Proteom Bioinf. 4, 173–181. doi: 10.1016/S1672-0229(06)60030-2
Zong, X. F., Yan, Q., Wu, F., Ma, Q., Zhang, J. Y. (2020). Genome-wide analysis of the role of NAC family in fower development and abiotic stress responses in Cleistogenes songorica. Genes (Basel). 11, 927. doi: 10.3390/genes11080927
Keywords: Hemerocallis citrina, NAC transcription factor, genome-wide identification, abiotic stress, expression analysis
Citation: Cao L, Wang J, Ren S, Jia Y, Liu Y, Yang S, Yu J, Guo X, Hou X, Xu J, Li S and Xing G (2024) Genome-wide identification of the NAC family in Hemerocallis citrina and functional analysis of HcNAC35 in response to abiotic stress in watermelon. Front. Plant Sci. 15:1474589. doi: 10.3389/fpls.2024.1474589
Received: 01 August 2024; Accepted: 25 September 2024;
Published: 14 October 2024.
Edited by:
Ravinder Kumar, Indian Agricultural Research Institute (ICAR), IndiaReviewed by:
Ge Zhao, Zhengzhou University, ChinaAke Liu, Changzhi University, China
Jing Zhuang, Nanjing Agricultural University, China
Xiaoxu Li, Chinese Academy of Agricultural Sciences (CAAS), China
Copyright © 2024 Cao, Wang, Ren, Jia, Liu, Yang, Yu, Guo, Hou, Xu, Li and Xing. This is an open-access article distributed under the terms of the Creative Commons Attribution License (CC BY). The use, distribution or reproduction in other forums is permitted, provided the original author(s) and the copyright owner(s) are credited and that the original publication in this journal is cited, in accordance with accepted academic practice. No use, distribution or reproduction is permitted which does not comply with these terms.
*Correspondence: Sen Li, c2F1bGlzZW5AMTYzLmNvbQ==; Guoming Xing, eGluZ2d1b21pbmdAMTYzLmNvbQ==
†These authors have contributed equally to this work
 Lihong Cao
 Jinyao Wang
 Sijia Ren
 Jin Xu
 Sen Li