 Alvaro Soler-Garzón1
 Mwiinga Mulube2
 Kelvin Kamfwa2
 Davies M. Lungu2
 Swivia Hamabwe2
 Jayanta Roy3Venâncio Salegua4Deidré Fourie5
 Timothy G. Porch6
 Phillip E. McClean3
 Phillip N. Miklas7*
- 1Irrigated Agriculture Research and Extension Center, Washington State University, Prosser, WA, United States
- 2Department of Plant Science, University of Zambia, Lusaka, Zambia
- 3Department of Plant Sciences, North Dakota State University, Fargo, ND, United States
- 4Mozambique Agricultural Research Institute (IIAM), Nampula, Mozambique
- 5Dry Bean Producers Organization, Pretoria, South Africa
- 6Tropical Agriculture Research Station, United States Department of Agriculture - Agricultural Research Service (USDA-ARS), Mayagüez, Puerto Rico
- 7Grain Legume Genetics and Physiology Research Unit, United States Department of Agriculture - Agricultural Research Service (USDA-ARS), Prosser, WA, United States
Bacterial brown spot (BBS) caused by Pseudomonas syringae pv. syringae (Pss), common bacterial blight (CBB) caused by Xanthomonas axonopodis pv. phaseoli (Xap) and Xanthomonas fuscans subsp. fuscans (Xff), and halo bacterial blight (HBB), caused by Pseudomonas syringae pv. phaseolicola (Psph), are major bacterial diseases that severely affect common bean yields and global food security. Andean-origin dry beans, representing large-seeded market classes, are particularly susceptible. Using 140,325 SNPs, a multi-locus GWAS was conducted on subsets of the Andean diversity panel (ADP) phenotyped for BBS in South Africa, CBB in Puerto Rico, South Africa, and Zambia, and HBB in South Africa, through natural infection, artificial inoculation, or both. Twenty-four QTL associated with resistance were identified: nine for BBS, eight for CBB, and seven for HBB. Four QTL intervals on Pv01, Pv03, Pv05, and Pv08 overlapped with BBS and HBB resistance. A genomic interval on Pv01, near the fin gene, which determines growth habit, was linked to resistance to all three pathogens. Different QTLs were detected for BBS and CBB resistance when phenotyped under natural infection versus artificial inoculation. These results underscore the importance of combining phenotyping methods in multi-GWAS to capture the full genetic spectrum. Previously recognized CBB resistance QTL SAP6 and SU91 and HBB resistance QTL HB4.2, and HB5.1, were observed. Other common (MAF >0.25) and rare (MAF <0.05) resistance QTL were also detected. Overall, these findings enhance the understanding and utilization of bacterial resistance present in ADP for the development of common beans with improved resistance.
Introduction
The three most globally prevalent bacterial diseases in the common bean (Phaseolus vulgaris L.) are bacterial brown spot (BBS) caused by Pseudomonas syringae pv. syringae van Hall (Pss); common bacterial blight (CBB), caused by Xanthomonas axonopodis pv. phaseoli (Xap) and Xanthomonas fuscans subsp. fuscans Smith (Xff); and halo bacterial blight (HBB) caused by Pseudomonas syringae pv. phaseolicola Burkholder (Psph). The incidence and severity of these diseases are influenced by the plant genotype, bacterial strain, climatic factors, seed hygiene, and agricultural management practices. Under favorable conditions, these pathogens can cause up to 50% yield loss and reduce seed quality (Singh and Schwartz, 2010; Singh and Miklas, 2015; Muedi et al., 2015; Tock et al., 2017).
BBS, CBB, and HBB symptoms manifested in leaves, pods, and seeds, leading to leaf blight, sunken lesions on pods, and poor seed quality. These diseases are seed-transmitted, emphasizing the importance of disease-free seeds to mitigate their spread. While copper-based chemicals applied to growing plants can limit disease severity, planting resistant varieties is considered the most effective, economical, sustainable, and environmentally friendly approach for combatting bacterial blights in common beans (Gilbertson et al., 1992; Yu et al., 2012). However, breeding for resistance to bacterial blight diseases in common bean is difficult because the resistance is inherited in a complex fashion, and the methods available for screening germplasm are cumbersome.
BBS resistance in common beans is quantitatively inherited by multiple factors that influence infection. Antonius (1982) observed that multiple recessive genes conditioned the resistance to BBS. Resistance to BBS exhibits low heritability when measured under field conditions relative to greenhouse inoculations, and quantitative trait loci (QTL) studies conducted by Jung et al. (2003) in dry bean and Navarro et al. (2007) in snap bean, using recombinant inbred populations, corroborate the complexity and quantitative inheritance of resistance to BBS across multiple screening methods and environments. Tropical black beans A55 and ‘Puebla-152’ of Middle American origin were the sources of resistance for the dry and snap bean studies, respectively. Although breeding for BBS in snap beans has been a focus (Navarro et al., 2007), efforts to incorporate such resistance into large-seeded Andean dry beans are unknown.
Screening bean lines for reactions to BBS is difficult, in part, because natural infection is dependent on the population size of Pss on leaves. Natural infections are also triggered by environmental events such as rainfall, hail, and wind. Pss survives on healthy bean leaves as an epiphyte until favorable environmental conditions lead to a substantially increased population size, inducing infection (Hirano et al., 1987). This suggests that genetic factors that lower the Pss population size may reduce the incidence of BBS disease. CBB resistance has been observed in various common bean gene pools. From the tertiary gene pool, high levels of resistance have been detected in tepary bean (Phaseolus acutifolius) (Singh and Muñoz, 1999). Moderate resistance in the common bean has been obtained from interspecific hybridization with Phaseolus coccineus from the secondary gene pool (Welsh and Grafton, 2001). P. vulgaris sources of CBB resistance include the Montana #5 (Miklas et al., 2003) and Thlantaplanta 46 (PI 208762) landraces. The genetic control of CBB disease resistance in the common bean is complex, with more than 20 QTL for resistance detected across all 11 chromosomes (Singh and Miklas, 2015; Singh et al., 2001). The major QTL on Pv06 (BC420), Pv08 (SU91), and Pv10 (SAP6) have been well characterized, but none are completely resistant to aggressive Xap or Xff strains (Miklas et al., 1996; Pedraza et al., 1997; Yu et al., 1998; Vandemark et al., 2008). Traditional marker-assisted selection (MAS) has been used to develop large-seeded Andean beans that are resistant to CBB (Miklas et al., 2006a, 2006b; Viteri et al., 2014).
Resistance to HBB is conditioned by major R genes (Pse-1, Pse-2, Pse-3, Pse-4, and Pse-6), with differential reactions across a set of nine Psph race differentials (Taylor et al., 1996a; Yaish et al., 2006; Miklas et al., 2014; Trabanco et al., 2014). QTL HB4.2 is critical for the control of the globally prevalent Race 6. In CAL 143, a large-seeded red mottled CIAT breeding line, released as a cultivar in several East African countries, the HB4.2 QTL conditions resistance to Race 6 derived from PI 150414, a small red landrace from El Salvador (Tock et al., 2017). GWAS analysis of ADP by Tock et al. (2017) revealed only one QTL, HB5.1, which correlated with higher yield under Race 6 infection. An Andean red bean, called ‘Rojo,’ released by Sokoine University of Agriculture (SUA), possesses Pse-2, a major gene that provides resistance to seven of nine differential races but not Race 6.
To facilitate breeding for resistance to bacterial diseases in Andean beans, we used multilocus GWAS methods to identify and compare genomic regions and candidate genes significantly associated with resistance to BBS, CBB, and HBB diseases in a large diversity panel of Andean accessions tested under controlled and natural inoculations.
Materials and methods
Plant material
A P. vulgaris Andean diversity panel (ADP, n = 468) was established to enhance the genetic improvement of beans from the Andean gene pool (Cichy et al., 2015). ADP includes a diverse range of landraces, germplasm releases, advanced breeding lines, and released cultivars from Africa, the Americas (Central, North, and South), Asia, the Caribbean, and Europe (Supplementary Table S1). In this study, ADP was expanded using 109 additional accessions.
Phenotyping
Bacterial brown spot
A total of 378 ADP accessions and five check cultivars were previously evaluated for phenotypic disease reactions to BBS using an alpha-lattice design with three replications at three field locations in South Africa (Middleburg, Potchefstroom, and Warden) (Salegua et al., 2020) (Supplementary Table S2). The Middelburg and Warden trials were conducted under natural infection, and artificial inoculation was used to enhance infection in Potchefstroom. The inoculum consisted of three aggressive Pss isolates (BV 6.3, BV 3.3.2, and BV 27.1) suspended in 1 × 10⁸ CFU/mL and applied using a mist blower with supplemental irrigation to enhance infection (Muedi et al., 2015). BBS severity was evaluated 7 days after the first signs of infection and then weekly for 3 weeks using the 1 to 9 CIAT scale, where 1 = no symptoms, 5 = moderate disease symptoms, and 9 = severe disease symptoms and plant death (Van Schoonhoven and Pastor-Corrales, 1987). A similar 1 to 9 scale was used to evaluate disease severity in the CBB and HBB trials, respectively. For all three diseases, the disease scores were grouped into three categories: 1–3 for resistant plants with no discernible or few symptoms with little impact on yield, 4–6 for plants with moderate disease symptoms with some impact on seed yield, and 7–9 for susceptible plants with severe symptoms or plant death. The mean disease severity scores for BBS recorded 21-d after inoculation were used for GWAS. Note that the BBS reaction data collected from the Warden field location were excluded from this study because of the confounding influence of additional stress factors.
Common bacterial blight
The reaction of ADP with CBB has not been reported previously. Consequently, various subsets of ADP accessions were screened against specific Xap strains in the greenhouse and against endemic strains in the field. The ADP accessions (n = 249) were inoculated with X. axonopodis pv. phaseoli (Xap) strains Xa3353 and Xa484A in a screenhouse at the USDA-ARS Tropical Agriculture Research Station in Mayagüez, Puerto Rico, in 2012 (Supplementary Table S2). The inoculum was produced on yeast extract-dextrose-CaCO3 agar (YDCA) for 48 h and then diluted in sterile water to 107 CFU/mL (Zapata et al., 1985). The multiple-needle inoculation technique, first described by Andrus (1948), consists of approximately 18 pins arranged in a 2.5 cm diameter that are pressed against the fully expanded first trifoliate leaves (~two weeks after planting) that are backed by sponges soaked in inoculum. Three replicates in a randomized complete block design (RCBD) were tested with a susceptible control, ‘Morales,’ and a resistant control, VAX 6. Plants were rated (1–9) for disease severity 21 days after inoculation.
A set of 193 ADP accessions were screened for resistance to Xanthomonas fuscans subsp. fuscans (Xff) strain ZM4 by artificial inoculation in the screenhouse at the Agricultural Research Council-Grain Crops Institute (ARC-GCI) located in Potchefstroom, South Africa (Supplementary Table S2). The ZM4 strain was isolated from a CBB-infected leaf sample collected in 2018 in a common bean field in Lusaka, Zambia. Fourteen to twenty-day-old plants were inoculated using the multiple-needle inoculation method described above. Plants were maintained in a screenhouse at 28°C day/18°C night temperatures. Plants were rated for disease severity 14 days post-inoculation. The experimental design was RCBD with three replicates.
A set of 201 ADP accessions were tested under natural field infection at the Zambia Agricultural Demonstration Center at the University of Zambia in Lusaka, Zambia (Supplementary Table S2). The panel entries ADP665 (USWK-CBB-17) and ADP676 (CELRK) were used as resistant and susceptible checks, respectively. The trial was conducted in December 2013, with two replications in an RCBD. The plot size was a single row 4 m long, with an inter-row spacing of 0.5 m. Common bacterial blight (CBB) disease is caused by the X. axonopodis pv. phaseoli and was prevalent at the site where ADP was planted. The University of Zambia experimental site is located in a region that tends to have high CBB pressure because of higher temperatures and rainfall during the growing season from January to April. The early 2014 season was no exception. Disease pressure was uniform across the experimental field, as reflected by the consistent scores obtained for the resistant and susceptible checks in both replications. CBB reactions at the flowering and pod-filling growth stages were evaluated under natural infection conditions using a previously described disease severity scale.
In addition, 255 ADP accessions were evaluated for CBB resistance under natural infection in the field at the University of Zambia Research Farm in Lusaka, Zambia in 2018 (Supplementary Table S2). Evaluations were conducted during the rainy season on soil classified as fine loamy isohyperthermic paleustalf. The experimental design and plot size were the same as those used for 2014. A local landrace from Zambia, ‘Kabulangeti’, which is highly susceptible to CBB, was used as a susceptibility check. The disease pressure was uniform across the experimental field, as reflected by the consistently high CBB severity scores for ‘Kabulangeti’ within and across replications. The CBB severity was scored for each plot at the pod-filling stage. For every CBB trial, least-square mean disease severity scores were used for GWAS.
Halo bacterial blight
ADP accessions (n = 360) were phenotyped for reactions (1 to 9 scale) to halo blight under field conditions at the Potchefstroom ARC-GCI Station in South Africa (Tock et al., 2017) (Supplementary Table S2). Briefly, the trial was sown in single-row plots of 4 m length per line, spaced 0.75 m apart, and replicated three times in an RCBD. The halo blight host differential set (Taylor et al., 1996b) was included as a check. The Phps inoculum consisting of Race 6 (Tanzania-1299A strain) was cultivated in King’s B medium, suspended in water, adjusted to 108–109 CFU ml−1, and applied using a mist-blower, followed by supplemental irrigation to enhance disease development. Disease severity (1–9 scale) was assessed during the mid-pod-fill stage. The mean disease severity scores obtained by Tock et al. (2017) were used for the GWAS in this study.
Pearson correlations between mean bacterial disease scores were performed using the cor() function in R 4.4.0 (R Core Team, 2021) with the parameter use = “pairwise.complete.obs.” Visualization and clustering of the correlation coefficients were performed using the R package d3heatmap (https://github.com/erdogant/d3heatmap).
Genotyping
Fresh young leaves from the early trifoliate stage of a single plant were collected and genomic DNA was extracted using the Mag-Bind Plant DNA Plus Kit (Omega Bio-Tek, Norcross, Georgia, USA). Genomic libraries were constructed using the optimized two-enzyme protocol [MseI and Taqα1] developed by Schröder et al. (2016). The libraries were sequenced using two different methods at the Hudson Alpha Institute for Biotechnology, Huntsville, AL. DNA from the first set, consisting of 325 ADP genotypes, was sequenced in single-end runs using the Illumina HiSeq 2500 sequencing platform. A total of 228 genotypes were included in the second set and library sequencing was performed using the Illumina HiSeq 2500 sequencing system and paired-end runs (2 × 150 bp). In the second set, 53 sequenced genotypes were duplicated from the first set of sequenced genotypes. Duplicated, Middle-American, and Tepary genotypes were removed, resulting in a total of 468 ADP genotypes.
Raw fastq files were subjected to quality filtering using the SICKLE software (Joshi and Fass, 2011) to trim reads with a low-quality score ≤20 and a minimum of 80 bp in length. The processed reads (forward reads from the paired-end reads) were aligned against the common bean reference genome G19833v2.1 (https://phytozome-next.jgi.doe.gov/info/Pvulgaris_v2_1) (Schmutz et al., 2014) using the Burrows–Wheeler Alignment Tool (BWA-mem) with default parameters (Li, 2013). SAMtools v1.15.1 (Li et al., 2009) was used to sort and index the aligned mapping results. Read group information of corresponding genotypes was added using Picard v2.9.0 tools (http://broadinstitute.github.io/picard).
Finally, the MultisampleVariantsDetector module embedded in NGSEPcore_4.2.0 software was used to call the variants with the ‘-maxAlnsPerStartPos 100’ parameter (Tello et al., 2023). Multiallelic SNPs were discarded, and markers with minDP ≥3, a quality value of >40, less than 40% missing sites, and 1% minor allele frequency (MAF) were selected, resulting in 184,345 high-quality SNPs genotyped in the 468 ADP accessions. The selected SNPs were imputed using the VCFImpute module in NGSEP v4.2.0 (Tello et al., 2023). This module utilizes a Hidden Markov Model (HMM) implemented in the fastPHASE package (Scheet et al., 2006).
ADP population structure
Population structure analysis was performed using 468 ADP accessions genotyped with an unimputed subset of 2,568 SNPs after linkage disequilibrium (LD) pruning, which involved using a 0.5 R2 threshold and the –indep-pairwise function in Plink v2.0 (https://www.cog-genomics.org/plink/2.0/) (Purcell et al., 2007), with a sliding window of 50 kb, shifted by five bases. The pruned set of SNPs with less than 20% missing values and a MAF >0.01 were retained for genetic structure analysis.
Population structure was estimated using a Bayesian Markov chain Monte Carlo model (MCMC) implemented in STRUCTURE 2.3 software (Pritchard et al., 2000). Ten runs were performed for each population (k), which were set from 1 to 10. The burn-in time and MCMC replication number were set as 100,000 and 200,000, respectively. The most likely number of populations (k) in the ADP was calculated using the Evanno method (Evanno et al., 2005) implemented in Pophelper v2.3.1 (Francis, 2017). To determine the robustness of the assignments of individuals to populations at each K, the Q-matrix was obtained using CLUMPP v1.1 software (Jakobsson and Rosenberg, 2007). Finally, the filtered SNPs were utilized for PCA and kinship analyses.
Genome-wide association study
Twenty-two Middle-American and two admixture accessions identified in the structure analysis were excluded, resulting in 444 genotypes analyzed with 148,701 SNPs filtered using previously described parameters. An LD-pruned set of 2,136 SNPs was obtained for principal components analysis (PCA) (Supplementary Table S3) and an identity-by-state kinship matrix, calculated using the Zhang algorithm. Both analyses were performed using GAPIT v3.0 R package (Wang and Zhang, 2021). Additionally, a multi-locus GWAS (ML-GWAS) analysis was performed using the mrMLM v4.0 R package (Zhang et al., 2020), which includes six different statistical methods for traits with multiple and polygenic effects: mrMLM, FASTmrMLM, FASTmrEMMA, EM-BLASSO, pLARmEB, and pKWmEB (Wang et al., 2016; Wen et al., 2018). To correct any genetic errors and prevent false discoveries, the kinship matrix (K) and first three principal components (PCs) were used as covariates. A logarithm of the odds (LOD) score of 3.0 (or P = 0.0002) was employed as a cutoff in ML-GWAS to strike a balance between high power and low false-positive rate for detecting QTL, as recommended by Zhang et al. (2019). Significant QTL detected by ML-GWAS were plotted using the Circlize R package (Gu et al., 2014).
Furthermore, analysis of variance comparing groups based on the presence or absence of favorable quantitative trait loci (QTL) per bacterial trait against phenotypic means was conducted using Yuen’s test for trimmed means. This analysis was performed using the ggbetweenstats function in the ggstatsplot R package. Yuen’s test was applied using the robust p-value method (P ≤0.05) within the same ggbetweenstats function (Patil, 2021). Only QTL identified as statistically stable (LOD >3) by at least two or more ML-GWAS methods combined with significant (P ≤0.05) Yuen’s tests were considered to harbor favorable alleles.
Candidate genes
The genome browser (JBrowse) in Phytozome 13 was used to search the G19833v2.1 common bean genome and identify positional candidate genes associated with significant SNPs. A gene was considered a candidate if it contained a significant SNP or was in the same LD block as the most significant SNP. Furthermore, a potential candidate gene is required to encode a protein with an established or proposed role in disease resistance or as homologs of guardees and decoys involved in bacterial resistance in other species (Kourelis and van der Hoorn, 2018).
Haplotype-based GWAS data were analyzed using the Plink software package. Haplotype blocks were constructed using the following parameters: –blocks no-pheno-req, –blocks-max-kb 1000, –blocks-min-maf 0.05, –blocks-strong-lowci 0.70, –blocks-strong-highci 0.98, –blocks-recomb-highci 0.90, and –blocks-inform-frac 0.95.
Results
ADP diversity analysis
Structural analysis of 468 ADP accessions genotyped with 2,658 linkage disequilibrium-pruned SNP markers resulted in the separation of three subpopulations (K = 3) based on an optimal K determined by the Evanno test (Figures 1A, B). Accessions were categorized based on a membership coefficient (Q) greater than 0.75 at K = 2, the ADP accessions were divided into two subpopulations: Andean (G1) and another subpopulation that combined Andean (G2) and Middle-American accessions. At K = 3, the Andean (G2) and Middle-American subpopulations were separated according to Q ≥0.75. Additionally, the PC analysis carried out for GWAS confirmed the subpopulations described above for the same set of ADP accessions. The percentage of genetic diversity explained by each of the three PCs was 14.5% for PC1, 8.11% for PC2, and 3.44% for PC3 (Figure 1C).
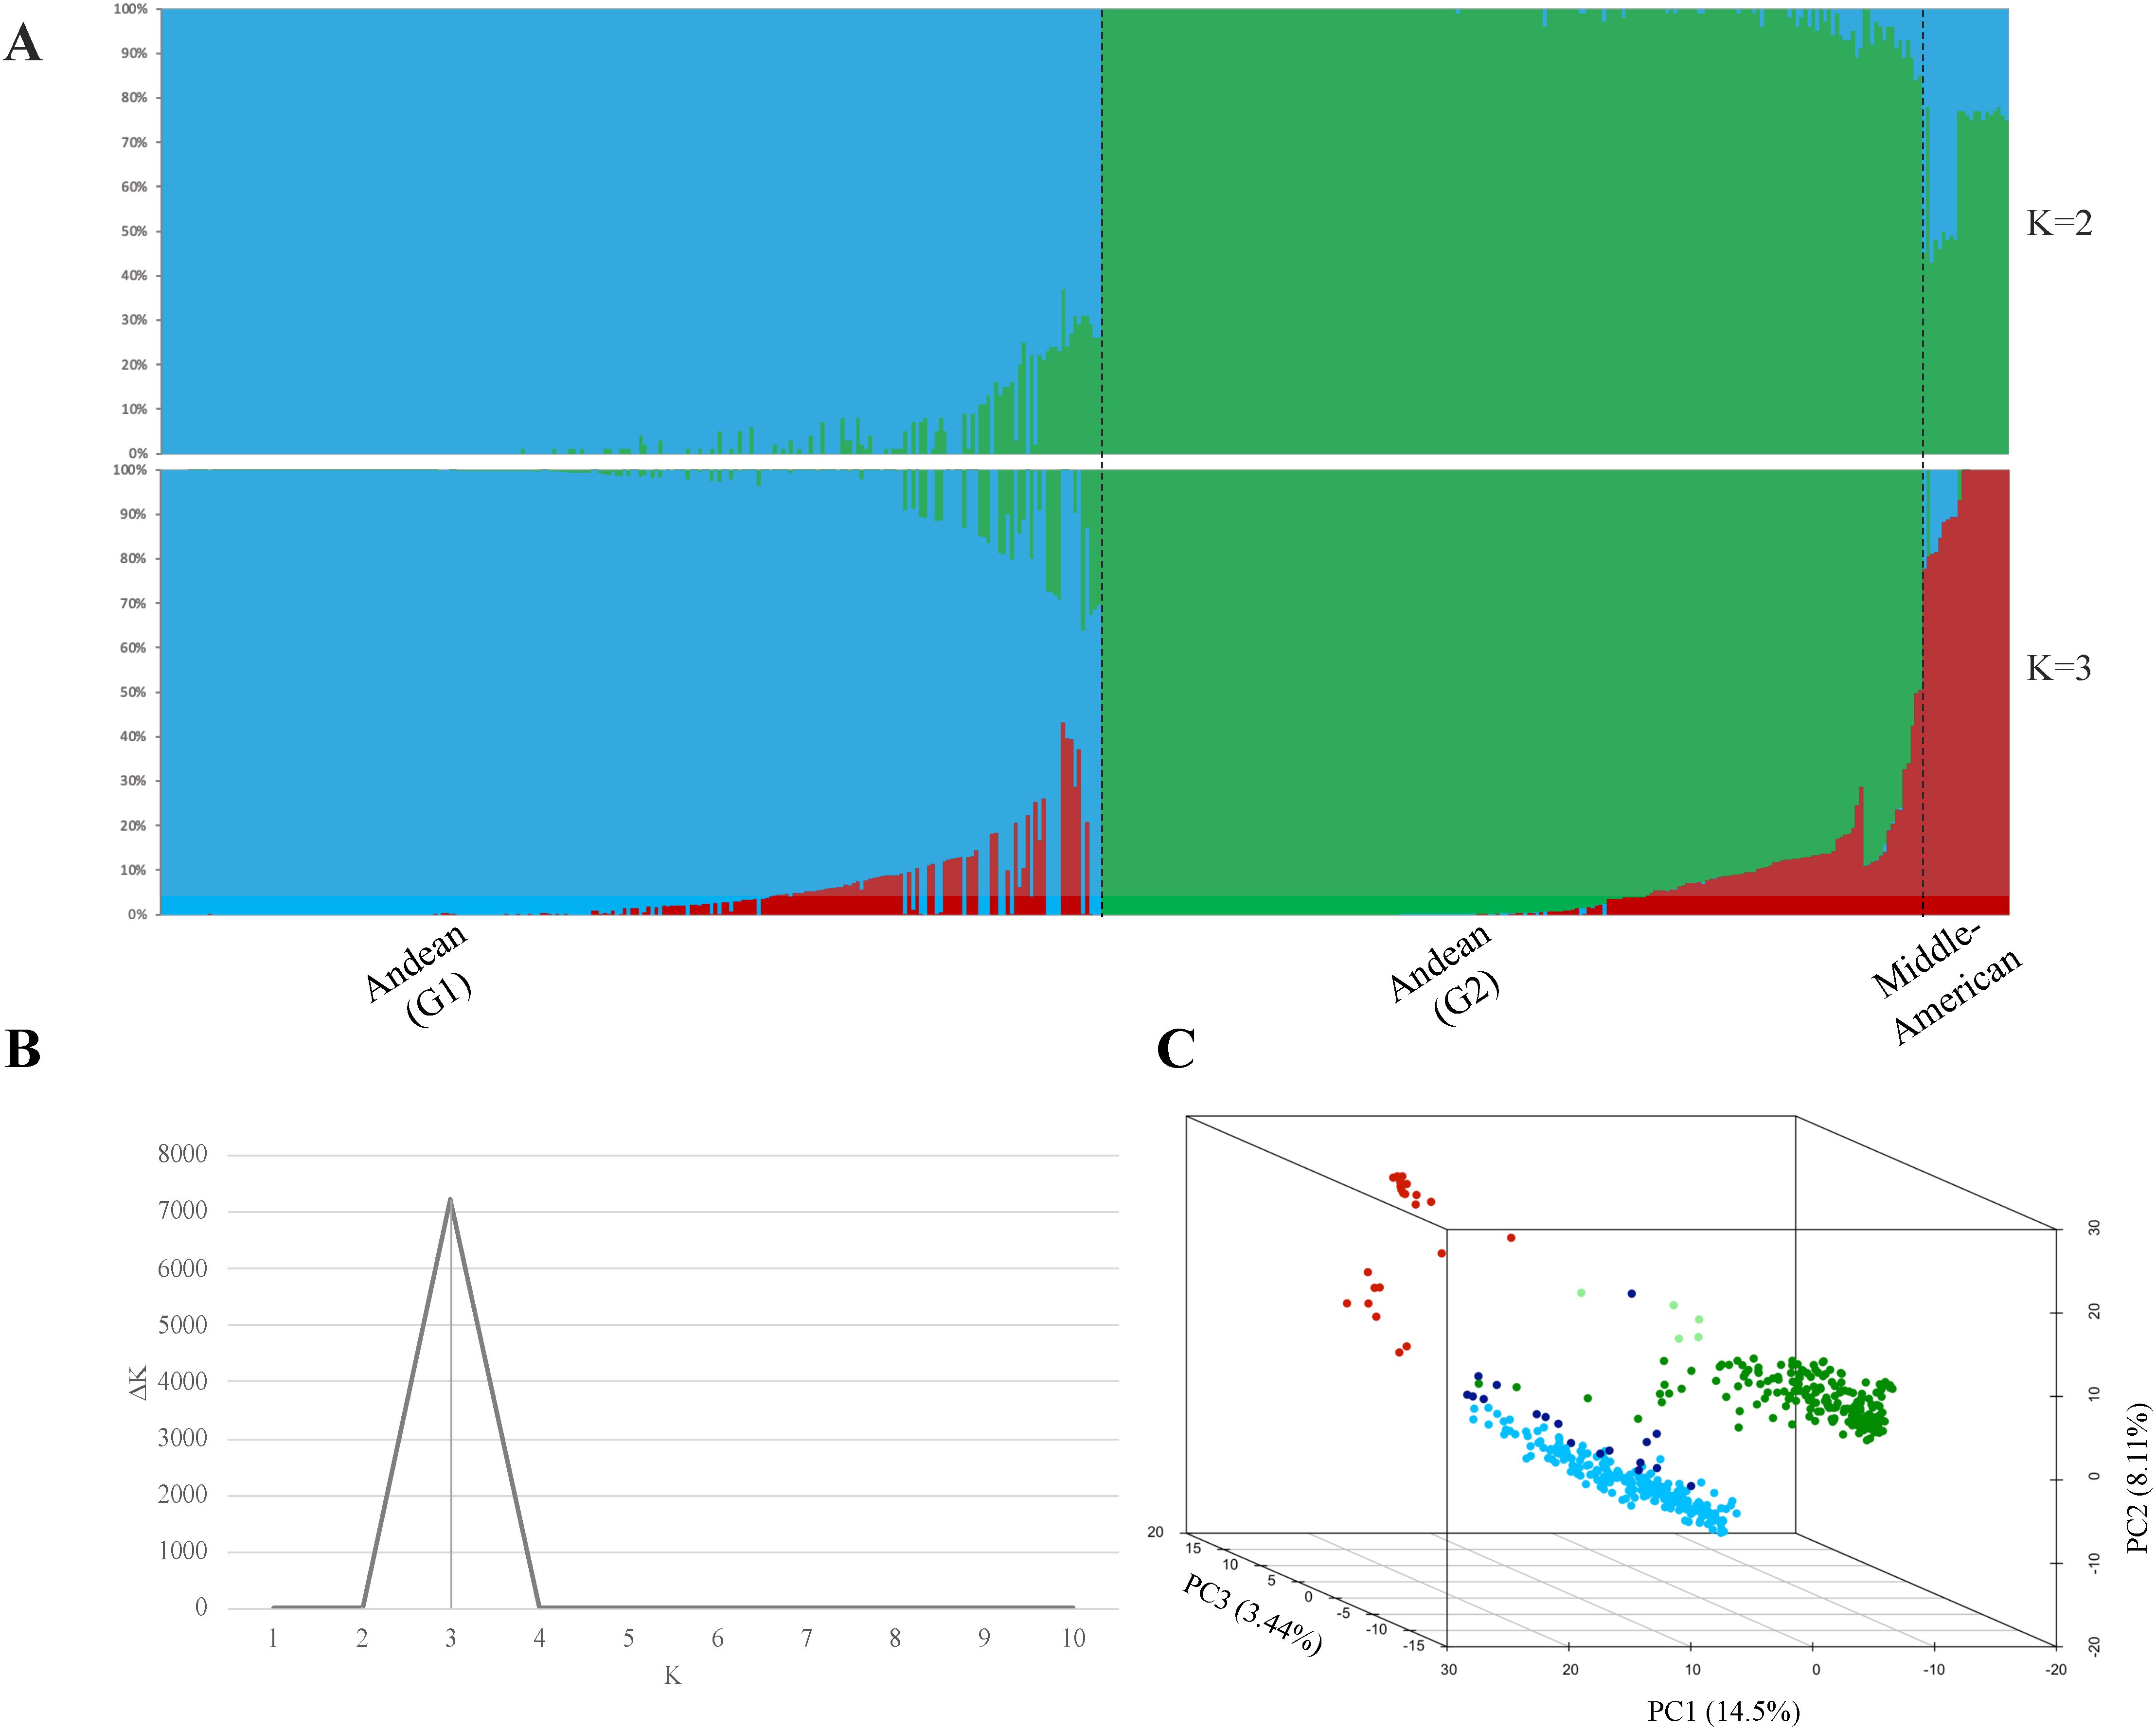
Figure 1. Estimation of the population structure. (A) Population structure clustering depicts each of the 468 ADP accessions by vertical bars into colored segments, with lengths proportional to each of the K inferred ancestral populations: blue and green colors represent sub-populations G1 and G2, respectively, within the Andean gene pool, while the red color corresponds to the Middle-American Genepool. (B) Evanno test of ADP populations resulting in an optimal K = 3, and (C) Principal Component Analysis (PCA) of the Andean diversity panel of common bean, with colors based on population structure analysis at K = 3, based on the membership coefficient (Q ≥0.75) from STRUCTURE. In the plot, Middle-American population is represented in red color, Andean (G1) population in blue, Andean (G2) admixture accessions in ‘light green,’ Andean (G2) population in green, and Andean (G1) admixture accessions in ‘dark blue’.
Additionally, 22 accessions categorized into the Middle-American gene pool (Q ≥0.75) and two accessions with a Middle-American allele admixture (Q >0.5) were removed from further analyses. This group included five Mexican accessions of the M phaseolin type, which is predominant in Mexican wild bean accessions (Koenig et al., 1990).
In summary, the Andean population comprised 444 accessions with structural analysis separating them into two sub-populations: Andean (G1) with 221 accessions and Andean (G2) with 202 accessions. Andean (G1) accessions were predominantly from Africa (55.7%, n = 123), followed by those of North American origin (32.1%, n = 71). Similarly, the Andean (G2) accessions included a significant proportion from Africa (42.6%, n = 86) and North America (20.8%, n = 42), with a notable representation from South America (23.3%, n = 47). The remaining accessions were grouped as admixtures according to gene-pool predominancy, using a membership coefficient Q ≥0.5, with 17 accessions as Andean (G1) admixture (3.82%) and four as Andean (G2) admixture (0.90%).
Phenotypic correlations
Based on heatmap analysis, three clusters were observed using phenotypic data collected for BBS, CBB, and HBB reactions in ADP (Figure 2A). One cluster grouped CBB field reactions collected in Lusaka, Zambia in 2014 and 2018. The second cluster grouped BBS and HBB reaction data. The third cluster consisted of CBB screenhouse reactions collected in Puerto Rico using the Xa484A and Xa353 strains in 2012 and the ZM4 strain evaluated in Potchefstroom, South Africa, in 2018.
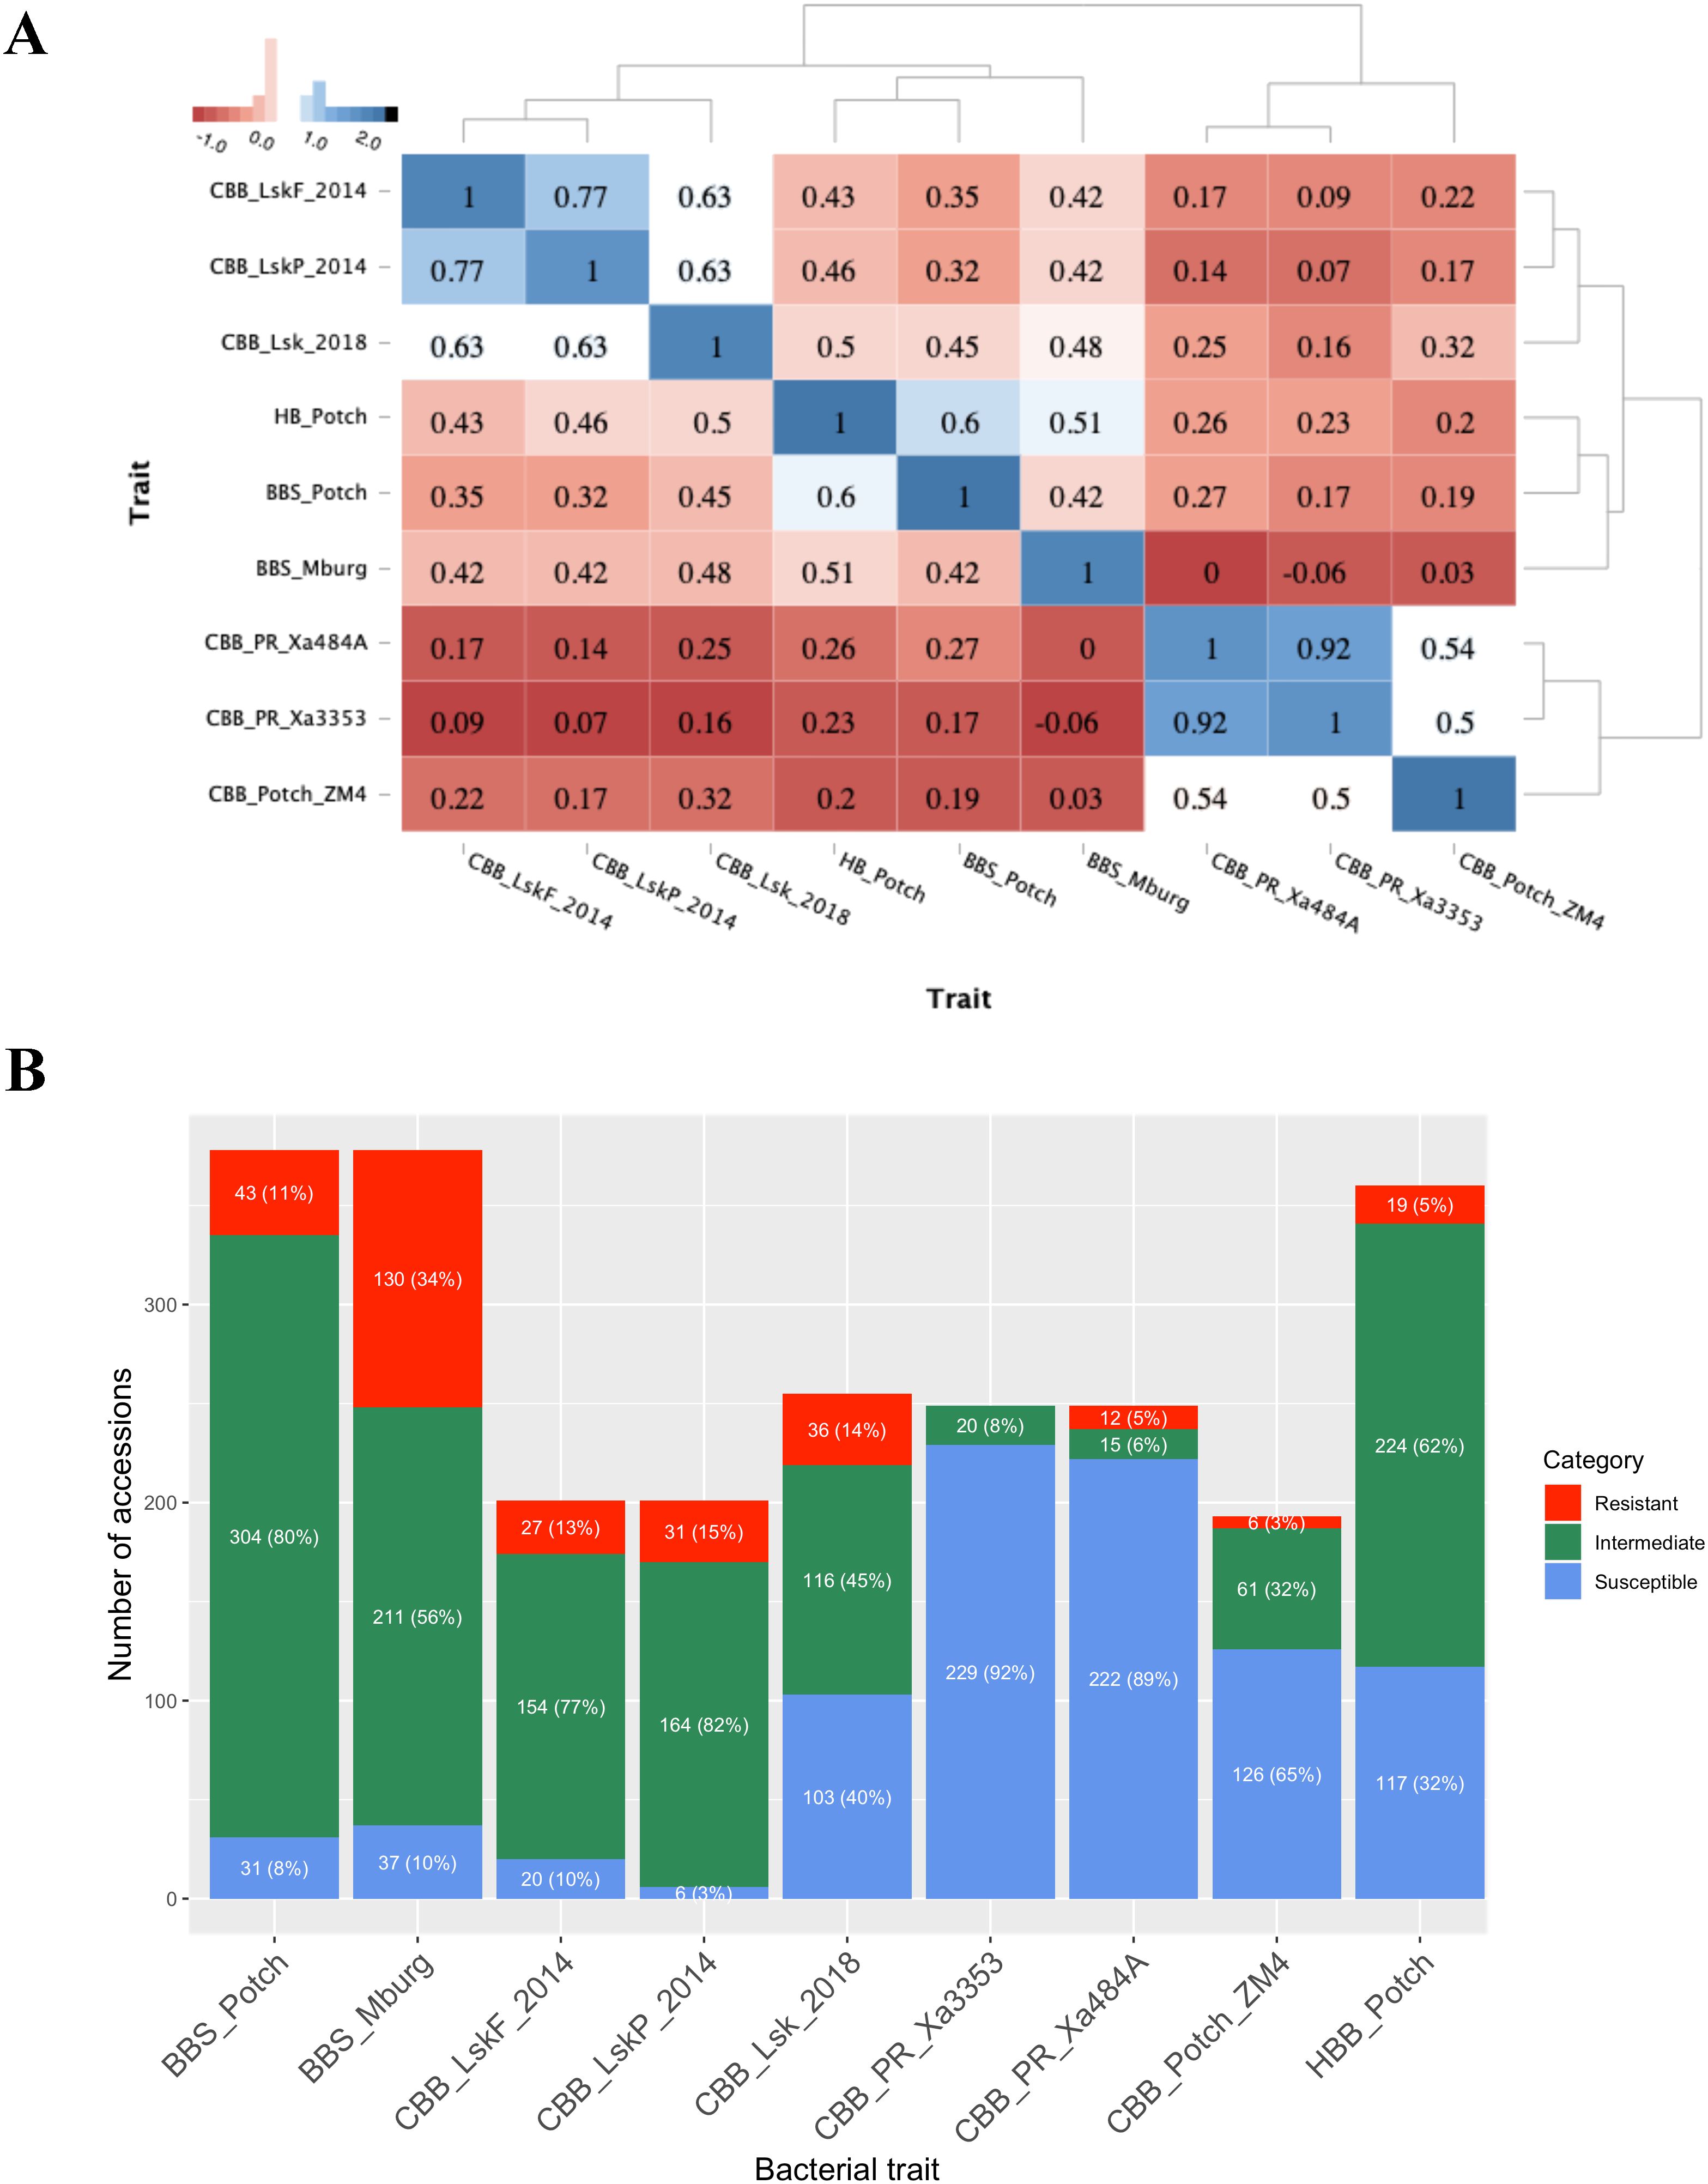
Figure 2. Bacterial phenotyping analysis. (A) Dendrogram and heatmap based on the Pearson correlation coefficient between traits and locations, using the pairwise complete observation method; (B) Frequency distribution of the 1–3 resistant (red), 4–6 intermediate (green), and 7–9 susceptible (blue) disease score categories for each trial.
The CBB data collected at the flowering and pod-filling stages in Lusaka, Zambia, in 2014 were highly correlated (r = 0.77, P <0.0001), and correlated with the data collected in Lusaka in 2018 (r = 0.63, P <0.0001). The screenhouse CBB data collected in Puerto Rico using Xa353 and Xa484A strains was highly correlated (r = 0.92, P <0.0001) and moderately correlated, 0.50 (P <0.0001) and 0.54 (P <0.0001), respectively, with the CBB screenhouse data collected using the ZM4 strain in Potchefstroom, South Africa, in 2018.
BBS reactions collected in Potchefstroom and Middelburg exhibited a correlation of 0.42 (P <0.0001). BBS reactions obtained in Potchefstroom and Middelburg were moderately correlated with HBB reaction, 0.60 (P <0.0001) and 0.51 (P <0.0001), respectively. BBS reactions from Potchefstroom and Middelburg exhibited moderate correlations ranging from 0.32 (P <0.0001) to 0.48 (P <0.0001), with field reactions to CBB obtained in Lusaka in 2014 and 2018. Only BBS reactions from Potchefstroom exhibited low but significant correlations, with CBB reactions collected in the screenhouse ranging from 0.17 (P <0.05) to 0.27 (P <0.0001). Lastly, HBB reactions showed significantly moderate correlations with CBB reactions collected in Lusaka (0.43 to 0.59; P <0.0001) and low but significant correlations [0.20 (P <0.01) to 0.26 (P <0.001)] with CBB reactions from screenhouse trials in Puerto Rico and South Africa.
Based on the resistant (1–3), intermediate (4–6), and susceptible (7–9) disease score categories, more resistant individuals were detected under natural field infection than under artificial inoculation in the field or screenhouse (Figure 2B). Accessions evaluated using artificial inoculation with CBB Xa3353, Xa484A, and ZM4 strains demonstrated high susceptibility rates of 92%, 89%, and 65%, respectively. Conversely, intermediate scores were predominant for the accessions evaluated for CBB under natural infection conditions in Lusaka in 2014 and 2018. Similarly, the BBS and HBB evaluations showed predominantly intermediate scores ranging from 56% to 82%.
Genome-wide association study
A GWAS detected 24 significant QTL associated with resistance to these three bacterial diseases. Significance (LOD >3) in two or more ML-GWAS methods combined with significant (P ≤0.05) Yuen’s tests were used to declare a significant QTL in this study. The QTL were distributed across 10 of the 11 chromosomes, with Pv09 being the exception (Figure 3). The QTL for each disease are described below.
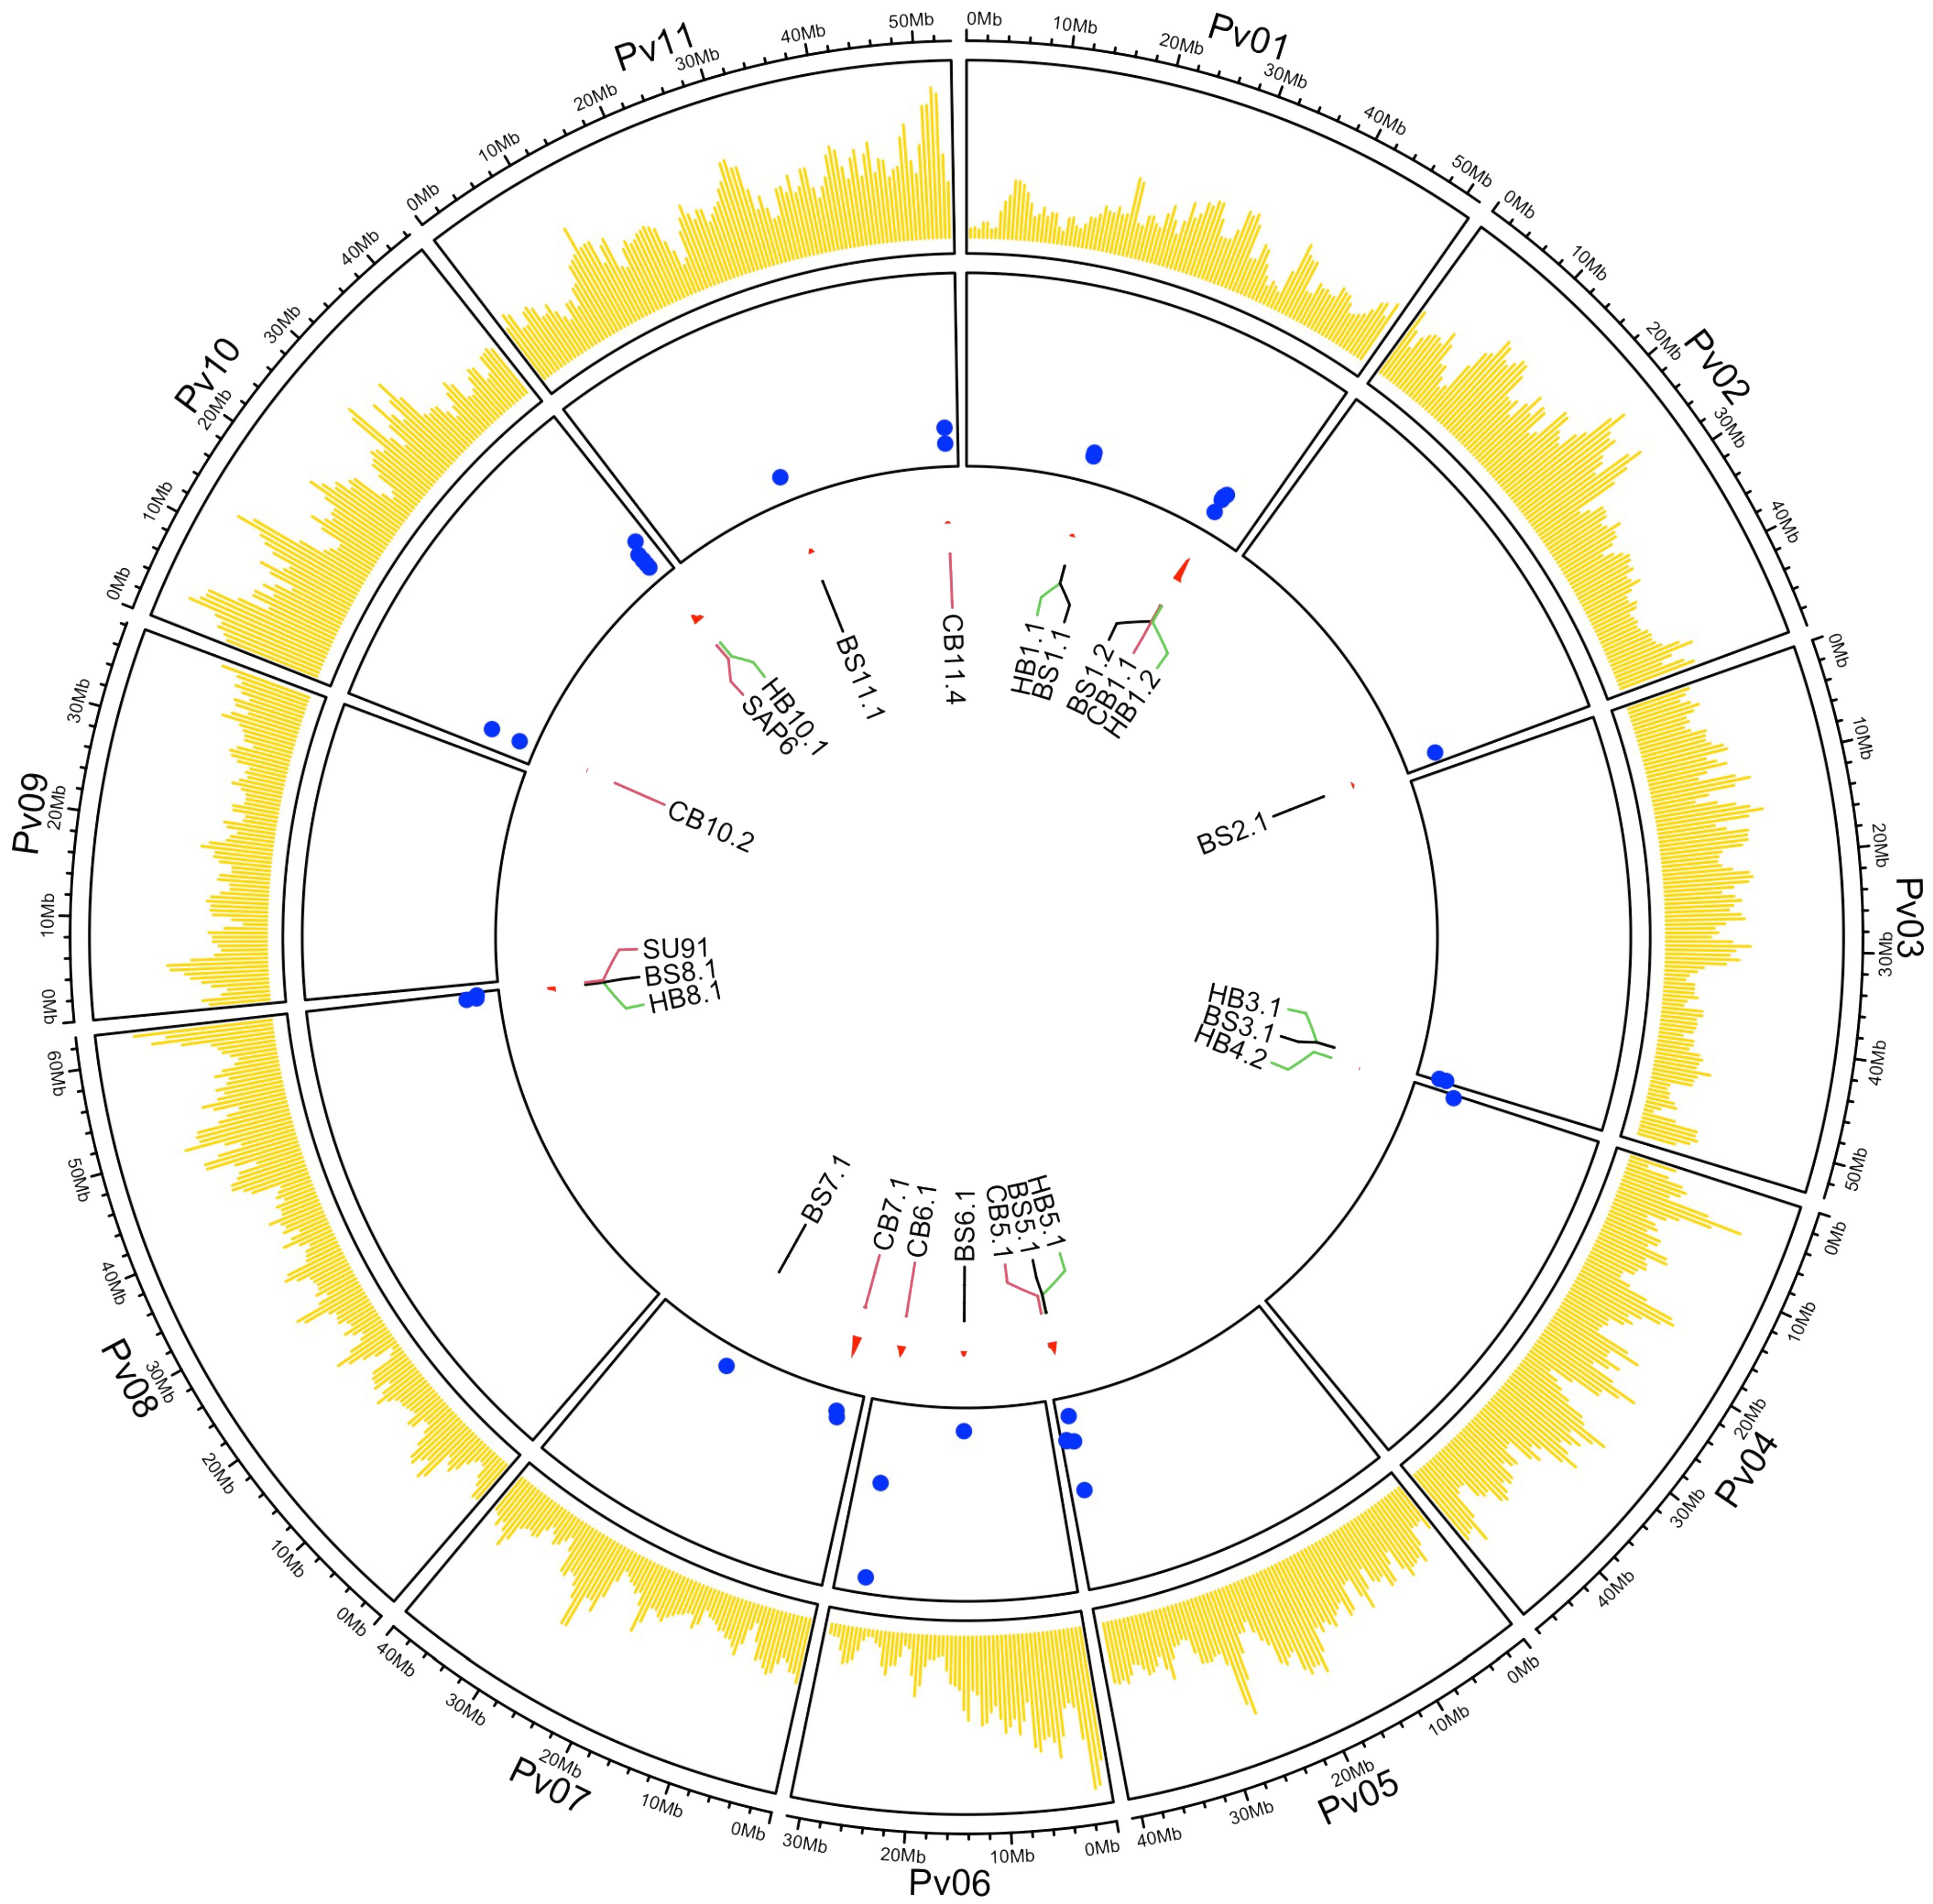
Figure 3. Circos plot showing the SNP distribution map for the 444 ADP genotypes in yellow, LOD values (blue dots on the y-axis), and genomic positions for the labeled significant QTL (on the x-axis) associated with BBS, CBB, and HBB resistance across 11 chromosomes. The SNPs were positioned using the G19833 v2.1 reference genome assembly.
Bacterial brown spot QTL
Nine QTL associated with BBS resistance were identified. Four QTL (BS1.2, BS7.1, BS8.1, and BS11.1) were identified only in the Middelburg field trial under natural infection, four QTL (BS1.1, BS2.1, BS3.1, and BS6.1) were identified only in the Potchefstroom field trial under artificial inoculation, and only one, BS5.1, identified in both trials (Table 1). BS1.2 was detected by most of the GWAS methods (six), followed by BS1.1 and BS11.1 (five methods). BS2.1 exhibited the lowest MAF (0.09), whereas BS5.1 exhibited the highest MAF (0.43, 0.45). Interestingly, BS5.1 had a greater effect in Potchefstroom, with 6.25% phenotypic variation explained (PVE), than in Middelburg, with 2.80% PVE.
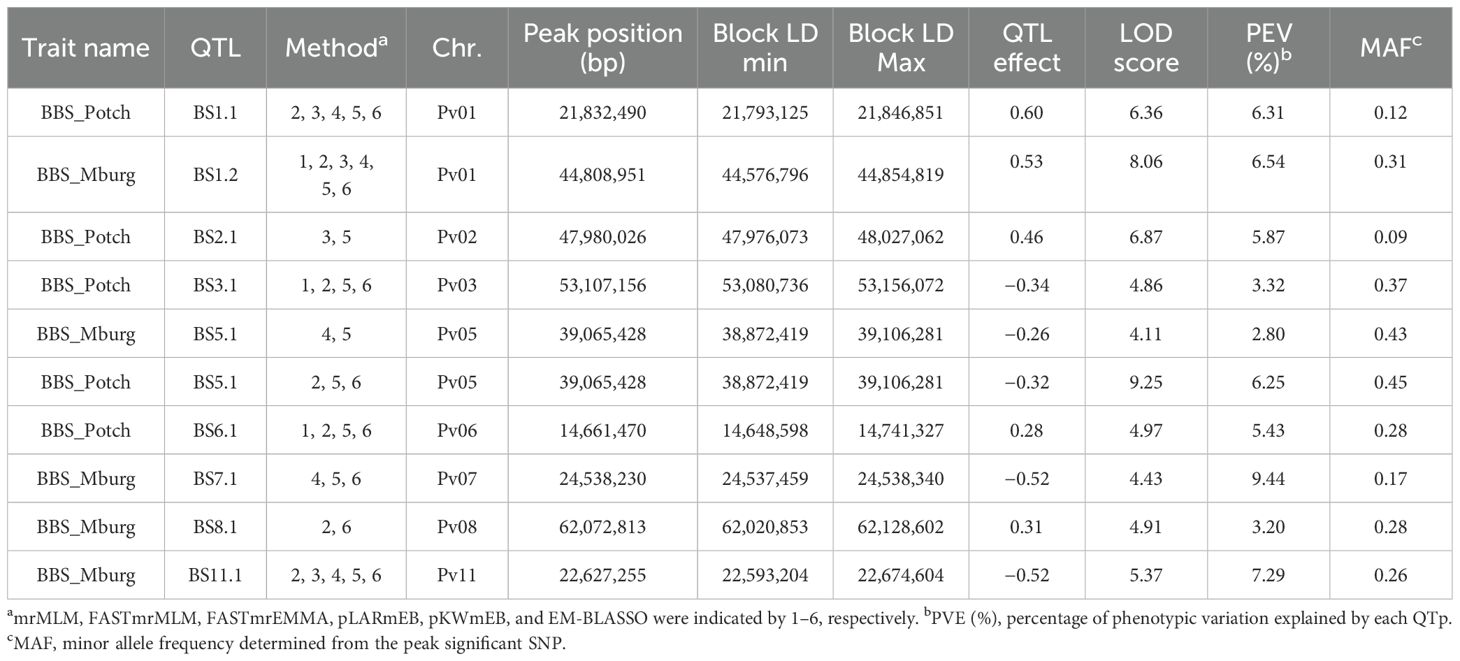
Table 1. BBS QTL identified by ML-GWAS in 377 ADP accessions evaluated against Pseudomonas syringae pv. syringae under natural field infection in Middelburg (Mburg) and artificial field inoculation in Potchefstroom (Potch).
Three ADP accessions, ADP118 (‘Werna’), ADP120 (‘Tygerberg’), and ADP121 (‘Kranskop HR-1’), all indeterminate vine sugar/cranberry cultivars developed by the ARC-Grain Crops Institute, Potchefstroom, SA, possessed the same haplotype with seven QTL, BS1.1/BS1.2/BS5.1/BS6.1/BS7.1/BS8.1/BS11.1, for resistance to BBS. These three cultivars exhibited resistant disease scores ranging from 1 to 1.67 under artificial inoculation, and from 2 to 2.67 under natural infection (Supplementary Table S2). Additionally, two advanced lines, ADP740 (MW-25) from CIAT-Malawi and ADP790 (PR0633-10) from Puerto Rico, with BS1.1/BS1.2/BS6.1/BS7.1/BS8.1/BS11.1 and BS1.1/BS1.2/BS6.1/BS8.1/BS11.1, respectively, exhibited low disease scores (ranging from 1 to 1.67) across locations.
Common bacterial blight QTL
Eight QTL, CB1.1, CB5.1, CB6.1, CB7.1, CB10.2, and CB11.4, including the historical major QTL SAP6 and SU91, were detected across CBB trials (Table 2). The SAP6 QTL was detected in all trials, except for the flowering stage evaluation in Lusaka in 2014. CB1.1, CB7.1, and SU91 were only detected in Lusaka field trials. Conversely, CB5.1, CB6.1, CB10.2, and CB11.4 were only detected by the two strains in the Puerto Rico screenhouse trial, and they possessed extremely low MAF ranging from 0.01 to 0.04. The screenhouse trial in Potchefstroom detected only the SAP6 QTL.
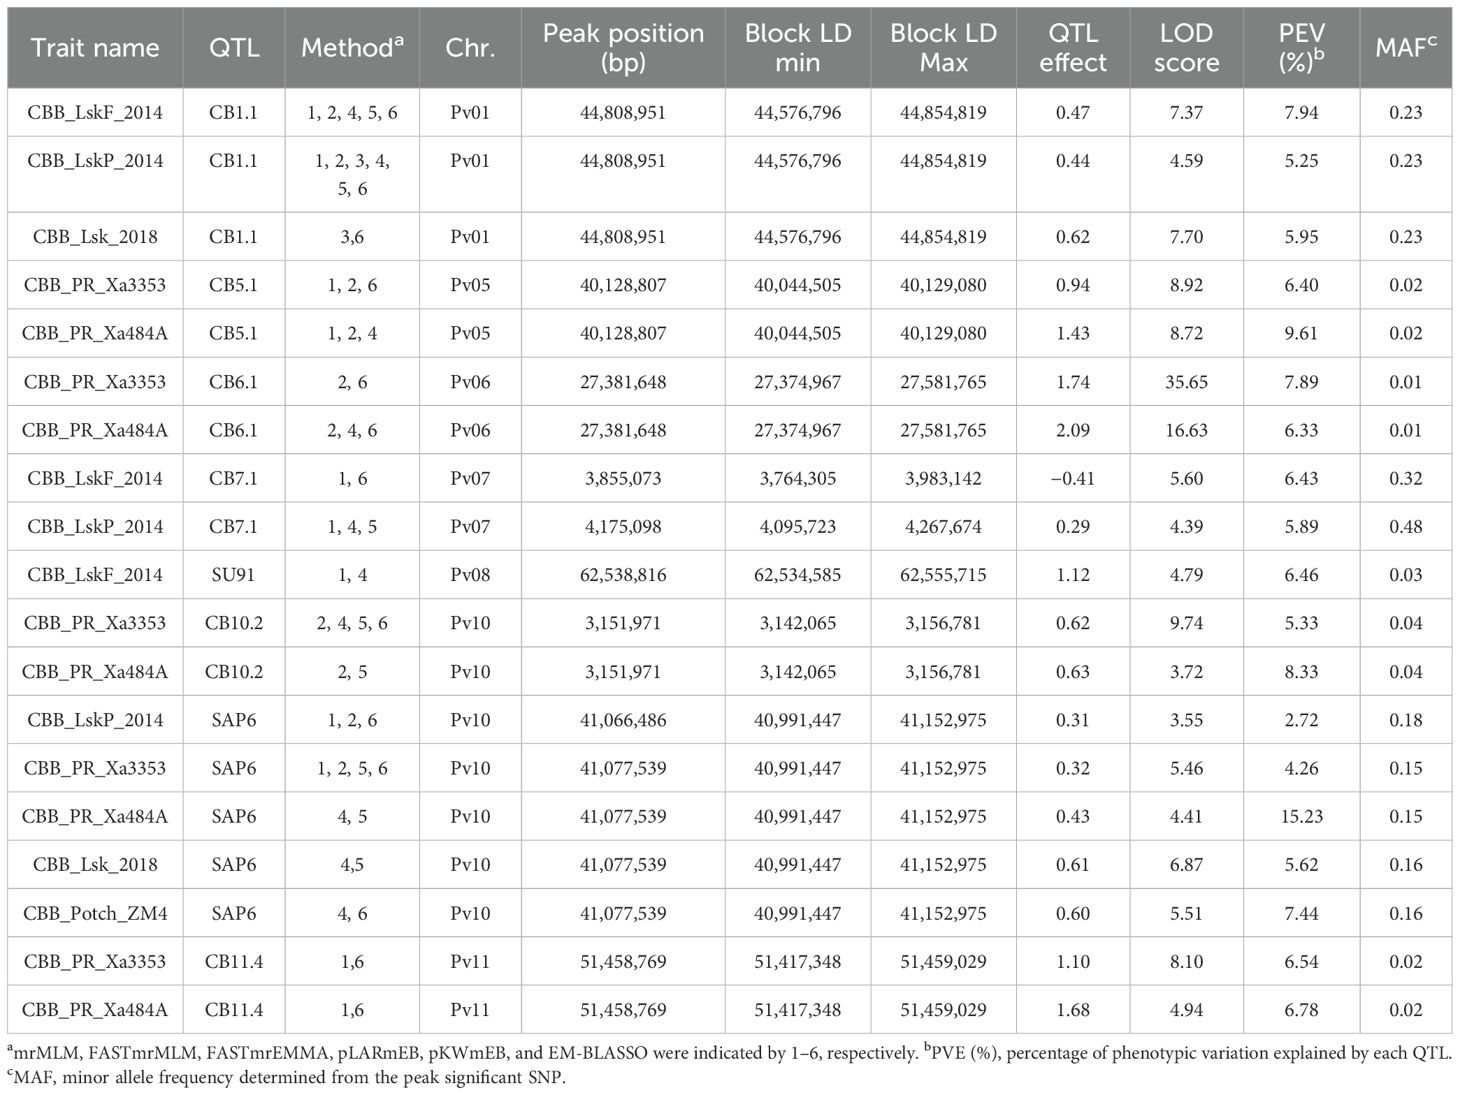
Table 2. CBB QTL identified by ML-GWAS in 191–254 ADP accessions evaluated under natural infection in the field in Lusaka, Zambia (CBB_LskF_2014, CBB_LskP_2014, and CBB_Lsk_2018), and against Xanthomonas axonopodis pv. phaseoli (Xap) strains Xa3353 and Xa484A in the screenhouse in Mayaguez, Puerto Rico (CBB_PR_Xa3353) and by Xanthomonas fuscans subsp. fuscans strain ZM4 in the screenhouse in Potchefstroom, South Africa (CBB_Potch_ZM4).
ADP626 (‘Badillo’), ADP113 (‘OPS-RS4’), and ADP118 (Werna) exhibited low mean CBB disease scores across the trials. ADP626, an indeterminate light red kidney from UPR-Mayaquez, Puerto Rico, possessed the CB1.1/CB3.1/CB5.1/SAP6 haplotype and exhibited a mean score of 1.3 for field locations in Zambia with natural infection, and a score of 4.2 across screenhouse trials (Supplementary Table S2). ADP113 and ADP118, both indeterminate sugar/cranberry cultivars from ARC-Grains Crop Institute, possessed haplotype CB1.1/SU91/SAP6 and exhibited mean scores of 1.3 and 1.0 under natural infection and 4.7 and 3.6 under artificial inoculation, respectively.
Additionally, ADP653 (USDK-CBB-15) (Miklas et al., 2006a) and ADP665 (USWK-CBB17) (Miklas et al., 2006b) released by USDA-ARS Prosser, WA, possessed haplotype SU91/SAP6 as expected and exhibited mean scores of 2.7 and 2.8, respectively, under natural infection, but were not included in the screenhouse trials. ADP653, a dark red kidney, and ADP665, a white kidney, have determinate bush growth habits.
Halo bacterial blight QTL
Seven QTL associated with HBB resistance HB1.1, HB1.2, HB3.1, HB4.2, HB5.1, HB8.1, and HB10.1 were detected (Table 3). HB4.2, identified by Tock et al. (2017) in multiple populations, had a low MAF of 0.03 in this study, as expected, given its origin from the Middle American landrace PI 150414. Using ADP means, Tock et al. (2017) identified only one QTL, HB5.1. Improved GWAS methods and the enhanced SNP dataset likely contributed to the identification of six more QTL in this study. HB5.1 exhibited the highest PVE (9.73%) and LOD (19.1) and a high MAF (0.44), which is significantly consistent with the MAF observed (MAF = 0.417) by Tock et al. (2017). HB8.1, was observed by Tock et al. (2017) in an RIL population, and HB10.1 is near the Pse-4 gene locus (Miklas et al., 2014); however, these and the newly identified QTL HB1.1, HB1.2, and HB3.1, require further validation.
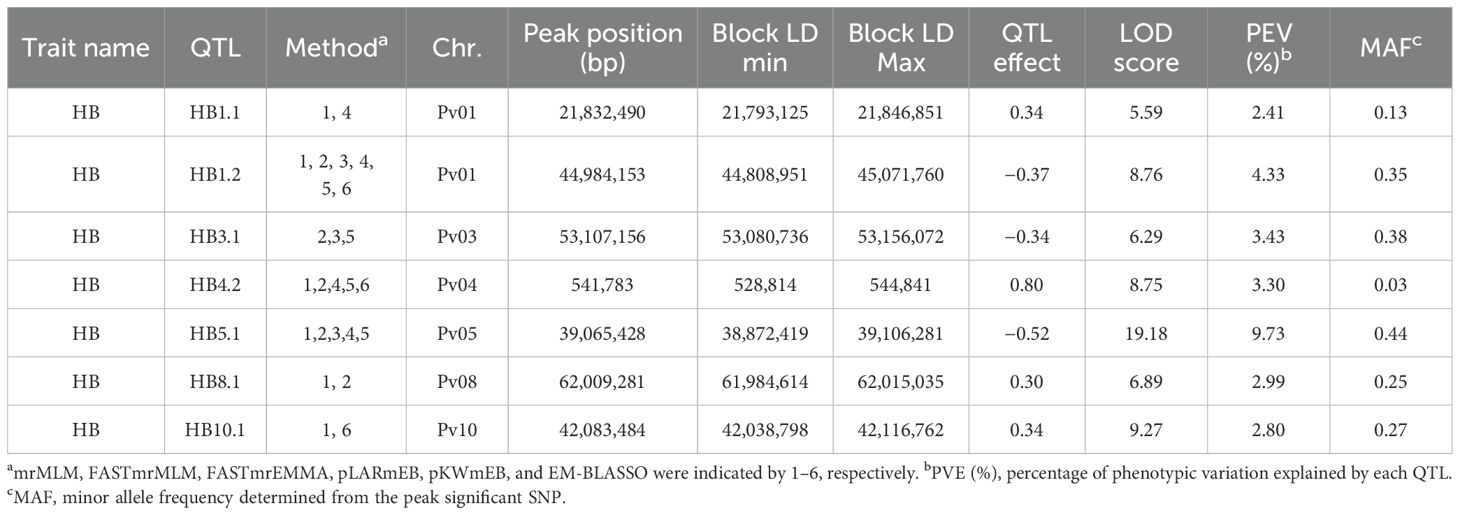
Table 3. HBB QTL identified by ML-GWAS in 358 ADP accessions inoculated with Pseudomonas syringae pv. phaseolicola Race 6 (strain Tanzania-1299A) under field conditions at the Potchefstroom ARC-GCI Station in South Africa.
ADP121 (Kranskop HR-1) and the breeding line ADP723 (KAB06F2.8-69) developed by CIAT-Malawi, exhibited resistant HBB scores 1.7 and 2.7, respectively, and possessed the same haplotype with six QTL, HB1.1, HB3.1, HB4.2, HB5.1, HB8.1, and HB10.1. Moreover, ADP118 (Werna) and ADP716 (MW-1), a breeding line developed by CIAT-Malawi, with scores of 2.0 and 2.3, respectively, possessed the same haplotype with five QTL HB1.2, HB3.1/HB5.1, HB8.1, HB10.
QTL intervals with resistance to multiple bacterial diseases
Five QTL intervals that were resistant to two or more bacterial pathogens were observed in Pv01 (BS1.1 and HB1.1), Pv01 (BS1.2, CB1.1, and HB1.2), Pv03 (BS3.1 and HB3.1), Pv05 (BS5.1 and HB5.1), and Pv08 (BS8.1 and HB8.1). The same peak SNP detected the QTL within the Pv01 (BS1.1 and HB1.1), Pv03, and Pv05 intervals, suggesting that a single gene likely contributes to resistance to both BBS and HBB bacterial pathogens.
The disease resistance conditioned by BS1.2, CB1.1, and HB1.2 within the second QTL interval on Pv01, was influenced by the Fin locus, located in the same region, which controls growth habit. For all three bacterial diseases, genotypes with indeterminate vine growth habits exhibited significantly (P <0.0001) higher resistance (lower susceptibility) than the genotypes with determinate bush growth habits (Table 4).
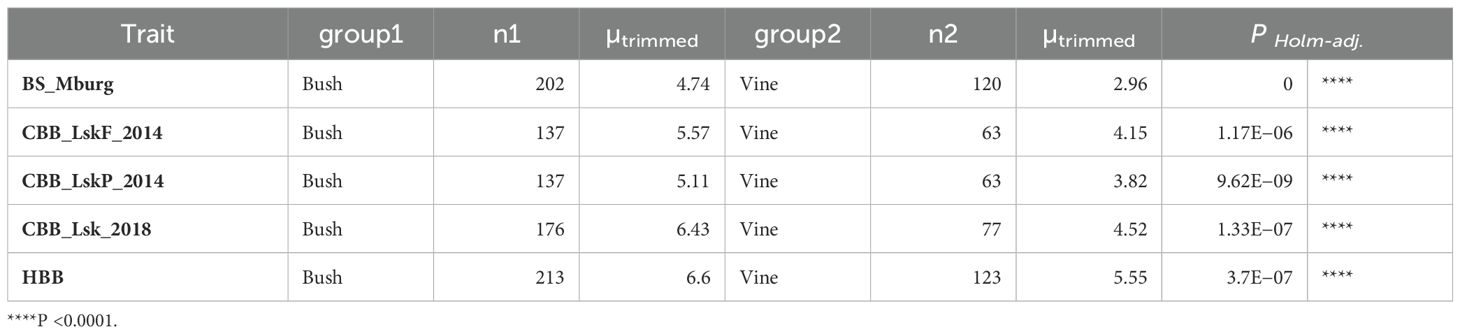
Table 4. ANOVA for quantitative BBS in Middelburg, CBB (Lusaka in 2014 and 2018), and HBB reaction (1 to 9 scale) in ADP accessions among bush, climber, and vine growth habits compared by Yuen’s trimmed means.
The peak SNPs for BS8.1 (S08_62072813) and HB8.1 (S08_62009281) were different, but they were in LD and were significantly correlated (D’ = 0.83; R2 = 0.58). Additionally, three QTL regions associated with CBB resistance were closely linked to QTL for resistance to BSS, HBB, or both diseases [BS5.1/HB5.1 (CB5.1), BS8.1/HB8.1 (SU91), and HB10.1 (SAP6)] (Figure 3; Table 5). The CB5.1 QTL, from 40,044,505 to 40,129,080 bp, was close to the above interval, but exhibited a low haplotype correlation (R2 = 0.036) with BS5.1 and HB5.1. The QTL overlapping the major SU91 QTL region from 62,534,585 to 62,555,715 bp exhibited low LD and correlation (D’ = 0.19; R2 = 0.015) with BS8.1 and HB8.1. The HB10.1 QTL, from 42,038,798 to 42,116,762 bp, was found to be moderately correlated (R2 = 0.46) with the SAP6 QTL, but their MAF values were quite different, 0.27 HB10.1 and 0.15 SAP6.
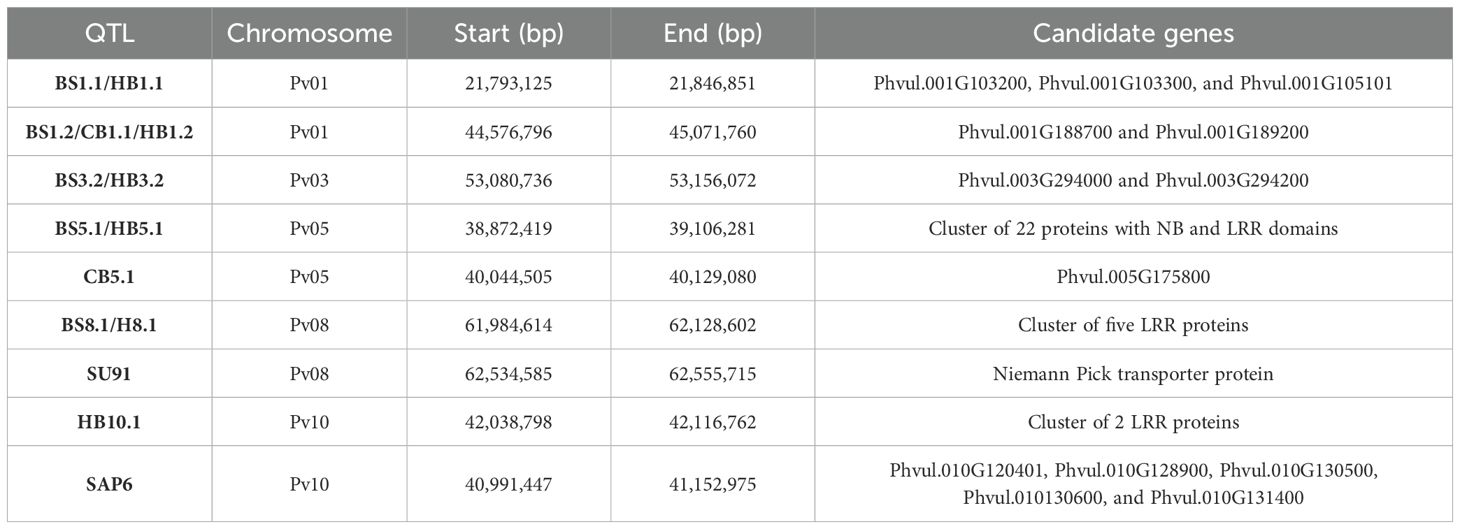
Table 5. Summary of candidate genes identified for five QTL intervals and three regions with linked QTL conditioning resistance to multiple bacterial pathogens BBS, CBB, and HBB.
Discussion
The Andean diversity panel was examined using GWAS to identify regions conferring resistance to bacterial brown spot, common bacterial blight, and halo bacterial blight diseases, which can severely reduce yield and fitness in common bean. GWAS and disease evaluations represented a cooperative effort among common bean researchers across four countries: Puerto Rico, South Africa, the United States of America, and Zambia. Given that common beans represent a specialty crop with a relatively small research community, the increased scope and widened impact often result from collaborative research across continents on topics of mutual benefit.
We used mean BBS disease severity reactions for a subset of ADP evaluated by Salegua et al. (2020) under natural and artificial field inoculations in Middelburg and Potchefstroom, South Africa, respectively. Mean CBB disease reactions for subsets of ADP were obtained in this study under artificial screenhouse inoculations in Puerto Rico and Potchefstroom and natural field infections in Lusaka, Zambia, in 2014 and 2018. Mean HBB disease reactions for ADP were obtained from evaluations conducted under artificial field inoculation in Potchefstroom in a previous study (Tock et al., 2017). Although different subsets of ADP accessions were evaluated across these different trials, there were enough accessions (ranging from 99 to 323 accessions) to identify five QTL intervals with resistance to multiple bacterial pathogens and to observe significant correlations between disease reactions (1 to 9 severity scores) obtained for the three bacterial pathogens.
Overall, 24 QTL associated with resistance met our criteria for significance: i) significant in at least two of the six ML-GWAS methods conducted and ii) combined with significant Yuen’s tests. Zhang et al. (2019) suggested combining single-locus and/or multi-locus methods to enhance the detection power and robustness of GWAS. Roy et al. (2023) used multiple mapping methods and environments to increase confidence and reliability of identified QTL for use in marker-assisted selection.
Nine, eight, and seven QTL were associated with resistance to BBS, CBB, and HBB, respectively. Previous BBS QTL studies predated accurate physical maps such that the 21 QTL identified by Jung et al. (2003) across 10 of 11 linkage groups and the four QTL identified by Navarro et al. (2007) on chromosomes Pv01, Pv03, Pv06, and Pv11 could not be easily aligned with the nine QTL found herein. This study provides a starting point for physical mapping and naming of distinct BBS QTL.
There were sufficient differences in infection between the BBS trials, and only one QTL, BS5.1, was detected in both trials. Differences in climate, pathogen strains, mode of infection, and disease severity, among other factors, likely contributed to identification of distinct QTL under natural infection versus artificial field inoculation. Perhaps some of the BBS QTL detected by natural infection reduced the Pss population size on leaf surfaces, which lessened infection incidence and severity. Four BBS QTL overlapped with four HBB QTL, and one with both CBB and HBB QTL.
BS1.1 and HB1.1 were found linked to a cluster of three multi-antimicrobial extrusion (MATE) proteins, Phvul.001G103200, Phvul.001G103300, and Phvul.001G105101. In Arabidopsis thaliana, these proteins are highly expressed in the presence of the SAD2 gene, which encodes an importin β-like protein that plays a fundamental role in resistance against P. syringae pv. tomato (Li et al., 2023). Sun et al. (2011) identified and characterized an Activated Disease Susceptibility 1 (ADS1) gene, which encodes a putative MATE transport protein. They found that overexpression of ADS1 supported the increased growth of P. syringae pv. phaseolicola, which may control processes integral to the interaction between Arabidopsis and P. syringae species.
BS1.2, within the same QTL interval as CB1.1 and HB1.2, is co-located with the Fin locus that conditions growth habit. Accessions with determinate bush growth habits were clearly more susceptible to the three bacterial diseases than those with indeterminate vine growth habits, suggesting that Fin or a tightly linked gene has a pleiotropic effect on bacterial disease reactions. Early maturity and less plasticity for vegetative growth and the reproductive phase likely contribute to the increased susceptibility of accessions with determinate bush growth habits. Two gene models within the region, Phvul.001G188700 and Phvul.001G189200, affect agronomic traits including flowering time, vegetative growth, pod and seed size, and early seedling development (González et al., 2016; Moghaddam et al., 2016; Delgado-García et al., 2021). The Phvul.001G188700 gene model encodes a nucleoside hydrolase involved in mobilization of nutrients during plant development and response to plant–pathogen interactions, playing a role in manipulating plant metabolism to favor the pathogen (Li et al., 2013). Additionally, the Phvul.001G189200 gene, homologous to the A. thaliana TERMINAL FLOWER1 (TFL1) gene, has been suggested in previous studies as a candidate gene for the determinacy locus fin (Kwak et al., 2008; Repinski et al., 2012; Keller et al., 2022).
For the BS3.1 and HB3.1 QTL intervals, a significant SNP was found upstream of the gene model Phvul.003G294000, which encodes a peroxidase protein. Peroxidase FBP1 and RBOH oxidases play crucial roles in the defense mechanisms of P. vulgaris against P. syringae pv. phaseolicola (Galeou et al., 2023). Specifically, FBP1 has been implicated in rhythmic defense, whereas RBOH oxidases are associated with acute defense responses (Galeou et al., 2023). Another candidate gene, Phvul.003G294200, containing a Cyclophilin-type peptidyl-prolyl cis-trans isomerase domain, was associated with the plant defense response against P. syringae in A. thaliana, where knock-out mutations increased susceptibility to P. syringae, while overexpression altered the transcription of defense genes, enhancing resistance (Pogorelko et al., 2014).
BS5.1 and HB5.1 are associated with a cluster of 22 leucine-rich repeat (LRR) proteins. Oblessuc et al. (2022) observed that gene model Phvul.005G162600 (Pv05: 39.05 Mb), encoding a LRR/malectin protein, was significantly upregulated in HBB resistant and tolerant genotypes, suggesting a potential association with general plant responses to Psph. LRR/malectin are plasma membrane receptors frequently found in legume and non-legume species (Restrepo-Montoya et al., 2020), and are involved in pathogen resistance and antimicrobial responses (Wang et al., 2008; Chakraborty et al., 2019).
For the BS8.1 and HB8.1 interval, Oblessuc et al. (2022) identified two candidate genes, Phvul.008G277310 and Phvul.008G277352 for resistance to Psph, at 61.9 Mb, which encode Ras suppressor proteins containing leucine-rich repeats. Overall, the candidate gene models found within the intervals with overlapping QTL suggested genes that could confer resistance to both BBS and HBB.
For CBB, two well-known major effect QTL, SAP6 and SU91, were detected. Both SAP6 and SU91 are easily assayed with existing markers in an Andean genetic background based on their origin from the Middle American gene pool and Tepary bean, respectively. Normally, SU91 is detectable under controlled screening conditions, but few accessions with this QTL were included in screenhouse trials. Therefore, SU91 was only detected in the field and exhibited a low MAF (0.03) because few accessions possessed the QTL (RH No.21, OPS-RS4, Werna, USDK-CBB-15, and USWK-CBB-17). Simons et al. (2021) identified SU91 within the 62.39–62.40 Mb interval in a Middle American breeding population. Viteri et al. (2014) mapped the peak for SU91 QTL at 62.96 bp (updated to G19833v2.1) in the Othello/VAX 3 RIL population. Lobaton et al. (2018) also detected an introgression block from P. acutifolious from 62,536,519 to 63,032,528 bp in the interspecific lines VAX 3, VAX 4, and VAX 6. Perry et al. (2013) identified a candidate gene at 62.9 Mb linked to the SU91 QTL, which encodes a Niemann–Pick transporter protein.
Across the different CBB trials, the major QTL SAP6 was identified within an interval of 40,991,447–41,152,975 bp. GWAS in a panel of 852 dry bean inoculated with Xap f91-5 strain located SAP6 QTL to 41.66–41.84 Mb in a Middle-American breeding population and to 41.11–42.22 Mb in an Andean breeding population (Simons et al., 2021). Zhu et al. (2016) described 25 gene models for the SAP6 region spanning 40.83–41.11 Mb (updated to G19833 v2.1). Among these gene models, 10 have functional annotations associated with plant–pathogen interactions, including receptor-like kinases, lipoxygenase, cytochrome P450 superfamily members, and plant glycoproteins from the cupin superfamily.
The specific candidate genes for SAP6 included four encoding MYB transcription factors (Pv010G131400, Pv010G120401, Pv010G130500, and Pv010130600). In Arabidopsis, AtMYB30, a MYB TF, has been implicated as an activator of HR-related cell death and resistance against the bacterial pathogen X. axonopodis (Celenza et al., 2005). Additionally, another candidate gene, Phvul.010G128900, encodes a Cytochrome P450 superfamily protein, similar to the pepper Cytochrome P450 gene CaCYP450A, which is differentially induced during Xanthomonas campestris pv. vesicatoria infection, and plays a crucial role in plant defense (Hwang and Hwang, 2010).
Except for SAP6, different QTL conditioning resistance to CBB were identified in the field (three QTL) and screenhouse (four QTL) screening environments. The low MAF (0.01 to 0.04) for the CB5.1, CB6.1, CB10.2, and CB11.4 QTL detected in the screenhouse suggest a potential origin from somewhere other than the Andean gene pool, and these rare alleles require further validation. The CB5.1 QTL interval is associated with the candidate gene Phvul.005G175800, a pectin lyase-like superfamily protein. In a previous study, a QTL was found linked to the Bng162 marker at 40.45 Mb (updated to G19833v2.1) in a F2:4 population (Seaforth/OAC95) evaluated by artificial CBB inoculation under field conditions (Yu et al., 2000; Tar’an et al., 2001). Kraiselburd et al. (2013) observed differential expression of genes encoding cell wall modification-related proteins in Citrus sinensis inoculated with Xanthomonas citri subsp. citri. CB6.1, with a large effect (1.74, 2.09) and high LOD (35.5, 16.6) for resistance to Xa3353 and Xa484A strains, respectively, was linked (0.16 Mb) downstream of the desirable bc-3 recessive gene, which is resistant to all BCMV and BCMNV strains. The gene model, Phvul.010G022400, linked to QTL CB10.2, was found through a transcriptomic analysis conducted on HR45 (Yang et al., 2022), a genotype known for its high resistance to Xap. This gene encodes a cytochrome P450 enzyme associated with oxidation–reduction processes.
There have been concerted traditional breeding efforts in the past to move the resistance conditioned by SAP6 QTL, which is supported by its higher MAF (0.15–0.18). This is compared to the recent movement of SU91 into Andean beans, as evidenced by the lower MAF of 0.03 in one trial and the complete lack of detection in the other trials. The use of different strains in the screenhouse trials may have contributed to the detection of five QTL in Puerto Rico compared to SAP6 alone in South Africa. Although the Xa3353 strain is more aggressive than the Xa484A strain, they both detected the same five QTL in the Puerto Rico trials, which suggests that using only one of these strains may be sufficient for screening the germplasm for CBB resistance. Xa484A was originally used in the discovery of SAP6 QTL (Miklas et al., 1996).
In addition to SAP6 and SU91, CB1.1 and CB7.1 were detected in field trials. CB1.1 is associated with growth habits. CB7.1, which exhibited a large MAF (0.32–0.48) and was detected in only one trial (Lusaka, 2014), which suggests that it may be influenced by a common background gene that is environmentally sensitive. Two receptor-like kinase (RLK) genes (Phvul.007G051300 and Phvul.007G030300) found in the CB7.1 region in a transcriptomic study were downregulated in JaloEEP558, a genotype susceptible to Xap, in contrast to BAT93, which exhibited minimal symptoms (Foucher et al., 2020).
Seven QTL identified as conditioning HBB resistance to Psph Race 6 in this study compared to only HB5.1 detected by Tock et al. (2017). HB4.2 and HB5.1 were also detected in RIL populations by Tock et al. (2017). Oblessuc et al. (2022) analyzed two candidate genes in proximity to HB4.2, Phvul.004G008740 and Phvul.004G015800, both with LRR domains, which were significantly upregulated in genotypes tolerant to the Psph strain but downregulated in resistant genotypes. Besides HB1.1 and HB4.2, the large MAF (0.25 to 0.44) for HB1.2, HB3.1, HB5.1, HB8.1, and HB10.1 suggests they represent background genes that influence HBB disease severity. HB10.1 is near the Pse-4 gene located in an interval from 40.69 – 41.08 Mb (updated to G19833v2.1), which conditions resistance to Race 5 (Miklas et al., 2014). Two candidate genes, Phvul.010G136700 and Phvul.010G136800, were identified for HB10.1, which encode LRR proteins. Five HBB QTL overlapped with QTL conditioning resistance to BBS, as described above.
In summary, multiple regions associated with quantitative resistance to Pseudomonas and Xanthomonas were identified in Andean beans. Four QTL contributing to resistance to both BBS and HBB were found in Pv01, Pv03, Pv05, and Pv08. Growth habits likely contribute to the QTL interval on Pv01, which influences field reactions to all three bacterial diseases evaluated in this study. BS5.1, detected under both natural infection and artificial field inoculation, and SAP6, identified in all CBB trials, represented QTL with stable and broad effects. QTL HB5.1, CB7.1, and CB10.2 were further validated by their overlap with candidate genes reported in previous transcriptomic studies in common bean. Some QTL with large effects BS1.1 (0.6), CB6.1 (1.74 and 2.09), and CB11.4 (1.10, 1.68) represent potential targets to combine with major QTL HB5.1, SAP6, SU91, HB4.2, and HB5.1, to increase resistance to BBS, CBB, and HBB.
Data availability statement
The authors acknowledge that the data presented in this study must be deposited and made publicly available in an acceptable repository, prior to publication. Frontiers cannot accept a article that does not adhere to our open data policies.
Author contributions
AS-G: Investigation, Visualization, Writing – original draft, Writing – review & editing, Data curation, Formal analysis, Methodology, Validation. MM: Formal analysis, Investigation, Methodology, Writing – review & editing. KK: Data curation, Investigation, Methodology, Resources, Writing – original draft, Writing – review & editing. DL: Investigation, Methodology, Writing – review & editing. SH: Investigation, Methodology, Writing – review & editing. JR: Data curation, Formal analysis, Investigation, Methodology, Writing – review & editing. VS: Investigation, Methodology, Writing – review & editing. DF: Formal analysis, Investigation, Methodology, Writing – review & editing. TP: Formal analysis, Investigation, Methodology, Writing – review & editing. PEM: Data curation, Formal analysis, Funding acquisition, Investigation, Methodology, Writing – review & editing. PNM: Conceptualization, Investigation, Project administration, Visualization, Writing – original draft, Writing – review & editing.
Funding
The author(s) declare that financial support was received for the research, authorship, and/or publication of this article. The Kirkhouse Trust through the African Bean Consortium (ABC) project supported this work.
Conflict of interest
The authors declare that the research was conducted in the absence of any commercial or financial relationships that could be construed as a potential conflict of interest.
Publisher’s note
All claims expressed in this article are solely those of the authors and do not necessarily represent those of their affiliated organizations, or those of the publisher, the editors and the reviewers. Any product that may be evaluated in this article, or claim that may be made by its manufacturer, is not guaranteed or endorsed by the publisher.
Supplementary material
The Supplementary Material for this article can be found online at: https://www.frontiersin.org/articles/10.3389/fpls.2024.1469381/full#supplementary-material
References
Andrus, C. F. (1948). A method of testing beans for resistance to bacterial blights. Phytopathology 38, 757–759.
Antonius, S. H. (1982). Identification and inheritance of resistance to bacterial brown spot (Pseudomonas syringae) in Phaseolus vulgaris. University of Wisconsin, Madison, WI.
Celenza, J. L., Quiel, J. A., Smolen, G. A., Merrikh, H., Silvestro, A. R., Normanly, J., et al. (2005). The Arabidopsis ATR1 Myb transcription factor controls indolic glucosinolate homeostasis. Plant Physiol. 137, 253–262. doi: 10.1104/pp.104.054395
Chakraborty, S., Nguyen, B., Wasti, S. D., Xu, G. (2019). Plant leucine-rich repeat receptor kinase (LRR-RK): Structure, ligand perception, and activation mechanism. Molecules 24. doi: 10.3390/molecules24173081
Cichy, K. A., Porch, T. G., Beaver, J. S., Cregan, P., Fourie, D., Glahn, R. P., et al. (2015). A Phaseolus vulgaris diversity panel for Andean bean improvement. Crop Sci. 55, 2149–2160. doi: 10.2135/cropsci2014.09.0653
Delgado-García, E., Piedras, P., Gómez-Baena, G., García-Magdaleno, I. M., Pineda, M., Gálvez-Valdivieso, G. (2021). Nucleoside metabolism is induced in common bean during early seedling development. Front. Plant Sci. 12. doi: 10.3389/fpls.2021.651015
Evanno, G., Regnaut, S., Goudet, J. (2005). Detecting the number of clusters of individuals using the software STRUCTURE: a simulation study. Mol. Ecol. 14, 2611–2620. doi: 10.1111/j.1365-294X.2005.02553.x
Foucher, J., Ruh, M., Préveaux, A., Carrère, S., Pelletier, S., Briand, M., et al. (2020). Common bean resistance to Xanthomonas is associated with upregulation of the salicylic acid pathway and downregulation of photosynthesis. BMC Genomics 21, 1–18. doi: 10.1186/s12864-020-07043-6
Francis, R. M. (2017). pophelper: an R package and web app to analyze and visualize population structure. Mol. Ecol. Resour. 17, 27–32. doi: 10.1111/1755-0998.12509
Galeou, A., Stefanatou, C., Prombona, A. (2023). Circadian clock-dependent and -independent response of Phaseolus vulgaris to Pseudomonas syringae. Physiol. Mol. Plant Pathol. 124, 101944. doi: 10.1016/j.pmpp.2022.101944
Gilbertson, R. L., Maxwell, D. P., Chaube, H. S., Kumar, J., Mukhopadhyay, A. N., Singh, U. S. (1992). Common bacterial blight of bean. Available online at: http://www.cabdirect.org/abstracts/19932328355.html (Accessed November 11, 2013).
González, A. M., Yuste-Lisbona, F. J., Saburido, S., Bretones, S., de Ron, A. M., Lozano, R., et al. (2016). Major contribution of flowering time and vegetative growth to plant production in common bean as deduced from a comparative genetic mapping. Front. Plant Sci. 7. doi: 10.3389/fpls.2016.01940
Gu, Z., Gu, L., Eils, R., Schlesner, M., Brors, B. (2014). Circlize implements and enhances circular visualization in R. Bioinformatics 19, 2811–2812. doi: 10.1093/bioinformatics/btu393
Hirano, S. S., Rouse, D. I., Upper, C. D. (1987). Bacterial ice nucleation as a predictor of bacterial brown spot disease on snap beans. Phytopathology 77, 1078–1084. doi: 10.1094/Phyto-77-1078
Hwang, I. S., Hwang, B. K. (2010). Role of the pepper cytochrome P450 gene cacyp450a in defense responses against microbial pathogens. Planta 232, 1409–1421. doi: 10.1007/s00425-010-1266-y
Jakobsson, M., Rosenberg, N. A. (2007). CLUMPP: a cluster matching and permutation program for dealing with label switching and multimodality in analysis of population structure. Bioinformatics 23, 1801–1806. doi: 10.1093/bioinformatics/btm233
Joshi, N. A., Fass, J. N. (2011). sickle: A sliding-window, adaptive, quality-based trimming tool for FastQ files (Version 1.33). Available online at: https://github.com/najoshi/sickle. (Accessed May 18, 2022).
Jung, G., Ariyarathne, H. M., Coyne, D. P., Nienhuis, J. (2003). Mapping QTL for bacterial brown spot resistance under natural infection in field and seedling stem inoculation in growth chamber in common bean. Crop Sci. 43, 350e357. doi: 10.2135/cropsci2003.3500
Keller, B., Ariza-Suarez, D., Portilla-Benavides, A. E., Buendía, H. F., Aparicio, J. S., Amongi, W., et al. (2022). Improving association studies and genomic predictions for climbing beans with data from bush bean populations. Front. Plant Sci. 13. doi: 10.3389/fpls.2022.830896
Koenig, R., Singh, S. P., Gepts, P. (1990). Novel phaseolin types in wild and cultivated common bean (Phaseolus vulgaris, Fabaceae). Econ. Bot. 44, 50–60. doi: 10.1007/BF02861066
Kourelis, J., van der Hoorn, R. A. L. (2018). Defended to the nines: 25 years of resistance gene cloning identifies nine mechanisms for R protein function. Plant Cell 30, 285–299. doi: 10.1105/tpc.17.00579
Kraiselburd, I., Daurelio, L. D., Tondo, M. L., Merelo, P., Cortadi, A. A., Talón, M., et al. (2013). The LOV protein of Xanthomonas citri subsp. citri plays a significant role in the counteraction of plant immune responses during citrus canker. PLoS One 8. doi: 10.1371/journal.pone.0080930
Kwak, M., Velasco, D., Gepts, P. (2008). Mapping homologous sequences for determinacy and photoperiod sensitivity in common bean (Phaseolus vulgaris). J. Hered 99, 283–291. Available at: http://www.ncbi.nlm.nih.gov/pubmed/18316323.
Li, H. (2013). Aligning sequence reads, clone sequences and assembly contigs with BWA-MEM. Available online at: http://arxiv.org/abs/1303.3997. (Accessed May 18, 2022).
Li, H., Handsaker, B., Wysoker, A., Fennell, T., Ruan, J., Homer, N., et al. (2009). The sequence alignment/map format and SAMtools. Bioinformatics 25, 2078–2079. doi: 10.1093/bioinformatics/btp352
Li, S., Shi, T., Lyu, M., Wang, R., Xu, A., Chen, L., et al. (2023). Transcriptomic analysis revealed key defense genes and signaling pathways mediated by the Arabidopsis thaliana gene SAD2 in response to infection with Pseudomonas syringae pv. tomato DC3000. Int. J. Mol. Sci. 24. doi: 10.3390/ijms24044229
Li, W., Chiang, Y. H., Coaker, G. (2013). The HopQ1 effector’s nucleoside hydrolase-like domain is required for bacterial virulence in Arabidopsis and tomato, but not host recognition in tobacco. PLoS One 8. doi: 10.1371/journal.pone.0059684
Lobaton, J. D., Miller, T., Gil, J., Ariza, D., de la Hoz, J. F., Soler-Garzón, A., et al. (2018). Resequencing of common bean identifies regions of inter-gene pool introgression and provides comprehensive resources for molecular breeding. Plant Genome 11, 170068. doi: 10.3835/plantgenome2017.08.0068
Miklas, P. N., Coyne, D. P., Grafton, K. F., Mutlu, N., Reiser, J., Lindgren, D. T., et al. (2003). A major QTL for common bacterial blight resistance derives from the common bean great northern landrace cultivar Montana No.5. Euphytica 131, 137–146. doi: 10.1023/A:1023064814531
Miklas, P. N., Fourie, D., Trapp, J., Davis, J., Myers, J. R. (2014). New loci including Pse-6 conferring resistance to halo bacterial blight on chromosome Pv04 in common bean. Crop Sci. 54, 2099–2108. doi: 10.2135/cropsci2014.03.0213
Miklas, P. N., Johnson, E., Stone, V., Beaver, J. S., Montoya, C., Zapata, M. (1996). Selective mapping of QTL conditioning disease resistance in common bean. Crop Sci. 36, 1344–1351. doi: 10.2135/cropsci1996.0011183X003600050044x
Miklas, P. N., Smith, J. R., Singh, S. P. (2006a). Registration of common bacterial blight resistant dark red kidney bean germplasm line USDK-CBB-15. Crop Sci. 46, 1005–1007. doi: 10.2135/cropsci2005.06-0110
Miklas, P. N., Smith, J. R., Singh, S. P. (2006b). Registration of common bacterial blight resistant white kidney bean germplasm line USWK-CBB-17. Crop Sci. 46, 2338–2339. doi: 10.2135/cropsci2006.04.0246
Moghaddam, S. M., Mamidi, S., Osorno, J. M., Lee, R., Brick, M., Kelly, J., et al. (2016). Genome-wide association study identifies candidate loci underlying agronomic traits in a middle american diversity panel of common bean. Plant Genome 9, 1–21. doi: 10.3835/plantgenome2016.02.0012
Muedi, H. T. H., Fourie, D., McLaren, N. W. (2015). Distribution and severity of bacterial brown spot on dry beans in South Africa: An update. S. Afr. J. Sci. 111, 1–6. doi: 10.17159/sajs.2015/20140015
Navarro, F., Skroch, P., Jung, G., Nienhuis, J. (2007). Quantitative trait loci associated with bacterial brown spot in Phaseolus vulgaris L. Crop Sci. 47, 1344–1353. doi: 10.2135/cropsci2006.01.0056
Oblessuc, P. R., Bridges, D. F., Melotto, M. (2022). Pseudomonas phaseolicola preferentially modulates genes encoding leucine-rich repeat and malectin domains in the bean landrace G2333. Planta 256, 1–13. doi: 10.1007/s00425-022-03943-x
Patil, I. (2021). Visualizations with statistical details: The 'ggstatsplot' approach. J. Open Source Software 6, 3167. doi: 10.21105/joss.03167
Pedraza, F., Gallego, G., Beebe, S., Tohme, J. (1997). “Marcadores SCAR y RAPD para la resistencia a la bacteriosis común (CBB),” in Taller de Mejoramiento de Frijol para el Siglo XXI: Bases para Una Estrategia para América Latina. Eds. Singh, S. P., Voysest, O. (CIAT, Cali, Colombia), 130–134.
Perry, G., Dinatale, C., Xie, W., Navabi, A., Reinprecht, Y., Crosby, W., et al. (2013). A comparison of the molecular organization of genomic regions associated with resistance to common bacterial blight in two Phaseolus vulgaris genotypes. Front. Plant Sci. 4. doi: 10.3389/fpls.2013.00318
Pogorelko, G. V., Mokryakova, M., Fursova, O. V., Abdeeva, I., Piruzian, E. S., Bruskin, S. A. (2014). Characterization of three Arabidopsis thaliana immunophilin genes involved in the plant defense response against Pseudomonas syringae. Gene 538, 12–22. doi: 10.1016/j.gene.2014.01.029
Pritchard, J. K., Stephens, M., Donnelly, P. (2000). Inference of population structure using multilocus genotype data. Genetics 155, 945–959. Available at: http://www.pubmedcentral.nih.gov/articlerender.fcgi?artid=1461096&tool=pmcentrez&rendertype=abstract.
Purcell, S., Neale, B., Todd-Brown, K., Thomas, L., Ferreira, M. A. R., Bender, D., et al. (2007). PLINK: a tool set for whole-genome association and population-based linkage analyses. Am. J. Hum. Genet. 81, 559–575. doi: 10.1086/519795
R Core Team (2021). R: A Language and Environment for Statistical Computing, Reference Index Version 3.3.0 (Vienna: R Foundation for Statistical Computing). Available at: https://www.R-project.org/.
Repinski, S. L., Kwak, M., Gepts, P. (2012). The common bean growth habit gene PvTFL1y is a functional homolog of Arabidopsis TFL1. Theor. Appl. Genet. 124, 1539–1547. doi: 10.1007/s00122-012-1808-8
Restrepo-Montoya, D., Brueggeman, R., McClean, P. E., Osorno, J. M. (2020). Computational identification of receptor-like kinases “RLK” and receptor-like proteins “RLP” in legumes. BMC Genomics 21. doi: 10.1186/s12864-020-06844-z
Roy, J., Soler-Garzón, A., Miklas, P. N., Lee, R., Clevenger, J., Myers, Z., et al. (2023). Integrating de novo QTL-seq and linkage mapping to identify quantitative trait loci conditioning physiological resistance and avoidance to white mold disease in dry bean. Plant Genome 16, e20380. doi: 10.1002/tpg2.20380
Salegua, V., Melis, R., Fourie, D., Sibiya, J., Musvosvi, C. (2020). Screening Andean diversity panel dry bean lines for resistance to bacterial brown spot disease under field conditions in South Africa. Plant Dis. 104, 2509–2514. doi: 10.1094/PDIS-11-19-2388-RE
Scheet, P., Stephens, M., Scheet, M. P. (2006).A fast and flexible statistical model for large-scale population genotype data: applications to inferring missing genotypes and haplotypic phase. Available online at: www.ajhg.org. (Accessed May 18, 2022).
Schmutz, J., McClean, P. E., Mamidi, S., Wu, G. A., Cannon, S. B., Grimwood, J., et al. (2014). A reference genome for common bean and genome-wide analysis of dual domestications. Nat. Genet. 46, 707–713. doi: 10.1038/ng.3008
Schröder, S., Mamidi, S., Lee, R., McKain, M. R., McClean, P. E., et al. (2016). Optimization of genotyping by sequencing (GBS) data in common bean (Phaseolus vulgaris L.). Mol. Breed. 6, 1–9. doi: 10.1007/s11032-015-0431-1
Simons, K. J., Oladzad, A., Lamppa, R., Maniruzzaman, R., McClean, P. E., Osorno, J. M., et al. (2021). Using breeding populations with a dual purpose: cultivar development and gene mapping—a case study using resistance to common bacterial blight in dry bean (Phaseolus vulgaris L.). Front. Plant Sci. 12. doi: 10.3389/fpls.2021.621097
Singh, S. P., Miklas, P. N. (2015). Breeding common bean for resistance to common blight: A review. Crop Sci. 55, 971–984. doi: 10.2135/cropsci2014.07.0502
Singh, S. P., Muñoz, C. G. (1999). Resistance to common bacterial blight among Phaseolus species and common bean improvement. Crop Sci. 39, 80–89. doi: 10.2135/cropsci1999.0011183X003900010013x
Singh, S. P., Muñoz, C. G., Terán, H. (2001). Registration of common bacterial blight resistant dry bean germplasm VAX 1, VAX 3, and VAX 4. Crop Sci. 41, 275–276. doi: 10.2135/cropsci2001.411275x
Singh, S. P., Schwartz, H. F. (2010). Breeding common bean for resistance to diseases: A review. Crop Sci. 50, 2199–2223. doi: 10.2135/cropsci2009.03.0163
Sun, X., Gilroy, E. M., Chini, A., Nurmberg, P. L., Hein, I., Lacomme, C., et al. (2011). ADS1 encodes a MATE-transporter that negatively regulates plant disease resistance. New Phytol. 192, 471–482. doi: 10.1111/j.1469-8137.2011.03820.x
Tar’an, B., Michaels, T. E., Pauls, K. P. (2001). Mapping genetic factors affecting the reaction to Xanthomonas axonopodis pv. phaseoli in Phaseolus vulgaris L. under field conditions. Genome 44, 1046–1056. doi: 10.1139/g01-099
Taylor, J. D., Teverson, D. M., Allen, D., Pastor-Corrales, M. A. (1996a). Identification and origin of races of Pseudomonas syringae pv. phaseolicola from Africa and other bean growing areas. Plant Pathol. 45, 469–478. doi: 10.1046/j.1365-3059.1996.d01-147.x
Taylor, J. D., Teverson, D. M., Davis, J. H. C. (1996b). Sources of resistance to Pseudomonas syringae pv. phaseolicola races in Phaseolus vulgaris. Plant Pathol. 45, 479–485. doi: 10.1046/j.1365-3059.1996.d01-148.x
Tello, D., Gonzalez-Garcia, L. N., Gomez, J., Zuluaga-Monares, J. C., Garcia, R., Angel, R., et al. (2023). NGSEP 4: Efficient and accurate identification of orthogroups and whole-genome alignment. Mol. Ecol. Resour. 23, 712–724. doi: 10.1111/1755-0998.13737
Tock, A. J., Fourie, D., Walley, P. G., Holub, E. B., Soler-Garzón, A., Cichy, K. A., et al. (2017). Genome-wide linkage and association mapping of halo blight resistance in common bean to race 6 of the globally important bacterial pathogen. Front. Plant Sci. 8. doi: 10.3389/fpls.2017.01170
Trabanco, N., Asensio-Manzanera, M. C., Pérez-Vega, E., Ibeas, A., Campa, A., Ferreira, J. J. (2014). Identification of quantitative trait loci involved in the response of common bean to Pseudomonas syringae pv. phaseolicola. Mol. Breed. 33, 577–588. doi: 10.1007/s11032-013-9974-1
Vandemark, G. J., Fourie, D., Miklas, P. N. (2008). Genotyping with real-time PCR reveals recessive epistasis between independent QTL conferring resistance to common bacterial blight in dry bean. Theor. Appl. Genet. 117, 513–522. doi: 10.1007/s00122-008-0795-2
Van Schoonhoven, A., Pastor-Corrales, M. A. (1987). Standard system for the evaluation of bean germplasm (Cali, Colombia: Centro Internacional de Agricultura Tropical (CIAT).
Viteri, D. M., Terán, H., Asensio-S.-Manzanera, M. C., Asensio, C., Porch, T. G., Miklas, P. N., et al. (2014). Progress in breeding Andean common bean for resistance to common bacterial blight. Crop Sci. 54, 2084–2092. doi: 10.2135/cropsci2014.03.0177
Wang, G., Ellendorff, U., Kemp, B., Mansfield, J. W., Forsyth, A., Mitchell, K., et al. (2008). A genome-wide functional investigation into the roles of receptor-like proteins in Arabidopsis. Plant Physiol. 147, 503–517. doi: 10.1104/pp.108.119487
Wang, S. B., Feng, J. Y., Ren, W. L., Huang, B., Zhou, L., Wen, Y. J., et al. (2016). Improving power and accuracy of genome-wide association studies via a multi-locus mixed linear model methodology. Sci. Rep. 6, 1–10. doi: 10.1038/srep19444
Wang, J., Zhang, Z. (2021). GAPIT version 3: Boosting power and accuracy for genomic association and prediction. Genomics Proteomics Bioinforma. 19, 629–640. doi: 10.1016/j.gpb.2021.08.005
Welsh, M., Grafton, K. (2001). Resistance to common bacterial blight of bean introgressed from Phaseolus coccineus. HortScience. 36 (4), 750–751. Available at: http://hortsci.ashspublications.org/content/36/4/750.short.
Wen, Y. J., Zhang, H., Ni, Y. L., Huang, B., Zhang, J., Feng, J. Y., et al. (2018). Methodological implementation of mixed linear models in multi-locus genome-wide association studies. Brief. Bioinform. 19, 700–712. doi: 10.1093/bib/bbw145
Yaish, M. W. F., Sosa, D., Vences, F. J., Vaquero, F. (2006). Genetic mapping of quantitative resistance to race 5 of Pseudomonas syringae pv. phaseolicola in common bean. Euphytica. 152, 397–404. doi: 10.1007/s10681-006-9227-z
Yang, P., Chang, Y., Wang, L., Wang, S., Wu, J. (2022). Regulatory mechanisms of the resistance to common bacterial blight revealed by transcriptomic analysis in common bean (Phaseolus vulgaris L.). Front. Plant Sci. 12. doi: 10.3389/fpls.2021.800535
Yu, K., Park, S. J., Poysa, V. (2000). Marker-assisted selection of common beans for resistance to common bacterial blight: efficacy and economics. Plant Breed. 119, 411–415. doi: 10.1046/j.1439-0523.2000.00514.x
Yu, K., Shi, C., Zhang, B. (2012). “Development and Application of Molecular Markers to Breed Common Bean (Phaseolus vulgaris L.) for Resistance to Common Bacterial Blight (CBB) – Current Status and Future Directions,” in Applied Photosynthesis Edited. Ed. Najafpour, M. M. (Rijeka: IntechOpen), 365–388. Available at: www.intechopen.com/books/applied-photosynthesis/development-and-application-of-molecular-markers-to-breed-common-bean-phaseolus-vulgaris-l-for-resis.
Yu, Z. H., Stall, R. E., Vallejos, C. E. (1998). Detection of genes for resistance to common bacterial blight of beans. Crop Sci. 38, 1290–1296. doi: 10.2135/cropsci1998.0011183X003800050028x
Zapata, M., Freytag, G. F., Wilkinson, R. E. (1985). Evaluation for bacterial blight resistance in beans. Phytopathology 5, 1032–1039. doi: 10.1094/Phyto-75-1032
Zhang, Y. M., Jia, Z., Dunwell, J. M. (2019). Editorial: The applications of new multi-locus GWAS methodologies in the genetic dissection of complex traits. Front. Plant Sci. 10. doi: 10.3389/fpls.2019.00100
Zhang, Y. W., Tamba, C. L., Wen, Y. J., Li, P., Ren, W. L., Ni, Y. L., et al. (2020). mrMLM v4. 0.2: an R platform for multi-locus genome-wide association studies. Genomics Proteomics Bioinf. 18, 481–487. doi: 10.1016/j.gpb.2020.06.006
Keywords: Phaseolus vulgaris, halo bacterial blight, common bacterial blight, bacterial brown spot, candidate resistance genes, genome-wide association study
Citation: Soler-Garzón A, Mulube M, Kamfwa K, Lungu DM, Hamabwe S, Roy J, Salegua V, Fourie D, Porch TG, McClean PE and Miklas PN (2024) GWAS of resistance to three bacterial diseases in the Andean common bean diversity panel. Front. Plant Sci. 15:1469381. doi: 10.3389/fpls.2024.1469381
Received: 23 July 2024; Accepted: 08 August 2024;
Published: 05 September 2024.
Edited by:
Fernando Juan Yuste-Lisbona, University of Almeria, SpainReviewed by:
Janette Jacobs, Michigan State University, United StatesAinong Shi, University of Arkansas, United States
Copyright © 2024 Soler-Garzón, Mulube, Kamfwa, Lungu, Hamabwe, Roy, Salegua, Fourie, Porch, McClean and Miklas. This is an open-access article distributed under the terms of the Creative Commons Attribution License (CC BY). The use, distribution or reproduction in other forums is permitted, provided the original author(s) and the copyright owner(s) are credited and that the original publication in this journal is cited, in accordance with accepted academic practice. No use, distribution or reproduction is permitted which does not comply with these terms.
*Correspondence: Phillip N. Miklas, cGhpbC5taWtsYXNAdXNkYS5nb3Y=