 Mingming Hou1,2
 Jerome Jeyakumar John Martin2,3
 Yuqiao Song1,2,3Qi Wang2,4Hongxing Cao2,3
 Wenrao Li1*
 Chengxu Sun2*
- 1School of Life Sciences, Henan University, Kaifeng, Henan, China
- 2Coconut Research Institute, Chinese Academy of Tropical Agricultural Sciences, Wenchang, China
- 3National Key Laboratory for Tropical Crop Breeding, Chinese Academy of Tropical Agricultural Sciences, Haikou, China
- 4College of Wine and Horticulture, Ningxia University, Yinchuan, Ningxia Hui Autonomous Region, China
Coconut meat and coconut water have garnered significant attention for their richness in healthful flavonoids. However, the dynamics of flavonoid metabolites in coconut water during different developmental stages remain poorly understood. This study employed the metabolomics approach using liquid chromatography-tandem mass spectrometry (LC-MS/MS) to investigate the changes in flavonoid metabolite profiles in coconut water from two varieties, ‘Wenye No.5’(W5) and Hainan local coconut (CK), across six developmental stages. The results showed that a total of 123 flavonoid metabolites including chalcones, dihydroflavonoids, dihydroflavonols, flavonoids, flavonols, flavonoid carboglycosides, and flavanols were identified in the coconut water as compared to the control. The total flavonoid content in both types of coconut water exhibited a decreasing trend with developmental progression, but the total flavonoid content in CK was significantly higher than that in W5. The number of flavonoid metabolites that differed significantly between the W5 and CK groups at different developmental stages were 74, 74, 60, 92, 40 and 54, respectively. KEGG pathway analysis revealed 38 differential metabolites involved in key pathways for flavonoid biosynthesis and secondary metabolite biosynthesis. This study provides new insights into the dynamics of flavonoid metabolites in coconut water and highlights the potential for selecting and breeding high-quality coconuts with enhanced flavonoid content. The findings have implications for the development of coconut-based products with improved nutritional and functional properties.
1 Introduction
Coconut is an important tropical cash crop known for its nutrient-rich meat and water. Coconut water in particular, is a popular natural beverage packed with essential nutrients (Pummer et al., 2001). Coconut water is reported to contain 5-9% total soluble solids (TSS), with over 80% being soluble sugars like glucose, sucrose and fructose (Mahayothee et al., 2016). Additionally, coconut water contains essential components including minerals, amino acids, enzymes, organic acids, fatty acids, vitamins and few phenolic compounds (Kumar et al., 2021). Phenolic compounds are recognized for their bioactive properties, with coconut water containing catechin, salicylic acid, 4-hydroxybenzoic acid, butyric acid, o-coumaric acid, p-coumaric acid, gallic acid and caffeic acid in coconut water (Chang and Wu, 2011; Mahayothee et al., 2016).
Flavonoids as a type of polyphenols widely found in many plants (Kozlowska and Szostak-Wegierek, 2014; Rudrapal and Chetia, 2016), are typically categorized into seven subclasses including, flavonols, flavones, isoflavones, anthocyanins, flavanones, flavanols, and chalcones (Wang et al., 2022). Research has demonstrated that flavonoids are prevalent in plants and play a crucial role in plant growth, reproduction and protection (Tang et al., 2014; Tian et al., 2014; Deng et al., 2019). Flavonoids serve as major pigments in plants and function as antitoxins or antioxidants, protecting plants from biotic and abiotic stress (Cavaiuolo et al., 2013; Iwashina, 2003; Zhang et al., 2020; Pourcel et al., 2007). In the fields of medicine and health, plant-derived flavonoids, as a bioactive compound, have been found to exhibit a broad spectrum of pharmacological effects, including neurological relief, anti-inflammatory, antioxidant, hepatoprotective (Leyva-López et al., 2016; Liu et al., 2017; Al-Khayri et al., 2022; Shen et al., 2022). Furthermore, flavonoids have been shown to help prevent osteoporosis, cancer, and reduces the risk of cardiovascular disease (Imran et al., 2019; Wang et al., 2017; Fernandes et al., 2017; Liu et al., 2021), ultimately having a profound impact on promoting human health and well-being (Tungmunnithum et al., 2018; Batiha et al., 2020; Kumar et al., 2017).
Metabolomics as a key histological technology that focuses on the precise qualitative and quantitative analysis of metabolites, and subsequently performs an in-depth analysis of metabolic pathways and network structures, providing a solid scientific foundation for revealing the metabolic mechanisms underlying the macroscopic phenotypes of different organisms (Fiehn, 2002). In particular, the integration of liquid chromatography-tandem mass spectrometry (LC-MS/MS) technology with chemoinformatics methods has significantly enhanced the ability to screen the diversity of complex metabolites, such as flavonoids, in a high-throughput manner (Akimoto et al., 2017; Tsugawa et al., 2016, 2019).
Coconut water, a natural beverage, that is rich in compounds, but there is a scarcity of reports on flavonoids. The change trend and metabolic mechanism of flavonoids in coconut water at different developmental stages are still unclear. To address this, we employed a combination of LC-MS/MS technique and metabolomics to conduct an in-depth study of flavonoid metabolites in coconut water at different developmental stages of the fruits of two coconut varieties. The aim of this study was to elucidate the characteristics of changes in flavonoid metabolites during the developmental stages of different coconuts and their roles during the ripening process of coconut fruits. The findings on flavonoid synthesis can offer insights into improving coconut quality. Understanding how flavonoids are synthesized in different coconut varieties can provide a scientific basis for enhancing their quality and nutritional value. This research may lead to better methods for heterologous synthesis of flavonoids, contributing to both theoretical knowledge and practical applications in coconut variety improvement.
2 Materials and methods
2.1 Experimental materials and treatments
The test materials used in this study were 10-year-old ‘Wenye No.5’ (W5) and 10-year-old local high species of coconut (CK). For each variety, three coconut trees were selected, and 100 mL of coconut water was collected from each fruit at six distinct developmental stages: 2, 4, 6, 8, 10, and 12 months of age. At each stage, three replicate samples of coconut water were collected in parallel. The collected coconut water was immediately flash-frozen in liquid nitrogen and stored at -80°C in a refrigerator for future analysis.
2.2 Determination and analysis of flavonoid metabolites
The combination of chromatography and mass spectrometry facilitates the whole process from separation of substances by chromatography to identification of substances by mass spectrometry. Flavonoids in coconut water can be accurately characterized and quantified using ultra-high performance liquid chromatography-mass spectrometry (UHPLC-MS/MS). The samples were thawed from -80°C refrigerator and rotated for 10 s to mix them thoroughly. The mixed 9 mL sample was placed in a 50 mL centrifuge tube and immersed in liquid nitrogen. After the sample was completely lyophilized, 300 uL of 70% methanol internal standard extraction solution was added and spun for 3 minutes. The mixture was then centrifuged at 12,000 rpm, 4°C for 10 min. The supernatant was filtered through a 0.22 μm microporous filtration membrane and stored in a sample vial for UPLC-MS/MS detection. Metabolite data obtained from mass spectrometry were preprocessed and quality controlled to ensure accurate quantification. Orthogonal partial least squares discriminant analysis (OPLS-DA) and differential multiple integration were used to screen for differential metabolites. The screening thresholds were VIP≥1,Fold_Change≥2 or Fold_Change ≤ 0.5 to identify differential metabolites.
2.3 Chromatography and Mass Spectrometry Acquisition Conditions
The data acquisition instrument system included Ultra Performance Liquid Chromatography (UPLC) (SHIMADZU Nexera X2) and Tandem mass spectrometry (Applied Biosystems 4500 QTRAP).
The liquid phase conditions mainly include:
1. Column: Agilent SB-C18 1.8µm, 2.1mm * 100mm;
2. Mobile phase: phase A is ultra-pure water with 0.1% formic acid; phase B is acetonitrile with 0.1% formic acid.
3. Elution gradient: The proportion of B phase is 5% at 0.00 minutes, increases linearly to 95% within 9.00 minutes, and is maintained at 95% 1 minute. From 10.00-11.10 minutes, the proportion of B phase decreases to 5%, and is balanced at 5% untill14 minutes.
4. Flow rate 0.35 mL/min; Column temperature: 40°C; Sample size: 4 μL.
The mass spectrometry conditions mainly include:
LIT and Triple Quadrupole (QQQ) scanning were performed using the Triple quadrupole linear ion TRAP Mass Spectrometer (QTRAP), AB4500 Q TRAP UPLC/MS/MS system equipped with ESI Turbo ion spray interface. Both positive and negative ion modes were controlled by the Analyst 1.6.3 software (AB Sciex). The ESI source operating parameters are as follows: ion source, turbo spray; Source temperature 550°C; Ion spray voltage (IS) 5500 V (positive ion mode)/-4500 V (negative ion mode); the ion source gas I (GSI), gas II (GSII), and curtain gas (CUR) are set to 50, 60, and 25.0 psi, respectively, and the collision-induced ionization parameter was set to high. The instrument was tuned and calibrated with 10 and 100 μmol/L polypropylene glycol solution in QQQ and LIT modes, respectively. The QQQ scan uses MRM mode with the collision gas (nitrogen) set to medium. Through further DP and CE optimization, the DP and CE of each MRM ion pair were determined. A specific set of MRM ion pairs was monitored during each period based on the metabolites elution times.
2.4 Statistical analysis
The metabolomic data were analyzed using multivariate statistical analysis. Heat maps were generated using the Complex Heatmap package in R software. Differential metabolites were annotated and presented using KEGG database (Kanehisa and Goto, 2000). The experimental data were processed using Excel 2021 software, followed by graphing using origin 2019 and Graphpad Prism8.3.3 softwares. Subsequently, the data were analyzed by ANOVA, correlation analysis and principal component analysis in SPSS 19.0 software.
3 Results and analyses
3.1 Quantitative analysis of total flavonoid content
The results showed (Figure 1) that the total flavonoid content of both coconut varieties exhibited a gradual decline from 2 months to 12 months of age, with the highest content at 2 months of age. In terms of specific values, the total flavonoid content of the CK variety peaked at 325.00 mol/g at 2 months of age and reached a minimum value of 8.46 mol/g at 12 months of age, Similarly, the W5 variety peaked at 231.00 mol/g at 2 months of age and reached a minimum value of 13.6 mol/g at 12 months of age. Notably, the total flavonoid content of the CK variety declined significantly between 8 and 10 months of age, whereas the W5 varieties showed a significant decline between 6 and 8 months of age. Differences between the two breeds were significant for comparisons at 2, 4, 6, and 8 months of age, and non-significant for comparisons at 10 and 12 months of age.
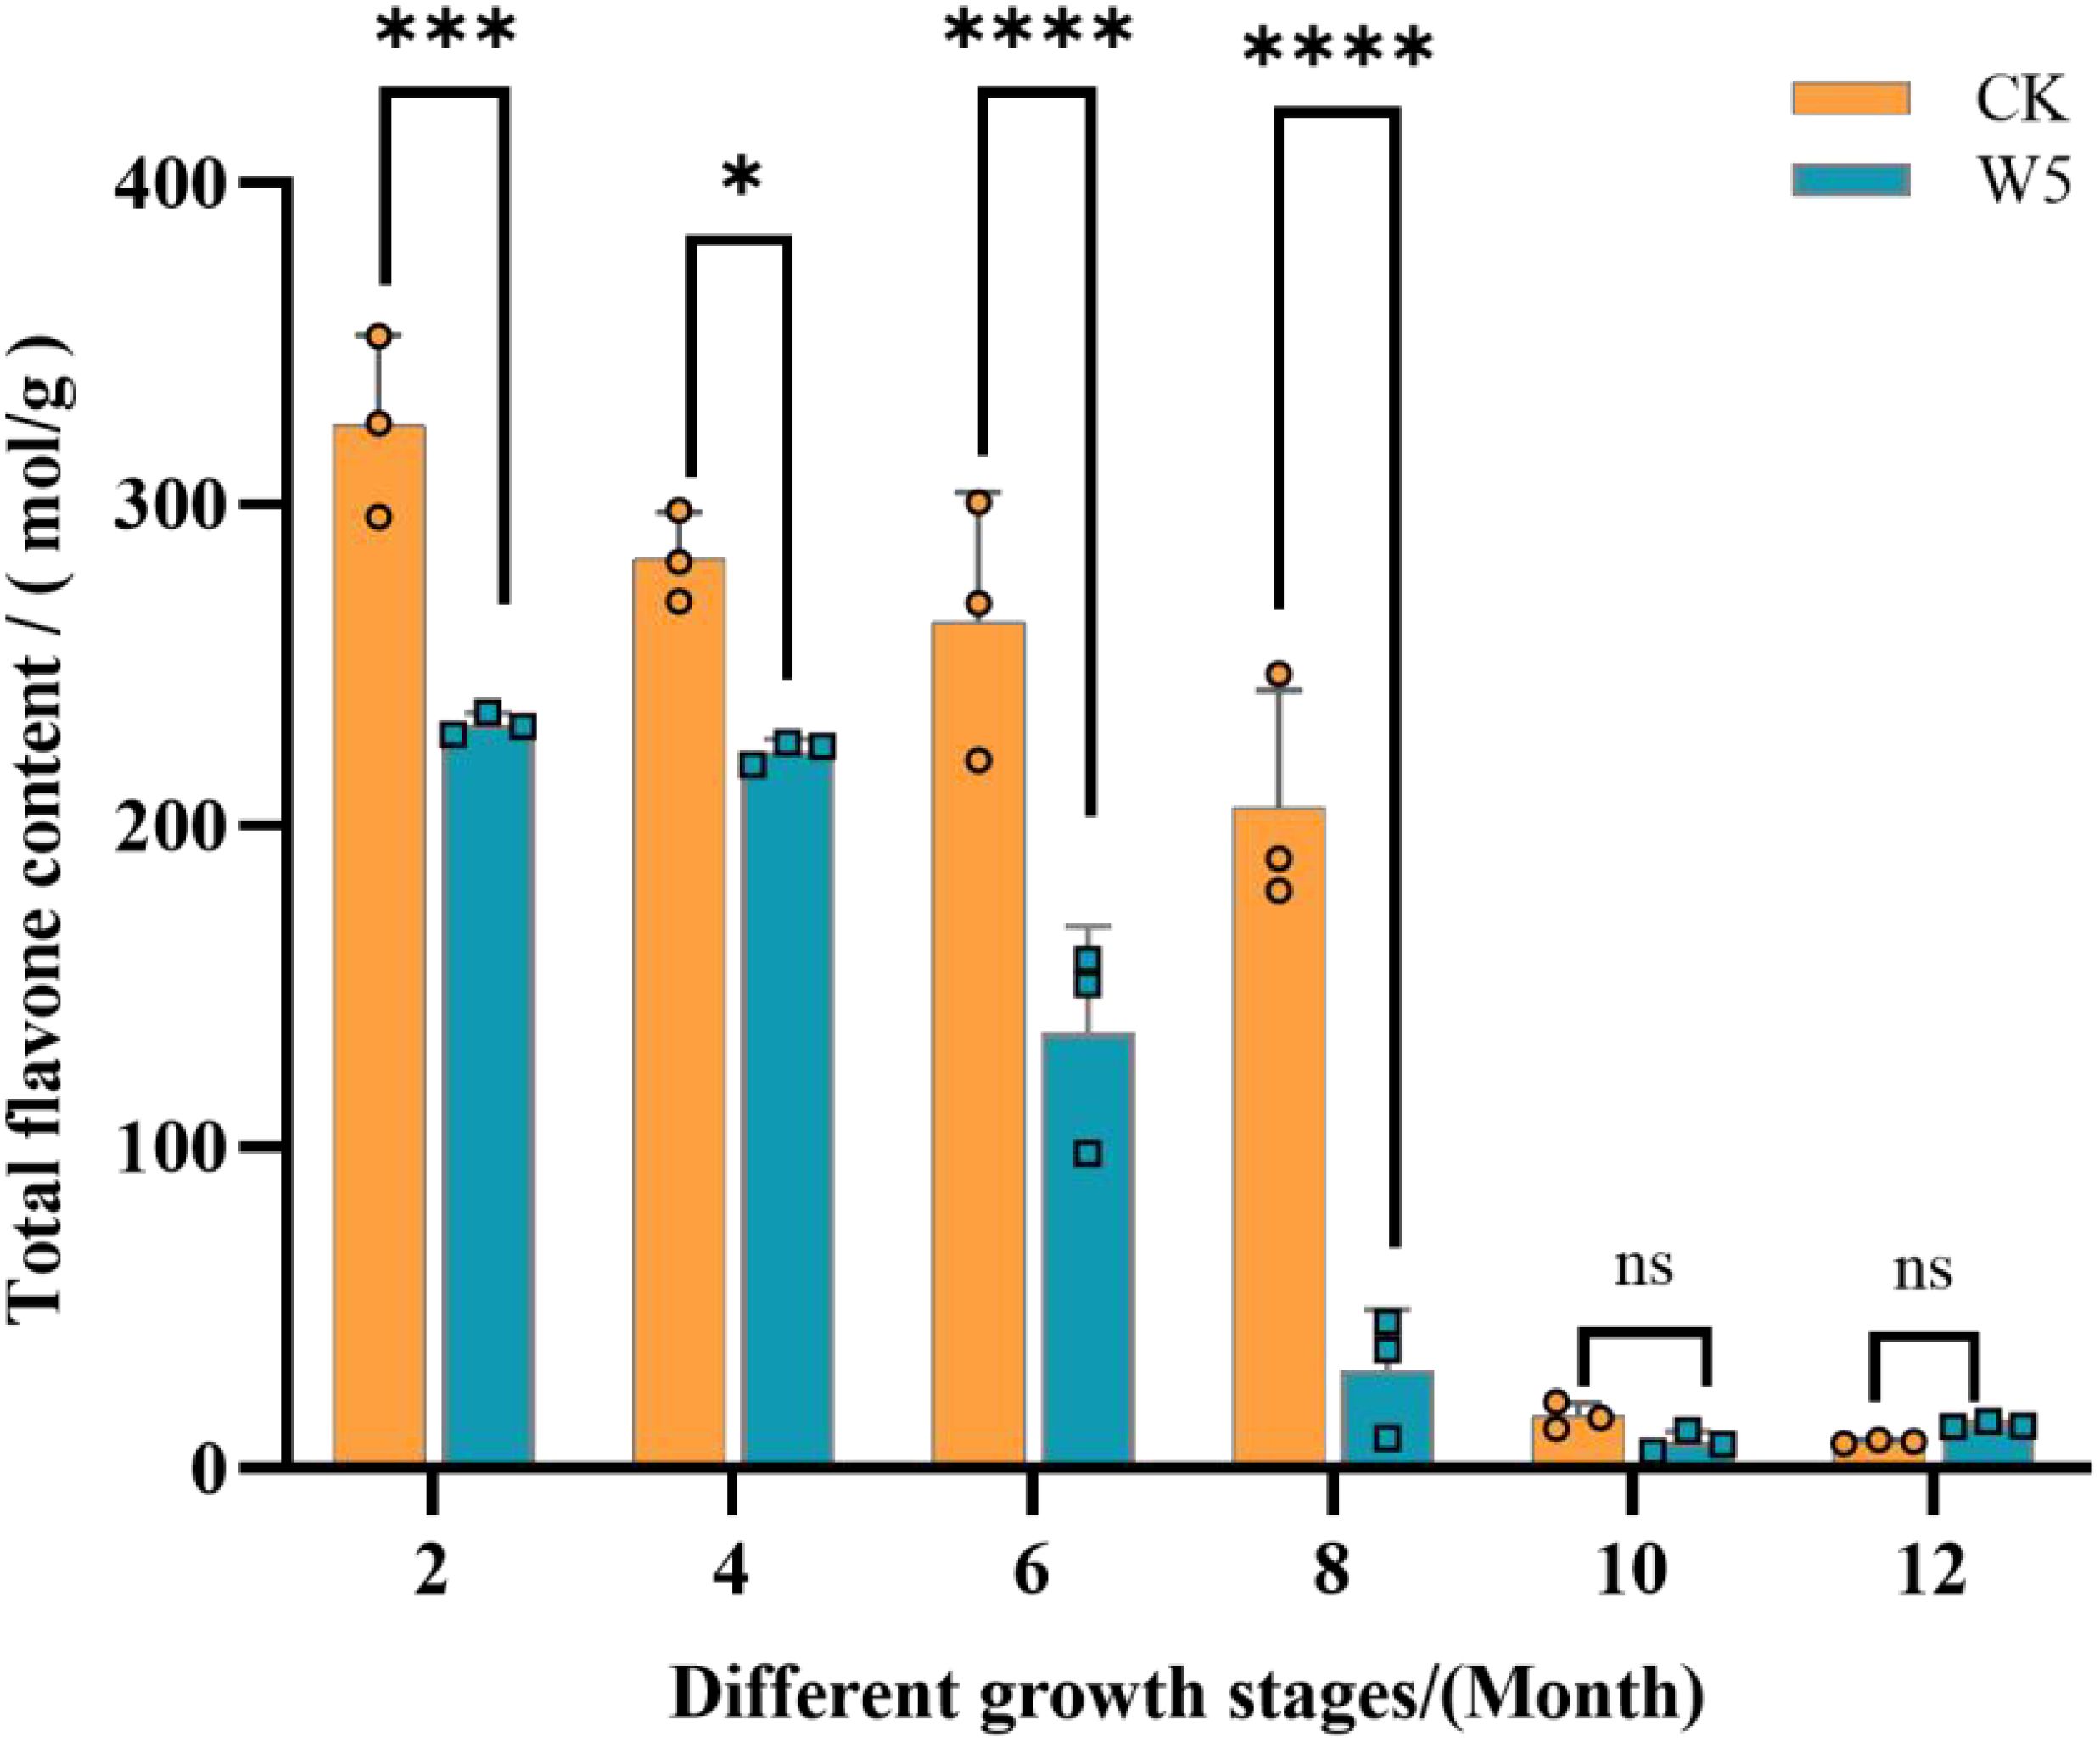
Figure 1. Dynamics of total flavonoid content in different varieties at different fruit ages. The bar chart illustrates the total flavonoid content in two coconut varieties, ‘CK’ denotes local coconut; ‘W5’ denotes ‘Wenye No. 5’; “2, 4, 6, 8, 10, 12” denotes the age of coconut fruits in different months. Error bars indicate the standard deviation of three replicates. Asterisks (*) denote significant differences in flavonoid content (p < 0.05) between the two varieties at the same fruit age. The mean values for asterisked bars are highlighted and annotated where applicable. ‘ns’ above the bar indicates no statistical significance, ****p<0.0001, ***p<0.001, *p<0.05, and ‘ns’ indicates p>0.05.
3.2 Qualitative and quantitative analysis of total metabolites
To gain a deeper understanding of the flavonoid metabolic profiles of two coconut varieties, CK and W5, at different developmental stages, coconut water samples from both varieties were analyzed using LC-MS/MS-based metabolomics. Based on the local metabolic database, the samples were analyzed qualitatively and quantitatively by mass spectrometry, and the multi-reaction detection mode MRM metabolite multi-peak diagrams in the figure demonstrated the metabolites in the samples, and the mass spectrometry peak generations of different colors represented different metabolites, (Supplementary Figures S1, S2), in which the relative contents, integral values, and metabolite names corresponding to the chromatographic peaks of the flavonoid metabolites were shown in Supplementary Table S1. The results showed that a total of 123 flavonoid metabolites were identified, including 18 chalcones, 10 Flavanones, 2 Flavanonols, 33 Flavones, 41 Flavonols,22 Flavonoid carbonoside, and 12 Flavanols. (Supplementary Table S1; Figure 2). Unsupervised PCA analyses (Figure 3A), showed significant differences in metabolite composition between samples from different developmental periods. The PC2 axis revealed similar trends in flavonoid metabolite changes in CK and W5 across different harvesting periods. Furthermore, hierarchical clustering analysis (Figure 3B) revealed a specific clustering pattern of metabolite composition between CK and W5 at different developmental stages, with the highest accumulation of metabolites during the CK2 period and relatively low during the other periods.
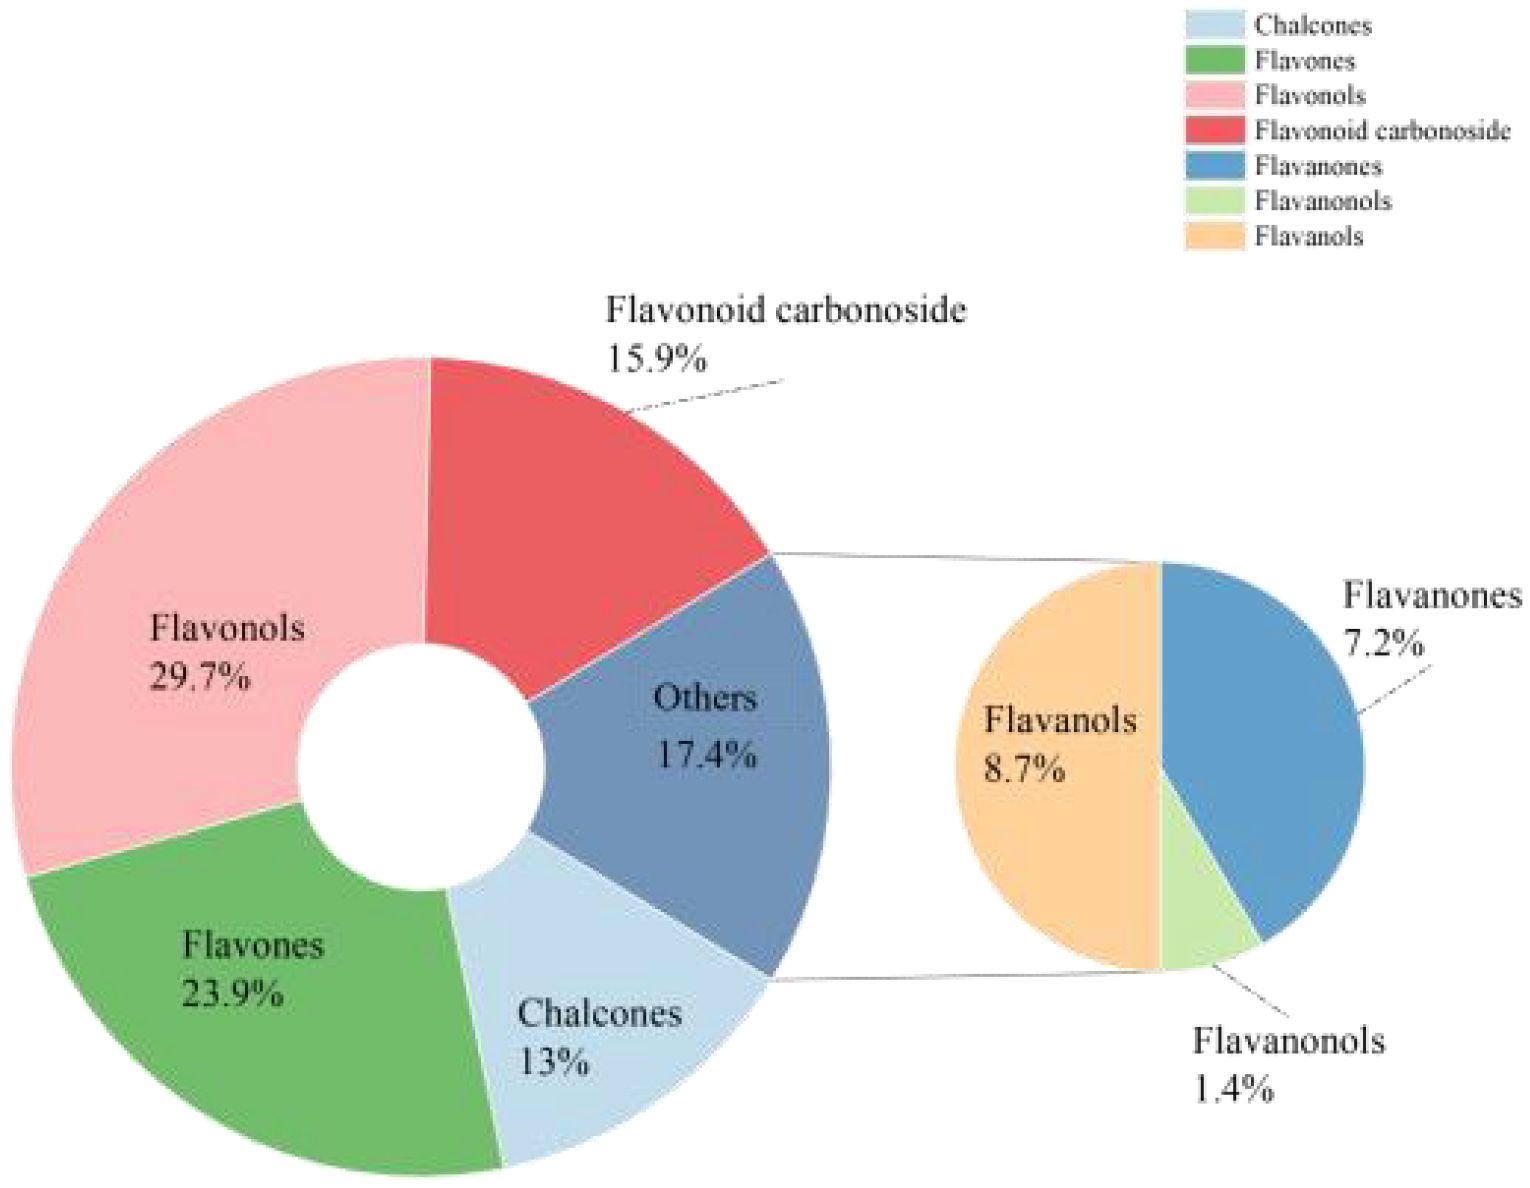
Figure 2. Pie chart showing types of flavonoid metabolites. The pie chart illustrates the distribution of different types of flavonoid metabolites. Each segment represents a specific class of flavonoids, with the size of each segment proportional to its relative abundance in the sample. The chart provides a visual summary of the composition of flavonoid metabolites.
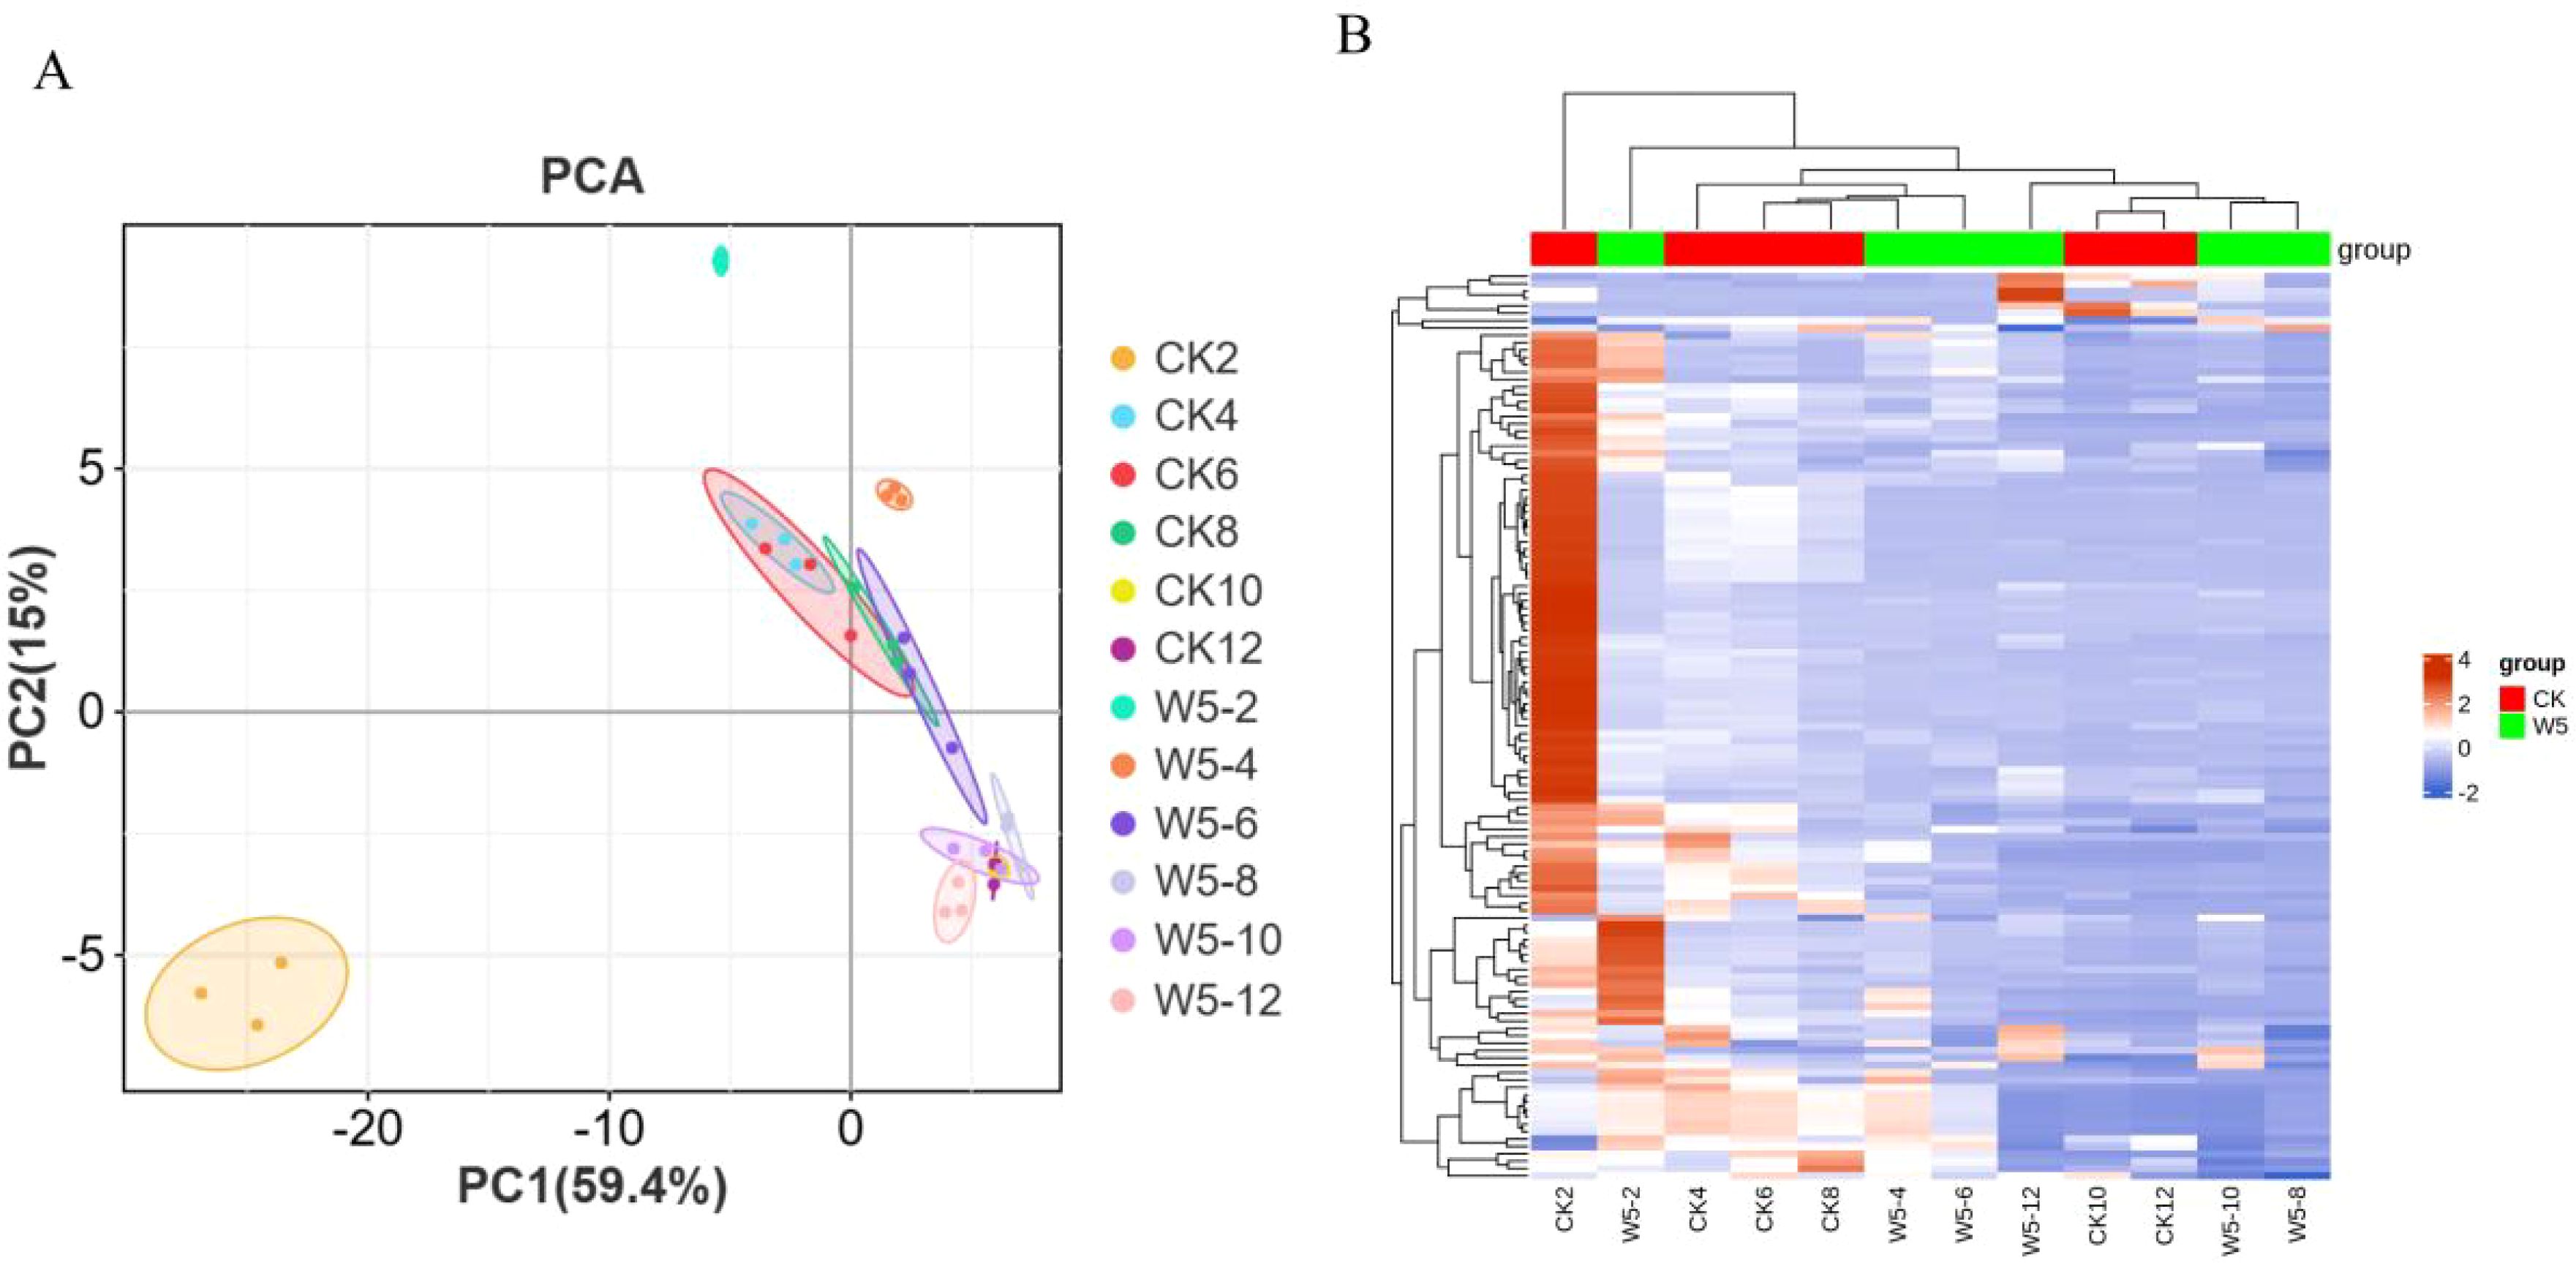
Figure 3. Quantitative and qualitative analysis of total flavonoid metabolites. (A) Principal Component Analysis (PCA) score plot illustrating the distribution of flavonoid metabolites based on their quantitative and qualitative profiles. Each point represents a sample, with the plot visualizing the separation and clustering of metabolites along principal components. (B) Heatmap showing the clustering of metabolites, with each row representing a different metabolite. The color gradient indicates abundance levels: red bars denote high abundance, while green bars indicate low abundance. The color key scale next to the heatmap provides a reference for interpreting the abundance levels.
3.3 Identification and screening of differential metabolites
Based on the criteria of fold-change ≥ 2 or ≤ 0.5 and VIP ≥ 1, we identified differential metabolites in CK and W5 fruits. The results showed that 38 common differential metabolites were identified (Supplementary Table S2), all of which were down-regulated. In CK2vsW5-2, 74 differential metabolites were identified, with 12 up-regulated and 62 down-regulated (Supplementary Table S3; Figures 4A, C). Similarly, in CK4vsW5-4, 74 differential metabolites were identified, with 12 up-regulated and 62 down-regulated (Supplementary Table S4; Figures 4A, D). In CK6vsW5-6 comparison, 60 differential metabolites were identified, with 3 up-regulated and 57 down-regulated (Supplementary Table S5; Figures 4A, E). In CK8vsW5-8, 92 differential metabolites were identified, with only 1 up-regulated and 91 down-regulated (Supplementary Table S6; Figures 4A, F). In CK10vsW5-10 comparison, 40 differential metabolites were identified, with 19 up-regulated and 21 down-regulated (Supplementary Table S7; Figures 4A, G). Finally, in CK12vsW5-12, 54 differential metabolites were found, with 48 up-regulated and 6 down-regulated (Supplementary Table S8; Figures 4A, H).
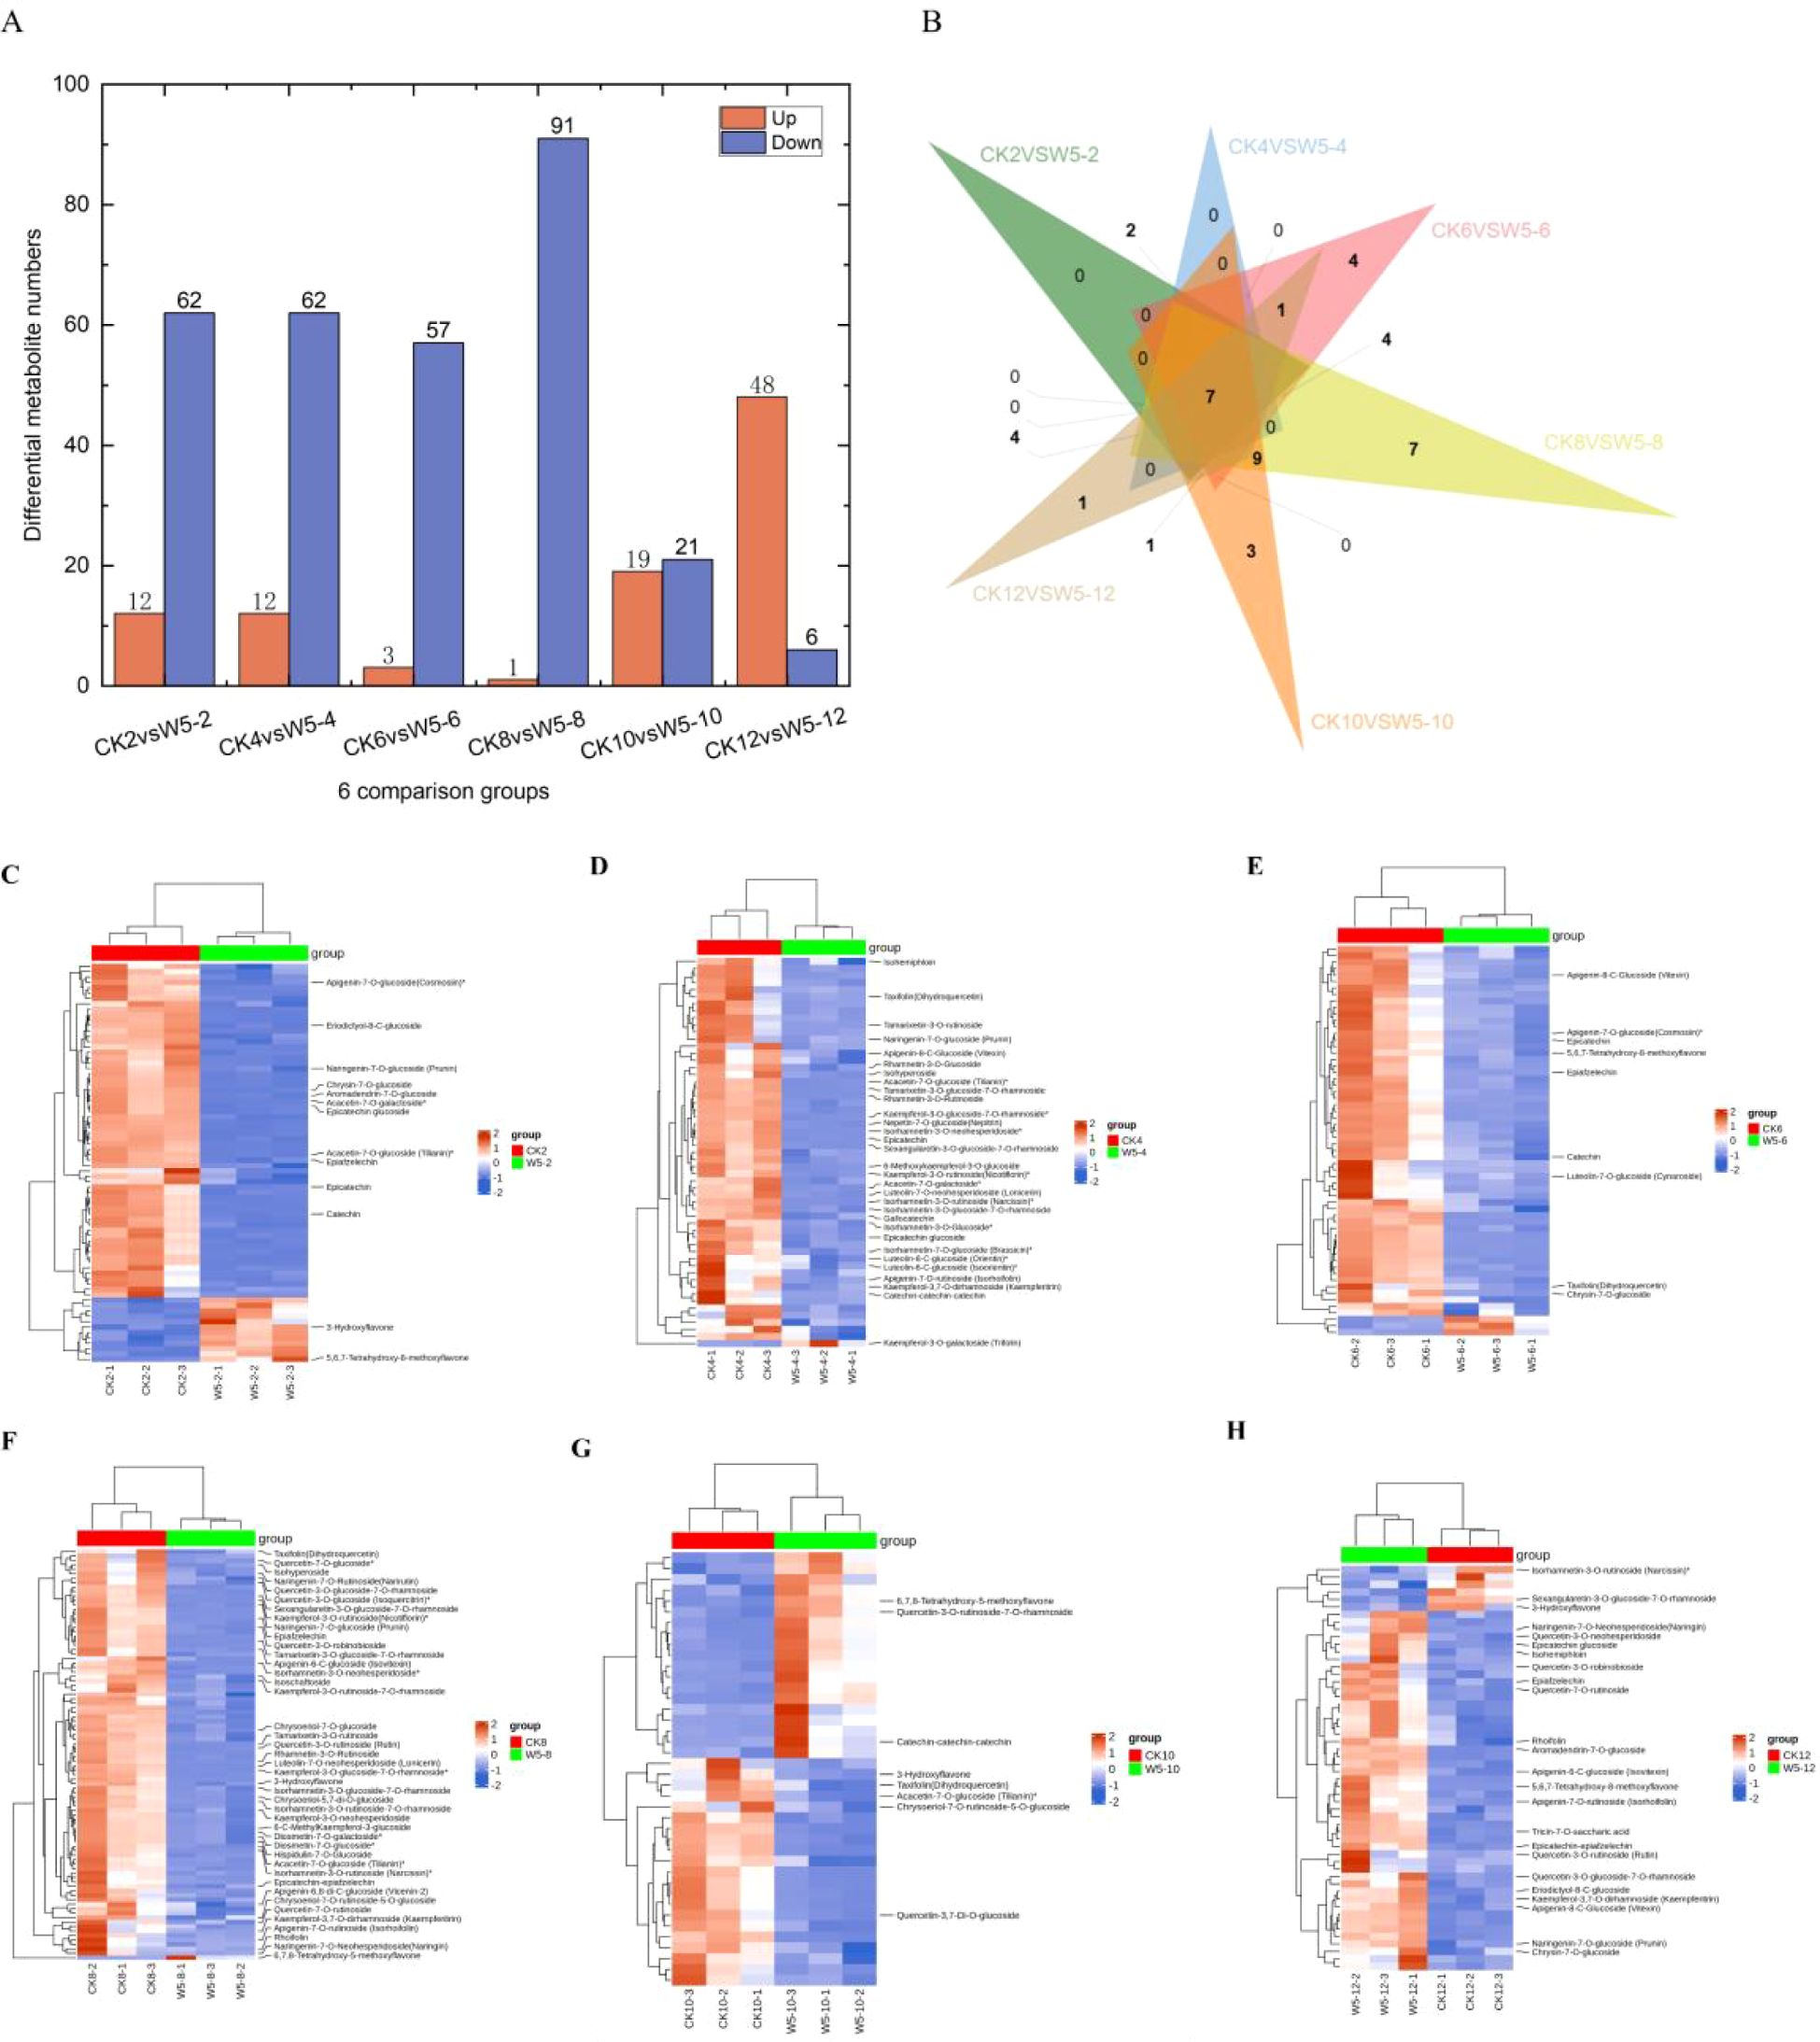
Figure 4. Differential metabolic analysis of two varieties, CK and W5, at different periods of fruit age. (A) Number of upward and downward adjustments in each comparison. (B) Venn of the number of differential metabolites in the six period comparisons. (C–H) denotes metabolite clustering analysis of samples from each period of CKvsW5.
Across all comparison groups, seven common differential metabolites were identified (Figure 4B). These include catechin, epicatechin, Dihydroquercetin, rhamnetin-3-O-glucoside, epicatechin-epiafzelech, apigenin-7-O-rutinoside, and kaempferol-3,7-O-dirhamnoside (Table 1). Additionally, several differential metabolites specific to certain comparison groups were also identified. For instance, in the CK12vsW5-12 comparison, a unique differential metabolite Isohemiphloin was found. In CK10 vs W5-10 comparison, three unique differential metabolites were identified: eupatilin-7-O-glucoside,Vitexin-2’’-O-galactoside, Quercetin-3-O-rutinoside-7-O-rhamnoside. Furthermore, in the CK8 vs W5-8 comparison, seven unique differential metabolites were identified: Luteolin-8-C- arabinoside, Quercetin-4’-O-glucoside (Spiraeoside), Vitexin-2’’-O-rhamnoside, Apigenin-6,8-di-C-glucoside (Vicenin-2). These findings provide important clues for future insights into flavonoid metabolite changes in coconut fruits at different developmental stages.
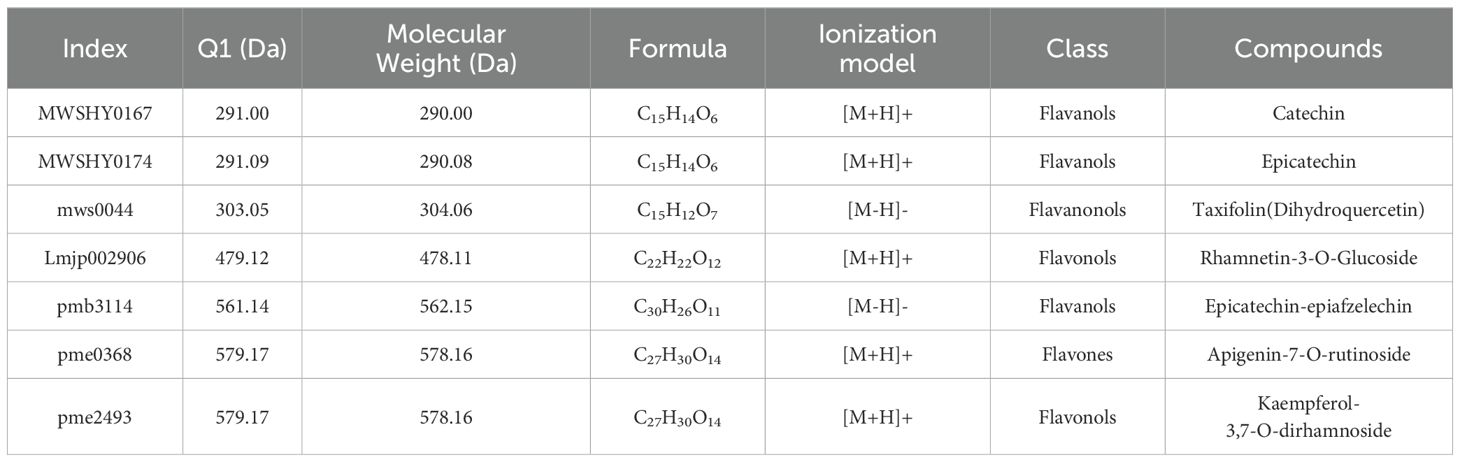
Table 1. Exhaustive information on common differential metabolites for six periods of fruit age in CKvsW5.
3.4 Orthogonal Partial Least Squares Discriminant Analysis of Differential Metabolite Groupings
Initial screening was performed based on VIP values (variable importance in projection) obtained using the OPLS-DA method, with screening criteria set at a fold change ≥2 or ≤0.5 and VIP ≥1. According to the OPLS-DA model (Figures 5A–F), a significant separation was observed between CK2, CK4, CK6, W5-6, CK8, CK10, W5-6, W5-10, and W5-12, whereas the separation between W5-2, W5-4, and W5-8 was insignificant. This suggests that metabolism varied more significantly among varieties at different fruit ages. The 123 differential metabolites were further analyzed, and the results of volcano plot analysis (Figures 6A–F) showed that 74, 60, 92, 40, and 54 differential metabolites were identified for CK2 vs W5-2; CK4 vs W5-4; CK8 vs W5-8; CK6 vs W5-6; CK8 vs W5-8; and CK12 vs W5-12, respectively (Supplementary Table S9), This analysis revealed the up- and down-regulation trends for each comparison, and the number of up- and down-regulated metabolites differed across comparison groups. For instance, in the CK2 vs. W5-2 comparison, 12 differential metabolites were up-regulated and 62 differential metabolites were down-regulated, whereas in the CK12 vs. W5-12 comparison, 48 differential metabolites were up-regulated and 6 differential metabolites were down-regulated.
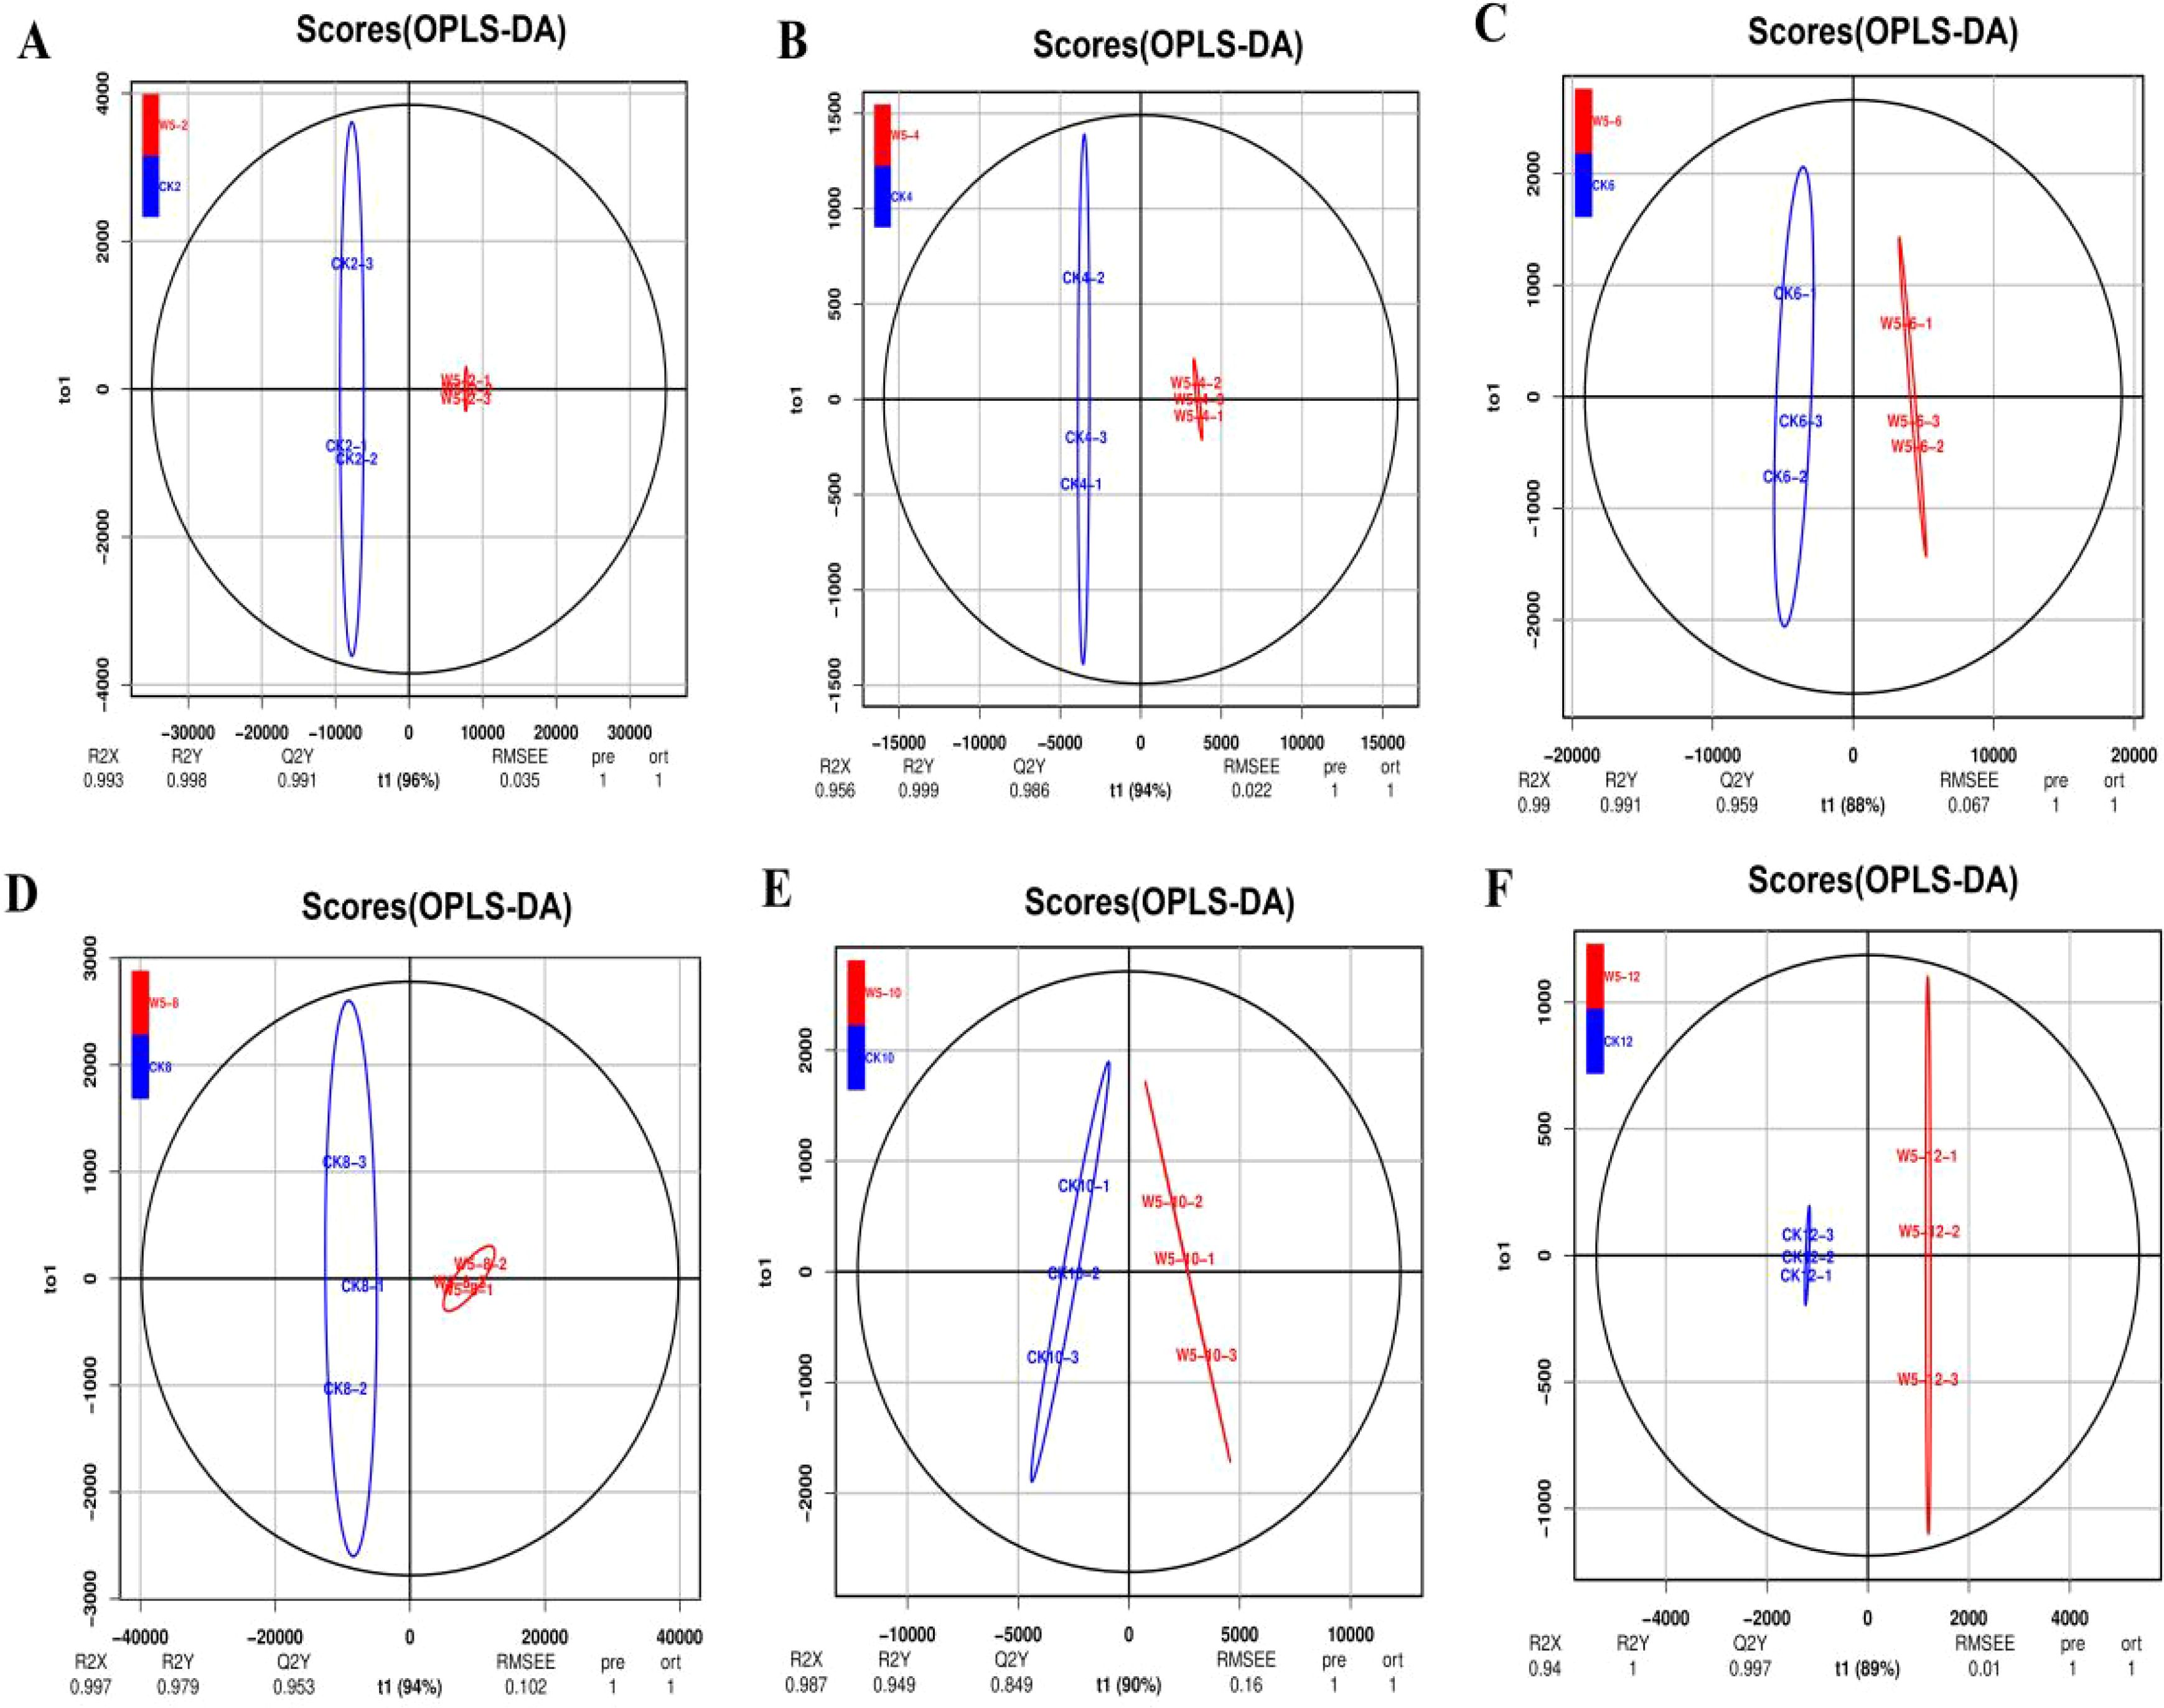
Figure 5. OPLS-DA model plots of differential flavonoid metabolite analysis across different fruit ages. (A-F) Show the OPLS-DA model plots for the following comparisons: (A) CK2 vs. W5-2, (B) CK4 vs. W5-4, (C) CK6 vs. W5-6, (D) CK8 vs. W5-8, (E) CK10 vs. W5-10, (F) CK12 vs. W5-12. The plots display the separation and classification of flavonoid metabolites based on orthogonal signal correction and partial least squares discriminant analysis (OPLS-DA) for various fruit maturation stages.
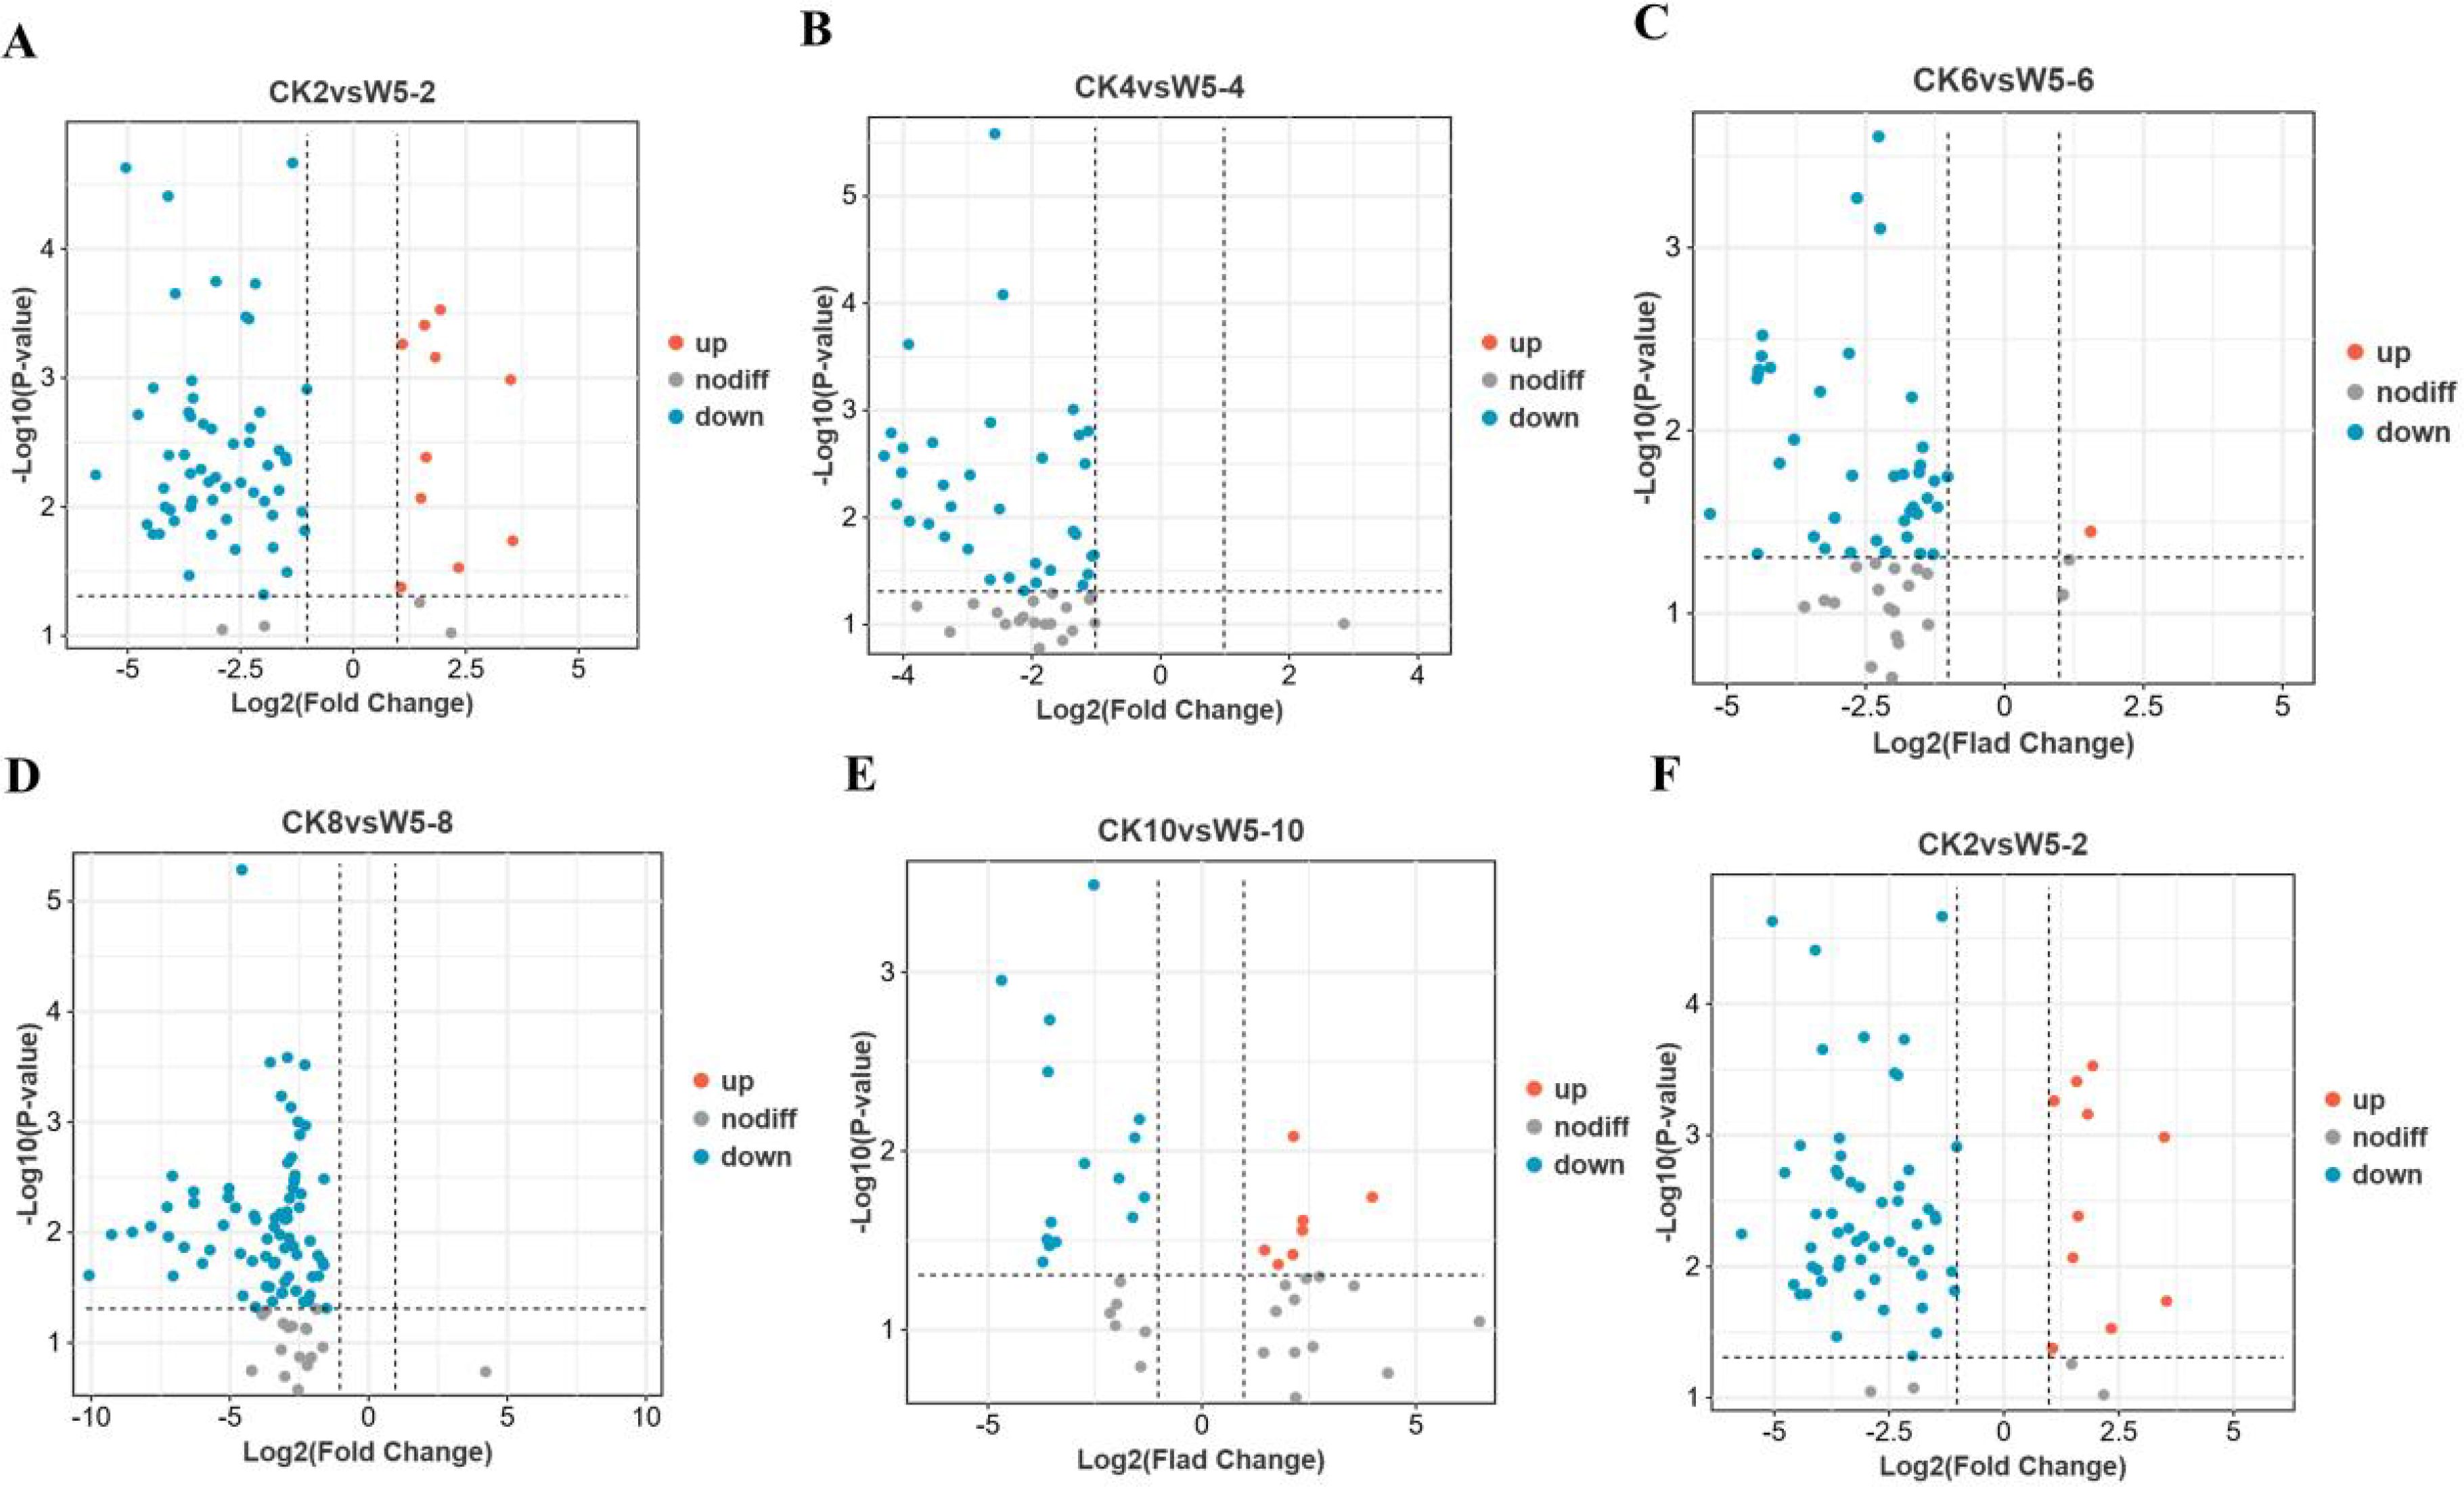
Figure 6. Volcano plots of metabolites differing by fruit age in different coconuts. (A-F) Present volcano plots comparing CK and W5 for various fruit ages. Each point represents a metabolite, with the horizontal axis showing the logarithm of the fold change between the two sample varieties (Log2 fold change) and the vertical axis representing the significance of the variable (VIP). Larger absolute values on the horizontal axis indicate greater significance of the difference. Blue dots denote down-regulated metabolites, red dots represent up-regulated metabolites, and gray dots indicate metabolites with significant changes.
3.5 KEGG functional annotation and enrichment analysis of differentially expressed metabolites
The functional annotation of differentially expressed metabolites and KEGG pathway enrichment analysis are shown in Figures 7A-F. The differentially expressed metabolites were primarily enriched in four metabolic pathways: the metabolic pathway (ko 01100), the flavonoid biosynthesis pathway (ko 00941), the biosynthesis of secondary metabolites pathway (ko 01110), and the biosynthesis pathway of flavonoids and flavonols (ko 00944). In the present study, it was found that during fruit ripening, the flavonoid metabolites remained abundant, although their accumulation level decreased. Differential expressed metabolites were mainly enriched in the biosynthetic pathways of flavonoids and flavonols, which is considered the main pathway for flavonoid synthesis in coconut plants (Figure 8). Further analysis of the 38 differential metabolites annotated to these pathways revealed a diverse range of compounds including chalcones, Flavanones, Flavanonols, Flavones, Flavonols, Flavonoid carbonoside, and Flavanols. (Supplementary Table S2).
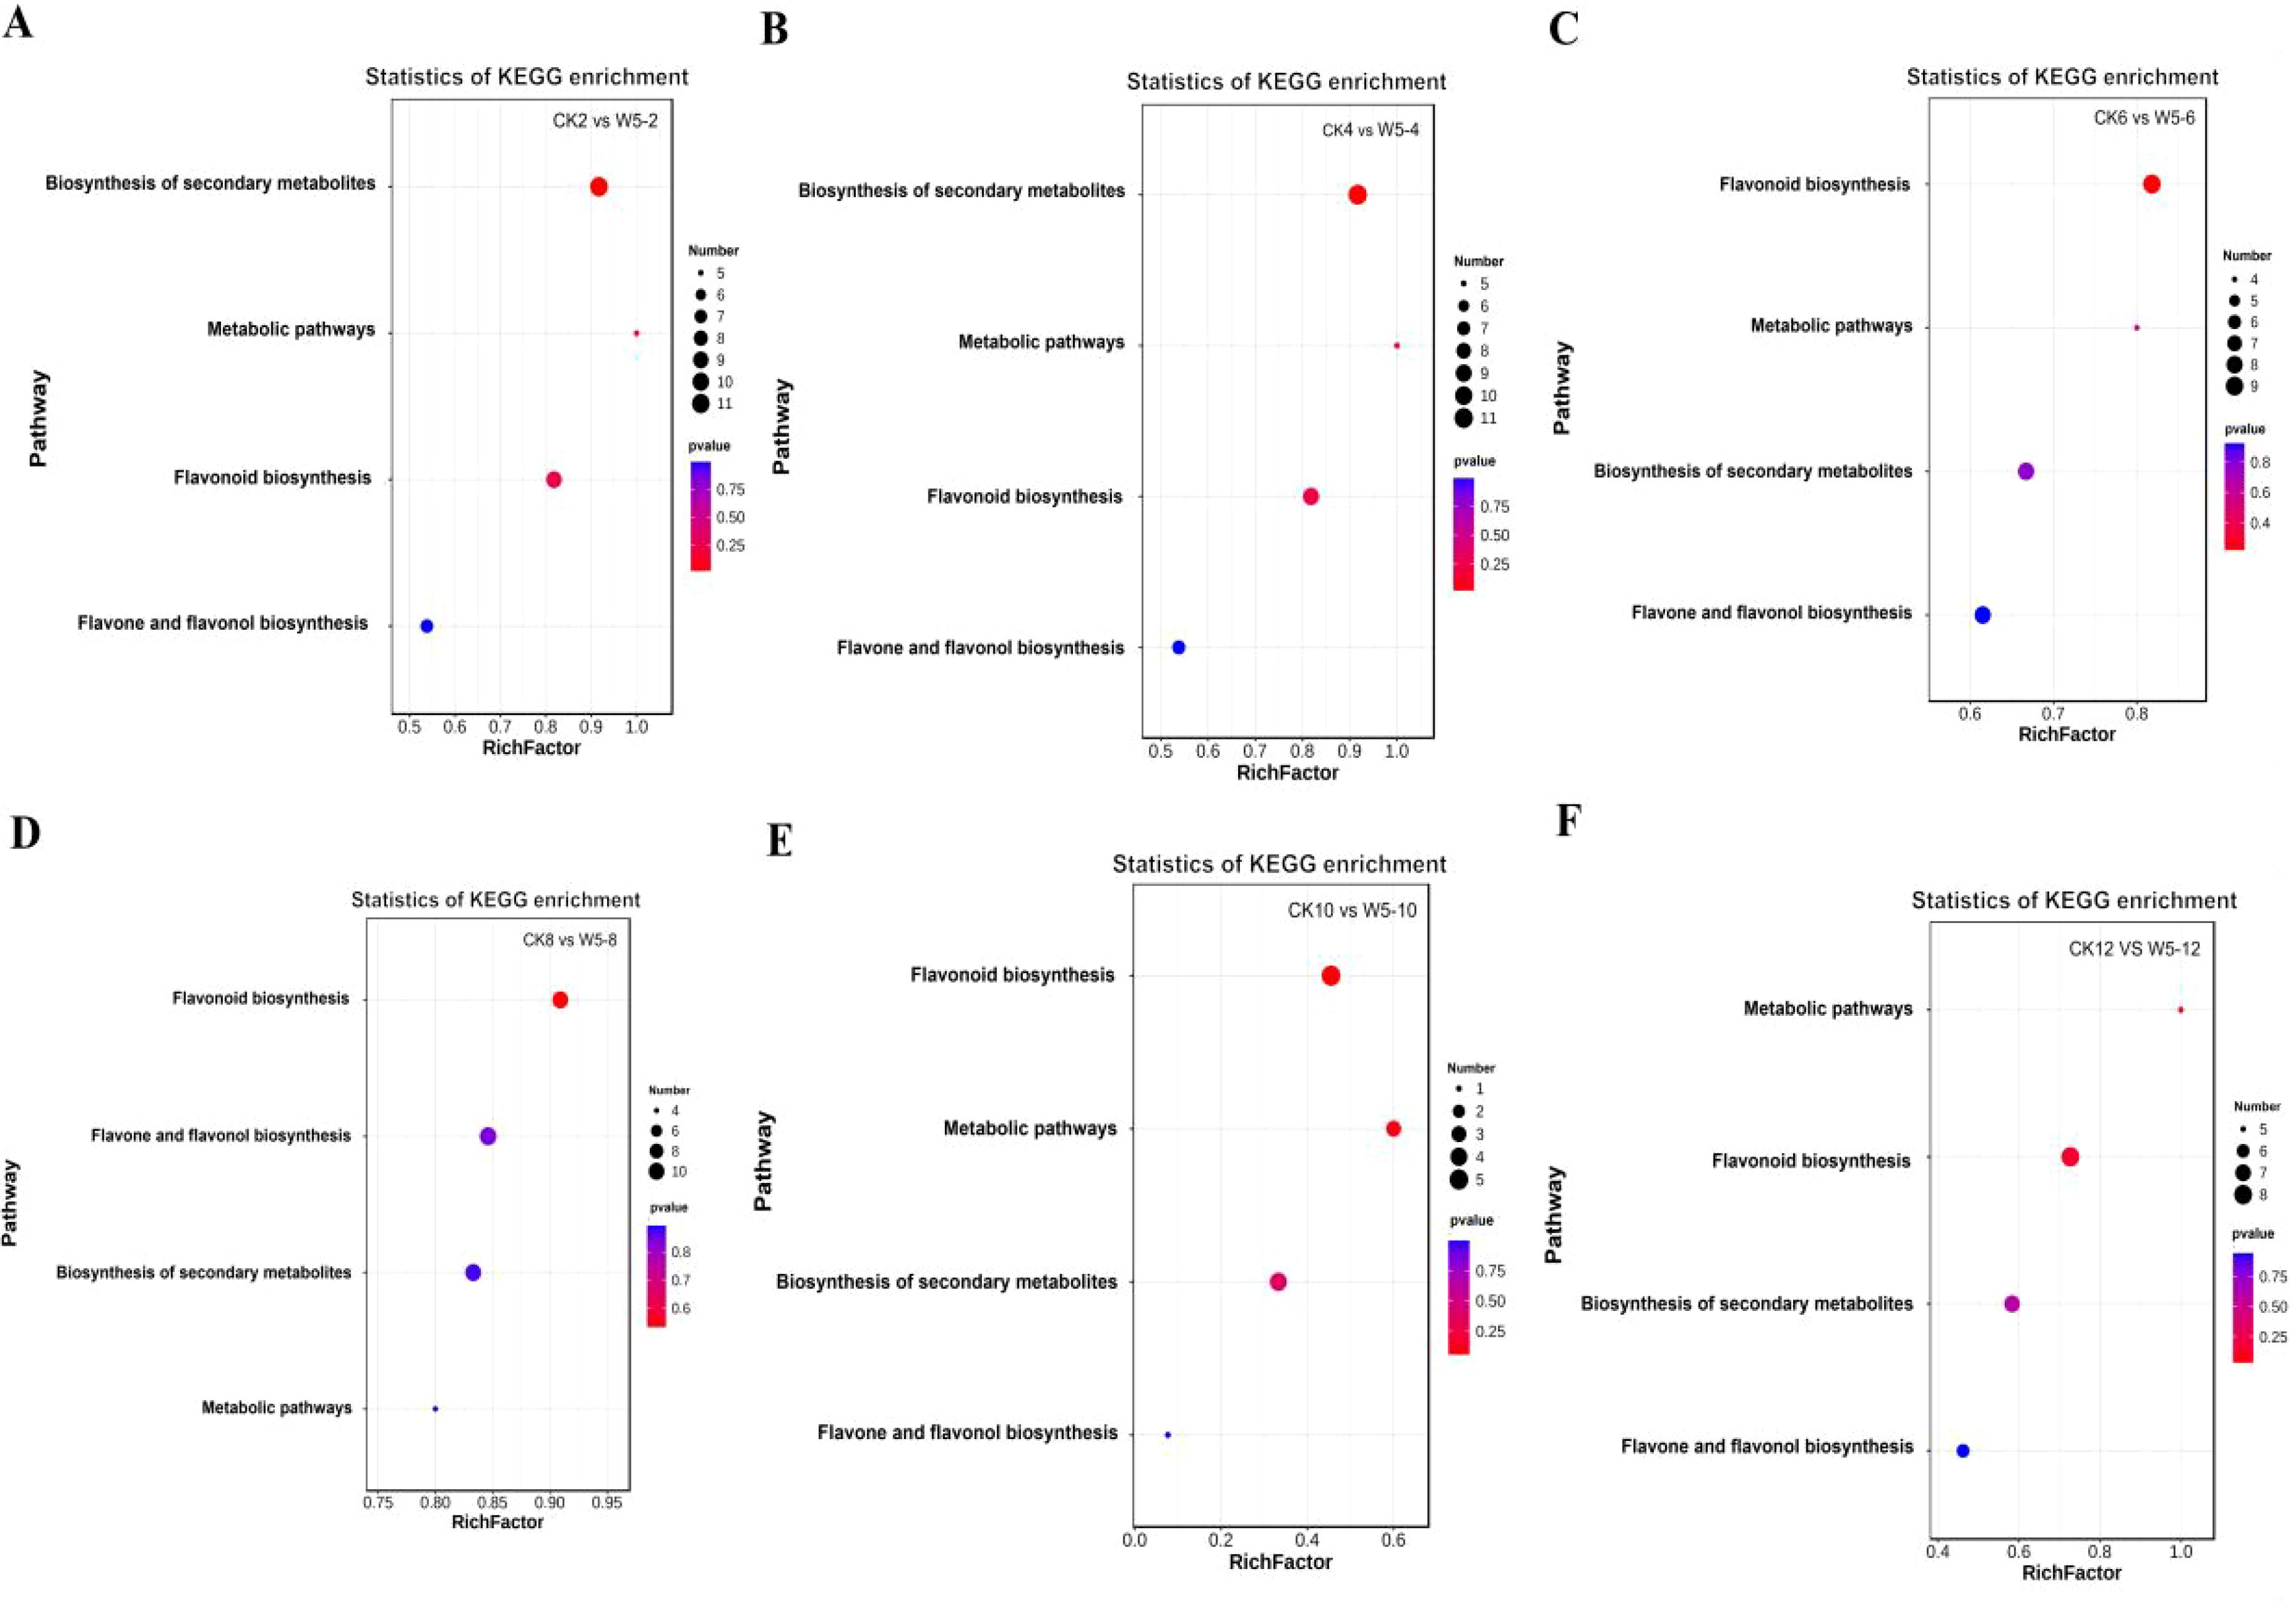
Figure 7. Enrichment analysis of differential flavonoid metabolites in six comparison groups. (A-F) Show the classification of differential metabolites in CK vs. W5 across different comparisons. Bubble size represents the number of metabolites significantly enriched in the pathway, with larger bubbles indicating a greater number of enriched metabolites.
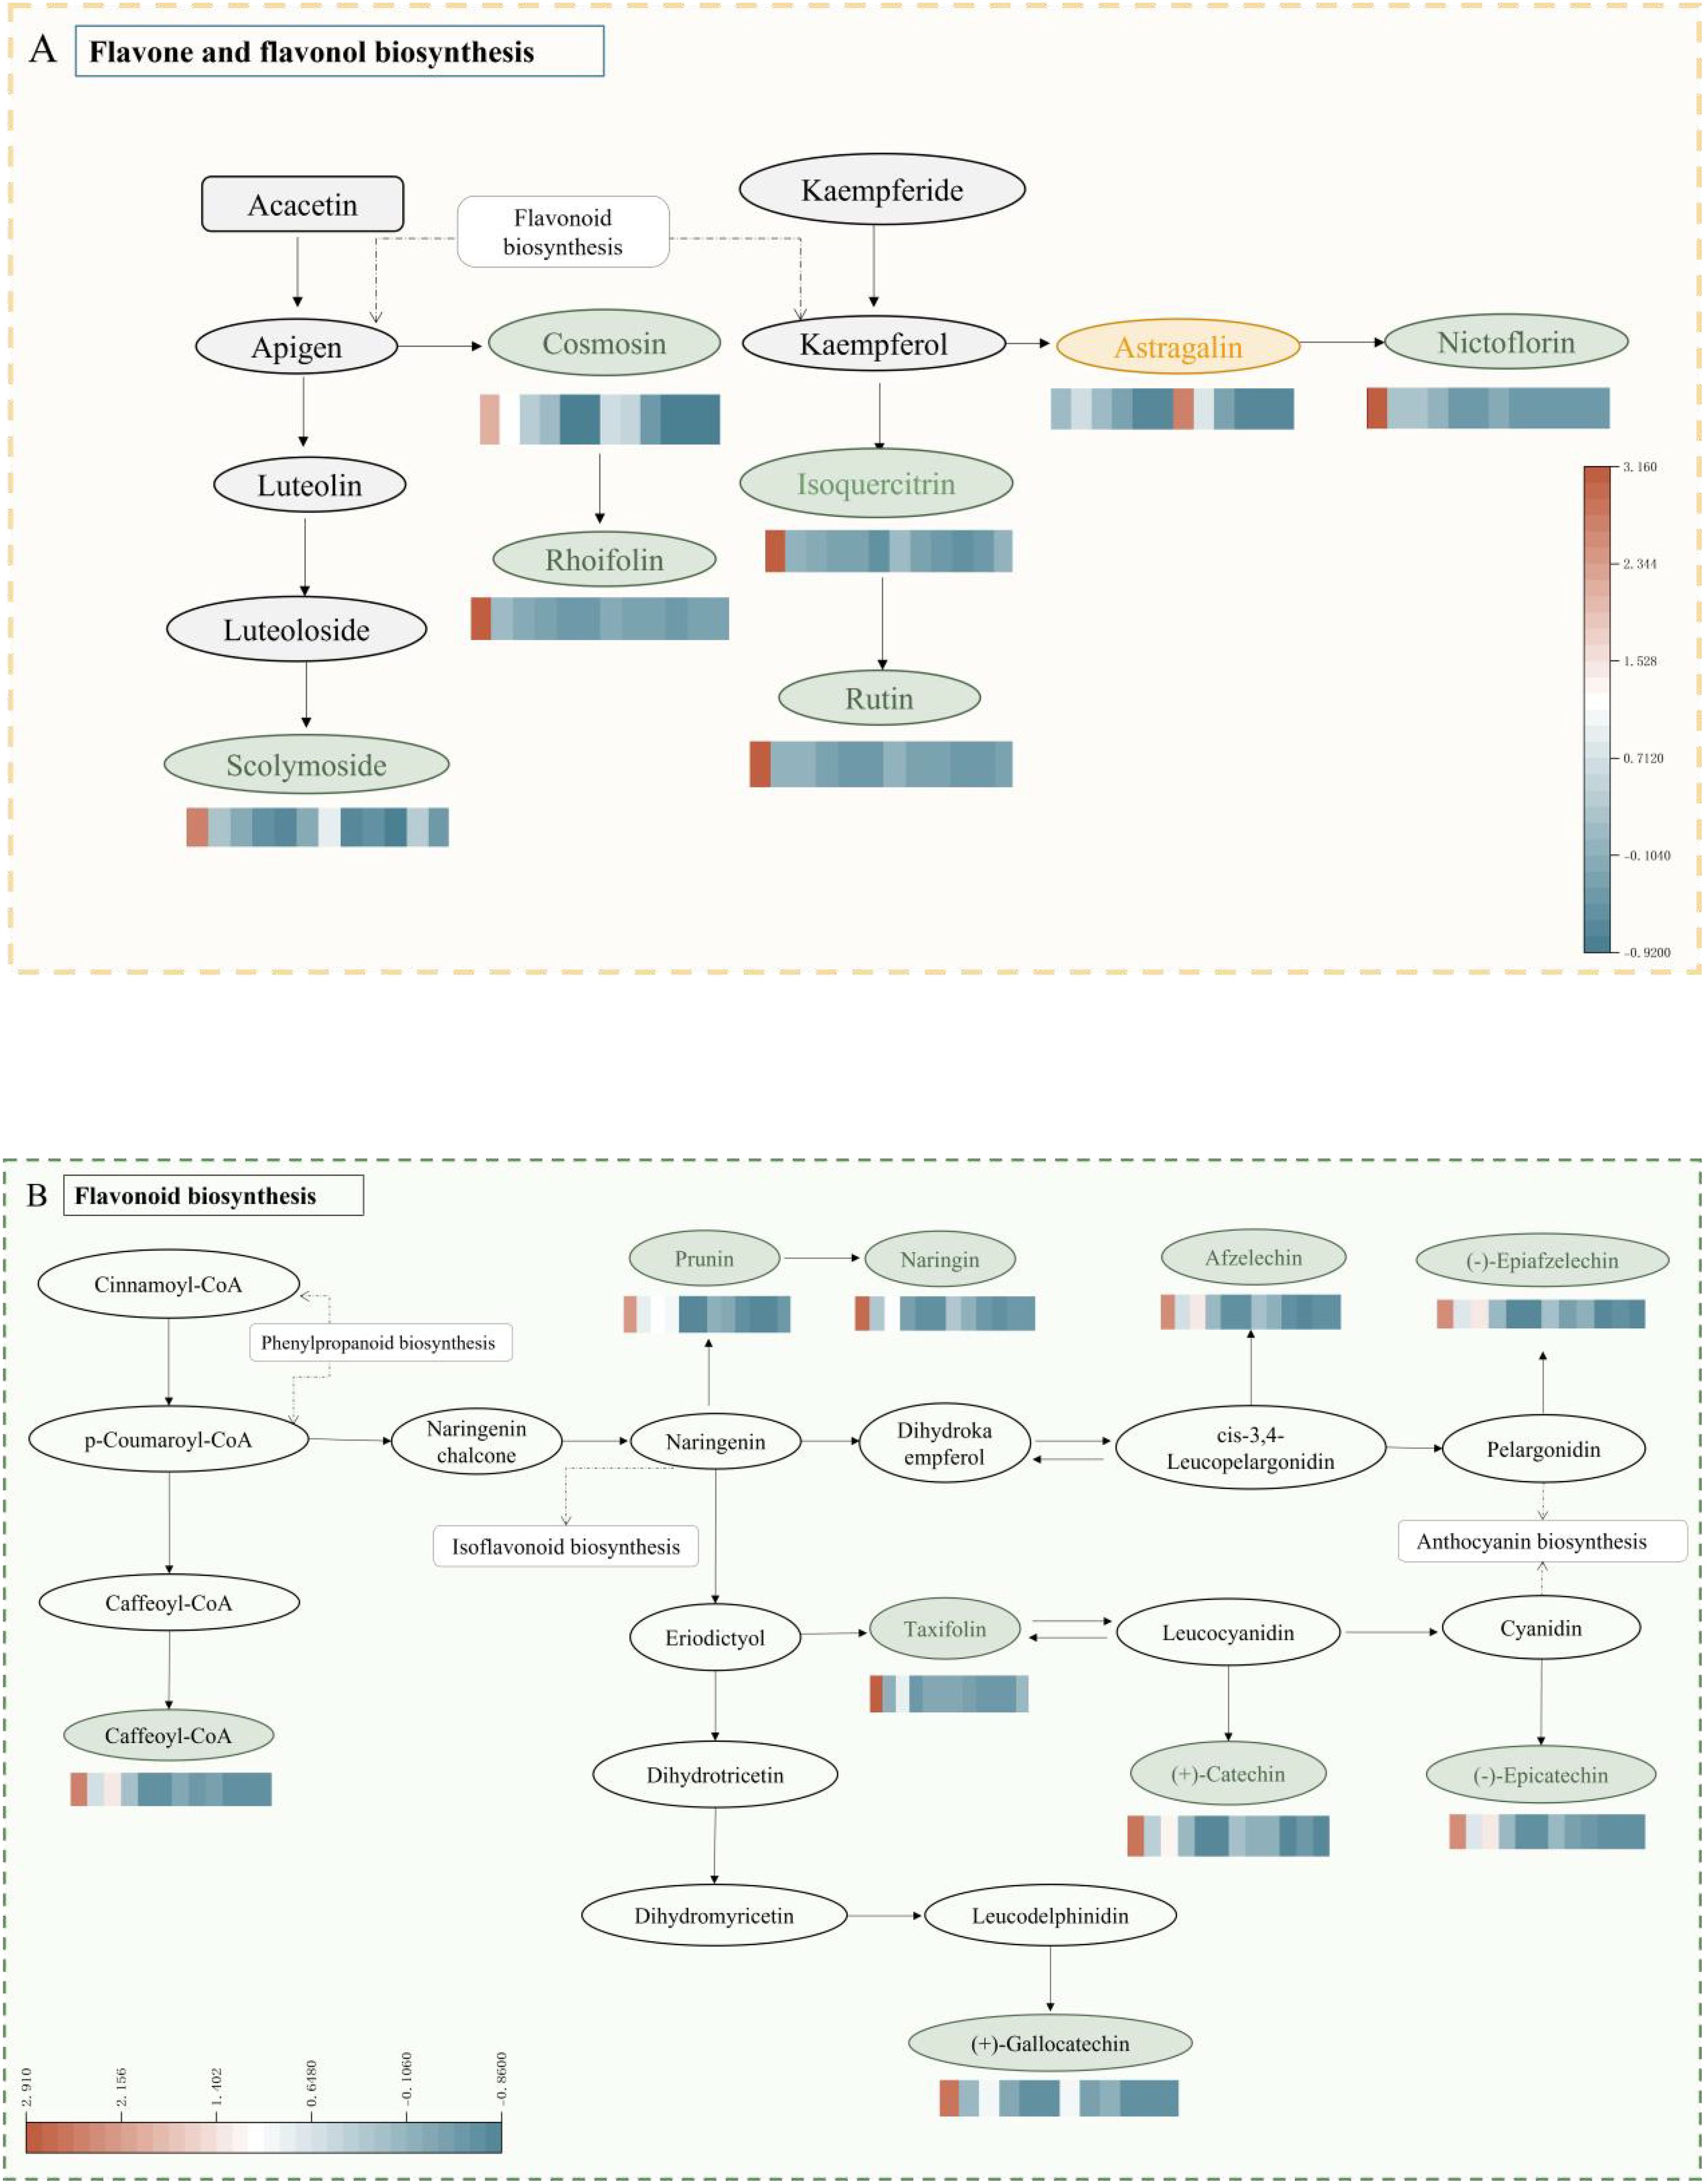
Figure 8. Enriched KEGG pathways of differentially expressed metabolites. (A) indicates flavonoid and flavonol biometabolic pathways, (B) indicates flavonoid biometabolic pathways. The color gradient represents the relative abundance of each flavonoid. Typically, warmer colors (red, orange) indicate higher levels, while cooler colors (blue, green) indicate lower levels.
3.6 Comprehensive comparison of flavonoid differential metabolites and analysis of characterized metabolites
The accumulation levels of 38 differential metabolites were analyzed across different harvest periods, and the described differentials were annotated with distinct flavonoid metabolic pathways CK and W5 fruits, as well as these metabolic networks (Figure 8). The majority of these metabolites were primarily enriched in the biosynthesis pathway of flavonoids and flavonols and the flavonoid biosynthesis pathway. The results showed that in the flavonoid and flavonol biosynthesis pathway, this study detected low expression of metabolites such as scolymoside, rutin, and nictoflorin during fruit development, whereas metabolites like kaempferol 3-O-glucoside were highly expressed. In the flavonoid biosynthesis pathway, metabolites such as (+)-catechin, (-)-epicatechin, gallocatechin, and (-)-epiafatechin were found to be lowly expressed during fruit development.
4 Discussion
Flavonoid is one of the important compounds in coconut water, which has an important effect on the growth and development of coconut. The change trend and metabolic mechanism of flavonoid in coconut water at different developmental stages are still unclear. In this study, the related problems were studied by metabonomics method. By examining the flavonoid content and metabolic properties of two coconut varieties (CK and W5) at different stages of fruit development, the results revealed that the total flavonoid content of both varieties exhibited a significant decline with fruit maturation, with the highest content observed at the age of fruit in 2 months. The total flavonoid content of CK varieties was not only numerically higher than that of W5, but also displayed more significant variation (Figure 1), suggesting that CK varieties may possess a more active metabolic mechanism for flavonoid synthesis and regulation, whereas W5 varieties exhibited a more stable metabolic profile. This finding highlighted essential differences in flavonoid metabolism among coconut varieties. Further analysis showed that the total flavonoid content decreased sharply during specific stages of coconut fruit development, such as between 8 and 10 months of age (Figure 1). This phenomenon may be attributed to the slowing down of flavonoid synthesis rates during fruit ripening, the changes in internal chemical composition, and the combination of flavonoids with other compounds (such as free glycoside elements and glycosides) to form more stable and water-soluble glycosidic compounds (such as flavonols, flavonoid glycosides). These glycosidic compounds play a crucial role in plant growth and development (Nabavi et al., 2020; Ojeda et al., 2002; Ferreyra et al., 2007). The metabolic trends of flavonoid compounds in plants have been reported to be diverse. For example, similar decreasing trends in total flavonoid content have been observed in grapes, strawberries, and pecans (Awad et al., 2017; Ferreyra et al., 2007; Jia et al., 2018), whereas contrasting findings have been reported in green beans and mangoes (Huang et al., 2023; Gan et al., 2016; Lu et al., 2019), which highlights the complexity and diversity of flavonoid metabolism across the plant kingdom. As an important secondary metabolite in plants, flavonoids have a more intricate synthesis and metabolism process (Liu et al., 2021). Research has shown that flavonoid biosynthesis in plants is not only tissue-specific, but also regulated by the plant’s developmental stage and influenced by environmental factors (Yang et al., 2018; Shi et al., 2022). Changes in plant chemical composition and bioactivity are strongly correlated with changes in different metabolic stages and climatic factors, such as temperature, soil moisture and rainfall (Yang et al., 2016; Prinsloo and Nogemane, 2018). Drought, high temperature and light exposure affect flavonoid and phenolic content in plants (Carvalho et al., 2010; Zheng et al., 2012; Liu et al., 2011). For instance, high temperatures (30-40°C) inhibit flavonoid biosynthesis, gene expression and enzyme activity (Dela et al., 2003). The sharp decline in flavonoid content between 8 and 10 months of age in the present study may be attributed to the high temperatures during this period. In addition to environmental factors, the differences in the synthesis of different species of flavonoids may also be related to the metabolic pathway, the synthesis of flavonoids involves the metabolic pathway of phenylpropanoid compounds, which involves the catalysis of several enzymes (PAL, C4H, 4CL), which catalyze the deamination of the aromatic amino acid phenylalanine (Phe) to produce coumaric acid (by PAL), then oxidized to 4-coumaric acid (by C4H). Through the addition of coenzyme A, the final activation into p-acyl-CoA (4CL), after a series of complex reactions, the formation of a series of phenolic substances and other secondary metabolites. In addition to environmental factors, differences in the synthesis of flavonoids in different species may be related to metabolic pathways. Flavonoid synthesis involves the metabolic pathway of phenylpropanoids, which involves the catalysis of several enzymes (PAL, C4H, 4CL), These enzymes catalyze the deamination of the aromatic amino acid phenylalanine (Phe) to form coumaric acid (by PAL), which is then oxidized to 4-coumaric acid (by C4H). Then, a series of secondary metabolites such as phenolics are formed through the addition of coenzyme A (CoA), which is finally activated into p - acyl- CoA (4CL), after a series of complex reactions (Nabavi et al., 2020). Flavonoids may also undergo a series of modification (glycosylation, methylation) and translocation processes after synthesis, which also affect the final content and distribution of flavonoids. The Arabidopsis UDP glycosyltransferases, UGT79B2 and UGT79B3, function as anthocyanin rhamnosyltransferases that confer abiotic stress tolerance by regulating anthocyanin accumulation (Li et al., 2017), There may be differences in the activity of these enzymes and substrate availability in different species, leading to differences in the rate of flavonoid synthesis and products. On the other hand, genetic factors also influence the differences in flavonoid content among different varieties, and the expression of genes involved in the flavonoid synthesis pathway varies among different varieties of plants. These genes include genes encoding flavonoid synthases (CHS, CHI, F3H) and transcription factors that regulate the expression of these genes. Mutants of several pro-flavonoid compound synthesis key enzymes corresponding to the key genes CHS, CHI, F3′H, and DFR were isolated in Arabidopsis thaliana, which play an important role in the synthesis of plant flavonoid compounds (Shen et al., 2022); In tobacco, both transcription factors NtMYB12a and NtMYB12b are involved in regulating flavonoid biosynthesis; and in tomato, the transcription factor WD40 protein SlAN11 is coordinated with bHLH and MYB proteins to regulate flavonoid biosynthesis and seed dormancy (Gao et al., 2018); Overexpression of the transcription factor MdWRKY11 in apple promoted the expression of F3H, FLS, DFR, anthocyanin synthase (ANS), and UFGT, which contributed to the increased accumulation of flavonoids and anthocyanins in apple healing tissues (Wang et al., 2018). CsMYB6A and CsUGT72AM1, key genes identified from tea tree, regulate the accumulation of anthocyanins and flavonols in purple leaf tea (He et al., 2018).Differences in gene expression directly lead to differences in the rate and products of flavonoid synthesis, thus affecting the flavonoid content in different varieties. It is hypothesized that the decrease in flavonoid content in this study is related to the conversion of other substances, environmental factors, metabolic pathways and genetic factors.
The flavonoid species and their metabolic properties in coconut water were systematically analyzed by UPLC-MS/MS technique and metabolomics approach, resulting in the detection of a total of 123 flavonoid compounds. The results of PCA and cluster analyses further emphasized this difference, indicating that metabolite accumulation was significantly higher in the CK variety compared to the other periods and in W5 (Figure 3). In the screening of differential metabolites, we identified a series of metabolites that differed significantly between CK and W5 varieties, including catechins and epicatechins, which play key roles in flavonoid biosynthesis. There are four common catechins: (+)-catechin, (-)-catechin, (+)-epicatechin, and (-)-epicatechin. Catechin biosynthesis involves the general phenylpropane pathway, which branches out into specific pathways of flavonoid biosynthesis (Xiong et al., 2013; Yu et al., 2022). Numerous studies have demonstrated that low concentrations of catechins have hormonal effects, promote, and enhance resistance, whereas high concentrations of catechins may be inhibitory (Hong et al., 2015; Prithiviraj et al., 2007; Ahammed et al., 2018). Additionally, low doses of (±) - catechins have been shown to elicit a moderate increase in ROS accumulation in the meristematic tissues of treated plants, which may trigger cell wall loosening, thereby promoting cell division and cell expansion for growth (Ahammed et al., 2023). In this study, we found that metabolites such as (+)-catechin and (-)-epicatechin were detected in the flavonoid biosynthesis pathway of W5 compared to CK and showed a significant down-regulation trend. Furthermore, gallocatechin and (-)-epiafatechin also exhibited significant down-regulation trends during fruit development (Figure 8). Based on these findings, it was inferred that W5 grows and develops better relative to CK and may accumulate more metabolites such as amino acids, proteins and sugars.
Flavonoids from coconut water species have been found to possess medicinal value, based on the results of KEGG functional annotation and enrichment analyses, which showed that flavonoids and flavonols have distinctly different distributions in the two species, with CK containing a higher abundance of flavonoids, while W5 up-regulated the accumulation of metabolites, particularly kaempferol-3-O-glucoside (Figure 8). Notably, Kaempferol-3-O-glucoside has been reported to exhibit a range of biological activities, including antimicrobial, anti-inflammatory, neuro- and cardioprotective, antitumour and antidiabetic properties (Riaz et al., 2018). Additionally, it has been shown to inhibit intestinal α-glucosidase and α–amylase activities (Hong et al., 2013), may act as a potential insulin secretagogue, contributing to glucose homeostasis (Rey et al., 2019). The study showed low expression of several differential metabolites such as catechin, saccharin chalcone, lonicera glycosides, rutin and other metabolites. Notably, the study showed that the expression of catechin changed noticeably, whereas the levels of other flavonoid metabolites remained relatively stable. These findings suggest that kaempferol-3-O-glucoside, and catechin may be a class of differential substances characterized in CK and W5. Differential metabolites were mainly concentrated in the flavonoid and flavonol biosynthesis pathways (Figure 7), highlighting the importance of flavonoids in coconut fruit metabolism and implying that they may play a role in physiological functions and stress responses in the fruit.
5 Conclusion
The present study compared the changes in flavonoid metabolites in coconut water from CK and W5 varieties at different stages of growth. The results showed that t the flavonoid content decreased significantly with fruit maturation, with a peak at 2 months of age and then gradually decreased. The flavonoid content of CK varieties was higher than that of W5 and varied more drastically, indicating fundamental differences in flavonoid synthesis and regulation between the two varieties. KEGG enrichment analyses showed that differential metabolites were mainly enriched in the flavonoid biosynthesis pathway (ko 00941), the flavonoid and flavonol biosynthesis pathway (ko 00944). Furthermore, the accumulation of key metabolites, such as kaempferol-3-O-glucoside and catechin, varied according to cultivar and developmental stage. This study not only enhanced our understanding of differential metabolism of flavonoids in coconut water, but also provided valuable insights into the study of flavonoid metabolic pathways and functions, which can contribute to the improvement of coconut varieties and quality enhancement. However, the study was limited by the sample size and inadequate analysis of environmental factors, and the specific mechanisms of flavonoids in coconut development require further in-depth exploration. Future studies should focus on these aspects to fully elucidate the complexities of flavonoid metabolism in coconut water.
Data availability statement
The datasets presented in this study can be found in online repositories. The names of the repository/repositories and accession number(s) can be found in the article/Supplementary Material.
Author contributions
MH: Writing – original draft, Writing – review & editing. JJ: Writing – review & editing. YS: Data curation, Methodology, Writing – review & editing. QW: Data curation, Methodology, Writing – review & editing. HC: Supervision, Formal analysis, Writing – original draft, Writing – review & editing. WL: Data curation, Supervision, Writing – original draft, Writing – review & editing. CS: Supervision, Writing – original draft, Writing – review & editing.
Funding
The author(s) declare financial support was received for the research, authorship, and/or publication of this article. This study was supported by the National Key Research and Development Program of China (Grant No. 2023YFD2200700), and the Research and Demonstration of Wenye No.5 Variety Breeding and Its Supporting Key Technology (Qiong (2021) TG 05).
Conflict of interest
The reviewer WH declared a shared parent affiliation with the authors JJ, YS, QW, HC, CS to the handling editor at the time of review.
The remaining authors declare that the research was conducted in the absence of any commercial or financial relationships that could be construed as a potential conflict of interest.
Publisher’s note
All claims expressed in this article are solely those of the authors and do not necessarily represent those of their affiliated organizations, or those of the publisher, the editors and the reviewers. Any product that may be evaluated in this article, or claim that may be made by its manufacturer, is not guaranteed or endorsed by the publisher.
Supplementary material
The Supplementary Material for this article can be found online at: https://www.frontiersin.org/articles/10.3389/fpls.2024.1468858/full#supplementary-material
References
Ahammed, G. J., Li, Y., Li, X., Han, W., Chen, S. (2018). Epigallocatechin-3-Gallate alleviates salinity-retarded seed germination and oxidative stress in tomato. J. Plant Growth Regul. 37, 1349–1356. doi: 10.1007/s00344-018-9849-0
Ahammed, G. J., Wu, Y., Wang, Y., Gou, T., Shamsy, R., Li, X., et al. (2023). Epigallocatechin-3-Gallate (EGCG): A unique secondary metabolite with diverse roles in plant-environment interaction. Environ. Exp. Bot. 209, 105299. doi: 10.1016/j.envexpbot.2023.105299
Akimoto, N., Ara, T., Nakajima, D., Suda, K., Ikeda, C., Takahashi, S., et al. (2017). FlavonoidSearch: A system for comprehensive flavonoid annotation by mass spectrometry. Sci. Rep. 7, 1243. doi: 10.1038/s41598-017-01390-3
Al-Khayri, J. M., Sahana, G. R., Nagella, P., Joseph, B V., Alessa, F M., Al-Mssallem, M Q., et al. (2022). Flavonoids as potential anti-inflammatory molecules: A review. Molecules 27, 2901. doi: 10.3390/molecules27092901
Awad, M. A., Al-Qurashi, A. D., Alrashdi, A. M. A., Mohamed, S A., Faidi, F., et al. (2017). Developmental changes in phenolic compounds, antioxidant capacity and enzymes activity in skin of ‘El-Bayadi’ table grapes. Scientia Hortic. 224, 219–225. doi: 10.1016/j.scienta.2017.06.044
Batiha, G. E. S., Beshbishy, A. M., Ikram, M., Mulla, Z S., Taha, A E., et al. (2020). The pharmacological activity, biochemical properties, and pharmacokinetics of the major natural polyphenolic flavonoid: quercetin. Foods 9, 374. doi: 10.3390/foods9030374
Carvalho, I. S., Cavaco, T., Carvalho, L. M., Duque, P. (2010). Effect of photoperiod on flavonoid pathway activity in sweet potato (Ipomoea batatas (L.) Lam.) leaves. Food Chem. 118, 384–390. doi: 10.1016/j.foodchem.2009.05.005
Cavaiuolo, M., Cocetta, G., Ferrante, A. (2013). The antioxidants changes in ornamental flowers during development and senescence. Antioxidants 2, 132–155. doi: 10.3390/antiox2030132
Chang, C. L., Wu, R. T. (2011). Quantification of (+)-catechin and (–)-epicatechin in coconut water by LC–MS. Food Chem. 126, 710–717. doi: 10.1016/j.foodchem.2010.11.034
Dela, G., Or, E., Ovadia, R., et al. (2003). Changes in anthocyanin concentration and composition in ‘Jaguar’ rose flowers due to transient high-temperature conditions. Plant Sci. 164, 333–340. doi: 10.1016/S0168-9452(02)00417-X
Deng, J., Qin, W., Yang, C., Iqbal, N., takpah, D., Zhang, J., et al. (2019). Seed quality deterioration dynamics for isoflavones biosynthesis in soybean (Glycine max L. Merr.) seeds against field mildew stress. Acta Physiologiae Plantarum 41, 57. doi: 10.1007/s11738-019-2845-6
Fernandes, I., Pérez-Gregorio, R., Soares, S., Mateus, N., Freitas, V. D. (2017). Wine flavonoids in health and disease prevention. Molecules 22, 292. doi: 10.3390/molecules22020292
Ferreyra, R. M., Viña, S. Z., Mugridge, A., Chaves, A R. (2007). Growth and ripening season effects on antioxidant capacity of strawberry cultivar Selva. Scientia Hortic. 112, 27–32. doi: 10.1016/j.scienta.2006.12.001
Fiehn, O. (2002). “Metabolomics — the link between genotypes and phenotypes,” in Town C. Functional Genomics (Springer Netherlands, Dordrecht), 155–171.
Gan, R. Y., Wang, M. F., Lui, W. Y., Wu, K. (2016). Dynamic changes in phytochemical composition and antioxidant capacity in green and black mung bean (Vigna radiata) sprouts. Int. J. Food Sci. Technol. 51, 2090–2098. doi: 10.1111/ijfs.2016.51.issue-9
Gao, Y., Liu, J., Chen, Y., Tang, H., Wang, Y., He, Y., et al. (2018). Tomato SlAN11 regulates flavonoid biosynthesis and seed dormancy by interaction with bHLH proteins but not with MYB proteins. Horticulture Res. 5, 27. doi: 10.1038/s41438-018-0032-3
He, X., Zhao, X., Gao, L., Shi, X., Dai, X., Liu, Y., et al. (2018). Isolation and characterization of key genes that promote flavonoid accumulation in purple-leaf tea (Camellia sinensis L.). Sci. Rep. 8, 130. doi: 10.1038/s41598-017-18133-z
Hong, G., Wang, J., Hochstetter, D., Gao, Y., Xu, P. (2015). Epigallocatechin-3-gallate functions as a physiological regulator by modulating the jasmonic acid pathway. Physiologia Plantarum 153, 432–439. doi: 10.1111/ppl.2015.153.issue-3
Hong, H. C., Li, S. L., Zhang, X. Q., Ye, W. C. (2013). Flavonoids with α-glucosidase inhibitory activities and their contents in the leaves of Morus atropurpurea. Chin. Med. 8, 19. doi: 10.1186/1749-8546-8-19
Huang, J., Qin, Y., Xie, Z., Wang, P., Zhao, Z., Huang, X., et al. (2023). Combined transcriptome and metabolome analysis reveal that the white and yellow mango pulp colors are associated with carotenoid and flavonoid accumulation, and phytohormone signaling. Genomics 115, 110675. doi: 10.1016/j.ygeno.2023.110675
Imran, M., Rauf, A., Abu-Izneid, T., Nadeem, M., Shariati, M. A., Khan, I A., et al. (2019). Luteolin, a flavonoid, as an anticancer agent: A review. Biomedicine Pharmacotherapy 112, 108612. doi: 10.1016/j.biopha.2019.108612
Iwashina, T. (2003). Flavonoid function and activity to plants and other organisms. Biol. Sci. Space 17, 24–44. doi: 10.2187/bss.17.24
Jia, X., Luo, H., Xu, M., Zhai, M., Gou, Z., Qiao, Y., et al. (2018). Dynamic changes in phenolics and antioxidant capacity during pecan (Carya illinoinensis) kernel ripening and its phenolics Profiles. Molecules 23, 435. doi: 10.3390/molecules23020435
Kanehisa, M., Goto, S. (2000). KEGG: kyoto encyclopedia of genes and genomes. Nucleic Acids Res. 28, 27–30. doi: 10.1093/nar/28.1.27
Kozlowska, A., Szostak-Wegierek, D. (2014). Flavonoids - food sources and health benefits. Roczniki Państwowego Zakładu Higieny 65, 79–85.
Kumar, M., Kasala, E. R., Bodduluru, L. N., Kumar, V., Lahkar, M. (2017). Molecular and biochemical evidence on the protective effects of quercetin in isoproterenol-induced acute myocardial injury in rats. J. Biochem. Mol. Toxicol. 31, e21832. doi: 10.1002/jbt.2017.31.issue-1
Kumar, M., Saini, S. S., Agrawal, P. K., Roy, P., Sircar, D. (2021). Nutritional and metabolomics characterization of the coconut water at different nut developmental stages. J. Food Composition Anal. 96, 103738. doi: 10.1016/j.jfca.2020.103738
Leyva-López, N., Gutierrez-Grijalva, E. P., Ambriz-Perez, D. L., Heredia, B. J. (2016). Flavonoids as cytokine modulators: A possible therapy for inflammation-related diseases. Int. J. Mol. Sci. 17, 921. doi: 10.3390/ijms17060921
Li, P., Li, Y. J., Zhang, F. J., Zhang, G. Z., Jiang, X. Y., Yu, H M., et al. (2017). The Arabidopsis UDP-glycosyltransferases UGT79B2 and UGT79B3, contribute to cold, salt and drought stress tolerance via modulating anthocyanin accumulation. Plant J. 89, 85–103. doi: 10.1111/tpj.2017.89.issue-1
Liu, H., Wang, X., Wang, D., Zou, Z., Liang, Z. (2011). Effect of drought stress on growth and accumulation of active constituents in Salvia miltiorrhiza Bunge. Ind. Crops Products 33, 84–88. doi: 10.1016/j.indcrop.2010.09.006
Liu, K., Pi, F., Zhang, H., Ji, J., Xia, S., Cui, F., et al. (2017). Metabolomics analysis to evaluate the anti-inflammatory effects of polyphenols: glabridin reversed metabolism change caused by LPS in RAW 264.7 cells. J. Agric. Food Chem. 65, 6070–6079. doi: 10.1021/acs.jafc.7b01692
Liu, W., Feng, Y., Yu, S., et al. (2021). The flavonoid biosynthesis network in plants. Int. J. Mol. Sci. 22, 12824. doi: 10.3390/ijms222312824
Lu, Y., Chang, X., Guo, X. (2019). Dynamic Changes of Ascorbic Acid, Phenolics Biosynthesis and Antioxidant Activities in Mung Beans (Vigna radiata) until Maturation. Plants 8, 75. doi: 10.3390/plants8030075
Mahayothee, B., Koomyart, I., Khuwijitjaru, P., Siriwongwilaichat, P., Nagle, M., Müller, J. (2016). Phenolic compounds, antioxidant activity, and medium chain fatty acids profiles of coconut water and meat at different maturity stages. Int. J. Food Properties 19, 2041–2051. doi: 10.1080/10942912.2015.1099042
Nabavi, S. M., Šamec, D., Tomczyk, M., Milella, L., Russo, D., Habtemariam, S., et al. (2020). Flavonoid biosynthetic pathways in plants: Versatile targets for metabolic engineering. Biotechnol. Adv. 38, 107316. doi: 10.1016/j.biotechadv.2018.11.005
Ojeda, H., Andary, C., Kraeva, E., Carbonneau, A., Deloire, A. (2002). Influence of pre- and postveraison water deficit on synthesis and concentration of skin phenolic compounds during berry growth of Vitis vinifera cv. Shiraz. Am. J. Enology Viticulture 53, 261–267.
Pourcel, L., Routaboul, J., Cheynier, V., Lepiniec, L., Debeaujon, I. (2007). Flavonoid oxidation in plants: from biochemical properties to physiological functions. Trends Plant Sci. 12, 29–36. doi: 10.1016/j.tplants.2006.11.006
Prinsloo, G., Nogemane, N. (2018). The effects of season and water availability on chemical composition, secondary metabolites and biological activity in plants. Phytochem. Rev. 17, 889–902. doi: 10.1007/s11101-018-9567-z
Prithiviraj, B., Perry, L. G., Badri, D. V., Vivanco, J. M. (2007). Chemical facilitation and induced pathogen resistance mediated by a root-secreted phytotoxin. New Phytol. 173, 852–860. doi: 10.1111/j.1469-8137.2006.01964.x
Pummer, S., Heil, P., Maleck, W., Petroianu, G. (2001). Influence of coconut water on hemostasis. Am. J. Emergency Med. 19, 287–289. doi: 10.1053/ajem.2001.24477
Rey, D., Miranda Sulis, P., Alves Fernandes, T., Gonçalves, R., Silva Frederico, M. J., Costa, G., et al. (2019). Astragalin augments basal calcium influx and insulin secretion in rat pancreatic islets. Cell Calcium 80, 56–62. doi: 10.1016/j.ceca.2019.03.009
Riaz, A., Rasul, A., Hussain, G., Kashif Zahoor, M., Jabeen, F., Subhani, Z., et al. (2018). Astragalin: A bioactive phytochemical with potential therapeutic activities. Adv. Pharmacol. Pharm. Sci. 2018, 9794625. doi: 10.1155/2018/9794625
Rudrapal, M., Chetia, D. (2016). Plant flavonoids as potential source of future antimalarial leads. Systematic Rev. Pharm. 8, 13–18. doi: 10.5530/srp.2017.1.4
Shen, N., Wang, T., Gan, Q., Liu, S., Wang, L., Jin, B. (2022). Plant flavonoids: Classification, distribution, biosynthesis, and antioxidant activity. Food Chem. 383, 132531. doi: 10.1016/j.foodchem.2022.132531
Shi, Y., Yang, L., Yu, M., Li, Z., Ke, Z., Qian, X., et al. (2022). Seasonal variation influences flavonoid biosynthesis path and content, and antioxidant activity of metabolites in Tetrastigma hemsleyanum Diels & Gilg. PloS One 17, e0265954. doi: 10.1371/journal.pone.0265954
Tang, W. T., Fang, M. F., Liu, X., Yue, M. (2014). Simultaneous quantitative and qualitative analysis of flavonoids from ultraviolet-B radiation in leaves and roots of Scutellaria baicalensis georgi using LC-UV-ESI-Q/TOF/MS. J. Analytical Methods Chem. 2014, e643879. doi: 10.1155/2014/643879
Tian, F., Jia, T., Yu, B. (2014). Physiological regulation of seed soaking with soybean isoflavones on drought tolerance of Glycine max and Glycine soja. Plant Growth Regul. 74, 229–237. doi: 10.1007/s10725-014-9914-z
Tsugawa, H., Kind, T., Nakabayashi, R., Yukihira, D., Tanaka, W., Cajka, T., et al. (2016). Hydrogen rearrangement rules: computational MS/MS fragmentation and structure elucidation using MS-FINDER software. Analytical Chem. 88, 7946–7958. doi: 10.1021/acs.analchem.6b00770
Tsugawa, H., Nakabayashi, R., Mori, T., Yamada, Y., Takahashi, M., Rai, A., et al. (2019). A cheminformatics approach to characterize metabolomes in stable-isotope-labeled organisms. Nat. Methods 16, 295–298. doi: 10.1038/s41592-019-0358-2
Tungmunnithum, D., Thongboonyou, A., Pholboon, A., Yangsaba, A. (2018). Flavonoids and other phenolic compounds from medicinal plants for pharmaceutical and medical aspects: an overview. Medicines 5, 93. doi: 10.3390/medicines5030093
Wang, J., Su, H., Wu, Z., Wang, W., Zhou, Y., Li, M. (2022). Integrated metabolites and transcriptomics at different growth stages reveal polysaccharide and flavonoid biosynthesis in cynomorium songaricum. Int. J. Mol. Sci. 23, 10675. doi: 10.3390/ijms231810675
Wang, N., Liu, W., Zhang, T., Jiang, S., Xu, H., Wang, Y., et al. (2018). Transcriptomic analysis of red-fleshed apples reveals the novel role of mdWRKY11 in flavonoid and anthocyanin biosynthesis. J. Agric. Food Chem. 66, 7076–7086. doi: 10.1021/acs.jafc.8b01273
Wang, S., Wang, B., Hua, W., Niu, J., Dang, K., Qiang, Y., et al. (2017). De novo assembly and analysis of polygonatum sibiricum transcriptome and identification of genes involved in polysaccharide biosynthesis. Int. J. Mol. Sci. 18, 1950. doi: 10.3390/ijms18091950
Xiong, L., Li, J., Li, Y., Yuan, L., Liu, S., Huang, J., et al. (2013). Dynamic changes in catechin levels and catechin biosynthesis-related gene expression in albino tea plants (Camellia sinensis L.). Plant Physiol. Biochem. 71, 132–143. doi: 10.1016/j.plaphy.2013.06.019
Yang, L., Wen, K. S., Ruan, X., Zhao, Y. X., Wei, F., Wang, Q. (2018). Response of plant secondary metabolites to environmental factors. Molecules 23, 762. doi: 10.3390/molecules23040762
Yang, L., Zheng, Z. S., Cheng, F., Ruan, X., Jiang, D. A., Pan, C. D., et al. (2016). Seasonal dynamics of metabolites in needles of taxus wallichiana var. mairei. Molecules 21, 1403. doi: 10.3390/molecules21101403
Yu, W., Liu, H., Luo, J., Zhang, S., Xiang, P., Wang, W., et al. (2022). Partial root-zone simulated drought induces greater flavonoid accumulation than full root-zone simulated water deficiency in the leaves of Ginkgo biloba. Environ. Exp. Bot. 201, 104998. doi: 10.1016/j.envexpbot.2022.104998
Zhang, P., Du, H., Wang, J., Pu, Y., Yang, C., Yan, R., et al. (2020). Multiplex CRISPR/Cas9-mediated metabolic engineering increases soya bean isoflavone content and resistance to soya bean mosaic virus. Plant Biotechnol. J. 18, 1384–1395. doi: 10.1111/pbi.13302
Zheng, J., Yang, B., Ruusunen, V., Laaksonen, O., Tahvonen, R., Hellsten, J., et al. (2012). Compositional differences of phenolic compounds between black currant (Ribes nigrum L.) cultivars and their response to latitude and weather conditions. J. Agric. Food Chem. 60, 6581–6593. doi: 10.1021/jf3012739
Keywords: coconut water, flavonoid metabolites, developmental dynamics, liquid chromatography tandem mass spectrometry, metabolomics
Citation: Hou M, John Martin JJ, Song Y, Wang Q, Cao H, Li W and Sun C (2024) Dynamics of flavonoid metabolites in coconut water based on metabolomics perspective. Front. Plant Sci. 15:1468858. doi: 10.3389/fpls.2024.1468858
Received: 22 July 2024; Accepted: 10 September 2024;
Published: 07 October 2024.
Edited by:
Qunfeng Zhang, Chinese Academy of Agricultural Sciences (CAAS), ChinaReviewed by:
Wang Hui, Chinese Academy of Tropical Agricultural Sciences, ChinaWeidong Dai, Chinese Academy of Agricultural Sciences, China
Chuan Yue, Southwest University, China
Copyright © 2024 Hou, John Martin, Song, Wang, Cao, Li and Sun. This is an open-access article distributed under the terms of the Creative Commons Attribution License (CC BY). The use, distribution or reproduction in other forums is permitted, provided the original author(s) and the copyright owner(s) are credited and that the original publication in this journal is cited, in accordance with accepted academic practice. No use, distribution or reproduction is permitted which does not comply with these terms.
*Correspondence: Wenrao Li, d3JsaTIwMDdAaGVudS5lZHUuY24=; Chengxu Sun, aG5zdW5jeEBxcS5jb20=