- Institute of Agricultural Quality Standard and Testing Technology, Jilin Academy of Agricultural Sciences, Changchun, China
As one of the developed genetically modified (GM) maize varieties in China, CC-2 has demonstrated promising commercial prospects during demonstration planting. The establishment of detection methods is a technical prerequisite for effective supervision and regulation of CC-2 maize. In this study, we have developed an event-specific quantification method that targets the junction region between the exogenous gene and the 5’ flanking genomic DNA (gDNA) of CC-2. The accuracy and precision of this method were evaluated across high, medium, and low levels of CC-2 maize content, revealing biases within ±25% and satisfactory precision data. Additionally, we determined the limits of quantification of the method to be 0.05% (equivalent to 20 copies) of the CC-2 maize. A collaborative trial further confirmed that our event-specific method for detecting CC-2 produces reliable, comparable, and reproducible results when applied to five different samples provided by various sources. Furthermore, we calculated the expanded uncertainty associated with determining the content level of CC-2 in these samples.
1 Introduction
Maize (Zea mays L.) occupies a significant position in the domain of genetically modified organisms (GMOs), with more than 25% of global maize varieties undergoing genetic alteration (ISAAA, 2021). As of 2023, it holds the record for the highest number of approved GM crop events, totalling 69.32 million hectares and the number of authorized maize events has reached 421 (GM AgbioInvestor Monitor, 2024). Maize accounts for 146 of these events (Meng et al., 2022). The cultivation and utilization of genetically modified maize for food or feed purposes is becoming increasingly widespread on a global scale (Turkec et al., 2015; Avsar et al., 2020).
Prior to the commercial release of a new GM event, it is widely acknowledged that regulatory must be conducted to assess their potential impacts on human, animal and environmental health (Akinbo et al., 2021; Giraldo et al., 2019). The incorporation of tracking and tracing tools for transgenic insertion is considered an indispensable component of the deregulation process (European Commission Regulation (EC) No.1830/2003). Furthermore, the development of detection methods for GM identification and quantification is not only pivotal for ensuring legality and traceability but also for compliance with GM labelling regulations (Gruère and Rao, 2007). Moreover, method validation plays a crucial role in standardizing GM testing methods to ensure that GM testing laboratories can generate reliable analytical results (Meng et al., 2022).
The GM maize CC-2, developed by the Chinese Agricultural University (CN Patent No. CN105331725A), is a transgenic maize event containing modified EPSPS genes linking with the the chloroplast signaling peptide of sorghum named maroACC gene (Chen et al., 2019; Fan et al., 2018). It is one of the first batch of GM maize varieties in China obtaining production safety certificates, and it will have great commercial potential. Therefore, developing highly specific event-specific PCR methods for GM maize CC-2 and its derivatives is of significant importance for promoting the commercialization of GM maize in China. At the same time, the application of this method will also provide necessary technical support for safety testing, intellectual property protection, and product supervision (Li et al., 2020). Therefore, there is an urgent need for more specific, accurate, and standardized methods to meet the technical requirements of GM regulation in various countries’ food trade regulations (Carzoli et al., 2018). Real-time PCR is widely regarded as the gold standard method for GM quantification in food or feed products (Li et al., 2022; Turkec et al., 2015; Avsar et al., 2020), though many other new GMO detection techniques such as microarray, digital PCR, re-sequencing, and biosensor, etc., were also reported (Yi et al., 2022; Li et al., 2017; Fraiture et al., 2021). The reliability of inter-laboratory results relies on method comparisons, validation, and harmonization. The inter-laboratory validation of methods is a crucial step in standardizing GM detection procedures, as it empowers the GM detection laboratory to generate dependable analytical outcomes.
This study established an event-specific real-time PCR method based on the molecular characteristics of CC-2 for the detection and quantification of GM maize CC-2. For this method, we organized a collaborative ring trial, which confirmed the specificity, applicability and viability of quantitative determination and the range of quantitative uncertainty. The development and application of the method will provide technical support for CC-2 maize commercialization supervision and implementation of quantitative labelling system.
2 Materials and methods
2.1 Plant material
Seeds of homozygous GM maize CC-2 and its non-GM maize ZD958 were provided by the Agricultural University of China. For specific testing, a total of 42 varieties of other GM crop events were graciously supplied by their respective developers, encompassing 13 transgenic maize (Zea mays L.) events (MON810, MON863, MON88017, MON89034, MON87460, MON87427, NK603, GA21, Bt176, Bt11, MIR604, MIR162, 3272, DAS-40278, 59122, 5307, 4114, T25, DBN9936, C0010.3.7 and TC1507), 7 transgenic soybean (Glycine max L.) events (GTS 40-3-2, A2704-12, MON89788, DP-356043, A5547-127, CV-127 and DP-305423), 7 transgenic rapeseed (Brassica napus L.) events (MS1, Topas19/2, Oxy-235, MS8, RF1/RF2/RF3 and T45) and 6 transgenic cotton (Gossypium hirsutum L.) events (MON531, MON88913, MON1445, MON15985, LLCotton25 and GHB614). All these seeds served as a source of genomic DNA for the purpose of this study.
2.2 Sample preparation
Seeds of CC-2 and non-GM maize were planted in the greenhouse. Genomic DNA extracted from leaves was used for quantitative DNA calibrant. Blind matrix samples containing different CC-2 event mass fractions (5%, 2%, 1%, 0.5%, and 0.1%) were created using ground seed powder from both types of maize, provided by the Development Center of Science and Technology, Ministry of Agriculture and Rural Affairs, China.
2.3 DNA extraction
The DNeasy Plant Mini Kit (Qiagen, Hilden, Germany) was used to extract genomic DNA (gDNA) from plant or seed material following the manufacturer’s instructions. The quality of the gDNA was evaluated by measuring the OD260/OD280 ratio with a Nanodrop 8000 (Thermo Scientific™ NanoDrop™, USA). To analyze low initial DNA concentrations, CC-2 maize DNA samples were diluted with water and prepared at concentrations of 10, 5, 0.4, 0.08, and 0.016 ng/µl using QubitR 2.0 (Life Technologies, United States). The copy number of gDNA was estimated based on the haploid genome size of maize being 2500 Megabasepairs (Arumuganathan and Earle, 1991), corresponding to a weight of 2.74 pg.
2.4 Primers and probes design
The design of primers and probes at the mutation positions was carried out using Primer Express Software 3.0 following the manufacturer’s instructions. The design principles involved placing one set of primers/probe on either the 5’ or 3’ side of the exogenous gene insertion locus in the genome, as well as specifying the region for the 5’ end of probes to maintain sensitivity. Candidate primer pairs were additionally confirmed through traditional endpoint PCR to ensure generation of a single PCR product of correct size. Endogenous gene probes were labelled with 5’HEX, while specific probes were labelled with 5’ FAM, both quenched with BHQ or MGB at the 3’end (Sangon BioTech, China). The details of the primers and probes used in this study are provided in Table 1.
2.5 Quantitative real-time PCR
The 7,500 Real-Time PCR System from Life Technologies AB (USA) was employed for quantitative real-time PCR analysis. The amplification system followed the instructions provided by Roche (Switzerland) for FastStart Universal Probe Master and ROX reference dye. qPCR analysis was conducted according to the methodology described in previous research (Guertler et al., 2019), with a minimum of three biological replicate samples included in each experiment. The maize endogenous gene zSSIIb (maize starch synthase IIb) and the event CC-2 specific fragment were separately amplified following the thermal cycle protocol: 95 °C for 5 min, 40 cycles at 95 °C for 15 s (denaturation), and 60 °C for 1 min (annealing and extension). Fluorescent signals were read out during the extension steps, and analyzed using the software Option Monitor 2 version 2.02 (MJ Research, Waltham, MA, USA).
2.6 Method verification
The validation of this method adheres to the standards outlined in the “ Verification of analytical methods for GMO testing when implementing interlaboratory validated methods” (Hougs et al., 2017). Key parameters including dynamic range, accuracy, precision, limit of detection (LOD) and limit of quantification (LOQ) were assessed. Furthermore, the specificity of the method was investigated by analyzing DNA samples from diverse species encompassing GM maize events as well as soybean, cotton, sugar beet, and rapeseed. Additionally, sensitivity in detecting target sequences in other DNA samples was evaluated by combining an equal amount of DNA from three GM maize samples with a positive control (CC-2 maize).
2.7 Collaborative trials
The ring trial comprised eight GMO detection laboratories, all of which were affiliated with the Ministry of Agriculture, China. Each laboratory was provided with seven genomic samples: one sample labelled as CC-2 was utilized for constructing standard curves through serial dilution; one sample designated as a negative control; and five blind samples labelled S1, S2, S3, S4 and S5 representing CC-2 content levels of 5%, 2%, 1%, 0.5% and 0.1% respectively. Each sample had a volume of 100 μL at a concentration of 50 ng/μL. The genomic DNA samples along with the primers/probe were stored in an enclosed container filled with dry ice and dispatched to each participating laboratory.
3 Results and discussion
3.1 Establishment of CC-2 event-specific PCR
The 5’ end of the insert and the flanking sequence of maize genomic DNA were provided and licensed by China Agricultural University for reference and method development (Patent No. CN201510856966). Blastn analysis against sequences in the GenBank database confirmed that the isolated junctions indeed spanned the integration border between the genome and integrated construct. Multiple primer-probe combinations specific to CC-2 were designed based on the 5’ end-boundary genome sequence and CC-2 insertion, utilizing online software Primer3 (http://primer3.ut.ee/). These primers and probes were screened through qPCR amplification using CC-2 genomic DNA as a template. Among them, CC-2-F/R combined with QP primer probes exhibited a characteristic “S” shaped curve with stronger amplification signal and lower quantification cycle (Cq) value, making it a potential candidate for further analysis. The amplified fragment length of this combination was determined to be 107 bp through sequencing verification, which matched expectations. As an endogenous reference gene in maize, zSSIIb gene was employed for quantitative PCR assay due to its confirmed single copy status in maize genome; moreover, real-time PCR protocol for zSSIIb gene had been previously validated (Yang et al., 2005). Specific information regarding primer probes is presented in Figure 1 while details about primers and probes are provided in Table 1.
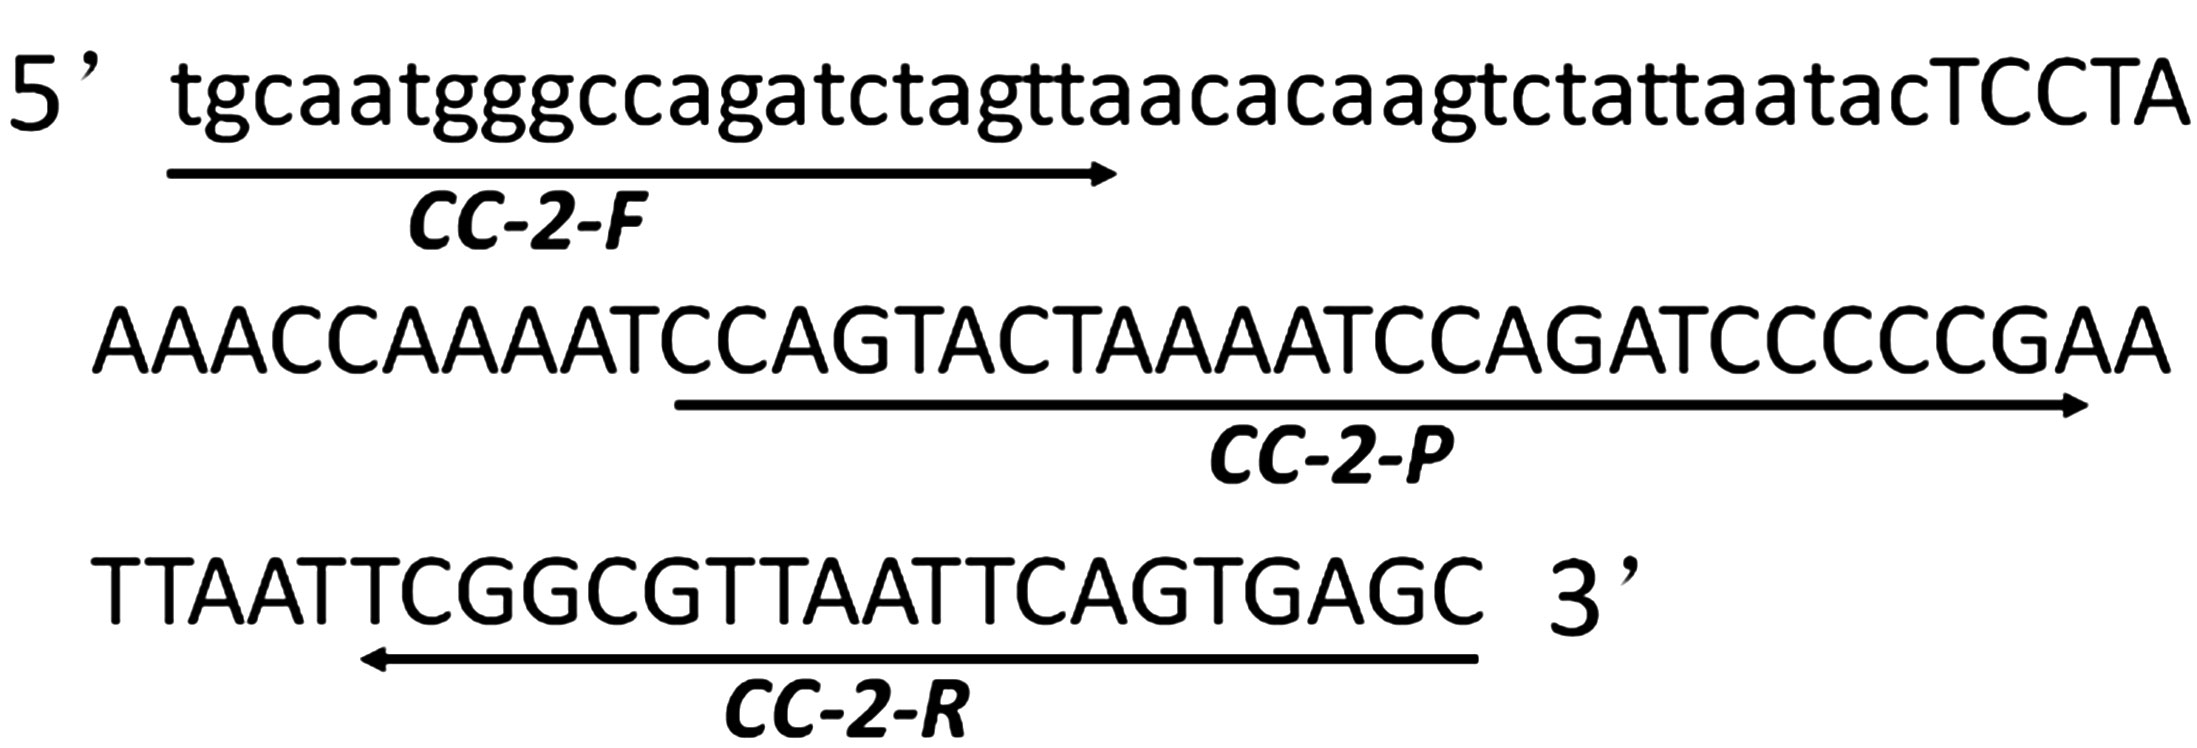
Figure 1. Amplicon sequence of GM maize CC-2 event-specific PCR. The junction fragment of CC-2 event covered 40 bp of flanking genomic DNA in lowercase letters and 67 bp exogenous insertion fragment in uppercase letters and the sequence of forward primer CC-2-F, reverse primer CC-2-R and probe CC-2-P were underlined.
In order to optimize the real-time fluorescence PCR reaction system, concentration gradients of six primers (0 μmol/L, 0.1 μmol/L, 0.2 μmol/L, 0.4 μmol/L, 0.6 μmol/L and 0.8 μmol/L) were set respectively, with the probe concentration being half of the primer concentration. The concentrations of primers and probes were determined based on fluorescence curves and relative Cq values. The results demonstrated that the smallest Cq value and higher fluorescence intensity were achieved when using a primer concentration of 0.4 μmol/L and a probe concentration of 0.2 μmol/L; there was no significant difference compared to amplification with high-concentration primer-probe pairs (Supplementary Figure S1). Considering its consistency with the internal standard gene zSSIIb and minimal impact on annealing temperature in real-time fluorescent PCR reactions, this method adopted the conventional qPCR reaction procedure.
3.2 Specific test of CC-2 event-specific PCR method
The specific test of the CC-2 primer combination CC-2-uQF/uQR/uQP was conducted on different crops and their main commercial events. The samples consisted of 6 mixed samples of common GM crops and 6 mixed samples of non-GM maize. Supplementary Table S1 provides detailed information on the events and results. The obtained results demonstrated that only the CC-2 sample exhibited the expected amplification curve, while other samples did not show such curves. These findings indicate that the method exhibits excellent specificity for detecting the CC-2 maize event.
3.3 LOD
The concentration of homozygous genomic DNA template was quantified and the copy numbers were calculated based on an estimated haploid maize genome size of 2500 Mbp (Arumuganathan and Earle, 1991). Six samples of the homozygous genomic DNA template were serially diluted to achieve copy number concentrations of 40, 20, 10, 5, 2.5 and 0.5 copies/μL. Subsequently, 2 μL test samples were introduced into the system. Utilizing a total DNA template amount of 100 ng, the mass-percentage of CC-2 event corresponded to approximately 0.20%, 0.10%, 0.05%, 0.25%, 0.125% and 0.025%. Each dilution was subjected to analysis in 12 parallel reactions to identified LOD.
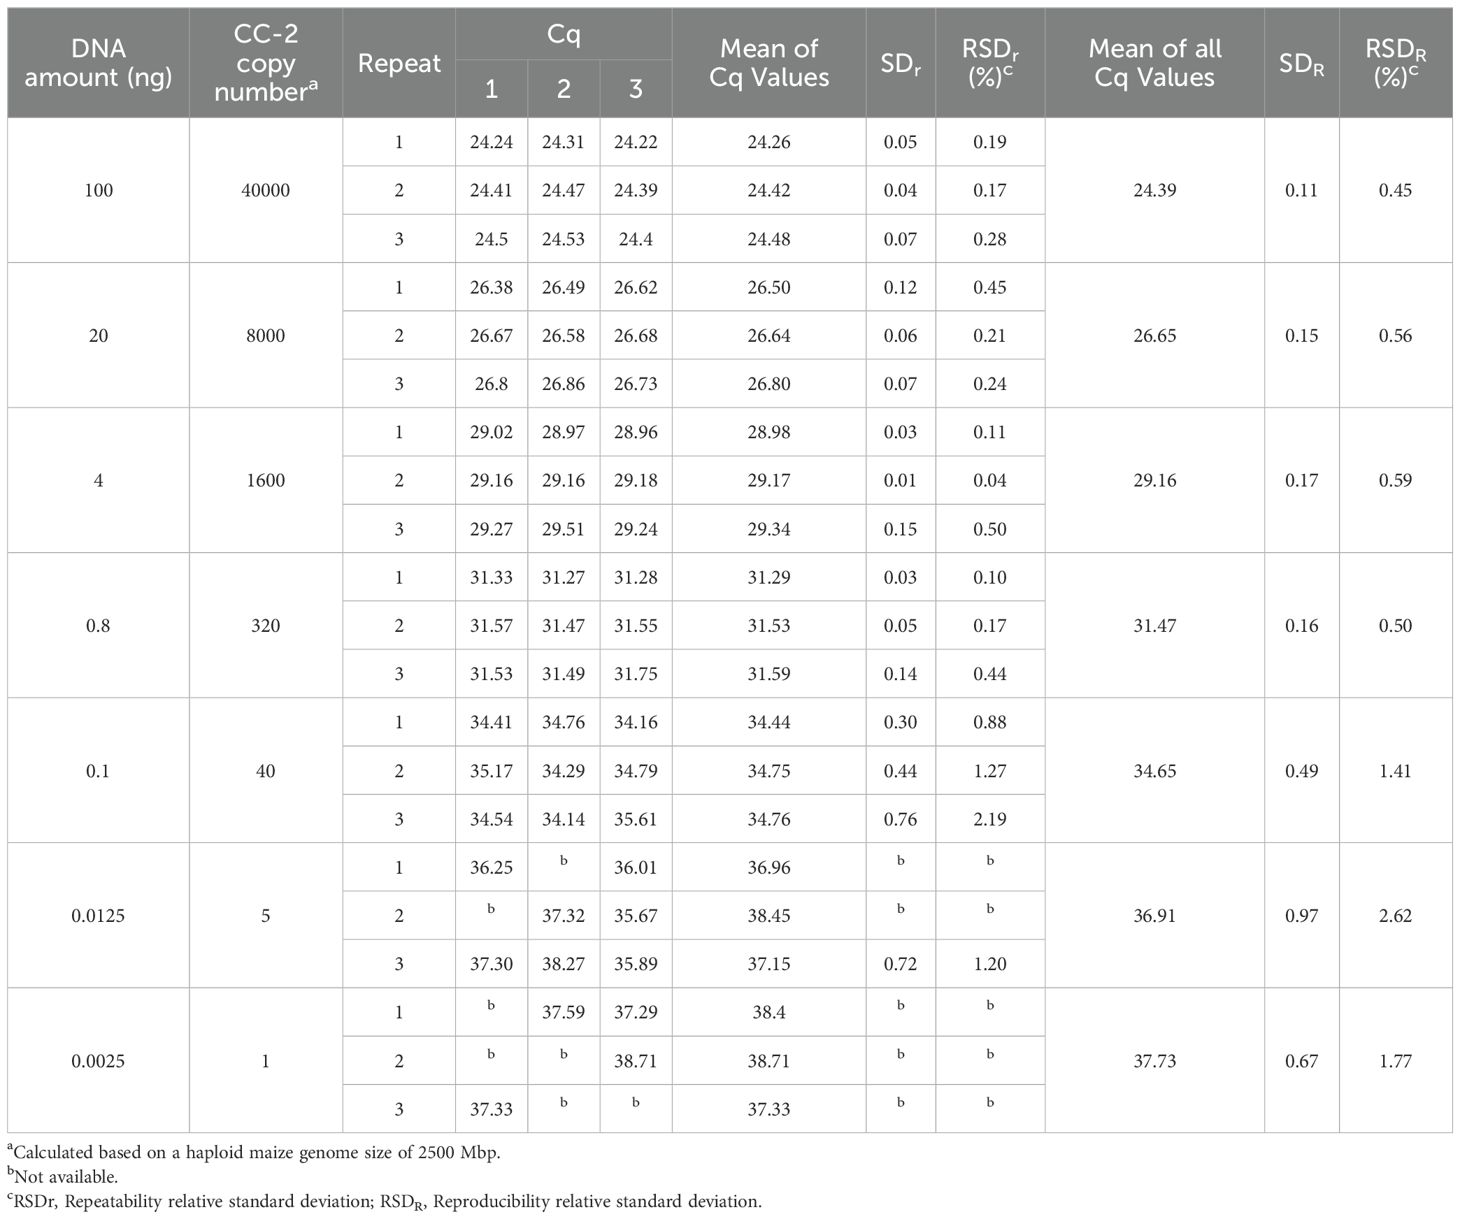
The amplification test results are presented in Figure 2, and the statistical findings are summarized in Table 2. The data indicate that at a template concentration of 0.5 copies/μL, corresponding to 1 copy of substrate in the reaction system, 5 out of 12 parallel reactions yielded positive results, validating the accuracy of the template concentration dilution. At a template volume of 5 copies, 9 out of 12 parallel reactions were positive. When using templates with 2 copies, 7 out of 12 parallel reactions produced a positive result, but mean copy number was not available. Notably, typical amplification curves were obtained for all twelve parallel reactions when utilizing templates with copy numbers ranging from 10 to 40 copies. These observations suggest that the sample containing a fraction as low as 0.05% of CC-2 event (equivalent to 20 copies of CC-2 maize) could be reliably detected.
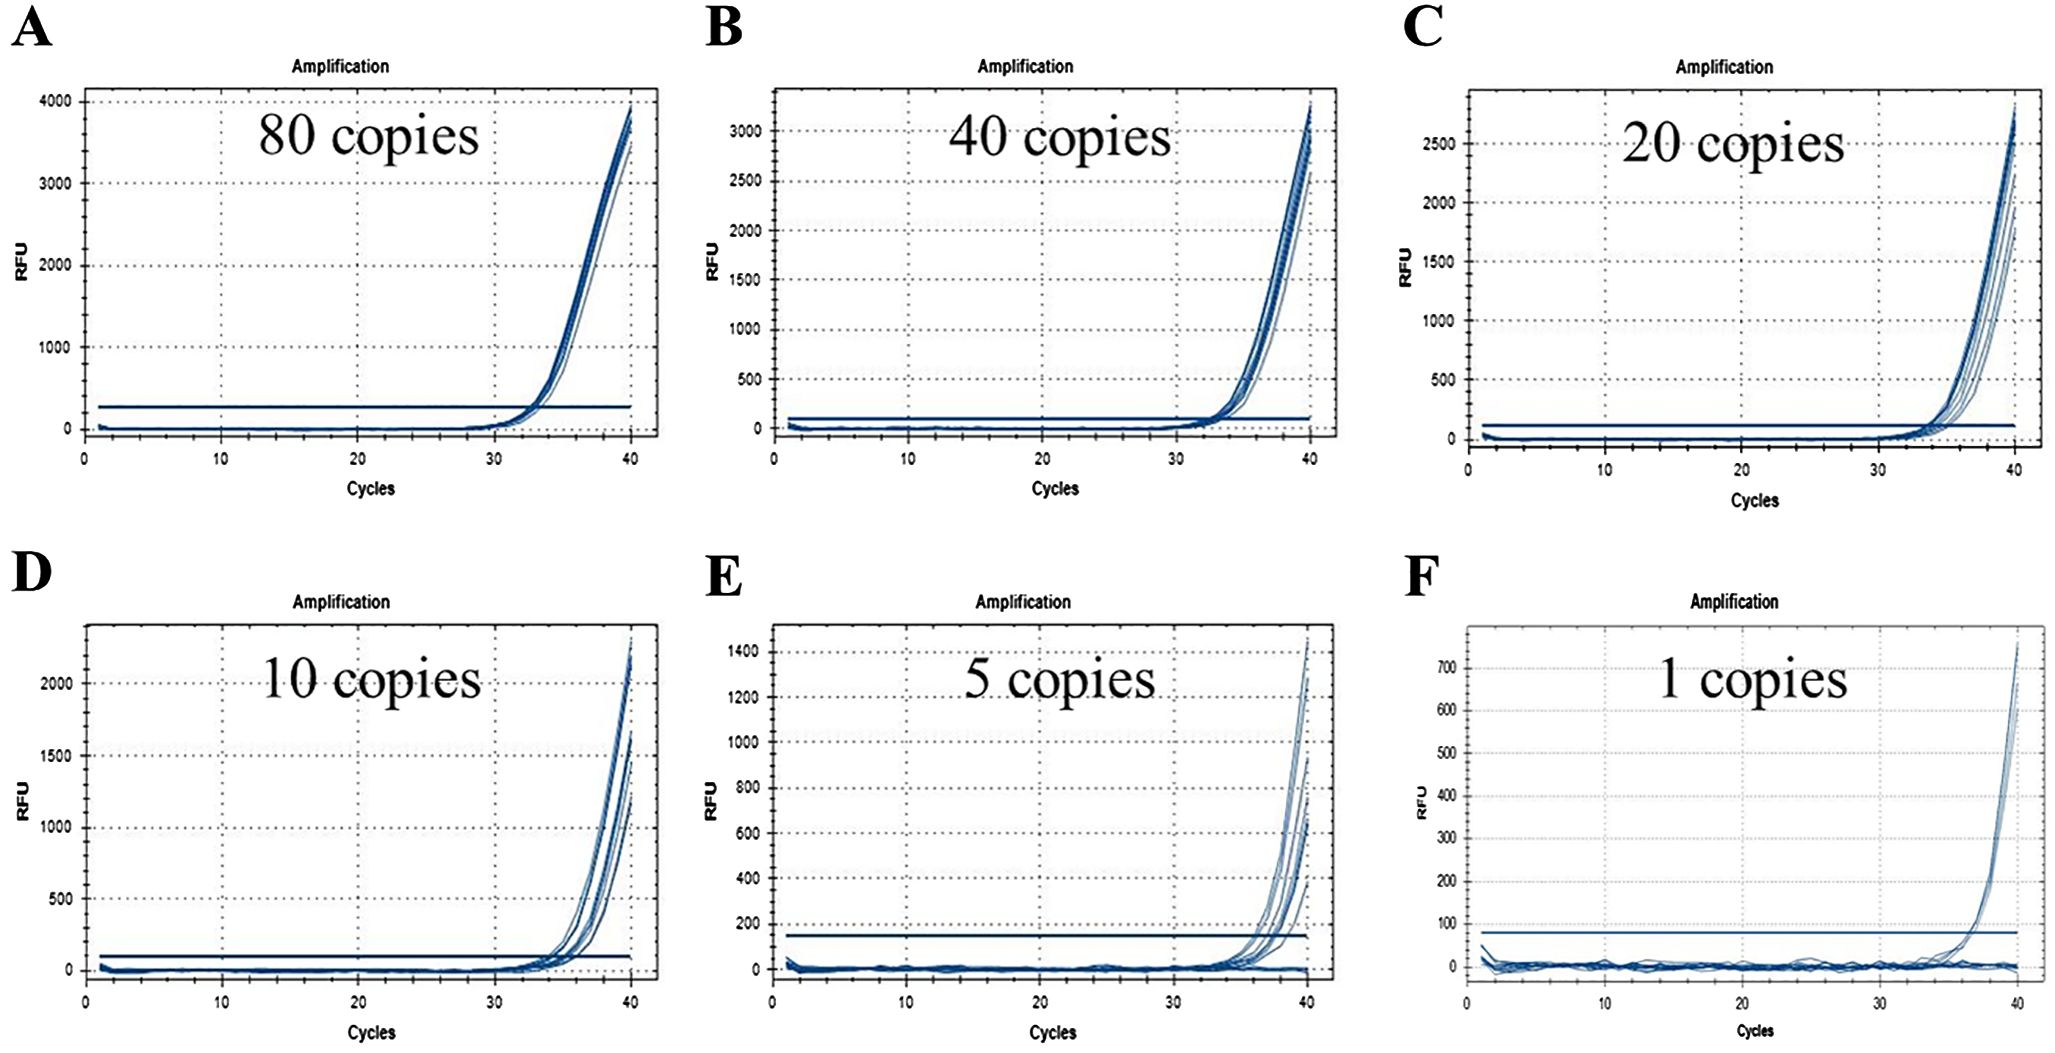
Figure 2. LOD test of CC-2 event specific real-time PCR method. is the amplification of 10 replicates when the amount of substrate in the reaction system is 80 (A), 40 (B), 20 (C), 10 (D), 5 (E) and 1 (F) copy, respectively.
3.4 Dynamic range
The concentration of genomic DNA was diluted to 50 ng/μl, followed by gradient dilution with water or 0.1×TE buffer to prepare multiple calibrators with varying contents. These calibrators were utilized as templates for real-time fluorescent PCR reactions, with the amount of DNA template in the PCR system being 2 μL. The corresponding DNA quality and copy number were then determined and are presented in Table 3. Standard curves for CC-2 and zSSIIb genes in maize were plotted based on the Cq value of PCR reaction of standard DNA solution and the logarithm of initial template copy number. The results indicated that when the calibrator ranged from 40 to 40000 copies, the slopes of the standard curves for CC-2 and zSSIIb in maize were -3.403 and -3.342 respectively (Figure 3). The coefficient of determination R2 was 0.999 for both cases, exceeding the minimum acceptable value of 0.98. The PCR amplification efficiencies were 96.70% and 99.20%, respectively, falling within the permissible range of 90% to 110%. More than three replicates were conducted, and all data parameters of standard curves met the requirements for quantitative GM detection methods. The PCR reaction system exhibited a good linear relationship between the PCR Cq value and the copy number detection of CC-2 specific fragment.
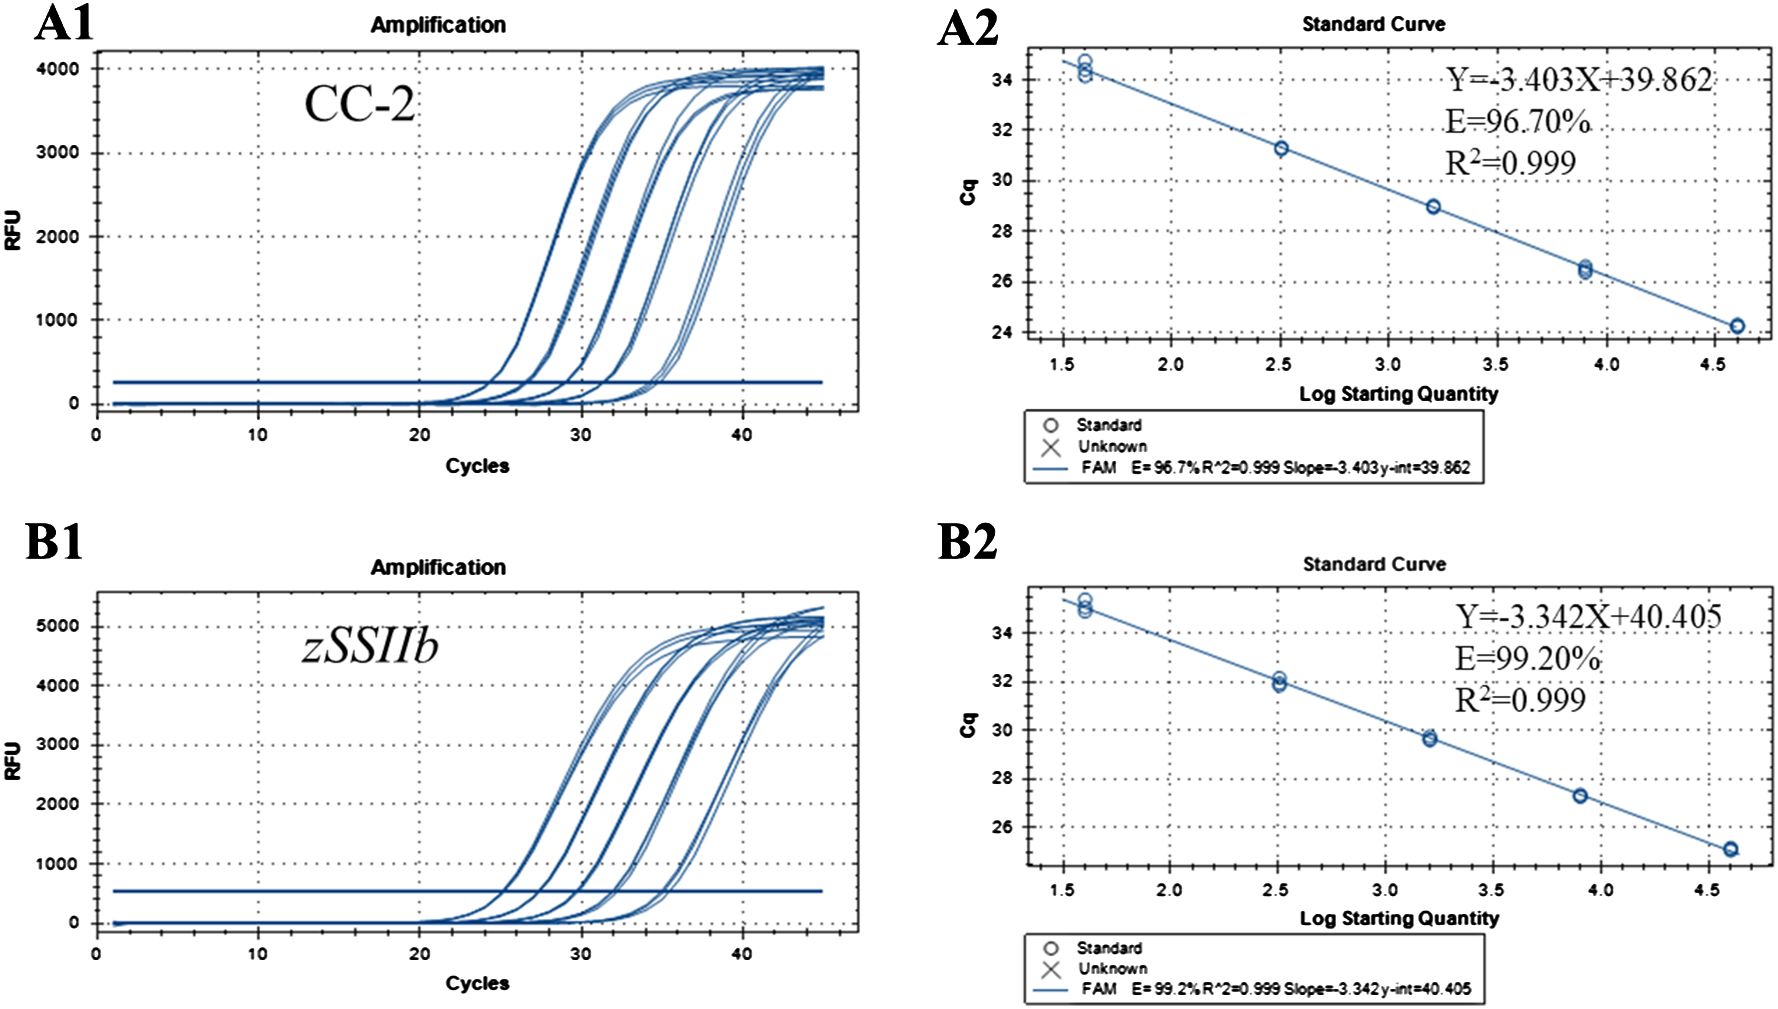
Figure 3. Amplification and standard curves for the event-specific quantitative PCR method using gradient-diluted CC-2 genomic DNA as the template analyzed using CFX96 System. (A1) Amplification graph for the CC-2 event-specific assay. (A2) Standard curve for the CC-2 event-specific assay. The copy numbers of the CC-2 event in each dilution were 40000,10000,1000,200 and 20 copies per reaction, respectively. (B1) Amplification graph for the endogenous gene zSSIIb assay. (B2) Standard curve for the gene zSSIIb assay. The quantities of maize genome in each dilution were 40000, 10000, 1000, 200, and 20 copies per reaction, respectively.
3.5 LOQ
The initial determination of the limit of quantification (LOQ) is established based on the concentration range of the low content calibrator as measured by the limit of detection (LOD) (see Table 2). The findings indicate that only when the substrate concentration in the sample reaches 40 copies, both the relative bias and relative standard deviation are ≤25%, falling within an acceptable range. Therefore, it can be concluded that a minimum substrate amount of 40 copies is required for accurate determination.
For the samples with the copy number fraction of 0.1% of CC-2 event that passed the preliminary test, a total of 60 quantitative tests were conducted to calculate the relative bias (biasR) and relative standard deviation (RSD) of the detection data (Supplementary Figure S2). The results showed that both the relative bias and relative standard deviation for all test samples fell within ±25% of the acceptable range, indicating that the quantitative limit of CC-2 fluorescent quantitative PCR method could be determined to reach 0.1%, thus meeting EU standards requirements (European Network of GMO Laboratories (ENGL), 2015).
3.6 Quantification of blind samples by real-time quantitative PCR
Samples containing genomic DNA with copy number fractions of 5%, 1%, and 0.1% of CC-2 were subjected to testing, with three parallel samples set for each level and the experiment repeated thrice. The proportion of CC-2 DNA to total maize DNA (%) was computed as (mean copies of GM maize of three parallel assays)/(mean copies of total maize DNA of three parallel assays)×100% (Kuribara et al., 2002). Table 4 presents results indicating values of 5.23%, 1.00%, and 0.10% for the three respective samples. The relative bias (biasR) between the measured total average value and the nominal value of the three subsamples ranges from 0.37% to 4.51%, falling within the acceptable range of ±25%, indicating that the measurement results obtained using the CC-2 quantitative PCR method exhibit good accuracy. The relative standard deviation (RSDr) for repeatability of the three horizontal samples ranged from 1.06% to 14.38%, all of which were below the specified threshold of 25%. The results of repeatability analysis demonstrate that the CC-2 converter fluorescence quantitative PCR method exhibits excellent precision.
3.7 Collaborative validation of the quantitative PCR method for GM event CC-2 detection
The new qualitative detection concept would be useful for ensuring robust and reproducible results among laboratories, particularly for detecting low-copy-number DNA samples. Samples of different CC-2 content were performed an interlaboratory evaluation of the developed quantitative method as a blind test performed by 8 laboratories. Blind samples with the CC-2 content levels of 5%, 2%, 1%, 0.5% and 0.1% were prepared and provided to measure in each lab. Samples of one content has 3 sub-samples.
As the result submitted of 8 labs shown (Supplementary Table S2; Figure S3), the slope of standard curves of CC-2 specific and zSSIIb gene in eight laboratories ranged from -42.63 to -38.29 and -42.95 to -38.091, respectively. The determination coefficients R2 ranged from 0.995 to 1.000 and from 0.992 to 1.000, respectively, PCR amplification efficiency ranged from 91.70 to 106.14% and from 90.09 to 101.4%, respectively. All the tests of the standard curves were within the acceptable range.
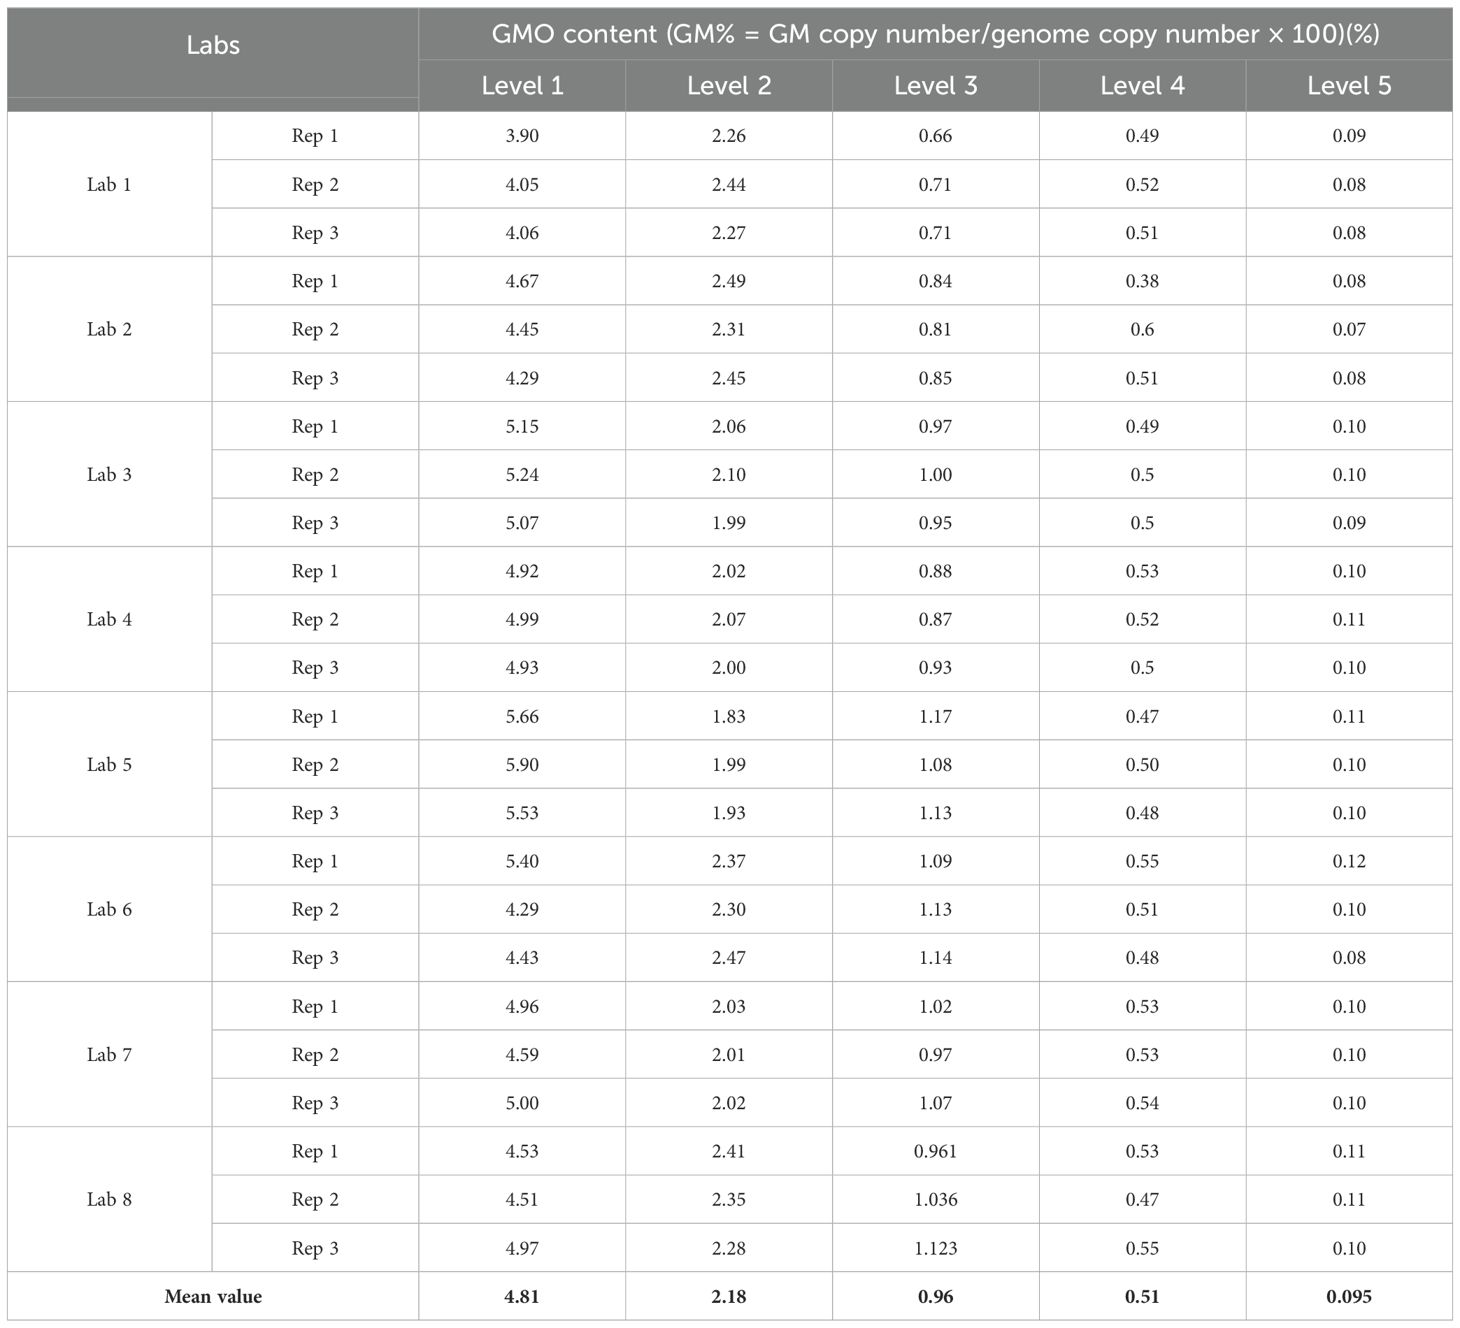
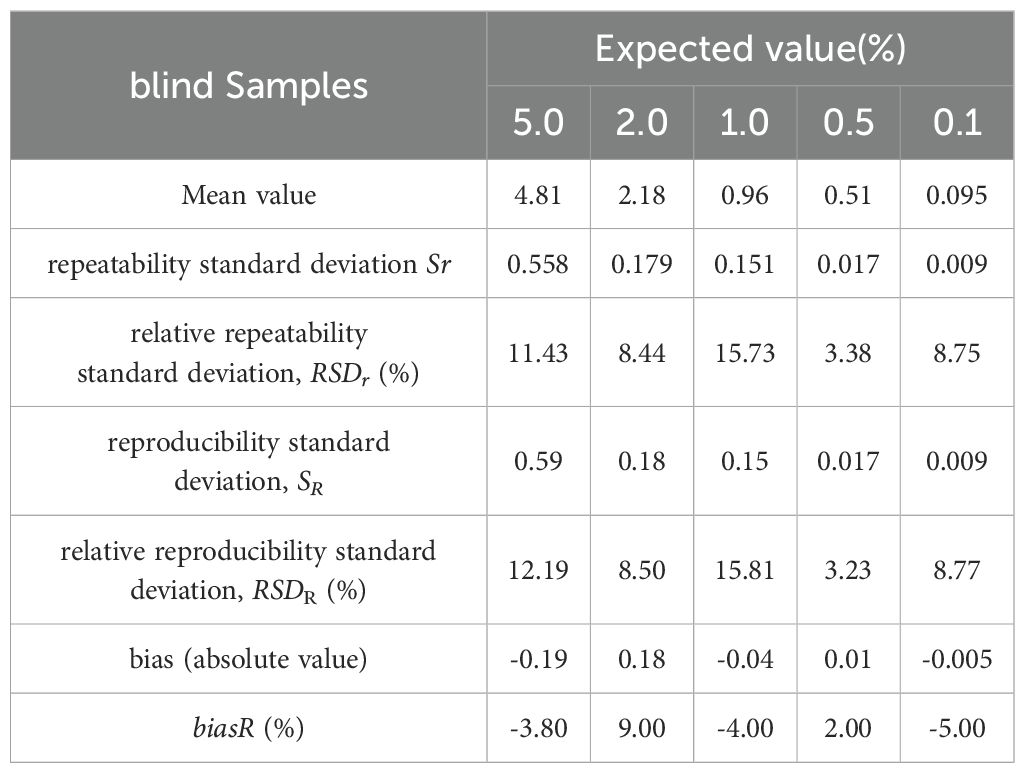
For the different content samples measured data, Cochran’s test (p<0.025) and Grubb’s test (p<0.025) were carried according to the harmonized guidelines of AOAC to remove the outlier data and analyze the validated result. The results show that there are no outliers or deviations in 8 laboratory data. the data of 15 samples with 3 different content from 8 laboratories were statistically summarized, and the average value from 8 laboratories was calculated (Table 5). The average values of 5 content samples in laboratories were 4.81%, 2.18%, 0.96%, 0.51% and 0.095%, respectively. The quantitative values deviated slightly from the expected values for all tested samples with bias (%) ranging from -5.0% and 9.0%. In the ENGL method acceptance criterion, the trueness should be within ±25% (European Network of GMO Laboratories (ENGL), 2015). It indicated that the CC-2 PCR specific method in quantitative measurement was credible.
After that, we conducted further statistical analyses for the values of quantification. The trueness and precision were determined as previously described. The mean, bias, repeatability of RSD (RSDr) and reproducibility of RSD (RSDR) of blind samples were measured (Table 6). The RSDr values for samples were 11.43%, 8.44%, 15.73%, 3.38% and 8.75%, respectively; all RSDr values were below 25%. The RSDR values were within the range of 3.23% to 12.19%, all below 35% across the entire dynamic range. Both the RSD of test samples were similar to or within a narrower range than those in previously reported method of GMO events (Wang et al., 2013; Mano et al., 2013; Jacchia et al., 2015). The repeatability and reproducibility of the method meet the acceptance criteria and performance requirements (European Network of GMO Laboratories (ENGL), 2015), indicating that the CC-2 specific method is stable, reliable, and suitable for quantifying CC-2. The analysis results demonstrate that the established event-specific real-time PCR system for CC-2 can generate accurate, repeatable, and comparable results across different laboratories.
3.8 Measurement uncertainty of the tested results
According to the guidance documents (Trapmann et al., 2007; Standardization ISO/TS 21748:2004), an estimation of measurement uncertainty (MU) was conducted for the quantitative results. This can be achieved by plotting a chart correlating repeatability standard deviation (sR value) in collaborative trials with the average number of blind samples tested (c), and calculating linear regression to estimate absolute standard uncertainty (u0) and relative standard uncertainty (RSU). The value of u0 is a constant equal to the intercept of linear regression (u0 = 0.0037), while RSU is equal to the slope of linear regression (RSU = 0.0384). The critical value (LC = 2 × u0) corresponds to a measurement result of 0.1% CC-2, indicating that if the estimated value is below 0.1%, it can be concluded with a confidence level of 95% that target CC-2 does not exist in the tested sample. The standard uncertainty associated with measurement results (u) is calculated using formula u = (0.00372 + (0.0384 × c)2) 1/2) (Figure 4). Typically, when reporting test results, an accompanying measurement uncertainty is provided as expanded uncertainty (U= 2 × u), which is derived from standard uncertainty using a coverage factor of 2.This corresponds approximately to a confidence level of about 95%. For blind samples S1-S5, respective values for c in measurement results are 5.083%, 2.071%, 1.049%, 0.503% and 0.102% (w/w).The U values for expanded uncertainties were calculated as follows: S1-0.144%, S2- 0.059%, S3-0.030%, S4-0.013% and S5-0.007%(w/w). Here, the uncertainty formula provides a closely approximate representation of the true distribution when laboratories utilize the CC-2 quantitative PCR method, offering a suitable level of precision for scientific research and analysis.
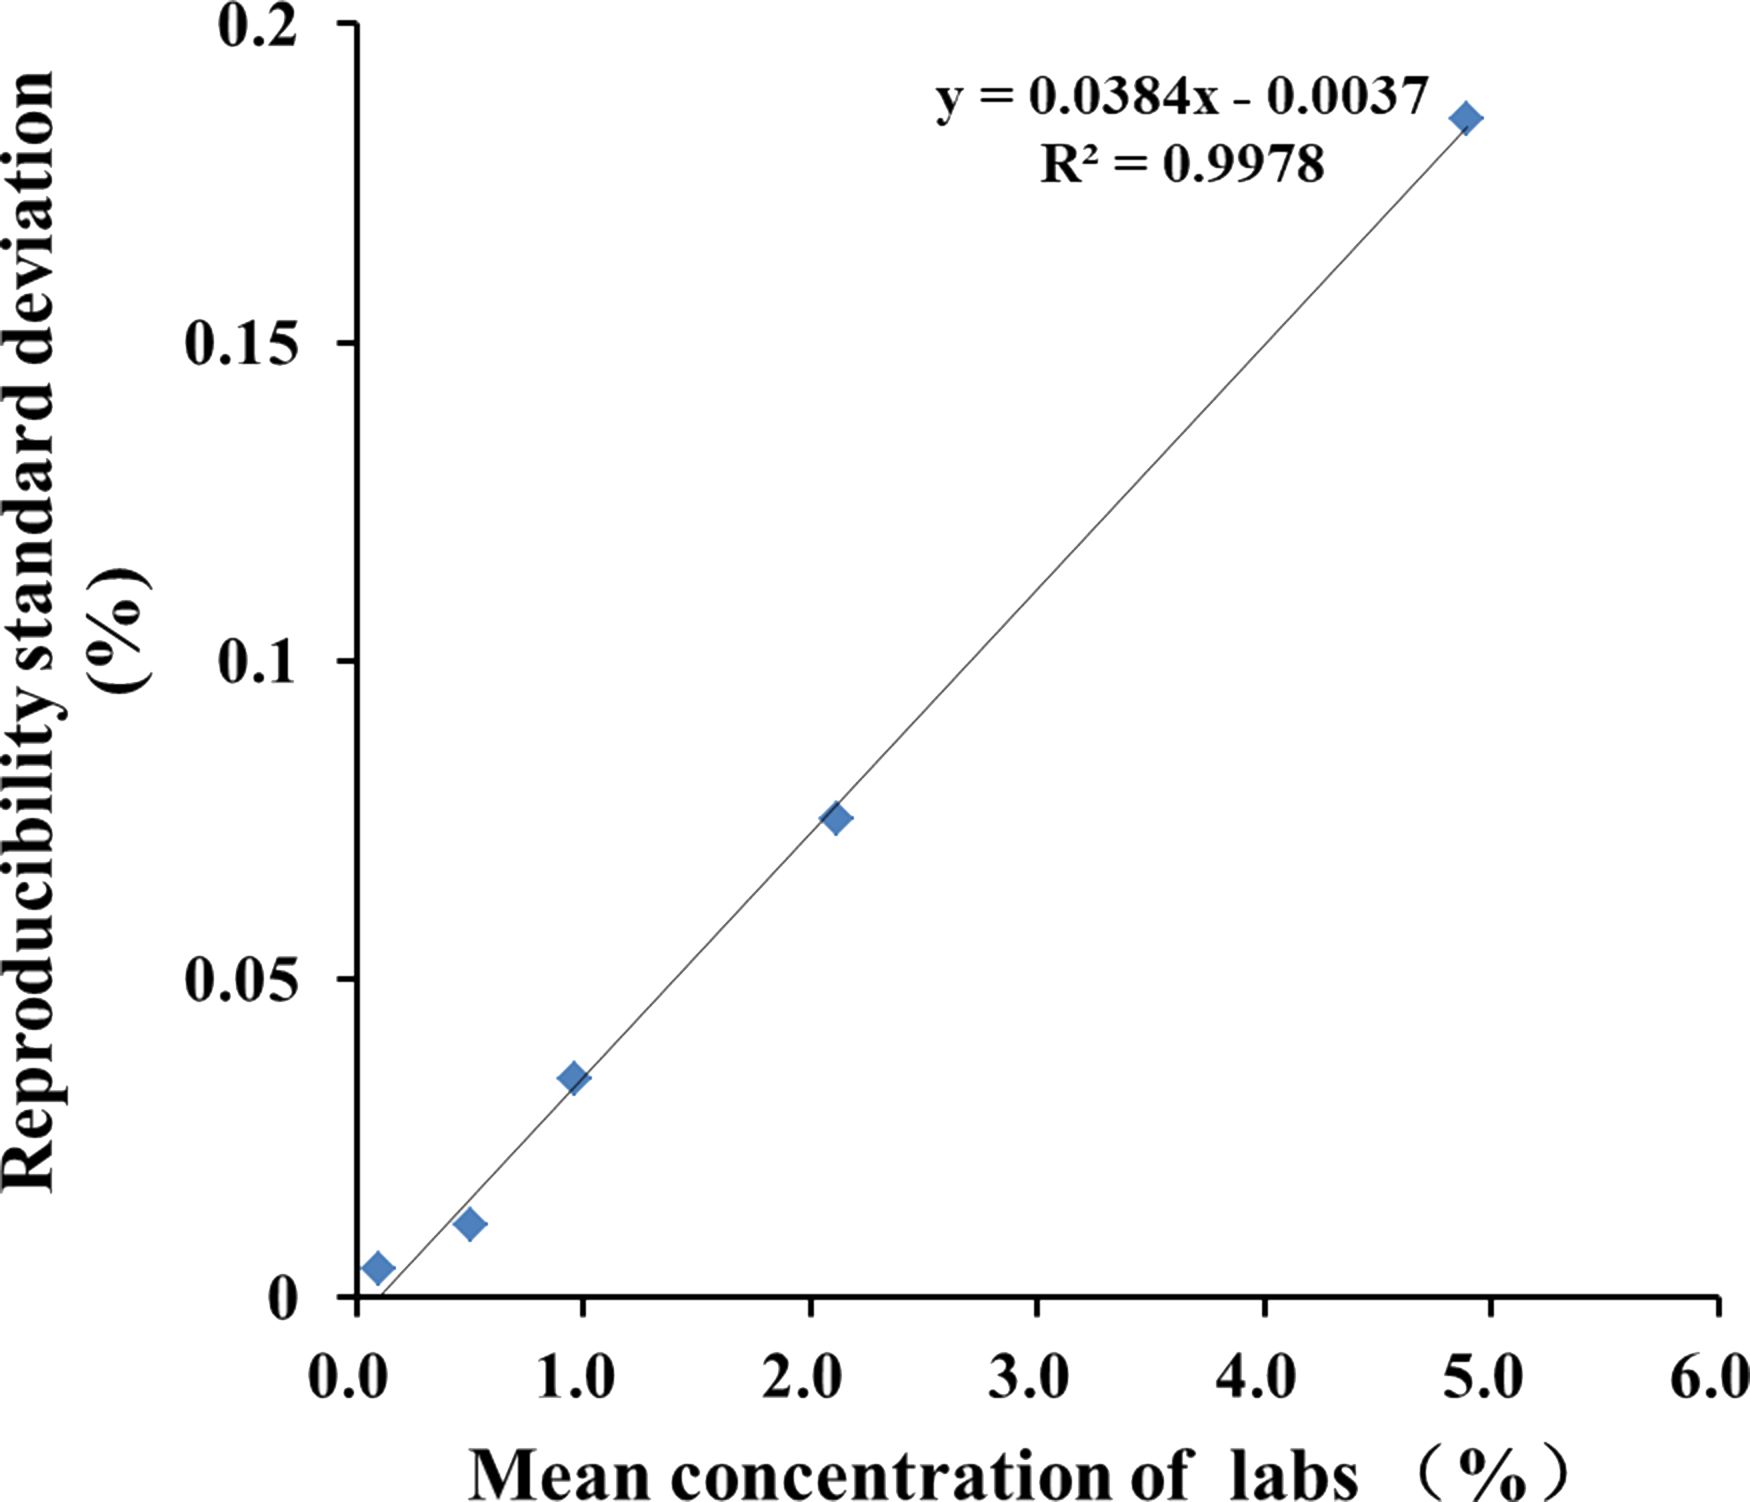
Figure 4. Linear regression produced by plotting mean measurement concentration (c) against reproducibility standard deviation (sR).
4 Conclusion
In this study, a novel real-time PCR-based analytical method was developed for the event-specific quantification of a genetically modified (GM) maize event CC-2. The specificity, sensitivity of these methods were determined with different concentrations of GM mixing samples. The LODs of these methods for CC-2 segment calculated as the amount of CC-2 were 0.05% or less. The limit of quantitation for the method was estimated to be 0.1% indicating that the LOQ of CC-2 was lower than 40 copies of maize haploid genome. The quantitative method was evaluated by means of blind tests in multi-laboratory trials. The trueness and precision were evaluated as the bias and reproducibility of relative standard deviation (RSD), and the determined bias and RSD values for the method were each less than 25%. These results suggest that the developed method would be suitable for practical analyses for the detection and quantification of CC-2. Furthermore, The uncertainty evaluation equation of the CC-2 method was established by the results from inter-laboratory verification to model the uncertainty arising from the relative repeatability standard deviation of inter-laboratory test values.
Data availability statement
The original contributions presented in the study are included in the article/Supplementary Material. Further inquiries can be directed to the corresponding author.
Author contributions
LL: Data curation, Methodology, Writing – original draft. NZ: Investigation, Visualization, Writing – original draft. ZX: Investigation, Visualization, Writing – original draft. YH: Investigation, Methodology, Writing – original draft. WY: Validation, Writing – original draft. LD: Validation, Writing – original draft. YM: Supervision, Writing – original draft. CL: Supervision, Writing – original draft. YX: Resources, Writing – original draft. NL: Writing – review & editing. WX: Resources, Writing – original draft. FL: Conceptualization, Methodology, Software, Supervision, Validation, Writing – review & editing.
Funding
The author(s) declare financial support was received for the research, authorship, and/or publication of this article. This work was supported by the National Biological Breeding - Major Project (grant no. 2022ZX0402010); Jilin Scientific and Technological Development Program, China (grant no. 20230508091RC); Agricultural Quality Standards and Testing Technology Institute Innovation fund Project (grant no. CXGC2023SJ107).
Conflict of interest
The authors declare that the research was conducted in the absence of any commercial or financial relationships that could be construed as a potential conflict of interest.
Publisher’s note
All claims expressed in this article are solely those of the authors and do not necessarily represent those of their affiliated organizations, or those of the publisher, the editors and the reviewers. Any product that may be evaluated in this article, or claim that may be made by its manufacturer, is not guaranteed or endorsed by the publisher.
Supplementary material
The Supplementary Material for this article can be found online at: https://www.frontiersin.org/articles/10.3389/fpls.2024.1460038/full#supplementary-material
References
Akinbo, O., Obukosia, S., Ouedraogo, J., Sinebo, W., Savadogo, M., Timpo, S., et al. (2021). Commercial release of genetically modified crops in Africa: interface between biosafety regulatory systems and varietal release systems. Front. Plant Sci. 12. doi: 10.3389/fpls.2021.605937
Arumuganathan, K., Earle, E. D. (1991). Nuclear DNA content of some important plant species. Plant Mol. Biol. Rep. 9(3), 208–219. doi: 10.1007/BF02672069
Avsar, B., Sadeghi, S., Turkec, A., Lucas, S. J. (2020). Identification and quantitation of genetically modified (GM) ingredients in maize, rice, soybean and wheat-containing retail foods and feeds in Turkey. J. Food Sci. Technol. 57, 787–793. doi: 10.1007/s13197-019-04080-2
Carzoli, A. K., Aboobucker, S. I., Sandall, L. L., Lübberstedt, T. T., Suza, W. P. (2018). Risks and opportunities of GM crops: Bt maize example. Global Food Secur. 19, 84–91. doi: 10.1016/j.gfs.2018.10.004
Chen, L., Zhong, R., Zhang, L., Zhang, H. (2019). The Chronic Effect of Transgenic Maize Line with mCry1Ac or maroACC Gene on Ileal Microbiota Using a Hen Model. Microorganisms 7, 92. doi: 10.3390/microorganisms7030092
European Commission Regulation(EC)No 1830/2003 (2003). Concerning the traceability and labelling of genetically modified organisms and the traceability of food and feed products produced from genetically modified organisms and amending Directive 2001/18/EC 268, 24–28.
European Network of GMO Laboratories (ENGL) (2015). Definition of Minimum Performance Requirements for Analytical Methods of GMO Testing. (European Network of GMO Laboratories (ENGL)). doi: 10.13140/RG.2.1.2060.5608
Fan, C. M., Wang, B. F., Song, X. Y. (2018). Effects of transgenic herbicide-resistant corn CC-2 with EPSPS gene cultivation on soil Collembola. J. Agro-Environment Sci. 37, 1203–1210. doi: 10.11654/jaes.2017-1423
Fraiture, M. A., Gobbo, A., Marchesi, U., Verginelli, D., Papazova, N., Roosens, N. H. C. (2021). Development of a real-time PCR marker targeting a new unauthorized genetically modified microorganism producing protease identified by DNA walking. Int. J. Food Microbiol. 354, 109330. doi: 10.1016/j.ijfoodmicro.2021.109330
Giraldo, P. A., Shinozuka, H., Spangenberg, G. C., Cogan, N. O. I., Smith, K. F. (2019). Safety assessment of genetically modified feed: is there any difference from food? Front. Plant Sci. 10. doi: 10.3389/fpls.2019.01592
GM AgbioInvestor Monitor (2024). Global GM Crop Area 2023 Review. Available online at: https://gm.agbioinvestor.com. (Accessed date June 15, 2024).
Gruère, G. P., Rao, S. R. (2007). A review of international labeling policies of genetically modified food to evaluate India’s proposed rule. Agbioforum 10, 51–64.
Guertler, P., Grohmann, L., Naumann, H., Pavlovic, M., Busch, U. (2019). Development of event-specific qPCR detection methods for genetically modified alfalfa events J101, J163 and KK179. Biomol Detect Quantif 17, 100076. doi: 10.1016/j.bdq.2018.12.001
Hougs, L., Gatto, F., Goerlich, O., Grohmann, L., Lieske, K., Mazzara, M., et al. (2017). Verification of analytical methods for GMO testing when implementing interlaboratory validated methods (Luxembourg: EUR 29015 EN, Publication Office of the European Union), ISBN: ISBN 978-92-79-77310-5. JRC 109940. doi: 10.2760/645114
ISAAA (2021). Global status of commercialized biotech/GM crops in 2019: Biotech Crops Drive Socio-Economic Development and Sustainable Environment in the New Frontier (Ithaca, NY: ISAAA Brief No.55. ISAAA). Available at: https://www.isaaa.org/resources/publications/briefs/55/default.asp.
Jacchia, S., Nardini, E., Savini, C., Petrillo, M., Angers-Loustau, A., Shim, J.-H., et al. (2015). Development, optimization, and single laboratory validation of an event-specific real-time PCR method for the detection and quantification of golden rice 2 using a novel taxon-specific assay. J. Agric. Food Chem. 63, 1711–1721. doi: 10.1021/jf505516y
Li, Y., Hallerman, E. M., Peng, Y. (2020). Excessive Chinese concerns over genetically engineered food safety are unjustified. Nat. Plants 6, 590–590. doi: 10.1038/s41477-020-0685-4
Li, Z., Li, X., Wang, C., Song, G., Pi, L., Zheng, L., et al. (2017). One novel multiple-target plasmid reference molecule targeting eight genetically modified canola events for genetically modified canola detection. J. Of Agric. And Food Chem. 65, 8489–8500. doi: 10.1021/acs.jafc.7b02453
Li, Y., Xiao, F., Zhai, C., Li, X., Wu, Y., Gao, H., et al. (2022). Qualitative and quantitative real-time PCR methods for assessing false-positive rates in genetically modified organisms based on the microbial-infection-linked HPT gene. Int. J. Mol. Sci. 23, 10000. doi: 10.3390/ijms231710000
Mano, J., Masubuchi, T., Hatano, S., Futo, S., Koiwa, T., Minegishi, Y., et al. (2013). Development and validation of event-specific quantitative PCR method for genetically modified maize LY038. Journa Food Hygienic Soc. Japan 54, 25–30. doi: 10.3358/shokueishi.54.25
Meng, Y., Wang, S., Guo, J., Yang, L. (2022). Collaborative ring trial of the applicability of a reference plasmid DNA Calibrant in the quantitative analysis of GM maize event MON810. Foods 11, 1538. doi: 10.3390/foods11111538
Trapmann, S., Burns, M., Broll, H., Macarthur, R., Wood, R., Zel, J. (2007). Guidance Document on Measurement Uncertainty for GMO Testing Laboratories. EUR 22756 EN. 2007. JRC37201. Available online at: https://publications.jrc.ec.europa.eu/repository/handle/JRC37201. (Accessed date June 01, 2024).
Turkec, A., Lucas, S. J., Karlık, E. (2015). Monitoring the prevalence of genetically modified maize in commercial animal feeds and food products in Turkey. J. Sci. Food Agric. 96, 3173–3179. doi: 10.1002/jsfa.7496
Wang, H., Qian, C., Su, C., Duan, Y., Bai, H. (2013). Rapid real-time PCR detection of transgenic cry1C rice using plasmid molecule as calibrator. Eur. Food Res. Technol. 237, 101–107. doi: 10.1007/s00217-013-1957-2
Yang, L., Xu, S., Pan, A., Yin, C., Zhang, K., Wang, Z., et al. (2005). Event specific qualitative and quantitative polymerase chain reaction detection of genetically modified MON863 maize based on the 5'-transgene integration sequence. J. Of Agric. And Food Chem. 53, 9312–9318. doi: 10.1021/jf051782o
Keywords: genetically modified maize CC-2, event-specific PCR, quantification, real-time quantitative PCR, detection, validation
Citation: Long L, Zhao N, Li C, He Y, Dong L, Yan W, Xing Z, Xia W, Ma Y, Xie Y, Liu N and Li F (2024) Development and collaborative validation of an event-specific quantitative real-time PCR method for detection of genetically modified CC-2 maize. Front. Plant Sci. 15:1460038. doi: 10.3389/fpls.2024.1460038
Received: 05 July 2024; Accepted: 20 August 2024;
Published: 10 September 2024.
Edited by:
Yuri Shavrukov, Flinders University, AustraliaReviewed by:
Sławomir Sowa, Plant Breeding and Acclimatization Institute, PolandTheo Prins, Wageningen University and Research, Netherlands
Copyright © 2024 Long, Zhao, Li, He, Dong, Yan, Xing, Xia, Ma, Xie, Liu and Li. This is an open-access article distributed under the terms of the Creative Commons Attribution License (CC BY). The use, distribution or reproduction in other forums is permitted, provided the original author(s) and the copyright owner(s) are credited and that the original publication in this journal is cited, in accordance with accepted academic practice. No use, distribution or reproduction is permitted which does not comply with these terms.
*Correspondence: Feiwu Li, bGlmZWl3dTMzOTRAc2luYS5jb20=
 Likun Long
 Yuxuan He
 Feiwu Li

