
94% of researchers rate our articles as excellent or good
Learn more about the work of our research integrity team to safeguard the quality of each article we publish.
Find out more
ORIGINAL RESEARCH article
Front. Plant Sci., 26 August 2024
Sec. Functional and Applied Plant Genomics
Volume 15 - 2024 | https://doi.org/10.3389/fpls.2024.1449006
 Shengchang Duan1,2,3†
 Liang Yan4,5†
 Zongfang Shen6,7,8†
 Xuzhen Li1
 Baozheng Chen9
 Dawei Li1Hantao Qin6,8
 Muditha K. Meegahakumbura6,10
 Moses C. Wambulwa6,7,11
 Lianming Gao6,12*
 Wei Chen2,3*
 Yang Dong2,3*Jun Sheng2,3*
The genus Camellia contains three types of domesticates that meet various needs of ancient humans: the ornamental C. japonica, the edible oil-producing C. oleifera, and the beverage-purposed tea plant C. sinensis. The genomic drivers of the functional diversification of Camellia domesticates remain unknown. Here, we present the genomic variations of 625 Camellia accessions based on a new genome assembly of C. sinensis var. assamica (‘YK10’), which consists of 15 pseudo-chromosomes with a total length of 3.35 Gb and a contig N50 of 816,948 bp. These accessions were mainly distributed in East Asia, South Asia, Southeast Asia, and Africa. We profiled the population and subpopulation structure in tea tree Camellia to find new evidence for the parallel domestication of C. sinensis var. assamica (CSA) and C. sinensis var. sinensis (CSS). We also identified candidate genes associated with traits differentiating CSA, CSS, oilseed Camellia, and ornamental Camellia cultivars. Our results provide a unique global view of the genetic diversification of Camellia domesticates and provide valuable resources for ongoing functional and molecular breeding research.
Human ancestors working in agriculture transformed wild plant species into new forms and established all major domesticated crops with desirable traits to meet human needs worldwide (Doebley et al., 2006). Prominent examples include rice, wheat, and maize as staple foods (Doebley et al., 2006), peanut and sesame for oil production (Wei et al., 2015), and cotton for natural fibers (Wang et al., 2019). Through artificial selection, these crops obtain better grain quality (changes in starch and other compounds), higher yield, and altered flowering time or plant height (Gross and Olsen, 2010) due to underlying genetic changes. Crop improvement and diversification would produce different varieties within a single species, but the genetic drivers of trait diversification remain unknown in many less-studied horticultural plants.
The Camellia plants in the Theaceae family are native to East Asia, with more than 300 species worldwide (Zeng and Endo, 2019). Three types of plants, including ornamental Camellia, oilseed Camellia, and tea plants, played indispensable roles in meeting the varied needs of human life (Teixeira and Sousa, 2021). The ornamental Camellia, prized for its exquisite, long-lasting flowers and deep green foliage, boasts over 30,000 cultivars in various flower forms and colors. The oilseed Camellia (i.e., C. oleifera) has been continuously selected for larger seeds with high content and quality of unsaturated fatty acid over the centuries (Lin et al., 2022). The tea plant (C. sinensis), including two varieties, C. sinensis var. assamica (CSA) and C. sinensis var. sinensis (CSS), has been commercially grown in more than 60 countries as a popular beverage (Drew, 2019). Despite the trait diversification of Camellia domesticates, the underlying genomic basis for the evolutionary course remains poorly understood.
Researchers reported many Camellia genomes recently from tea plants (Xia et al., 2017; Wei et al., 2018; Wang et al., 2020; Xia et al., 2020; Zhang et al., 2020a, 2020, 2021) and oilseed Camellia (Lin et al., 2022). These studies identified genes involved in the biosynthesis of terpenoids and fatty acids, but it is unknown if they bear signatures of human selection. Among tea plants, ‘Yunkang10’ (CSA, ‘YK10’) is a widely cultivated cultivar in Southwestern China. It was recognized as a national fine variety and bred from Fengqing large leaf variety of Yunnan Academy of Agricultural Sciences Tea Research Institute (Zhang et al., 2020c; Lei et al., 2021). It bears the advantages of wide-range adaptability, low-cost cultivation, and quick growth rate over other cultivars (Zhang et al., 2020c). The reported genome of ‘YK10’ (Xia et al., 2017) had poor continuity (contigs N50 = 19,958 bp), and the lack of high-quality CSA genomes warrants obtaining a high-quality genome assembly of the ‘YK10’.
In addition, analyses of population structure and genetic diversity in tea plants yielded two competing theories for its evolution history (Wang et al., 2020; Xia et al., 2020; Zhang et al., 2020b, 2021). The researchers proposed that either two tea varieties (CSS and CSA) underwent parallel domestication (Zhang et al., 2021) or they resulted from a single origin in Southwestern China (Xia et al., 2020). In comparison, oilseed Camellia and ornamental Camellia populations showed a high genetic diversity (Lin et al., 2022; Yang et al., 2022). Previous reports also showed that simple sequence repeat (SSR) markers could differentiate ornamental Camellia populations in northern and southern China according to their geographical origin and genetic background (Yang et al., 2022). In contrast, the C. oleifera cultivars were mainly distinguished by their morphological characteristics rather than geographic origin, based on 25,581 SNPs from transcriptome sequencing data of 221 oilseed Camellia cultivars (Lin et al., 2022). Despite these advances, additional analyses of a comprehensive collection of cultivars may add to our understanding of the complex evolutionary history of Camellia.
Here, we report the genome of ‘YK10’, the resequencing of 625 Camellia accessions, and the pan-genome of 206 core cultivars. We evaluated the phylogeny, population structure, and trait diversification of Camellia species, which provided insights into the evolution, domestication, and dispersal of this economically significant perennial horticultural plant.
The leaves of ‘YK10’ were sampled from Lincang, Yunnan province of China. Genomic DNA for sequencing was extracted from leaves using the cetyltrimethylammonium bromide (CTAB) method. 50 mg DNA was used to construct the PacBio Sequel sequencing libraries, producing raw PacBio reads after sequencing. Paired-end libraries with insert sizes of 292, 319, 340, 394, 448, 514, 578, 812, and 904 bp were constructed using NEBNext Ultra II DNA Library Prep Kit for Illumina (NEB, USA). All the constructed libraries were sequenced on an Illumina HiSeq2500 platform (Illumina, USA) with a PE-100 module. The raw data were filtered by removing reads with more than 5% N or more than 40 bp low-quality bases (Q20). Moreover, only one copy of any duplicated paired-end reads was retained. The clean data was employed to correct the CANU-assembled genome.
All paired-end Illumina raw reads were subjected to the 21 k-mer frequency distribution analysis using Jellyfish (Version: 2.2.10) (Marcais and Kingsford, 2011). The result was fed to GenomeScope2 (Version: 2.0) (Ranallo-Benavidez et al., 2020) to estimate the genome size.
After automatic assembly was performed using CANU (Version: v1.8) (Koren et al., 2017) based on PacBio data with parameters “useGrid = true; minThreads=4; genomeSize=3000m; minOverlapLength = 700; minReadLength = 1000”, the assembled contigs were polished with clean NGS reads using Pilon (Version 1.23) (Walker et al., 2014). The polished contigs were further assembled using HERA (Du and Liang, 2019) with parameters “InterIncluded_Side=30000; InterIncluded_Identity=99; InterIncluded_Coverage=99; MinIdentity=97; MinCoverage=90; MinLength=5000; MinIdentity_Overlap=97; MinOverlap_Overlap=1000; MaxOverhang_Overlap=100; MinExtend_Overlap=500”.
The contigs were scaffolded with optical mapping using the SAPHYR optical mapping technology (BioNano Genomics). High molecular weight DNA with a fragment distribution greater than 150 kb was isolated using BioNano sample preparation kits (BioNano Genomics). Sequence-specific labeling of genomic DNA (gDNA) for BioNano mapping was prepared by Nicking, Labeling, Repairing, and Staining (NLRS). 600 ng of the isolated DNA was used for subsequent DNA nicking using Nt.BssSI (NEB) incubating for 2 hours at 37°C. The nicks were labeled according to the instructions provided with the BioNano Prep NLRS Labeling Kit (BioNano Genomics). The labeled DNA sample was loaded onto the Saphyr Chip nanochannel array (BioNano Genomics) and imaged using the Saphyr system and associated software (BioNano Genomics) according to the Saphyr System User Guide. The Sovle (Version: 3.1_08232017; BioNano Genomics) software package (parameters: -B 1 -N 2) was used to assemble the maps and construct scaffolds.
The software Redundans.py with parameters “–identity 0.55 –overlap 0.80 –noscaffolding –nogapclosing” was performed to resolve the redundancy in the genome first, and then the scaffolds were aligned all-to-all using BWA-MEM (Version: 0.7.12) (Li and Durbin, 2009). The coverage ratio was calculated as the length of synteny region/total length for an aligned length greater than 1 kb and identity above 96%. The sequences with more than 99% coverage ratio were filtered out.
After removing these heterozygous sequences, the remaining sequences were clustered using Hi-C data based on 3d-dna (Version: 180419) (Dudchenko et al., 2017). The Hi-C library was prepared by NowBio Biotechnology Co., Ltd (Yunnan, China), and then the library was sequenced on an Illumina NovaSeq platform. The clean Hi-C reads were mapped to the draft assembly with juicer (juicer_tools.1.7.6_jcuda.0.8.jar) (Durand et al., 2016). A candidate chromosome-scale assembly was generated automatically using a 3d-dna pipeline (Dudchenko et al., 2017). Manual review and refinement of the candidate assembly were performed in Juicebox Assembly Tools (Version 1.9.1) (Durand et al., 2016) for quality control and interactive correction. Then, the genome was re-assembled using 3d-dna (Dudchenko et al., 2017) according to manually adjust. With the modified 3d-dna and Juicebox workflow, 15 chromosomes were anchored. We performed BUSCO (v5.4.4) (Simao et al., 2015) assessments on the assembly using the embryophyte_odb10 lineage dataset (creation date: 2020-09-10, number of BUSCOs: 1,614).
‘YK10’ leaves were collected at the shoot, mature, and late developmental stages. 3μg of total RNA per sample was used as input material for the RNA sample preparation. Beads with oligo (dT) were used to isolate poly(A) mRNA from total RNA. RNA sequencing libraries were constructed from these mRNA using the TruSeq RNA Sample Preparation Kit (Illumina, San Diego, USA). The resulting libraries were sequenced using the PE150 module of the Illumina platform. In addition, the Iso-Seq library for leaf tissue was prepared according to the Isoform Sequencing protocol (Iso-Seq) using the Clontech SMARTer PCR cDNA Synthesis Kit and the BluePippin Size Selection System protocol as described by Pacific Biosciences. Then, the library was sequenced on a PacBio Sequel System.
First, we searched for tandem repeats across the genome using Tandem Repeat Finder (TRF, Version: 4.09) (Benson, 1999). The transposable elements (TEs) in the genome were identified by combining homology-based and de novo approaches. For homolog-based prediction, known repeats were identified using RepeatMasker (Version: open-4.0.9) (Tarailo-Graovac and Chen, 2009) and RepeatProteinMask (Tarailo-Graovac and Chen, 2009) against Repbase (Jurka et al., 2005) (Repbase Release 20181026). For de novo prediction, LTR FINDER (Version: v1.07) (Xu and Wang, 2007) and LTRharvest in GenomeTools (Version: 1.5.10) (Ellinghaus et al., 2008; Gremme et al., 2013) were used to predict LTR retrotransposons, and the results were integrated using LTR_retriever (Version: v2.8) (Ou and Jiang, 2018). Furthermore, RepeatModeler (Version: 2.0; http://repeatmasker.org/) was also used to identify repeats from the assembled genome. The results of LTR_retriever and RepeatModeler were merged as a custom library and fed to RepeatMasker to predict TEs. The assembly index (LAI) and LTR insert time analyses were based on the LTR_retriever results (Ou and Jiang, 2018). The insertion time was calculated according to the formula Time=Ks/2μ (μ = 6.5×10⁻⁹ mutations per site per year) (Wang et al., 2020).
Finally, these TE sequences were classified according to their characteristics using TEsorter (https://github.com/zhangrengang/TEsorter) based on the REXdb database (viridiplantae_v3.0) (Neumann et al., 2019). For non-autonomous TEs that lack protein domains, such as SINEs, were classified according to their best-hit sequences using the method above. LTR-retrotransposon sequences encoding reverse transcriptase (RT) protein domains were extracted and used to construct a phylogenetic tree using FastTree (Price et al., 2010). The tree was created for each lineage of TEs separately. For rooting, we included ten sequences from other lineages. Ty3/gypsy Retand sequences were included as an outgroup for Ty1/Copia Angela and Ty1/Copia Ivana trees. Ty3/Gypsy Athila trees were rooted using Ty1/copia Angela.
We employed EVidence Modeler (EVM) (Haas et al., 2008) to consolidate RNA-seq-based, de novo, and homolog-based predictions into a final gene set. For RNA-seq-based gene prediction, the reads of Illumina transcriptome were cleaned with Trimmomatic (Bolger et al., 2014) and aligned to the genome with HISAT2 (Version: 2.2.0) (Kim et al., 2019). Alignments were assembled independently with StringTie (Version: 2.1.4) (Kovaka et al., 2019). For de novo gene prediction, the clean reads of Illumina transcriptome were assembled using Trinity (Version: v2.14.0) (Grabherr et al., 2011). Full-length transcriptomes were managed with the SMRT Analysis software suite (PacBio, Version: release_6.0.0.47841) and resulted in a set of full-length transcripts. RNA-seq assemblies and full-length transcripts were combined and further refined using PASA (Haas et al., 2008), and a high-quality training set was generated using the PASA assemblies. Then Augustus (Stanke et al., 2008) was performed with this training set. Three additional ab initio gene predictions, GlimmerHMM (Majoros et al., 2004), GENSCAN (Burge and Karlin, 1997), and SNAP (Korf, 2004) were also used. Protein sequences of C. sinensis var. assamica (CSA) (Xia et al., 2017) and C. sinensis var. sinensis (CSS) (Wei et al., 2018) were used for homolog-based gene annotation. After mapping the protein sequences to the ‘YK10’ genome using tblastn, protein-coding regions were obtained by extending 2,000 bp upstream and downstream of the matching DNA sequences. GeneWise (Birney and Durbin, 2000) was then used to predict gene structure within each protein-coding region. All lines of evidence were then fed to EVM using intuitive weight (RNAseq > cDNA/protein > de novo gene predictions). Finally, EVM models were updated with PASA. The genes were filtered if the proportion of repeats was more than 50% or the CDS was less than 300 nt.
Gene functions were assigned according to the best match alignment using eggNOG-mapper (Huerta-Cepas et al., 2017) against the eggNOG5.0 database. KEGG enrichment was performed using TBtools (Chen et al., 2020).
We downloaded and assembled the RNA sequencing data for the C. japonica cultivar ‘Jiangxue’ (PRJNA325385; (Li et al., 2016b). The data of three biological replicates for CK were used in our assembly. The transcriptome was de novo assembled using Trinity (Version: v2.14.0) (Grabherr et al., 2011) and filtered using CD-HIT-EST with parameter “-c 0.95” (Li and Godzik, 2006). Then, TransDecoder (Version: v5.5.0, https://github.com/TransDecoder/TransDecoder) was used to identify coding regions. Here, to maximize sensitivity for capturing ORFs, all ORFs were scanned for homology to known proteins dataset of ‘YK10’, TGY (CSS Chinese Oolong tea variety ‘Tieguanyin’) (Zhang et al., 2021), DASZ (an ancient tea tree) (Zhang et al., 2020b), and CON (wild oilseed Camellia, C. oleifera var. ‘Nanyongensis’) (Lin et al., 2022). The alternative splicing was filtered by CD-HIT-EST with the parameter “-c 0.9”. This step yielded 46,312 protein-coding genes and captured 87.7% complete orthologs (81.6% complete and single-copy orthologs and 6.1% complete and duplicated orthologs) in embryophyte_obd10 (Creation: 2020-09-10, number of BUSCOs: 1614) using BUSCO (Version: 5.4.2) (Simao et al., 2015).
The gene families cluster was performed with protein-coding genes of ‘YK10’, TGY, DASZ, CON, C. japonica, and Actinidia chinensis cultivar ‘Hongyang’ (Kiwifruit) (Yue et al., 2022) using OrthoFinder (Version: 2.5.4) (Emms and Kelly, 2019). The alignment of multiple single-copy orthologous genes and corresponding rooted species tree generating with OrthoFinder were fed to MCMCTREE in the PAML package (Version: 4.9j) (Yang, 2007) to infer the species divergence times. To estimate each species’ divergence time, the known divergence times between these species were collected from http://timetree.org. Based on the calculated phylogeny and divergence times, CAFE5 (Mendes et al., 2020) was applied to identify whether gene families had undergone expansion or contraction. The Gamma model with two gamma rate categories and the root equilibrium frequency with Poisson distribution were set.
All-to-all BLASTP analysis of protein sequences was performed within YK10, TGY, DASZ, and CON, respectively, using an e-value cutoff of 1e-10. Syntenic regions within each species were then identified using MCscanX (Wang et al., 2012) based on the all-to-all BLASTP results. Protein sequences of homologous gene pairs in the identified syntenic regions were first aligned using MUSCLE (Edgar, 2004), and the protein alignments were then converted to the CDS alignments. Finally, synonymous substitution rates (Ks) were calculated on these CDS alignments using KaKs_Calculator (Version: 1.2) (Zhang et al., 2006) with the NG method.
486 Camellia accessions were obtained from the sampling place, containing 15 Other Camellia accessions (other species in Camellia), 21 ornamental Camellia accessions, 23 oilseed Camellia accessions, 54 Wild Tea accessions, 20 Hybrid accessions (C. sinensis var. assamica × C. sinensis var. sinensis), 246 CSA accessions (C. sinensis var. assamica) and 107 CSS accessions (C. sinensis var. sinensis). In addition, 139 accessions (1 oilseed Camellia accession, 13 Wild Tea accessions, 5 Hybrid accessions, 37 CSA accessions, and 83 CSS accessions) in a previous paper (Wang et al., 2020) were also used for resequencing analysis. Young leaves were collected from the plants and snap-frozen in liquid nitrogen. Total DNA was extracted with the DNAsecure plant kit (Tiangen, Beijing). 2 µg genomic DNA from each accession was used to construct a sequencing library following the manufacturer’s instructions using NEBNext Ultra DNA Library Prep Kit (NEB, USA). Paired-end sequencing libraries with an insert size of approximately 400 bp were sequenced on an Illumina NovaSeq 6000 sequencer at Novogene (Beijing, China). Paired-end resequencing reads were filtered using NGSQCToolkit_v2.3.3 (Patel and Jain, 2012), removing reads containing adapter or poly-N and low-quality reads (reads with >40% bases having Phred quality ≤ 20) from the raw data. Reads shorter than 70bp were discarded, and the yielded clean data were used for downstream analyses.
Paired-end reads were mapped to the ‘YK10’ genome using bwa-mem2 (Version: 2.0pre1) (Md et al., 2019) with the default parameters. SAMtools (Version: 1.3.1) (Li et al., 2009) converted mapping results into the BAM format. After sorting the mapping results, duplicated reads were marked with the Picard package (picard.sourceforge.net, Version: 2.1.1). The reads around indels were then realigned using Genome Analysis Toolkit (GATK, version 3.3-0-g37228af) (McKenna et al., 2010).
The variation detection followed the best practice workflow recommended by GATK (McKenna et al., 2010). In brief, the variants were called for each accession with GATK HaplotypeCaller (McKenna et al., 2010) with a joint genotyping step. In the filtering step, the SNP filter expression was set as “QD < 2.0 || MQ < 40.0 || FS > 60.0 || SOR > 5.0 || MQRankSum < -12.5 || ReadPosRankSum < -8.0 || QUAL < 30”, and the Indel filter expression was set as “QD < 2.0 || ReadPosRankSum < -20.0 || InbreedingCoeff < -0.8 || FS > 200.0 || SOR >10.0 || QUAL < 30”. Only insertions and deletions shorter than or equal to 40 bp were considered. Indels and SNPs with non-biallelic were removed, which yielded the basic set. SNPs with MAF < 0.05 and >50% missing calls were further removed for phylogenetic tree structure, population structure analyses, and IBS calculation (the core set).
SNPs and Indels annotation were performed according to the ‘YK10’ genome using ANNOVAR (Version: 2015-12-14) (Wang et al., 2010). The coverage of each accession against each chromosome of the ‘YK10’ genome was counted based on the aligned BAM file using SAMtools (Version: 1.3.1) (Li et al., 2009). A 100 kb sliding window approach was applied to quantify genetic differentiation (FST) and polymorphism levels (π, pairwise nucleotide variation as a measure of variability) using VCFtools (v0.1.16) (Danecek et al., 2011).
Whole-genome SNPs were used to construct the ML (Maximum likelihood method) phylogenetic tree with 100 bootstraps using SNPhylo (Version: 20140701) (Lee et al., 2014). C. cuspidata (KM6) was used to provide outgroup information. The iTOL tool (http://itol.embl.de) was used to color the phylogenetic tree.
SNPs in linkage disequilibrium (LD) were filtered using PLINK (Version v1.90b3.38) (Purcell et al., 2007) with a window size of 50 SNPs (advancing 5 SNPs at a time) and an r2 threshold of 0.5. Population structure was analyzed using ADMIXTURE (Version: 1.3) (Alexander et al., 2009) with a block-relaxation algorithm. To explore the convergence of individuals, we predefined the number of genetic clusters K from 2-8 and ran the cross-validation error (CV) procedure with default methods and settings.
Genetic distances among and within each accession were calculated based on LD pruned SNPs using PLINK with the formulation 1-IBS, where IBS is identity by state. The CMDSCALE function in R was used to calculate eigenvectors (Mardia, 1978) based on the distance matrix. Formal clustering with the PAM method and filtering based on each cluster’s silhouette scores computed by the DISCRETIZE algorithm were performed with the IBS distance matrix using an available R script (https://github.com/grafau/discretize), which was previously described (Gutaker et al., 2020). Clustering and discretization were carried out independently for clusters k, ranging from 2 to 9. The remaining 443 accessions in the corresponding group with k=5 were selected and filtered to remove outliers based on the phylogenetic tree. The filtered accessions were used for subsequent analysis.
Relationships between each accession were verified using KING (Version: 2.2.5) (Manichaikul et al., 2010) based on the basic set of SNPs. Close relatives were inferred based on the estimated kinship coefficients as shown in the following algorithm: an estimated kinship coefficient range >0.354, [0.177, 0.354], [0.0884, 0.177] and [0.0442, 0.0884] correspond to duplicate, 1st-degree, 2nd-degree, and 3rd-degree relationships, respectively. The duplicate accessions were removed from subsequent group analysis.
RAiSD (Raised Accuracy in Sweep Detection, Version 2.9) (Alachiotis and Pavlidis, 2018) was used to detect signatures of selective sweeps based on the μ statistics in ornamental Camellia, oilseed Camellia, Wild Tea, CSA 1, CSA 2, and CSS group, respectively. The significant threshold for μ statistic score was set as top 0.5%.
LD was calculated using PopLDdecay (Version: v3.41) (Zhang et al., 2019). The pairwise r2 values within and between different chromosomes were calculated. The LD for each group was calculated using SNP pairs only from the corresponding group.
The Pairwise Sequentially Markovian Coalescent (PSMC) model (Sun and An, 2005) was used to reconstruct the demographic history of each tea accession. Parameters were set as follows: -N25, -t15, -r5 and -p ‘4 + 25*2 + 4+6’. The estimated time to the most recent common ancestor (TMRCA) was given in units of 2N0 time, and the relative population size (Ne) at state t was scaled to N0 (the present effective population size). Then, the neutral mutation rate (6.1 × 10⁻⁹ mutations per site per year) was used to scale the TMRCA and Ne values into chronological time. For plotting, accessions were grouped by their populations.
SMC++ (version: v1.15.4.dev16+g72ea2e2) (Terhorst et al., 2017) was employed to infer population size histories and split times between the CSA 2 and CSS groups. The analysis was performed by testing the treatment of runs of homozygosity longer than 50, 100, and 200 kb as missing or not (no mask). A mutation rate of 6.1 × 10⁻⁹ mutations per site per year was used to convert the scaled times and population sizes into real times and sizes.
After clustering, discretization, and removing duplicate accessions, the CSA 1 (54), CSA 2 (98), and CSS (176) tea accessions were analyzed using self-organizing maps (SOM) machine learning. SNPs with MAF > 0.05 and no missing genotypes were selected. SNPs in linkage disequilibrium were filtered using PLINK (Version v1.90b3.38) (Purcell et al., 2007) with parameter “–indep-pairwise 50 1 0.5”. Then, SNP-genotypes were coded with the integers: 0 - homozygous major alleles genotype, 1 - heterozygous alleles genotype, and 2 - homozygous minor allele genotype. The datasets were feature-centralized and clustered using SOM machine learning (Wirth et al., 2011). SOM was implemented in “oposSOM” R package (Löffler-Wirth et al., 2015).
We estimated admixture graphs in SOM-defined tea clusters using TreeMix (Version: 1.12) (Pickrell and Pritchard, 2012), employing a Maximum Likelihood (ML) method based on a Gaussian model of allele frequency change. Migration events (m) were set from 1 to 5. The bootstrap values were calculated with 1,000 replicates, using the Wild Tea group as the root. Each migration event was run ten times with a random seed. The optimal number of migration edges was estimated using an R package “OptM” (Version: v0.1.6) (Fitak, 2021). Node robustness was estimated with 100 bootstrap replicates and plotted using the treemix.bootstrap function in BITE (Version: v1.2.0008) (Milanesi et al., 2017).
We compiled 5,415 occurrence records for C. sinensis (L.) Kuntze from the Global Biodiversity Information Facility (GBIF, www.gbif.org). Duplicate records and those lacking location data were omitted, and longitude and latitude were supplemented according to the locality. The filtered occurrences were further thinned to ensure records were at least 50 km apart using the R package “spThin” (Aiello-Lammens et al., 2015), resulting in 459 records. Rasters of 19 bioclimatic variables at 2.5-minute resolution for Last Glacial Maximum (LGM, ca. 21 ka, v1.2b), early-Holocene (EH, Greenlandian, 11.7-8.326 ka, v1.0), mid-Holocene (MH, Northgrippian, 8.326-4.2 ka, v1.0), late-Holocene (LH, Meghalayan, 4.2-0.3 ka, v1.0) and Current (1979-2013, Anthropocene, v1.2b) paleoclimate data were obtained from PaleoClim (Brown et al., 2018). The ecological niche models were run over all combinations of the defined settings and evaluated with cross-validation using the R package “ENMeval” (Muscarella et al., 2014). The setting of LQHP_2 (here: L: Linear features; Q: Quadratic features; H: Hinge features; P: Product features; 2: Regularization multiplier value), LQHPT_3 (T: Threshold features), LQHPT_2.5, H_2.5 and L_3 were used to measure variable importance for each period. Habitat suitability projections for the four periods were generated using MaxEnt (Version: 3.4.4) (Phillips et al., 2017) with ENMeval results, ten subsample replicated runs, and a 30% random test.
The accessions used for pan-genome analysis were selected according to manual screening and SVCollector (Ranallo-Benavidez et al., 2021). The manual screening followed these principles: (1) remove accessions with sequencing depth lower than 7 ×; (2) remove hybrid accessions; (3) remove the potentially wrong accessions whose position in the SNPs’ phylogenetic tree was incongruent with the accession information; (4) just keep one accession if there were multiple cultivars; (5) retain one accession per species in a clade of the SNPs’ phylogenetic tree for ornamental Camellia, oilseed Camellia, and Wild Tea groups. After combining accessions selected by the two methods, accessions were further removed if they were not in the accession pool, resulting in clustering, discretization, and removing duplicate accessions. After the above filtering step, sequences of 206 tea accessions were used for the pan-genome construction.
Raw reads of selected accessions were processed to remove duplicated reads using Nubeam-dedup (Dai and Guan, 2020). Then, the adapters and low-quality sequences were trimmed using Trimmomatic (Version: 0.39) (Bolger et al., 2014) with parameters ‘SLIDINGWINDOW:4:20 MINLEN:50’. The final cleaned reads of each accession were de novo assembled using Megahit (Version: v1.2.9) (Li et al., 2016a) with default parameters. The non-reference sequences were identified according to the previous description (Gao et al., 2019). In brief, the assembled contigs with lengths longer than 500 bp were selected and aligned to ‘YK10’ genomes using Mummer (Version: 4.0.0beta2) (Delcher et al., 2003). If the continuous alignment was longer than 300 bp with sequence identity higher than 86%, and the continuous unaligned regions were longer than 500 bp, then the unaligned regions were extracted as unaligned sequences. These unaligned sequences and other unaligned contigs were then searched against the GenBank nucleotide database using blastn (Version: 2.9.0+) (Camacho et al., 2009). Sequences with the best hits outside the green plants or covered by known plant mitochondrial or chloroplast genomes were removed. The cleaned non-reference sequences from all accessions were combined and then processed to remove redundant sequences using CD-HIT (Version: 4.8.1) (Li and Godzik, 2006) with an identity threshold of 90%. The resulting non-redundant sequences and the reference ‘YK10’ genome were merged as the pan-genome.
A custom repeat library was constructed by screening the pan-genome using EDTA (Version: v1.9.6) (Ou et al., 2019) and used to screen the non-reference genome to identify repeat sequences with RepeatMasker (Version: 4.1.2-p1) (Tarailo-Graovac and Chen, 2009). Protein-coding genes were predicted from the repeat-masked non-reference genome using BRAKER (Version: 2.1.6) (Brůna et al., 2021) with two lines. One of the lines was running BRAKER with RNA-Seq data. RNA-seq data included Illumina transcriptome for leaves sequencing in our paper and reads of 40 tea samples downloaded from NCBI (Supplementary Table S1). The reads were cleaned using Trimmomatic (Version: 0.39) (Bolger et al., 2014) with parameters ‘SLIDINGWINDOW:4:15 MINLEN:70’ and aligned to the pan-genome with HISAT2 (Version: 2.2.0) (Kim et al., 2019). Then, the alignments were converted to a hint file for AUGUSTUS in gff format. All gff files were merged and fed to BRAKER. Another line was running BRAKER with OrthoDB Viridiplantae protein database. The results were then combined using TSEBRA (https://github.com/Gaius-Augustus/TSEBRA). The genes were filtered if the proportion of repeat sequences in gene sequences was greater than 50% or the CDS length was less than 300 nt.
Gene functions were assigned according to the best match using blastp against KEGG databases. InterPro functional analysis and Gene Ontology IDs were obtained using InterProScan (Zdobnov and Apweiler, 2001). The pathway to which the gene might belong was derived from the matching genes in KEGG.
Sequencing reads from each accession were aligned to the pan-genome using Bowtie2 (Version: 2.4.4) (Langmead and Salzberg, 2012) with “–end-to-end –sensitive” parameters. The gene presence/absence variation was characterized with the SGSGeneLoss package (Version: v0.1) (Golicz et al., 2015). For a specific gene within a given accession, if less than 20% of its exon regions were covered by at least two reads (minCov = 2, lostCutoff = 0.2), this gene was treated as absent in that accession; otherwise, it was determined as present. A maximum-likelihood phylogenetic tree was constructed based on the PAVs with 1,000 bootstraps using IQ-TREE (Version: 1.6.12) (Nguyen et al., 2015) with C. costei (KM7) as outgroup. Population structure was determined using ADMIXTURE (Version: 1.3) (Alexander et al., 2009). Principal component analysis was performed with TASSEL5 (Bradbury et al., 2007).
The presence frequencies within each pair of groups (ornamental Camellia versus oilseed Camellia and CSA versus CSS) were derived to identify genes under selection. The significance of the difference in the presence frequencies for each gene between the two compared groups was determined using Fisher’s exact test. The raw P values of all genes in each comparison were corrected using a false discovery rate (FDR). Genes under selection were identified with significantly different frequencies (FDR < 0.001 and fold change >2). KEGG enrichment analysis was performed using TBtools (Chen et al., 2020).
Pan-genome and core-genome size curves were fitted using the nlsLM function in the R package minpack.lm according to the steps (Hurgobin et al., 2018). The combinations of genomes were obtained according to the formula: 206!/(n!(206-n))!, n = [1,206]. The pan-genome size was modeled using the power law regression: y = AxB + C, and the core genome size was modeled using the exponential regression y = AeBx + C (Tettelin et al., 2005; Zhao et al., 2014).
‘Yunkang10’ (‘YK10’) is a CSA tea tree cultivar (2n=2x=30). Its estimated genome size was ~3.05 Gb using k-mer (k = 21) analysis with 670.98 Gb Illumina sequencing data (Supplementary Figure S1A, Supplementary Table S2). Due to the high genome heterozygosity level of 2.99%, we obtained an initial 5.54 Gb ‘YK10’ genome assembly from 318.86 Gb PacBio single-molecule sequencing data (Supplementary Table S3; contig N50 = 148,300 bp). Then, the contigs were scaffolded using 574.98 Gb optical mapping data (Supplementary Table S4). This step increased the contig N50 size to 822,186 bp. After removing redundancy and heterozygous sequences in the genome, we attained an assembly of 3.35 Gb with a contig N50 of 816,948 bp. Further, we clustered it into 15 chromosome-scale scaffolds using Hi-C data (Figure 1A, Supplementary Figure S1B, Table 1, Supplementary Tables S5 and S6). Our assembly captured 94.7% (1,529 of 1,614) of the complete core embryophyta genes (Supplementary Table S7), and the LTR assembly index (LAI) score of 11.94 suggested high completeness (Supplementary Table S8).
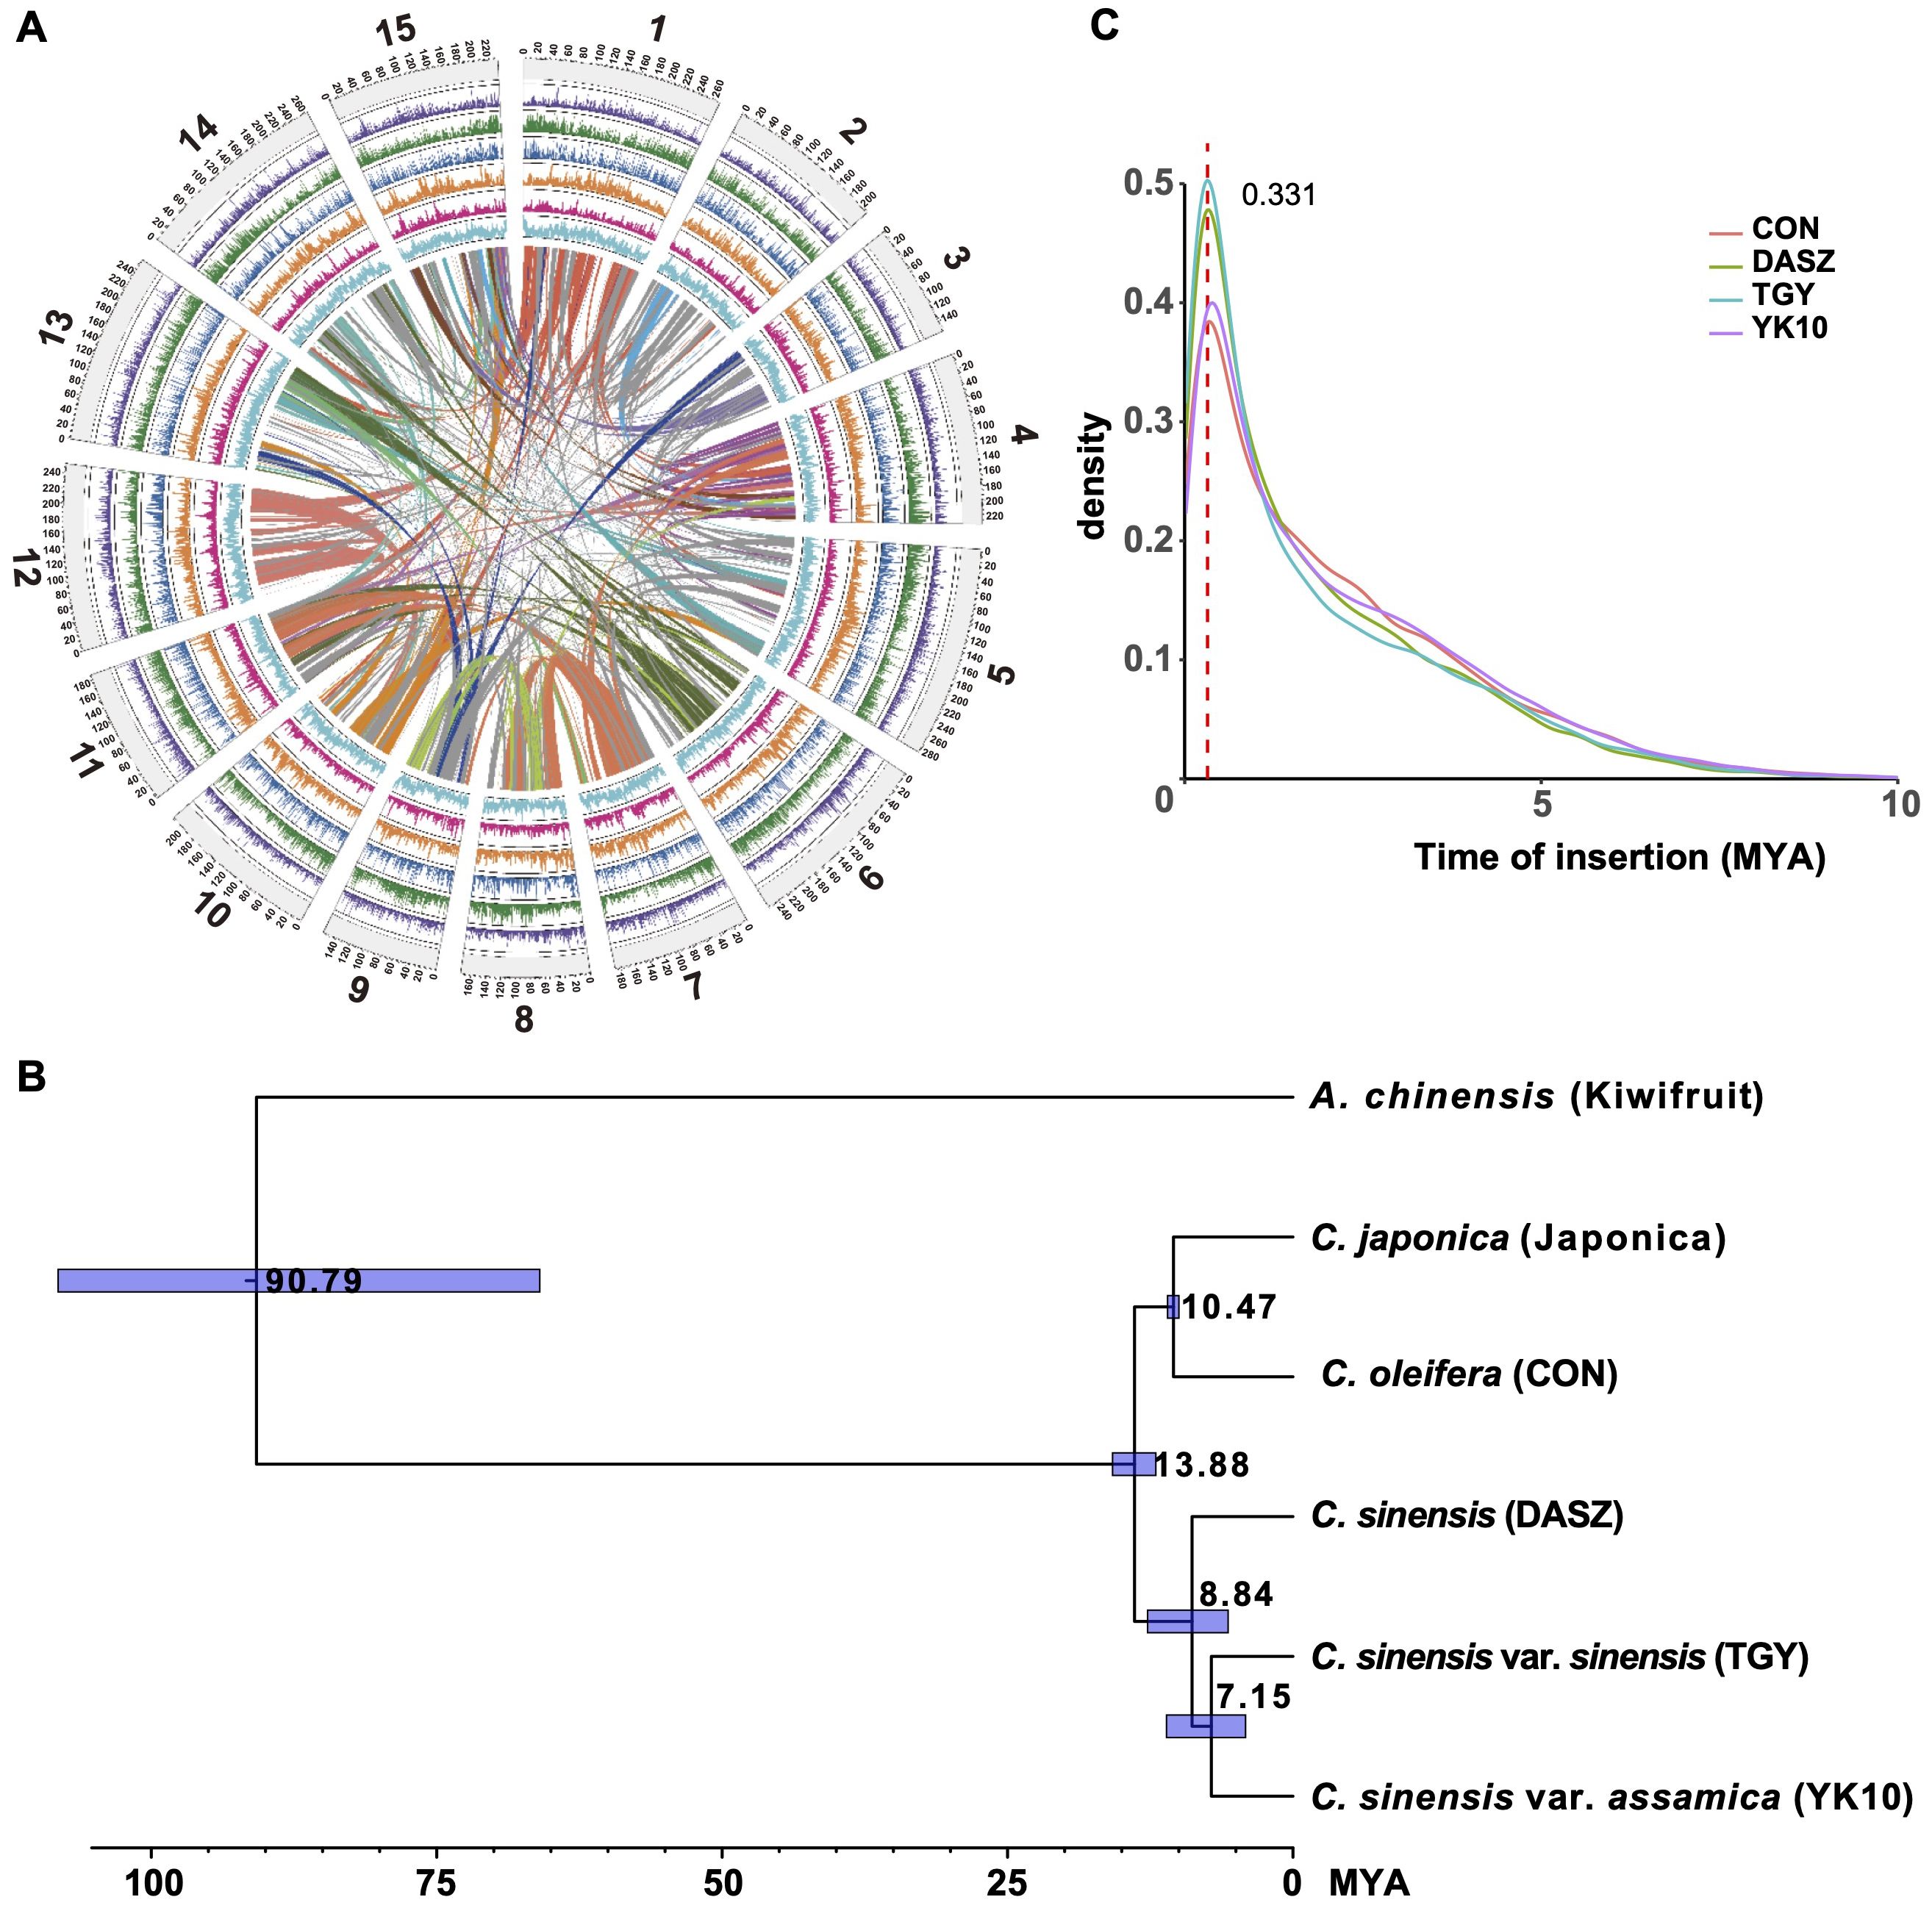
Figure 1. Genome assembly and evolution of the ‘YK10’. (A) The genome information of ‘YK10’. Representatives from outside to inside: chromosomes (light gray), LTR number (purple), gene number (green), TRF number (blue), Copia number (orange), Gypsy number (red), and GC content (cyan). (B) Phylogenetic tree and divergence time of ‘YK10’ and five plant species. The phylogenetic tree was generated from single-copy orthologs using the maximum-likelihood method. Blue blocks show the 95% highest posterior density (HPD) of divergence time. (C) Distribution of LTR-RT insertion time for different tea trees based on LTR_retriever’s result. ‘YK10’: CSA cultivar ‘Yunkang10’; TGY: CSS Chinese Oolong tea variety ‘Tieguanyin’; CON: wild oilseed Camellia (C. oleifera var. ‘Nanyongensis’); DASZ: an ancient tea tree; Kiwifruit: Actinidia chinensis var. ‘Hongyang’.
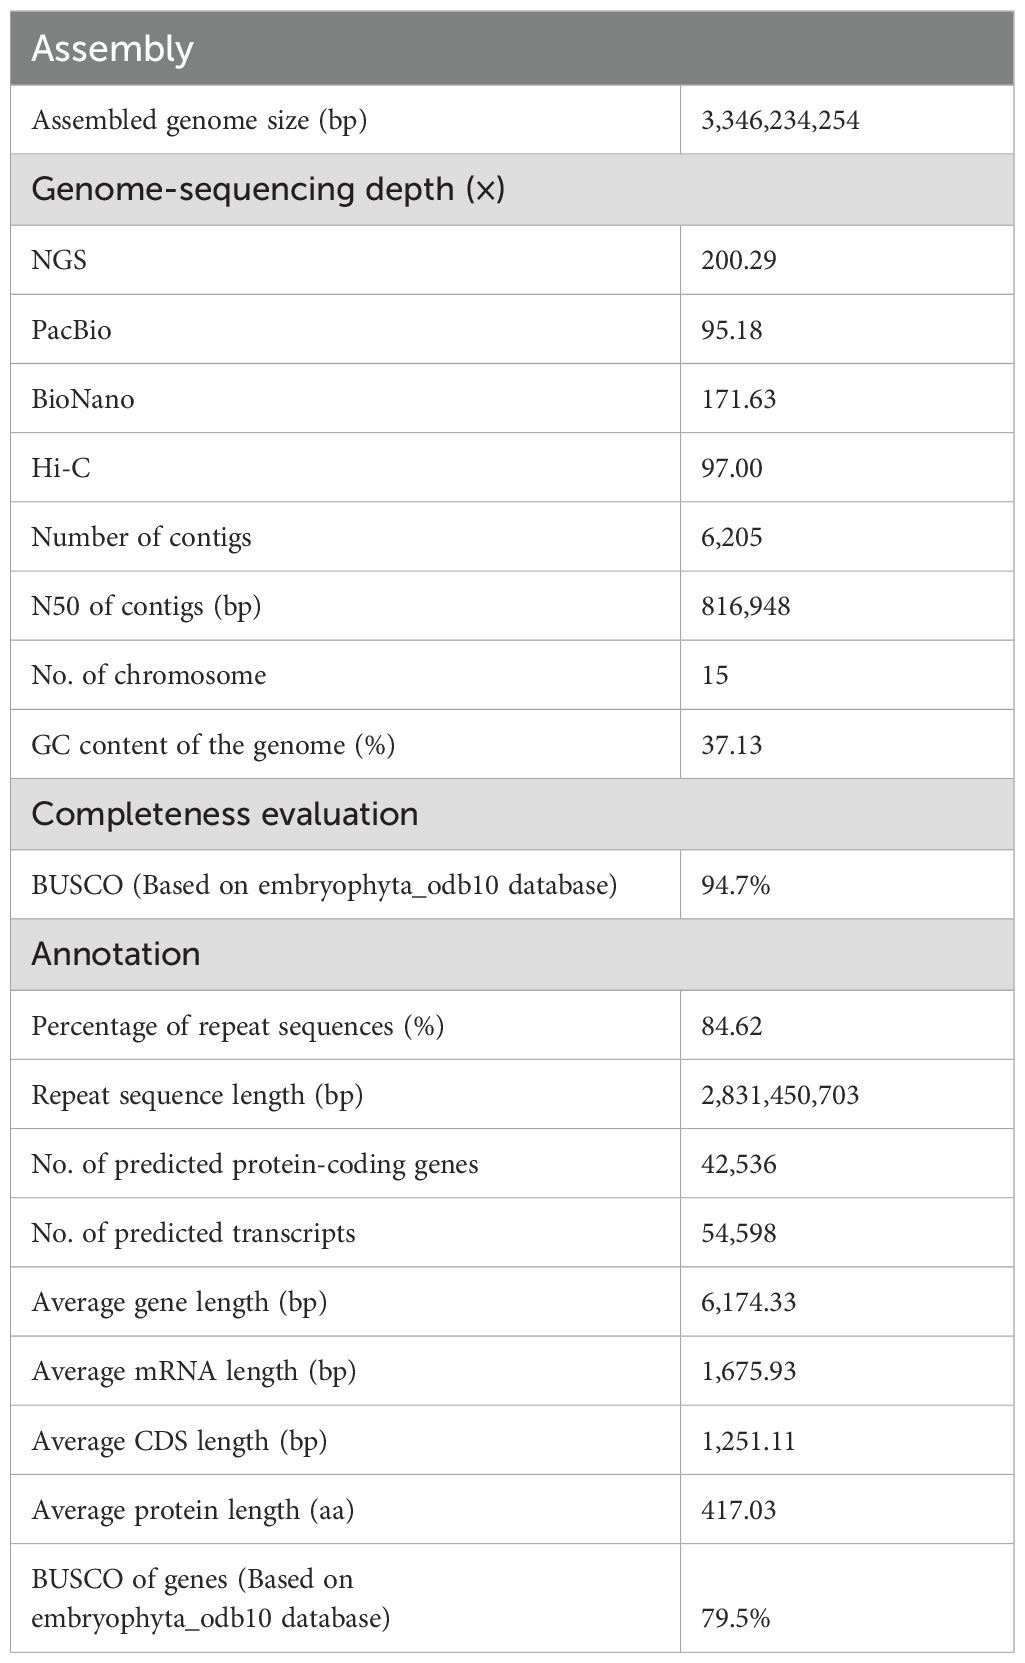
Table 1. Summary of genome assembly and annotation.
We predicted 42,536 protein-coding genes (54,598 transcripts) following homology and de novo methods (Supplementary Tables S9 and S10; 79.5% of core BUSCO genes). In total, 35,328 (83.05%) predicted genes had functional annotation in public databases (Supplementary Table S11). The species phylogeny using single-copy orthologous genes of reported Camellia genomes (Figure 1B, Supplementary Table S12) revealed an estimated divergence time of ~7.15 million years ago (MYA) between ‘YK10’ and ‘Tieguanyin’. The divergence time between C. japonica and C. oleifera var. ‘Nanyongensis’ was estimated at ~10.47 MYA. Tea trees diverged from other Camellia species at ~13.88 MYA. Whole genome duplication (WGD) analysis indicated that YK10 (and other Camellia plants) had experienced the same genome duplication event, in which the Ks peak was 0.386-0.414 (Supplementary Figure S2). 3,919 and 2,158 gene families of ‘YK10’ underwent expansion and contraction, respectively (Supplementary Figure S3), with 757 exhibiting significant expansion and 178 showing significant contraction. The significantly expanded genes were related to phenylpropanoid biosynthesis, glycan and glycosaminoglycan metabolism, ubiquinone and other terpenoid-quinone biosynthesis, and so on (Supplementary Table S13). Five gene families, including 26 NUCLEOTIDE-BINDING SITE AND LEUCINE-RICH REPEAT (NBS-LRR) genes, also underwent significant expansion. In comparison, the significantly contracted genes were related to monoterpenoid biosynthesis, metabolism of terpenoids and polyketides and others (Supplementary Table S13).
We predicted ~2.83 Gb repetitive elements in the ‘YK10’ genome (Table 1, Supplementary Table S14), among which 82.64% repeats were transposable elements (TEs; Supplementary Table S15). Long-terminal repeat (LTR) retrotransposons represented 58.48% of the genome, with Ty3/gypsy Ogre elements being the major lineage (10.08%, Supplementary Table S15). We showed a universal distribution of major TE families across the genome (Supplementary Figure S4) and analyzed the divergence of the reverse transcriptase sequences of different TE lineages (Supplementary Figure S5). Notably, Athila elements were evolutionarily young, but Angela and Ivana were comparably more ancient (Supplementary Figure S5). The LTR retrotransposon burst event in ‘YK10’ was consistent with other reported genomes (Figure 1C), around 0.331 MYA.
We collected 486 Camellia accessions worldwide and generated whole-genome sequencing data at an average depth of 18.28×, and we also included 139 accessions from a previous study (Wang et al., 2020) to maximize the genetic diversity for population genomic analyses (Figure 2A, Supplementary Table S16). The mean mapping rate of these reads to the ‘YK10’ reference genome was ~98.63% (Supplementary Table S17), and the properly paired mapping rate was 49.99-93.89% and showed significant difference among groups (Supplementary Figure S6, Supplementary Table S17). After applying filtering criteria to the called variants, we identified 651,670,193 single-nucleotide polymorphisms (SNPs), among which 80,356,229 SNPs had minor allele frequencies (MAF) more than 0.05 and <50% missing calls (Supplementary Table S18). About 91.87% of SNPs were intergenic. The nonsynonymous-to-synonymous substitution ratio for the SNPs in the coding regions was 1.419. We also found 3,727,828 indels (< 40 bp), 84.30% of which are in the intergenic regions and 0.83% in the coding regions. An estimated 72.82% of indels in the coding regions could cause frameshift mutations (Supplementary Table S18).
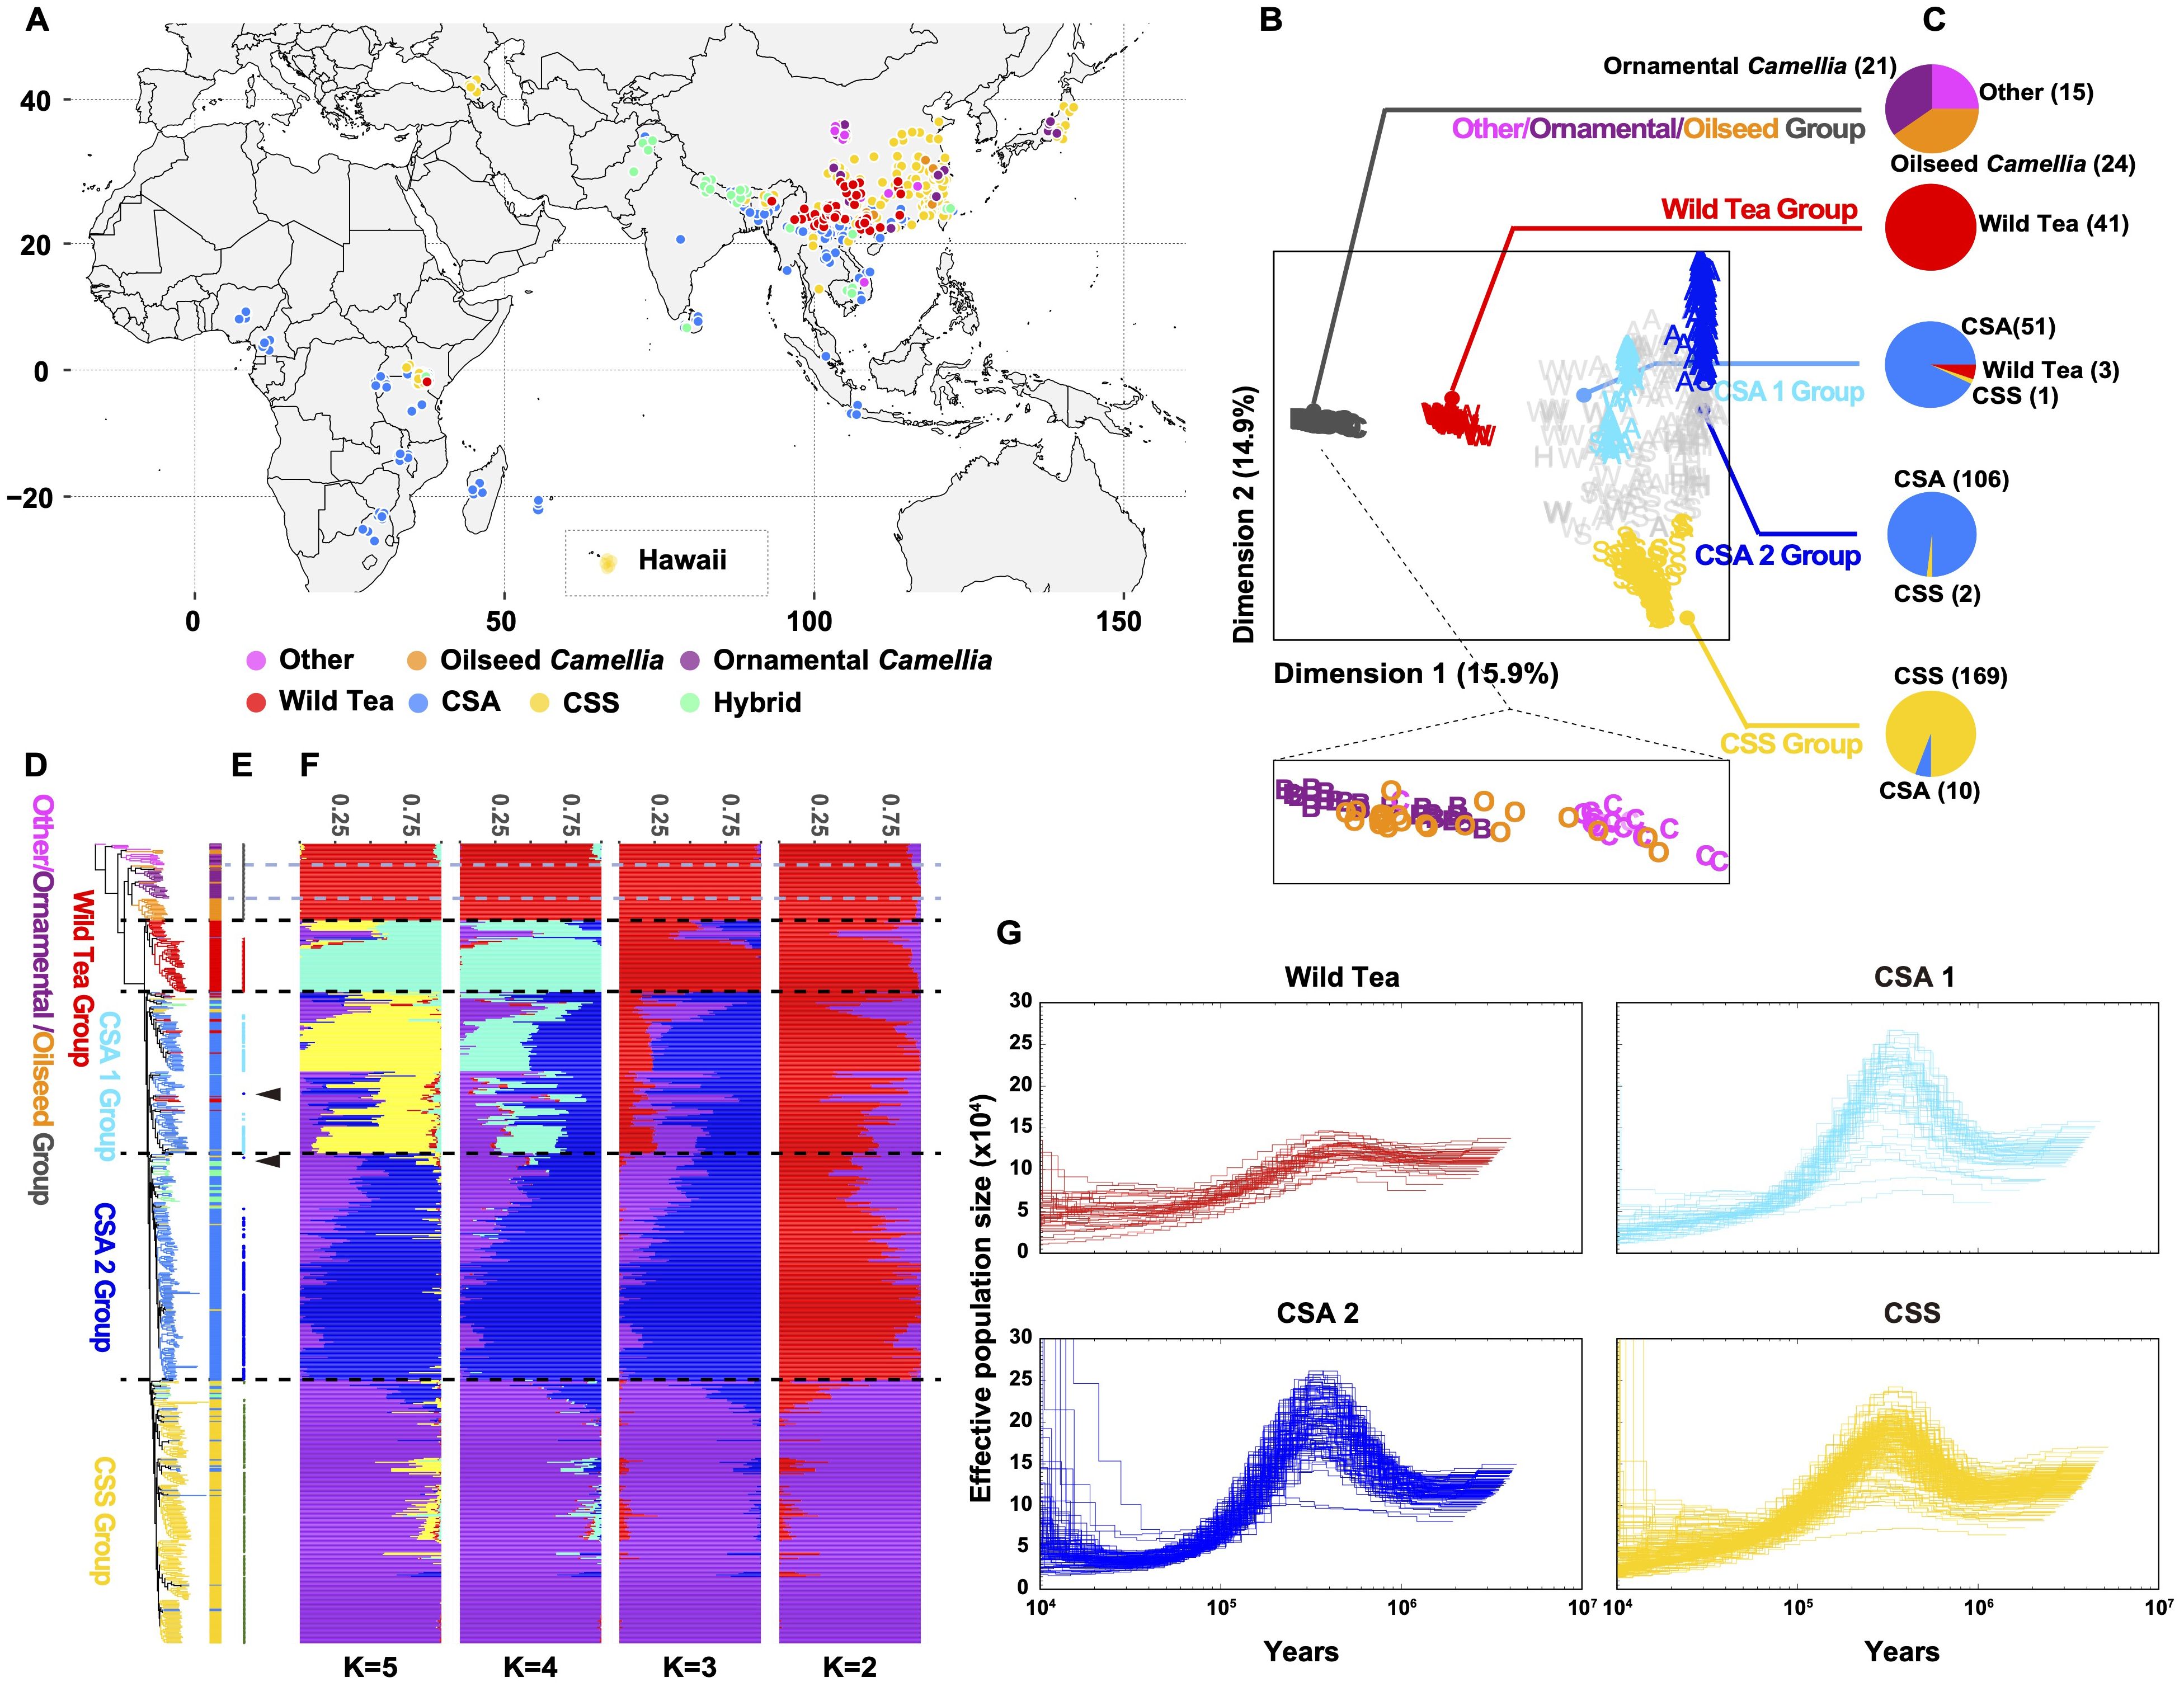
Figure 2. Subpopulations of tea accessions. (A) Geographic distribution of the re-sequenced Camellia accessions. (B) All tea accessions projected onto the first two dimensions after multidimensional scaling of genomic distances. The tea accessions’ genotypes were clustered using k-medoids (k = 5 subpopulations) and filtered using silhouette parameters, which resulted in kd=5 discrete subpopulations (colored labels, Other/ornamental/oilseed Camellia, Wild Tea, CSA 1, CSA 2 and CSS groups). (C) Pie charts represent the tea accession compositions of each discrete subpopulation. (D) Maximum likelihood phylogenetic tree of tea accessions inferred from the whole-genome SNPs with 100 nonparametric bootstraps (see Supplementary Figure S7 for bootstrap values as blue circles). C. cuspidata (KM6) was used as an outgroup. (E) Signs represent the position on the phylogenetic tree for selected accessions of (B). Arrows indicate outlier the accession (re166 and re176). (F) Population structure of major tea categories estimated by ADMIXTURE. Each color represents one ancestral population. Each accession is represented by a bar, and the length of each colored segment in the bar represents the proportion contributed by that ancestral population. (G) PSMC-inferred population history of Wild Tea, CSA 1, CSA 2, and CSS group. Each line represents an accession.
We constructed a maximum likelihood (ML) phylogenetic tree using C. cuspidata as an outgroup to investigate the phylogenetic relationships among Camellia accessions. We found that many Camellia species in the section Theopsis of subg. Thea (hereafter termed ‘Other’) were closer to the phylogenetic tree root (Supplementary Figure S7). In addition, the ornamental Camellia species form two polyphyletic clusters. The oilseed Camellia species also did not cluster together. This result suggested rampant genetic introgression with congeners or potential misclassification of accessions based on morphology during sample collection. In the section Thea of subgenus Thea, wild tea tree species, CSA, and CSS accessions formed three independent clades, with CSA and CSS being sister clades.
To identify discrete subpopulations (kd) of Camellia accessions, we clustered all accessions based on genomic distances by partitioning around medoids (PAM) and a silhouette-based procedure (Gutaker et al., 2020). This discretization procedure removed genetic gradients between subpopulations (Figures 2B, C), corresponding to the removal of accessions with mixed genetic ancestry assessed by ADMIXTRUE (Figures 2D-F, Supplementary Figure S8). In the end, we obtained five discrete subpopulations: The base group containing Other/ornamental/oilseed Camellia species, a second group containing wild tea trees (hereafter Wild Tea), the third and fourth groups containing CSA accessions (hereafter CSA 1 and 2), and the last group containing CSS accessions (hereafter CSS).
Furthermore, we removed the clonal accessions according to a KING-robust kinship criterion (> 0.354; Supplementary Figure S9). In our sample collections, first-degree relationships existed in many Camellia plants (KING-robust kinship value: 0.177 - 0.354). For example, the ornamental Camellia cultivars ‘Huamudan’ (KM9) and ‘Qiumudan’ (KM10) with distinct floral presentations may result from a single hybridization event. The Chinese CSS cultivar pairs ‘Fujian Shuixian’ (Per13-3) and ‘Shuixian’ (re024), the Malawian CSA cultivar pairs ‘SFS 371’ (re313) and ‘PC81’ (re314) with first-degree relationships showcased the hybridization history of tea breeding worldwide. We deduced that the Japanese tea accessions re094, re095, and re098 were offspring of the cultivar ‘Yabukita’, representing about 80% of the total cultivated areas in Japan. Previous research showed that ‘Fuyun 6’ (re035) was the offspring of ‘Fuding Dabai’ and one unknown CSA accession (Zhang et al., 2021). Our result revealed the identity of the unknown parent as ‘Zhongye 2’ (Per15-3), which originated from Fengqing County of Yunnan Province, China.
Characterization of the linkage disequilibrium (LD, expressed as r2) pattern showed that the LD decay for all tea tree subpopulations was very rapid. The LD reached half the maximum average r2 at a distance of 400 bp for the CSA 1 group, 100 bp for the CSA 2 group, and 100 bp for the CSS group. In comparison, the LD reached half of the maximum r2 at a distance of 11.7 kb for ornamental Camellia, 3.4 kb for oilseed Camellia, and 400 bp for the Wild Tea group (Supplementary Figure S10).
We applied the pairwise sequentially Markovian coalescent model (Li and Durbin, 2011) to analyze the Camellia groups (Figure 2G). The results were scaled to real time, assuming a neutral mutation rate of 6.1 × 10⁻⁹ nucleotides per year. Almost all groups experienced a steady decline in effective population size (Ne) from the highest point at 300-500 thousand years ago (Kya) to the nadir at 10-30 Kya. The Wild Tea group had a smaller Ne at the highest point. We also explored the population split between CSA and CSS populations with unphased SNP data using SMC++ (Terhorst et al., 2017). This approach revealed that these two groups diverged at about 11 Kya (Supplementary Figure S11).
We used the top 0.5% RAiSD μ statistic score (Alachiotis and Pavlidis, 2018) to screen potential selective sweep signals in ornamental Camellia and identified 1,457 protein-coding genes in the selective sweep regions (Figure 3A, Supplementary Data S1). Gene function analyses revealed that these genes were enriched in plant secondary metabolism pathways (Supplementary Table S19). Lots of candidate genes were involved in flower development (Figure 3A, Supplementary Data S1), such as genes encoding auxin response factor protein (ARF, CaS12G016450), MYB transcription factor protein (CaS02G017990, CaS03G017040, CaS05G008850, CaS09G008780, and CaS15G015140), glutathione S-transferase (GST, CaS01G024940, CaS04G022330, CaS08G023030, and CaS10G007120), beta-ring hydroxylase protein (CaS10G014230) and ethylene-responsive transcription factor protein (CaS01G023240).
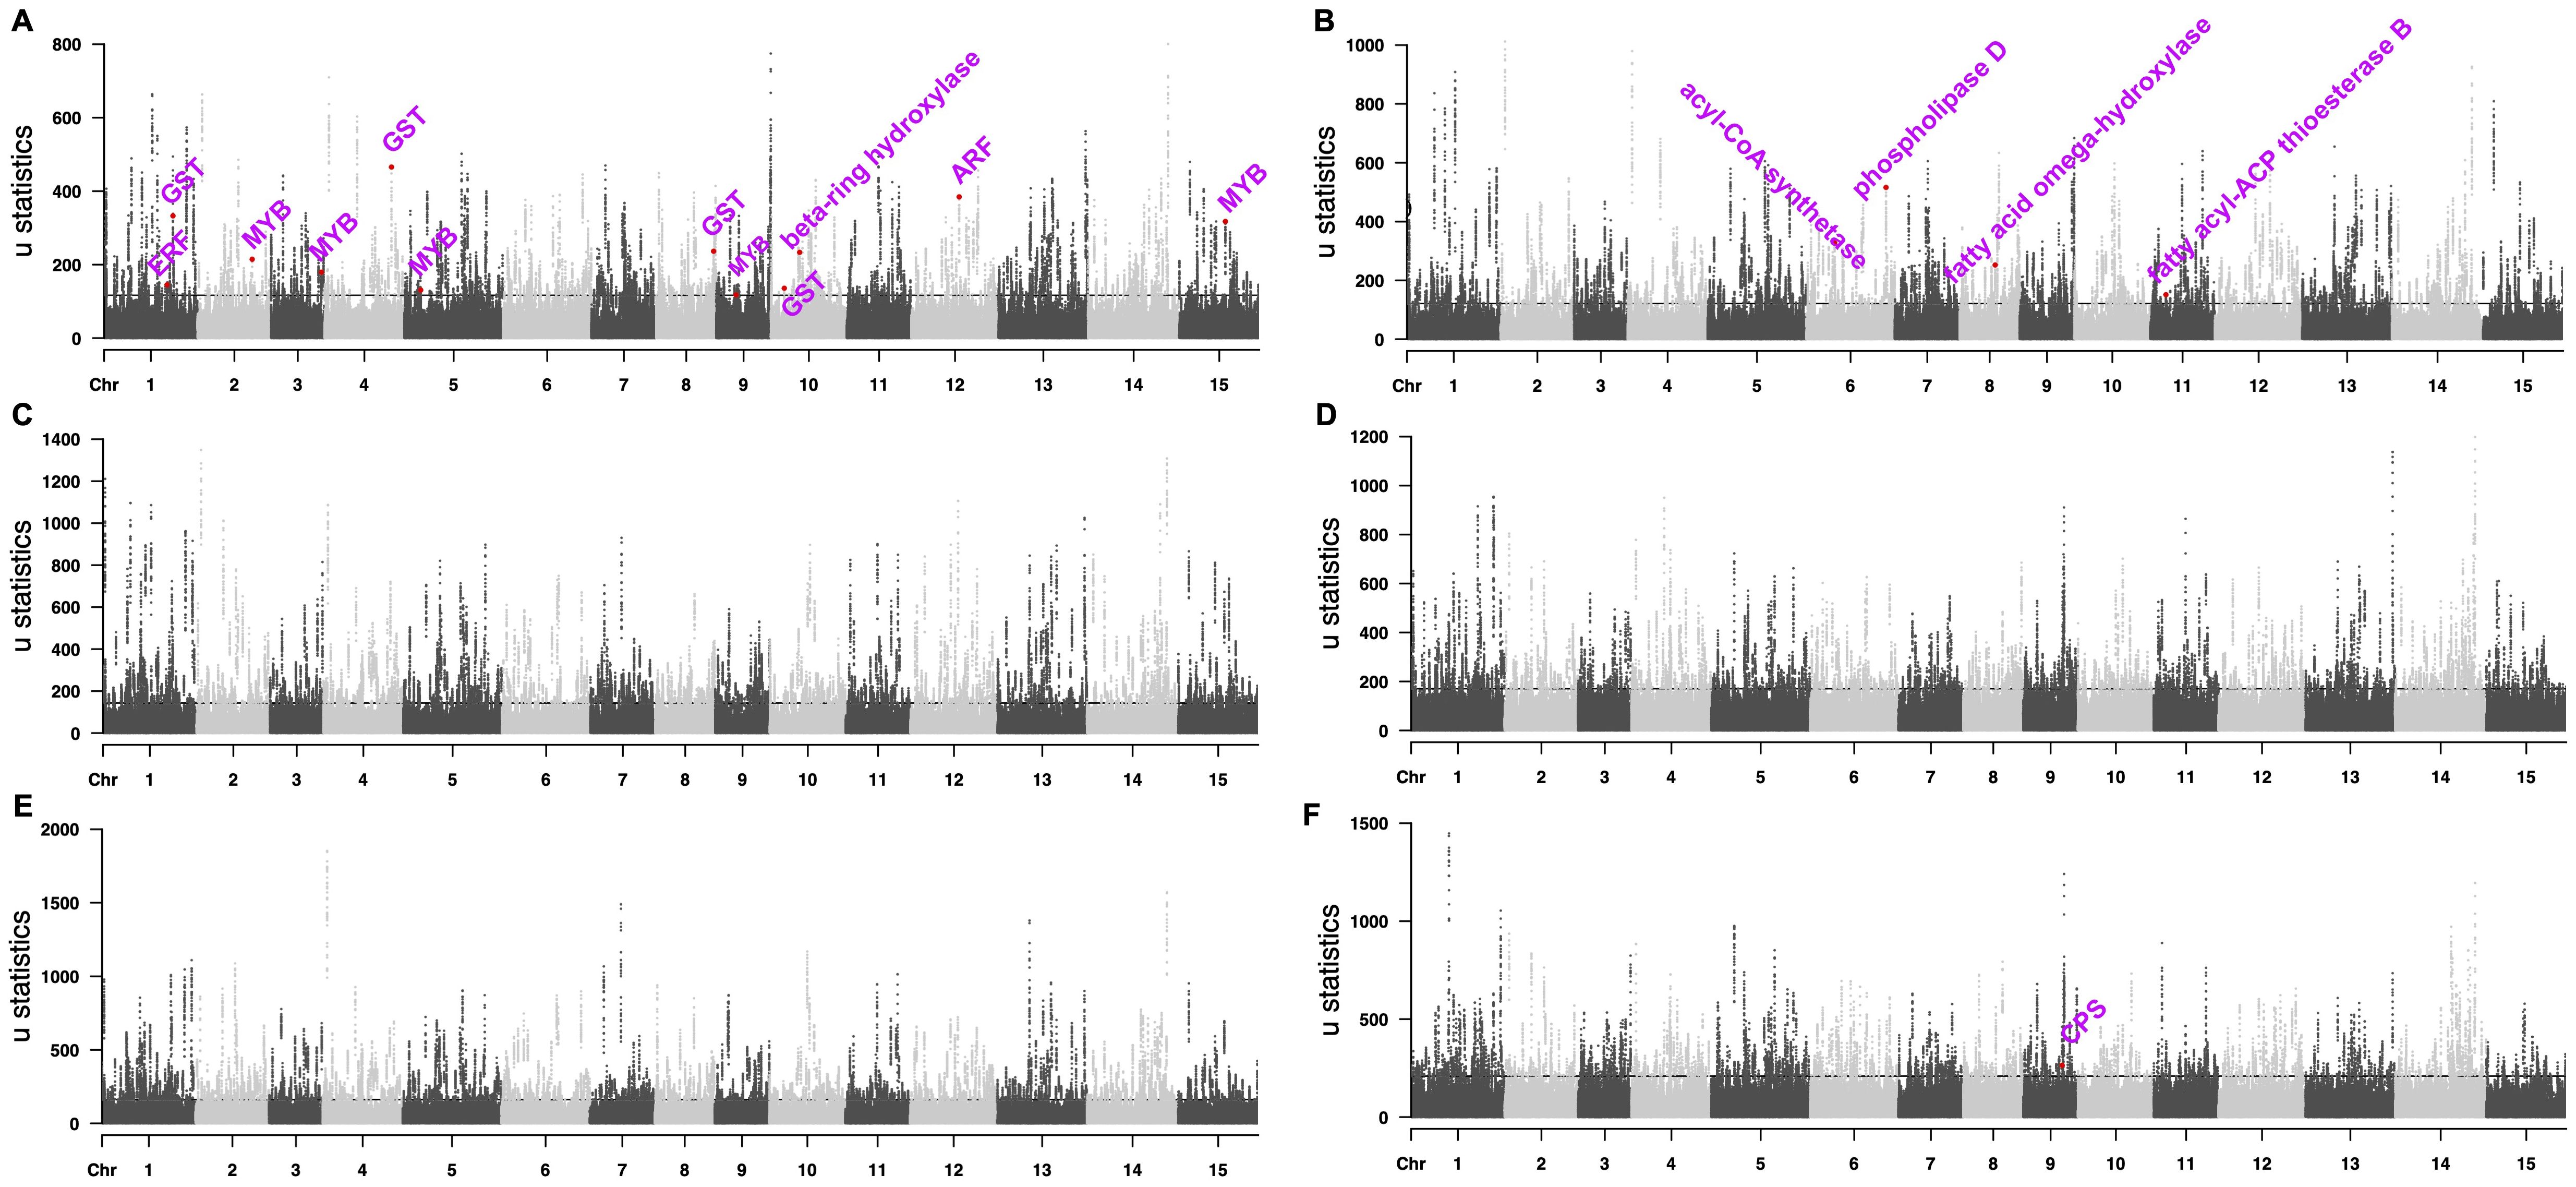
Figure 3. Manhattan plots of selected sweep signals. (A) ornamental Camellia. (B) oilseed Camellia. (C) Wild Tea. (D) CSA 1. (E) CSA 2. (F) CSS. The dashed lines mark the regions at the top 0.5%.
We also identified 1,714 protein-coding genes in the selective sweep regions for oilseed Camellia, among which many genes may help the increased de novo fatty acid (FA) biosynthesis (Figure 3B, Supplementary Data S1), e.g., phospholipase D (PLD, CaS06G030600), acyl-CoA synthetase (CaS06G009730), fatty acid omega-hydroxylase proteins (CaS08G012810, CaS08G012820), and fatty acyl-ACP thioesterase B protein (CaS11G004150).
In addition, we identified more genes in the selective sweep regions in the Wild Tea group (2,289) and the CSA groups (2,147 and 2,477) than in the CSS group (1,858; Figures 3C-F, Supplementary Data S1). The stilbenoid, diarylheptanoid, and gingerol biosynthesis pathway was enriched in all tea groups, which agreed with the selection of tea for a beverage. The selected genes in CSA groups contained members related to environmental adaptation and plant-pathogen interaction (Supplementary Table S19). Selective sweep genes in the CSA2 group also participated in the metabolism of terpenoids and polyketides, as well as monoterpenoid and brassinosteroid biosynthesis. By contrast, the CSS group had selective sweep genes related to flavonoid biosynthesis, diterpenoid biosynthesis, alpha-linolenic acid metabolism, and beta-alanine metabolism (Supplementary Table S19). In addition, we found a gene (CaS09G017690) encoding copalyl-diphosphate synthase (CPS) protein in the selective sweep region of the CSS group (Figure 3F), which may be related to dwarf phenotype (Guo et al., 2020).
Ecological niche modeling revealed a significant suitable habitat (suitability score >0.75) for tea trees in the Southern regions of East Asia and Southeast Asia from the Last Glacial Maximum (LGM) to the Holocene period, consistent with the collected records from GBIF (Figure 4A, Supplementary Figure S12, Supplementary Table S20). It is also apparent that the suitable habitat gradually separated into two smaller regions since the Late Holocene. The west covers the Eastern Himalayan region and the Ganges Basin, whereas the east mainly covers South China. This result corresponds to the sister relationship between CSA and CSS (Figure 2D), hinting at the parallel domestication of tea trees.
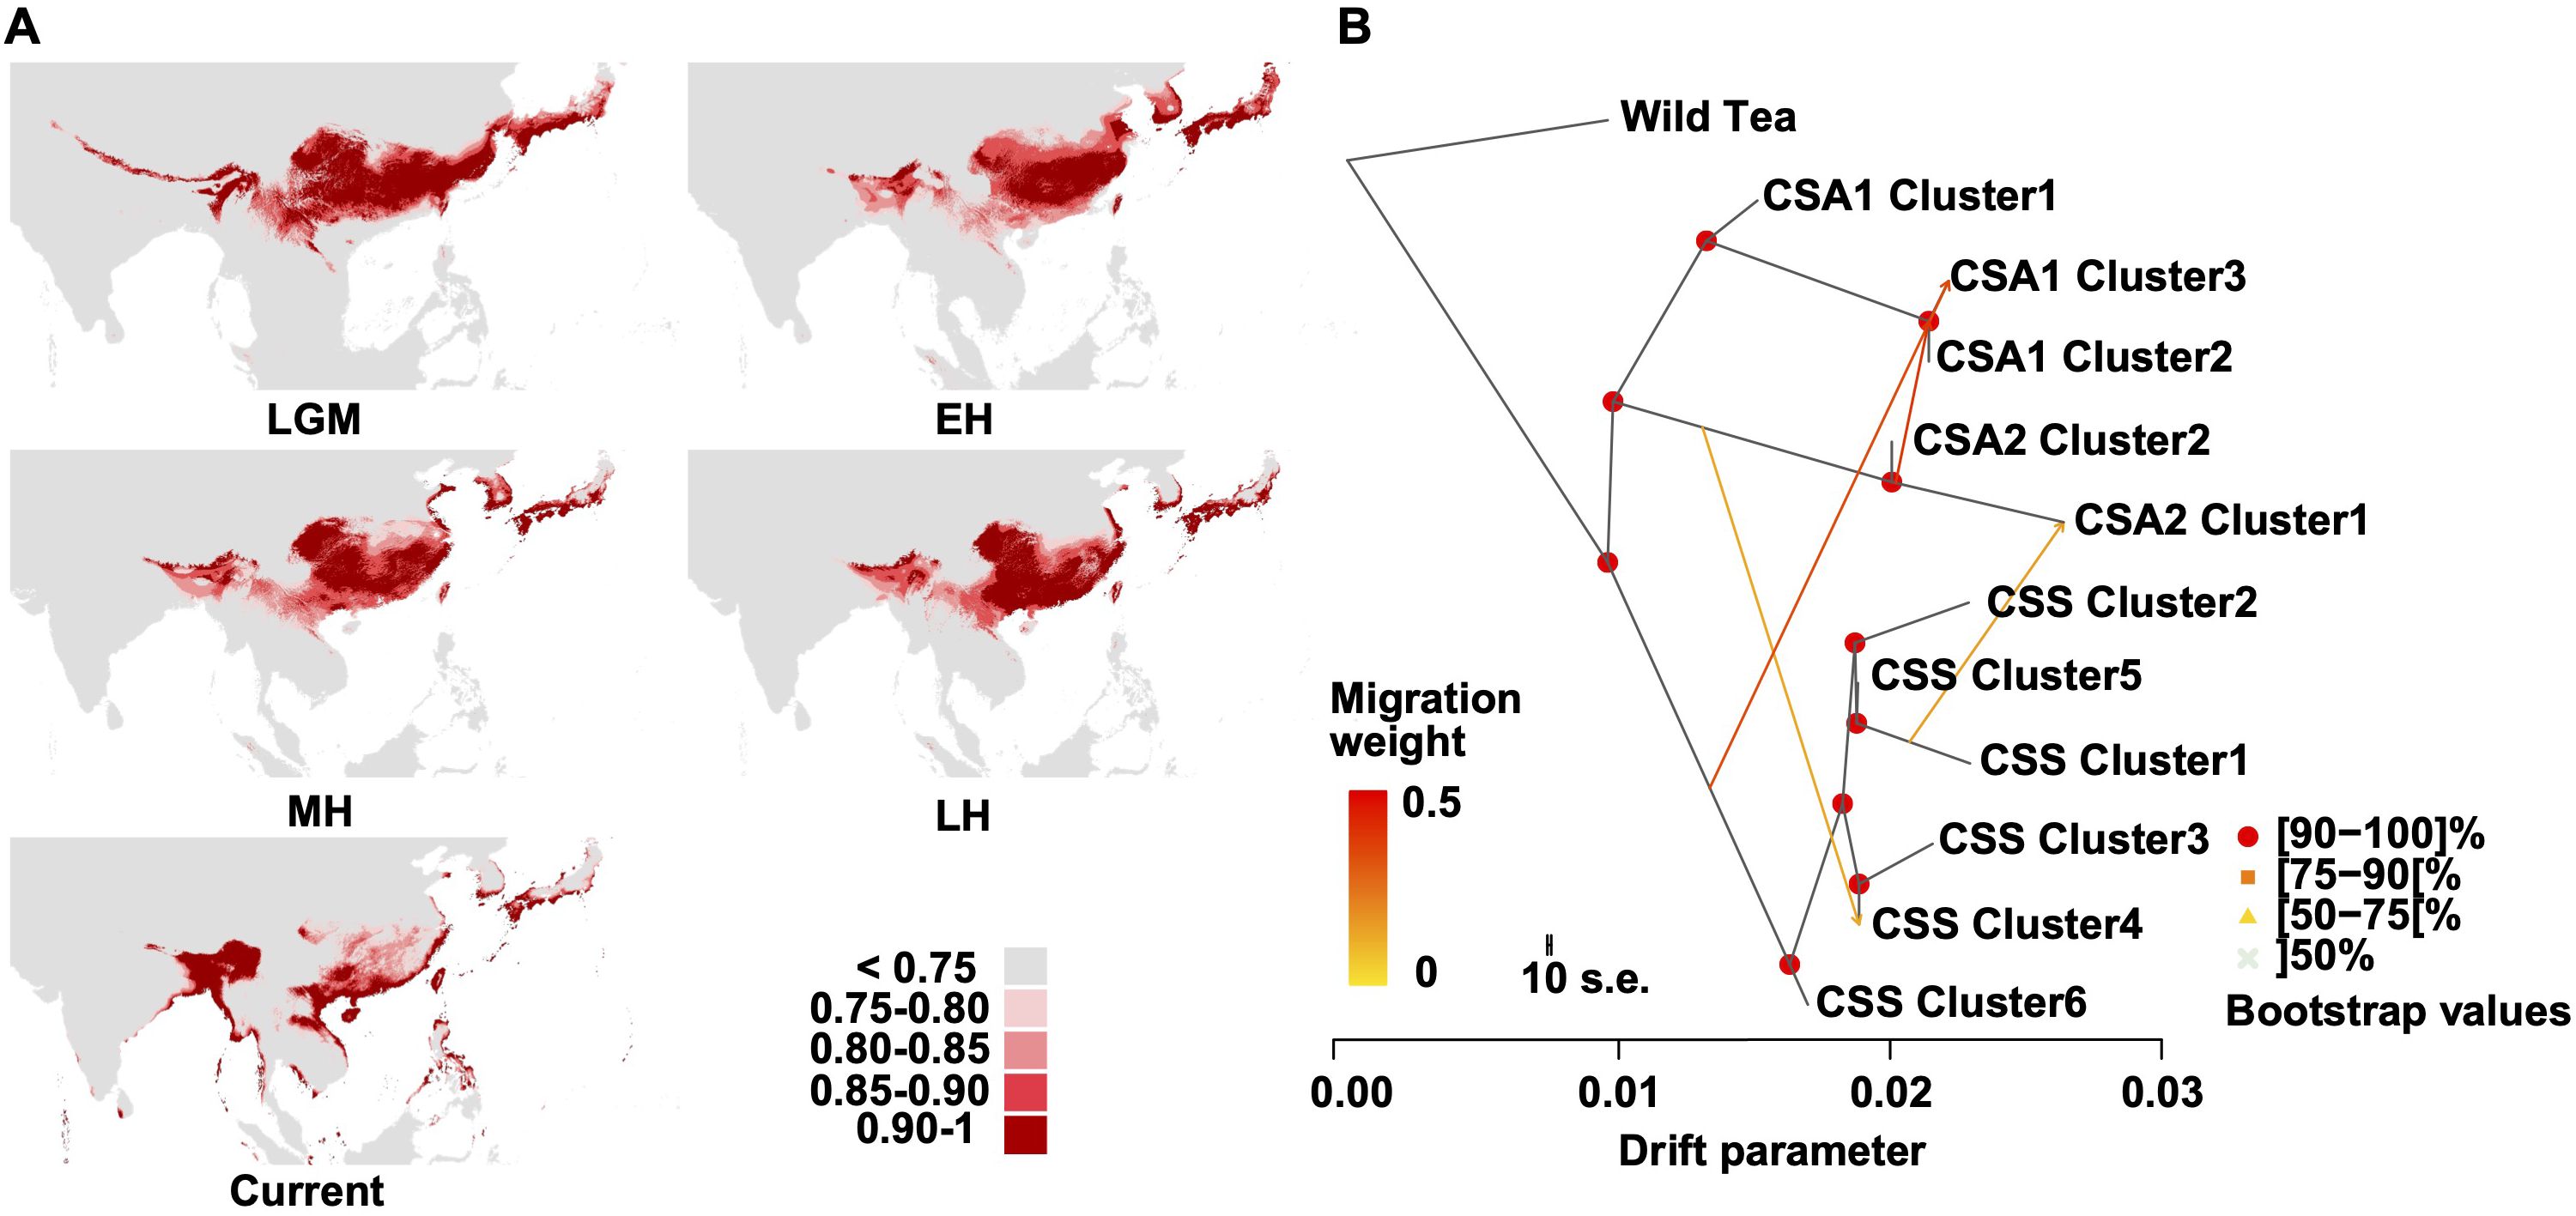
Figure 4. Environmental niche modeling and TreeMix analysis. (A) Predicated distributions of C. sinensis (L.) Kuntze based on ecological niche modeling during LGM (Last Glacial Maximum, ca. 21 ka), EH (EH (early-Holocene, 11.7-8.326 ka)), MH (mid-Holocene, 8.326-4.2 ka), LH (late-Holocene, 4.2-0.3 ka) and Current (1979 – 2013) period. Areas in different colors indicate the various probabilities (0-1) of suitable habitats. (B) The gene flow among the CSA and CSS clusters (m=4). The direction of each arrow represents the direction of gene flow. The Wild Tea group was used for root.
We applied a Self-Organizing Map (SOM) approach (Wirth et al., 2011) to investigate the genetic diversity and the subpopulation-level distributions of characteristic alleles in tea cultivars. A gallery of SNP portraits helped visualize the genotypes (Supplementary Figures S13-S15) using color-coded allelic landscapes to depict major homozygous (blue), heterozygous (green), and minor homozygous (red), respectively. The accession portraits were very similar among accessions from the same geographic region but progressively different among accessions from different regions with increasing geographic distance. This result revealed three, two, and six smaller clusters in the CSA 1, CSA 2, and CSS groups, respectively. The geographic distribution of the CSA 1 group was mainly in Yunnan and Southeast Asia (Supplementary Figure S16A), whereas the CSA 2 group was in Africa, Bangladesh, Nepal, and Assam. By contrast, the CSS clusters were scattered across South China (Supplementary Figure S16B).
The population differentiation (FST) level was more prominent between the CSA 1 and the CSA 2 clusters (Supplementary Figure S17A), indicating the genetic separation between Yunnan and South Asia tea tree plants. The FST among CSS clusters was relatively lower (FST < 0.15), showing a low level of genetic differentiation (Supplementary Figure S17B). Most CSS clusters showed higher nucleotide diversity (Supplementary Figure S18A), probably reflecting historical introgression and a more extensive habitat throughout evolution history in South China. The differences were significant between/among most CSA and CSS clusters (Supplementary Figure S18B).
To illustrate the high level of gene flow between the CSA and CSS groups, we estimated admixture graphs of SOM-defined clusters using TreeMix. The optimal number of migration events was four (Figure 4B, Supplementary Figure S19), including events from CSA 2 into CSA 1 (clusters 2 and 3; migration weight 0.393) and from CSS to CSA 1 (cluster 3; migration weight 0.340). This result suggested that CSA 1 cluster 3 might result from CSS and CSA 2 hybridization. We also observed an admixture event from CSS cluster 1 to CSA 2 cluster 1 (migration weight 0.154) and a gene flow from CSA 2 to CSS cluster 4 (migration weight 0.132).
We selected 206 Camellia accessions (Supplementary Table S16) for the pan-genome construction, including eight accessions in the Other Camellia, 21 accessions in the ornamental Camellia, 12 accessions in the oilseed Camellia, 26 accessions in the Wild Tea group, 68 CSA accessions, and 71 CSS accessions. The average genome size of accessions was ~2.30 Gb for the de novo assemblies, and the average N50 size was 1.46 kb (Supplementary Figure S20). We mapped assembled contigs to the ‘YK10’ reference genome and identified ~43.33 Gb non-reference sequence sharing < 86% identity with the reference (Supplementary Figure S21). After removing redundancies, we obtained 9,275,358 sequences (8.58 Gb) representing the non-reference genome and annotated 216,302 protein-coding genes. The ‘YK10’ reference and the final non-reference genome formed the Camellia pan-genome and were used for the following analyses. We categorized pan-gnome genes according to their presence frequencies, including 26,330 core genes shared by all 206 accessions (100% accessions), 4,497 softcore genes (99-100% accessions), 206,044 shell genes (1-99%), and 21,916 cloud genes (<1%), respectively (Supplementary Figure S22). Iteratively random sampling of accessions showed the plateau of both pan and core genes, suggesting a finite pan-genome size (Figure 5A).
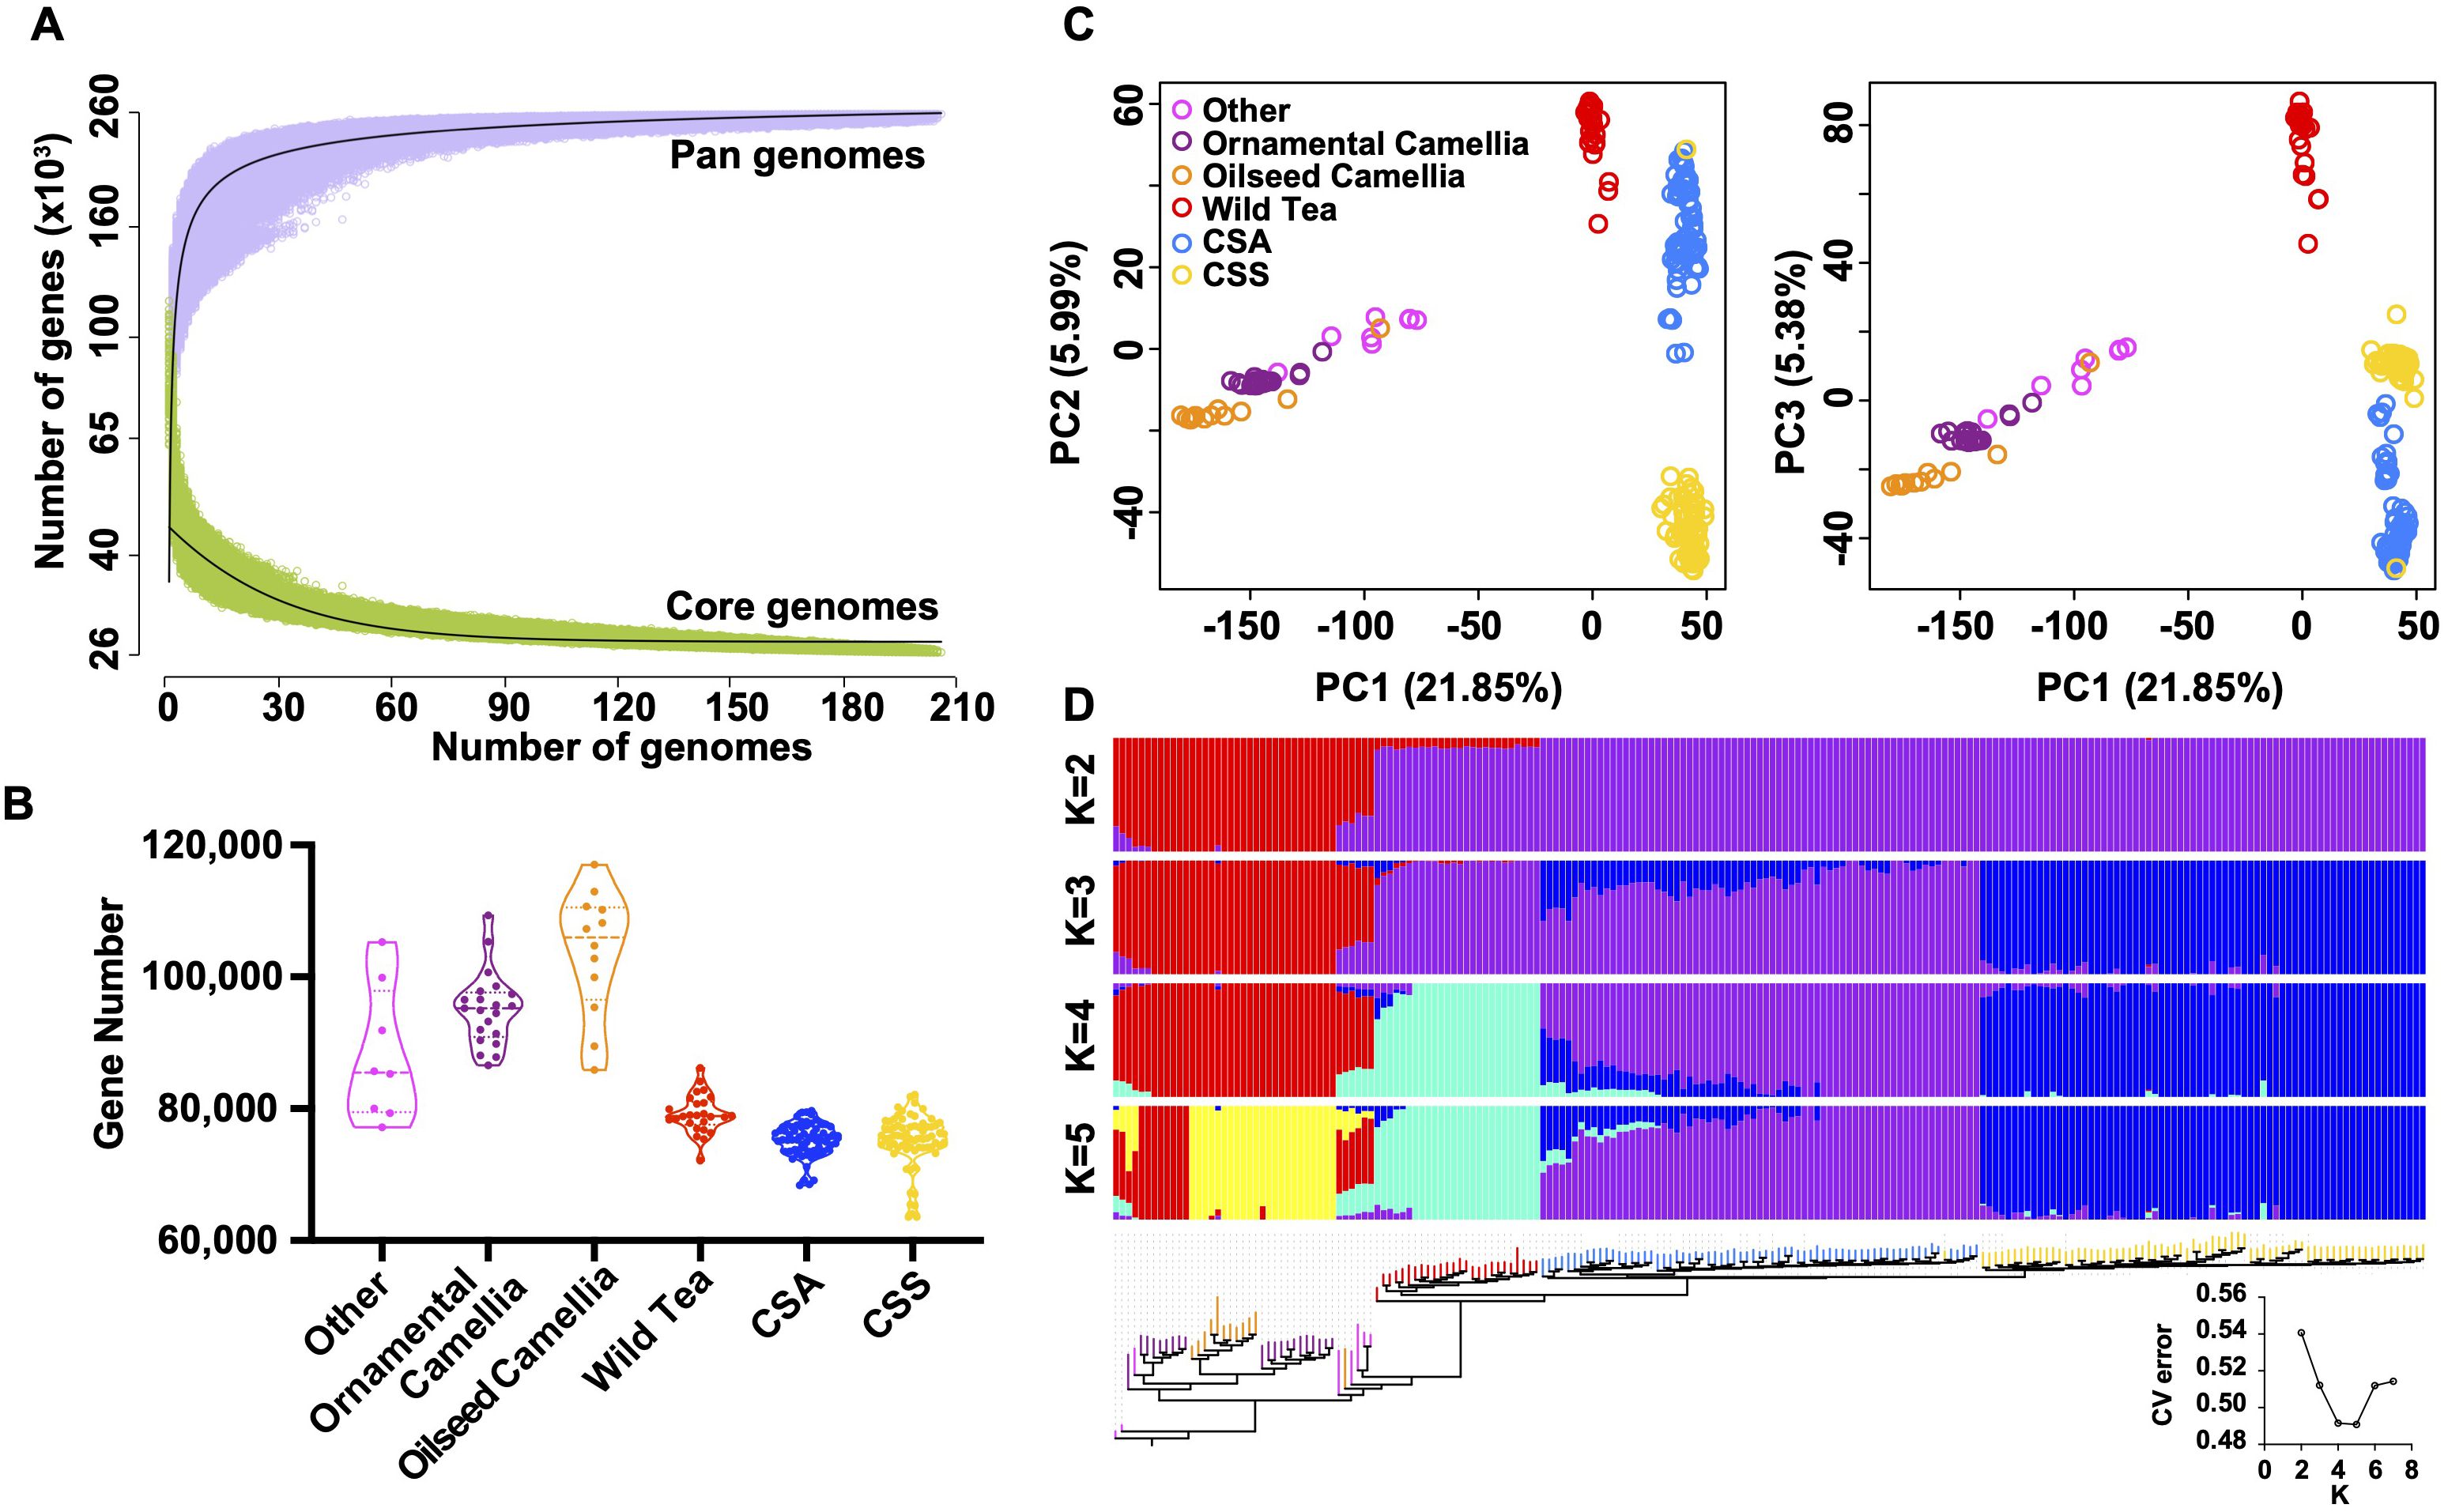
Figure 5. Feature of tea pan-genome. (A) Simulations of the increase of the pan-genome size and the decrease of core-genome size. Accessions were sampled as 10,000 random combinations of each given number of accessions. The upper and lower edges of the purple and green areas correspond to the maximum and minimum numbers of genes, respectively. Solid black lines indicate the pan- and core-genome curves fitted using points from all random combinations. (B) Violin plots showing the number of detected genes in each group. Three lines (from the bottom to the top) in each violin plot show the location of the lower quartile, the median, and the upper quartile, respectively. (C) Principal component analysis based on PAVs. The core and all absent genes were excluded. (D) Maximum-likelihood tree and model-based clustering of the 206 accessions with different numbers of ancestral kinships (K = 2, 3, 4, and 5) using the identified PAVs. The core and all absent genes were excluded.
The tea tree Camellia accessions have significantly fewer genes than the Other Camellia species (Figure 5B, Supplementary Figure S23), suggesting a general trend of gene loss during tea tree evolution. Phylogenetic, principal component analyses, and ADMIXTRUE clustering (Figures 5C, D, Supplementary Figure S24) using the presence/absence variations (PAVs) showed clear separation of the Wild Tea, CSA, and CSS accessions except for re255, which may be a misidentified accession. By contrast, most Other Camellia accessions were clustered together, corresponding to the results from similar analyses using SNPs (Supplementary Figure S7).
We identified PAVs under selection by screening genes with significantly different frequencies between CSA and CSS (Supplementary Figure S25). We identified 11,060 CSA-favorable genes (higher frequencies in CSA) and 10,972 CSS-favorable genes (higher frequencies in CSS). The CSA-favorable genes were mainly involved in carotenoid biosynthesis, metabolism of terpenoids and polyketides, carbohydrate metabolism, and benzoxazinoid biosynthesis (Supplementary Table S21). The CSS-favorable genes were mainly involved in carotenoid biosynthesis, steroid biosynthesis, metabolism of terpenoids and polyketides, cytochrome P450, nitrogen metabolism, and monoterpenoid biosynthesis (Supplementary Table S21). Similarly, we identified 210 ornamental Camellia-favorable genes and 2,945 oilseed Camellia-favorable genes (Supplementary Figure S26). The pathways of fatty acid degradation and carbohydrate metabolism were enriched in oilseed Camellia, but no significant pathways related to secondary metabolism were enriched in ornamental Camellia.
Tea is a popular non-alcoholic beverage worldwide. Because of the health benefit, economic value, and progress of sequencing technique, lots of Camellia genomes, including ‘YK10’, CSA, CSS, and oilseed Camellia, have been decoded (Xia et al., 2017; Wei et al., 2018; Wang et al., 2020; Xia et al., 2020; Zhang et al., 2020a, 2020, 2021; Lin et al., 2022; Chen et al., 2023). However, most CSA assemblies have lower contig N50 lengths (~881 kb) (Chen et al., 2023). Our new ‘YK10’ assembly has improved forty-fold in terms of contig N50 length (817 kb) compared to a previous report (Xia et al., 2017), and its quality was comparable with other reported CSA (Chen et al., 2023) and CSS genomes (Wei et al., 2018; Wang et al., 2020; Xia et al., 2020; Zhang et al., 2020a). TE burst events were estimated at around 0.331 MYA using our genome, which was younger than that obtained from a previous ‘YK10’ genome (Xia et al., 2017). Furthermore, the Ks peak of WGD analysis in this study (0.386-0.414) was larger than that in the previous studies (0.31-0.36) (Wang et al., 2020; Xia et al., 2020), suggesting an older genome duplication event. Observably, our results showed that some NBS-LRR and phenylpropanoid biosynthesis-related gene families were expanded in the ‘YK10’ genome, which may be beneficial for disease resistance and tea flavor, respectively, given the fact that NBS-LRR genes are the most important disease resistance genes in plants (Wu et al., 2017). The cardiovascular health benefits of drinking tea are mainly due to flavonoids (Hodgson and Croft, 2010), which are synthesized through a specific branch of the phenylpropanoid pathway (Li et al., 2019).
Trait diversification of Camellia domesticates was visualized for three main types according to human needs, but the potential genomic drivers remained covered. Ornamental Camellia cultivars exhibit diverse flowering times, flower sizes, petal colors, and petal forms. These traits are putative targets of human selection throughout history. We identified abundant selective sweep genes related to floral development in this group, among which the ARF protein plays a role in the auxin-mediated pathway in promoting floral fate (Chung et al., 2019) in addition to its role in regulating gynoecium morphogenesis, self-incompatibility, de novo organ regeneration, and organ polarity (Zhang et al., 2018). MYB proteins regulate anthocyanin biosynthesis in fruits and flowers, and GST proteins transport anthocyanin from the endoplasmic reticulum to facilitate the coloration of flowers, leaves and stems (Lu et al., 2021). Other selected genes in the group encoding beta-ring hydroxylase protein and ethylene-responsive transcription factor protein also affected flowering in Camellia (Wang et al., 2016; Huang et al., 2022), thus possibly influencing the ornamental value of flowers in ornamental Camellia.
The oilseed Camellia produces high-temperature cooking oil with a mild tea aroma. It is a crucial source of dietary fats for the local Southeast Asian people. Not surprisingly, some selective sweep genes in this group were found to be related to FA biosynthesis. In Camellia, phospholipase D (PLD) became important in regulating triacylglycerol (TAG) production. Transgenic Camelina plants expressing Arabidopsis PLD produced 2-3% higher levels of TAG (Deepika and Singh, 2022). In addition, acyl-CoA synthetase mediates de novo lipogenesis and glycerol lipid assembly in developing seeds (Ichihara et al., 2003). Furthermore, the genes encoding fatty acid omega-hydroxylase proteins and fatty acyl-ACP thioesterase B protein are also related to FA metabolism (Salas and Ohlrogge, 2002; Osborne et al., 2022).
The details of tea tree domestication remain inconclusive, as the true progenitor of the cultivated tea tree is unknown. New evidence emerged to propose the parallel cultivation of CSA and CSS in the past and hypothesize that selected genes possibly affected flavor, leaf size, and tree height (Zhang et al., 2021). Our results revealed that the function enrichment of selective sweep genes showed differences in these two groups. We also found that CSA and CSS were sister clades in the phylogenetic tree, and the divergence time between CSA and CSS predated the earliest documentation of tea cultivation. Ecological niche models showed that the suitable habitat of tea plants gradually separated into two smaller regions since the Late Holocene. All of these supported the parallel domestication processes for CSA and CSS. However, the location and time of domestication still require verified progenitor populations for elucidation. Especially, a previous study found that both cell length and the cell number of internodes were reduced in a dwarf mini plant 1 (mnp1) mutant of Medicago truncatula, which involved a putative CPS gene in the first step of gibberellin biosynthesis (Guo et al., 2020). A CPS gene was found in the selective sweep region in the CSS group in the present study, providing indirect evidence for the relatively shorter plant height in CSS.
The kinship of important cultivars contributed to understanding the history of breeding and screening germplasm resources, e.g., identifying the offspring of the cultivar ‘Yabukita’. The pattern of geographic distribution among different CSA and CSS subpopulations showed significant differences, suggesting that established cultivars traveled to far-away tea-growing regions, possibly with early farmers. In addition, we investigated the population differentiation, nucleotide diversity, and gene flow among these subpopulations. These results reflected a complex hybridization history during tea tree domestication and breeding history.
Furthermore, we provided a landscape of Camellia pan-genome. Though a graphical pangenome based on the de novo assembly of 22 elite tea cultivars has been released (Chen et al., 2023), our Camellia pan-genome will expand the Camellia gene pool, thus helping subsequent functional research. Genetic structure analysis based on PAVs of Camellia pan-genome corresponded to the results based on SNPs, proving the capacity and value of this genetic variation. The group-favorable genes also provided valuable genetic resources for explaining the trait diversification of Camellia domesticates.
In conclusion, we presented a high-quality genome sequence for the CSA tea tree. According to resequencing and pan-genome analyses for Camellia species, the genetic diversity and population structure of a worldwide panel were revealed, and genetic drivers of selection during domestication were identified. Our results offered a valuable genomic resource for ongoing functional research of Camellia species in agriculture. Many aspects of the tea origin remain unknown, but our results agreed with the parallel domestication of CSA and CSS. Because the progenitor of tea trees is unidentified, two-population analyses of selective sweeps and the dispersal history of tea trees remained to be examined.
The raw reads of genome sequencing data are available at the China National Center for Bioinformation under the accession number PRJCA017951. The raw reads of resequencing data are available at the China National Center for Bioinformation under the accession number PRJCA017952. Genome assembly and annotation are available at Teabase (http://teabase.ynau.edu.cn).
SD: Data curation, Formal Analysis, Investigation, Software, Visualization, Writing – original draft, Writing – review & editing. LY: Data curation, Formal Analysis, Investigation, Software, Visualization, Writing – original draft. ZS: Data curation, Formal Analysis, Investigation, Software, Visualization, Writing – original draft. XL: Data curation, Software, Visualization, Writing – original draft. BC: Data curation, Formal Analysis, Writing – original draft. DL: Formal Analysis, Visualization, Writing – original draft. HQ: Data curation, Visualization, Writing – original draft. MM: Formal Analysis, Software, Writing – original draft. MW: Software, Visualization, Writing – original draft. LG: Funding acquisition, Project administration, Resources, Writing – review & editing. WC: Conceptualization, Project administration, Writing – original draft, Writing – review & editing. YD: Conceptualization, Funding acquisition, Project administration, Supervision, Writing – review & editing. JS: Conceptualization, Project administration, Supervision, Writing – review & editing.
The author(s) declare financial support was received for the research, authorship, and/or publication of this article. This work was supported by Yunnan Provincial Key Programs (2019ZG00908), The NSFC grant (31970363), and The Key Basic Research Program of Yunnan Province (202101BC070003).
The authors declare that the research was conducted in the absence of any commercial or financial relationships that could be construed as a potential conflict of interest.
All claims expressed in this article are solely those of the authors and do not necessarily represent those of their affiliated organizations, or those of the publisher, the editors and the reviewers. Any product that may be evaluated in this article, or claim that may be made by its manufacturer, is not guaranteed or endorsed by the publisher.
The Supplementary Material for this article can be found online at: https://www.frontiersin.org/articles/10.3389/fpls.2024.1449006/full#supplementary-material
Aiello-Lammens, M. E., Boria, R. A., Radosavljevic, A., Vilela, B., Anderson, R. P. (2015). spThin: an R package for spatial thinning of species occurrence records for use in ecological niche models. Ecography 38, 541–545. doi: 10.1111/ecog.01132
Alachiotis, N., Pavlidis, P. (2018). RAiSD detects positive selection based on multiple signatures of a selective sweep and SNP vectors. Commun. Biol. 1, 79. doi: 10.1038/s42003-018-0085-8
Alexander, D. H., Novembre, J., Lange, K. (2009). Fast model-based estimation of ancestry in unrelated individuals. Genome Res. 19, 1655–1664. doi: 10.1101/gr.094052.109
Benson, G. (1999). Tandem repeats finder: a program to analyze DNA sequences. Nucleic Acids Res. 27, 573–580. doi: 10.1093/nar/27.2.573
Birney, E., Durbin, R. (2000). Using GeneWise in the Drosophila annotation experiment. Genome Res. 10, 547–548. doi: 10.1101/gr.10.4.547
Bolger, A. M., Lohse, M., Usadel, B. (2014). Trimmomatic: a flexible trimmer for Illumina sequence data. Bioinformatics 30, 2114–2120. doi: 10.1093/bioinformatics/btu170
Bradbury, P. J., Zhang, Z., Kroon, D. E., Casstevens, T. M., Ramdoss, Y., Buckler, E. S. (2007). TASSEL: software for association mapping of complex traits in diverse samples. Bioinformatics 23, 2633–2635. doi: 10.1093/bioinformatics/btm308
Brown, J. L., Hill, D. J., Dolan, A. M., Carnaval, A. C., Haywood, A. M. (2018). PaleoClim, high spatial resolution paleoclimate surfaces for global land areas. Sci. Data 5, 180254. doi: 10.1038/sdata.2018.254
Brůna, T., Hoff, K. J., Lomsadze, A., Stanke, M., Borodovsky, M. (2021). BRAKER2: automatic eukaryotic genome annotation with GeneMark-EP+ and AUGUSTUS supported by a protein database. NAR Genom. Bioinform. 3, lqaa108. doi: 10.1093/nargab/lqaa108
Burge, C., Karlin, S. (1997). Prediction of complete gene structures in human genomic DNA. J. Mol. Biol. 268, 78–94. doi: 10.1006/jmbi.1997.0951
Camacho, C., Coulouris, G., Avagyan, V., Ma, N., Papadopoulos, J., Bealer, K., et al. (2009). BLAST+: architecture and applications. BMC Bioinf. 10, 421. doi: 10.1186/1471-2105-10-421
Chen, C., Chen, H., Zhang, Y., Thomas, H. R., Frank, M. H., He, Y., et al. (2020). TBtools: an integrative toolkit developed for interactive analyses of big biological data. Mol. Plant 13, 1194–1202. doi: 10.1016/j.molp.2020.06.009
Chen, S., Wang, P., Kong, W., Chai, K., Zhang, S., Yu, J., et al. (2023). Gene mining and genomics-assisted breeding empowered by the pangenome of tea plant Camellia sinensis. Nat. Plants 9, 1986–1999. doi: 10.1038/s41477-023-01565-z
Chung, Y., Zhu, Y., Wu, M.-F., Simonini, S., Kuhn, A., Armenta-Medina, A., et al. (2019). Auxin Response Factors promote organogenesis by chromatin-mediated repression of the pluripotency gene SHOOTMERISTEMLESS. Nat. Commun. 10, 886. doi: 10.1038/s41467-019-08861-3
Dai, H., Guan, Y. (2020). Nubeam-dedup: a fast and RAM-efficient tool to de-duplicate sequencing reads without mapping. Bioinformatics 36, 3254–3256. doi: 10.1093/bioinformatics/btaa112
Danecek, P., Auton, A., Abecasis, G., Albers, C. A., Banks, E., DePristo, M. A., et al. (2011). The variant call format and VCFtools. Bioinformatics 27, 2156–2158. doi: 10.1093/bioinformatics/btr330
Deepika, D., Singh, A. (2022). Plant phospholipase D: novel structure, regulatory mechanism, and multifaceted functions with biotechnological application. Crit. Rev. Biotechnol. 42, 106–124. doi: 10.1080/07388551.2021.1924113
Delcher, A. L., Salzberg, S. L., Phillippy, A. M. (2003). Using MUMmer to identify similar regions in large sequence sets. Curr. Protoc. Bioinf. doi: 10.1002/0471250953.bi1003s00. Chapter 10, Unit 10.13.
Doebley, J. F., Gaut, B. S., Smith, B. D. (2006). The molecular genetics of crop domestication. Cell 127, 1309–1321. doi: 10.1016/j.cell.2006.12.006
Du, H., Liang, C. (2019). Assembly of chromosome-scale contigs by efficiently resolving repetitive sequences with long reads. Nat. Commun. 10, 5360. doi: 10.1038/s41467-019-13355-3
Dudchenko, O., Batra, S. S., Omer, A. D., Nyquist, S. K., Hoeger, M., Durand, N. C., et al. (2017). De novo assembly of the Aedes aEgypti genome using Hi-C yields chromosome-length scaffolds. Science 356, 92–95. doi: 10.1126/science.aal3327
Durand, N. C., Shamim, M. S., Machol, I., Rao, S. S., Huntley, M. H., Lander, E. S., et al. (2016). Juicer provides a one-click system for analyzing loop-resolution Hi-C experiments. Cell Syst. 3, 95–98. doi: 10.1016/j.cels.2016.07.002
Edgar, R. C. (2004). MUSCLE: multiple sequence alignment with high accuracy and high throughput. Nucleic Acids Res. 32, 1792–1797. doi: 10.1093/nar/gkh340
Ellinghaus, D., Kurtz, S., Willhoeft, U. (2008). LTRharvest, an efficient and flexible software for de novo detection of LTR retrotransposons. BMC Bioinf. 9, 18. doi: 10.1186/1471-2105-9-18
Emms, D. M., Kelly, S. (2019). OrthoFinder: phylogenetic orthology inference for comparative genomics. Genome Biol. 20, 238. doi: 10.1186/s13059-019-1832-y
Fitak, R. R. (2021). OptM: estimating the optimal number of migration edges on population trees using Treemix. Biol. Methods Protoc. 6, bpab017. doi: 10.1093/biomethods/bpab017
Gao, L., Gonda, I., Sun, H., Ma, Q., Bao, K., Tieman, D. M., et al. (2019). The tomato pan-genome uncovers new genes and a rare allele regulating fruit flavor. Nat. Genet. 51, 1044–1051. doi: 10.1038/s41588-019-0410-2
Golicz, A. A., Martinez, P. A., Zander, M., Patel, D. A., Van De Wouw, A. P., Visendi, P., et al. (2015). Gene loss in the fungal canola pathogen Leptosphaeria maculans. Funct. Integr. Genomics 15, 189–196. doi: 10.1007/s10142-014-0412-1
Grabherr, M. G., Haas, B. J., Yassour, M., Levin, J. Z., Thompson, D. A., Amit, I., et al. (2011). Full-length transcriptome assembly from RNA-Seq data without a reference genome. Nat. Biotechnol. 29, 644–652. doi: 10.1038/nbt.1883
Gremme, G., Steinbiss, S., Kurtz, S. (2013). GenomeTools: a comprehensive software library for efficient processing of structured genome annotations. IEEE/ACM Trans. Comput. Biol. Bioinform. 10, 645–656. doi: 10.1109/tcbb.2013.68
Gross, B. L., Olsen, K. M. (2010). Genetic perspectives on crop domestication. Trends Plant Sci. 15, 529–537. doi: 10.1016/j.tplants.2010.05.008
Guo, S., Zhang, X., Bai, Q., Zhao, W., Fang, Y., Zhou, S., et al. (2020). Cloning and functional analysis of dwarf gene mini plant 1 (MNP1) in Medicago truncatula. Int. J. Mol. Sci. 21. doi: 10.3390/ijms21144968
Gutaker, R. M., Groen, S. C., Bellis, E. S., Choi, J. Y., Pires, I. S., Bocinsky, R. K., et al. (2020). Genomic history and ecology of the geographic spread of rice. Nat. Plants 6, 492–502. doi: 10.1038/s41477-020-0659-6
Haas, B. J., Salzberg, S. L., Zhu, W., Pertea, M., Allen, J. E., Orvis, J., et al. (2008). Automated eukaryotic gene structure annotation using EVidenceModeler and the Program to Assemble Spliced Alignments. Genome Biol. 9, R7. doi: 10.1186/gb-2008-9-1-r7
Hodgson, J. M., Croft, K. D. (2010). Tea flavonoids and cardiovascular health. Mol. Aspects Med. 31, 495–502. doi: 10.1016/j.mam.2010.09.004
Huang, Y., Xing, X., Tang, Y., Jin, J., Ding, L., Song, A., et al. (2022). An ethylene-responsive transcription factor and a flowering locus KH domain homologue jointly modulate photoperiodic flowering in chrysanthemum. Plant Cell Environ. 45, 1442–1456. doi: 10.1111/pce.14261
Huerta-Cepas, J., Forslund, K., Coelho, L. P., Szklarczyk, D., Jensen, L. J., von Mering, C., et al. (2017). Fast Genome-Wide Functional Annotation through Orthology Assignment by eggNOG-Mapper. Mol. Biol. Evol. 34, 2115–2122. doi: 10.1093/molbev/msx148
Hurgobin, B., Golicz, A. A., Bayer, P. E., Chan, C. K., Tirnaz, S., Dolatabadian, A., et al. (2018). Homoeologous exchange is a major cause of gene presence/absence variation in the amphidiploid Brassica napus. Plant Biotechnol. J. 16, 1265–1274. doi: 10.1111/pbi.12867
Ichihara, K., Kobayashi, N., Saito, K. (2003). Lipid synthesis and acyl-CoA synthetase in developing rice seeds. Lipids 38, 881–884. doi: 10.1007/s11745-003-1139-0
Jurka, J., Kapitonov, V. V., Pavlicek, A., Klonowski, P., Kohany, O., Walichiewicz, J. (2005). Repbase Update, a database of eukaryotic repetitive elements. Cytogenet. Genome Res. 110, 462–467. doi: 10.1159/000084979
Kim, D., Paggi, J. M., Park, C., Bennett, C., Salzberg, S. L. (2019). Graph-based genome alignment and genotyping with HISAT2 and HISAT-genotype. Nat. Biotechnol. 37, 907–915. doi: 10.1038/s41587-019-0201-4
Koren, S., Walenz, B. P., Berlin, K., Miller, J. R., Bergman, N. H., Phillippy, A. M. (2017). Canu: scalable and accurate long-read assembly via adaptive k-mer weighting and repeat separation. Genome Res. 27, 722–736. doi: 10.1101/gr.215087.116
Kovaka, S., Zimin, A. V., Pertea, G. M., Razaghi, R., Salzberg, S. L., Pertea, M. (2019). Transcriptome assembly from long-read RNA-seq alignments with StringTie2. Genome Biol. 20, 278. doi: 10.1186/s13059-019-1910-1
Langmead, B., Salzberg, S. L. (2012). Fast gapped-read alignment with Bowtie 2. Nat. Methods 9, 357–359. doi: 10.1038/nmeth.1923
Lee, T. H., Guo, H., Wang, X., Kim, C., Paterson, A. H. (2014). SNPhylo: a pipeline to construct a phylogenetic tree from huge SNP data. BMC Genomics 15, 162. doi: 10.1186/1471-2164-15-162
Lei, X., Wang, Y., Zhou, Y., Chen, Y., Chen, H., Zou, Z., et al. (2021). TeaPGDB: tea plant genome database. Beverage Plant Res. 1, 1–12. doi: 10.48130/BPR-2021-0005
Li, H., Durbin, R. (2009). Fast and accurate short read alignment with Burrows-Wheeler transform. Bioinformatics 25, 1754–1760. doi: 10.1093/bioinformatics/btp324
Li, H., Durbin, R. (2011). Inference of human population history from individual whole-genome sequences. Nature 475, 493–496. doi: 10.1038/nature10231
Li, W., Godzik, A. (2006). Cd-hit: a fast program for clustering and comparing large sets of protein or nucleotide sequences. Bioinformatics 22, 1658–1659. doi: 10.1093/bioinformatics/btl158
Li, H., Handsaker, B., Wysoker, A., Fennell, T., Ruan, J., Homer, N., et al. (2009). The sequence alignment/Map format and SAMtools. Bioinformatics 25, 2078–2079. doi: 10.1093/bioinformatics/btp352
Li, Q., Lei, S., Du, K., Li, L., Pang, X., Wang, Z., et al. (2016b). RNA-seq based transcriptomic analysis uncovers α-linolenic acid and jasmonic acid biosynthesis pathways respond to cold acclimation in Camellia japonica. Sci. Rep. 6, 36463. doi: 10.1038/srep36463
Li, D., Luo, R., Liu, C. M., Leung, C. M., Ting, H. F., Sadakane, K., et al. (2016a). MEGAHIT v1.0: A fast and scalable metagenome assembler driven by advanced methodologies and community practices. Methods 102, 3–11. doi: 10.1016/j.ymeth.2016.02.020
Li, X., Zhang, L. P., Zhang, L., Yan, P., Ahammed, G. J., Han, W. Y. (2019). Methyl salicylate enhances flavonoid biosynthesis in tea leaves by stimulating the phenylpropanoid pathway. Molecules 24. doi: 10.3390/molecules24020362
Lin, P., Wang, K., Wang, Y., Hu, Z., Yan, C., Huang, H., et al. (2022). The genome of oil-Camellia and population genomics analysis provide insights into seed oil domestication. Genome Biol. 23, 14. doi: 10.1186/s13059-021-02599-2
Löffler-Wirth, H., Kalcher, M., Binder, H. (2015). oposSOM: R-package for high-dimensional portraying of genome-wide expression landscapes on bioconductor. Bioinformatics 31, 3225–3227. doi: 10.1093/bioinformatics/btv342
Lu, Z., Cao, H., Pan, L., Niu, L., Wei, B., Cui, G., et al. (2021). Two loss-of-function alleles of the glutathione S-transferase (GST) gene cause anthocyanin deficiency in flower and fruit skin of peach (Prunus persica). Plant J. 107, 1320–1331. doi: 10.1111/tpj.15312
Majoros, W. H., Pertea, M., Salzberg, S. L. (2004). TigrScan and GlimmerHMM: two open source ab initio eukaryotic gene-finders. Bioinformatics 20, 2878–2879. doi: 10.1093/bioinformatics/bth315
Manichaikul, A., Mychaleckyj, J. C., Rich, S. S., Daly, K., Sale, M., Chen, W. M. (2010). Robust relationship inference in genome-wide association studies. Bioinformatics 26, 2867–2873. doi: 10.1093/bioinformatics/btq559
Marcais, G., Kingsford, C. (2011). A fast, lock-free approach for efficient parallel counting of occurrences of k-mers. Bioinformatics 27, 764–770. doi: 10.1093/bioinformatics/btr011
Mardia, K. V. (1978). Some properties of clasical multi-dimesional scaling. Commun. Stat Theory Methods 7, 1233–1241. doi: 10.1080/03610927808827707
McKenna, A., Hanna, M., Banks, E., Sivachenko, A., Cibulskis, K., Kernytsky, A., et al. (2010). The Genome Analysis Toolkit: a MapReduce framework for analyzing next-generation DNA sequencing data. Genome Res. 20, 1297–1303. doi: 10.1101/gr.107524.110
Mendes, F. K., Vanderpool, D., Fulton, B., Hahn, M. W. (2020). CAFE 5 models variation in evolutionary rates among gene families. Bioinformatics. 36, 5516–5518 doi: 10.1093/bioinformatics/btaa1022
Milanesi, M., Capomaccio, S., Vajana, E., Bomba, L., Garcia, J. F., Ajmone-Marsan, P., et al. (2017). BITE: an R package for biodiversity analyses. bioRxiv, 181610. doi: 10.1101/181610
Muscarella, R., Galante, P. J., Soley-Guardia, M., Boria, R. A., Kass, J. M., Uriarte, M., et al. (2014). ENMeval: An R package for conducting spatially independent evaluations and estimating optimal model complexity for Maxent ecological niche models. Methods Ecol. Evol. 5, 1198–1205. doi: 10.1111/2041-210X.12261
Neumann, P., Novak, P., Hostakova, N., Macas, J. (2019). Systematic survey of plant LTR-retrotransposons elucidates phylogenetic relationships of their polyprotein domains and provides a reference for element classification. Mob DNA 10, 1. doi: 10.1186/s13100-018-0144-1
Nguyen, L. T., Schmidt, H. A., von Haeseler, A., Minh, B. Q. (2015). IQ-TREE: a fast and effective stochastic algorithm for estimating maximum-likelihood phylogenies. Mol. Biol. Evol. 32, 268–274. doi: 10.1093/molbev/msu300
Osborne, N., Leahy, C., Lee, Y. K., Rote, P., Song, B. J., Hardwick, J. P. (2022). CYP4V2 fatty acid omega hydroxylase, a druggable target for the treatment of metabolic associated fatty liver disease (MAFLD). Biochem. Pharmacol. 195, 114841. doi: 10.1016/j.bcp.2021.114841
Ou, S., Jiang, N. (2018). LTR_retriever: A highly accurate and sensitive program for identification of long terminal repeat retrotransposons. Plant Physiol. 176, 1410–1422. doi: 10.1104/pp.17.01310
Ou, S., Su, W., Liao, Y., Chougule, K., Agda, J. R. A., Hellinga, A. J., et al. (2019). Benchmarking transposable element annotation methods for creation of a streamlined, comprehensive pipeline. Genome Biol. 20, 275. doi: 10.1186/s13059-019-1905-y
Patel, R. K., Jain, M. (2012). NGS QC Toolkit: a toolkit for quality control of next generation sequencing data. PloS One 7, e30619. doi: 10.1371/journal.pone.0030619
Phillips, S. J., Anderson, R. P., Dudík, M., Schapire, R. E., Blair, M. E. (2017). Opening the black box: an open-source release of Maxent. Ecography 40, 887–893. doi: 10.1111/ecog.03049
Pickrell, J. K., Pritchard, J. K. (2012). Inference of population splits and mixtures from genome-wide allele frequency data. PloS Genet. 8, e1002967. doi: 10.1371/journal.pgen.1002967
Price, M. N., Dehal, P. S., Arkin, A. P. (2010). FastTree 2–approximately maximum-likelihood trees for large alignments. PloS One 5, e9490. doi: 10.1371/journal.pone.0009490
Purcell, S., Neale, B., Todd-Brown, K., Thomas, L., Ferreira, M. A., Bender, D., et al. (2007). PLINK: a tool set for whole-genome association and population-based linkage analyses. Am. J. Hum. Genet. 81, 559–575. doi: 10.1086/519795
Ranallo-Benavidez, T. R., Jaron, K. S., Schatz, M. C. (2020). GenomeScope 2.0 and Smudgeplot for reference-free profiling of polyploid genomes. Nat. Commun. 11, 1432. doi: 10.1038/s41467-020-14998-3
Ranallo-Benavidez, T. R., Lemmon, Z., Soyk, S., Aganezov, S., Salerno, W. J., McCoy, R. C., et al. (2021). Optimized sample selection for cost-efficient long-read population sequencing. Genome Res. 31, 910–918. doi: 10.1101/gr.264879.120
Salas, J. J., Ohlrogge, J. B. (2002). Characterization of substrate specificity of plant FatA and FatB acyl-ACP thioesterases. Arch. Biochem. Biophys. 403, 25–34. doi: 10.1016/s0003-9861(02)00017-6
Simao, F. A., Waterhouse, R. M., Ioannidis, P., Kriventseva, E. V., Zdobnov, E. M. (2015). BUSCO: assessing genome assembly and annotation completeness with single-copy orthologs. Bioinformatics 31, 3210–3212. doi: 10.1093/bioinformatics/btv351
Stanke, M., Diekhans, M., Baertsch, R., Haussler, D. (2008). Using native and syntenically mapped cDNA alignments to improve de novo gene finding. Bioinformatics 24, 637–644. doi: 10.1093/bioinformatics/btn013
Sun, Y., An, Z. (2005). Late Pliocene-Pleistocene changes in mass accumulation rates of eolian deposits on the central Chinese Loess Plateau. J. Geophys. Res.: Atmos. 110. doi: 10.1029/2005JD006064
Tarailo-Graovac, M., Chen, N. (2009). Using RepeatMasker to identify repetitive elements in genomic sequences. Curr. Protoc. Bioinf. doi: 10.1002/0471250953.bi0410s25. Chapter 4, Unit 4.10.
Teixeira, A. M., Sousa, C. (2021). A review on the biological activity of Camellia species. Molecules 26. doi: 10.3390/molecules26082178
Terhorst, J., Kamm, J. A., Song, Y. S. (2017). Robust and scalable inference of population history from hundreds of unphased whole genomes. Nat. Genet. 49, 303–309. doi: 10.1038/ng.3748
Tettelin, H., Masignani, V., Cieslewicz, M. J., Donati, C., Medini, D., Ward, N. L., et al. (2005). Genome analysis of multiple pathogenic isolates of Streptococcus agalactiae: implications for the microbial “pan-genome. Proc. Natl. Acad. Sci. U.S.A. 102, 13950–13955. doi: 10.1073/pnas.0506758102
Vasimuddin, M., Misra, S., Li, H., Aluru, S. (2019) “Efficient architecture-aware acceleration of BWA-MEM for multicore systems,” in 2019 IEEE International Parallel and Distributed Processing Symposium (IPDPS). (Rio de Janeiro, Brazil: IEEE) pp. 314–324. doi: 10.1109/IPDPS.2019.00041
Walker, B. J., Abeel, T., Shea, T., Priest, M., Abouelliel, A., Sakthikumar, S., et al. (2014). Pilon: an integrated tool for comprehensive microbial variant detection and genome assembly improvement. PloS One 9, e112963. doi: 10.1371/journal.pone.0112963
Wang, X., Feng, H., Chang, Y., Ma, C., Wang, L., Hao, X., et al. (2020). Population sequencing enhances understanding of tea plant evolution. Nat. Commun. 11, 4447. doi: 10.1038/s41467-020-18228-8
Wang, K., Li, M., Hakonarson, H. (2010). ANNOVAR: functional annotation of genetic variants from high-throughput sequencing data. Nucleic Acids Res. 38, e164. doi: 10.1093/nar/gkq603
Wang, Y., Tang, H., Debarry, J. D., Tan, X., Li, J., Wang, X., et al. (2012). MCScanX: a toolkit for detection and evolutionary analysis of gene synteny and collinearity. Nucleic Acids Res. 40, e49. doi: 10.1093/nar/gkr1293
Wang, H. M., To, K. Y., Lai, H. M., Jeng, S. T. (2016). Modification of flower colour by suppressing β-ring carotene hydroxylase genes in Oncidium. Plant Biol. (Stuttg) 18, 220–229. doi: 10.1111/plb.12399
Wang, M., Tu, L., Yuan, D., Zhu, D., Shen, C., Li, J., et al. (2019). Reference genome sequences of two cultivated allotetraploid cottons, Gossypium hirsutum and Gossypium barbadense. Nat. Genet. 51, 224–229. doi: 10.1038/s41588-018-0282-x
Wei, X., Liu, K., Zhang, Y., Feng, Q., Wang, L., Zhao, Y., et al. (2015). Genetic discovery for oil production and quality in sesame. Nat. Commun. 6, 8609. doi: 10.1038/ncomms9609
Wei, C., Yang, H., Wang, S., Zhao, J., Liu, C., Gao, L., et al. (2018). Draft genome sequence of Camellia sinensis var. sinensis provides insights into the evolution of the tea genome and tea quality. Proc. Natl. Acad. Sci. U.S.A. 115, E4151–e4158. doi: 10.1073/pnas.1719622115
Wirth, H., Löffler, M., von Bergen, M., Binder, H. (2011). Expression cartography of human tissues using self organizing maps. BMC Bioinf. 12, 306. doi: 10.1186/1471-2105-12-306
Wu, J., Zhu, J., Wang, L., Wang, S. (2017). Genome-wide association study identifies NBS-LRR-encoding genes related with anthracnose and common bacterial blight in the common bean. Front. Plant Sci. 8. doi: 10.3389/fpls.2017.01398
Xia, E., Tong, W., Hou, Y., An, Y., Chen, L., Wu, Q., et al. (2020). The reference genome of tea plant and resequencing of 81 diverse accessions provide insights into its genome evolution and adaptation. Mol. Plant 13, 1013–1026. doi: 10.1016/j.molp.2020.04.010
Xia, E. H., Zhang, H. B., Sheng, J., Li, K., Zhang, Q. J., Kim, C., et al. (2017). The tea tree genome provides insights into tea flavor and independent evolution of caffeine biosynthesis. Mol. Plant 10, 866–877. doi: 10.1016/j.molp.2017.04.002
Xu, Z., Wang, H. (2007). LTR_FINDER: an efficient tool for the prediction of full-length LTR retrotransposons. Nucleic Acids Res. 35, W265–W268. doi: 10.1093/nar/gkm286
Yang, Z. (2007). PAML 4: phylogenetic analysis by maximum likelihood. Mol. Biol. Evol. 24, 1586–1591. doi: 10.1093/molbev/msm088
Yang, K., Sun, Y., Li, W., Guo, X., Liu, Q., Gao, H. (2022). Genetic diversity and relationships among populations of Camellia japonica, an endangered species in China. Can. J. Plant Sci. 102, 136–146. doi: 10.1139/cjps-2021-0034
Yue, J., Chen, Q., Wang, Y., Zhang, L., Ye, C., Wang, X., et al. (2022). Telomere-to-telomere and gap-free reference genome assembly of the kiwifruit Actinidia chinensis. Hortic. Res. 10. doi: 10.1093/hr/uhac264
Zdobnov, E. M., Apweiler, R. (2001). InterProScan–an integration platform for the signature-recognition methods in InterPro. Bioinformatics 17, 847–848. doi: 10.1093/bioinformatics/17.9.847
Zeng, W., Endo, Y. (2019). Lipid characteristics of camellia seed oil. J. Oleo Sci. 68, 649–658. doi: 10.5650/jos.ess18234
Zhang, X., Chen, S., Shi, L., Gong, D., Zhang, S., Zhao, Q., et al. (2021). Haplotype-resolved genome assembly provides insights into evolutionary history of the tea plant Camellia sinensis. Nat. Genet. 53, 1250–1259. doi: 10.1038/s41588-021-00895-y
Zhang, C., Dong, S. S., Xu, J. Y., He, W. M., Yang, T. L. (2019). PopLDdecay: a fast and effective tool for linkage disequilibrium decay analysis based on variant call format files. Bioinformatics 35, 1786–1788. doi: 10.1093/bioinformatics/bty875
Zhang, Y., Gu, M., Wang, R., Li, M., Li, D., Xie, Z. (2020c). Dietary supplement of Yunkang 10 green tea and treadmill exercise ameliorate high fat diet induced metabolic syndrome of C57BL/6 J mice. Nutr. Metab. 17, 14. doi: 10.1186/s12986-020-0433-9
Zhang, Q. J., Li, W., Li, K., Nan, H., Shi, C., Zhang, Y., et al. (2020a). The chromosome-level reference genome of tea tree unveils recent bursts of non-autonomous LTR retrotransposons in driving genome size evolution. Mol. Plant 13, 935–938. doi: 10.1016/j.molp.2020.04.009
Zhang, Z., Lib, J., Zhao, X.-Q., Wang, J., Wong, G. K.-S., Yu, J. (2006). KaKs_Calculator: calculating Ka and Ks through model selection and model averaging. Genomics Proteomics Bioinf. 4, 259–263. doi: 10.1016/s1672-0229(07)60007-2
Zhang, K., Wang, R., Zi, H., Li, Y., Cao, X., Li, D., et al. (2018). AUXIN RESPONSE FACTOR3 regulates floral meristem determinacy by repressing cytokinin biosynthesis and signaling. Plant Cell 30, 324–346. doi: 10.1105/tpc.17.00705
Zhang, W., Zhang, Y., Qiu, H., Guo, Y., Wan, H., Zhang, X., et al. (2020b). Genome assembly of wild tea tree DASZ reveals pedigree and selection history of tea varieties. Nat. Commun. 11, 3719. doi: 10.1038/s41467-020-17498-6
Keywords: Camellia, Camellia sinensis var. assamica cv. ‘Yunkang10’, resequencing, pangenome, assembly
Citation: Duan S, Yan L, Shen Z, Li X, Chen B, Li D, Qin H, Meegahakumbura MK, Wambulwa MC, Gao L, Chen W, Dong Y and Sheng J (2024) Genomic analyses of agronomic traits in tea plants and related Camellia species. Front. Plant Sci. 15:1449006. doi: 10.3389/fpls.2024.1449006
Received: 14 June 2024; Accepted: 07 August 2024;
Published: 26 August 2024.
Edited by:
Zhenbin Hu, Agricultural Research Service (USDA), United StatesReviewed by:
Hengfu Yin, Chinese Academy of Forestry, ChinaCopyright © 2024 Duan, Yan, Shen, Li, Chen, Li, Qin, Meegahakumbura, Wambulwa, Gao, Chen, Dong and Sheng. This is an open-access article distributed under the terms of the Creative Commons Attribution License (CC BY). The use, distribution or reproduction in other forums is permitted, provided the original author(s) and the copyright owner(s) are credited and that the original publication in this journal is cited, in accordance with accepted academic practice. No use, distribution or reproduction is permitted which does not comply with these terms.
*Correspondence: Jun Sheng, c2hlbmdqdW5AZG9uZ3lhbmctbGFiLm9yZw==; Yang Dong, bG95YWx5YW5nQDE2My5jb20=; Wei Chen, d2NoZW5udHJAZ21haWwuY29t; Lianming Gao, Z2FvbG1AbWFpbC5raWIuYWMuY24=
†These authors have contributed equally to this work
Disclaimer: All claims expressed in this article are solely those of the authors and do not necessarily represent those of their affiliated organizations, or those of the publisher, the editors and the reviewers. Any product that may be evaluated in this article or claim that may be made by its manufacturer is not guaranteed or endorsed by the publisher.
Research integrity at Frontiers
Learn more about the work of our research integrity team to safeguard the quality of each article we publish.