
94% of researchers rate our articles as excellent or good
Learn more about the work of our research integrity team to safeguard the quality of each article we publish.
Find out more
ORIGINAL RESEARCH article
Front. Plant Sci. , 26 August 2024
Sec. Plant Abiotic Stress
Volume 15 - 2024 | https://doi.org/10.3389/fpls.2024.1424689
 Prasit Khunsanit1,2†Navarit Jitsamai2,3†Nattana Thongsima2,3Supachitra Chadchawan4,5Monnat Pongpanich5,6Isabelle M. Henry7Luca Comai7Duangjai Suriya-Arunroj8Itsarapong Budjun8Teerapong Buaboocha2,5*
Introduction: Owing to advances in high-throughput genome sequencing, QTL-Seq mapping of salt tolerance traits is a major platform for identifying soil-salinity tolerance QTLs to accelerate marker-assisted selection for salt-tolerant rice varieties. We performed QTL-BSA-Seq in the seedling stage of rice from a genetic cross of the extreme salt-sensitive variety, IR29, and “Jao Khao” (JK), a Thai salt-tolerant variety.
Methods: A total of 462 F2 progeny grown in soil and treated with 160 mM NaCl were used as the QTL mapping population. Two high- and low-bulk sets, based on cell membrane stability (CMS) and tiller number at the recovery stage (TN), were equally sampled. The genomes of each pool were sequenced, and statistical significance of QTL was calculated using QTLseq and G prime (G′) analysis, which is based on calculating the allele frequency differences or Δ(SNP index).
Results: Both methods detected the overlapping interval region, wherein CMS-bulk was mapped at two loci in the 38.41–38.85 Mb region with 336 SNPs on chromosome 1 (qCMS1) and the 26.13–26.80 Mb region with 1,011 SNPs on chromosome 3 (qCMS3); the Δ(SNP index) peaks were −0.2709 and 0.3127, respectively. TN-bulk was mapped at only one locus in the overlapping 38.26–38.95 Mb region on chromosome 1 with 575 SNPs (qTN1) and a Δ(SNP index) peak of −0.3544. These identified QTLs in two different genetic backgrounds of segregating populations derived from JK were validated. The results confirmed the colocalization of the qCMS1 and qTN1 traits on chromosome 1. Based on the CMS trait, qCMS1/qTN1 stably expressed 6%–18% of the phenotypic variance in the two validation populations, while qCMS1/qTN1 accounted for 16%–20% of the phenotypic variance in one validation population based on the TN trait.
Conclusion: The findings confirm that the CMS and TN traits are tightly linked to the long arm of chromosome 1 rather than to chromosome 3. The validated qCMS-TN1 QTL can be used for gene/QTL pyramiding in marker-assisted selection to expedite breeding for salt resistance in rice at the seedling stage.
Soil salinity poses a significant threat to food security and human nutrition, as it can be caused by both natural soil salinization occurrences and artificial conditions (Amoah et al., 2020; Kumar and Sharma, 2020; Lei et al., 2020). In the northeast part of Thailand, which is the primary region for rice cultivation, rice yields are relatively low. One of the key factors contributing to this decline in rice yield is soil salinity originating from underground rock salt and seemingly influenced by rainfall patterns (Yang et al., 2022). Salt-prone regions in the northeast cover 1.84 million hectares, representing 16% of the rainfed lowland area of this part of Thailand (Punyawaew et al., 2016; Vanavichit et al., 2018). Soil affected with 50 mM NaCl can result in rice (Oryza sativa) yield reduction by up to 50% (Wu et al., 2020) and poses a significant limitation to all stages of rice cultivation by limiting soil water absorption (osmotic stress), increasing the Na+/K+ ratio within the cell (ionic toxicity) through ion uptake by membrane transporters, and initiating oxidative stress (Bonilla, 2002; Munns and Tester, 2008). Rice has been regarded as a preeminent model for exploring molecular genetics in cereal crops (Khush and Brar, 2001; Haque et al., 2021). The utilization of high-throughput sequencing to sequence the rice genome has resulted in the identification of a considerable number of mutations present within the genome (Lekklar et al., 2019b). These mutations are indicative of high genetic diversity within the rice genome. Single-nucleotide polymorphisms (SNPs) and insertion/deletion (InDel) events occur with a high frequency across both coding and non-coding regions (Jain et al., 2014). These polymorphisms are highly diverse and can be utilized as genetic markers (Ganal et al., 2009; Rajcan et al., 2011; Gimhani et al., 2016). Consequently, a novel line of rice cultivars with tolerance to salinity has been developed by utilizing a range of genetic resources aimed at mitigating susceptibility to salinity (Quan et al., 2018).
The regulation of plant phenotype is predominantly mediated by polygenic factors and their interaction with the external environment. The salt tolerance trait is influenced by both major and minor quantitative trait loci (QTLs) (Mackill and Ni, 2001), with each having a small effect (Takagi et al., 2013). The identification of QTLs is still challenging when investigating the multiple genes that affect salt tolerance in rice. QTL mapping is a forward genetics method used to identify the location of QTLs in the genome, which can be employed alongside bulk segregant analysis (BSA) and genome sequencing (Majeed et al., 2022). QTL-BSA mapping is a rapid and cost-effective technique (Zegeye et al., 2018; Dai et al., 2022; de la Fuente Cantó and Vigouroux, 2022) for detecting novel QTLs for salinity tolerance by establishing a biparental population and mapping it to the F2 segregating population (Sun et al., 2019; Pundir et al., 2021). SNPs are widespread in the genome due to its many polymorphisms and are effectively present in genes/QTLs that can be frequently linked to important traits. Compared with conventional QTL mapping, QTL-Seq offers the possibility to detect the abundance of DNA polymorphisms, such as SNPs and InDels across the genome, which are invaluable for use as molecular markers in marker-assisted selection (MAS) (Dwiningsih et al., 2020).
In MAS development, QTLs are mapped and validated (Collard and Mackill, 2008; Acquaah, 2012; Geng et al., 2023). Thus, the first step of MAS development is QTL mapping, which involves the construction of mapping populations and linkage maps. The next step is validation, which is a verification step to confirm the stability of the identified QTLs and includes QTL validation using the population derived from the QTL mapping. The marker validation process is performed using important breeding material before marker-assisted breeding. In rice, both wild and cultivated rice, QTL mapping has been performed to identify novel QTLs for salt-stress tolerance (Bizimana et al., 2017; Rahman et al., 2017; Quan et al., 2018; Kong et al., 2021; Singh et al., 2021; Xie et al., 2022; Yuan et al., 2022). Salt tolerance is a complex trait controlled by multiple genes. Identifying and characterizing the causative genes to the end of clarifying their molecular mechanisms is crucial for improving new cultivars (Flowers, 2004; Reddy et al., 2017). Additionally, to develop new cultivars with enhanced yield and tolerance to abiotic stress, genetic variation at all levels, both within and between species, has been employed in breeding schemes; however, the limited availability of germplasm for salt tolerance that can be crossed without associated yield penalty has led to slow progress in developing salt-tolerant cultivars (Ashraf and Munns, 2022). For Thai rice, only a few local germplasms have been used in rice breeding for salt tolerance traits. Our previous study revealed that “Jao Khao” (JK), a Thai domestic germplasm rice variety, has the capacity for high yields under salinity stress (Lekklar et al., 2019a; Habila et al., 2022). Therefore, JK is a promising candidate for facilitating the transmission of salt tolerance traits; hence, we use it as a donor line for salt tolerance traits.
In this study, we aimed to develop molecular markers for soil-salinity tolerance by identifying QTLs in the F2 progeny derived from the donor rice line, JK, using QTL-Seq mapping combined with BSA. The identified QTLs were then validated in validation populations obtained from two different genetic backgrounds.
According to our previous study on 206 varieties of Thai rice under salt stress in the heading stage (Lekklar et al., 2019a), the JK variety showed high tillers per plant and filled grain per plant stability indexes compared with those of “Pokkali” (a standard salt-tolerant cultivar) (Habila et al., 2022). Consequently, JK was used as a donor line in the cross with the standard salt-sensitive cultivar IR29. The marker-assisted development pipeline used in the current study, including QTL mapping and validation, is illustrated in Figure 1. The F1 progeny were produced and then self-pollinated to generate more than 10,000 seeds of the F2 population. These experiments were conducted at the Nakhon Ratchasima Rice Research Center, Rice Department, Ministry of Agriculture and Cooperatives, Thailand.
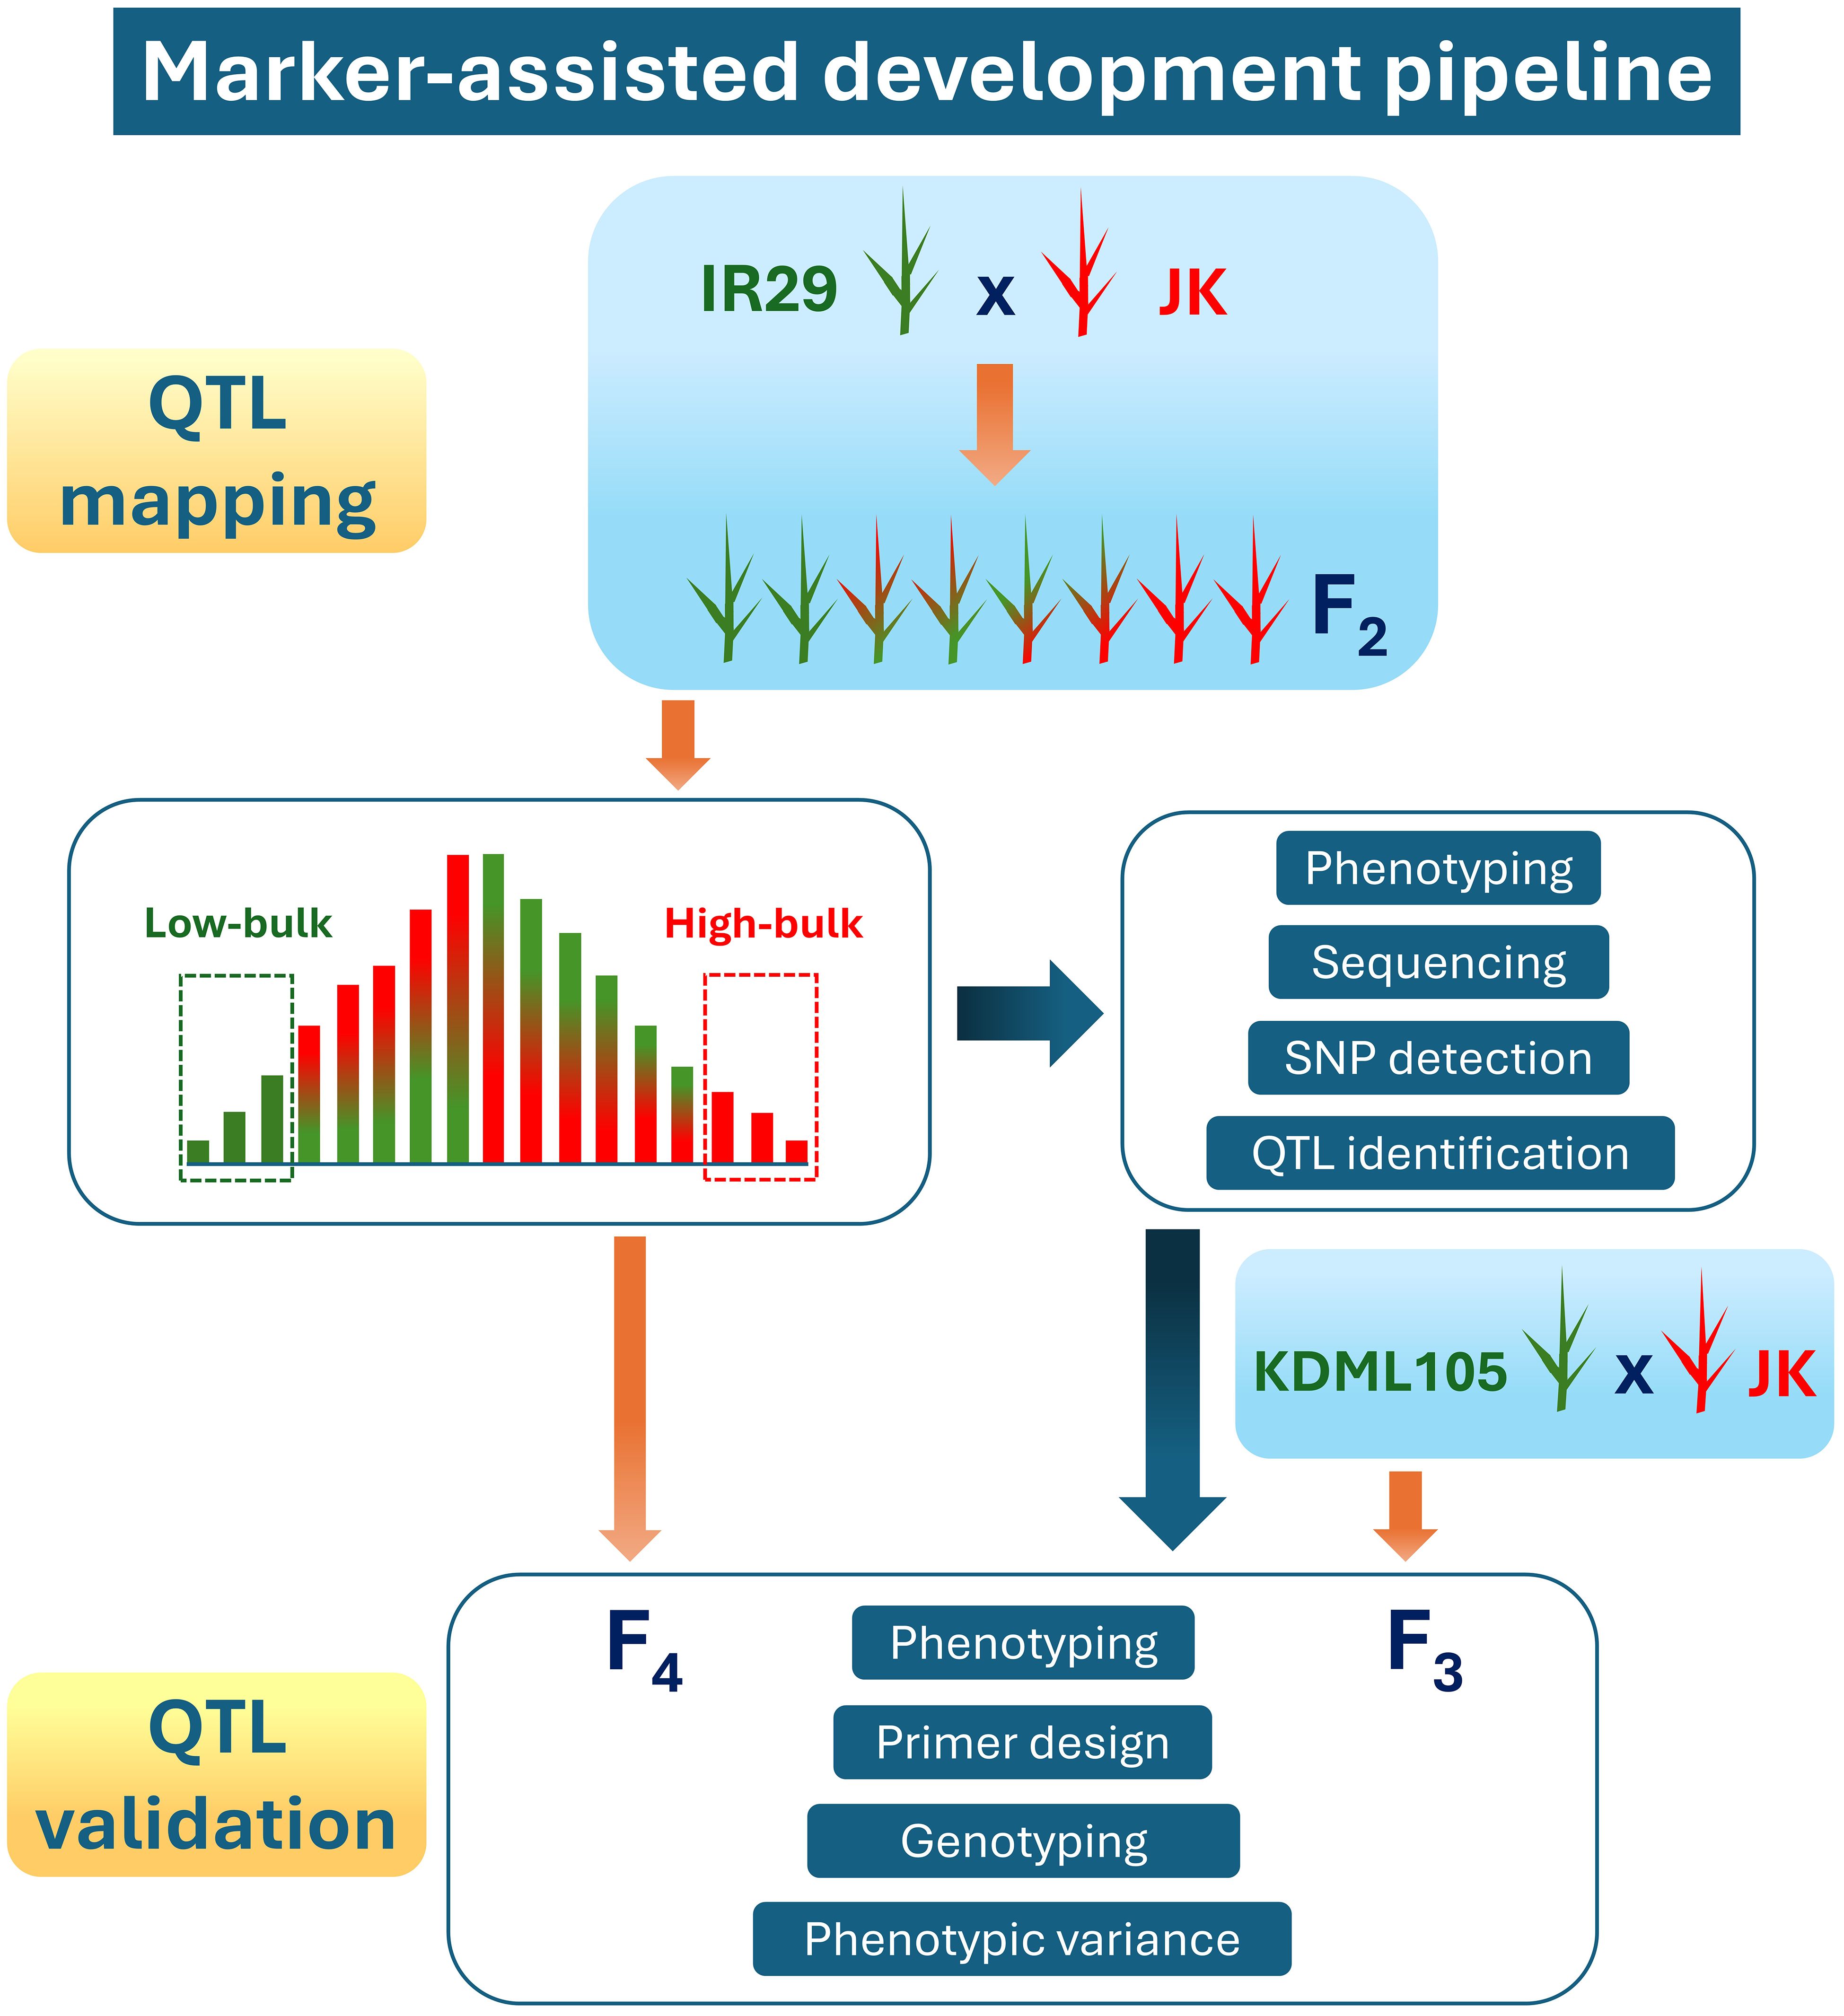
Figure 1. Marker-assisted development pipeline used in this study.
Rice seeds were randomly selected from the F2 population, soaked in water for germination, and transplanted into soil in a 4-inch pot (one seedling per pot). Next, a total of 462 3-week-old rice seedlings were subjected to 115 mM NaCl treatment for 3 days (13.1 dS m−1). After this treatment period, the concentration of the saline solution was increased to 160 mM NaCl for 7 days (18.6 dS m−1). Then, on day 7, cell membrane stability (CMS) was determined, and tap water was used thereafter to remove salt to re-establish normal conditions. After 10 days of recovery, the tiller number per plant (TN) was counted. CMS was determined based on electrolyte leakage, which was determined via electrical conductivity (EC) measurement. Approximately 1.5 mg of fully expanded leaf tissues were selected, weighed, cut into small 1- to 2-cm pieces, soaked in 10 mL of deionized water, and incubated at 25°C for 4–5 h. Thereafter, the initial electrical conductivity (EC1) was determined. To disturb the whole cell, the samples were autoclaved at 121°C for 20 min and then cooled, after which the final electrical conductivity (EC2) was measured. CMS was calculated as CMS = 100 × [1 − (EC1/EC2)] (Habila et al., 2021). Two sets of phenotypes were separately arranged to select the pool of opposite phenotypes: CMS-bulk contained 21 plants each of high- or low-CMS, and TN-bulk contained 28 plants each of high- or low-TN.
Fresh leaf samples were collected before the rice seedlings were subjected to salt-stress conditions. Genomic DNA (gDNA) was extracted from the fresh leaves using a gDNA extraction kit (Geneaid Biotech Ltd., New Taipei City, Taiwan). Individual plants from all four groups of the two phenotypes (high- and low-CMS and high- and low-TN) were used to construct gDNA libraries, which were pooled in equal amounts for each group. To prepare the whole-genome library, genomic DNA was fragmented with dsDNA Fragmentase (New England Biolabs, Ipswich, MA). The resulting sheared DNA was modified with an End Repaired enzyme (New England Biolabs), and deoxyadenosine was added to the 3′ end using a Klenow fragment (New England Biolabs). Each library had unique DNA barcodes (Bioo Scientific, Austin, TX) joined to the DNA using DNA ligase (New England Biolabs). The short sequence reads obtained from the Illumina Sequencer (Illumina, San Diego, CA, USA) were demultiplexed and trimmed using Trimmomatic-0.39 (available at http://www.usadellab.org/cms/index.php?page=trimmomatic) (Bolger et al., 2014). The raw reads from each extreme pool were aligned against the reference genome by the Burrow-Wheeler Aligner (version 0.5.7–1) (Li and Durbin, 2010) using the rice reference genome version IRGSP-1.0 downloaded from the EnsemblPlants database (https://plants.ensembl.org/index.html) (Kawahara et al., 2013; Matsumoto et al., 2016) and indexed by SAMtools (Li et al., 2009). The mapped reads were processed using Picard (https://broadinstitute.github.io/picard/). Variants were called and filtered using a genome analysis toolkit (GATK; version 3.3-0) (McKenna et al., 2010).
The QTLs were mapped using both the QTL-seq method and the G prime method in the R package “QTLseqr” (Magwene et al., 2011; Mansfeld and Grumet, 2018). The identified SNPs were filtered using the following criteria: reference allele frequency = 0.4, minimal total depth = 100, maximum total depth = 400, depth difference between bulks = 60, minimum sample depth = 40, and minimum genotype quality = 99. The SNP index at any allele location was compared with that of reference alleles (Nipponbare). The SNP index was calculated as SNP indexi = the alternate allele depth/total read depth, where i is the location of the SNP. In a given genomic interval, the distribution of Δ(SNP index) between the bulks was estimated using a 50-kb (for QTL-seq) or 1-Mb (for G prime) sliding window. The regions where the Δ(SNP index) passed the confidence intervals of 95% and 99% according to the statistical simulations were referred to as regions harboring the major QTLs responsible for the differences between the bulks (Takagi et al., 2013; Itoh et al., 2019).
Two progeny validation populations were used to assess the consistency of the identified QTLs. To this end, the single-seed descent (SSD) method was established. First, the F4 population was produced from the F2 progeny derived from crossing JK with IR29 from the prior QTL mapping population. Second, the population for marker validation was established using F3 from a cross between JK and “Khao Dawk Ma Li 105” (KDML105), a relatively salt-sensitive Thai rice cultivar. These experiments were performed at the Nakhon Ratchasima Rice Research Center. To establish the validation population, seeds from the F4 and F3 populations were sown to produce approximately 800 and 1,200 seedlings, respectively. The stress and recovery conditions were given as previously described. The phenotypes were assessed in two stages: during stress, measuring CMS and tiller number_stress (TN_s), and during recovery, measuring tiller number_recovery (TN_r). CMS and TN were determined as previously described.
PCR using allele-specific primers (ASPs) was performed based on the significant SNPs identified in the QTLs. These primers were designed to bind the regions containing SNPs that can clearly distinguish between the salt-tolerant allele (JK) and the salt-sensitive alleles (IR29 and KDML105). We used at least 250 bp covering the target SNPs to design the ASP with approximately 30-bp gap between each product by the WebSNAPER software (https://pga.mgh.harvard.edu/cgi-bin/snap3/websnaper3.cgi). A mismatch base was added within the three nucleotides adjacent to the 3′ terminus to improve the efficacy of the differential PCR. Reportedly, a single base mismatch (SNP) can cause false-positive detection; therefore, increasing the number of artificial mismatch bases can reduce false-positive results (Liu et al., 2012; Kim et al., 2016).
gDNA was isolated from young leaf tissue according to the CTAB procedure (Aboul-Maaty and Oraby, 2019). The DNA concentration was diluted to 100 ng/mL, and the quality was determined using a UV spectrophotometer (Eppendorf, Hamburg, Germany). To identify the unique molecular marker, an ASP was tested on the F3 or F4 progenies. The PCR mixture (10 µL) contained 1 µL of gDNA, 0.5 µL of each primer (0.5 µM), 5 µL of 2×Tag Mastermix PCR buffer (Vivantis Technologies, Shah Alam, Malaysia), and 3 µL of ddH2O. First, a step gradient PCR program was used to determine the proper annealing temperature of each primer. The program was set to comprise an initial denaturation at 95°C for 5 min, followed by 35 cycles of amplification consisting of denaturation at 95°C for 25 s, annealing at 49°C for 30 s, and extension at 72°C for 35 s. The final extension was conducted at 72°C for 5 min, followed by a cooling step at 20°C for 5 min. The PCR amplicon was combined with a 6× tracking dye and subjected to electrophoresis using 2% agarose gel and run in 1× TBE buffer at 100 mV for 30 min. The gels were recorded using a molecular imaging system (Amersham ImageQuant 800, GE Healthcare, UK) to assess and score the bands.
QGene software (version 4.4.0) (Joehanes and Nelson, 2008) was used to perform single marker analysis of phenotype and genotype correlations. The correlations were expressed as R2 (%) and used to explain the proportion of the phenotypic variation explained (PVE) by the QTLs of the progenies. The mean phenotypic value for each line was determined using individuals with similar genotypes, with a minimum of three replicates. Furthermore, descriptive and Pearson analyses were performed using SPSS (SPSS Inc., Chicago, IL, USA) (George and Mallery, 2019). R (R Foundation for Statistical Computing, Vienna, Austria) was used to construct graphs (Team, 2020).
Phenotyping of the F2 population derived from a cross between the extreme salt-sensitive variety IR29 and JK, a Thai salt-tolerant variety, was performed in two phases: CMS and TN_s traits were measured in the stressed phase, and the TN_r trait was measured in the recovery phase. The distribution of the CMS values is shown in Figure 2. IR29, a standard salt-sensitive line, displayed a bimodal distribution, which exhibited two distinct peaks at 50%–60% and 70%–80% CMS (Figure 2A), whereas “Pokkali” a standard salt-tolerant line, mostly exhibited a high CMS (Figure 2B). The CMS distribution of F2 (Figure 2D) was more similar to that of JK, the salt donor line used in the present study (Figure 2C). TN demonstrated that almost all varieties had one tiller per plant at the recovery stage after salt treatment. “Pokkali” had a greater proportion of plants with two tillers, and “Pokkali” and F2 offspring had a few plants with three tillers per plant (Figure 3). The CMS distribution of F2 was left-skewed under a normal distribution, and the means of high and low CMS-bulk were 92.84% and 7.05%, respectively (Supplementary Table 1 and Supplementary Figures 1A, C). However, the TN distribution showed the opposite trend, i.e., a right-skewed pattern (Supplementary Figures 1B, D), with the means of the high TN-bulk and low TN-bulk being 2 and 0 tillers per plant, respectively.
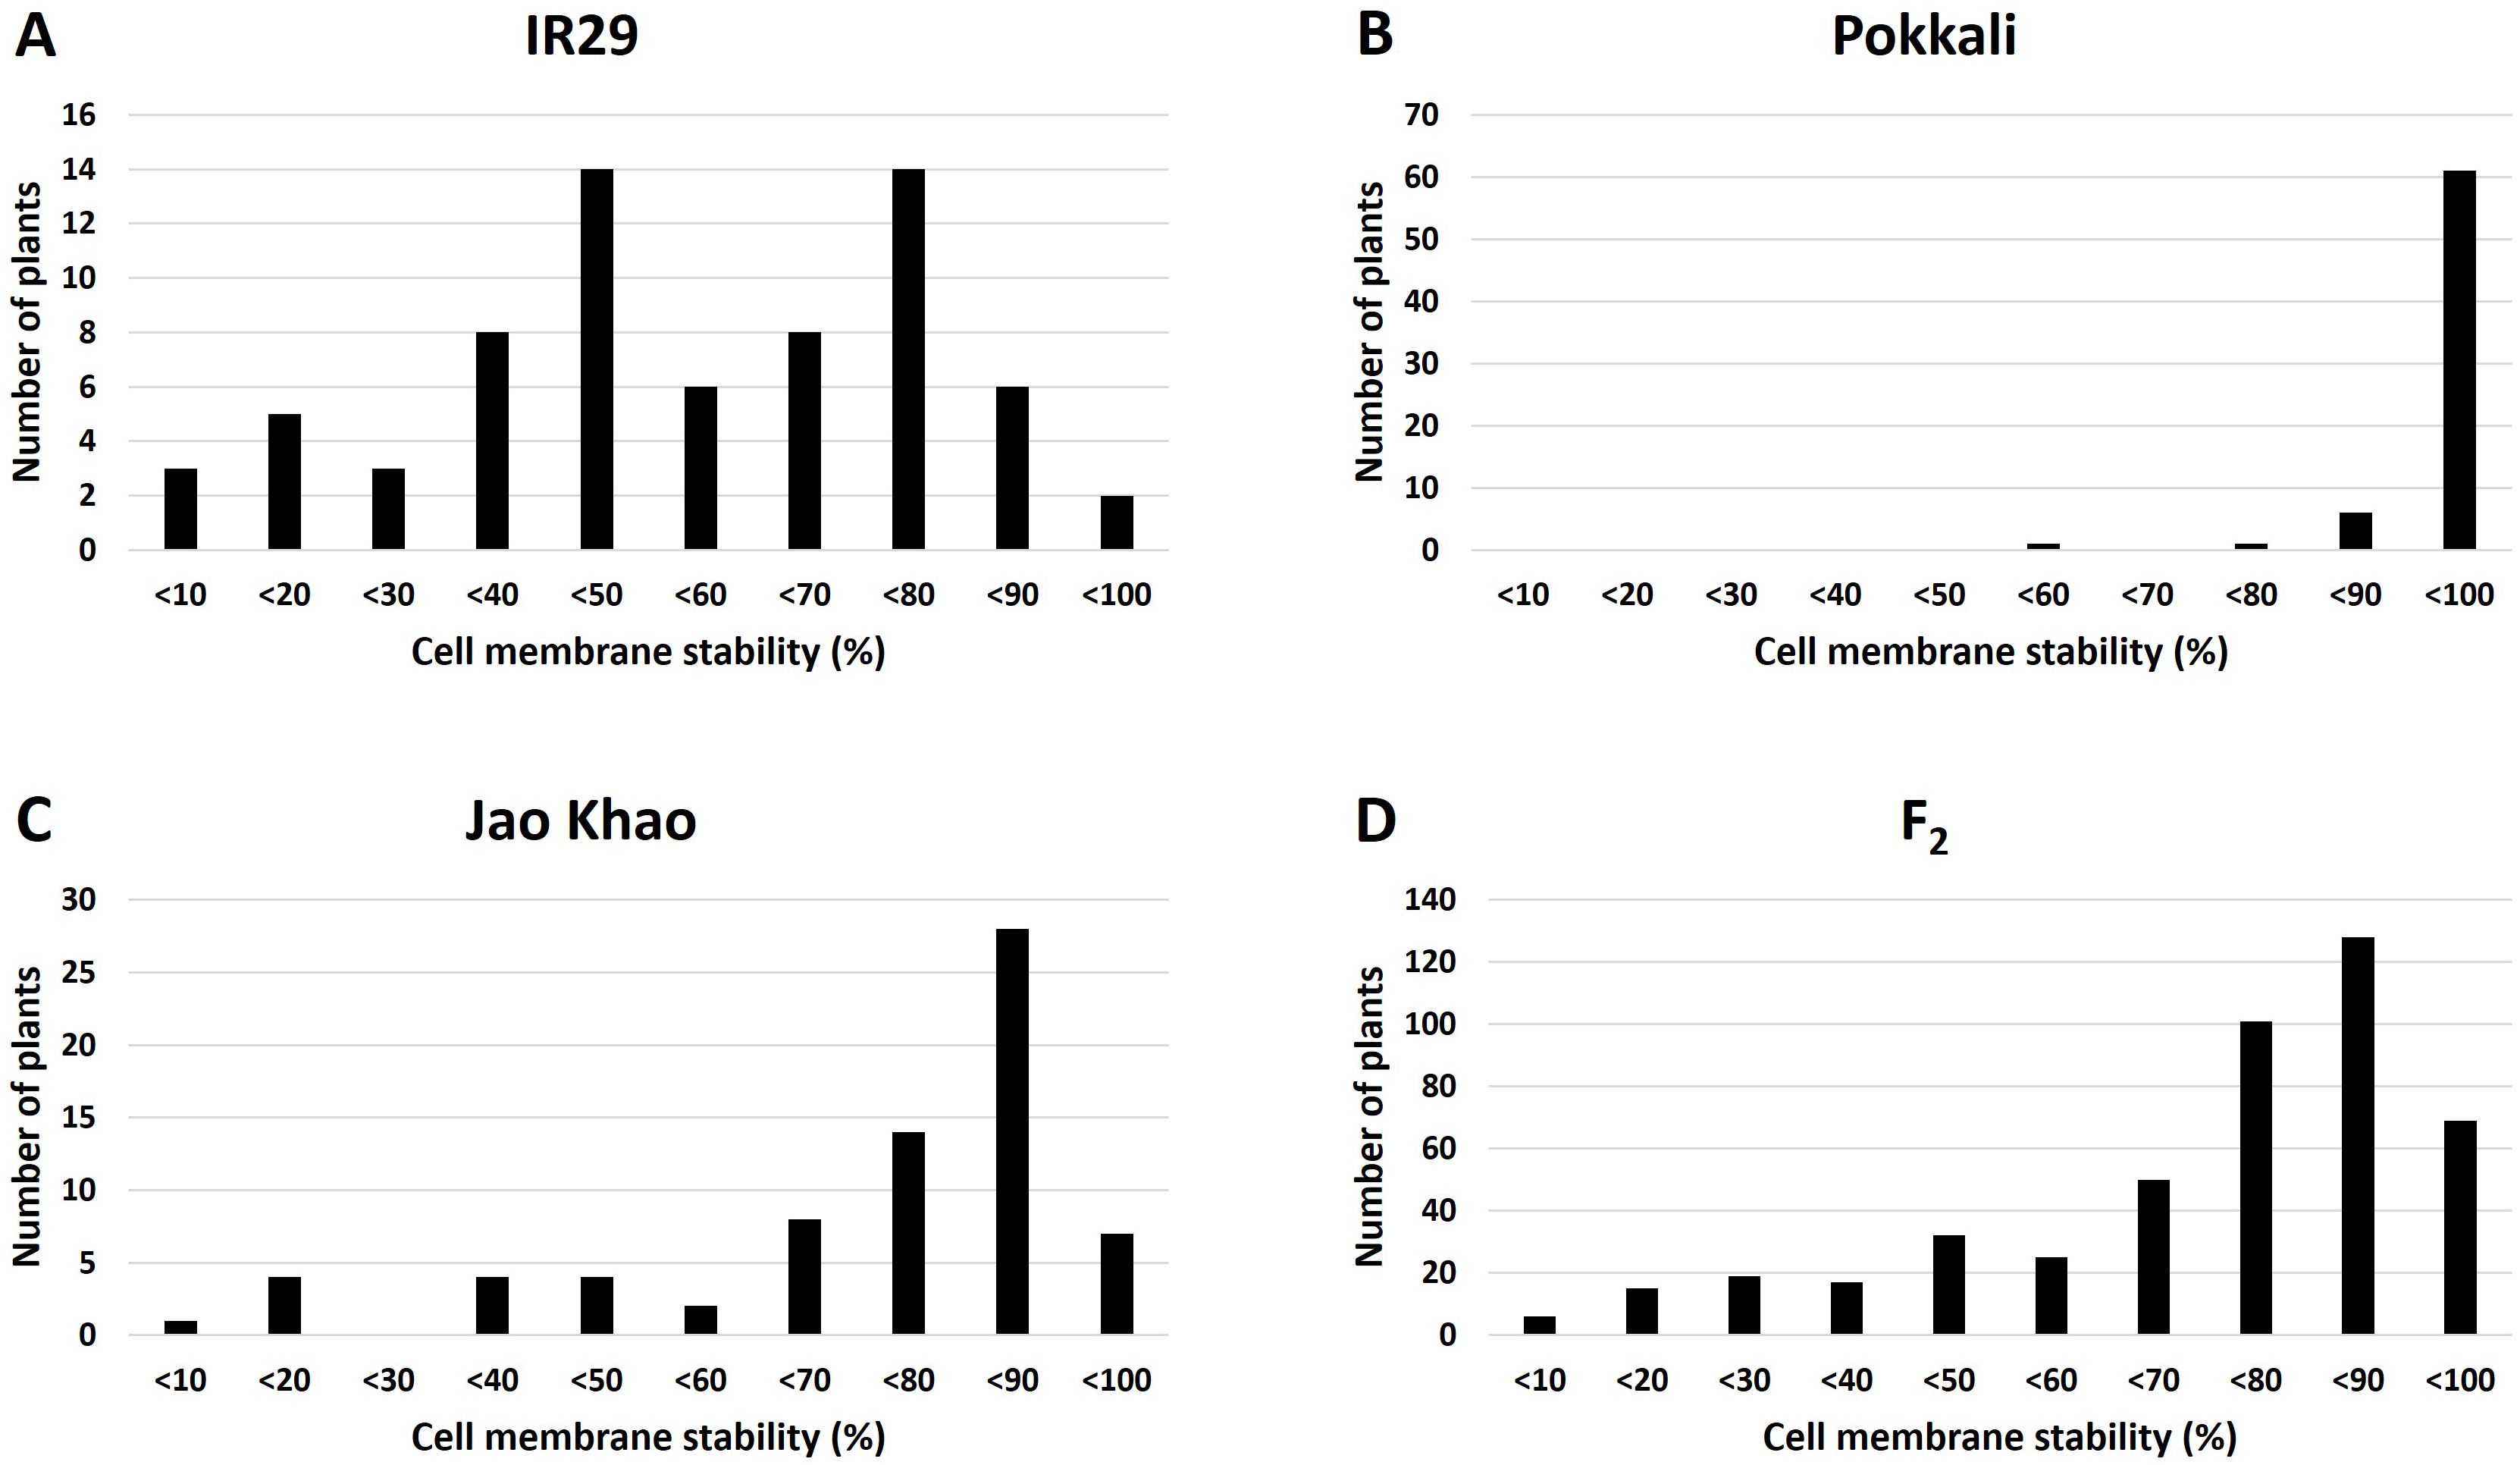
Figure 2. Distribution of cell membrane stability under salt-stress treatment in (A) IR29 (n = 69), (B) “Pokkali” (n = 69), (C) “Jao Khao” (n = 72), and (D) the F2 population (n = 462).
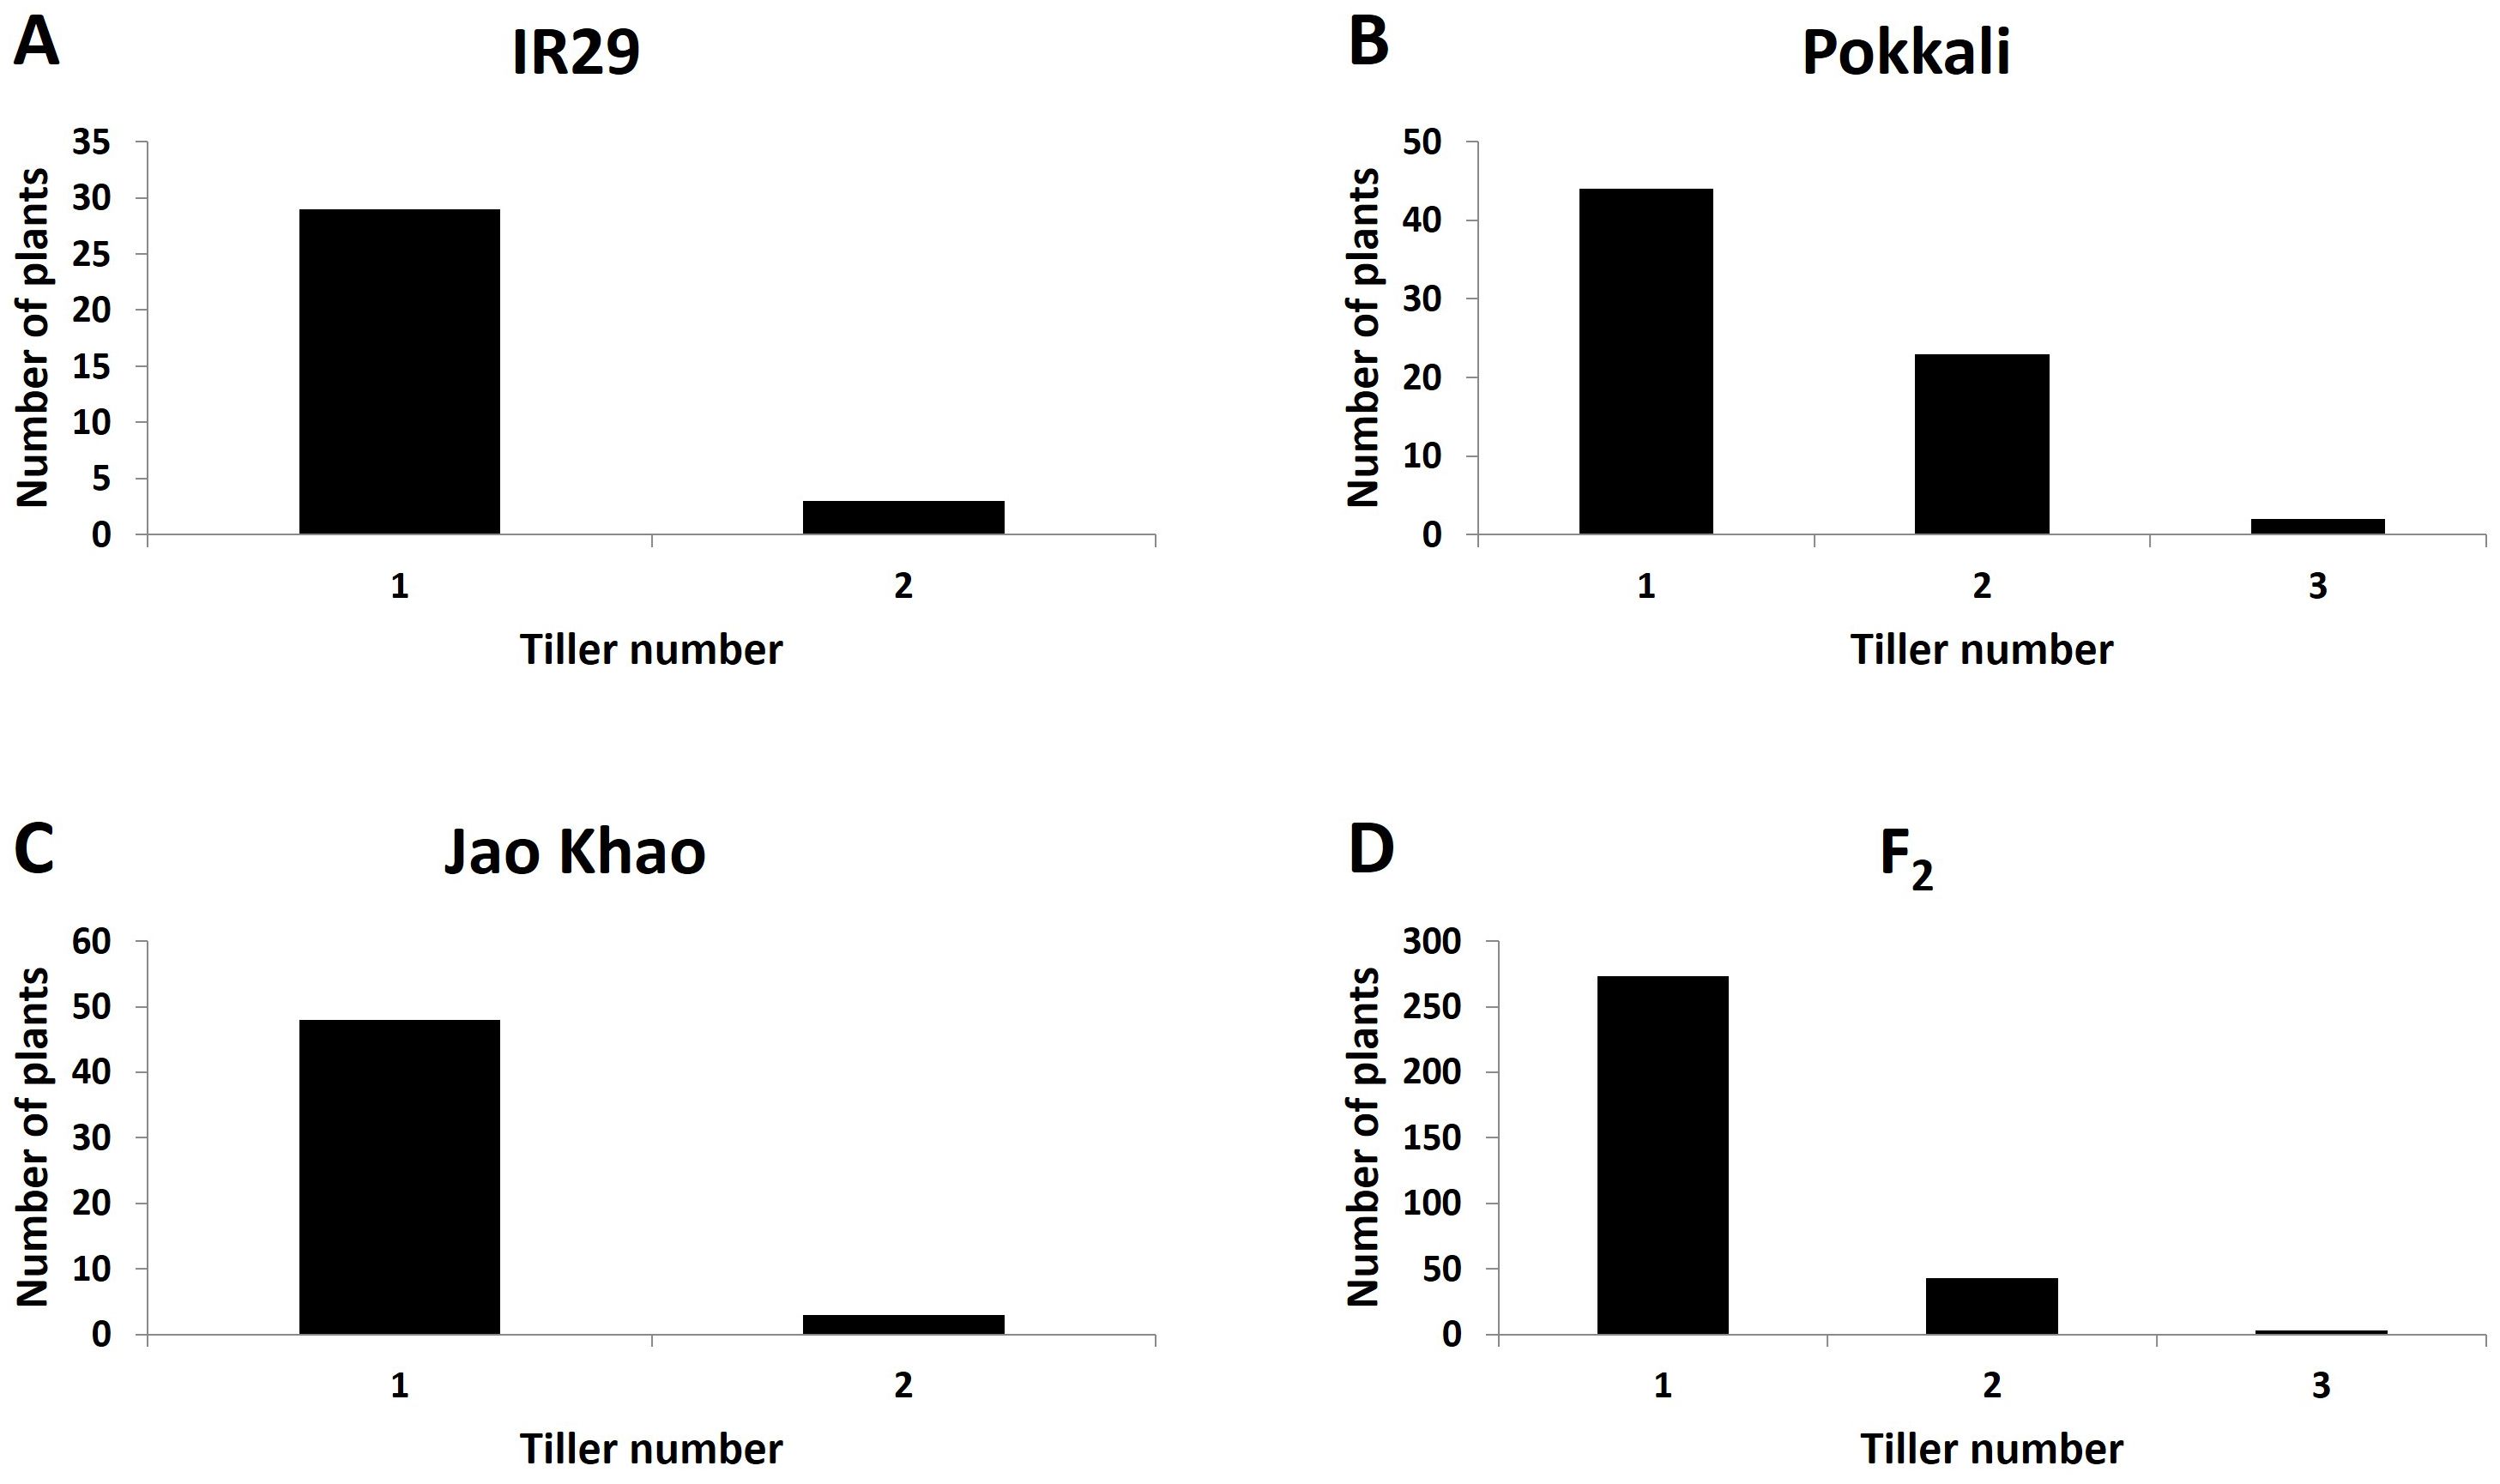
Figure 3. Distribution of tiller number under salt-stress treatment in (A) IR29 (n = 69), (B) “Pokkali” (n = 69), (C) “Jao Khao” (n = 72), and (D) the F2 population (n = 462).
QTL mapping by QTLseqr revealed that for the CMS trait, QTLs were identified on chromosomes 1, 3, 4, 9, and 11 using the G′ method, and to chromosomes 1 and 3 using the QTL-seq method. The overlapping regions between the two methods were between 38.41 and 38.85 Mb on chromosome 1, designated as qCMS1 (QTL1), and between 26.13 and 26.80 Mb on chromosome 3, designated qCMS3 (QTL2). These regions contained 336 and 1,011 SNPs, respectively (Table 1 and Figure 4). In both methods, the TN trait was found to be located at an interval of 38.26–38.95 Mb on chromosome 1, designated qTN1, and contained 575 SNPs (Table 2 and Figure 5), which overlapped with QTL1.
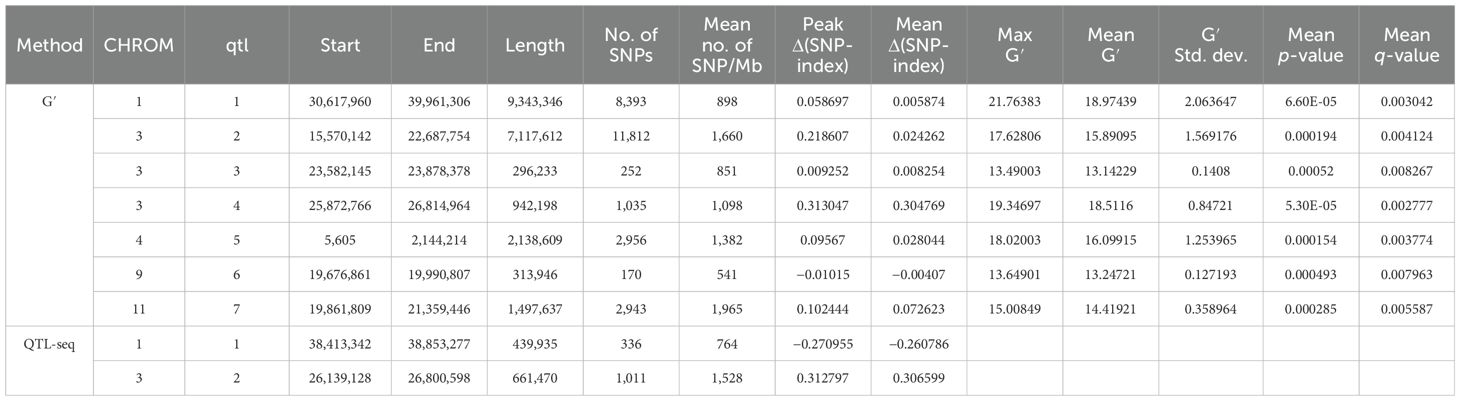
Table 1. Single-nucleotide polymorphism (SNP) peaks associated with cell membrane stability detected by the G′ and QTL-Seq methods.
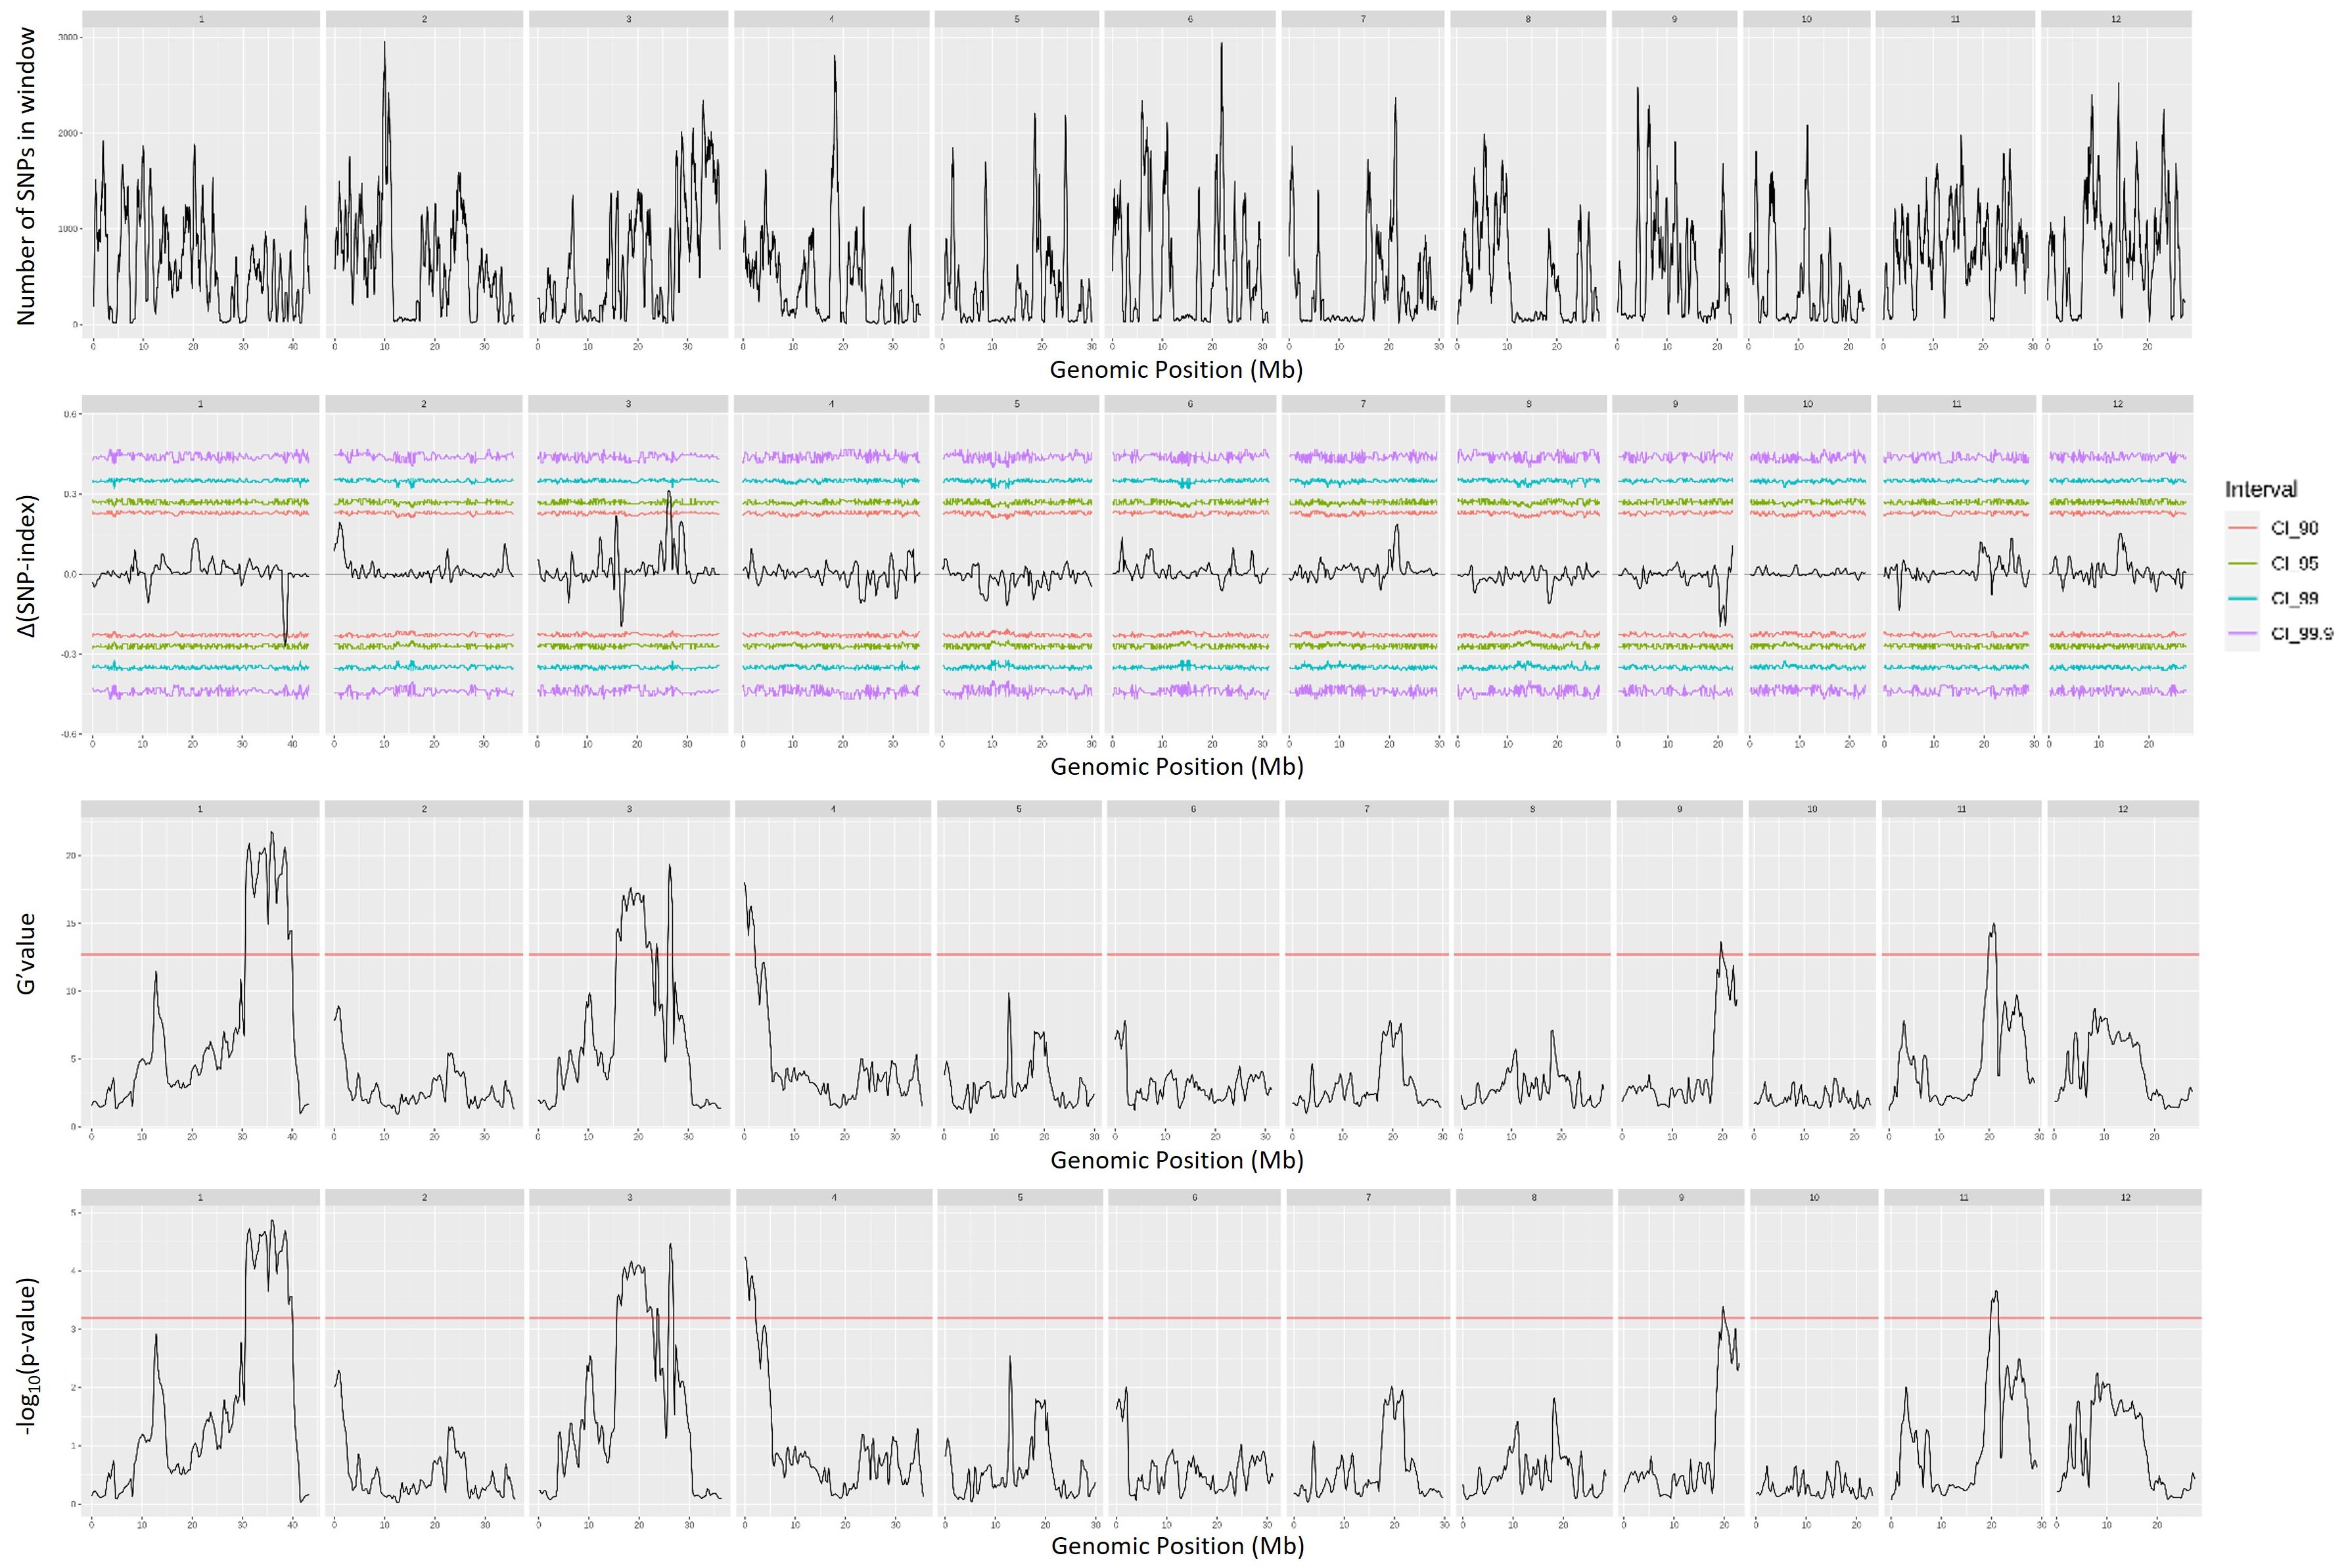
Figure 4. Quantitative trait loci mapping for salt tolerance identified by the cell membrane stability (CMS) of 12 chromosomes, including the number of single-nucleotide polymorphisms (SNPs) in the sliding window, Δ(SNP index), G′ value, and −log10(p-value).
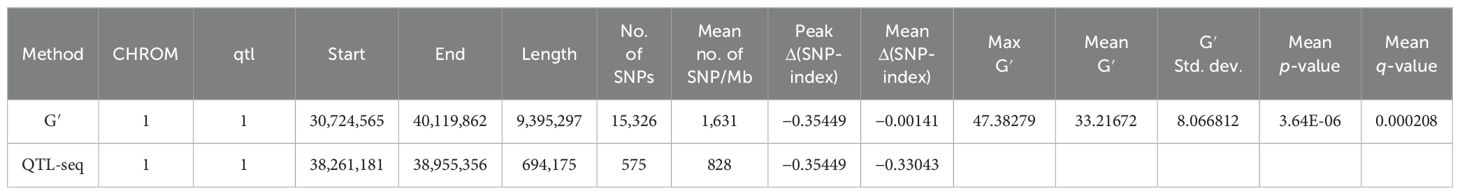
Table 2. Single-nucleotide polymorphism (SNP) peaks detected by the G′ and QTL-Seq methods based on tiller number at the recovery stage.
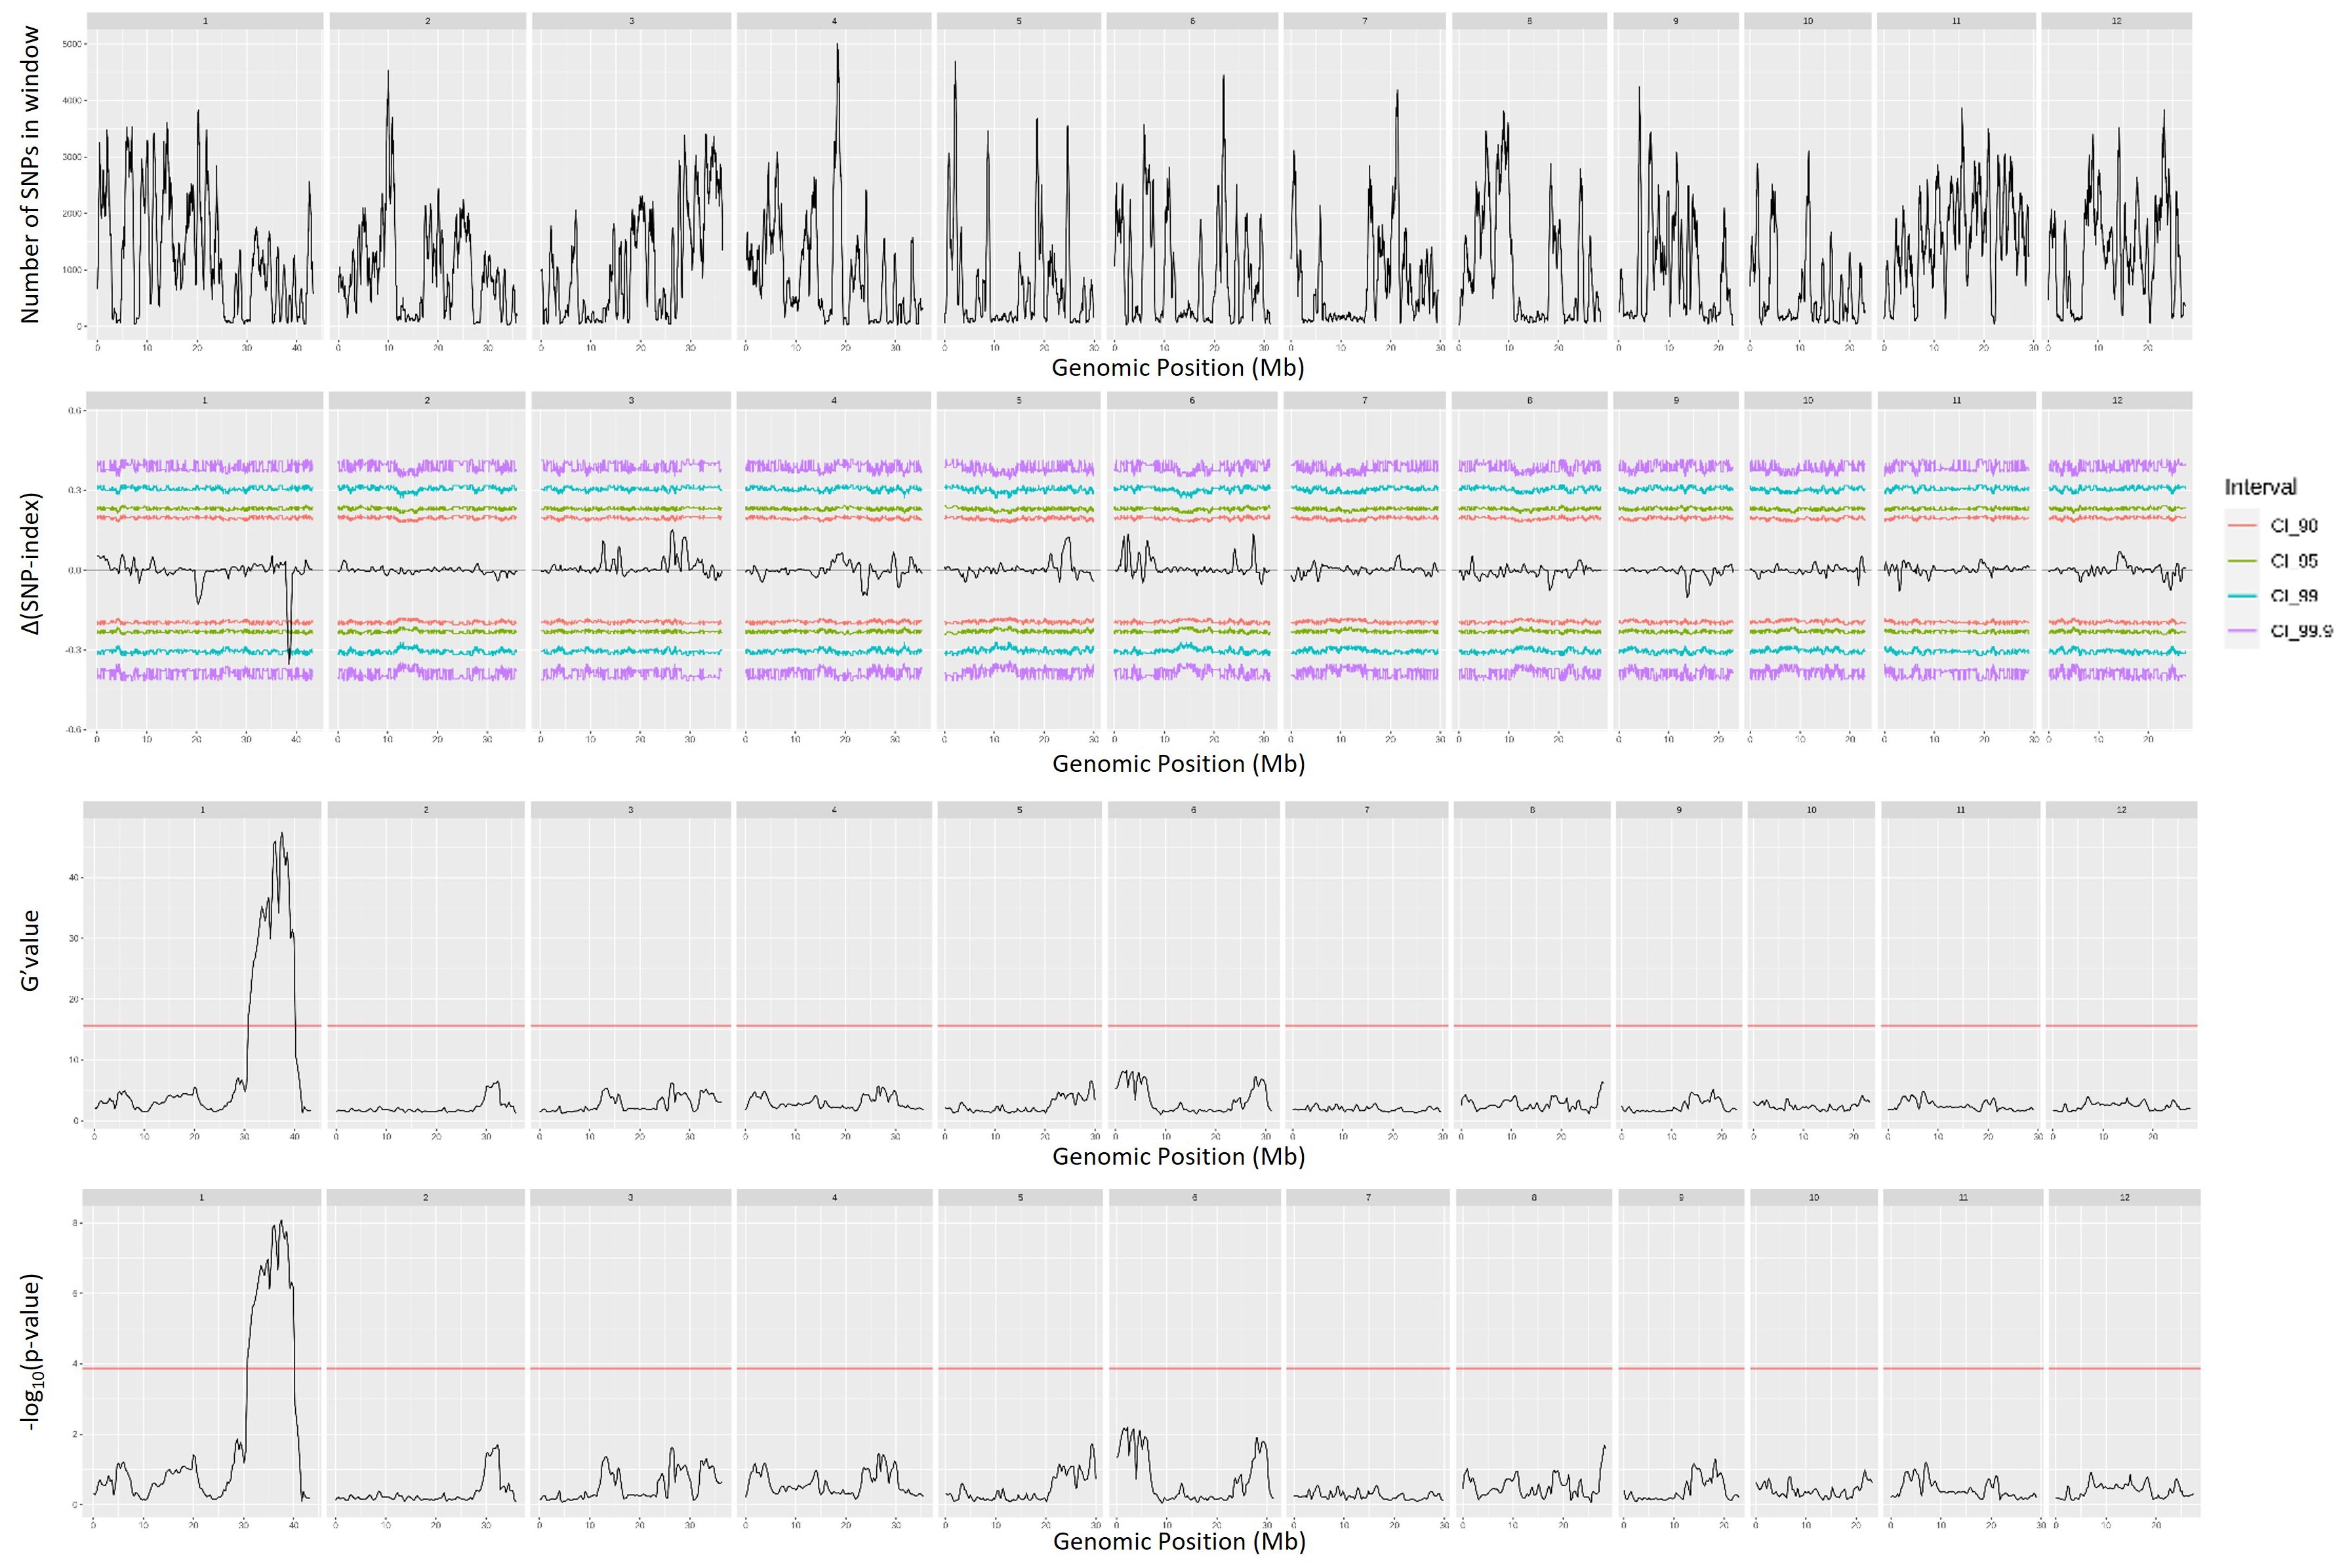
Figure 5. Quantitative trait loci mapping for salt tolerance identified by the tiller number (TN) of 12 chromosomes, including the number of single-nucleotide polymorphisms (SNPs) in the sliding window, Δ(SNP index), G′ value, and −log10(p-value).
Two validation populations, F4 [derived from F2 (JK × IR29) of the previously mapped population] and F3 [F3 (JK × KDML105) constructed later] progenies, were used to validate the identified QTLs, i.e., QTL1 and QTL2 on chromosomes 1 and 3, respectively. The validation populations were established using different genetic backgrounds based on the JK cultivar. JK is a domestic Thai germplasm rice that shows high-yield performance at the heading stage (Lekklar et al., 2019a), and its TN increases by more than 50% after salt stress at the vegetative stage (Habila et al., 2021). On the other hand, KDML105 is a commercial Thai rice with a jasmine-like aroma that has a high cooking/eating quality profile (Vanavichit et al., 2018; Pamuta et al., 2022). For QTL validation, we considered three phenotype parameters, namely, CMS, TN_s, and TN_r. The phenotypic values for the F4 and F3 progenies and validation population parents are presented in the Supplementary Materials (Supplementary Tables 2–6, respectively). The summaries of the phenotypic values of the three traits considering QTL1 and QTL2 are shown in Table 3 and Figure 6, and Table 4 and Figure 7, respectively. Most traits were approximately normally distributed. The average CMS values of parent JK, IR29, and KDML105 were 60.23%, 45.34%, and 20.43%, respectively, and those of the validation populations ranged from 18.22% to 82.06%. For TN_s, the average values for parent JK, IR29, and KDML105 were 1.08, 1.00, and 1.00, respectively, and for TN_r, the average values were 1.00, 1.00, and 0.76, respectively. For the validation populations, TN_s and TN_r ranged from 0.75 to 3.00 and from 0 to 2.33, respectively.
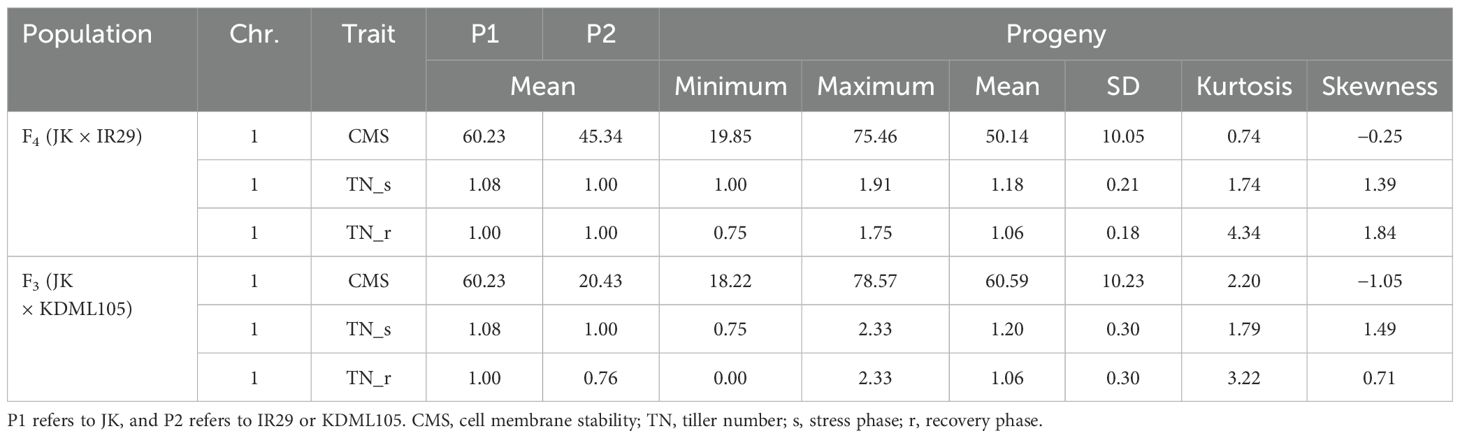
Table 3. Phenotypic values of the three traits considering QTL1 in the two validation populations.
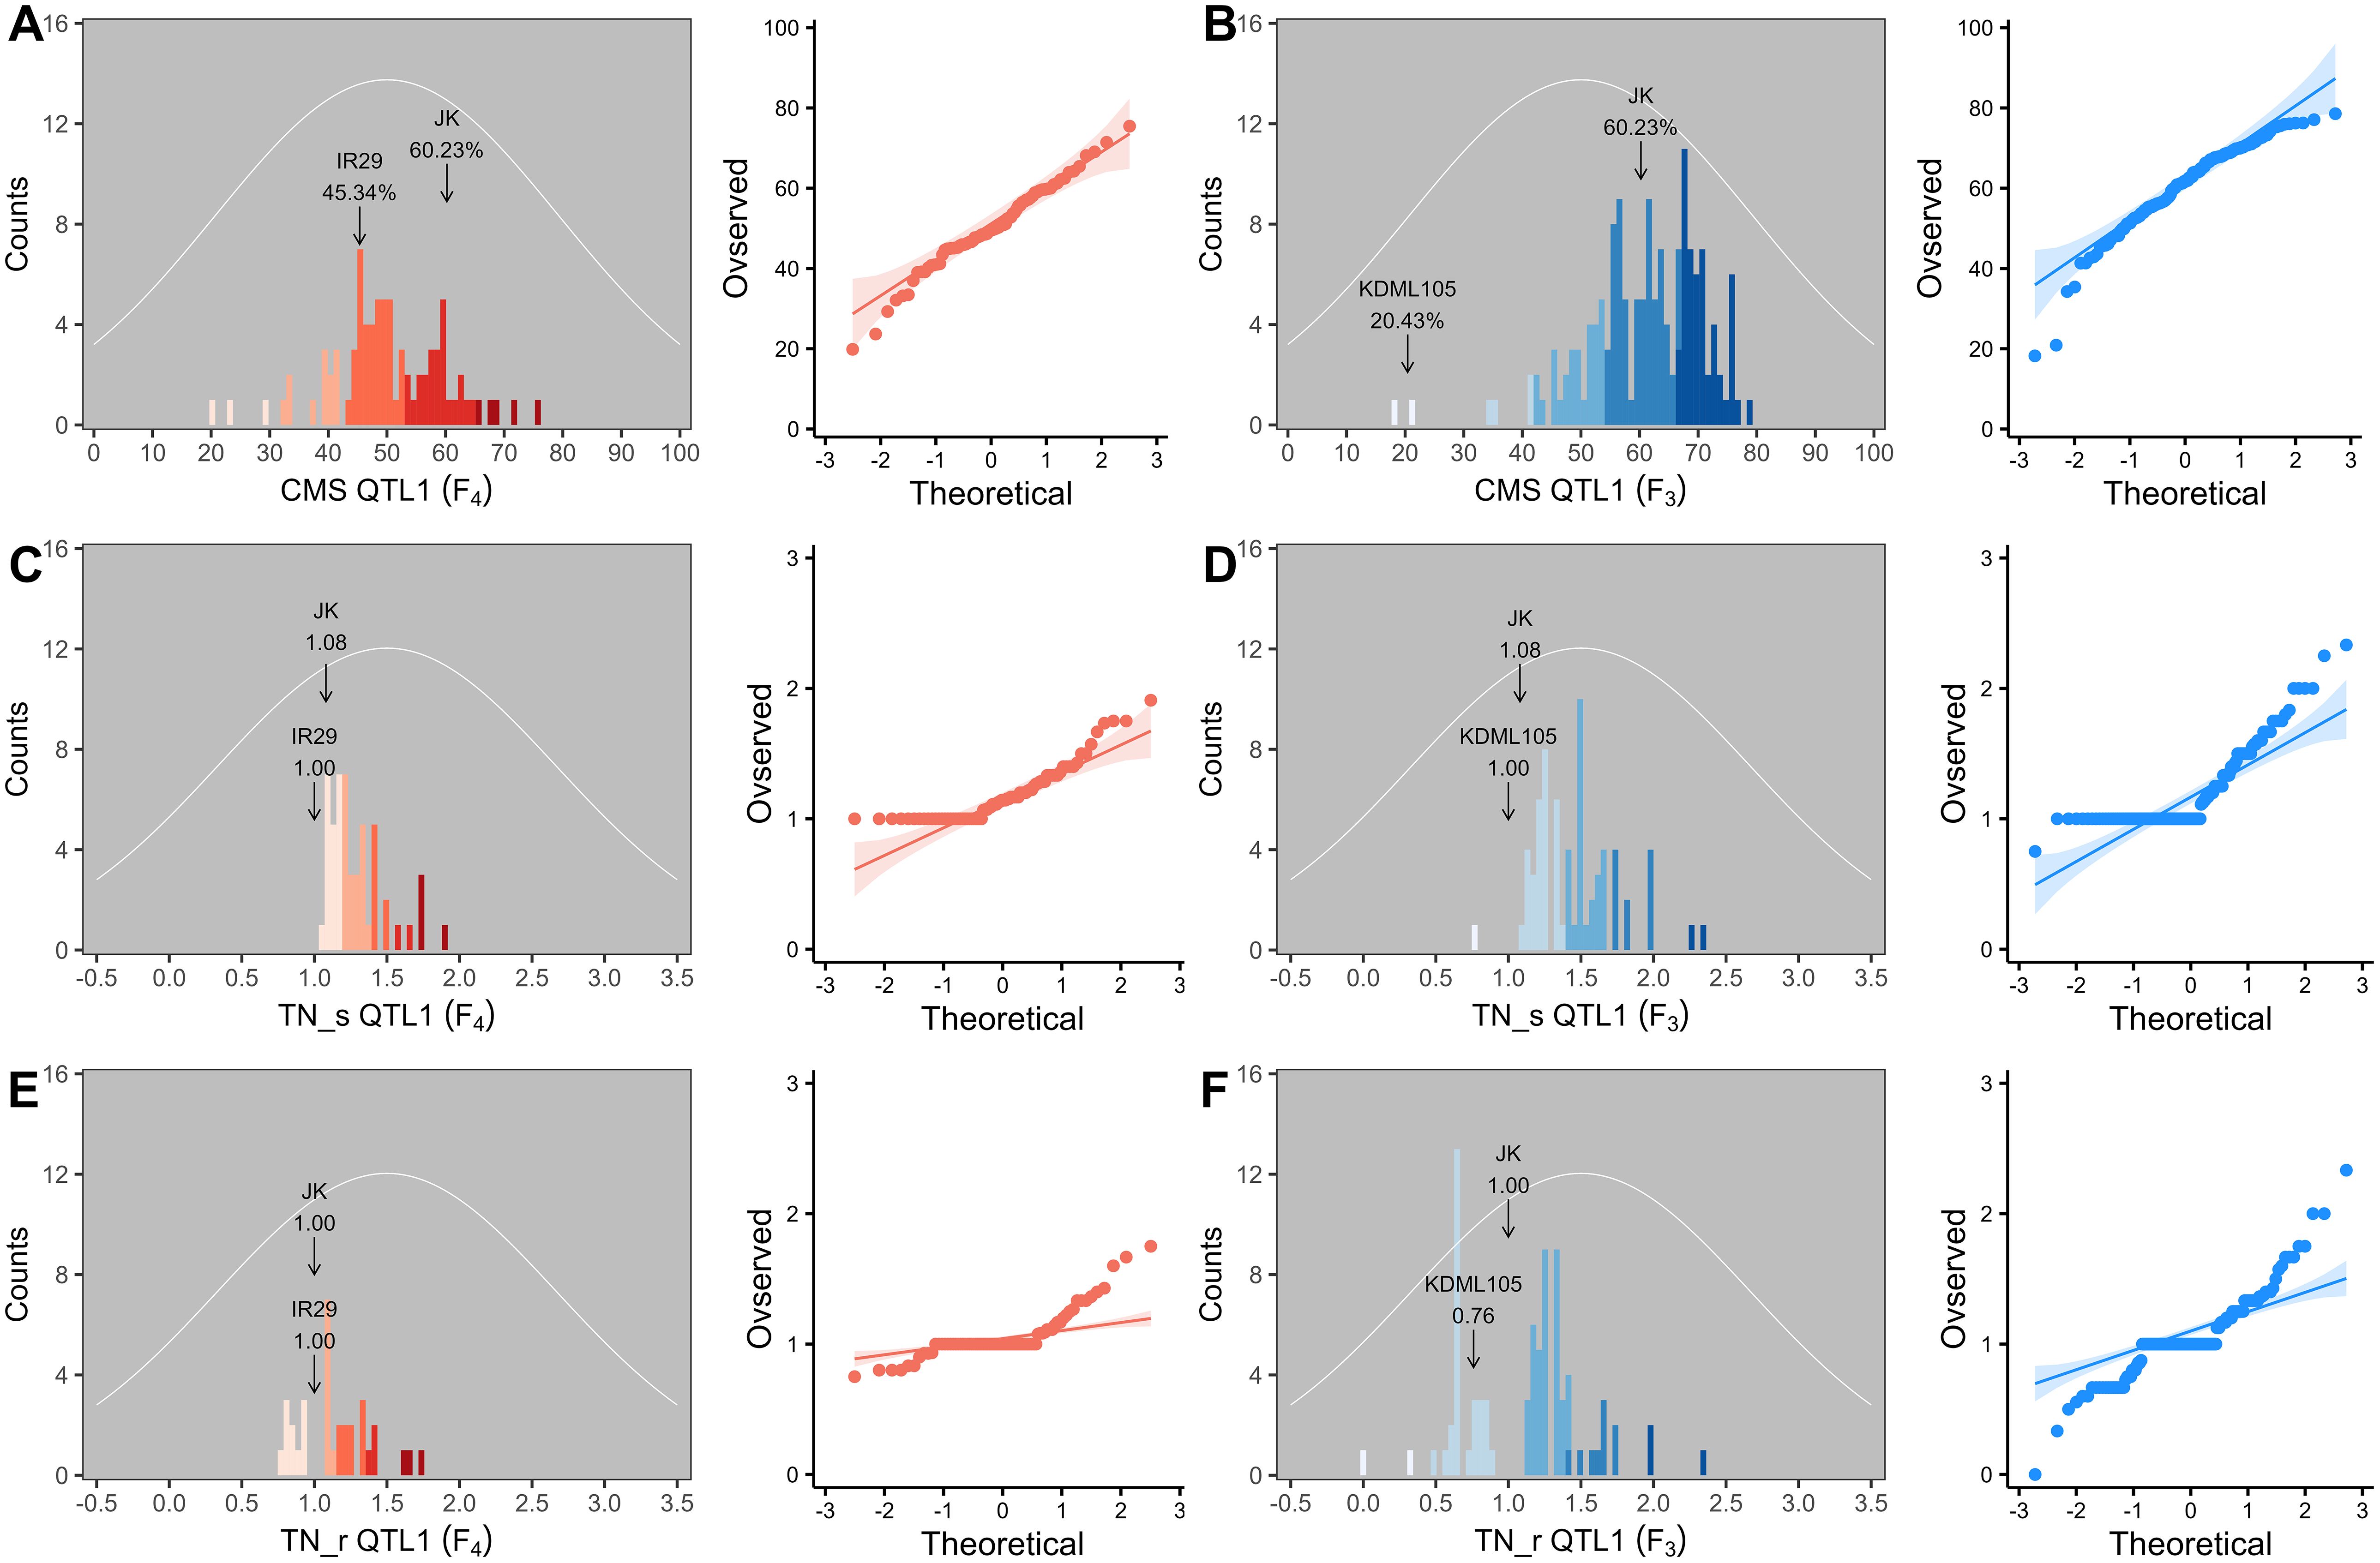
Figure 6. Frequency distribution and quantile–quantile (Q–Q) plots of QTL1 in two validation populations. Cell membrane stability (CMS) (A, B), tiller number (TN)_s (C, D), and TN_r (E, F). F4 progeny, n = 82; F3 progeny, n = 153. The color gradient was cut at five levels for each parameter, and the number of bins was set to 100. The arrow indicates the means of the parent cultivars, and the normal distribution curve is shown as a white line.

Table 4. Phenotypic values of the three traits considering QTL2 in the two validation populations.
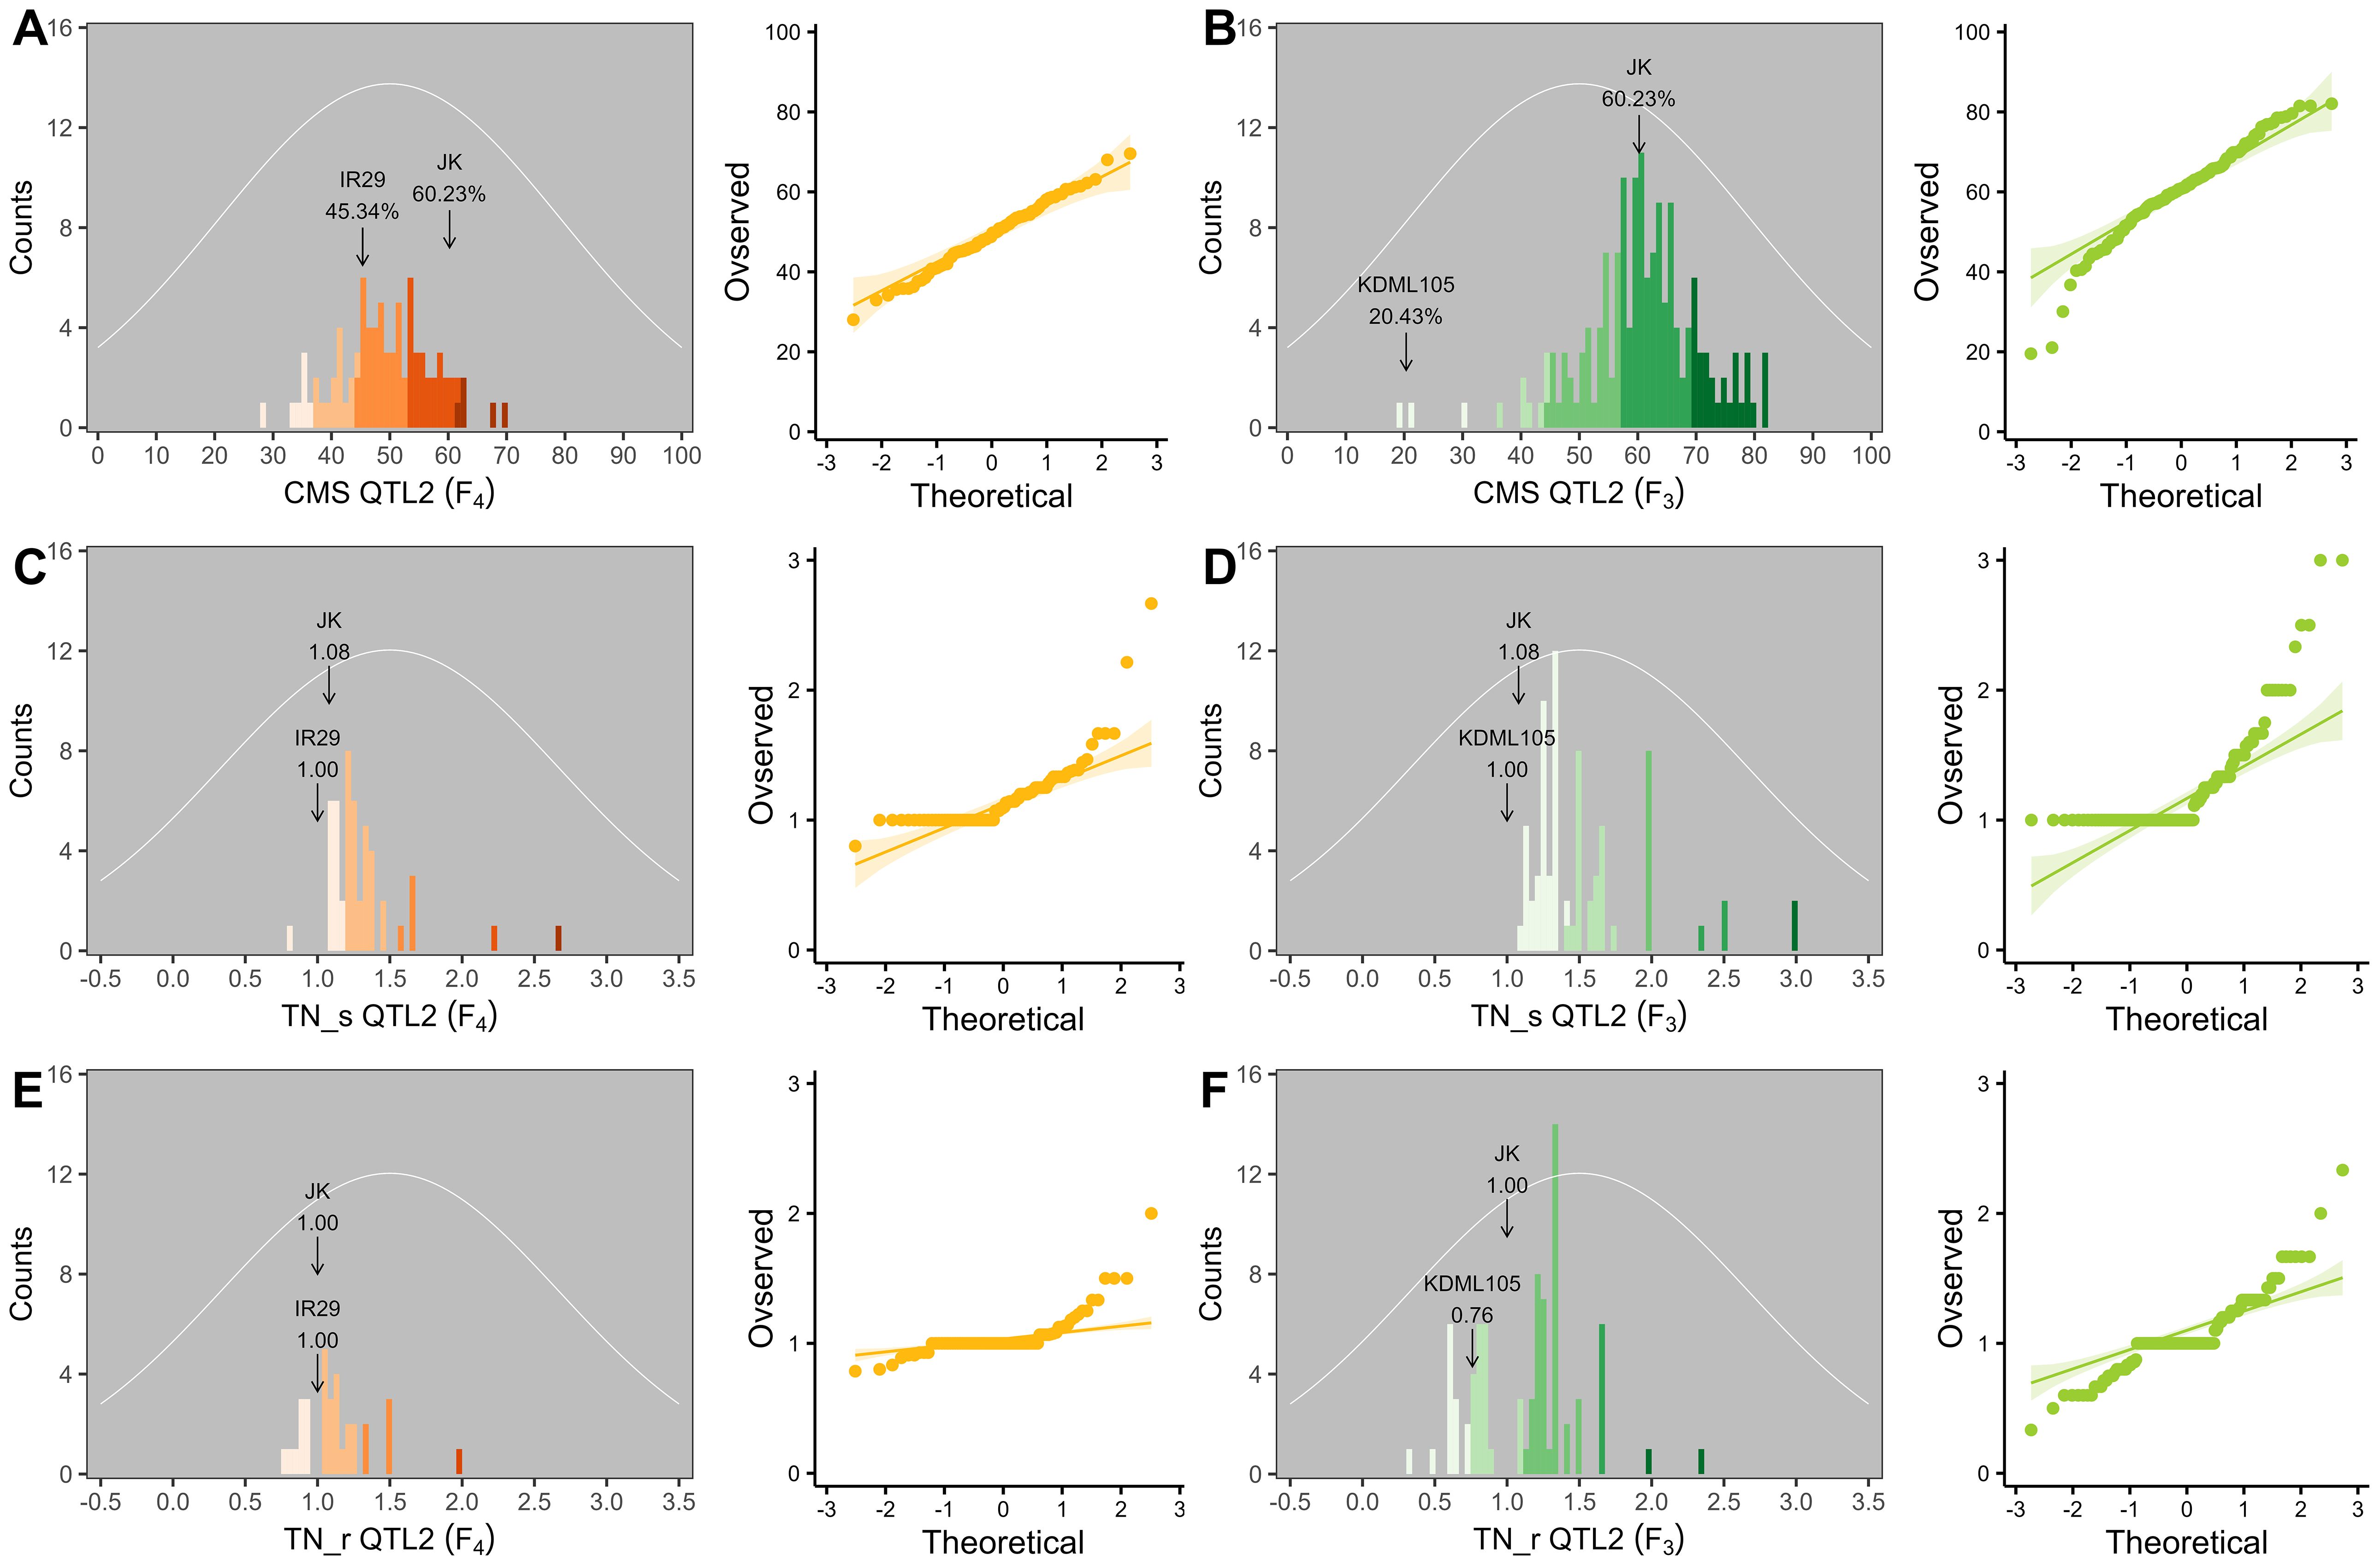
Figure 7. Frequency distribution and quantile–quantile (Q–Q) plots of QTL2 in two validation populations. Cell membrane stability (CMS) (A, B), tiller number (TN)_s (C, D), and TN_r (E, F). F4 progeny, n = 84; F3 progeny, n = 159. The color gradient was cut at five levels for each parameter, and the number of bins was set to 100. The arrow indicates the means of the parent cultivars, and the normal distribution curve is shown as a white line.
The trait correlation coefficients of the three phenotypes are shown in Supplementary Figure 2 and Supplementary Table 7. In both validation populations, TN_r was substantially positively correlated with TN_s in the context of both QTL1 and QTL2. Similarly, in the F3 progeny, CMS also showed a strong positive correlation with TN_r in the context of both QTL1 and QTL2. Zhang et al. (2023) reported that TN shows a negative correlation with leaf electrolyte leakage (EL), indicating cell membrane damage, and is inversely related to CMS.
To confirm that the detected QTLs were related to the salt tolerance trait (CMS and TN_r), a molecular marker was generated based on the SNPs detected in these regions. As a result, primers were built for QTL1-SNP at position 38,419,022 bp on chromosome 1 (Supplementary Figure 3) and QTL2-SNP at position 26,236,424 bp on chromosome 3 (Supplementary Figure 4). The primers were developed to clearly distinguish the A and G alleles from two distinct genotypes (Supplementary Table 8 and Figures 8A, C). The F4 and F3 progenies were evaluated to confirm QTL stability. PCR amplicons revealed differences in the size of each SNP; four different primers were used: (1) outer forward (OF), (2) outer reverse (OR), (3) inner forward (IF), and (4) inner reverse (IR). The OF and OR primers encompassed the entire range, confirming the existence of this segment. The OF-IR or IF-OR primer pairs provided unique products for each SNP. For QTL1, OF-OR generated 164 bp for the entire segment, OF-IR generated 98 bp for the P1 allele (JK), and IF-OR generated 128 bp for the P2 allele (IR29 or KDML105) (Figure 8B). For QTL2, OF-OR yielded 237 bp, OF-IR generated 193 bp for the P1 allele (JK), and IF-OR generated 95 bp for the P2 allele (IR29 or KDML105) (Figure 8D).
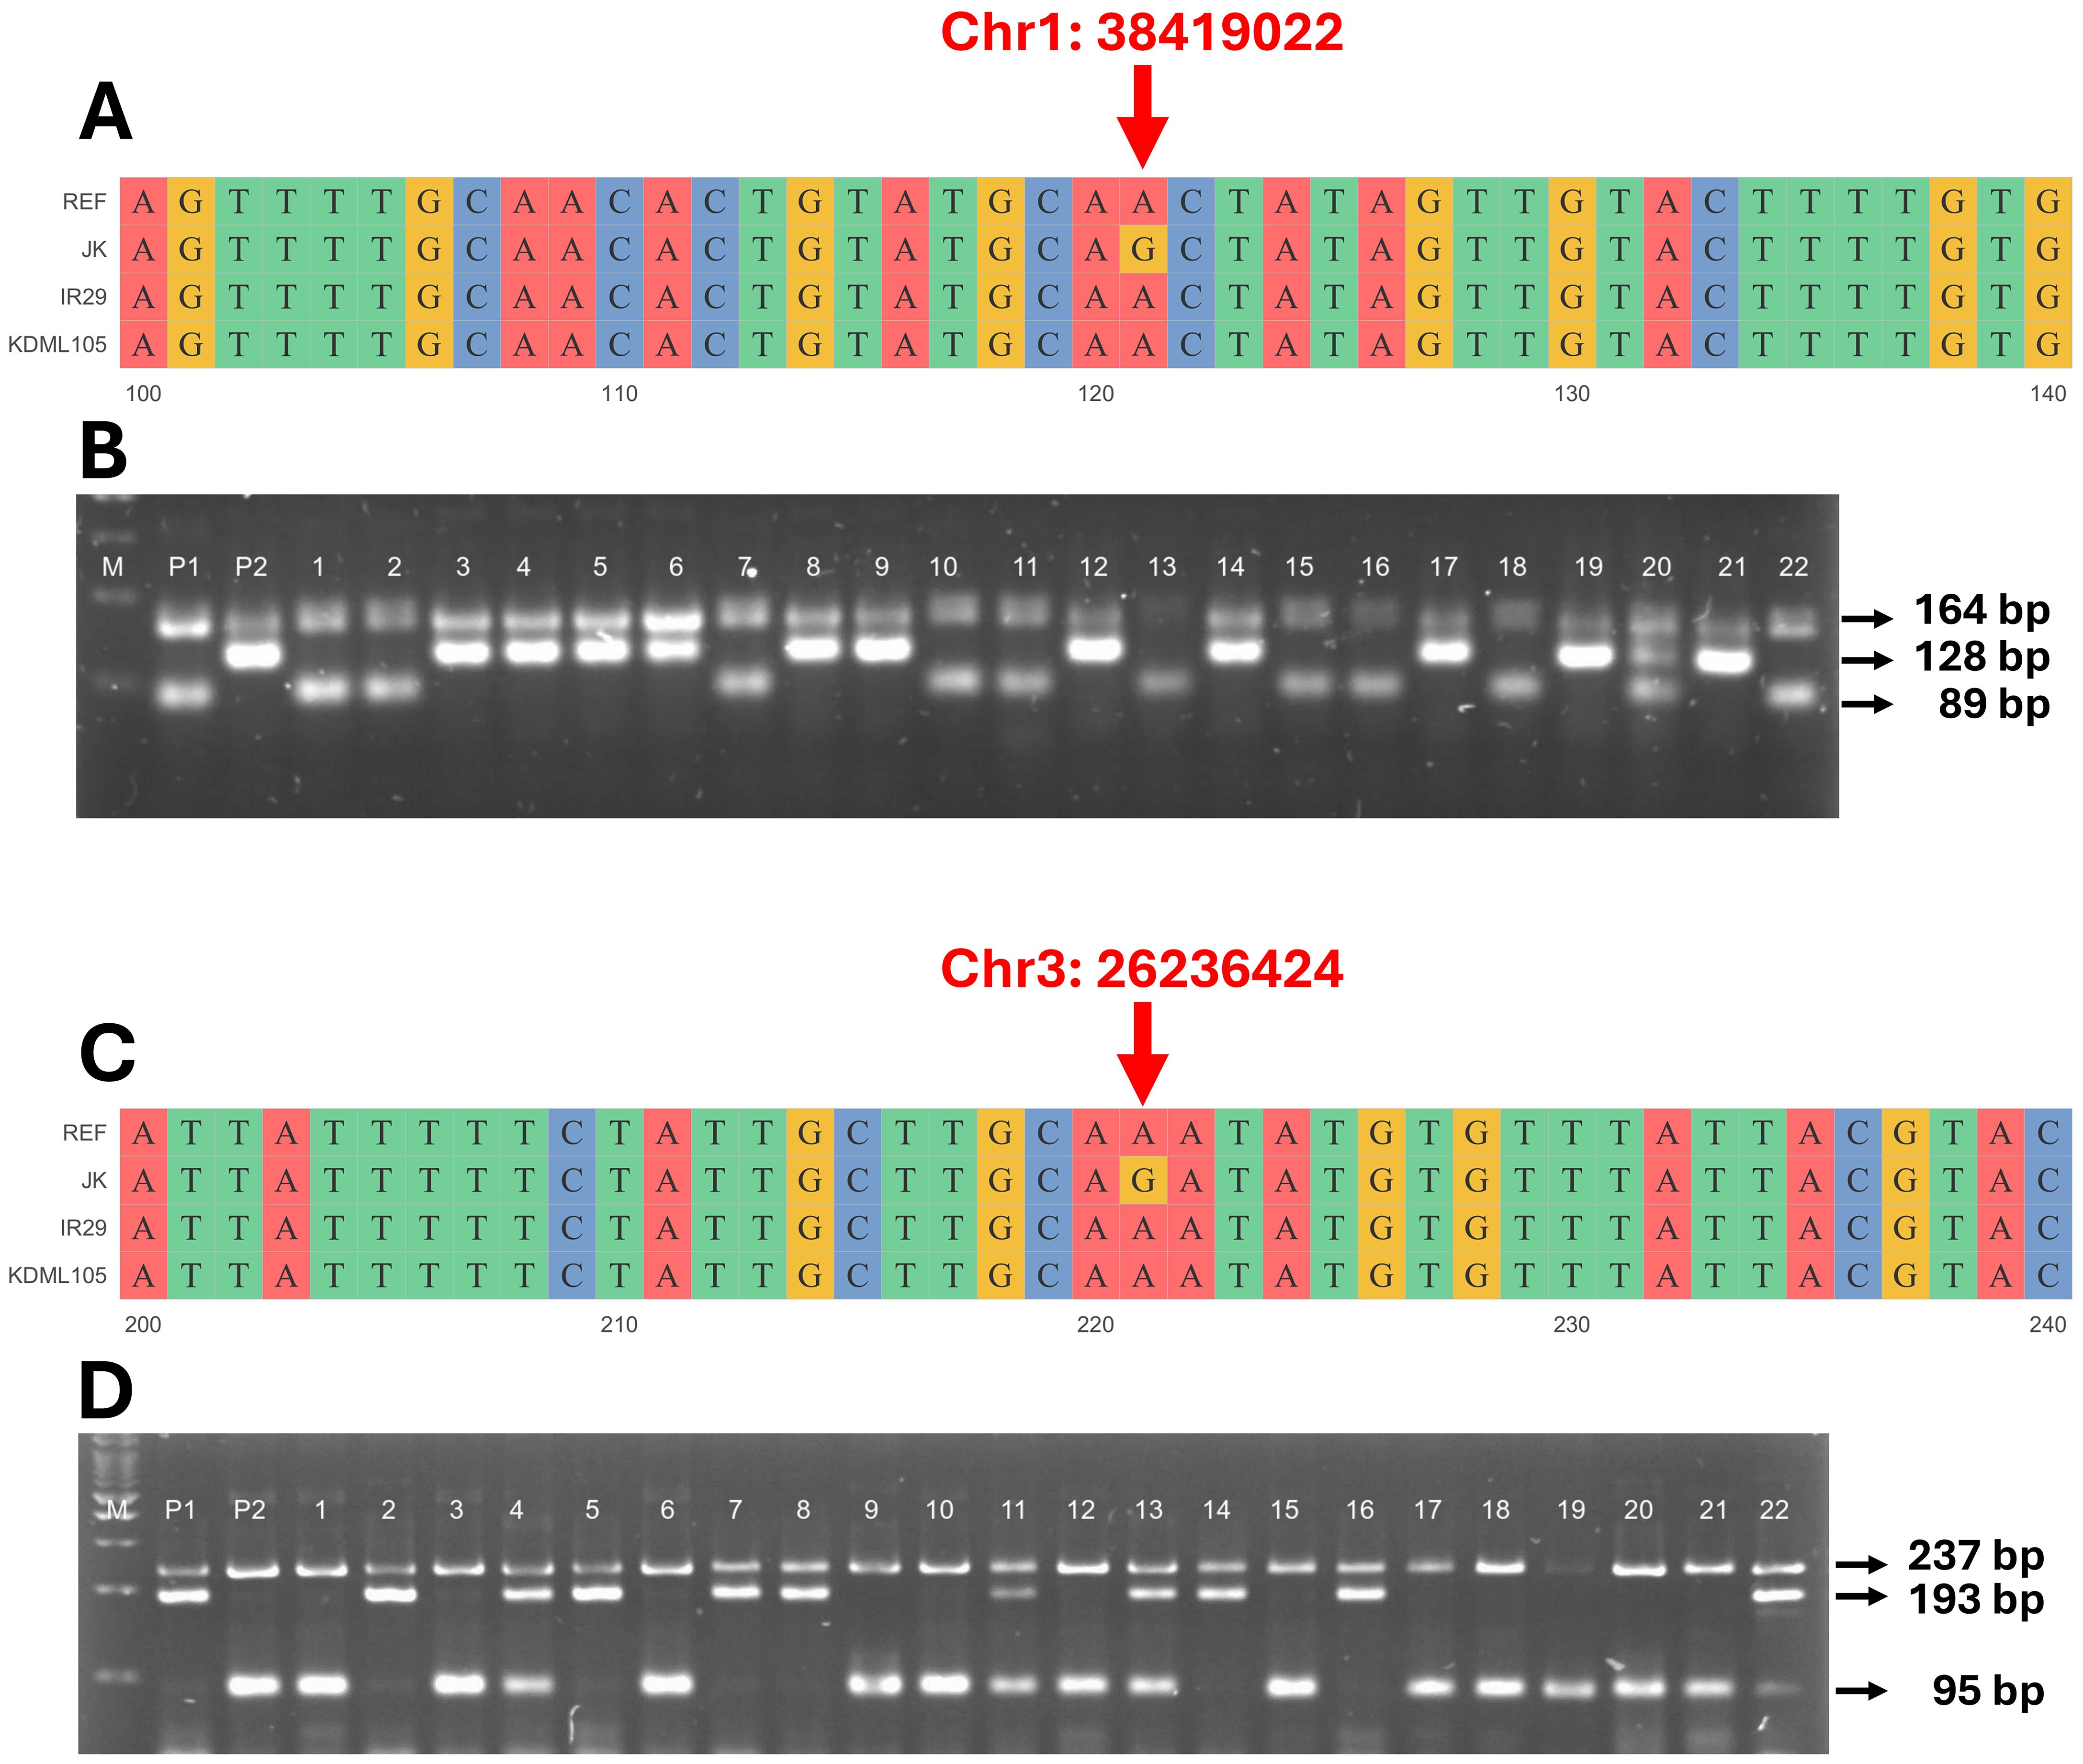
Figure 8. Genotyping of validation populations using allele-specific primers. Sequence alignment of target single-nucleotide polymorphisms (SNPs) on the QTL1 (A) and QTL2 (C) of JK, IR29, and KDML105 compared with the reference genome “Nipponbare”. Gel electrophoresis of QTL1 (B) outer primers (164 bp), JK (P1) allele (89 bp), and IR29 or KDML105 (P2) allele (128 bp). Lanes 1–22 are the individual progeny, and lane 20 is the heterozygous allele (three bands in lane). Gel electrophoresis of QTL2 (D) outer primers (237 bp), JK (P1) allele (193 bp), and IR29 or KDML105 (P2) allele (95 bp). Lanes 1–22 show the individual progeny, and lanes 4, 11, 13, and 22 show the heterozygous alleles (three bands in lane). M is a 100-bp marker ladder.
A total of 720 (considering QTL1) and 727 (considering QTL2) F4, and 824 (considering QTL1) and 808 (considering QTL2) F3 plants were phenotyped and genotyped, and the data were analyzed by the SSD method. The SSD method was used to maintain the genetic diversity of each line in the segregating progeny (Sleper and Poehlman, 2006); thus, the average phenotypic value of plants containing identical alleles in each line was calculated based on their similar genotype with at least three replicates. Subsequently, 82 and 84 lines based on the QTL1 and QTL2 genotyping of F4, respectively, and 153 and 159 lines based on the QTL1 and QTL2 genotyping of F3, respectively, were subjected to phenotypic variance analysis (Supplementary Tables 2–5). The phenotype and genotype correlations are represented as a box plot (Figure 9). Allele 1 with SNP G (alternative SNP) indicates the JK genotype, and allele 2 with SNP A indicates the IR29 or KDML105 genotype (similar to the reference genome “Nipponbare”). Linear regression was used to determine R2 (shown as a percentage), which indicates the PVE by the QTL at a specific allele. For QTL1, CMS exhibited significant PVEs of 18.0% and 6.0% in F4 and F3, respectively. The PVEs of TN_s and TN_r were 16.2% and 20.4%, respectively, in the F3 population. The additive effect (AE) was negative, indicating that plants containing alleles from IR29 and KDML105 tolerate salt stress (Table 5; Figure 9; Supplementary Table 9).
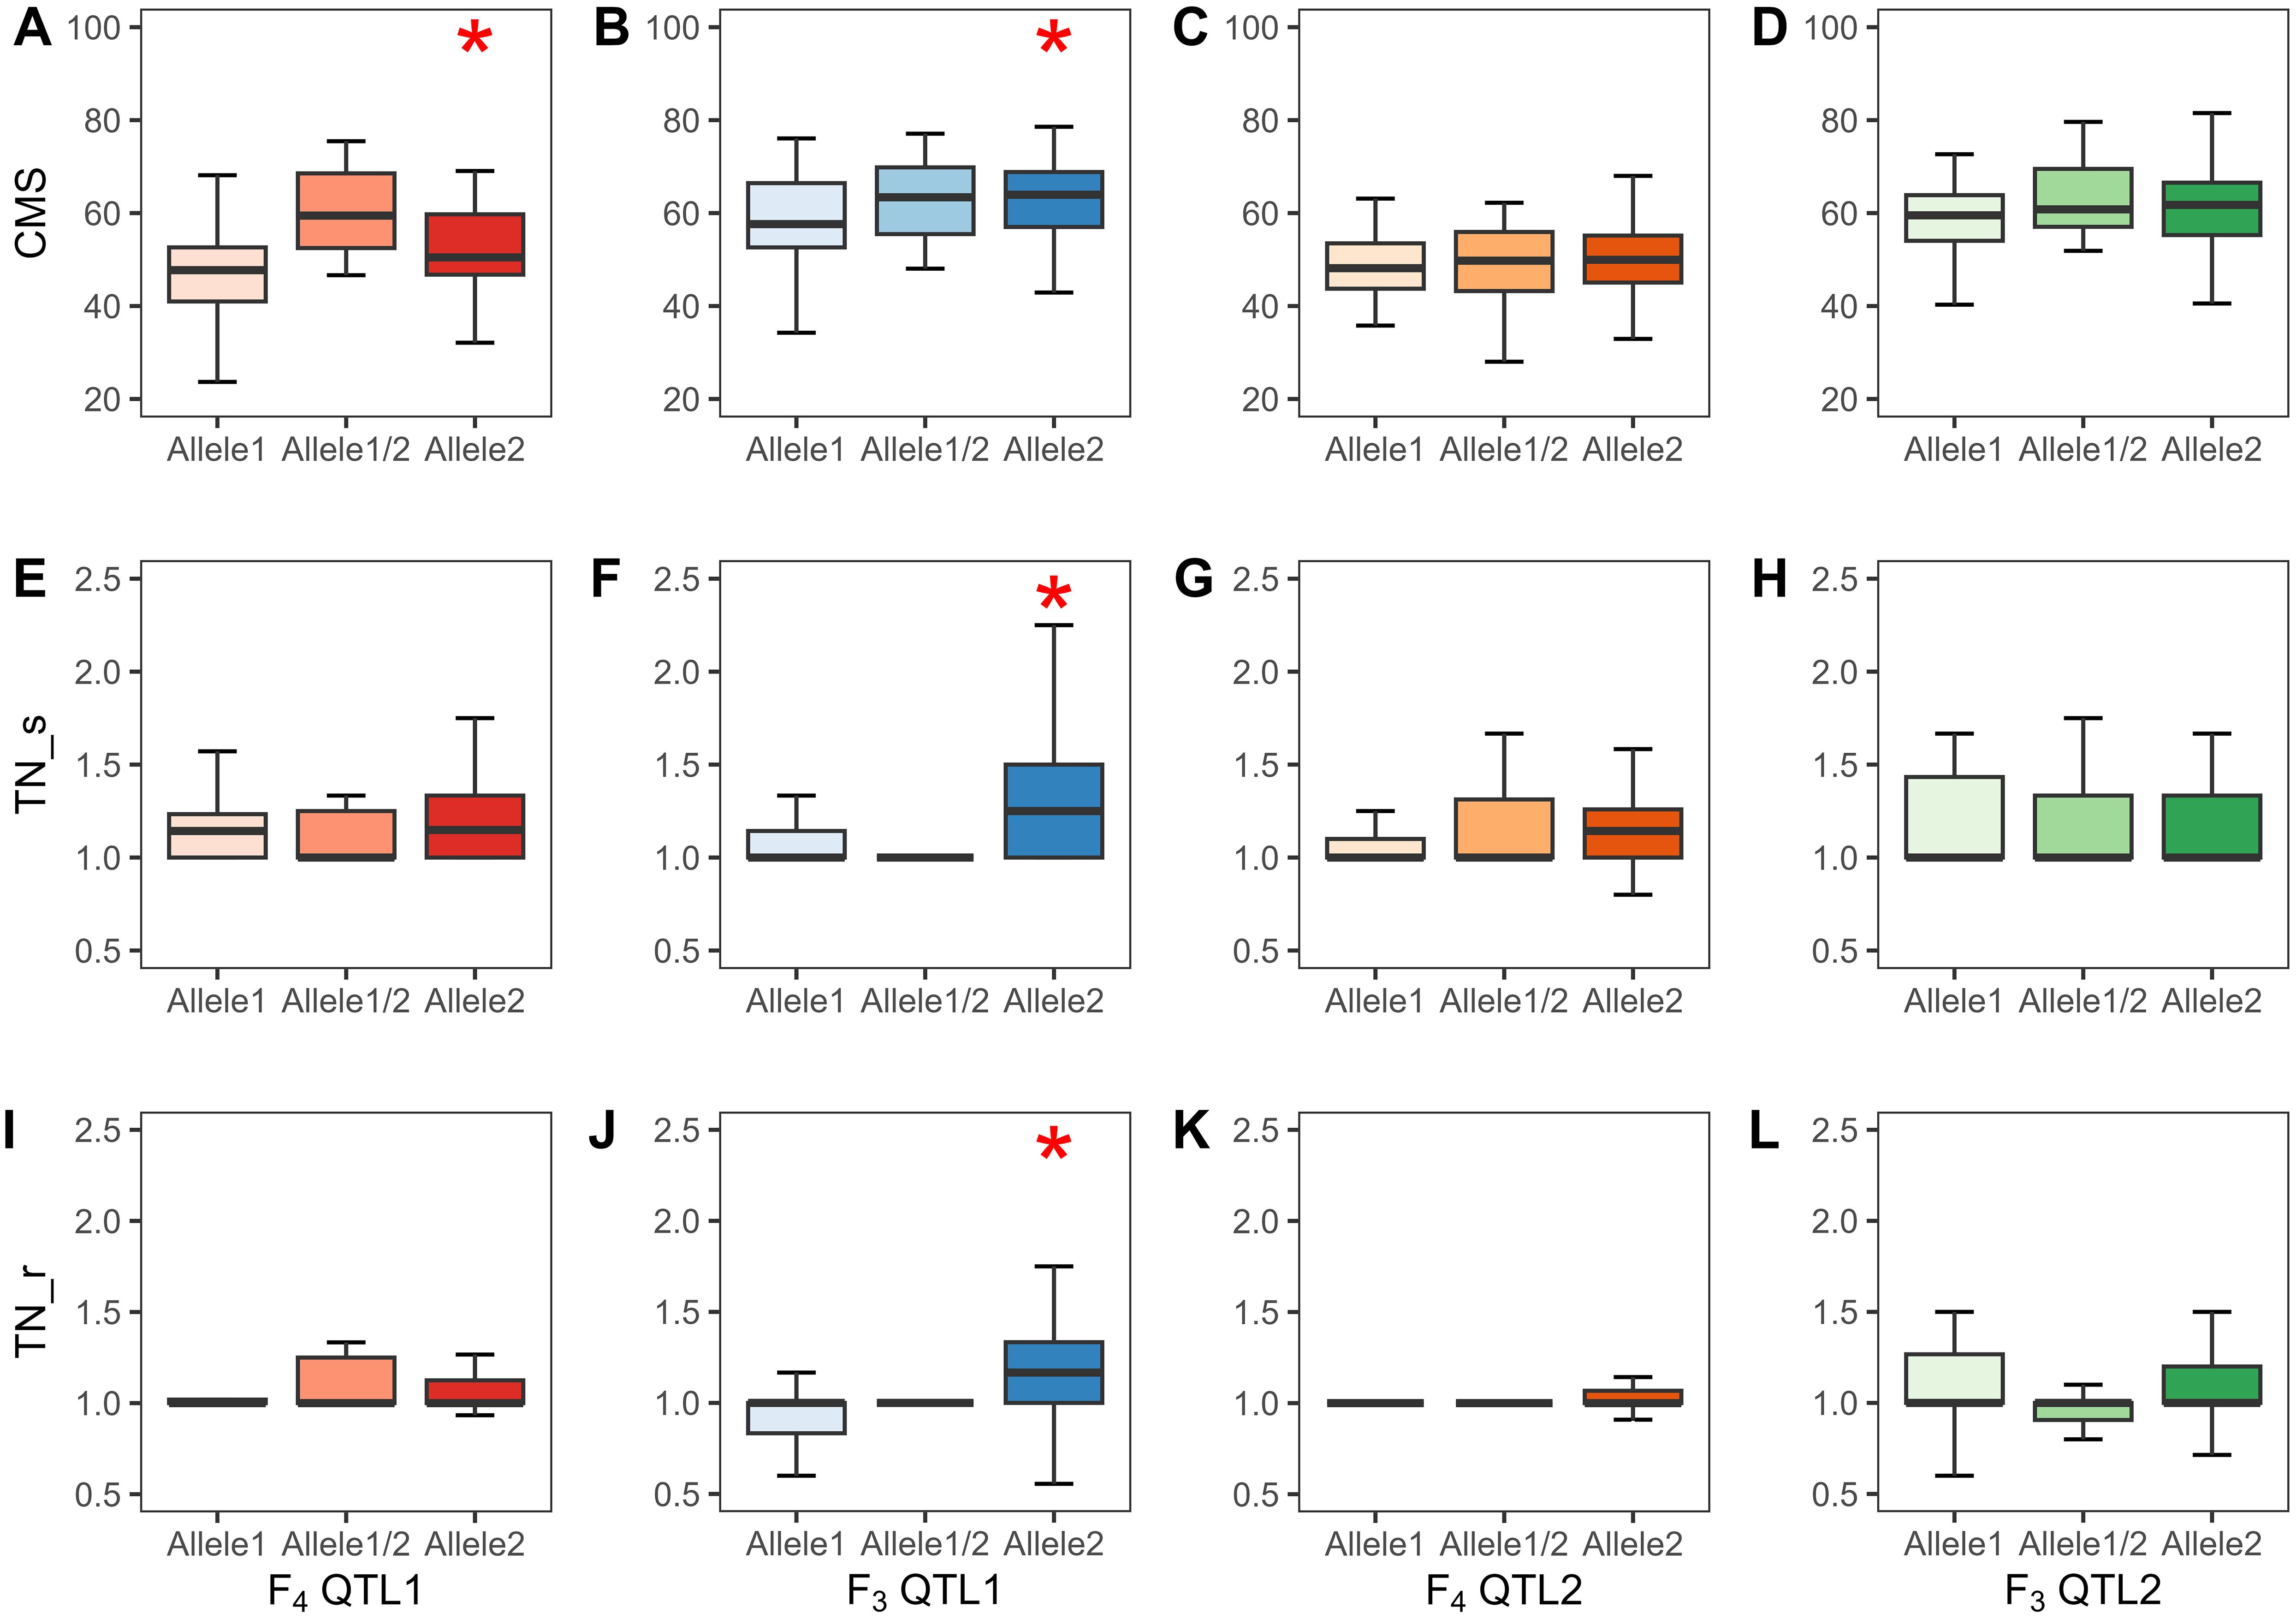
Figure 9. Phenotypes of QTL1 and QTL2 of the two validation populations (F4 and F3 populations). CMS, QTL1 (A, B) and QTL2 (C, D); TN_s, QTL1 (E, F) and QTL2 (G, H); TN_r, QTL1 (I, J) and QTL2 (K, L). Allele1 refers to JK, allele1/2 implies a heterozygous allele, and allele2 indicates IR29 or KDML105 in the F4 and F3 populations, respectively. Significant QTLs at the 0.05 level are marked with *. The black line in the middle of the box shows the median. CMS, cell membrane stability; TN, tiller number; s, stress phase; r, recovery phase.
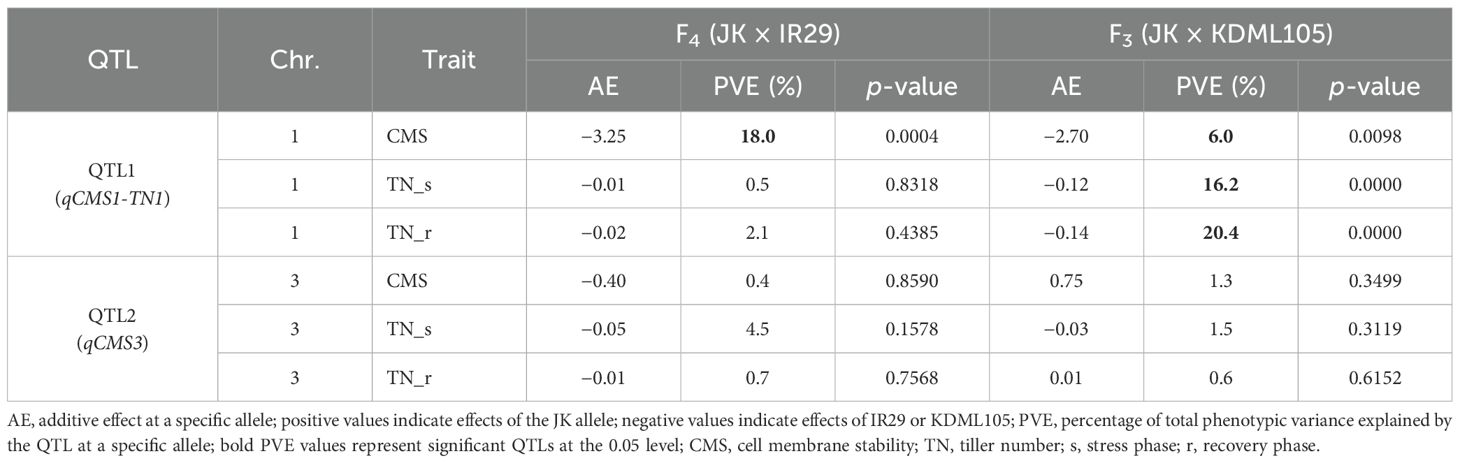
Table 5. Phenotypic variance of identified qCMS1-TN1 on chromosome 1 and qCMS3 on chromosome 3 in the two validation populations.
Our validated QTLs were located at 38.26–38.95 Mb on chromosome 1 and 26.13–26.80 Mb on chromosome 3. Recent studies reported that the QTLs of various biparental crossings with different germplasms validated using BSA were colocalized in the overlapping region on chromosome 1. These QTLs, which correspond to salinity and drought stress, are associated with yield components, including the stress susceptibility index, seed germination rate, days to 50% flowering, plant height, biomass, and harvest index, which represent 3.5%–53.5% of the PVE (Figure 10 and Supplementary Table 10).
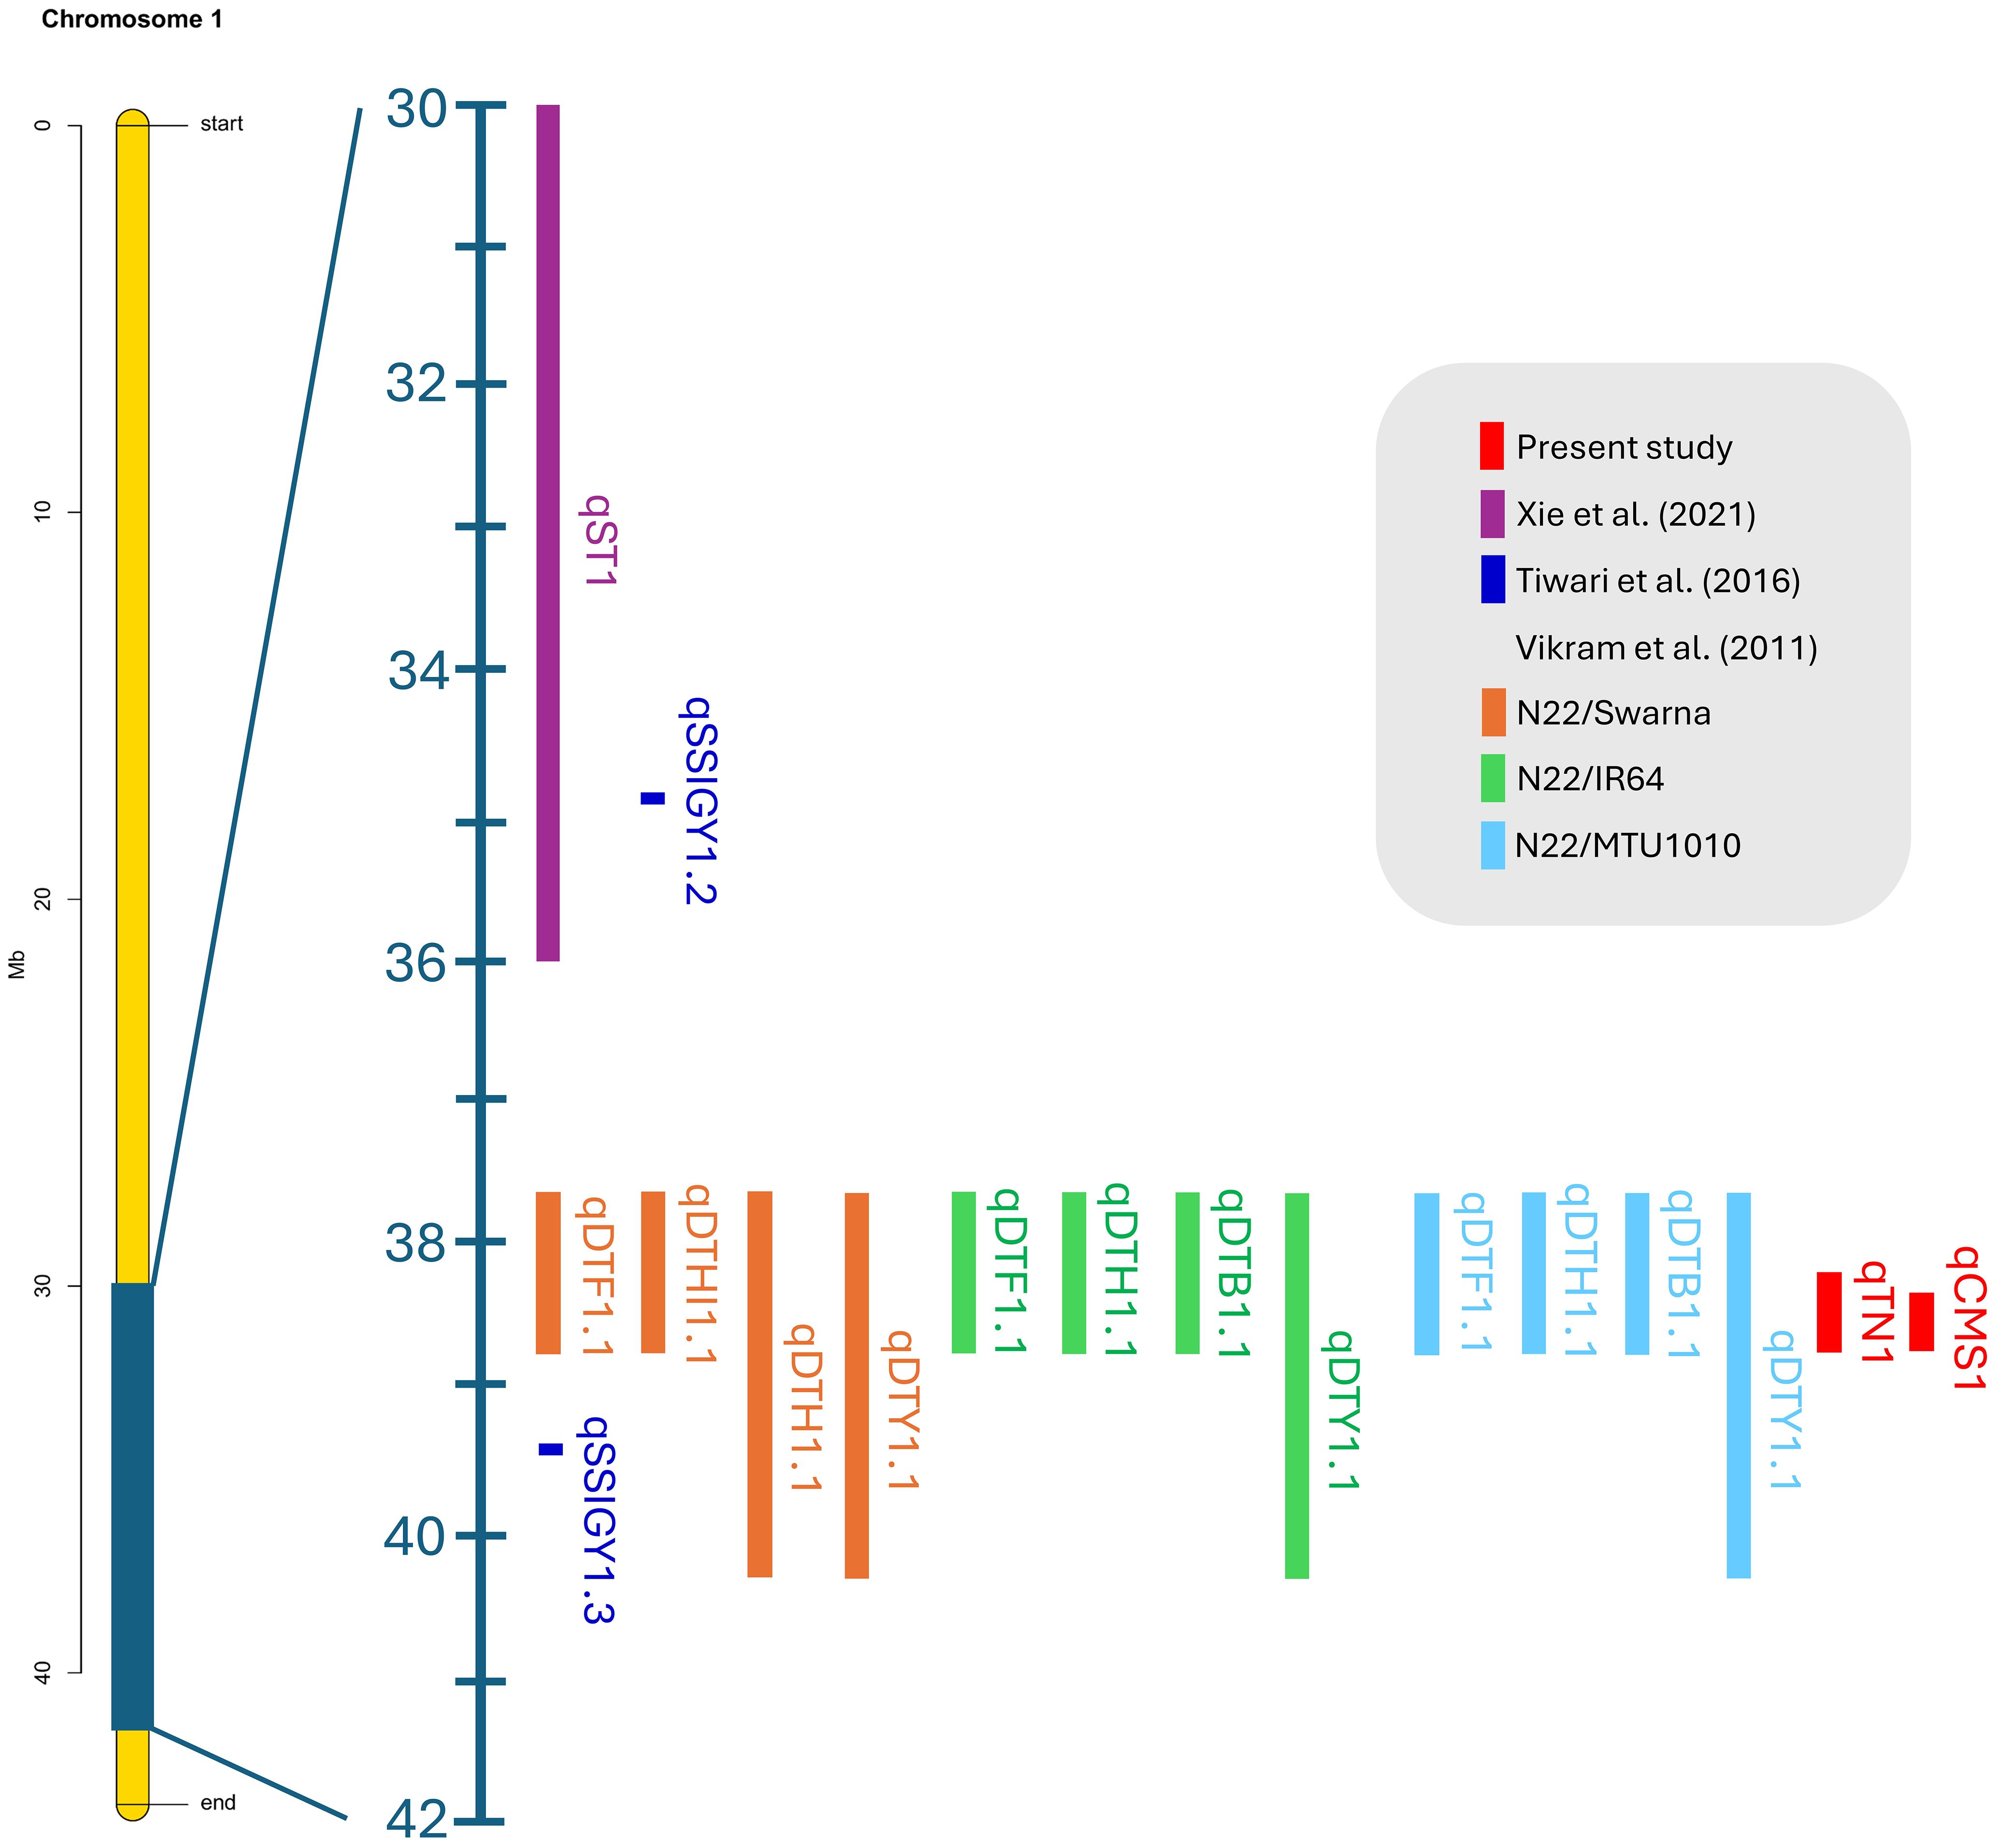
Figure 10. Colocation of verified rice quantitative trait loci associated with salt and drought stress on chromosome 1 was determined using the BSA-Seq technique.
The MAS approach is an effective way to create new rice cultivars that resist salinity stress based on the introgression of salt-responsive genes/QTLs from donor to recipient lines (Miah et al., 2015; Rana et al., 2019). High-throughput genome sequencing can accelerate QTL mapping for identifying genomic loci related to traits of interest. The abundance of SNPs and InDels has been investigated at the genome level and can be applied to develop molecular markers (de la Fuente Cantó and Vigouroux, 2022). Here, we performed QTL-Seq mapping alongside the BSA technique based on the extreme opposite phenotypes of a biparental cross. The results of QTL-Seq mapping of the F2 generation revealed that two major salt-responsive QTLs were mapped by the CMS and TN traits on chromosomes 1 and 3, respectively, with approximately 500–1,000 SNPs present in the 1-Mb range of each region (Tables 1, 2).
To evaluate the stability of the identified QTLs, we established two validation populations with different genetic backgrounds, F4 (JK × IR29) and F3 (JK × KDML105), depending on JK, a salt-tolerant donor line. Some phenotypes exhibited a near-normal distribution. Skewness and kurtosis >1 imply a non-normal curve. If the skewness or kurtosis of the phenotype is between −1 and +1, the distribution is adequate (Mishra et al., 2019); however, QTL studies typically assume a normal distribution, although some traits may not follow this assumption (Li et al., 2015). Skewness indicated that the CMS of both progenies shifted to the right (negative value) (Tables 3, 4 and Figures 6A, B, 7A, B), while the TN trait was skewed to the left (positive value) (Figures 6C–F, 7C–F).
Compared with the F4 population, the F3 progeny tolerated salt better. This was demonstrated by the higher average CMS of approximately 60% in the F3 population compared with 50% in the F4 population. The mean CMS of F3 in QTL1 (60.59%) and QTL2 (60.36%) was similar to that of their parent JK (60.23%), whereas that of F4 was slightly lower than that of JK. Moreover, the mean TN of both progenies was slightly greater than that of JK (Tables 3, 4). KDML105 is reportedly moderately sensitive to salt stress at the seedling stage, with a survival rate of 76.33% (Kanawapee et al., 2012). Therefore, crossing JK with KDML105 could result in the generation of plants that are highly tolerant to salt stress. Habila et al. (2021) discovered that the CMS of an F2 (JK × IR29) population grown in salted hydroponics had a bimodal distribution of polygenic traits, with a mean of 44% and positive correlation with TN. In the present study, the mean CMS of the F2 population was approximately 69.92% (Supplementary Table 1).
Furthermore, the AE considers the total effect of each allele that contributes to the phenotypic value of a particular trait. Consequently, the AE of each locus is expressed as the difference in mean values (Tan et al., 2022). In the present study, we considered the phenotype of plants that carry alleles from each parent (Figure 8): the donor line (JK) with a G allele, the recipient line (IR29 or KDML105) with an A allele, and the heterozygous allele with a G/A allele. The AE was calculated as [G/A-midpoint], with the midpoint determined as [G+A]/2. Thus, significant QTLs exhibited negative AE because G allele plants (JK allele) had phenotypic values lower than the midpoint. Figure 9 reveals that plants that harbor JK allele at this position exhibit salt-sensitive phenotypes such as low CMS and TN values. The inverse AE of JK indicates that the allele that increases the desired phenotype (high CMS and TN) was from the recipient line (IR29 or KDML105)—AEs can be positive or negative values. Vikram et al. (2011) crossed drought-tolerant and high-yielding cultivars and detected QTLs located on the long arm of chromosome 1. In the same interval region as in the present study, these QTLs were found to have AEs with both positive and negative values.
QTL validation is frequently accomplished with two or more validation populations with distinct genetic architectures (Knoll and Ejeta, 2008; Singh and Singh, 2015). We validated the identified QTLs by phenotyping during both the stress (CMS and TN_s traits) and recovery (TN_r trait) stages.
Allele-specific primers were designed using an SNP that can distinctly differentiate the salt-tolerance allele (JK) from the salt-sensitive alleles (IR29 and KDML105). Kim et al. (2016) reported that to improve band separation during gel electrophoresis when the gap is small (<20 bp), the PCR product size of the ASP should be less than 120 bp. In the present study, we used at least 250 bp covering the target SNP with the gap between the products at approximately 30 bp, to design the ASP. The limitation was that if an indel was in this SNP region, the forward and reverse primers could not be constructed. With these criteria, two SNP markers were evaluated. The significant SNPs for the QTL1 and QTL2 markers at 38,419,022 bp on chromosome 1 and 26,236,424 bp on chromosome 3 were located in the intron regions of LOC_Os01g66140 and LOC_Os03g46390, respectively, which were predicted by the Variant Effect Predictor (Arikit et al., 2019) (Supplementary Figures 3 and 4).
Chutimanukul et al. (2021) noted that in KDML105, chromosome segment substitution lines (CSSLs) containing different regions of DH212 between markers RM1003 and RM3362 show differential salt tolerance at the booting stage. This region overlaps with the QTL1 region identified in this study, which contains 71 genes, with 15 genes containing genic SNPs. Among these genes, LOC_Os01g66890 (OsBTBZ1) was identified as a crucial gene responsible for the salt tolerance of CSSL16, functioning via ABA-dependent pathways (Saputro et al., 2023).
QTL1 (qCMS1-TN1) was stably expressed for 6%–18% of the PVE based on the CMS trait in the F3 and F4 populations but exclusively expressed for 16%–20% of the PVE based on the TN trait in the F3 population (Table 5). Correspondingly, TN_r was highly positively correlated with TN_s and CMS in the F3 population (Supplementary Figure 2).
The putative QTL on chromosome 3 with a minor phenotypic variance of less than 5% was not significantly different (Table 5). This could mean that the CMS and TN traits were not associated with this putative QTL. This finding is consistent with our QTL mapping, which revealed that the BSA mapping of the TN trait was only connected to QTLs on chromosome 1. The colocalization of qCMS1 and qTN1 on chromosome 1 was confirmed.
qCMS-TN1 is a pleiotropic QTL in which a single locus contributes to multiple traits. In the present study, we found that the QTL1 locus likely controls the CMS, TN_s, and TN_r traits. A major QTL has a PVE of 25%–50% with a major effect; however, a minor QTL has a PVE of less than 25% with a slight and cumulative effect, which is the most common agronomic and physiological feature governed by numerous genes (Mackill and Ni, 2001; Singh and Singh, 2015). Because the PVE values of the significant QTLs were less than 25%, the validated QTLs were grouped with minor QTLs.
CMS, reflected by membrane injury, has been widely used to index plants under abiotic stress. Under salt stress, the cellular lipid membrane is destroyed by oxidative stress (Gao et al., 2023). QTLs related to CMS have been reported on chromosomes 1, 3, 7, 8, 9, 11, and 12 in rice under drought conditions and explained 13.4%–42.1% of the phenotypic variance (Tripathy et al., 2000). Hossain et al. (2015) reported that QTLs associated with TN at the flowering stage account for 11.3%–16.3% of the PVE on chromosomes 7 and 8 in F2 progeny and that TN positively correlates with panicle number (Deng et al., 2022) and length, grain yield, potassium content, and biomass. TN in rice directly affects grain yield, and the QTLs differ at each stage, from the seedling to the heading stages (Yan et al., 1998; Liu et al., 2010, 2012). Barnaby et al. (2022) detected QTLs for TN on the short arms of chromosomes 1 and 3 at various locations, accounting for 19%–33% of the PVE in 6-week-old F10 recombinant inbred lines of rice progeny. Pundir et al. (2021) reported that QTLs related to the number of productive tillers on chromosome 2 explained 5% of the variation in an F2 population. Moreover, Liu et al. (2010) argued that the potential maximum for TN QTLs across chromosomes 1, 3, 4, 5, 6, 7, 9, and 12 accounted for 2.54%–8.54% of the PVE in doubled haploid lines. The QTLs between the restriction fragment length polymorphism markers RZ730 and RZ801 on chromosome 1 represented approximately 35% of the PVE of the multiple-QTL model and were detected at every stage of growth (Yan et al., 1998). Finally, Lekklar et al. (2019a) indicated that the strongest positive correlations were observed between the TN per plant, panicle number, and unfilled grains. Collectively, these reports are consistent with our findings that CMS and TN are quantitative traits with small and cumulative effects.
QTL analyses frequently overestimate the impact of a QTL because the same dataset is used to identify and calculate its effect (% explained variance). QTLs with minor effects are challenging to identify in small mapping populations of approximately 100 individuals (number of lines of segregating population) unless they exceed the detection threshold by chance. This occurs due to a statistical sampling effect that amplifies their actual impact (Fischer, 2020).
In MAS, the process of selecting individuals carrying target genes involves the utilization of linked markers rather than relying solely on their observable phenotype within a segregating population. Consequently, the population may undergo screening at any developmental phase and across diverse environments (Khush and Brar, 2001). The utilization of molecular markers has the potential to facilitate breeders in optimizing parent and progeny selection processes with increased precision and efficiency. It is evident that an effective breeding program would profit from the capacity to decrease the number of plants in the initial generation (Rana et al., 2019; Marè et al., 2023). The purpose of employing markers in the early stages of a breeding program is to effectively eliminate plants that do not possess the desired gene combinations, consequently optimizing the subsequent stages of the program with reduced labor and space requirements, hence economizing the process. The concept of gene/QTL pyramiding involves the transfer of multiple genes of a particular trait into a single genotype. As a result, the application of MAS can significantly reduce both the cost and time requirements of selecting precise phenotypes that exhibit desired traits.
QTL-BSA-Seq was performed to map salt-responsive genes/QTLs in an F2 population, and the results were validated with two different genetic background crosses derived from the JK variety, a salt-tolerant local Thai rice variety. Candidate QTLs were mapped on chromosomes 1 and 3 based on CMS and TN traits, with CMS-bulk overlapping in a region similar to that of TN-bulk on chromosome 1. QTL validation confirmed the colocalization of QTLs for both traits on chromosome 1, which are pleiotropic QTLs in which one locus governs multiple traits. For future studies, using JK rice as a donor line for salt tolerance, we plan to utilize the identified QTL, qCMS-TN1, along with other markers for QTL pyramiding. This approach will be applied in MAS to improve rice salt tolerance, as well as to address drought stress.
The original contributions presented in the study are publicly available. This data can be found here: https://www.ncbi.nlm.nih.gov/bioproject/PRJNA1148750.
PK: Investigation, Visualization, Writing – original draft. NJ: Investigation, Writing – review & editing. NT: Investigation, Writing – review & editing. SC: Conceptualization, Funding acquisition, Supervision, Writing – review & editing. MP: Methodology, Writing – review & editing. IH: Conceptualization, Writing – review & editing. LC: Conceptualization, Writing – review & editing. DS-A: Investigation, Writing – review & editing. IB: Investigation, Writing – review & editing. TB: Conceptualization, Funding acquisition, Supervision, Writing – review & editing.
The author(s) declare financial support was received for the research, authorship, and/or publication of this article. This work was funded by the Agricultural Research Development Agency (Public Organization), grant number PRP6405030090. PK was supported by the Program in Biotechnology Faculty of Science and Graduate School, Chulalongkorn University; NJ was supported by the Royal Golden Jubilee Ph.D. Program; and NT was supported by the 100th Anniversary Chulalongkorn University Fund for Doctoral Scholarship.
We are thankful to Dr. Chakkree Lekklar, Bagus Herwibawa, and laboratory members of the Center of Excellence in Molecular Crop, Department of Biochemistry, Faculty of Science, Chulalongkorn University for their valuable technical support and Dr. Susinya Habila and Dr. Thammaporn Kojonna, CEEPP Laboratory for providing rice seeds. SC is appreciated to be a part of Thailand Rice Science Research Hub of Knowledge (NRCT Grant Number: N34E670027). We would like to thank Editage (www.editage.com) for English language editing.
The authors declare that the research was conducted in the absence of any commercial or financial relationships that could be construed as a potential conflict of interest.
All claims expressed in this article are solely those of the authors and do not necessarily represent those of their affiliated organizations, or those of the publisher, the editors and the reviewers. Any product that may be evaluated in this article, or claim that may be made by its manufacturer, is not guaranteed or endorsed by the publisher.
The Supplementary Material for this article can be found online at: https://www.frontiersin.org/articles/10.3389/fpls.2024.1424689/full#supplementary-material
Aboul-Maaty, N.-F., Oraby, H.-S. (2019). Extraction of high-quality genomic DNA from different plant orders applying a modified CTAB-based method. Bull. Natl. Res. Centre 43, 1–10. doi: 10.1186/s42269-019-0066-1
Acquaah, G. (2012). Principles of plant genetics and breeding (West Sussex, UK: John Wiley & Sons). doi: 10.1002/9781118313718
Amoah, N. K. A., Akromah, R., Kena, A. W., Manneh, B., Dieng, I., Bimpong, I. K. (2020). Mapping QTLs for tolerance to salt stress at the early seedling stage in rice (Oryza sativa L.) using a newly identified donor ‘Madina Koyo’. Euphytica 216, 1–23. doi: 10.1007/s10681-020-02689-5
Arikit, S., Wanchana, S., Khanthong, S., Saensuk, C., Thianthavon, T., Vanavichit, A., et al. (2019). QTL-seq identifies cooked grain elongation QTLs near soluble starch synthase and starch branching enzymes in rice (Oryza sativa L.). Sci. Rep. 9, 8328. doi: 10.1038/s41598-019-44856-2
Ashraf, M., Munns, R. (2022). Evolution of approaches to increase the salt tolerance of crops. Crit. Rev. Plant Sci. 41, 128–160. doi: 10.1080/07352689.2022.2065136
Barnaby, J. Y., Mcclung, A. M., Edwards, J. D., Pinson, S. R. (2022). Identification of quantitative trait loci for tillering, root, and shoot biomass at the maximum tillering stage in rice. Sci. Rep. 12, 13304. doi: 10.1038/s41598-022-17109-y
Bizimana, J. B., Luzi-Kihupi, A., Murori, R. W., Singh, R. (2017). Identification of quantitative trait loci for salinity tolerance in rice (Oryza sativa L.) using IR29/Hasawi mapping population. J. Genet. 96, 571–582. doi: 10.1007/s12041-017-0803-x
Bolger, A. M., Lohse, M., Usadel, B. (2014). Trimmomatic: a flexible trimmer for Illumina sequence data. Bioinformatics 30, 2114–2120. doi: 10.1093/bioinformatics/btu170
Bonilla, P. (2002). RFLP and SSLP mapping of salinity tolerance genes in chromosome 1 of rice (Oryza sativa L.) using recombinant inbred lines. Phil. Agric. Scient. 85, 68–76.
Chutimanukul, P., Saputro, T. B., Mahaprom, P., Plaimas, K., Comai, L., Buaboocha, T., et al. (2021). Combining genome and gene co-expression network analyses for the identification of genes potentially regulating salt tolerance in rice. Front. Plant Sci. 12, 704549. doi: 10.3389/fpls.2021.704549
Collard, B. C., Mackill, D. J. (2008). Marker-assisted selection: an approach for precision plant breeding in the twenty-first century. Philos. Trans. R. Soc. B: Biol. Sci. 363, 557–572. doi: 10.1098/rstb.2007.2170
Dai, L., Li, P., Li, Q., Leng, Y., Zeng, D., Qian, Q. (2022). Integrated multi-omics perspective to strengthen the understanding of salt tolerance in rice. Int. J. Mol. Sci. 23, 5236. doi: 10.3390/ijms23095236
De La Fuente Cantó, C., Vigouroux, Y. (2022). Evaluation of nine statistics to identify QTLs in bulk segregant analysis using next generation sequencing approaches. BMC Genomics 23, 490. doi: 10.1186/s12864-022-08718-y
Deng, X., Wang, J., Liu, X., Yang, J., Zhou, M., Kong, W., et al. (2022). QTL analysis and heterosis loci of effective tiller using three genetic populations derived from Indica-Japonica crosses in rice. Agronomy 12, 2171. doi: 10.3390/agronomy12092171
Dwiningsih, Y., Rahmaningsih, M., Alkahtani, J. (2020). Development of single nucleotide polymorphism (SNP) markers in tropical crops. Advance Sustain. Science Eng. Technol. 2, 343558. doi: 10.26877/asset.v2i2.6279
Fischer, D. (2020). “Performing QTL and eQTL analyses with the R-package genomicTools.” in eQTL Analysis. Methods in Molecular Biology, eds. Shi, X., (Humana, New York, NY), 2082. doi: 10.1007/978-1-0716-0026-9_2
Flowers, T. J. (2004). Improving crop salt tolerance. J. Exp. Bot. 55, 307–319. doi: 10.1093/jxb/erh003
Ganal, M. W., Altmann, T., Röder, M. S. (2009). SNP identification in crop plants. Curr. Opin. Plant Biol. 12, 211–217. doi: 10.1016/j.pbi.2008.12.009
Gao, Q., Wang, H., Yin, X., Wang, F., Hu, S., Liu, W., et al. (2023). Identification of salt tolerance related candidate genes in ‘Sea rice 86’at the seedling and reproductive stages using QTL-seq and BSA-seq. Genes 14, 458. doi: 10.3390/genes14020458
Geng, L., Zhang, W., Zou, T., Du, Q., Ma, X., Cui, D., et al. (2023). Integrating linkage mapping and comparative transcriptome analysis for discovering candidate genes associated with salt tolerance in rice. Front. Plant Sci. 14, 1065334. doi: 10.3389/fpls.2023.1065334
George, D., Mallery, P. (2019). IBM SPSS statistics 26 step by step: A simple guide and reference (New York, USA: Routledge). doi: 10.4324/9780429056765
Gimhani, D., Gregorio, G. B., Kottearachchi, N., Samarasinghe, W. (2016). SNP-based discovery of salinity-tolerant QTLs in a bi-parental population of rice (Oryza sativa). Mol. Genet. Genomics 291, 2081–2099. doi: 10.1007/s00438-016-1241-9
Habila, S., Buaboocha, T., Pongpanich, M., Suriya-Arunroj, D., Siangliw, M., Chadchawan, S. (2021). F2 population phenotyping for salt stress tolerant region identification in’Jao khao’Rice. Genomics Genet. 14, 47–55.
Habila, S., Khunpolwattana, N., Chantarachot, T., Buaboocha, T., Comai, L., Chadchawan, S., et al. (2022). Salt stress responses and SNP-based phylogenetic analysis of Thai rice cultivars. Plant Genome 15, e20189. doi: 10.1002/tpg2.20189
Haque, M. A., Rafii, M. Y., Yusoff, M. M., Ali, N. S., Yusuff, O., Datta, D. R., et al. (2021). Advanced breeding strategies and future perspectives of salinity tolerance in rice. Agronomy 11, 1631. doi: 10.3390/agronomy11081631
Hossain, H., Rahman, M., Alam, M., Singh, R. (2015). Mapping of quantitative trait loci associated with reproductive-stage salt tolerance in rice. J. Agron. Crop Sci. 201, 17–31. doi: 10.1111/jac.12086
Itoh, N., Segawa, T., Tamiru, M., Abe, A., Sakamoto, S., Uemura, A., et al. (2019). Next-generation sequencing-based bulked segregant analysis for QTL mapping in the heterozygous species Brassica rapa. Theor. Appl. Genet. 132, 2913–2925. doi: 10.1007/s00122-019-03396-z
Jain, M., Moharana, K. C., Shankar, R., Kumari, R., Garg, R. (2014). Genomewide discovery of DNA polymorphisms in rice cultivars with contrasting drought and salinity stress response and their functional relevance. Plant Biotechnol. J. 12, 253–264. doi: 10.1111/pbi.12133
Joehanes, R., Nelson, J. C. (2008). QGene 4.0, an extensible Java QTL-analysis platform. Bioinformatics 24, 2788–2789. doi: 10.1093/bioinformatics/btn523
Kanawapee, N., Sanitchon, J., Lontom, W., Threerakulpisut, P. (2012). Evaluation of salt tolerance at the seedling stage in rice genotypes by growth performance, ion accumulation, proline and chlorophyll content. Plant Soil 358, 235–249. doi: 10.1007/s11104-012-1179-6
Kawahara, Y., de la Bastide, M., Hamilton, J. P., Kanamori, H., Mccombie, W. R., Ouyang, S., et al. (2013). Improvement of the Oryza sativa Nipponbare reference genome using next generation sequence and optical map data. Rice 6, 1–10. doi: 10.1186/1939-8433-6-4
Khush, G., Brar, D. (2001). “Rice genetics from Mendel to functional genomics,” in Rice Genetics IV. (Enfield, NH, USA: Science Publishers), 3–25.
Kim, S.-R., Ramos, J., Ashikari, M., Virk, P. S., Torres, E. A., Nissila, E., et al. (2016). Development and validation of allele-specific SNP/indel markers for eight yield-enhancing genes using whole-genome sequencing strategy to increase yield potential of rice, Oryza sativa L. Rice 9, 1–17. doi: 10.1186/s12284-016-0084-7
Knoll, J., Ejeta, G. (2008). Marker-assisted selection for early-season cold tolerance in sorghum: QTL validation across populations and environments. Theor. Appl. Genet. 116, 541–553. doi: 10.1007/s00122-007-0689-8
Kong, W., Sun, T., Zhang, C., Deng, X., Li, Y. (2021). Comparative transcriptome analysis reveals the mechanisms underlying differences in salt tolerance between indica and japonica rice at seedling stage. Front. Plant Sci. 12, 725436. doi: 10.3389/fpls.2021.725436
Kumar, P., Sharma, P. K. (2020). Soil salinity and food security in India. Front. Sustain. Food Syst. 4, 533781. doi: 10.3389/fsufs.2020.533781
Lei, L., Zheng, H., Bi, Y., Yang, L., Liu, H., Wang, J., et al. (2020). Identification of a major QTL and candidate gene analysis of salt tolerance at the bud burst stage in rice (Oryza sativa L.) using QTL-Seq and RNA-Seq. Rice 13, 1–14. doi: 10.1186/s12284-020-00416-1
Lekklar, C., Pongpanich, M., Suriya-Arunroj, D., Chinpongpanich, A., Tsai, H., Comai, L., et al. (2019a). Genome-wide association study for salinity tolerance at the flowering stage in a panel of rice accessions from Thailand. BMC Genomics 20, 1–18. doi: 10.1186/s12864-018-5317-2
Lekklar, C., Suriya-Arunroj, D., Pongpanich, M., Comai, L., Kositsup, B., Chadchawan, S., et al. (2019b). Comparative genomic analysis of rice with contrasting photosynthesis and grain production under salt stress. Genes 10, 562. doi: 10.3390/genes10080562
Li, H., Durbin, R. (2010). Fast and accurate long-read alignment with Burrows–Wheeler transform. Bioinformatics 26, 589–595. doi: 10.1093/bioinformatics/btp698
Li, H., Handsaker, B., Wysoker, A., Fennell, T., Ruan, J., Homer, N., et al. (2009). The sequence alignment/map format and SAMtools. bioinformatics 25, 2078–2079. doi: 10.1093/bioinformatics/btp352
Li, Z., Möttönen, J., Sillanpää, M. J. (2015). A robust multiple-locus method for quantitative trait locus analysis of non-normally distributed multiple traits. Heredity 115, 556–564. doi: 10.1038/hdy.2015.61
Liu, G., Li, M., Wen, J., Du, Y., Zhang, Y.-M. (2010). Functional mapping of quantitative trait loci associated with rice tillering. Mol. Genet. Genomics 284, 263–271. doi: 10.1007/s00438-010-0566-z
Liu, J., Huang, S., Sun, M., Liu, S., Liu, Y., Wang, W., et al. (2012). An improved allele-specific PCR primer design method for SNP marker analysis and its application. Plant Methods 8, 1–9. doi: 10.1186/1746-4811-8-34
Mackill, D., Ni, J. (2001). “Molecular mapping and marker-assisted selection for major-gene traits in rice,” in Rice Genetics IV. (Enfield, NH, USA: Science Publishers), 137–151.
Magwene, P. M., Willis, J. H., Kelly, J. K. (2011). The statistics of bulk segregant analysis using next generation sequencing. PloS Comput. Biol. 7, e1002255. doi: 10.1371/journal.pcbi.1002255
Majeed, A., Johar, P., Raina, A., Salgotra, R., Feng, X., Bhat, J. A. (2022). Harnessing the potential of bulk segregant analysis sequencing and its related approaches in crop breeding. Front. Genet. 13, 944501. doi: 10.3389/fgene.2022.944501
Mansfeld, B. N., Grumet, R. (2018). QTLseqr: An R package for bulk segregant analysis with next-generation sequencing. Plant Genome 11, 180006. doi: 10.3835/plantgenome2018.01.0006
Marè, C., Zampieri, E., Cavallaro, V., Frouin, J., Grenier, C., Courtois, B., et al. (2023). Marker-assisted introgression of the salinity tolerance locus Saltol in temperate Japonica rice. Rice 16, 2. doi: 10.1186/s12284-023-00619-2
Matsumoto, T., Wu, J., Itoh, T., Numa, H., Antonio, B., Sasaki, T. (2016). The Nipponbare genome and the next-generation of rice genomics research in Japan. Rice 9, 1–11. doi: 10.1186/s12284-016-0107-4
Mckenna, A., Hanna, M., Banks, E., Sivachenko, A., Cibulskis, K., Kernytsky, A., et al. (2010). The Genome Analysis Toolkit: a MapReduce framework for analyzing next-generation DNA sequencing data. Genome Res. 20, 1297–1303. doi: 10.1101/gr.107524.110
Miah, G., Rafii, M. Y., Ismail, M. R., Puteh, A. B., Rahim, H. A., Latif, M. A. (2015). Recurrent parent genome recovery analysis in a marker-assisted backcrossing program of rice (Oryza sativa L.). Comptes rendus biologies 338, 83–94. doi: 10.1016/j.crvi.2014.11.003
Mishra, P., Pandey, C. M., Singh, U., Gupta, A., Sahu, C., Keshri, A. (2019). Descriptive statistics and normality tests for statistical data. Ann. cardiac anaesthesia 22, 67. doi: 10.4103%2Faca.ACA_157_18
Munns, R., Tester, M. (2008). Mechanisms of salinity tolerance. Annu. Rev. Plant Biol. 59, 651–681. doi: 10.1146/annurev.arplant.59.032607.092911
Pamuta, D., Siangliw, M., Sanitchon, J., Pengrat, J., Siangliw, J. L., Toojinda, T., et al. (2022). Physio-biochemical traits in improved ‘KDML105’jasmine rice lines containing drought and salt tolerance gene under drought and salt stress. Chilean J. Agric. Res. 82, 97–110. doi: 10.4067/S0718-58392022000100097
Pundir, P., Devi, A., Krishnamurthy, S., Sharma, P. C., Vinaykumar, N. (2021). QTLs in salt rice variety CSR10 reveals salinity tolerance at reproductive stage. Acta Physiologiae Plantarum 43, 1–15. doi: 10.1007/s11738-020-03183-0
Punyawaew, K., Suriya-Arunroj, D., Siangliw, M., Thida, M., Lanceras-Siangliw, J., Fukai, S., et al. (2016). Thai jasmine rice cultivar KDML105 carrying Saltol QTL exhibiting salinity tolerance at seedling stage. Mol. Breed. 36, 1–13. doi: 10.1007/s11032-016-0574-8
Quan, R., Wang, J., Hui, J., Bai, H., Lyu, X., Zhu, Y., et al. (2018). Improvement of salt tolerance using wild rice genes. Front. Plant Sci. 8, 2269. doi: 10.3389/fpls.2017.02269
Rahman, M. A., Bimpong, I. K., Bizimana, J., Pascual, E. D., Arceta, M., Swamy, B. M., et al. (2017). Mapping QTLs using a novel source of salinity tolerance from Hasawi and their interaction with environments in rice. Rice 10, 1–17. doi: 10.1186/s12284-017-0186-x
Rajcan, I., Boersma, J., Shaw, E. (2011). “Plant Systems | Plant GeneticTechniques: Plant Breeder’s Toolbox.“. in Comprehensive Biotechnology, Second Edition, volume 4, ed Moo-Young, Murray (Amsterdam, Netherlands: Elsevier)133–147.
Rana, M. M., Takamatsu, T., Baslam, M., Kaneko, K., Itoh, K., Harada, N., et al. (2019). Salt tolerance improvement in rice through efficient SNP marker-assisted selection coupled with speed-breeding. Int. J. Mol. Sci. 20, 2585. doi: 10.3390/ijms20102585
Reddy, I. N. B. L., Kim, B.-K., Yoon, I.-S., Kim, K.-H., Kwon, T.-R. (2017). Salt tolerance in rice: focus on mechanisms and approaches. Rice Sci. 24, 123–144. doi: 10.1016/j.rsci.2016.09.004
Saputro, T. B., Jakada, B. H., Chutimanukul, P., Comai, L., Buaboocha, T., Chadchawan, S. (2023). OsBTBZ1 confers salt stress tolerance in arabidopsis thaliana. Int. J. Mol. Sci. 24, 14483. doi: 10.3390/ijms241914483
Singh, R. K., Kota, S., Flowers, T. J. (2021). Salt tolerance in rice: seedling and reporductive stagge QTL mapping come of age. Theor. Appl. Genet. 134, 2495–3533. doi: 10.1007/s00122-021-03890-3
Singh, B. D., Singh, A. K. (2015). Marker-assisted plant breeding: principles and practices New York, USA: Springer. doi: 10.1007/978-81-322-2316-0
Sun, B.-R., Fu, C.-Y., Fan, Z.-L., Chen, Y., Chen, W.-F., Zhang, J., et al. (2019). Genomic and transcriptomic analysis reveal molecular basis of salinity tolerance in a novel strong salt-tolerant rice landrace Changmaogu. Rice 12, 1–15. doi: 10.1186/s12284-019-0360-4
Takagi, H., Abe, A., Yoshida, K., Kosugi, S., Natsume, S., Mitsuoka, C., et al. (2013). QTL-seq: rapid mapping of quantitative trait loci in rice by whole genome resequencing of DNA from two bulked populations. Plant J. 74, 174–183. doi: 10.1111/tpj.12105
Tan, Q., Bu, S., Chen, G., Yan, Z., Chang, Z., Zhu, H., et al. (2022). Reconstruction of the high stigma exsertion rate trait in rice by pyramiding multiple QTLs. Front. Plant Sci. 13, 921700. doi: 10.3389/fpls.2022.921700
Team, R. C. (2020). R: a language and environment for statistical computing. (R Foundation for Statistical Computing, Vienna). Available online at: https://www.R-project.org/.
Tripathy, J., Zhang, J., Robin, S., Nguyen, T. T., Nguyen, H. (2000). QTLs for cell-membrane stability mapped in rice (Oryza sativa L.) under drought stress. Theor. Appl. Genet. 100, 1197–1202. doi: 10.1007/s001220051424
Vanavichit, A., Kamolsukyeunyong, W., Siangliw, M., Siangliw, J. L., Traprab, S., Ruengphayak, S., et al. (2018). Thai Hom Mali Rice: Origin and breeding for subsistence rainfed lowland rice system. Rice 11, 1–12. doi: 10.1186/s12284-018-0212-7
Vikram, P., Swamy, B. M., Dixit, S., Ahmed, H. U., Teresa Sta Cruz, M., Singh, A. K., et al. (2011). qDTY 1.1, a major QTL for rice grain yield under reproductive-stage drought stress with a consistent effect in multiple elite genetic backgrounds. BMC Genet. 12, 1–15. doi: 10.1186/1471-2156-12-89
Wu, F., Yang, J., Yu, D., Xu, P. (2020). Identification and validation a major QTL from “Sea Rice 86” seedlings conferred salt tolerance. Agronomy 10, 410. doi: 10.3390/agronomy10030410
Xie, L., Zheng, C., Li, W., Pu, M., Zhou, G., Sun, W., et al. (2022). Mapping and identification a salt-tolerant QTL in a salt-resistant rice landrace, Haidao86. J. Plant Growth Regul. 41, 2347–2358. doi: 10.1007/s00344-021-10448-6
Yan, J., Zhu, J., He, C., Benmoussa, M., Wu, P. (1998). Quantitative trait loci analysis for the developmental behavior of tiller number in rice (Oryza sativa L.). Theor. Appl. Genet. 97, 267–274. doi: 10.1007/s001220050895
Yang, Y., Ye, R., Srisutham, M., Nontasri, T., Sritumboon, S., Maki, M., et al. (2022). Rice production in farmer fields in soil salinity classified areas in Khon Kaen, Northeast Thailand. Sustainability 14, 9873. doi: 10.3390/su14169873
Yuan, L., Zhang, L., Wei, X., Wang, R., Li, N., Chen, G., et al. (2022). Quantitative trait locus mapping of salt tolerance in wild rice Oryza longistaminata. Int. J. Mol. Sci. 23, 2379. doi: 10.3390/ijms23042379
Zegeye, W. A., Zhang, Y., Cao, L., Cheng, S. (2018). Whole Genome Resequencing from bulked populations as a rapid QTL and gene identification method in rice. Int. J. Mol. Sci. 19, 4000. doi: 10.3390/ijms19124000
Keywords: quantitative trait loci, bulk segregant analysis, QTL-seq, QTL mapping, QTL validation, marker-assisted selection, rice, salt tolerance
Citation: Khunsanit P, Jitsamai N, Thongsima N, Chadchawan S, Pongpanich M, Henry IM, Comai L, Suriya-Arunroj D, Budjun I and Buaboocha T (2024) QTL-Seq identified a genomic region on chromosome 1 for soil-salinity tolerance in F2 progeny of Thai salt-tolerant rice donor line “Jao Khao”. Front. Plant Sci. 15:1424689. doi: 10.3389/fpls.2024.1424689
Received: 28 April 2024; Accepted: 22 July 2024;
Published: 26 August 2024.
Edited by:
Vijay Gahlaut, Chandigarh University, IndiaReviewed by:
Wricha Tyagi, Central Agricultural University, IndiaCopyright © 2024 Khunsanit, Jitsamai, Thongsima, Chadchawan, Pongpanich, Henry, Comai, Suriya-Arunroj, Budjun and Buaboocha. This is an open-access article distributed under the terms of the Creative Commons Attribution License (CC BY). The use, distribution or reproduction in other forums is permitted, provided the original author(s) and the copyright owner(s) are credited and that the original publication in this journal is cited, in accordance with accepted academic practice. No use, distribution or reproduction is permitted which does not comply with these terms.
*Correspondence: Teerapong Buaboocha, teerapong.b@chula.ac.th
†These authors have contributed equally to this work
Disclaimer: All claims expressed in this article are solely those of the authors and do not necessarily represent those of their affiliated organizations, or those of the publisher, the editors and the reviewers. Any product that may be evaluated in this article or claim that may be made by its manufacturer is not guaranteed or endorsed by the publisher.
Research integrity at Frontiers
Learn more about the work of our research integrity team to safeguard the quality of each article we publish.