- 1School of Computer and Communication Engineering, University of Science and Technology Beijing, Beijing, China
- 2Aerospace Information Research Institute, Chinese Academy of Sciences, Beijing, China
- 3Department of Electronic Engineering, Tsinghua University, Beijing, China
Fine classification and phenological information of rice paddy are of great significance for precision agricultural management. General compact polarimetric (CP) synthetic aperture radar (SAR) offers the advantage of providing rich polarimetric information, making it an important means of monitoring rice growth. Therefore, in response to the current challenges of difficulty in rice type classification and the small differences in phenological polarimetric characteristics, a novel strategy for fine classification and phenological analysis of rice paddy is proposed. This strategy thoroughly explores the polarimetric information of general CP SAR data and the target scattering characterization capabilities under different imaging modes. Firstly, the general CP SAR data is formalized using the standard CP descriptors, followed by the extraction of general CP features through the ΔαB/αB target decomposition method. optimal CP features are generated to achieve fine classification of rice paddy. Finally, 6 phenological stages of rice are analyzed based on the general CP features. The experiment results of rice classification show that the classification accuracy based on this strategy exceeds 90%, with a Kappa coefficient above 0.88. The highest classification accuracies were observed for transplanting hybrid rice paddy (T-H) and direct-sown japonica rice paddy (D-J), at 80.9% and 89.9%, respectively. The phenological evolution rule of the two rice types indicate that from early June (seedling stage) to late July (elongation stage), the CP feature variation trends of T-H and D-J are generally consistent. However, from October (mature stage) to November (harvest stage), the variation trends of the CP features for T-H and D-J are significantly different. The study found that from the booting-heading stage to the harvest stage, the linear π/4 mode outperforms circular and elliptical polarimetric modes in distinguishing different types of rice. Throughout the entire phenological period of rice growth, CP SAR of linear π/4 mode is surpasses that of other linear modes in discriminating different type of rice. The proposed strategy enables high-precision fine classification rice paddy, and the extracted general CP αB parameter effectively reflects the phenological change trends in rice growth.
1 Introduction
Rice is the primary staple crop worldwide, covering approximately 15% of the world’s total arable land. Furthermore, over 50% of the global population depends on rice as their primary food source (Maclean et al., 2002). Accurate information on the fine classification of rice paddies can enable precise and periodic estimation of rice yields. This information directly influences the government’s ability to formulate appropriate policies for grain production, distribution, storage, and transportation. Consequently, it serves as a crucial foundation for scientifically predicting and managing grain prices. Furthermore, rice phenology estimation is an important part of rice field management system (Mosleh et al., 2015). It not only helps field managers plan and implement different field management activities (such as irrigation, fertilization, etc.) in a timely manner, but also provides essential timing and crop growth references for yield estimates. In recent years, remote sensing technology has gradually replaced the traditional field observation method with its wide coverage and short revisiting period. Moreover, all-day and all-weather radar remote sensing has become an effective means of monitoring and estimating rice yield (Lopez-Sanchez et al., 2014). Fine classification and phenological analysis of rice paddies utilizing SAR data are particularly advantageous due to SAR’s capability to penetrate clouds and fog, enabling continuous monitoring of rice growth in all weather conditions. Furthermore, the characteristic parameters of polarimetric SAR are highly sensitive to the morphological structure and water content of the rice canopy, enhancing the accuracy of classification and analysis of rice paddies.
At present, the research on rice mapping based on fully polarimetric (FP) SAR data has gradually matured (Zhang et al., 2009; Yang et al., 2008; Li et al., 2014; Bouvet and Toan, 2011). As a new imaging radar system, CP SAR has emerged as one of the crucial development trends in the next generation of earth observation SAR systems. It transmits a polarization wave and receives two orthogonal polarization waves, which effectively reduces the complexity and energy consumption of SAR system and reduces the sensor volume. Currently, the most widely used CP SAR modes are π/4 mode (Souyris et al., 2005; Souyris and Mingot, 2002), DCP (Raney, 2006) and CTLR (Stacy and Press Austra, 2006; Raney, 2007). In agricultural radar remote sensing, rice classification and phenology estimation using CP SAR data is becoming a hotspot of current research (Yang et al., 2014; Deepika et al., 2015; Guo et al., 2021, Guo et al., 2022). However, all these studies are based on a single CP mode. Nowadays, there is no study in fine classification and phenology estimation of rice paddies based on the general CP mode. At present, there is a paucity of research focused on the fine classification and phenology estimation of rice paddies utilizing the general CP mode. Fortunately, our recent work (Yin et al., 2019) introduced a novel formalism for general CP SAR, paving the way for exploring the potential of CP SAR data from arbitrary electromagnetic wave transceiver modes in rice classification and phenology estimation.
Complex land-cover classification for FP SAR and CP SAR data primarily relies on intensity and polarimetric information. Various polarimetric decomposition methods are commonly employed to extract polarimetric characteristic parameters, enhancing the use of polarimetric information in classification tasks. Numerous polarimetric decomposition methods for the FP SAR data, have been developed based on target complexity. These methods include the two-component decomposition method based on Kennaugh matrix (Huynen, 1990; Holm and Barnes, 1988; Yang et al., 2006), decomposition methods using covariance matrix C3 or coherence matrix T3 based on scattering models (Freeman and Durden, 1998; Yamaguchi et al., 2005, Yamaguchi et al., 2006), eigenvector or eigenvalue analysis methods based on covariance matrix C3 or coherence matrix T3 (Cloude, 1985; Cloude and Pottier, 1996; van Zyl, 1993) and coherent decomposition methods based on scattering matrix S (Krogager, 1990; Cameron and Leung, 1990; Cameron and Rais, 2006; Touzi and Charbonneau, 2002). These decomposition methods are used to extract polarimetric features for land classification. Currently, there are two main polarimetric decomposition methods for CP SAR data. The first method involves reconstructing CP SAR into pseudo fully polarimetric SAR, followed by polarimetric decomposition using FP decomposition methods to extract polarimetric parameters. The second method involves directly performing polarimetric decomposition on the CP SAR data. Recently, few polarimetric decomposition methods have been developed for CP SAR, and most of them apply only to a single mode of compact polarization, such as m-χ decomposition (Raney et al., 2012), m-δ decomposition (Raney, 2007; Charbonneau et al., 2010) and m-αS decomposition (Cloude et al., 2012). However, these decomposition methods are only applicable to CP SAR of circular mode, and cannot be directly applied to CP SAR data in other modes without incident wave-based modification. We (Yin and Yang, 2020) developed a αS-ϕsdecomposition method, which expanded the m-αS decomposition method from circular polarization mode to π/4 mode. Therefore, we note that currently, few polarimetric decomposition methods can be directly applied to CP SAR of different modes as well as FP SAR data. We (Yin et al., 2016) developed a decomposition method applied to FP SAR data, achieving good results in identifying and separating target scattering mechanisms. Subsequently, we (Yin et al., 2019) modified the ΔαB/αB target decomposition method, enabling its application to CP SAR data in general CP mode.
Given the universality and robustness of ΔαB/αB method in both FP SAR and multi-mode CP SAR data, we introduced this method into the fine classification of multi-temporal rice paddy and phenological analysis of rice. Moreover, we the first time explored the ability of CP SAR data of arbitrary electromagnetic wave transceiver modes in rice classification and phenological analysis. We also extracted and analyzed the six temporal ΔαB and αB parameters of T-H and D-J based on FP SAR and general CP SAR. For fine classification of rice paddy, ΔαB and αB parameters were analyzed for distinguishing of T-H and D-J based on FP SAR data, CP SAR data of π/4 and CTLR modes. The Support Vector Machine (SVM) method was used to carry out a classification experiment based on the optimal ΔαB and αB parameters under the three kinds of SAR data (FP SAR, CP SAR of CTLR mode and π/4 mode). The classification results were then verified and evaluated. For phenological analysis of two types of rice, we analyzed the ΔαB and αB of general CP SAR across multiple phenological periods, including four CP modes: circular mode, linear π/4 mode and two kinds of ellipse modes. And we obtained the change rule of ΔαB and αB of two types of rice paddies in the phenological periods under multiple CP modes.
2 Study area and data
Our research area is located around Jinhu, Huai ‘an, Jiangsu, China, covering approximately 40 km × 30 km (Figure 1). The central geographic coordinate of this area is 33°07 ‘05 “N, 118°59′55.14″E. The climate of the study area is classified as a subtropical temperate monsoon climate zone, with an average annual precipitation of 1085 mm. In terms of crops, the main crop in this area is rice with planting pattern once a year. Due to different planting methods, planting habits and rice varieties, this area mainly includes two types of rice paddies, namely, transplanting hybrid rice paddy (T-H) and direct-sown japonica rice paddy (D-J). In terms of transplanting paddy, rice seedlings need to be cultivated in nursery in advance, and then transplanted by artificial or mechanical transplanting. Besides, the row and pier spacing are approximately 30 cm and 15 cm. And, most of these rice seedlings are hybrid rice (e.g. ‘LIANGYOU-898’ and ‘XIEYOU-9308’) with growth cycle of about 120 days. In 2015, the T-H rice growth cycle spanned from mid-June to mid-October. For sowing paddy, rice seeds or small seedlings are directly sowed. Compared with the transplanting paddy, the rice seedlings had no obvious row-column rule with random uniform distribution. Meanwhile, these rice seeds or small seedlings are mostly japonica rice. (e.g. ‘HUAIDAO-5’ and ‘NANJING-9108’) with growth cycle of about 150 days. In 2015, the T-H rice growth cycle spanned from mid-June to early November. Figure 2 shows field photos of two types of rice. We can see the difference between the two types of rice in the field photo in two phenological stages. In addition to the two types of rice paddies, the study area includes three other land cover types: urban, water and shoal naked land (SNL). Since the growth cycle of rice spans from June to November, we selected six temporal RADARSAT-2 C band FP SAR data. The FP SAR data parameters are shown in Table 1.
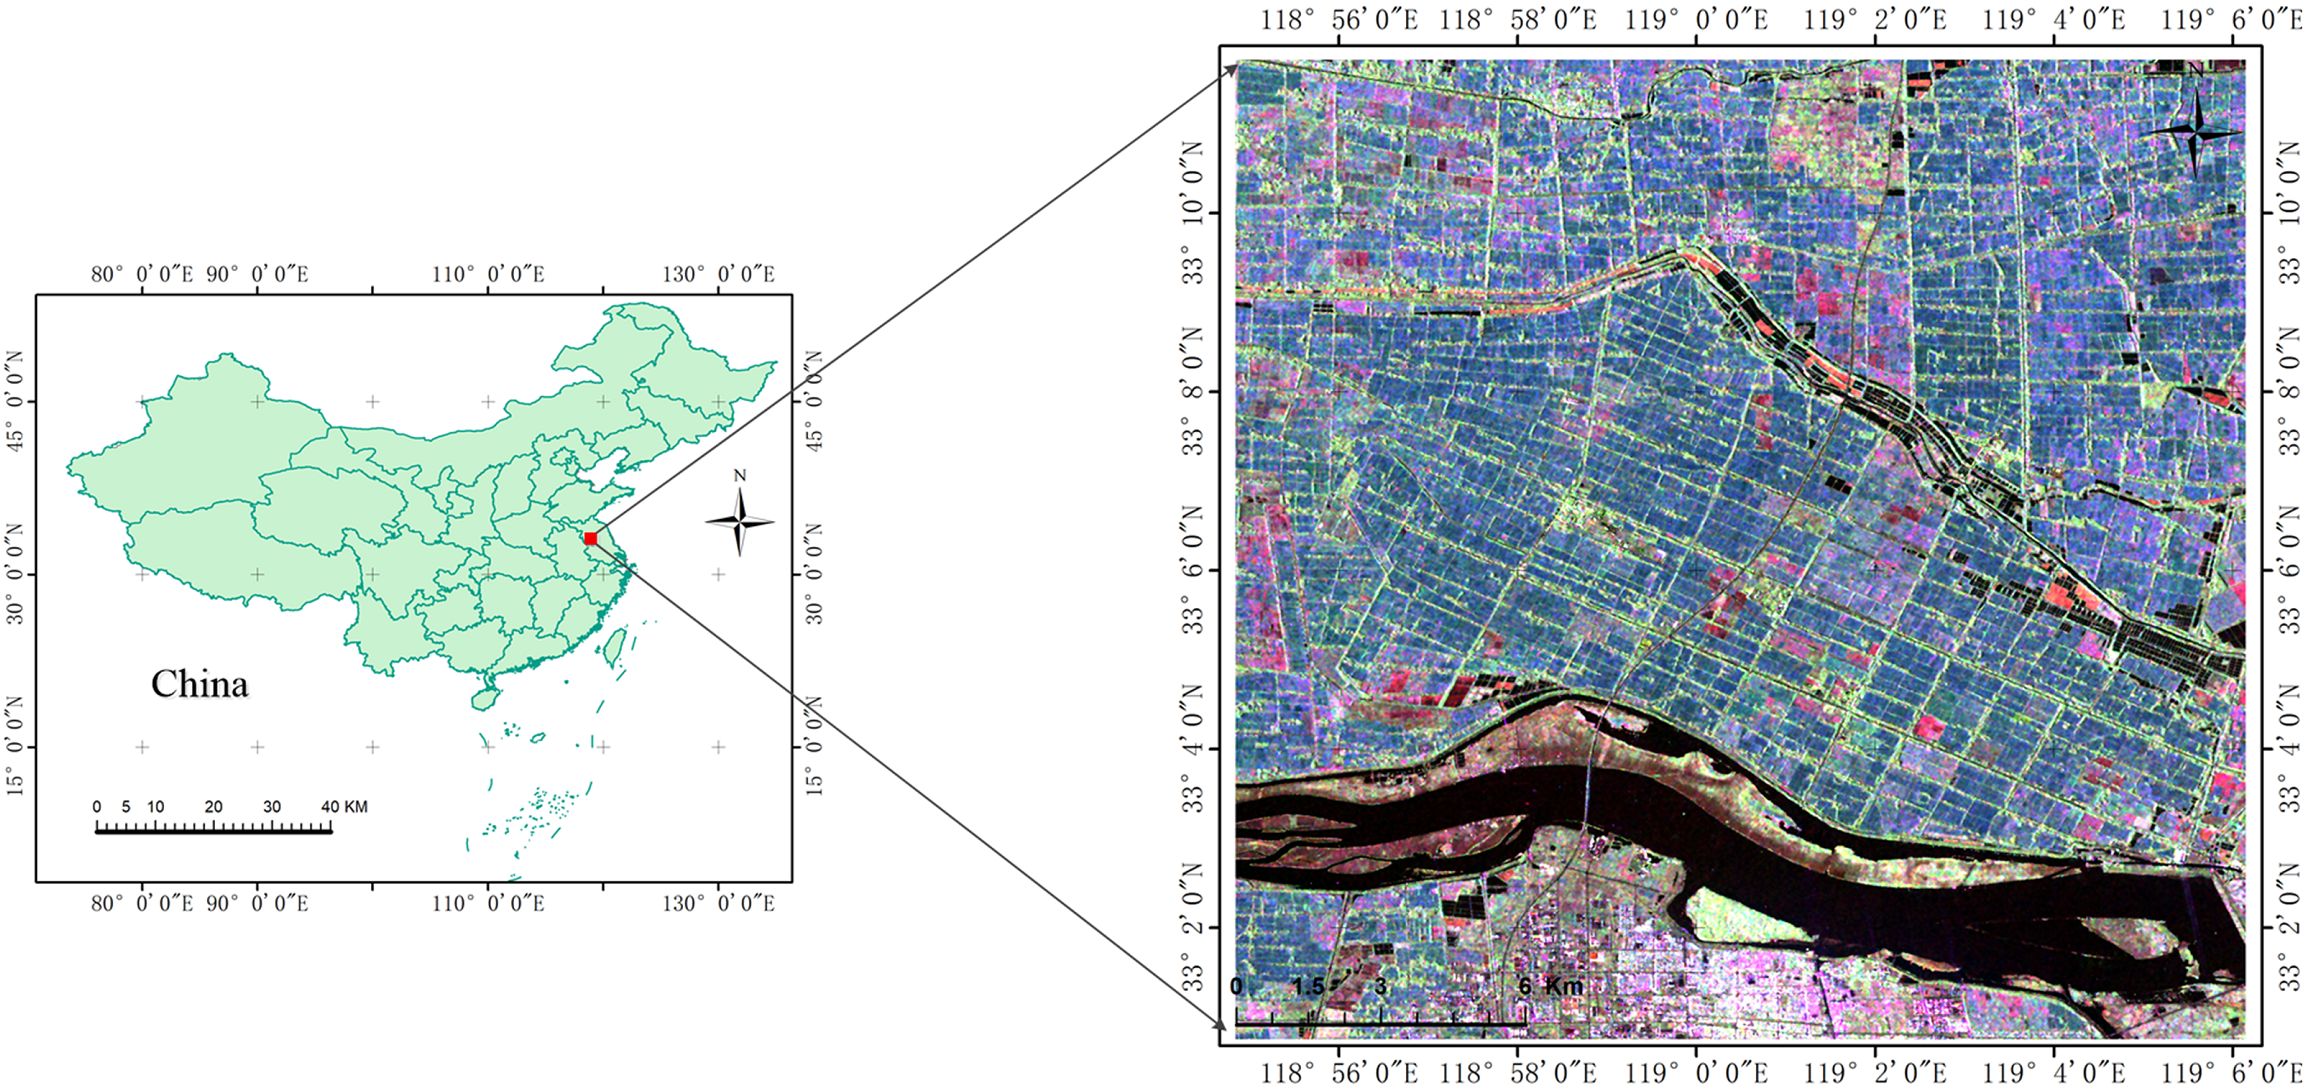
Figure 1. The color composite images [FP SAR VV (Red), VH (Green), and HH (Blue)] of the backscattering coefficients of FP SAR data on July 30, 2015.
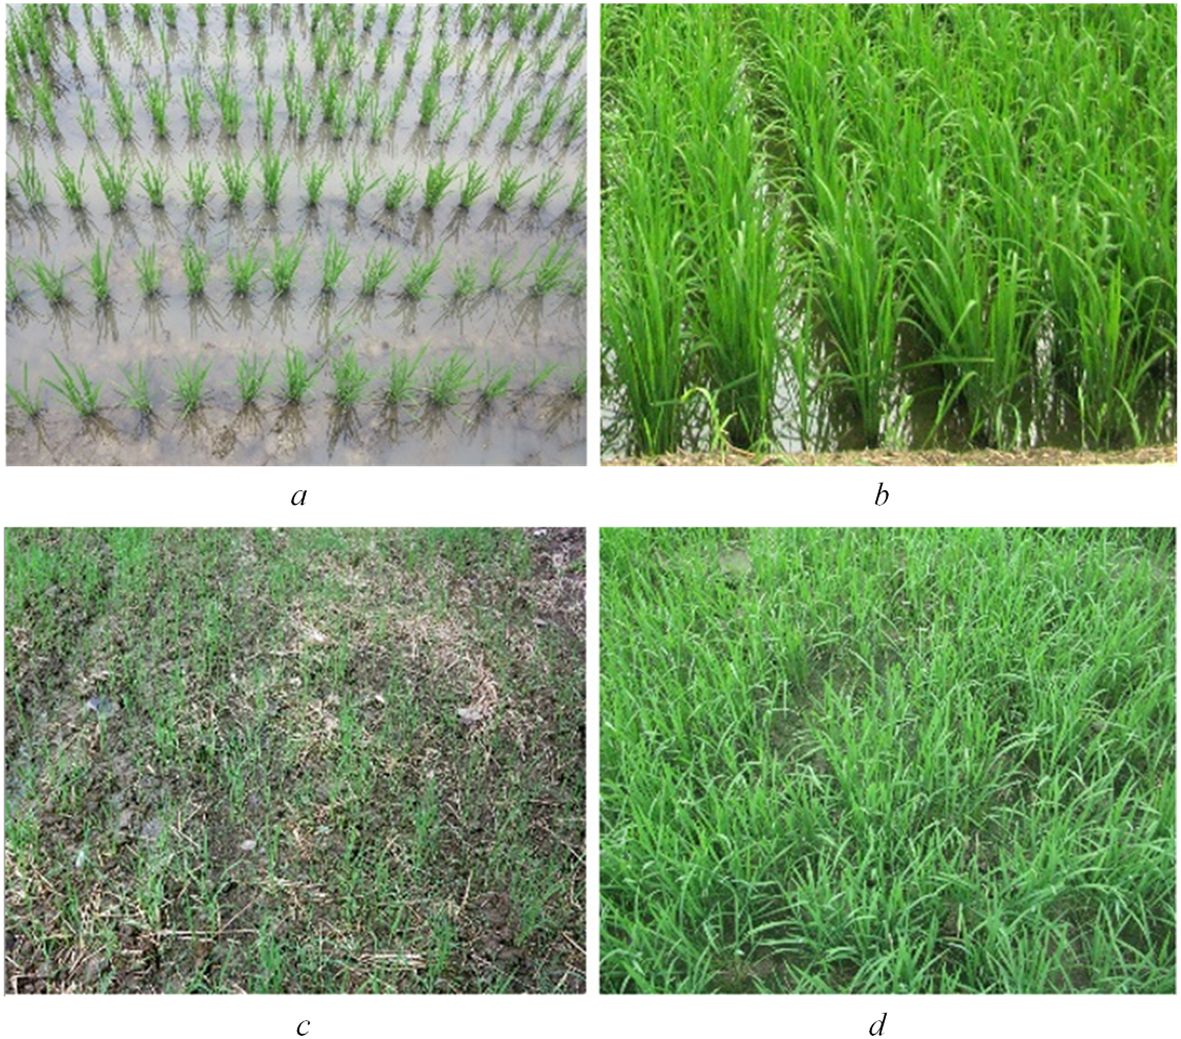
Figure 2. Field photos of two types of rice (A) Seedling stage of T-H; (B) Early tillering stage of T-H; (C) Seedling stage of D-J; (D) Early tillering stage of D-J).
Ground experiments were conducted as the satellite passed over the study area. High-precision GPS was used to collect the geographic coordinates of 42 rice parcels, including 28 T-H and 14 D-J parcels. Each parcel covers an area of more than 100 m × 100 m, ensuring sufficient pixel coverage. In addition, we also collected the geographic information of 8 water, 8 urban and 8 SNL parcels. In this study, the T-H, D-J, urban, SNL, and water parcels were divided into two groups: training and verification samples, based on their geographic coordinates. And the training and verification sets each accounted for 50% of total samples, with no overlap between the two.
3 Methodology
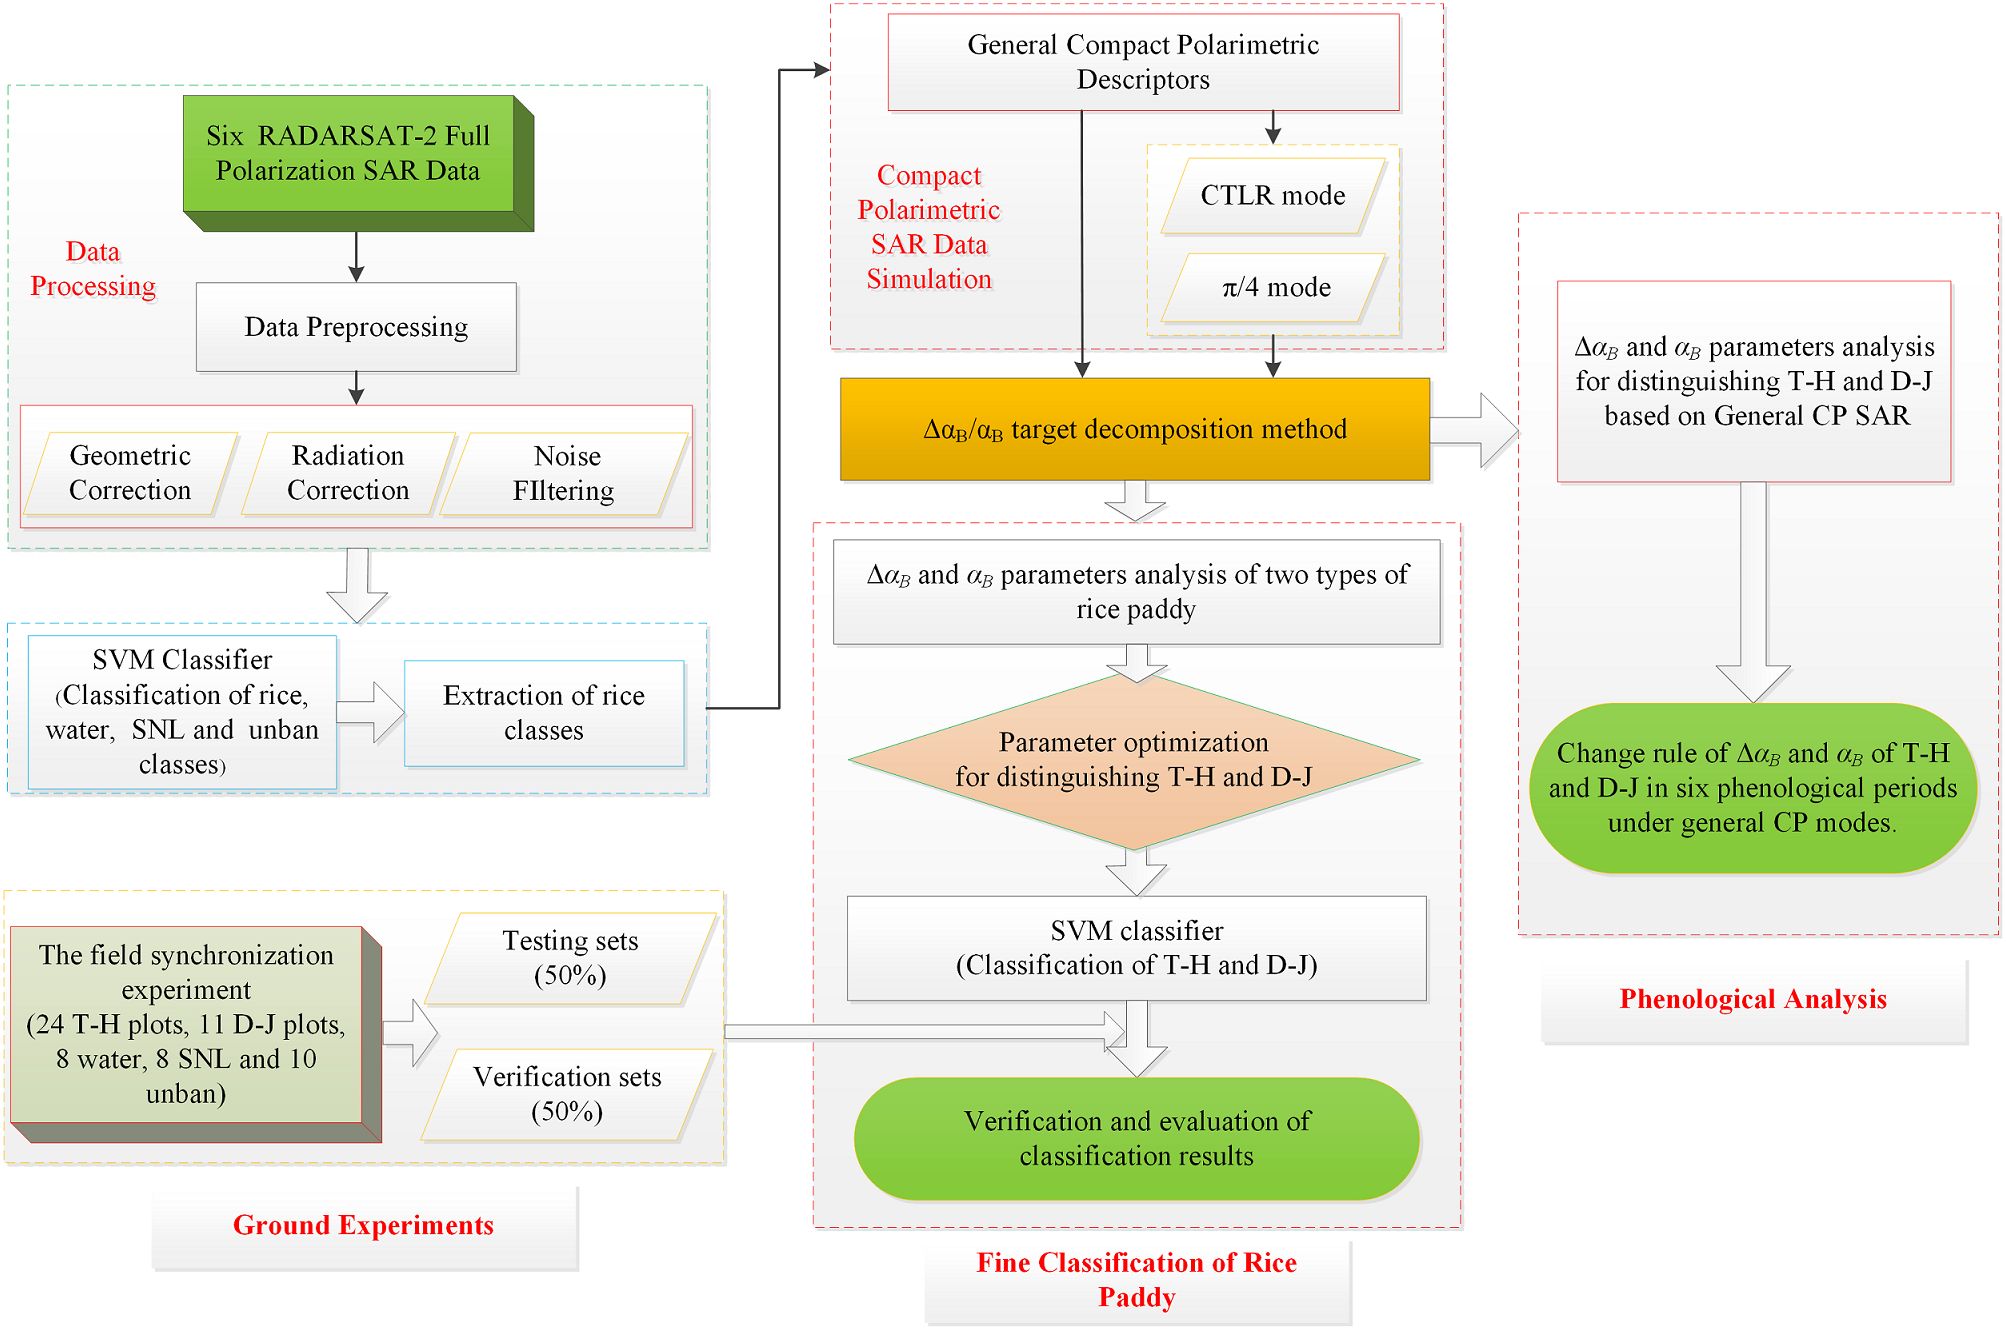
First, six temporal FP RADARSAT-2 data were preprocessed, including radiometric correction, geometric correction and filtering. Next, utilizing the SVM method with FP SAR data, the study area was classified into four classes: rice, water, SNL, and unban. At the same time, we used general compact polarimetric descriptors to simulate the FP SAR data in the rice area, thereby obtaining general CP SAR data. Since our study focuses on the two types of rice paddies, we masked the rice class using the classification results of the SVM method. Then, the ΔαB/αB target decomposition method was introduced to carry out polarimetric decomposition for six temporal FP SAR data and general CP SAR data. Afterwards, using ΔαB/αB target decomposition method on general CP SAR data, we performed fine classification and phenological analysis of rice paddies. For fine classification of rice paddy, ΔαB and αB parameters were analyzed for distinguishing of T-H and D-J based on FP SAR data, CP SAR data of π/4 and CTLR modes, and the SVM method was used to carry out a classification experiment based on the optimal ΔαB and αB parameters under the three kinds of SAR data (FP SAR, CP SAR of CTLR mode and π/4 mode). Finally, the classification results were verified and evaluated. Moreover, for phenological analysis, we analyzed the ΔαB and αB of general CP SAR, including four CP modes (circular mode, linear π/4 mode and two kinds of ellipse modes) across multiple phenological periods for both types of rice paddies. We then obtained the change rule of ΔαB and αB for two types of rice paddies throughout the phenological periods under multiple CP modes. Figure 3 shows the specific flow chart of the methodology.
Specifically, for preprocessing work (radiometric correction, geometric correction and filtering), the detailed parameters information of radiometric correction provided by the header file of FP SAR data are used for radiometric correction. Then the SAR image is speckle filtered using a 7×7 Lee filter. For all RADARSAT-2 FP SAR data, we extract the complex scattering matrix S based on PolSARpro software (version 6.0, https://step.esa.int/main/toolboxes/polsarpro-v6-0-biomass-edition-toolbox/). And, the preprocessing work is carried out in ENVI image processing software (version 5.3, https://www.cnblogs.com/enviidl/p/16275745.html) and PolSARpro v6.0. For SVM method, the algorithm parameters used in this study are introduced in detail in Section 3.3. Moreover, the general compact polarimetric SAR descriptors and ΔαB/αB target decomposition method are programmed in matlab software (version R2021b, https://ww2.mathworks.cn/en/products/matlab.html).
3.1 Polarimetric features
3.1.1 π/4 mode and CTLR mode
We simulated CP SAR data using FP SAR data based on π/4 mode and CTLR mode respectively. For π/4 mode, this mode transmits linear polarization waves in a 45°C direction, receiving horizontal and vertical polarization echo signals (Souyris et al., 2005; Souyris and Mingot, 2002; Wang et al., 2018). , scattering vector under π/4 mode, is expressed as
where, SHH, SHV and SVV are three elements of Sinclair matrix.
For CTLR mode, this mode transmits right circular polarization and receives horizontal and vertical polarization echo signals (Raney, 2006, Raney, 2007; Cloude et al., 2012; Wang et al., 2018). , scattering vector under CTLR mode, is expressed as
The Jones coherency matrix (C2) of CP SAR, that is, the second-order statistic of the scattering vector, can be expressed as follows:
where, is scattering vector of CP SAR.
For full polarimetric SAR, the radar transmits horizontal and vertical polarization waves, and receives horizontal and vertical polarization waves. In the single-station backscattering system, the three-dimensional target vector k is expressed as
The full polarization coherence matrix T can be expressed as
where, T* is element of coherence matrix T.
3.1.2 General compact polarimetric descriptors
The electromagnetic field is usually expressed in the form of a polarization ellipse, which contains two parameters, namely, the ellipticity angle χ and the orientation angle θ of the ellipse.
where, a and b are transmitting wave elements and . For the arbitrary transmitting wave , the received wave can be expressed as follows:
In the Equation 7, is the representation of H/V polarized basis , including , . T is matrix transpose. contains and contains . The backscattering characteristics of the target are mainly retained in the co-polarization ratio. When a≠0 and b≠0, the backscattering vector can be described
where E1 and E2 are normalized elements of to represent the characteristics of backscattering waves. From Equation 8, we can form two new CP vectors ( and )
The corresponding second-order statistic of the scattering vector, namely the covariance matrix C2 and coherence matrix T2 of the normalized vector, are used to describe the partially polarized scattered waves
where denotes the ensemble average. *T represents matrix conjugate transpose. The general CP SAR descriptor vector in Equation 8 (or the covariance C2 and coherence matrix C2 defined in Equations 11, 12) provides a unified method for scattering analysis of CP SAR data.
3.2 ΔαB/αB target decomposition method based on FP SAR and CP SAR
3.2.1 ΔαB/αB target decomposition method based on FP SAR
The ΔαB/αB target decomposition method is mainly based on the average physical scattering mechanism to solve the scattering inconsistency and dominant scattering mechanism. We defined a new parameter, which is rotation invariant (Yin et al., 2016).
where T11, T22, T33 are the main diagonal elements of an arbitrary backscattering coherence matrix T (see Equation 5). αB is a function of the co-polarized channel ratio and the co-polarized channel correlation. For the single look case, αB is only related to the co-polarized channel ratio. Thus, in order to measure the randomness inherent in the multi-look case, another parameter ΔαB is expressed as
where,
with,
where |ρr | and |ϕr |are the average copolarization amplitude ratio and the average copolarization phase difference, respectively. ϕVV and ϕHHare the phases of VV and HH polarization, respectively. αB is used to describe the physical scattering mechanism, and ΔαB describes the scattering randomness.
3.2.2 ΔαB/αB target decomposition method based on CP SAR
For the CP SAR data, from the T2 matrix, the parameter αBCP was defined as (Yin et al., 2019)
where, , is used to describe the average scattering mechanism. E1, and E2 are the formalized elements of to characterize the backscattered wave. For the general compact polarization, and (see Equation 8).
In deterministic scattering without rotation, the cross-polarization quantity SHV is typically smaller than the co-polarization quantity. In surface scattering region, such as the water surface, αBCP is close to 0°. In regions dominated by double-bounce scattering, αBCP approaches 90°while in areas characterized by volume scattering, αBCP around 45°.
Since αBCP can be expanded further,
where, functions of channel ratio ρcp, channel correlation coefficient rcp, and phase difference ϕcp was defined as
|rcp| is the main index to describe the random backscattering process. When the |rcp| is close to 1, it indicates that a coherent scattering and αBCP is determined by channel ratio ρCP. When the |rcp| is close to 0, it indicates that backscattering comes from randomly distributed scattering objects. Meanwhile, αBCP is close to 45°.
Besides, similar to ΔαB, a physical parameter is defined to describe the scattering incoherence of the target. ΔαBCP is expressed as
where,
is used to describe the average scattering mechanism. α0CP can be regarded as an ideal scattering mechanism determined only by the average polarization ratio. And ρCP is channel ratio.
In general, ΔαB and ΔαBCP can describe the scattering randomness of the target, with their symbols determined by the phase difference in the co-polarization channel. If in a resolution cell, all scattering objects have the same scattering mechanism and the orientation angle is consistent with the dielectric constant, the co-polarization correlation coefficient rcp and rc is high, resulting in ΔαB and ΔαBCP close to 0°. For the double-bounce scattering process, because their physical models are mainly described by the characteristics of phase difference (±π) of the co-polarization channel, the values of ΔαB and ΔαBCP should be less than 0°. In contrast, for single scattering and volume scattering, because their physical models are mainly described by the characteristics of phase difference (±π/2) of the co-polarization channel, the values of ΔαB and ΔαBCP should be greater than 0.
3.3 SVM classification method
The SVM is a powerful machine learning algorithm used for various applications, including classification analysis, regression analysis, and pattern recognition (Suykens and Vandewalle, 1999; Huang et al., 2012). The idea of the SVM classification method is to enable the optimal hyperplane to have the maximum classification interval. For this study, we used the Radial Basis Function (RBF) kernel in the SVM classifier. Meanwhile, the parameter of RBF kernel function (Gamma) controls the influence distance of a single training point. A small Gamma results in a smaller influence, while a large Gamma increases the influence range. In our experiments, we set the Gamma parameter as the reciprocal of the input parameter. Besides, the penalty parameter (C) is the penalty parameter, the tolerance for error. The higher C is, the less error is tolerated and the easier it is to overfit. The smaller C is, the less fit it is. If C is too large or too small, the generalization ability becomes worse. In the experiment, C is set to 100. It should be noted that the spatial resolution of the original image is used for classification, and the classification probability threshold is 0.
4 Experiment and discussion
First, we used FP SAR data to divide the study into 4 classes based on SVM classification method, namely rice, water, urban and SNL classes. We then focused exclusively on the rice regions for further analysis. Next, we utilized FP SAR, as well as CP SAR in π/4 and CTLR modes, and general CP SAR data to extract the six temporal ΔαB and αB parameters of rice paddy using ΔαB and αB method.
The experiment is conducted on a computer equipped with an Intel Core i7-9750H processor (6 cores, 2.60 GHz), 16 GB of DDR4 RAM, an NVIDIA Quadro GPU, and running Windows 10. The image pixel size in this study is 2000 × 2000, and the area covered by the study region is approximately 1200 square kilometers. Based on the proposed method, we obtained experimental results and recorded the algorithm’s running time (approximately 38 minutes and 16 seconds). Therefore, under this research scenario (pixel size: 2000 × 2000), the computational efficiency for rice classification and phenological analysis is acceptable. In addition, the present parallel computing method can also improve the computational efficiency of the proposed method to a certain extent.
4.1 ΔαB and αB parameters analysis of two types of rice paddies based on FP SAR data, CP SAR data of π/4 and CTLR modes
According to CP SAR theory in Sections 3.1.1 and 3.1.2, CP SAR data of π/4 and CTLR modes are two typical and widely applied CP mode. Therefore, we first carried out ΔαB and αB parameters analysis of two types of rice paddies based on FP SAR data, CP SAR data of π/4 and CTLR modes. Figure 4 shows ΔαB and αB parameters of rice region based on FP SAR data, CP SAR data of π/4 and CTLR modes on June 12. As noted in Section 3.2, the αB range spans from 0° to 90°, indicating regions predominantly influenced by surface scattering, volume scattering and double-bounce scattering respectively. Figures 4A–C show that there are essentially two states of αB in the rice region: one greater than 45° and the other less than 45°. On June 12, the two types of rice were basically in the seedling stage, and the paddy in the seedling stage showed more information about the underlying surface of the paddy on the SAR image. Besides, the underlying surface of T-H is water surface, which is prone to surface scattering. In contrast, the underlying surface of D-J is moist soil. Therefore, it is obvious that the surface scattering component of D-J is smaller than that of T-H. Furthermore, most regions with high αB values are D-J paddy, while the region with low αB values area T-H paddy. In addition, there is one situation. Since T-H has a shorter growth period than D-J, it is possible that some farmers have not completed transplanting in this period, leading to the bare land in this area. Consequently, in addition to D-J paddy, some areas with high αB values might be T-H paddy where transplanting was not yet completed.
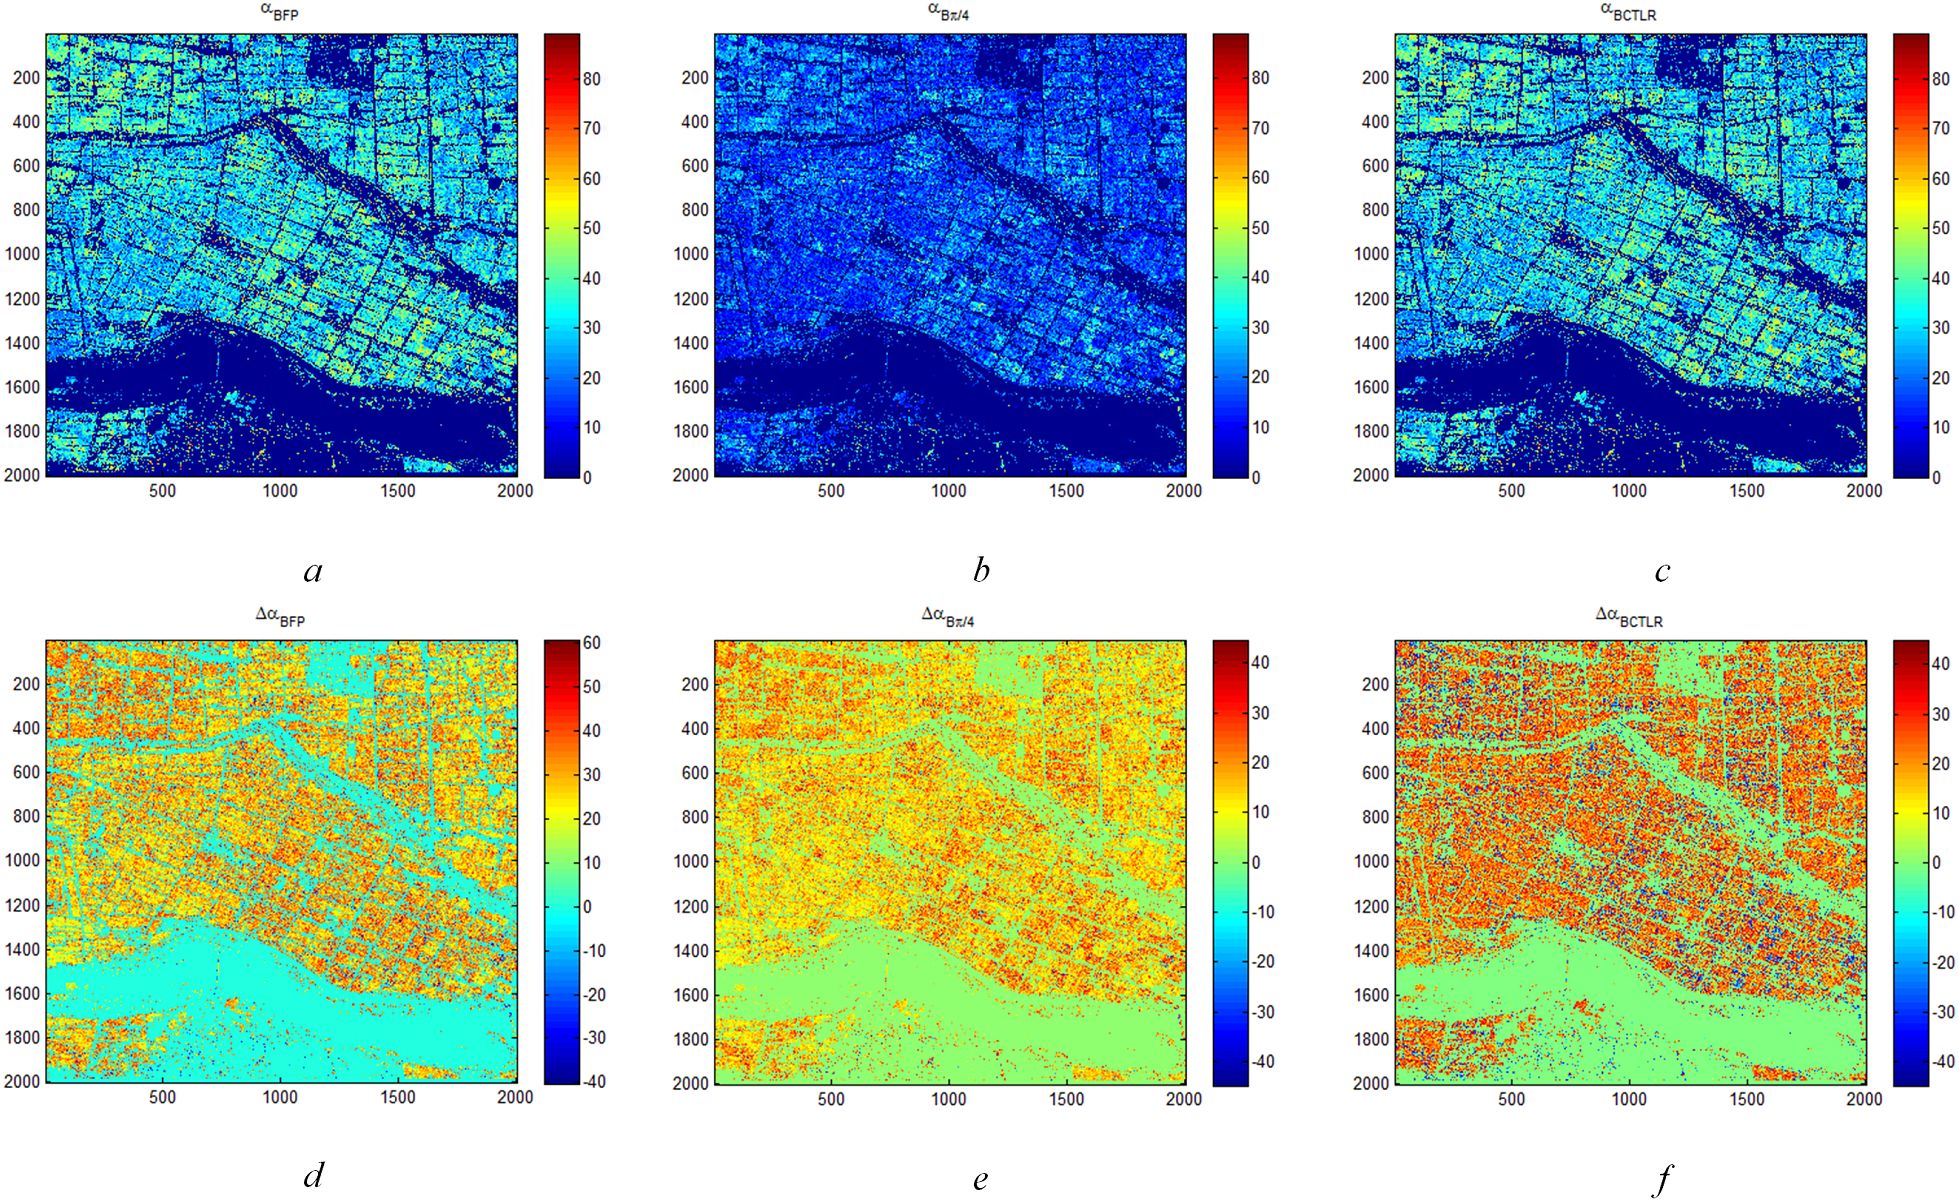
Figure 4. ΔαB and αB parameters of rice region based on FP SAR data, CP SAR data of π/4 mode and CTLR mode on June 12 (A) is αB and (D) is ΔαB based on FP SAR data; (B) is αB and (E) is ΔαB based on CP SAR data of π/4 mode; (C) is αB and (F) is ΔαB based on CP SAR data of CTLR mode).
For ΔαB parameter, when ΔαB is greater than 0, it shows more surface scattering and volume scattering of ground objects. Conversely, when ΔαB is less than 0, it shows more double-bounce scattering. Furthermore, as shown in Figures 4D–F, ΔαB in the rice region is basically less than 0. In some areas, the ΔαB based on CP SAR data of CTLR mode exceeds 0, indicating predominant double-bounce scattering. These regions are more likely to be D-J.
With the growth of rice plants, the underlying surface information is covered, which results in representing more vegetation information in radar images. on June 12 and August 23, the ΔαB and αB are relatively uniform in the rice region. Therefore, ΔαB and αB parameters based on FP, CP of CTLR and CP of π/4 SAR data respectively, could not distinguish between T-H and D-J in these two periods.
Figure 5 shows ΔαB and αB parameters of rice region based on FP SAR data, CP SAR data of π/4 mode and CTLR mode on September 16. On September 16, the phenology stage of rice is Heading–Flowering stage (Table 1). Therefore, the information of ear of rice is presented in this period. Due to the short period of T-H, the ear of rice of T-H grow earlier and are thicker than that of D-J, which makes the surface scattering of T-H larger than that of D-J. Additionally, D-J is larger than T-H in αB parameter. Comparing Figures 5A–C, we can find that in distinguishing the two types of rice paddies, CP SAR data of π/4 mode data is better than CP SAR data of CTLR mode data and FP SAR data in this period. For ΔαB parameters (Figures 5D–F), it’s almost impossible to see the difference between the two types of rice paddies. On October 10, the phenology stage of rice is Dough–Mature stage (Table 1). In this period, the rice ears of both T-H and D-J had mostly developed and begun to mature, leading to similar radar signatures for the rice panicles. Therefore, surface scattering, volume scattering and double-bounce scattering are similar.
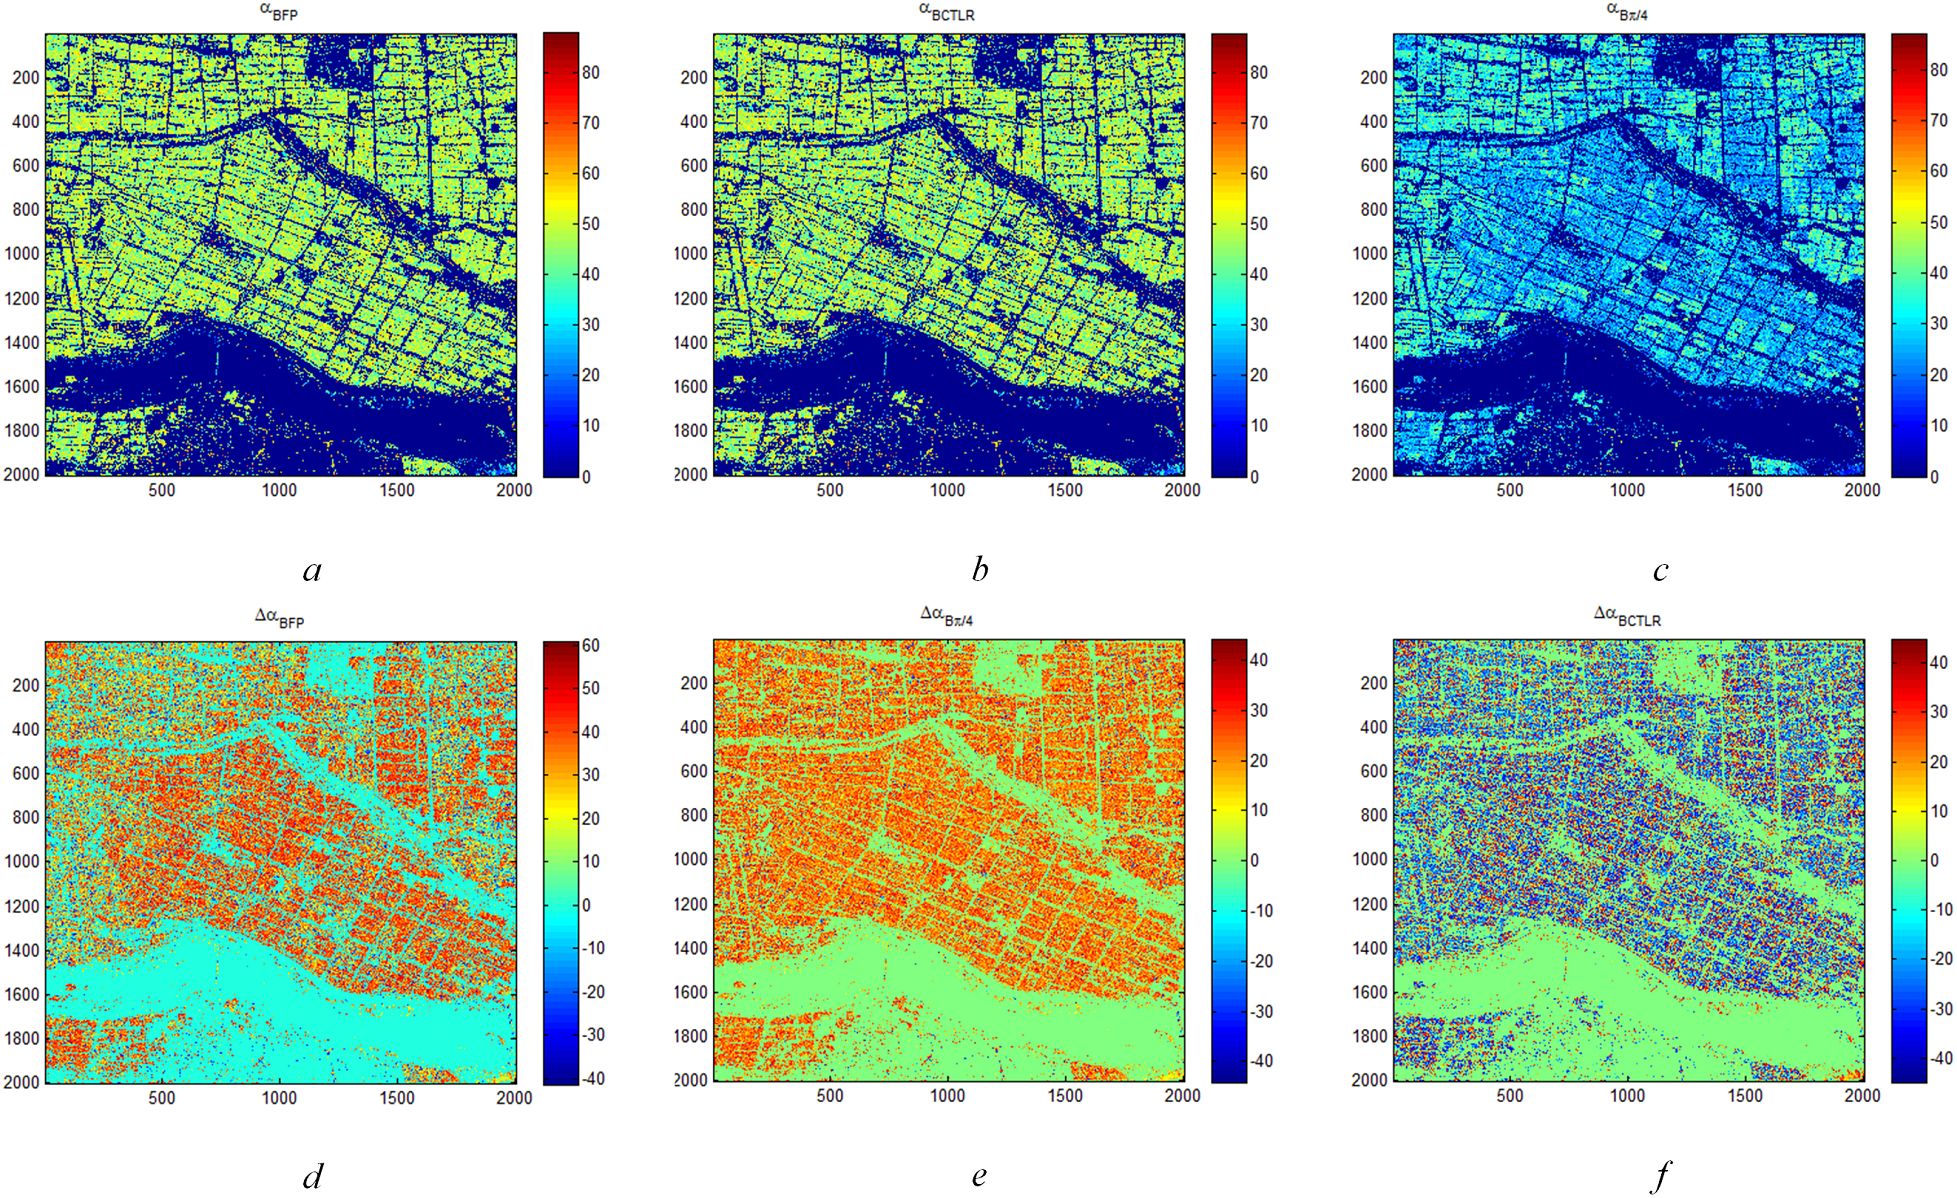
Figure 5. ΔαB and αB parameters of rice region based on FP SAR data, CP SAR data of π/4 mode and CTLR mode on September 16 (A) is αB and (D) is ΔαB based on FP SAR data; (B) is αB and (E) is ΔαB based on CP SAR data of π/4 mode; (C) is αB and (F) is ΔαB based on CP SAR data of CTLR mode).
Figure 6 shows ΔαB and αB parameters of rice region based on FP SAR data, CP SAR data of π/4 mode and CP SAR data of CTLR mode on November 3. On November 3, the phenology stage of rice is Harvest stage (Table 1). Since the growth cycle of T-H is shorter than that of D-J, most of T-H had been harvested during this period. Therefore, the underlying soil of T-H is exposed naked, which shows soil characteristics in radar images. However, D-J has a long growth cycle. In this period, rice is in the mature stage and has not been harvested. Thus, the radar images capture the characteristics of the rice plants. Therefore, ΔαB and αB images show obvious differences between the two types of rice paddies. As shown in Figures 6A–C, that the values of αB of D-J are larger than those of T-H. Similarly, for Figures 6D–F, the values of ΔαB of D-J are also significantly different from those of T-H. However, the ΔαB and αB images show that αB is more stable than ΔαB.
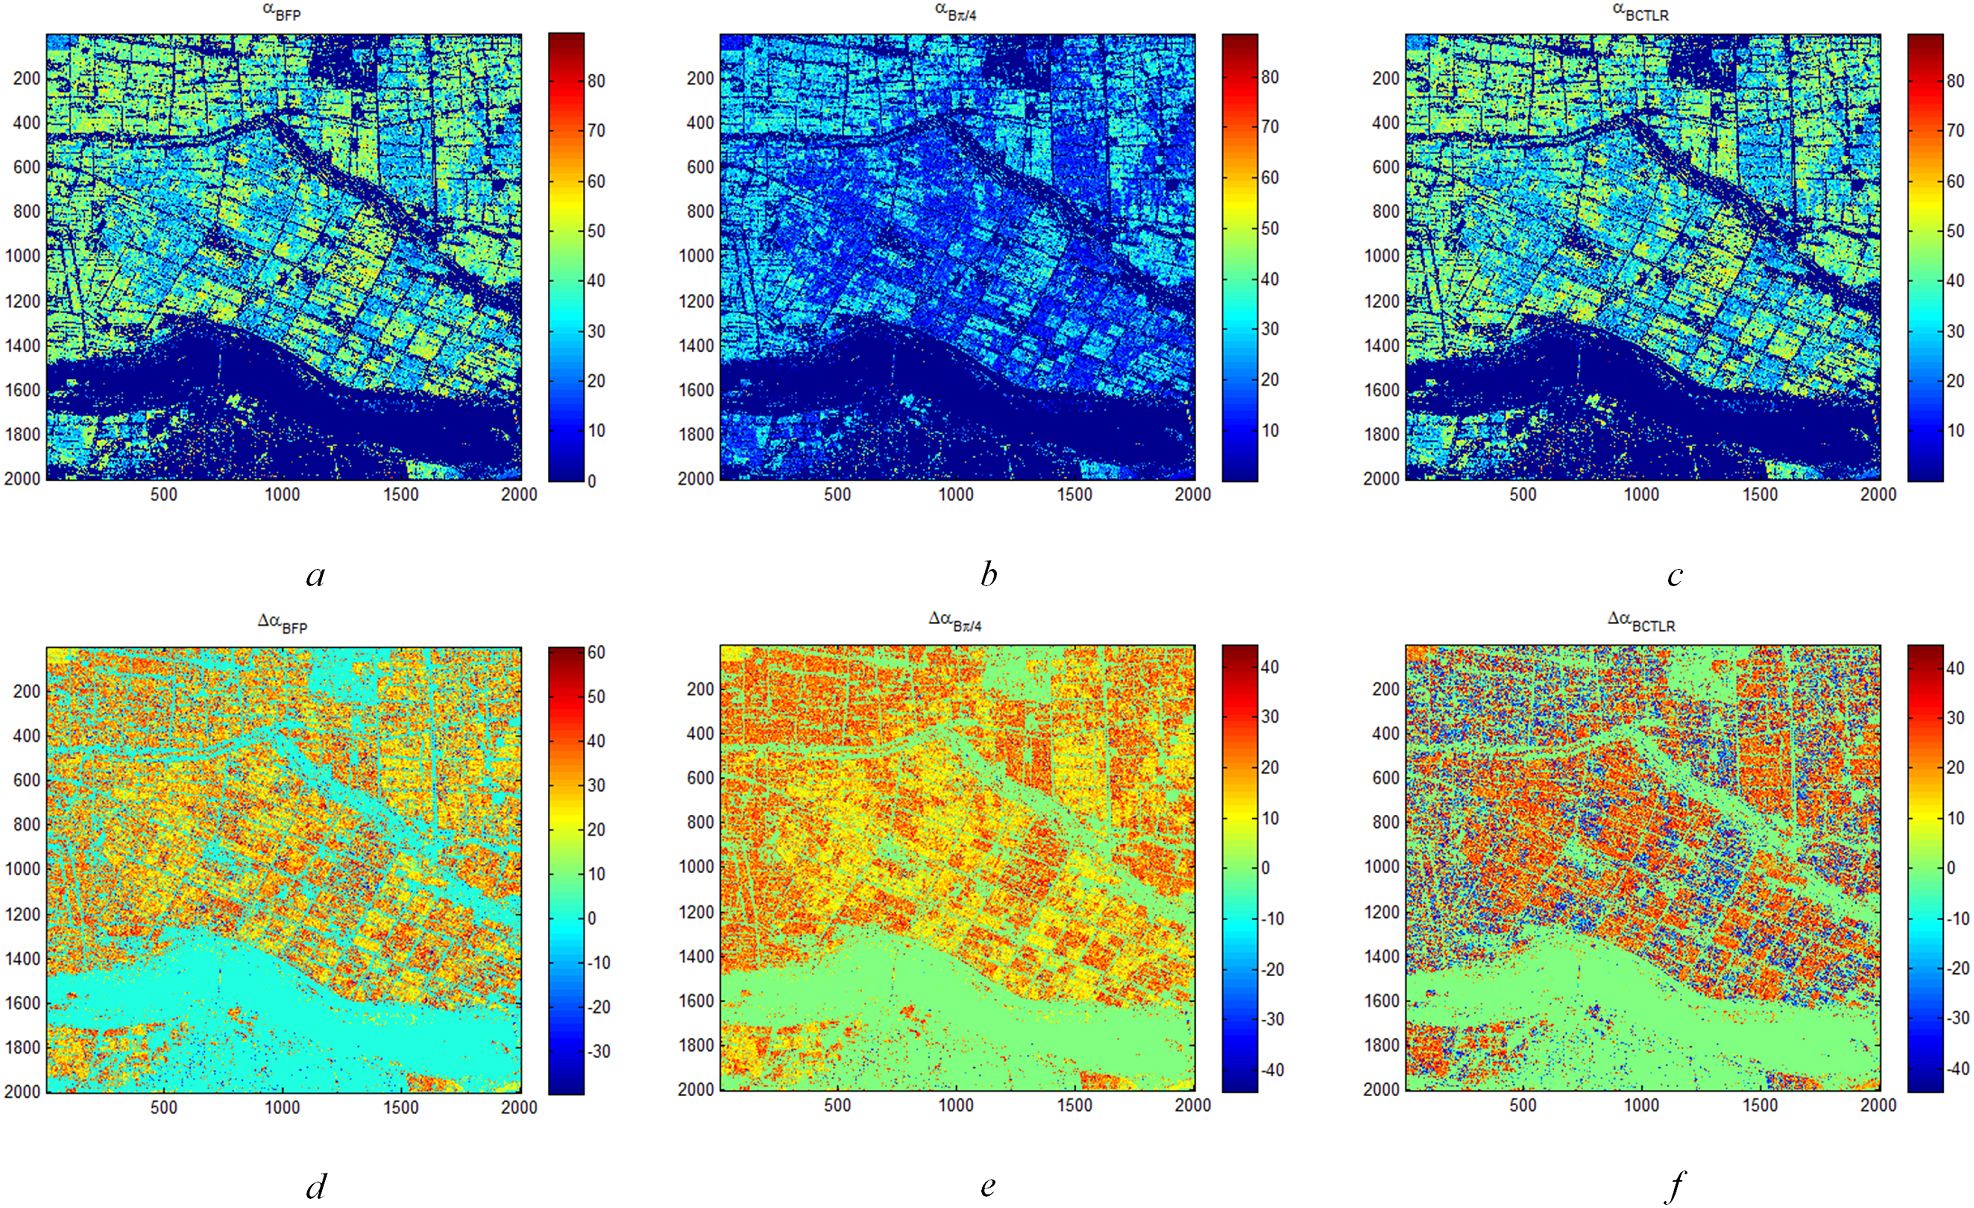
Figure 6. ΔαB and αB parameters of rice region based on FP SAR data, CP SAR data of π/4 mode and CTLR mode on November 3 (A) is αB and (D) is ΔαB based on FP SAR data; (B) is αB and (E) is ΔαB based on CP SAR data of π/4 mode; (C) is αB and (F) is ΔαB based on CP SAR data of CTLR mode).
In order to analyze the discrimination ability of six temporal ΔαB and αB parameters based on FP SAR data, CP SAR data of π/4 mode and CTLR mode to distinguish between the two types of rice paddies in detail, we extract the ΔαB and αB parameter values of T-H and D-J training areas, and draw the scatter diagram. Figure 7 shows αB and αB parameters scatter diagram of T-H and D-J based on FP SAR data, CP SAR data of π/4 mode and CP SAR data of CTLR mode on June 12, July 30, August 23, September 16, October 10 and November 3. As can be seen from Figures 7A–C on June 12, July 30 and August 23, three kinds of SAR data based on ΔαB and αB methods cannot effectively distinguish D-J and T-H. And the ΔαB and αB of D-J and T-H are confused on the scatter diagram.
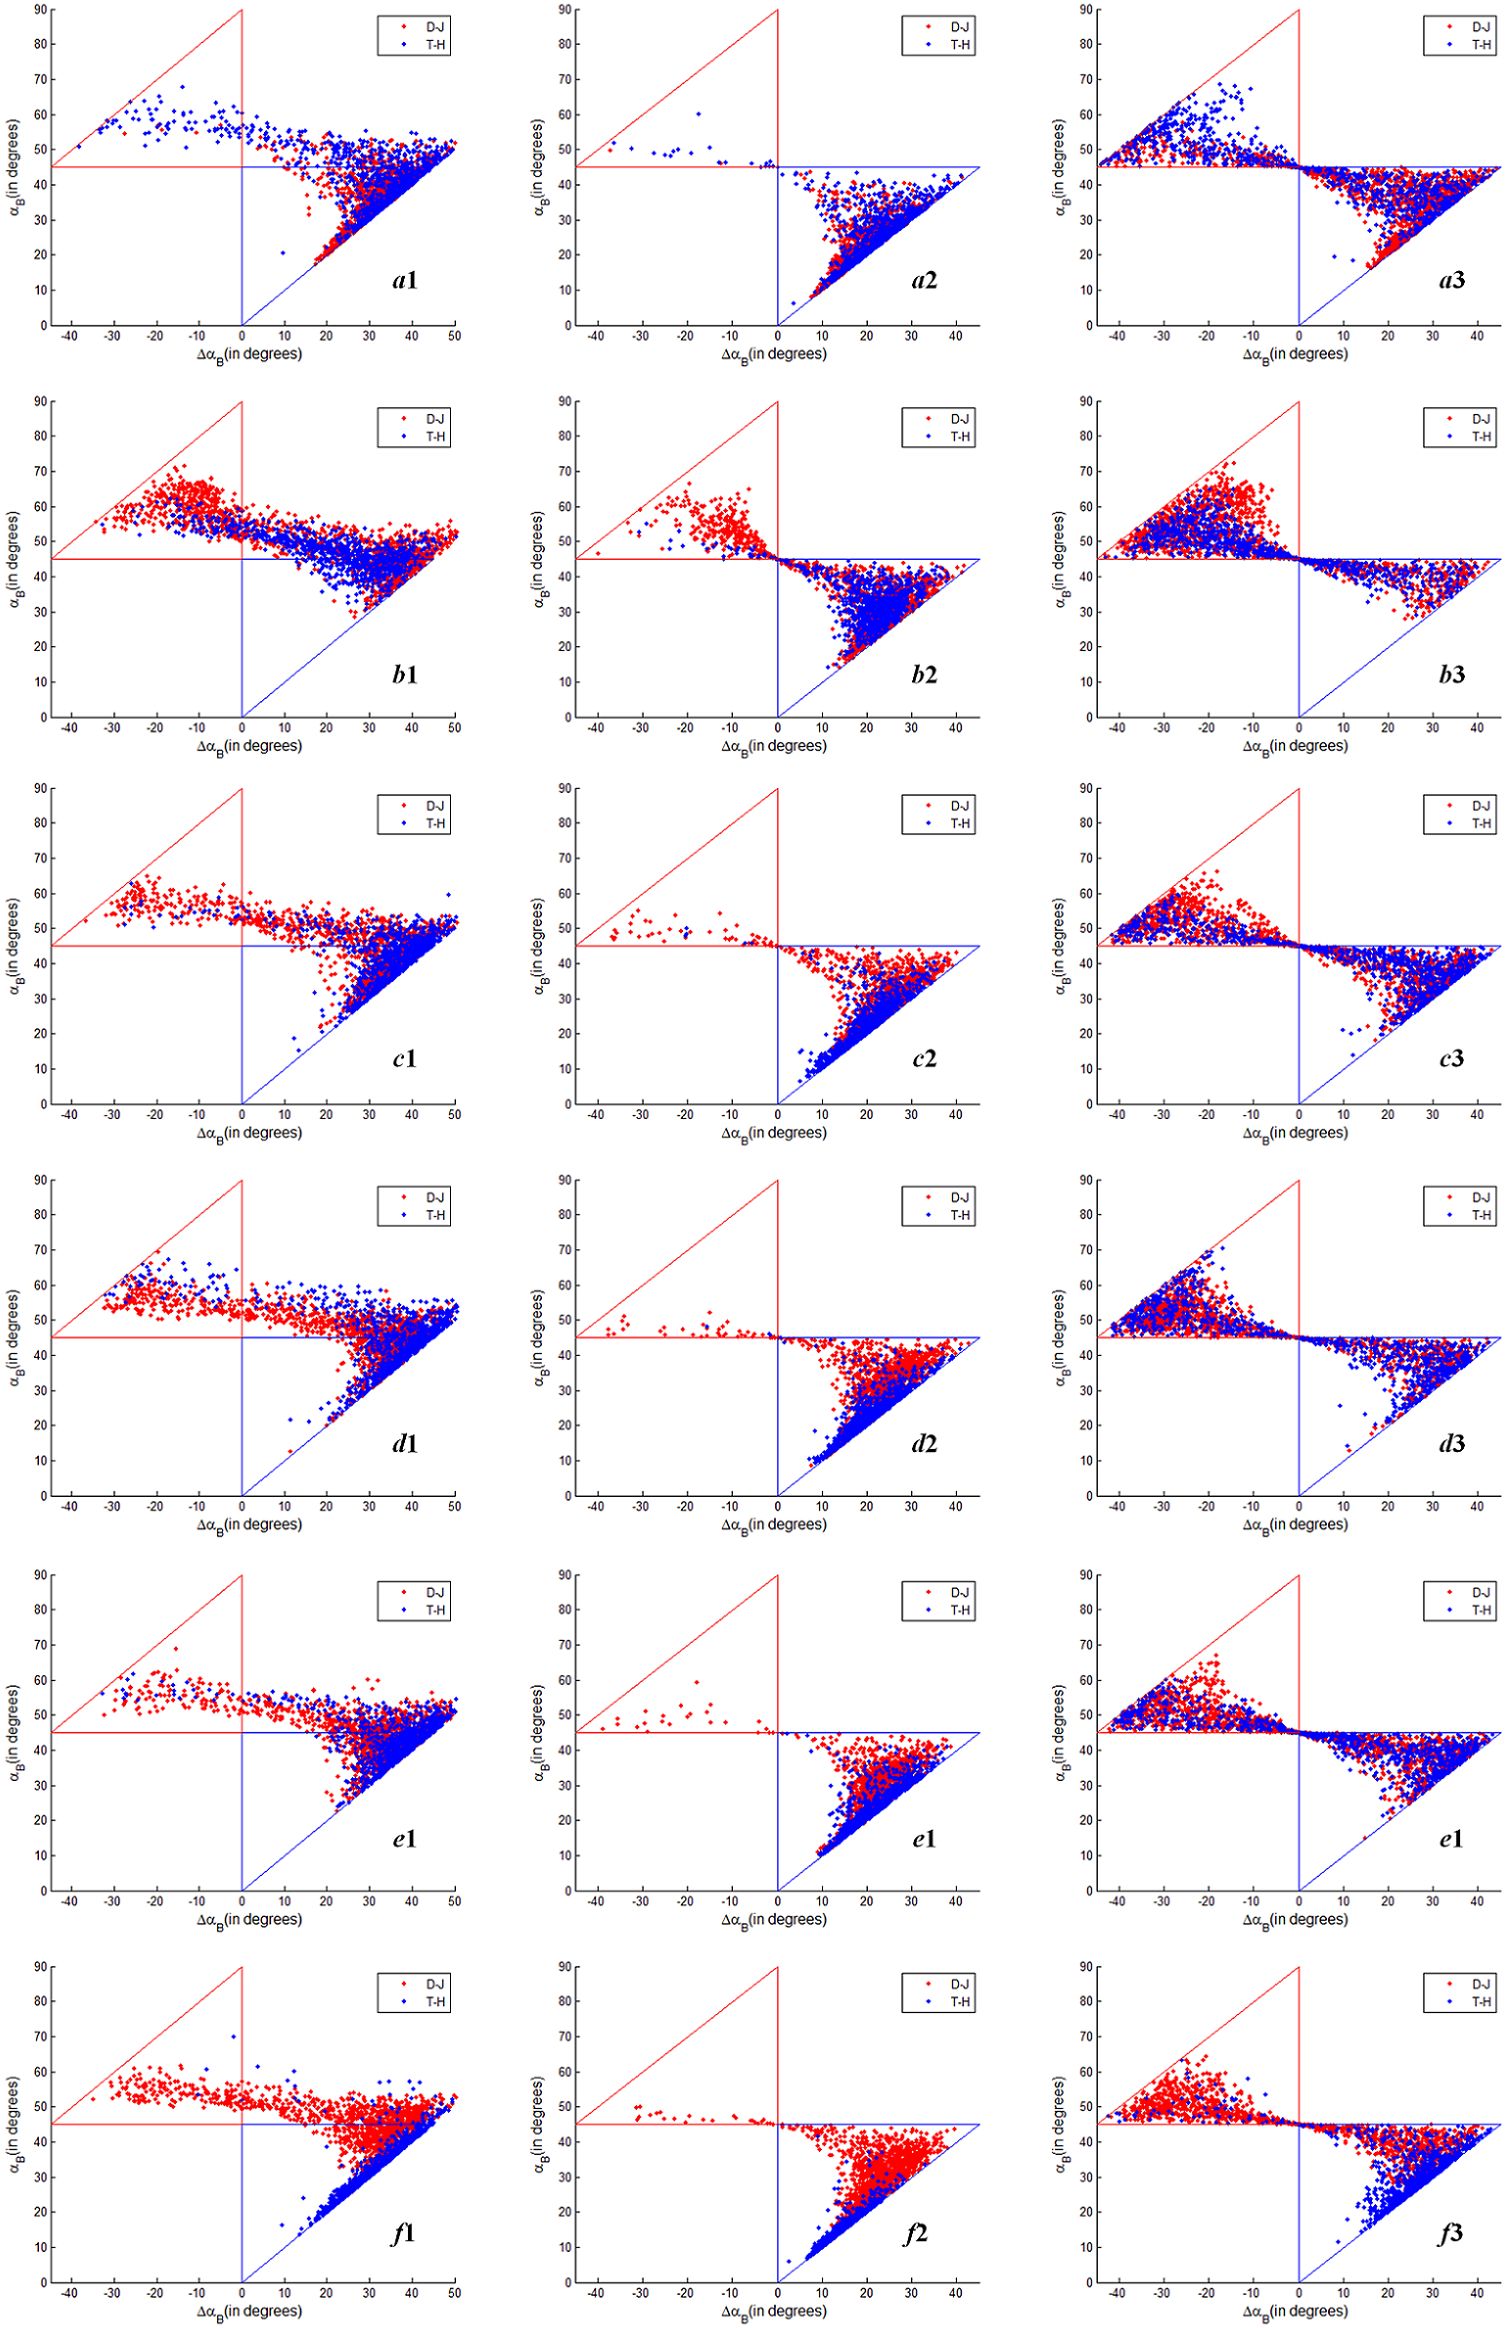
Figure 7. ΔαB and αB parameters scatter diagram of T-H and D-J based on FP SAR data, CP SAR data of π/4 mode and CTLR mode (The x-coordinate is ΔαB and the y-coordinate is αB; a1, b1, c1, d1, e1 and f1 are αB and ΔαB scatter diagram of T-H and D-J based on FP SAR data on June 12, July 30, August 23, September 16, October 10 and November 3 respectively; a2, b2, c2, d2, e2 and f2 are αB and ΔαB scatter diagram of T-H and D-J based on CP SAR data of π/4 mode on June 12, July 30, August 23, September 16, October 10 and November 3 respectively; a3, b3, c3, d3, e3 and f3 are αB and ΔαB scatter diagram of T-H and D-J based on CP SAR data of CTLR mode on June 12, July 30, August 23, September 16, October 10 and November 3 respectively.).
Figures 7D, E show ΔαB and αB parameters scatter diagrams of T-H and D-J based on FP SAR data, CP SAR data of π/4 mode and CTLR mode on September 16 and October 10. Compared with Figure 7 d1, d2 and d3, we can find that ΔαB and αB of Figure 7 d2 are better than Figure 7 d1 and d3 in distinguishing the two types of rice paddy. That is to say, on September 16 (Heading–Flowering stage), CP SAR data of π/4 mode was better than FP SAR data and CP SAR data of CTLR mode in distinguishing the two types of rice paddies. However, on October 10 (Dough–Mature stage), the rice ear of T-H and D-J have basically grown well, and their scattering characteristics are similar. As shown in Figure 7 e1, e2 and e3, ΔαB and αB of two types of rice paddies in this period are not as different as those of September 16. Figure 7 f shows ΔαB and αB parameters scatter diagram of T-H and D-J based on FP SAR data, CP SAR data of π/4 mode and CTLR mode on November 3. As shown in Figure 7 f1, f2 and f3, ΔαB and αB of the two types of rice paddies are significantly different. And in the ordinate (αB), αB based on CP SAR data of π/4 mode is better than FP SAR data and CP SAR data of CTLR mode. As shown in Figure 7 f2, the αB value of T-H is between 5° and 25°, and the αB value of D-J is between 25° and 50°. The two types of rice paddies can be well distinguished by this parameter. For αB based on FP SAR data and CP SAR data of CTLR mode, although αB value of most D-J is larger than T-H, there is confusion. Regarding ΔαB, the values based on FP SAR data and CP SAR data of CTLR mode range from -40° to 50°, which is a broader range than that observed for ΔαB based on CP SAR data of π/4 mode. In terms of the discrimination effect, the ability of αB based on FP SAR data and CP SAR data of CTLR mode to distinguish between the two types of rice paddies is superior to that of CP SAR data of π/4 mode.
Overall, ΔαB and αB showed the best performance in distinguishing between the two types of paddies on November 3, which is closely related to the differences of scattering characteristics between the two types of paddies during this phenological stage. The second-best performance was observed with αB based on CP SAR data of π/4 mode on September 16, which reflects the differences of rice ear between the two types of paddies. However, ΔαB and αB based on FP SAR data and CP SAR data of CTLR mode showed no difference between the two types of rice paddies on September 16. For the ΔαB and αB parameters in other periods, the distinction between the two types of rice paddies is not obvious.
4.2 ΔαB and αB parameters analysis of two types of rice paddies based on general CP SAR
In section 4.1, we conducted a differential analysis of ΔαB and αB parameters of two types of rice paddies based on FP SAR data, CP SAR data of π/4 mode and CTLR mode in six phenological periods. To explore CP SAR differences of two types of rice paddies under arbitrary transmit wave, we calculated six temporal ΔαB and αB parameters of two types of rice paddies based on general CP SAR data (Section 3.1.2). Based on the theory of general CP descriptors in Section 3.1.2, for a fixed scattering matrix S, the widely accepted CP signal depends entirely on θ and χ (or a and b). For the two parameters, χ ranged from -π/4 to π/4, and θ ranged from -π/2 to π/2. For linear π/4, left circular, right circular, the horizontal and vertical polarization transmit wave, the values of correspond to , , , and respectively. Circular polarization is not affected by wave orientation angle, so .
Therefore, we set one variable of θ and χ (or a and b) unchanged and change the other variable to extract six temporal ΔαB and αB parameters of two types of rice paddies, so as to explore the difference of two types of rice paddies under arbitrary transmitting mode of CP. Figure 8 shows the curves of αB and ΔαB parameters of T-H and D-J for varying transmitting polarizations (a fixed θ=π/4 and variable ) respectively. And, Figure 9 show the curves of αB and ΔαB parameters of T-H and D-J for varying transmitting polarizations (a fixed χ=0 and variable ) respectively.
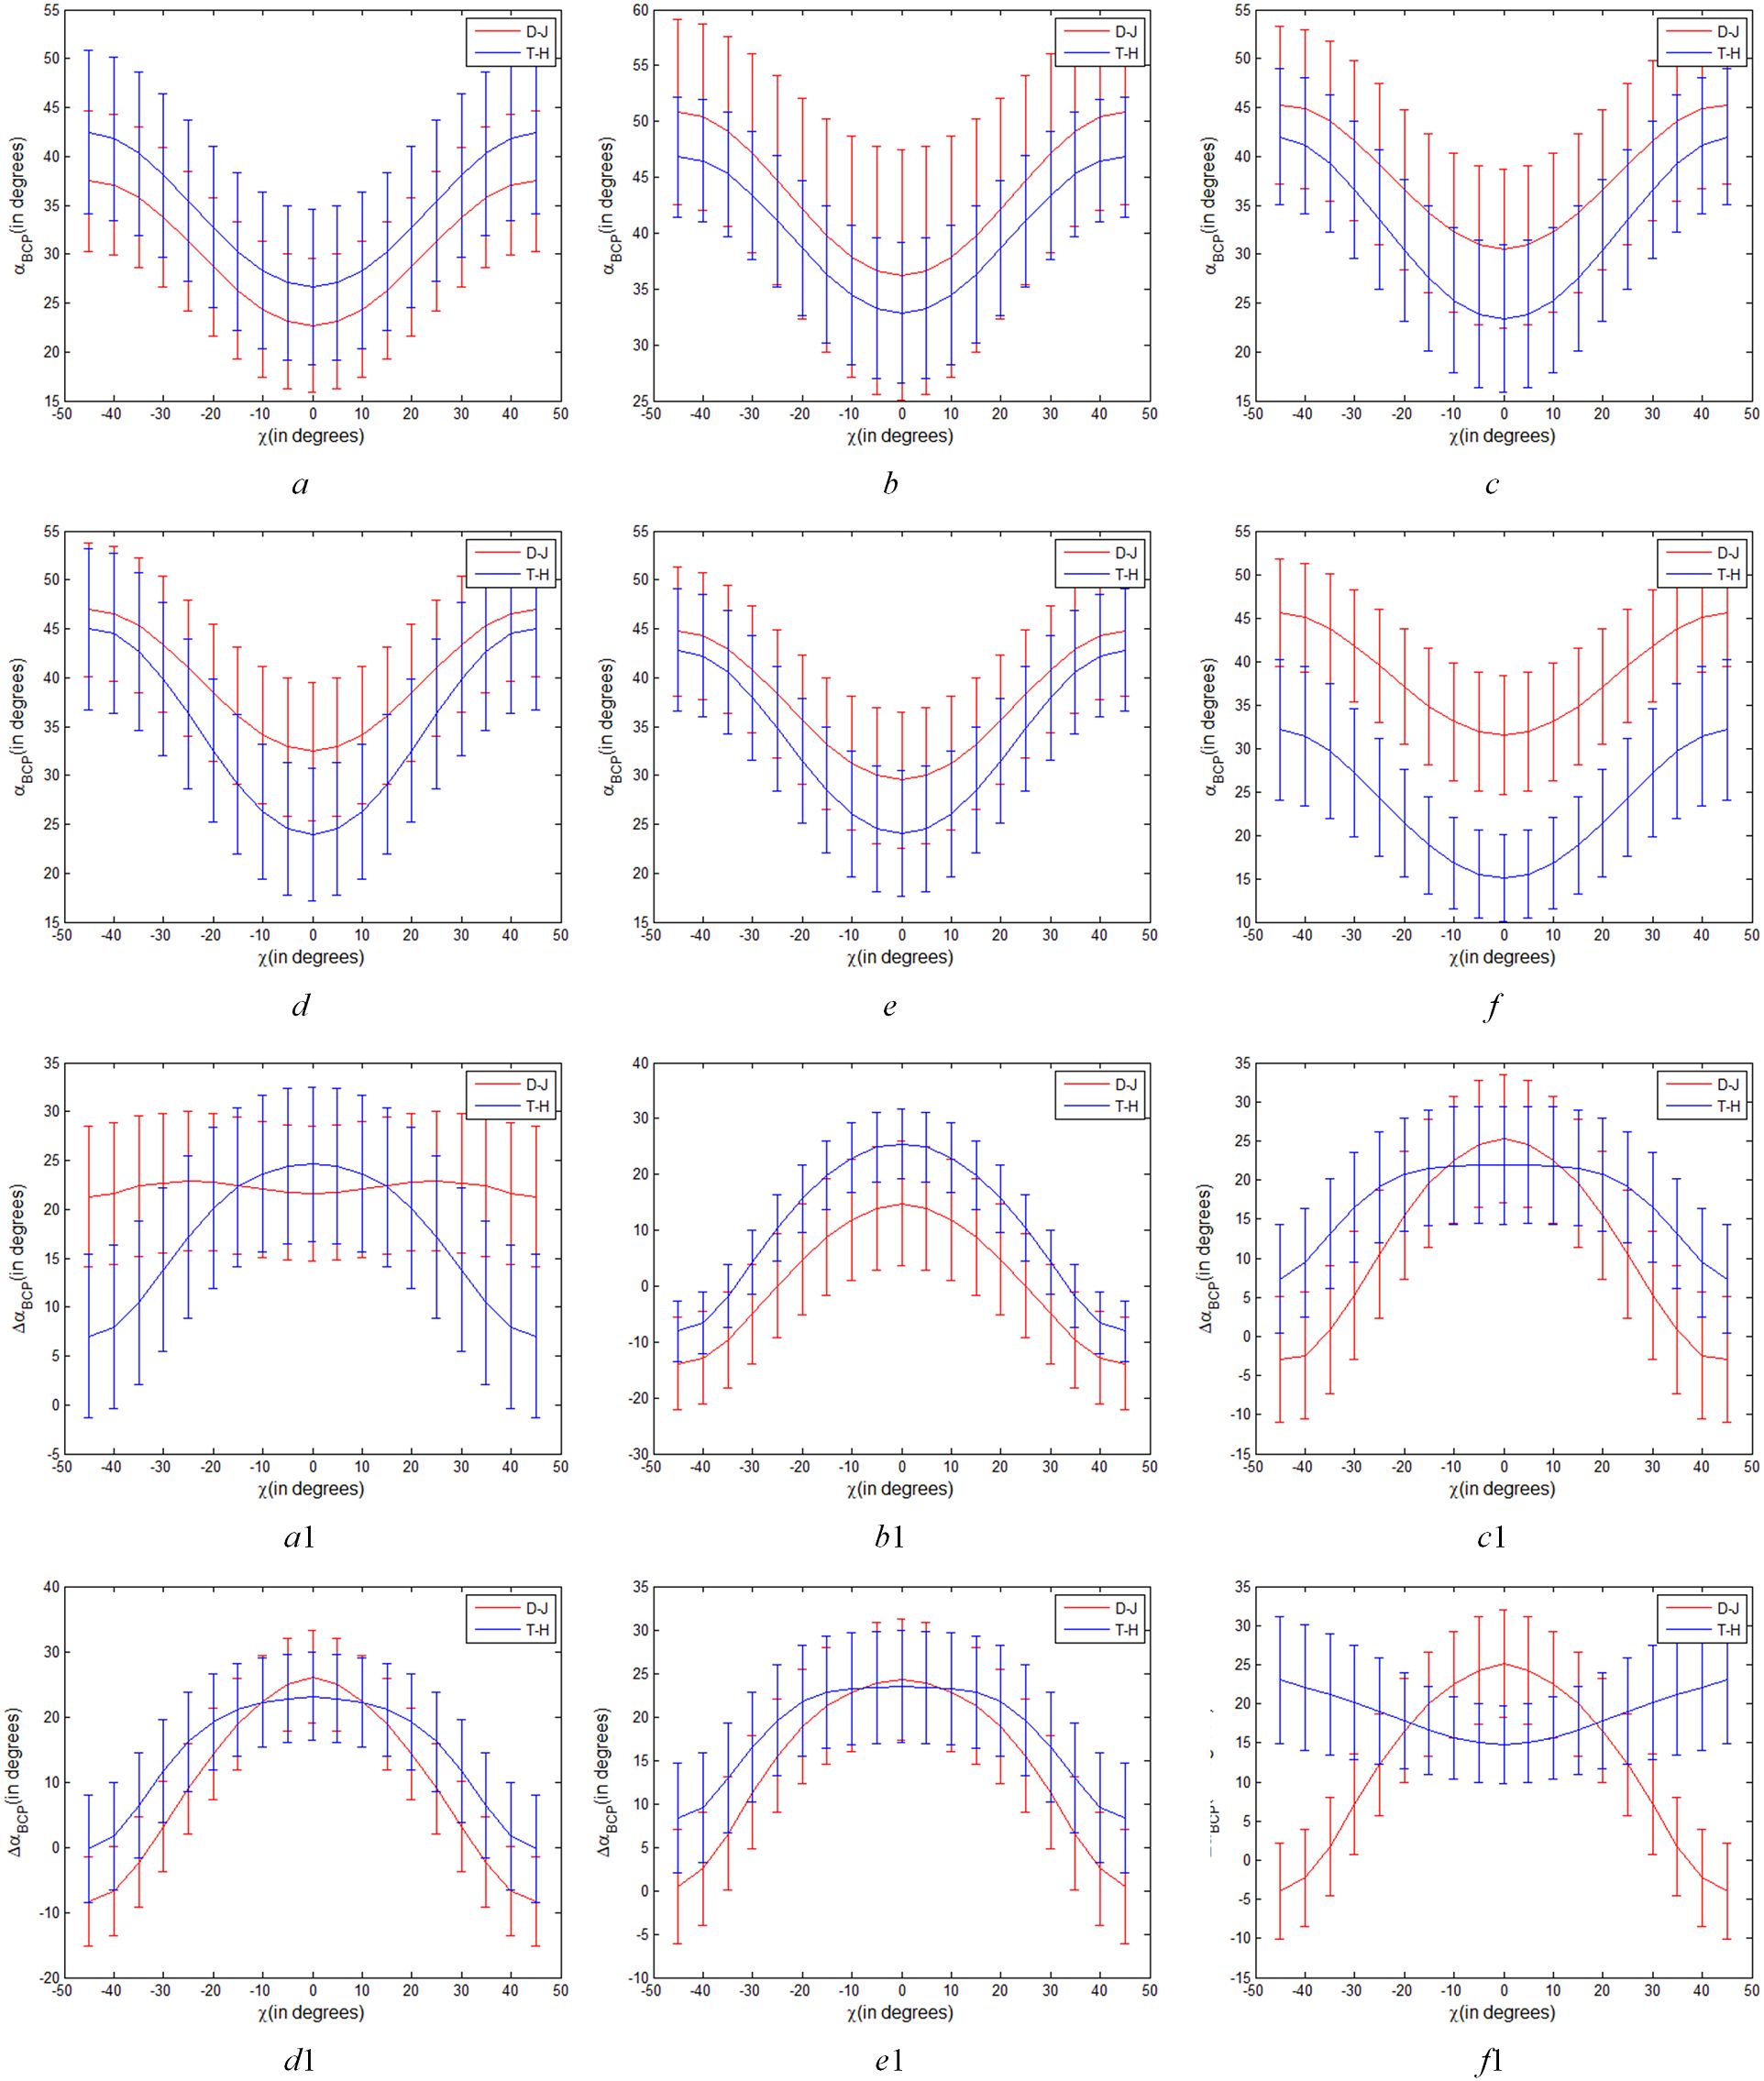
Figure 8. Variations of αB and ΔαB parameters of T-H and D-J for varying transmitting polarizations (a fixed θ=π/4 and variable ), (A–F) are variations of αB parameter on June 12, July 30, August 23, September 16, October 10 and November 3 respectively. a1-f1 are variations of ΔαB parameter on June 12, July 30, August 23, September 16, October 10 and November 3 respectively).
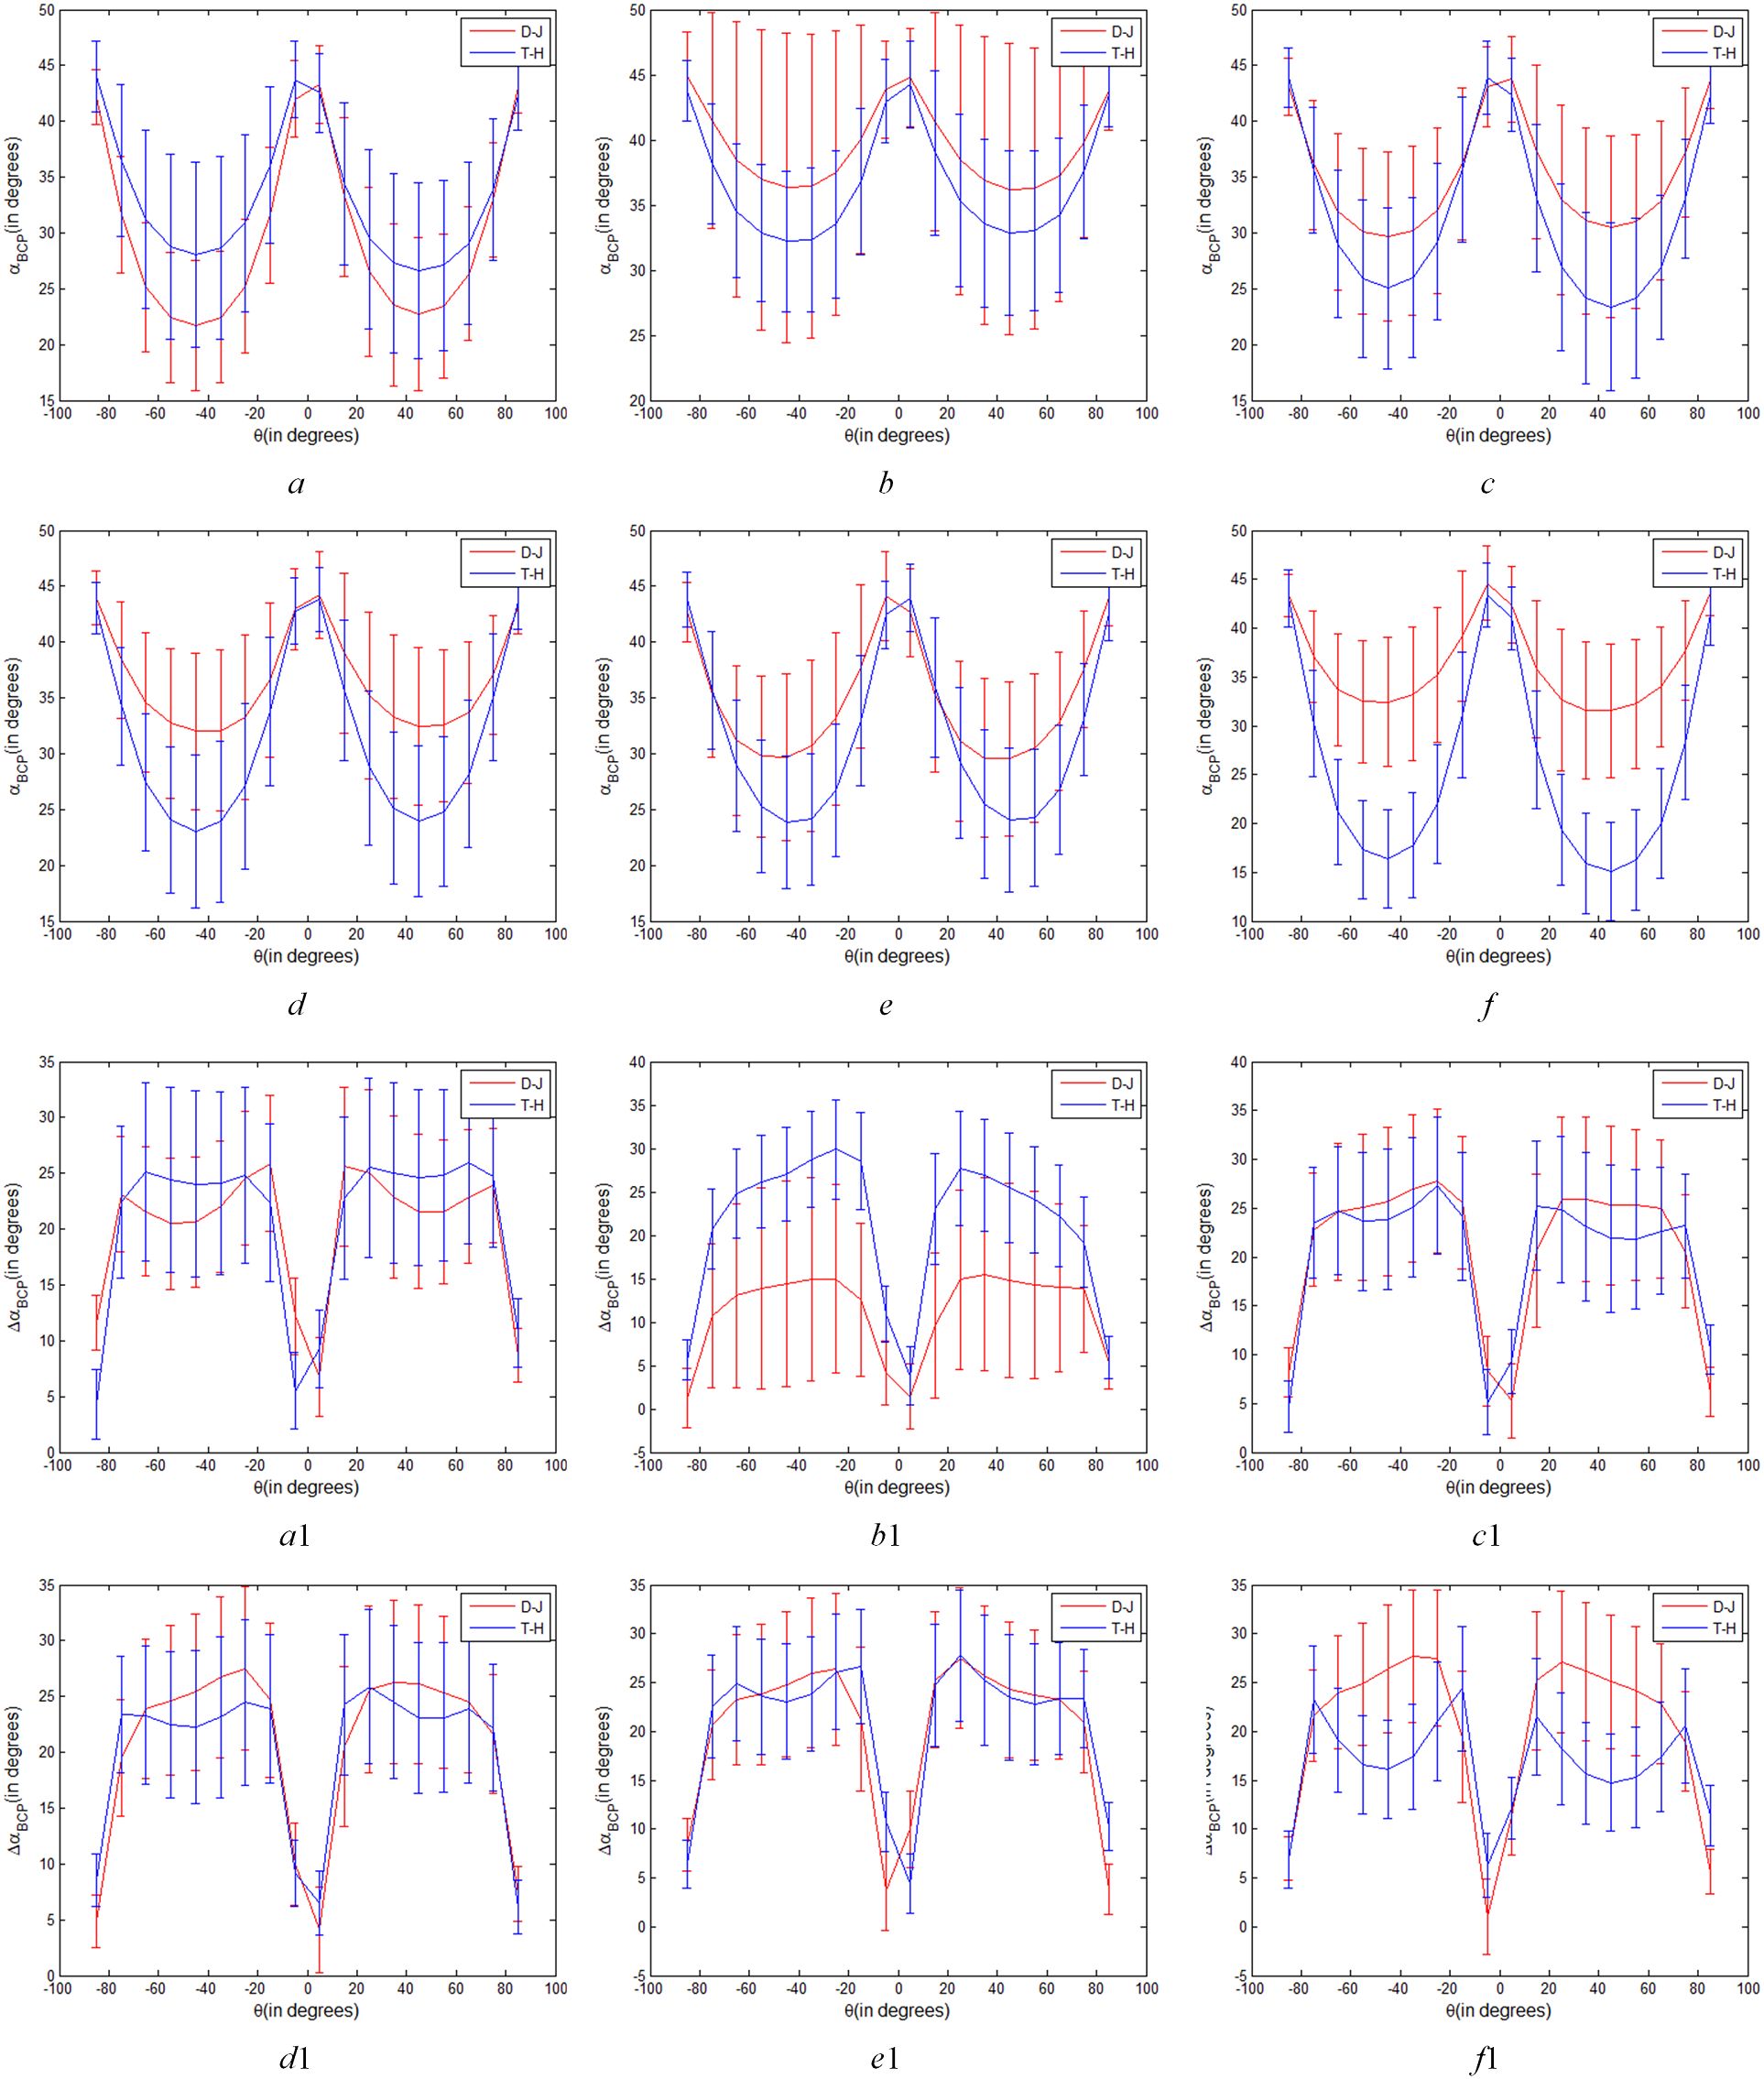
Figure 9. Variations of αB and ΔαB parameters of T-H and D-J for varying transmitting polarizations (a fixed =0 and variable ), (a, b, c, d, e and f are variations of αB parameter on June 12, July 30, August 23, September 16, October 10 and November 3 respectively. a1, b1, c1, d1, e1 and f1 are variations of ΔαB parameter on June 12, July 30, August 23, September 16, October 10 and November 3 respectively).
As shown in Figures 8A–F, the values of αB of T-H and D-J decreased significantly with χ approaching 0. However, as shown in Figures 8A, B on June 12, July 30, with the change of χ, difference value of αB of T-H and D-J showed little difference. These results indicated that CP SAR of different polarization modes shows little difference in αB characterization between the two types of rice paddies at seedling stage and initial growth stage. However, from August 23 to November 3, when χ is close to 0°, the αB values of T-H and D-J are significantly different, and when χ=0°, the difference was the largest. Since θ=π/4 is fixed, the closer to the linear π/4 mode, the more obvious the difference between the two types of rice paddies, especially September 16 and November 3. In accordance with the analysis results in Section 4.1, from August 23 to November 3, the linear π/4 mode of αB is better than the circular and elliptic polarization modes for discriminating between the two types of rice paddies.
Different from Figures 8A–F, it can be seen from Figure 8 a1-f1that the difference value of ΔαB of T-H and D-J changed with the change of χ. For example, in Figure 8 f1, when χ is ±π/4, corresponding to the circular polarization mode, the difference in ΔαB between T-H and D-J is most pronounced. As the absolute value of χ decreases, the difference value of ΔαB of T-H and D-J also decreases, indicating that the ΔαB parameter of circular polarization mode can show the difference of T-H and D-J better than that of elliptic polarization mode. As the absolute value of χ continues to decrease, when it is closer to 0, that is to say, closer to the linear polarization mode, the difference between T-H and D-J gradually becomes larger. This indicates that the circular polarization mode and linear π/4 mode show the most obvious differences between the two types of rice paddies in Harvest stage (on November 3).
As shown in Figures 9A–F, when χ is 0, that is, CP polarization mode was linear polarization mode, θ changed from -π/2 to π/2, αB parameter of T-H and D-J changed significantly. As shown in Figures 9A–F, αB parameter has the same variation trend in different stages. When θ is ±π/4 (linear π/4 mode), the difference value between the two types of rice paddies is most obvious compared with other linear polarization modes. Combined with Figures 8A–F, it can be seen that the αB of the linear π/4 mode in six phenological periods is obviously better than that of the other mode in distinguishing between the two types of rice paddies.
4.3 Rice paddy classification based on SVM method using ΔαB and αB parameters
To quantitatively evaluate six temporal ΔαB and αB parameters in distinguishing between T-H and D-J, as shown in Figure 10, we made the difference histogram for T-H and D-J of ΔαB and αB based on FP SAR data, CP SAR data of π/4 and CTLR modes respectively.
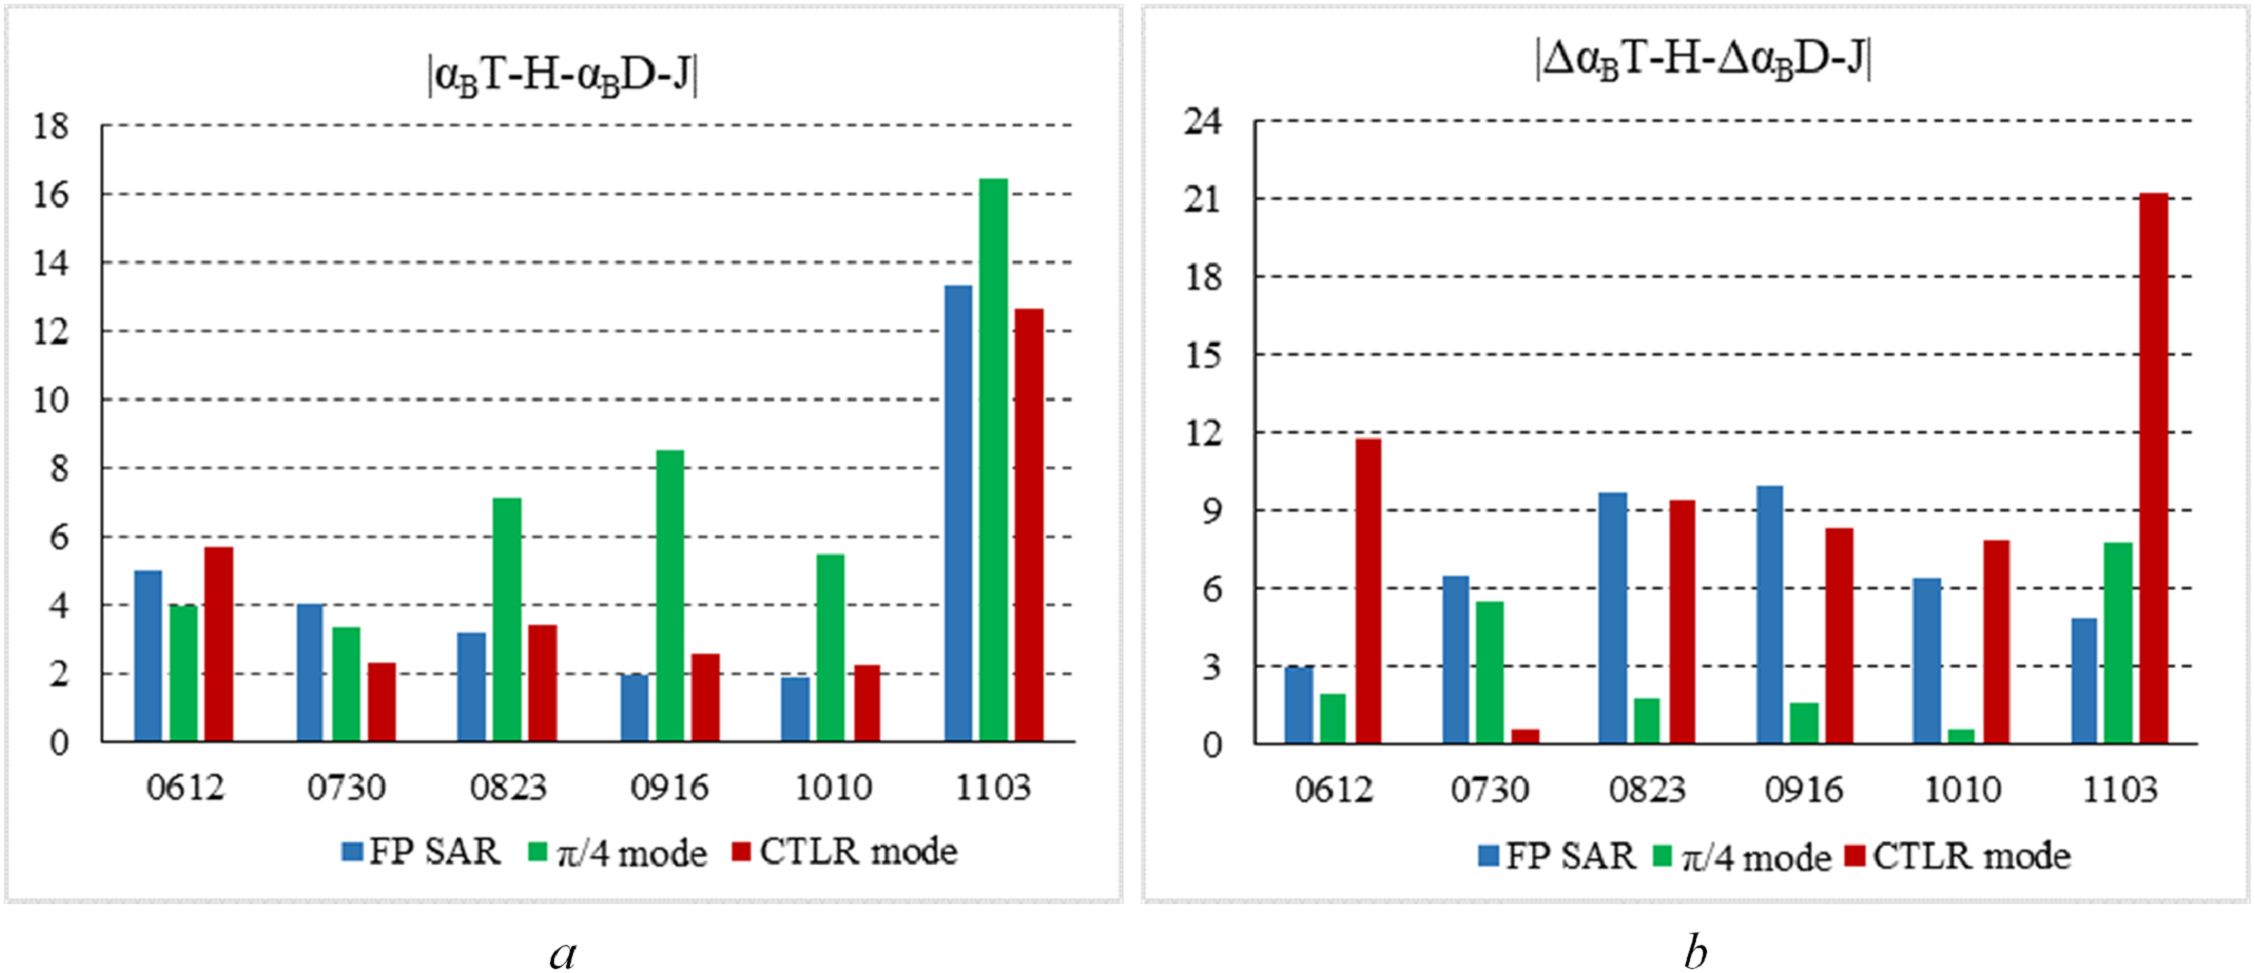
Figure 10. Difference histogram for T-H and D-J of ΔαB and αB based on FP SAR data, CP SAR data of π/4 mode and CTLR mode respectively (A) is difference histogram for T-H and D-J of αB; (B) is difference histogram for T-H and D-J of ΔαB).
As shown in Figure 10A that difference degree for T-H and D-J of αB is greater on November 3 than in other periods. Besides, the difference degree for T-H and D-J of αB based on CP SAR data of π/4 mode is bigger than that based on FP SAR data and CP SAR data of CTLR mode on August 23, September 16, October 10 and November 3. Compared with other periods, the difference degree for T-H and D-J of αB on November 3 was the largest. Therefore, compared with other periods of αB, αB is the best parameter to distinguish between two types of rice paddies, which is consistent with the conclusions of the analysis in section 4.1. As shown in Figure 10B that difference degree for T-H and D-J of ΔαB based on CP SAR data of CTLR mode is greater on November 3 than in other periods. Additionally, in other periods, the difference degree based on FP SAR and CP SAR data of CTLR mode is similar, which is larger than the difference degree based on CP SAR data of π/4 mode.
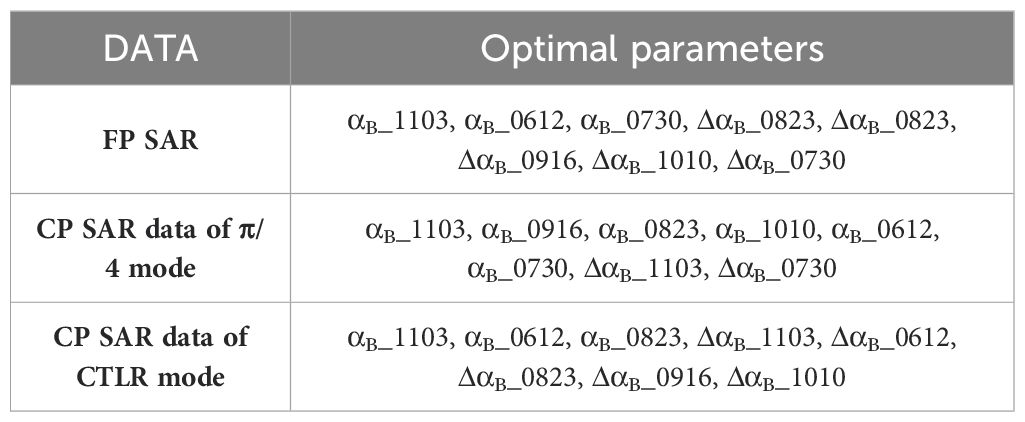
As shown in Table 2, we selected the optimal parameters of ΔαB and αB for distinguishing two types of rice paddies based on difference degree of Figure 10. We used the optimal parameters of ΔαB and αB under three kinds of SAR data to carry out the SVM classification to realize the fine classification of two types of rice paddies. Figure 11 shows the classification results based on FP SAR data, CP SAR data of CTLR mode and π/4 mode, respectively. As can be seen from the classification results, towns and cities are mostly distributed in the south of the study area, rivers in the middle of the study area, and SNL classes are mostly distributed on both sides of the river. In addition, D-J is mostly distributed in the northwest of the study area. And T-J is mostly distributed in the southeast. The classification results were consistent with the actual distribution of rice cultivation in the study area. Compared with the three classification results, the classification results are generally consistent, but there are differences in details. To better evaluate the three classification results, we used the validation data to verify the classification results.
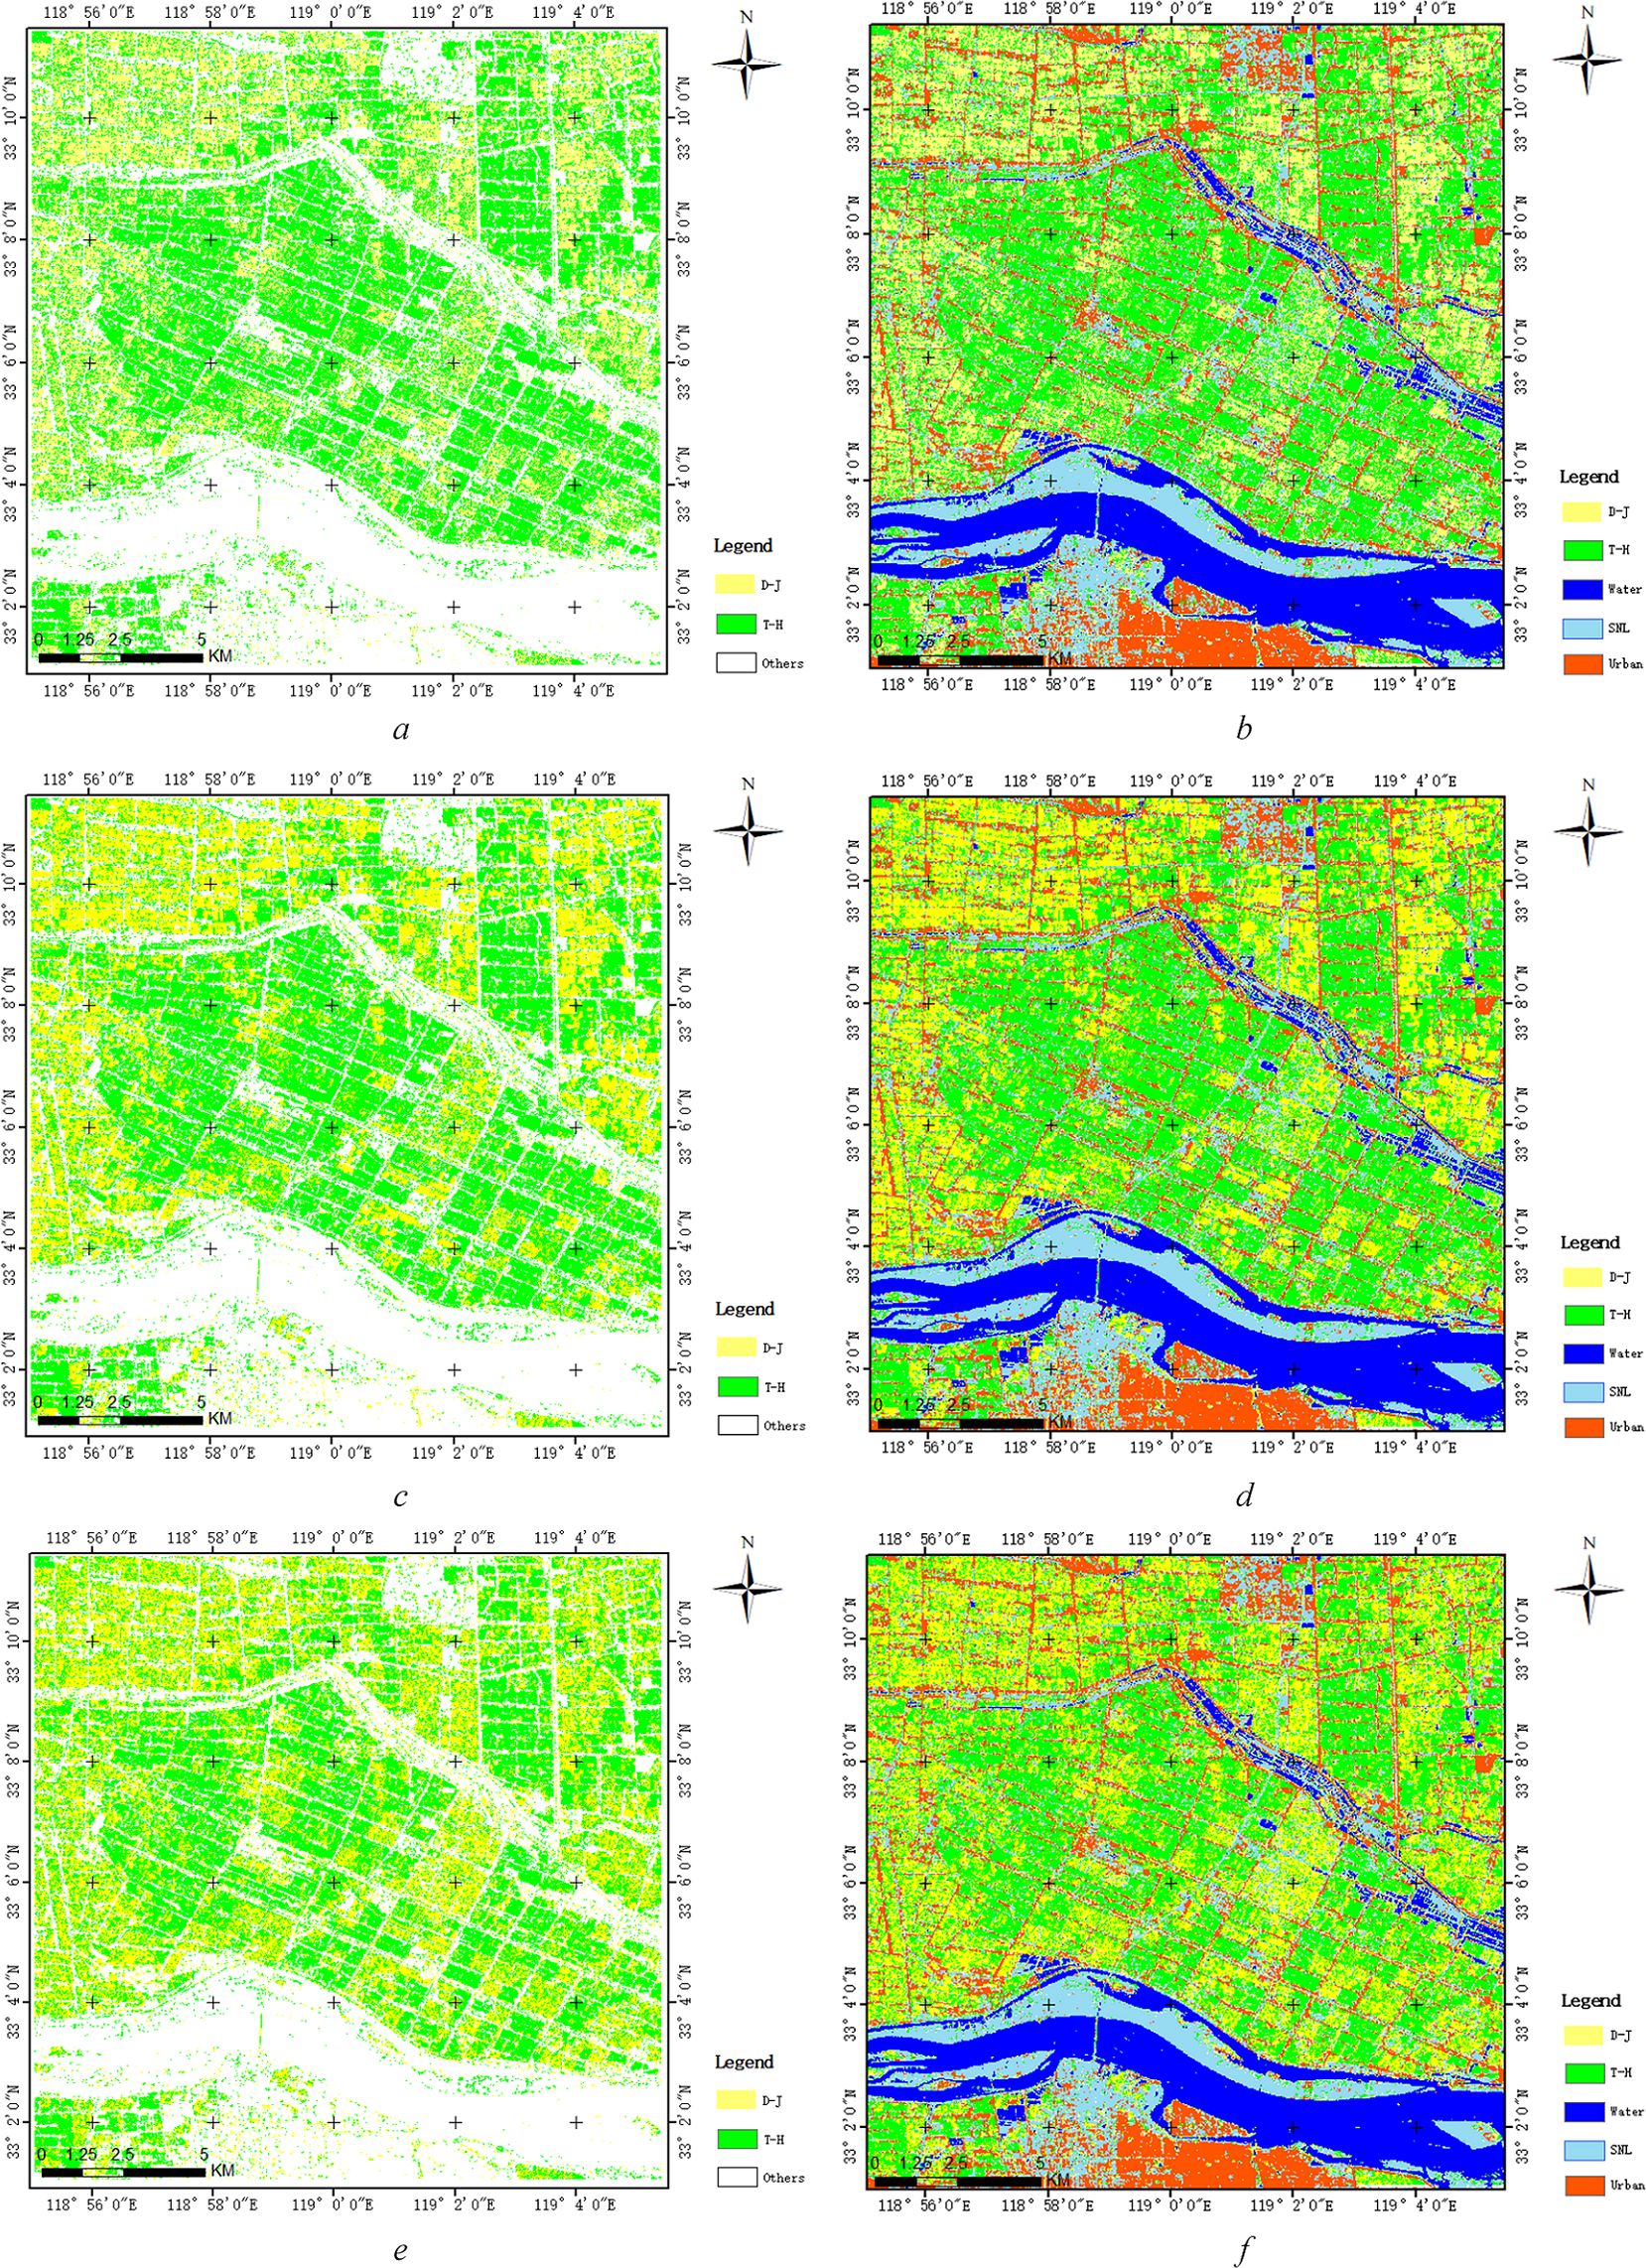
Figure 11. Classification result (A) is classification result of T-H and D-J and (B) is the overall classification result including 5 classes based on FP SAR data; (C) is classification result of T-H and D-J and (D) is the overall classification result including 5 classes based on CP SAR data of π/4 mode; (E) is classification result of T-H and D-J and (F) is the overall classification result including 5 classes based on CP SAR data of CTLR mode).
Table 3 shows the accuracy indexes of the classification results based on FP SAR data, CP SAR data of CTLR mode and π/4 mode, respectively. This study focuses on distinguish two types of rice paddies based on ΔαB and αB parameters, so we discuss only the classification accuracy of the two types of rice paddies and the overall accuracies of the classification results. By comparing accuracy of classification results based on FP SAR data, CP SAR data of CTLR mode and π/4 mode, classification of rice paddy using CP SAR data of π/4 mode shows the best classification results with overall accuracy of 95.5% and kappa of 0.938. Based on ΔαB/αB target decomposition method, the classification result using CP SAR data of π/4 mode is higher than that of using FP SAR data and CP SAR data of CTLR mode. Specifically, the overall accuracy of CP SAR data of π/4 mode is 4% higher than that of using CTLR mode, and the Kappa coefficient is greater than 0.05. For rice paddy, in the classification results based on CP SAR data of π/4 mode, the average accuracy of T-H and D-J is 80.9% and 90.0%, respectively. In the classification results based on CP SAR data of CTLR mode, the average accuracy of T-H and D-J is 63.8% and 75.4%, respectively. In the classification results based on FP SAR data, the average accuracy of T-H and D-J is 77.7% and 86.0% respectively. Therefore, we can see that the classification results using CP SAR data of π/4 mode are better than those of using CP SAR data of CTLR mode, and the results are similar to those of using FP SAR data.
4.4 Phenological analysis of ΔαB and αB parameters of T-H and D-J
With the growth of rice plants, rice morphology will be different under different phenological periods, which results in different expressions of CP parameters at different phenological periods. Therefore, it is of great significance to analyze the CP parameters under different phenological periods for rice phenological recognition. In this section, we analyzed the ΔαB and αB of four CP modes of general CP SAR in multiple phenological periods of two types of rice paddies respectively, so as to obtain the change rule of ΔαB and αB of two types of rice paddies in the phenological periods under multiple CP modes. Figures 12A, B show variations of αB parameter of rice paddy (T-H and D-J) for four transmitting polarization modes in six phenological periods. In the seedling stage, the vegetation is small and the scattering component is mainly surface scattering. The αB parameter values of both kinds of rice paddy are low. Due to the different planting methods and varieties of rice, the scattering component of T-H is more abundant than that of D-J in seedling stage, so the αB of T-H is larger than that of D-J. With increasing growth of rice plants, both plants have increased volume and double-bounce scattering, resulting in greater αB value of T-H and D-J at elongation stage than at seedling stage. As the rice ear grows, the volume scattering of rice continues to increase. Since the plant is denser, this results in a lower amount of double-bounce scattering. Therefore, at the Booting stage, αB of T-H and D-J decreased slightly. As rice ears continue to grow from heading stage to mature stage, the scatterings of T-H and D-J tend to be stable, and αB do not change significantly. Until the Harvest stage, the growth cycle of D-J is longer than that of T-H, so on November 3, T-H has been harvested, while D-J is still in the mature stage and has not been harvested. Therefore, during this period, the αB of T-H has a significant decrease compared with October 10. However, D-J has no such trend in Harvest stage (November 3). Therefore, the variation trend of αB parameters of two types of rice paddies is different under the phenological period of rice growth due to the difference of two types of rice varieties.
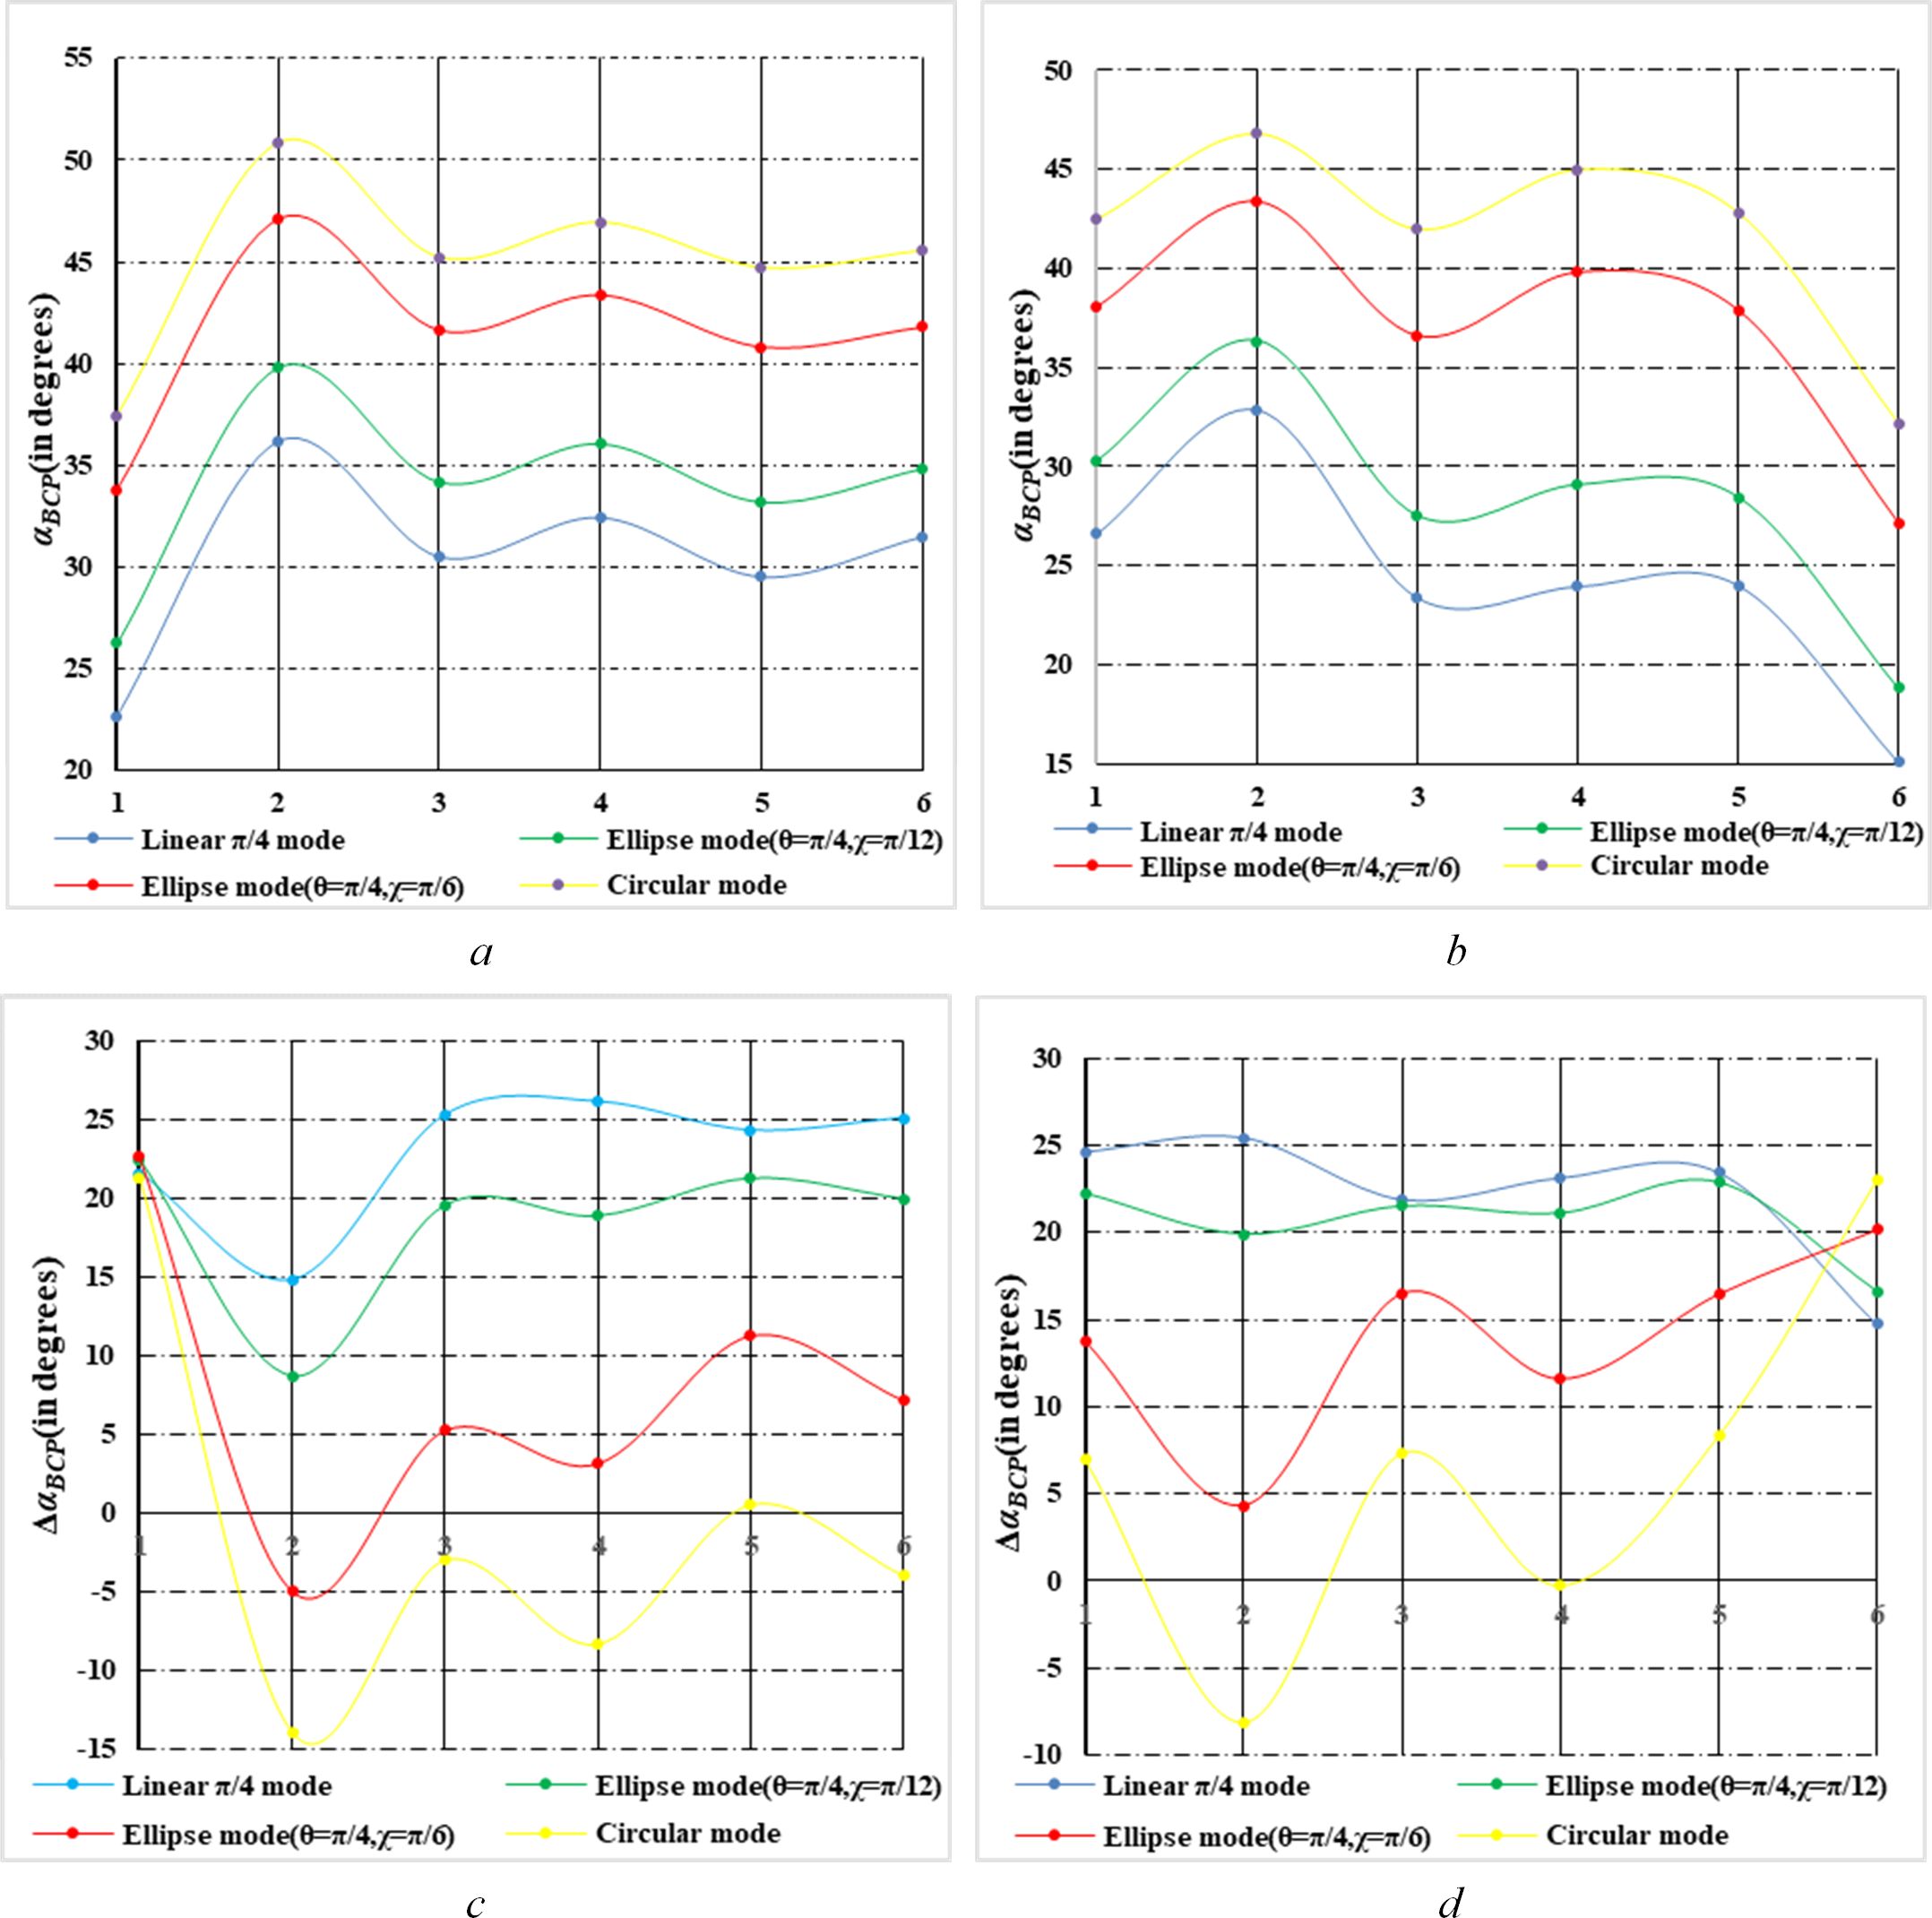
Figure 12. Variations of αBand ΔαB parameter of rice paddy for four transmitting polarization modes in six phenological periods (A, B) are variations of αBparameter of D-J and T-H respectively. (C, D) and d are variations of ΔαBparameter of D-J and T-H respectively. And the ordinates 1-6 represent 6 phenological periods (on June 12, July 30, August 23, September 16, October 10 and November 3).
For different transmitting polarization modes, αB parameters gradually increase from linear polarization to circular polarization mode, which is similar to Figures 8A–F results are consistent. In addition, the variation trend of αB parameters of T-H and D-J is basically the same for different transmitting modes, which could show the variation rule of the CP parameters in each phenological period.
Figures 12C, D show variations of ΔαB parameter of rice paddy (T-H and D-J) for four transmitting polarization modes across six phenological periods. In the seedling stage, the vegetation is small and the scattering component is mainly surface scattering. The ΔαB parameter values of the two types of rice paddies are greater than 0. As rice grows into Elongation stage, the double-bounce scattering increases. Therefore, the ΔαB of T-H and D-J at Elongation stage is lower than that at seedling stage. From October 10 to November 3, the changes of ΔαB of T-H and D-J were different because T-H was harvested on November 3, while D-J was still in the mature stage. As a result, the variation trends of ΔαB are quite different. In addition, the variation trend of ΔαB curves for T-H and D-J shows that ΔαB under the circular mode exhibits a much more obvious difference in the characteristics of each phenological period of rice compared to other modes.
In general, there was a certain difference in the variation trend of αB parameters between the two types of rice paddies with the growth of rice plants. From Seedling to Elongation stage, the variation trend of the T-H and D-J is basically the same, but the degree of change differs, which is related to the planting methods and varieties of the two types of rice. However, from mature stage to harvest stage, the variation trend of αB parameters differs significantly, mainly due to the length of growth cycle of the two types of rice. For the ΔαB parameter, with the growth of rice plant, ΔαB changes dramatically, and the variation trends of the two types of rice differ. Taking the circular mode as an example, the most obvious difference is from mature stage to harvest stage, and the ΔαB parameter variation trend of the T-H and D-J is just the opposite. In addition, from seedling stage to harvest stage, changes degree of ΔαB under circular mode were more obvious than other mode, which also showed the difference between the two types of rice paddies.
This paper mainly studied the classification and phenological analysis of rice based on the optimal polarimetric parameters that characterize the scattering characteristics of rice plants. However, environmental factors also affect rice classification and phenological analysis to a certain extent. The specific influencing factors mainly include the following three aspects. 1. Topography factors: The study area is a plain region with flat terrain, so the topography has little impact on this study. However, in mountainous and hilly areas where rice is grown, radar side imaging may cause overlay and shadow effects in paddy fields. Consequently, polarimetric SAR parameters may not effectively characterize rice scattering characteristics in these regions. In future work, we will acquire SAR data of paddy fields in mountainous and hilly areas to study the influence of topography on rice classification and phenological analysis. 2. Soil factors. In SAR images, soil moisture is the main factor affecting polarimetric scattering characteristics of crop. Since our research focuses on rice, the underlying surface environment varies with different rice phenological stages. For example, during the Seedling, Elongation, Booting, Heading, and Flowering stages, the rice fields are completely covered by water. However, in the Milky and Mature stages, the underlying surface is wet soil layer. Therefore, the underlying surface of rice varies across different phenological stages, leading to distinct responses in polarimetric parameters in radar images. For rice phenological analysis, the variations in the underlying surface at different phenological stages of rice lead to improved characterization of these stages by polarimetric parameters. 3. Agricultural Management Factors: Agricultural management also has a certain impact on the classification and phenological analysis of rice. For example, this study distinguishes between two types of rice (T-H and D-J), which differ not only in variety but also in cultivation management practices. T-H rice is sown for transplanting, with row and pier spacing of approximately 30 cm and 15 cm, respectively. In contrast, D-J rice, which is planted directly in paddies, shows a random uniform distribution during the seedling stage. This results in significantly different polarimetric characteristics between the two types of rice, allowing them to be effectively distinguished.
5 Conclusion
In this study, we proposed a strategy for fine classification and phenological analysis based on general CP SAR data. Based on FP SAR data and general CP SAR data, ΔαB/αB methods were introduced into rice fine classification and phenological analysis of rice paddy under multiple phenological periods. And the main research conclusion has two aspects.
On the one hand, based on ΔαB and αB parameters, the fine classification results of rice paddy using FP SAR and CP SAR of data of π/4 mode and CTLR mode were obtained and the three results were verified and evaluated. Additionally, we explored the ability of ΔαB and αB parameters to distinguish between the two types of rice paddies across multiple phenological periods and extracted the optimal parameters. We found that the ΔαB and αB based on the general CP SAR data on November (Harvest stage) are the best parameters for distinguishing between the two types of rice paddies. Moreover, CP SAR data of π/4 mode is better than CP SAR data of CTLR mode and FP SAR data on September 16 (Heading–Flowering stage) in distinguishing between the two types of rice paddies. Additionally, αB based on CP SAR data of π/4 mode reflects the difference of rice ear between the two types of paddies in this period. Furthermore, we found that CP SAR of different modes had little difference in αB characterization between the two types of rice paddies at seedling stage and initial growth stage. However, from August 23 (Booting–Heading stage) to November 3 (Harvest stage), π/4 mode of αB is better than circular and elliptic polarization mode in discrimination ability for two types of rice paddies. In addition, using SVM classification method based on optimal parameters of ΔαB and αB, we get high precision classification results of rice paddy. The experimental results show that the classification accuracy is above 90%, and the Kappa coefficient is above 0.88. The highest accuracy of T-H is 80.9%, and the highest accuracy of D-J is 89.9%. Moreover, classification results using CP SAR data of π/4 mode data are better than those using CP SAR data of CTLR mode data, and the results are similar to those of using FP SAR data.
On the other hand, we studied the phenological evolution rule of the two rice types under general CP modes. There was a certain difference in the variation trend of αB parameters between the two types of rice paddies with the growth of rice plants. From Seedling to Elongation stage, the variation trend of the T-H and D-J is basically the same, but the degree of change is different. From mature stage to harvest stage, the variation trend of αB parameters is significantly different for two types of rice paddies, which is mainly due to the length of growth cycle of the two types of rice.
Data availability statement
The original contributions presented in the study are included in the article/supplementary material. Further inquiries can be directed to the corresponding author.
Author contributions
XG: Methodology, Writing – original draft, Writing – review & editing. JuY: Formal analysis, Funding acquisition, Project administration, Supervision, Writing – review & editing. KL: Data curation, Resources, Writing – review & editing. JiY: Project administration, Supervision, Writing – review & editing.
Funding
The author(s) declare financial support was received for the research, authorship, and/or publication of this article. This work was supported by NSFC under Grant no. 62222102, NSFC no. 62171023, the. Fundamental Research Funds for the Central Universities under Grant no. FRF-TP-22-005C1, and projects of China High-resolution Earth Observation System, grant numbers 00-Y30B01-9001-22/23.
Conflict of interest
The authors declare that the research was conducted in the absence of any commercial or financial relationships that could be construed as a potential conflict of interest.
Publisher’s note
All claims expressed in this article are solely those of the authors and do not necessarily represent those of their affiliated organizations, or those of the publisher, the editors and the reviewers. Any product that may be evaluated in this article, or claim that may be made by its manufacturer, is not guaranteed or endorsed by the publisher.
References
Bouvet, A., Toan, T. L. (2011). Use of ENVISAT/ASAR wide-swath data for timely rice fields mapping in the Mekong River Delta. Remote Sens. Environ. 115, 1090–1101. doi: 10.1016/j.rse.2010.12.014
Cameron, W. L., Leung, L. K. (1990). “Feature motivated polarization scattering matrix decomposition,” in IEEE International Conference on Radar, Arlington, USA. 549–557. doi: 10.1109/RADAR.1990.201088
Cameron, W. L., Rais, H. (2006). Conservative polarimetric scatterers and their role in incorrect extensions of the Cameron decomposition. IEEE Trans. Geosci. Remote Sens. 44, 3506–3516. doi: 10.1109/TGRS.2006.879115
Charbonneau, F. J., Brisco, B., Raney, R. K., McNairn, H., Liu, C., Vachon, J., et al. (2010). Compact polarimetry overview and applications assessment. Can. J. Remote Sens. 36, S298–S315. doi: 10.5589/m10-062
Cloude, S. R. (1985). Radar target decomposition theorems. Electron. Lett. 21, 22–24. doi: 10.1049/el:19850018
Cloude, S. R., Goodenough, D. G., Chen, H. (2012). Compact decomposition theory. IEEE Geosci. Remote Sens. Lett. 9, 28–32. doi: 10.1109/LGRS.2011.2158983
Cloude, S. R., Pottier, E. (1996). A review of target decomposition theorems in radar polarimetry. IEEE Trans. Geosci. Remote Sens. 34, 498–518. doi: 10.1109/36.485127
Deepika, U., Ramana, V. K., Poloju, S., Mullapudi, S. S. V. R., Dadhwal, V. K. (2015). Rice crop discrimination using single date RISAT1 hybrid (RH, RV) polarimetric data. Photogramm. Eng. Remote. Sens. 81, 557–563. doi: 10.14358/PERS.81.7.557
Freeman, A., Durden, S. (1998). A three-component scattering model for polarimetric SAR data. L. IEEE Trans. Geosci. Remote Sens. 36, 963–973. doi: 10.1109/36.673687
Guo, X., Yin, J., Li, K., Yang, J. (2021). Fine classification of rice paddy based on RHSI-DT method using multi-temporal compact polarimetric SAR data. Remote Sens. 13, 5060. doi: 10.3390/rs13245060
Guo, X., Yin, J., Li, K., Yang, J., Shao, Y. (2022). Scattering intensity analysis and classification of two types of rice based on multi-temporal and multi-mode simulated compact polarimetric SAR data. Remote Sens. 14, 1644. doi: 10.3390/rs14071644
Holm, W. A., Barnes, R. M. (1988). “On radar polarization mixed target state decomposition techniques,” in 1988 IEEE National Radar Conference, Ann Arbor, USA. 249–254. doi: 10.1109/NRC.1988.10967
Huang, G. B., Zhou, H., Ding, X., Zhang, R. (2012). Extreme learning machine for regression and multiclass classification. IEEE Trans. Systems Man Cybernetics Part B (Cybernetics) 42, 513. doi: 10.1109/TSMCB.2011.2168604
Huynen, J. R. (1990). “Stokes matrix parameters and their interpretation in terms of physical target properties,” in Polarimetry: Radar, infrared, visible, ultraviolet, and X-ray, vol. 1317. (Huntsville, USA: SPIE), 195–207. doi: 10.1117/12.22083
Krogager, E. (1990). New decomposition of the radar target scattering matrix. Electron. Lett. 26, 1525–1527. doi: 10.1049/el:19900979
Li, K., Brisco, B., Shao, Y., Touzi, R. (2014). Polarimetric decomposition with RADARSAT-2 for rice mapping and monitoring. Can. J. Remote Sens. 38, 169–179. doi: 10.5589/m12-024
Lopez-Sanchez, J. M., Vicente-Guijalba, F., Ballester-Berman, J. D., Cloude, S. R. (2014). Polarimetric response of rice fields at C-band: analysis and phenology retrieval. IEEE Trans. Geosci. Remote Sens. 52, 2977–2993. doi: 10.1109/TGRS.2013.2268319
Maclean, J. L., Dawe, D. C., Hardy, B., Hettel, G. P. (2002). Rice almanac: source book for the most important economic activity on earth (London, United Kingdom: CABI Pub; International Rice Research Institute (IRRI)). doi: 10.1079/9780851996363.0000
Mosleh, M. K., Hassan, Q. K., Chowdhury, E. H. (2015). Application of remote sensors in mapping rice area and forecasting its production: A review. Sensors 15, 769–791. doi: 10.3390/s150100769
Raney, R. K. (2006). Dual-polarized SAR and stokes parameters. IEEE Geosci. Remote Sens. Lett. 3, 317–319. doi: 10.1109/LGRS.2006.871746
Raney, R. K. (2007). Hybrid-polarity SAR architecture. IEEE Trans. Geosci. Remote Sens. 45, 3397–3404. doi: 10.1109/TGRS.2007.895883
Raney, R. K., Cahill, J. T. S., Patterson, G. W., Bussey, D. B. J. (2012). “The m-chi decomposition of hybrid dual-polarimetric radar data,” in 2012 IEEE International Geoscience and Remote Sensing Symposium, Munich, Germany. 5093–5096. doi: 10.1109/IGARSS.2012.6352465
Souyris, J. C., Imbo, P., Fjortoft, R., Sandra, M., Lee, J. S. (2005). Compact polarimetry based on symmetry properties of geophysical media: the π/4 mode. IEEE Trans. Geosci. Remote Sens. 43, 634–646. doi: 10.1109/TGRS.2004.842486
Souyris, J. C., Mingot, S. (2002). “Polarimetry based on one transmitting and two receiving polarizations: the π/4 mode,” in 2002 IEEE International Geoscience and Remote Sensing Symposium, Toronto, Canada, 24-28 June 2002. doi: 10.1109/IGARSS.2002.1025127
Stacy, N., Press Austra. (2006). “Compact Polarimetric Analysis of X-Band SAR Data.” in EUSAR 2006 - 6th European Conference on Synthetic Aperture Radar, Dresden, Germany. 4.
Suykens, J. A. K., Vandewalle, J. (1999). Least squares support vector machine classifiers. Neural Process. Lett. 9, 293. doi: 10.1023/A:1018628609742
Touzi, R., Charbonneau, F. (2002). Characterization of target symmetric scattering using polarimetric SARs. IEEE Trans. Geosci. Remote Sens. 40, 2507–2516. doi: 10.1109/TGRS.2002.805070
van Zyl, J. J. (1993). Application of Cloude’s target decomposition theorem to polarimetric imaging radar data. Radar polarimetry SPIE 1748, 184–191. doi: 10.1117/12.140615
Wang, X., Shao, Y., She, L., Tian, W., Li, K., Liu, L. (2018). Ocean wave information retrieval using simulated compact polarized SAR from radarsat-2. J. Sens. 1738014, 1–12. doi: 10.1155/2018/1738014
Yamaguchi, Y., Moriyama, T., Ishido, M., Yamada, H. (2005). Four-component scattering model for polarimetric SAR image decomposition. IEEE Trans. Geosci. Remote Sens. 43, 1699–1706. doi: 10.1109/TGRS.2005.852084
Yamaguchi, Y., Yajima, Y., Yamada, H. (2006). A four-component decomposition of POLSAR images based on the coherency matrix. IEEE Geosci. Remote Sens. Lett. 3, 292–296. doi: 10.1109/LGRS.2006.873229
Yang, Z., Li, K., Liu, L., Shao, Y., Brisco, B., Li, W. (2014). Rice growth monitoring using simulated compact polarimetric C band SAR. Radio Sci. 49, 1300–1315. doi: 10.1002/2014RS005498
Yang, J., Peng, Y. N., Yamaguchi, Y., Yamada, H. (2006). On Huynen’s decomposition of a Kennaugh matrix. IEEE Geosci. Remote Sens. Lett. 3, 369–372.2. doi: 10.1109/LGRS.2006.873229
Yang, S., Shen, S., Li, B., Le Toan, T., He, W. (2008). Rice mapping and monitoring using ENVISAT ASAR data. IEEE Geosci. Remote Sens. Lett. 5, 108–112. doi: 10.1109/LGRS.2007.912089
Yin, J., Moon, W. M., Yang, J. (2016). Novel model-based method for identification of scattering mechanisms in polarimetric SAR data. IEEE Trans. Geosci. Remote Sens. 54, 520–532. doi: 10.1109/TGRS.2015.2461431
Yin, J., Papathanassiou, K. P., Yang, J. (2019). Formalism of compact polarimetric descriptors and extension of the $\Delta\alpha_ {\text {B}}/\alpha_ {\text {B}} $ Method for general compact-pol SAR. IEEE Trans. Geosci. Remote Sens. 57, 10322–10335. doi: 10.1109/TGRS.2019.2933556
Yin, J., Yang, J. (2020). Target decomposition based on symmetric scattering model for hybrid polarization SAR imagery. IEEE Geosci. Remote Sens. Lett. 18, 494–498. doi: 10.1109/LGRS.2020.2994540
Keywords: rice paddy, general compact polarimetric (CP) SAR, fine classification, phenological analysis, CTLR mode, π/4 mode
Citation: Guo X, Yin J, Li K and Yang J (2024) Fine classification and phenological analysis of rice paddy based on multi-temporal general compact polarimetric SAR data. Front. Plant Sci. 15:1391735. doi: 10.3389/fpls.2024.1391735
Received: 26 February 2024; Accepted: 19 September 2024;
Published: 10 October 2024.
Edited by:
Yongliang Qiao, University of Adelaide, AustraliaReviewed by:
Chao Chen, Suzhou University of Science and Technology, ChinaYeison Alberto Garcés-Gómez, Catholic University of Manizales, Colombia
Copyright © 2024 Guo, Yin, Li and Yang. This is an open-access article distributed under the terms of the Creative Commons Attribution License (CC BY). The use, distribution or reproduction in other forums is permitted, provided the original author(s) and the copyright owner(s) are credited and that the original publication in this journal is cited, in accordance with accepted academic practice. No use, distribution or reproduction is permitted which does not comply with these terms.
*Correspondence: Junjun Yin, anVuanVuX3lpbkB1c3RiLmVkdS5jbg==
 Xianyu Guo
 Junjun Yin
 Kun Li2
