 Chunxiao Yang
 Rudolph Fredua-Agyeman
 Sheau-Fang Hwang
 Linda Y. Gorim
 Stephen E. Strelkov
- Department of Agricultural, Food and Nutritional Science, University of Alberta, Edmonton, AB, Canada
The root systems of Brassica species are complex. Eight root system architecture (RSA) traits, including total root length, total root surface area, root average diameter, number of tips, total primary root length, total lateral root length, total tertiary root length, and basal link length, were phenotyped across 379 accessions representing six Brassica species (B. napus, B. juncea, B. carinata, B. oleracea, B. nigra, and B. rapa) using a semi-hydroponic system and image analysis software. The results suggest that, among the assessed species, B. napus and B. oleracea had the most intricate and largest root systems, while B. nigra exhibited the smallest roots. The two species B. juncea and B. carinata shared comparable root system complexity and had root systems with larger root diameters. In addition, 313 of the Brassica accessions were genotyped using a 19K Brassica single nucleotide polymorphism (SNP) array. After filtering by TASSEL 5.0, 6,213 SNP markers, comprising 5,103 markers on the A-genome (covering 302,504 kb) and 1,110 markers on the C-genome (covering 452,764 kb), were selected for genome-wide association studies (GWAS). Two general linear models were tested to identify the genomic regions and SNPs associated with the RSA traits. GWAS identified 79 significant SNP markers associated with the eight RSA traits investigated. These markers were distributed across the 18 chromosomes of B. napus, except for chromosome C06. Sixty-five markers were located on the A-genome, and 14 on the C-genome. Furthermore, the major marker-trait associations (MTAs)/quantitative trait loci (QTLs) associated with root traits were located on chromosomes A02, A03, and A06. Brassica accessions with distinct RSA traits were identified, which could hold functional, adaptive, evolutionary, environmental, pathological, and breeding significance.
Introduction
Roots are a fundamental component of the plant vascular system, playing a pivotal role in plant growth, development, and overall survival. The primary function of roots is absorbing water and nutrients from the soil, as well as serving as an anchor that firmly secures plants to the ground, thereby ensuring stability and support. The development of a root system is an important quantitative characteristic that determines a plant’s capacity to survive across different environments. Improved understanding of the behavior of roots within natural ecosystems is of significance in enhancing crop yields, developing more resilient plant varieties, and preserving biodiversity (Griffiths et al., 2022).
The genus Brassica consists of 37 species including the widely cultivated commercial crops Brassica napus L. (AACC, n = 19), B. rapa L. (AA, n = 10), B. nigra (L.) Koch (BB, n = 8), B. oleracea L. (CC, n = 9), B. juncea (L.) Czern & Coss (AABB, n = 18), and B. carinata A. Braun (BBCC, n = 17) (Branca and Cartea, 2011). Most B. juncea and B. nigra genotypes have fibrous roots (Center for Agriculture, Food, and the Environment, 2015), while B. napus (Arif et al., 2019), B. rapa (Center for Agriculture, Food, and the Environment, 2015), B. oleracea (Center for Agriculture, Food, and the Environment, 2015), and B. carinata (Barro and Martín, 1999) have a large taproot system with a single main root axis and hundreds of lateral roots. Several root system architecture (RSA) traits are heritable characteristics, which suggests some level of genetic control mechanisms that may be exploited in breeding programs (Shi et al., 2013). In addition, root growth and development have been reported to be influenced by plant hormonal cues (Tanimoto, 2005; Santner et al., 2009; Vissenberg et al., 2020). The uneven distribution of nutrients and water in soils as well as soil microbiomes have also been reported to influence root growth and development (Molefe et al., 2023). Lastly, the plasticity of roots make them vulnerable to physico-chemical environmental influences (Lynch, 2007; Ingram and Malamy, 2010; Yang et al., 2010; Shi et al., 2013; Zhang et al., 2016; Ibrahim et al., 2021).
Genetic variability in plants is a fundamental component of biodiversity and serves as the foundation for the creation of novel and enhanced cultivars with desirable traits (Govindaraj et al., 2015; Yu et al., 2021). Therefore, increasing the genetic diversity in Brassica genotypes is an important breeding objective. However, only a few studies have reported the potential of root phenomics for crop breeding (Kuijken et al., 2015; Prince et al., 2019; Falk et al., 2020; Liu et al., 2021). This is mostly due to the complexity and large genetic variability of Brassica root systems, the difficulties of accessing intact roots, as well as the tedious and laborious nature of phenotyping Brassica roots (de Dorlodot et al., 2007; Zhu et al., 2011; Meister et al., 2014; Ibrahim et al., 2021; Yang et al., 2024). The main goal of breeding programs that target root traits is to enhance the ability of roots to explore the soil and acquire water and nutrients, and to develop crops with increased stress tolerance and improved yields. By improving understanding of RSA and the underlying pathways that shape it, researchers can leverage diverse root features to help plants respond to climate change and enhance crop yields (Smith and De Smet, 2012; Ibrahim et al., 2021). However, genetic studies focusing on RSA, especially of Brassica species, are limited compared with research on aboveground traits. Most of these studies were conducted in controlled environments, but have value since they enable the observation of RSA and the collection of intact roots (Wang et al., 2019). For example, the detection of overlapping quantitative trait loci (QTLs) for root traits under non-soil-based conditions alongside those influencing yield in the field suggested the relevance and applicability of the non-soil methods (Tuberosa et al., 2002; Wang et al., 2019).
The limited genetic studies on Brassica RSA have focused primarily on the important role of root morphology in enhancing the efficiency of phosphorus, boron, and nitrogen uptake in rapeseed (B. napus) (Yang et al., 2010; Shi et al., 2013; Zhang et al., 2016; Wang et al., 2017, 2019). Alcock et al. (2018) reported that in B. napus, the chromosomal regions associated with foliar phosphorus concentration harbor multiple genes that influence root development. Furthermore, homologs of three ABC transporter proteins implicated in root suberin synthesis exhibited co-localization with peaks associated with leaf nitrate and phosphorus levels. In another RSA study, Ahmad et al. (2023) identified 39 significant single nucleotide polymorphisms (SNPs) on Brassica chromosomes A04, A09, A10, C02, C03, C07, and C09 that were associated with RSA and biomass traits in 327 rapeseed accessions under low phosphorus conditions. Fletcher et al. (2016) also reported 20 QTLs on chromosomes A03, A10 and C02, associated with flowering time and root mass in a B. napus doubled haploid population, demonstrating their association with adaptation to drought.
Recently, we identified total root length (TRL/cm), total root surface area (TRSA/cm2), root average diameter (RAD/cm), number of tips (NTP), total primary root length (TPRL/cm), total lateral root length (TLRL/cm), total tertiary root length (TTRL/cm), and basal link length (BLL/cm) as significant RSA traits in the B. napus root system (Yang et al., 2024). The genomic regions controlling the observed phenotypic differences, however, were not determined. Genome-wide association studies (GWAS) is a method rooted in the concept of linkage disequilibrium (LD), which detects associations between genotypic and measured phenotypic data. This is achieved by examining differences in allele frequency of genetic variants within natural populations (Uffelmann et al., 2021). This approach offers notable advantages compared with traditional linkage-based association mapping (Gupta, 2016; Fredua-Agyeman et al., 2020). GWAS enable the exploration of a broader range of allelic diversity, providing enhanced resolution for analyzing various traits of interest. In addition, GWAS also offer the opportunity to examine genotypes across different crop species, eliminating the need for ancestry or pedigree data typically required in QTL mapping (Fredua-Agyeman et al., 2020).
In the present study, we assessed eight RSA traits in 379 accessions representing the six commercially important Brassica species, B. napus, B. juncea, B. carinata, B. oleracea, B. nigra, and B. rapa. Additionally, we identified the genomic regions associated with these key RSA traits through GWAS.
Materials and methods
Plant materials
Three hundred and forty-one genotypes, primarily landraces, were included in this study. These genotypes consisted of 68 B. napus, 64 B. juncea, 60 B. rapa, 66 B. nigra, 55 B. oleracea and 28 B. carinata accessions obtained from the Leibniz Institute of Plant Genetics and Crop Plant Research (IPK), Gatersleben, Germany (Supplementary Table 1). An additional 25 Canadian canola (B. napus) cultivars and the 13 hosts of the Canadian Clubroot Differential (CCD; Strelkov et al., 2018) were also included in the experiments. Accessions obtained from IPK were multiplied under greenhouse conditions at the Crop Diversification Centre North, Alberta Agriculture and Irrigation, Edmonton, Canada.
Growth conditions and RSA traits phenotyping
Plants were grown and phenotyped following Yang et al. (2024). In brief, 7-day-old seedlings that had been pre-germinated in Petri dishes were moved to a semi-hydroponic system. This system comprised rolls of germination paper (Anchor Paper Company, St. Paul, USA) placed in 2 L beakers filled with 1 L of half-strength Hoagland’s No. 2 Basal Salt Mixture solution (Sigma-Aldrich Co., Ontario, Canada). The seedlings were maintained in a growth chamber under a 16 h photoperiod at 20°C (day)/18°C (night) and removed from the germination paper after 14-days to measure RSA traits (Yang et al., 2024). The roots of each plant were severed, arranged on a scanning tray, and gently spread apart using forceps. Subsequently, root scans were performed using an EPSON Perfection V800 scanner (Epson, Markham, ON). The analysis was done with the aid of WinRHIZO™ software (Regent Instruments Inc., Quebec, Canada), employing the linkage analysis for root and background detection. Twenty-nine RSA-related traits were recorded per root scan, only eight of which showed significant variation within and among genotypes and hence were employed for GWAS (Yang et al., 2024). The eight traits included (1) total root length (TRL/cm), (2) total surface area of roots (TRSA/cm2), (3) root average diameter (RAD/cm), (4) number of tips (NTP), (5) total primary root length (TPRL/cm), (6) total lateral root length (TLRL/cm), (7) total tertiary root length (TTRL/cm), and (8) basal link length (BLL/cm). The experiment was performed four times, with each experiment consisting of four replicates.
Statistical analyses
Analysis of the RSA traits data was conducted with R 4.0.2: A Language and Environment for Statistical Computing (R Foundation for Statistical Computing, Vienna, Austria). Because repetition × treatment was not significant (p-value ranging from 0.86 to 0.95), the data were pooled across the four repeats of the experiment. Duncan’s multiple range test (Duncan, 1955) and the bar plot of each trait were generated to test (p-value ≤ 0.05) for differences in the mean root trait values among the six Brassica species. The Anderson-Darling test (Anderson and Darling, 1954) was performed to test the normality of the eight traits. The Spearman rank-based variable correlation test (Conover, 1971) was conducted using the cor function to determine the correlation among root traits (p-value ≤ 0.05). Principal component analysis (PCA) (Pearson, 1901) was carried out using the prcomp function on the eight variables.
SNP genotyping
SNP genotyping was conducted on 313 of the 379 Brassica accessions, excluding the 66 B. nigra accessions, using the Brassica 19K SNP array from TraitGenetics GmbH (Gatersleben, Germany), according to the manufacturer’s instructions. This array comprised 9,310 SNP markers on the A-genome, 8,072 SNP markers on the C-genome, and 1,154 SNP markers on scaffolds. None of the markers on the array was from the B-genome, and hence the B. nigra accessions were not genotyped. After discarding monomorphic, low coverage site markers, markers with MAF ≤ 0.05 and those missing data for > 5% of the accessions, 6,213 SNP markers, comprising 5,103 A-genome and 1,110 C-genome markers, were used for GWAS. The average inter-SNP marker distance was determined for each chromosome.
Linkage disequilibrium estimation
The non-random occurrence of genetic variants among the RSA traits detected as LD between alleles at different loci was estimated using Pearson’s squared correlation coefficient (r2) statistic with TASSEL 5 v5.2.2.5 (Bradbury et al., 2007). The decay and extent of LD was determined by calculating the Chi-square (χ2) statistic for each SNP pair following Fredua-Agyeman et al. (2020). In brief, the r2 -values of significant (p-value ≤ 0.001) SNP marker pairs was plotted against the physical distance (in megabases (Mb)) for each chromosome using the PROC GPLOT procedure in SAS v. 9.4 (SAS Institute, Cary NC, North Carolina, U.S.). The PROC TRANSREG function in SAS was then used to obtain an LD decay curve for each chromosome. Additionally, the intersection between the fitted curve and the r2-value threshold line were determined and projected onto the physical distance axis to obtain the average extent of LD for each chromosome (Breseghello and Sorrells, 2006; Bellucci et al., 2015).
Bayesian population structure analysis
The population structure was determined based on the method of Yu et al. (2021). In brief, a series of STRUCTURE analyses were run using the admixture and allele frequency correlated models, with burn-in lengths ranging from 5,000 to 100,000 iterations and Markov Chain Monte Carlo (MCMC) run lengths from 5,000 to 100,000 permutations, using STRUCTURE v2.3.4 (Pritchard et al., 2000). Runs for each cluster (K = 1–10) were replicated 10 times. The number of clusters was determined using the ΔK statistics of Evanno et al. (2005), and the MedMedK, MedMeaK, MaxMedK and MaxMeaK statistics of Puechmaille (2016) and Li and Liu (2018). The many STRUCTURE runs were required to reach the convergence necessary for accurate determination of the population structure in the GWAS (Yu et al., 2021).
Genome-wide association studies
According to the criteria outlined by Yu et al. (2021), two general linear models (GLM), comprising PCA-only and Q-only, and four mixed linear models (MLM), including Q+D, Q+K, PCA+D and PCA+K implemented in TASSEL 5.0 (Bradbury et al., 2007), were tested in the marker-trait association studies, using the 6,213 SNP marker data and mean ID values of each of the eight RSA traits. For each model, significant markers associated with an RSA trait were determined only if the least amount of deviation from the expected −log10 p-value was observed in the quantile-quantile (Q-Q) plot. Manhattan plots were generated to represent the major marker-trait associations (MTAs). Significant SNP markers associated with the RSA traits were identified using the Bonferroni correction, i.e., p-value cut-off at 0.05/total number of markers (Benjamini and Hochberg, 1995). Stable MTAs detected by the different models and pleiotropic SNPs associated with the different RSA traits were considered credible.
Identification of candidate genes
To identify candidate genes associated with significant SNP markers, the SNP sequences were used in BLASTN searches of B. rapa (AA), B. oleracea (CC), B. napus (AACC), and Arabidopsis thaliana genome assemblies in the EnsemblPlants (https://plants.ensembl.org/Multi/Tools/Blast) and National Centre for Biotechnology Information (https://blast.ncbi.nlm.nih.gov/Blast.cgi) databases. The physical locations of genes meeting an E-value ≤ 1e-20 and a percentage identity of ≥ 95% were mapped to the reference genomes.
Results
Phenotypic variation for RSA traits
The phenotypic variation in the eight RSA traits for the six Brassica species is presented in Table 1. Based on the measurements, the eight RSA traits were significantly different (p-value ≤ 0.05) among the Brassica genotypes tested. For example, TTRL ranged from 0.35 cm per plant for accession FG1063 (B. juncea) to 123.69 cm per plant for FG 643 (B. oleracea), while NTP ranged from 20 per plant for accession FG1063 (B. juncea) to 2,753 per plant for L345PC (a commercial canola cultivar) (Table 1). The coefficients of variation (%) for TTRL, NTP, TRSA, TLRL, TRL, BLL, TPRL, and RAD were 124.55, 92.26, 70.54, 70.13, 65.52, 62.01, 39.30, and 33.25, respectively (Table 1).
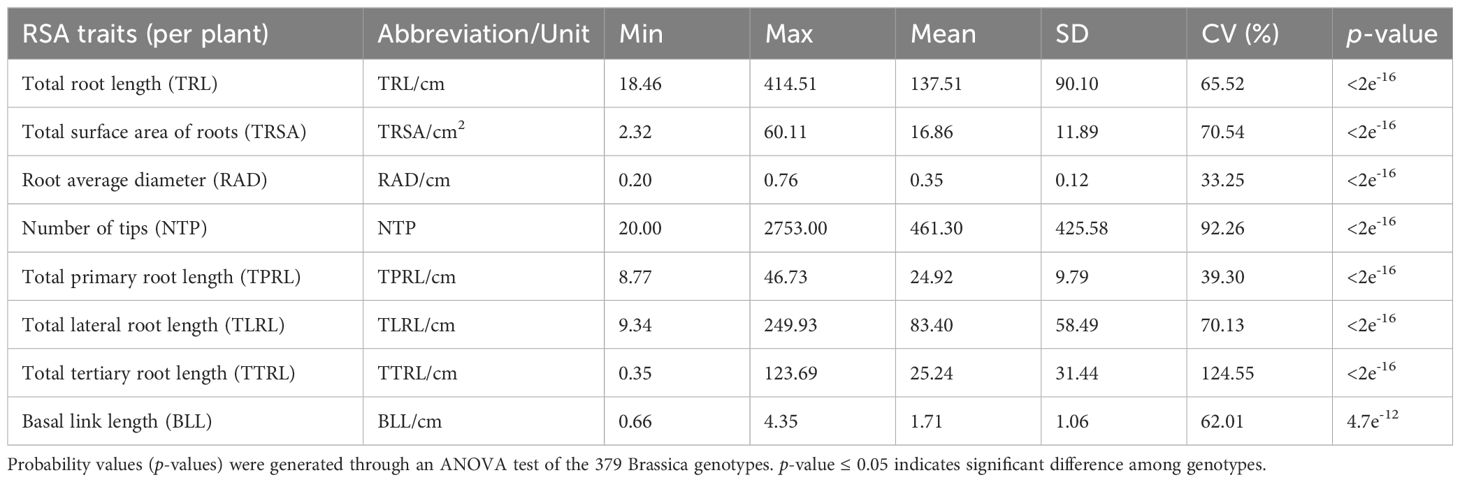
Table 1 Summary and phenotypic variation of eight root system architecture (RSA) traits in a collection of 379 Brassica genotypes representing B. napus, B. oleracea, B. rapa, B. nigra, B. carinata, and B. juncea.
The 379 Brassica genotypes in this study were divided into three groups based on their root sizes according to the criteria of Liu et al. (2021). Based on a median TRL value of 137.52 cm per plant ± 2 standard errors (SE) of 7.53, 177 accessions were classified as having large-sized roots (TRL >130.52 cm), 29 accessions were identified as having medium-sized roots (TRL ranging from 115.45 to 130.52 cm), and 173 genotypes were deemed as having small-sized root systems (TRL <115.45 cm) (Supplementary Table 1).
Correlation analysis between selected RSA traits
The Anderson-Darling test showed that all eight parameters were not normally distributed (p-value < 2.2e-16). A Spearman rank-based variable correlation test indicated that TRL, TRSA, and TLRL were highly and positively correlated with each other, with coefficient values ranging from 0.80 to 0.96 (p-value ≤ 0.05) (Figure 1). Relatively high positive correlations were also observed among TRL, TRSA, TLRL, TTRL, and NTP, with coefficients ranging from 0.52 to 0.76 (p-value ≤ 0.05), while moderate positive correlations existed among TPRL, TTRL, and NTP (coefficients ranging from 0.40 to 0.47, p-value ≤ 0.05) (Figure 1).
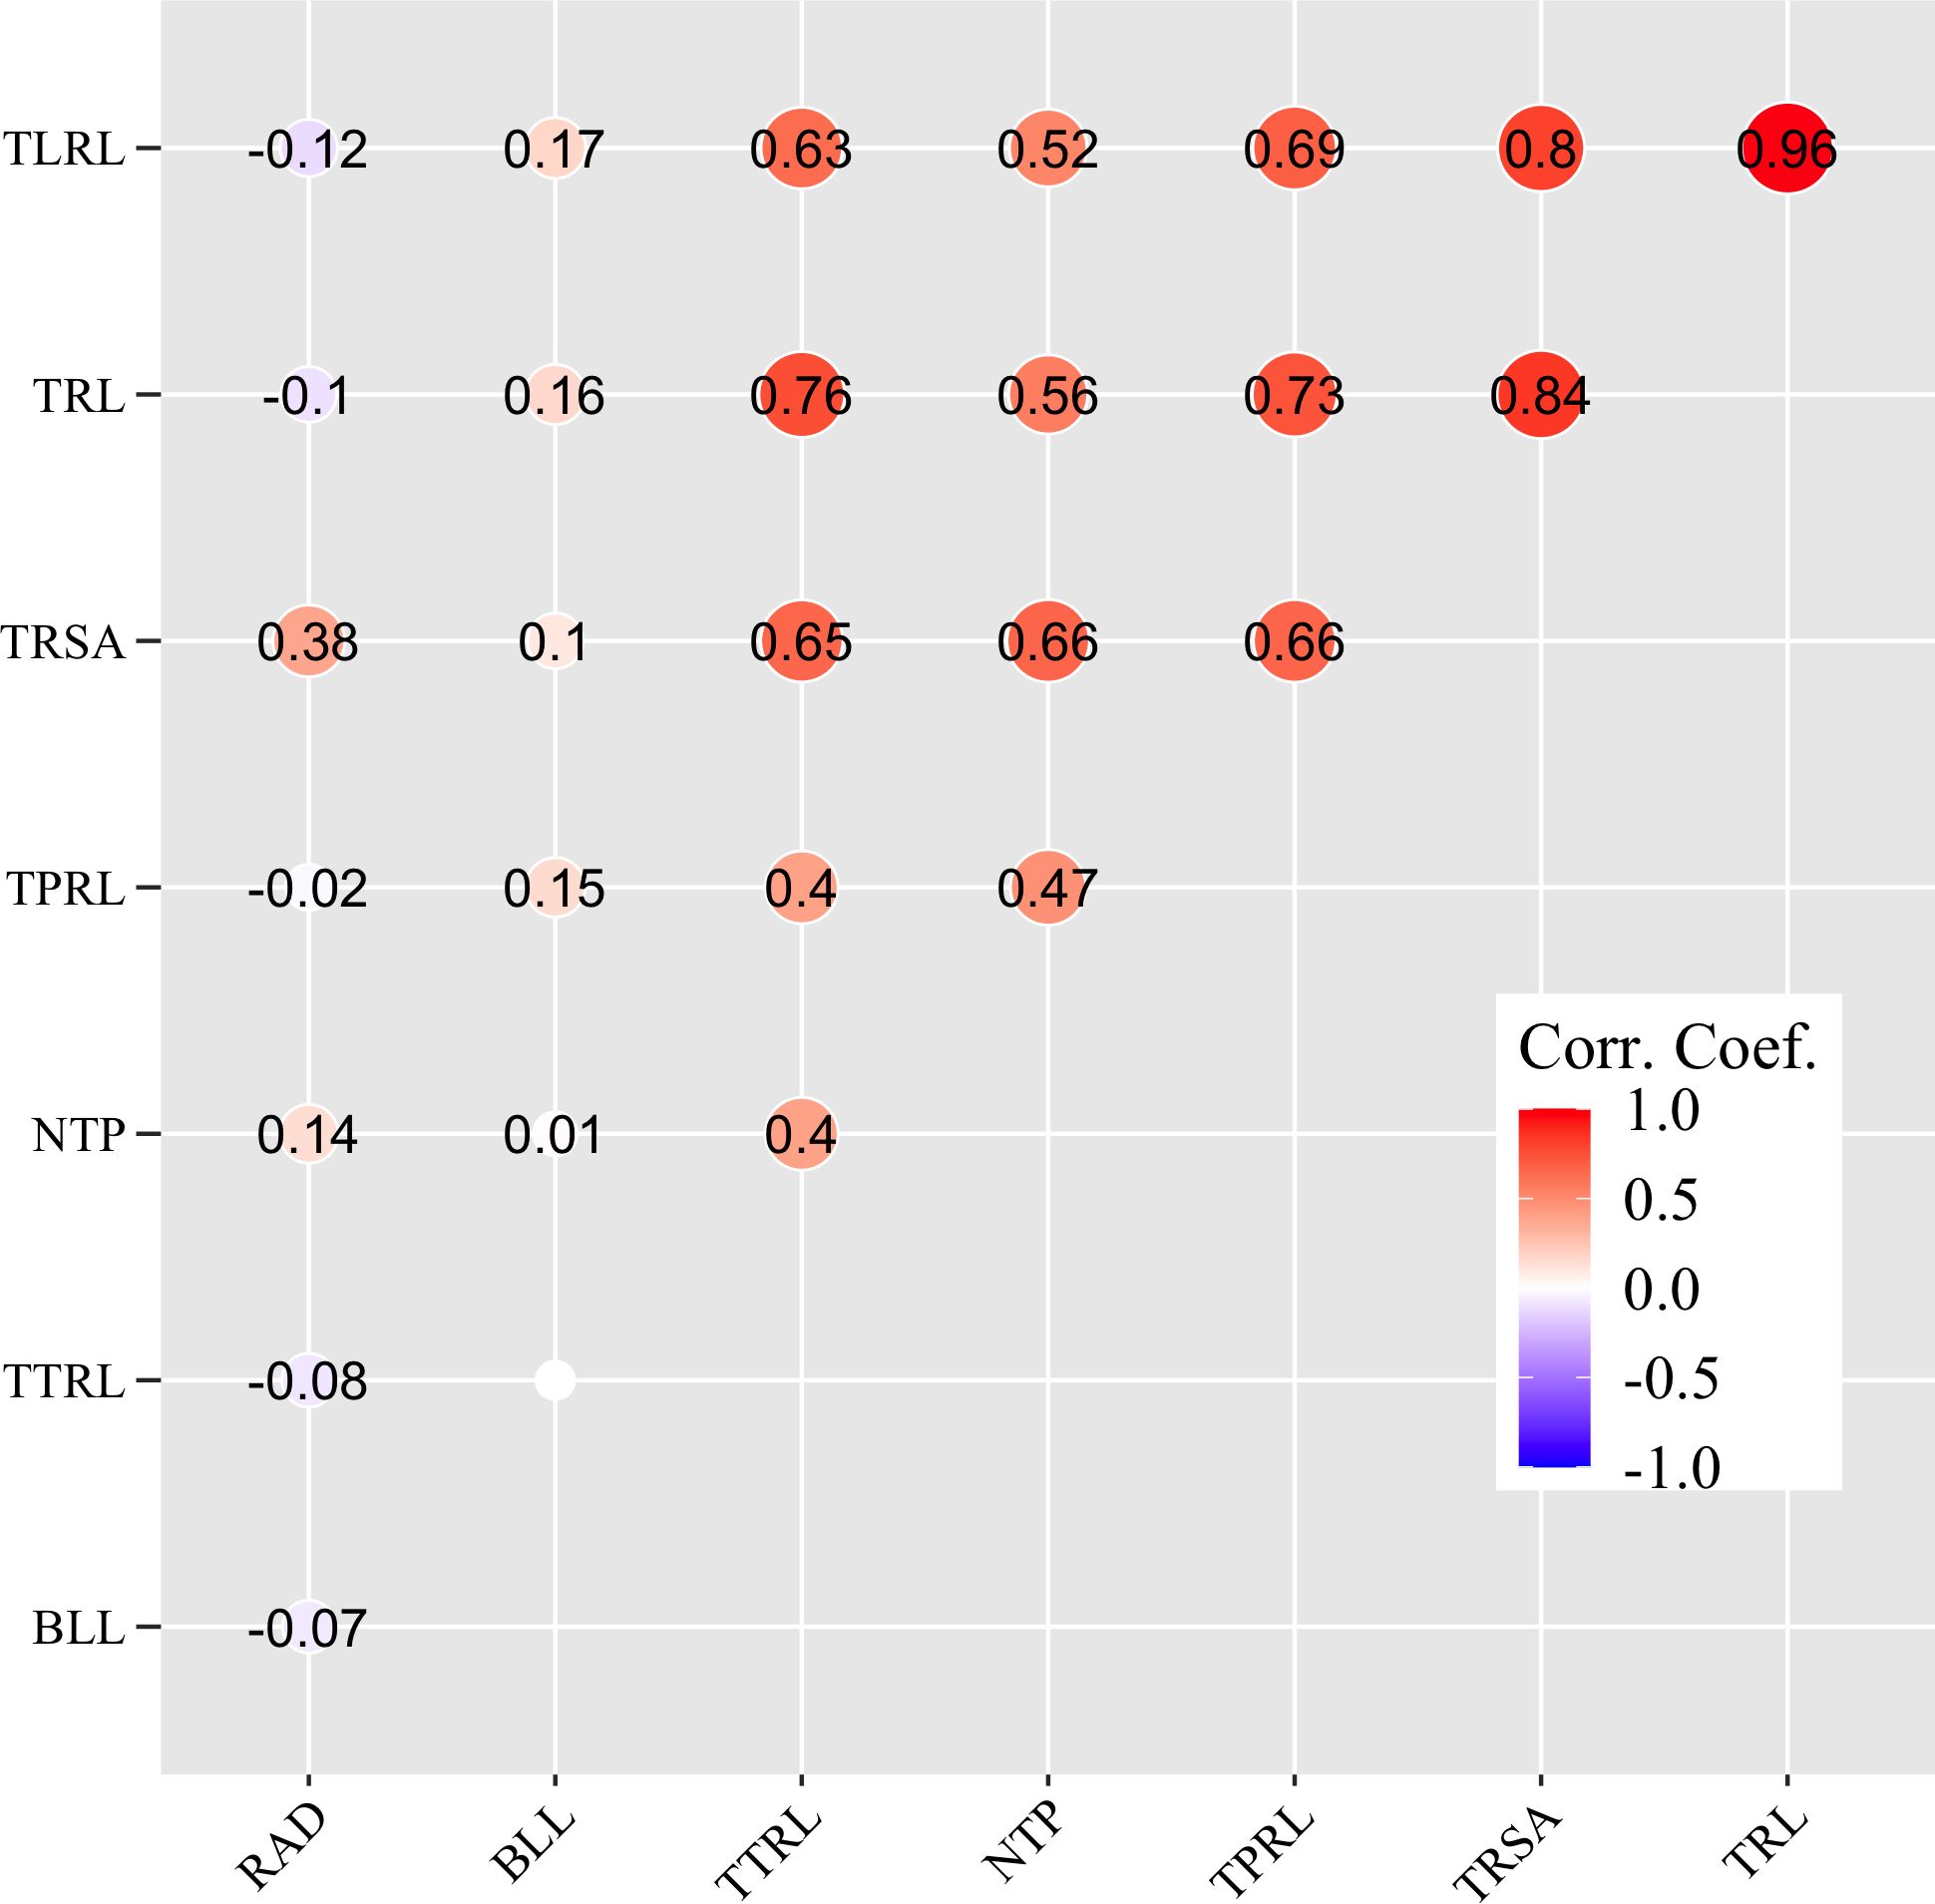
Figure 1 Correlation analysis between eight root system architecture traits as determined by a Spearman rank-based variable correlation test. Traits include total root length (TRL/cm), total surface area of roots (TRSA/cm2), root average diameter (RAD/cm), number of tips (NTP), total primary root length (TPRL/cm), total lateral root length (TLRL/cm), total tertiary root length (TTRL/cm), and basal link length (BLL/cm). ‘Corr. Coef.’ denotes the coefficient values of the correlation, with the strength of the correlation indicated in different colors. 0.0, no significant correlation (p-value > 0.05).
Comparisons among the six Brassica species
The PCA indicated that TRL, TRSA, TLRL, and TPRL accounted for 70.5% (PC1 = 53.0% and PC2 = 17.5%) of total genotypic variation for all RSA traits (Supplementary Figure 1). A biplot of the PCA indicated that TRL was the most important trait, followed by TRSA, TLRL, and TPRL (Supplementary Figure 2). The distribution of the six Brassica species based on the contribution coefficient of the eight traits is illustrated in the biplot of the PCA (Figure 2). Brassica oleracea showed the greatest variation in the eight RSA traits relative to the other species. As a result, the B. oleracea accessions were widely dispersed in the biplot of the PCA, although most were located on the right-hand side (Figure 2). Similarly, most of the B. napus accessions were located on the right-hand side of the biplot, indicating large RSA trait variations comparable with those observed in the B. oleracea accessions (Figure 2). Most of the B. juncea, B. nigra, B. rapa, and B. carinata accessions were located on the left-hand side of the PCA biplot (Figure 2). This suggests that B. juncea, B. nigra, B. rapa, and B. carinata have comparable RSA traits and complexity. Therefore, B. napus, and B. oleracea possessed the largest and most complex root systems among the six Brassica species.
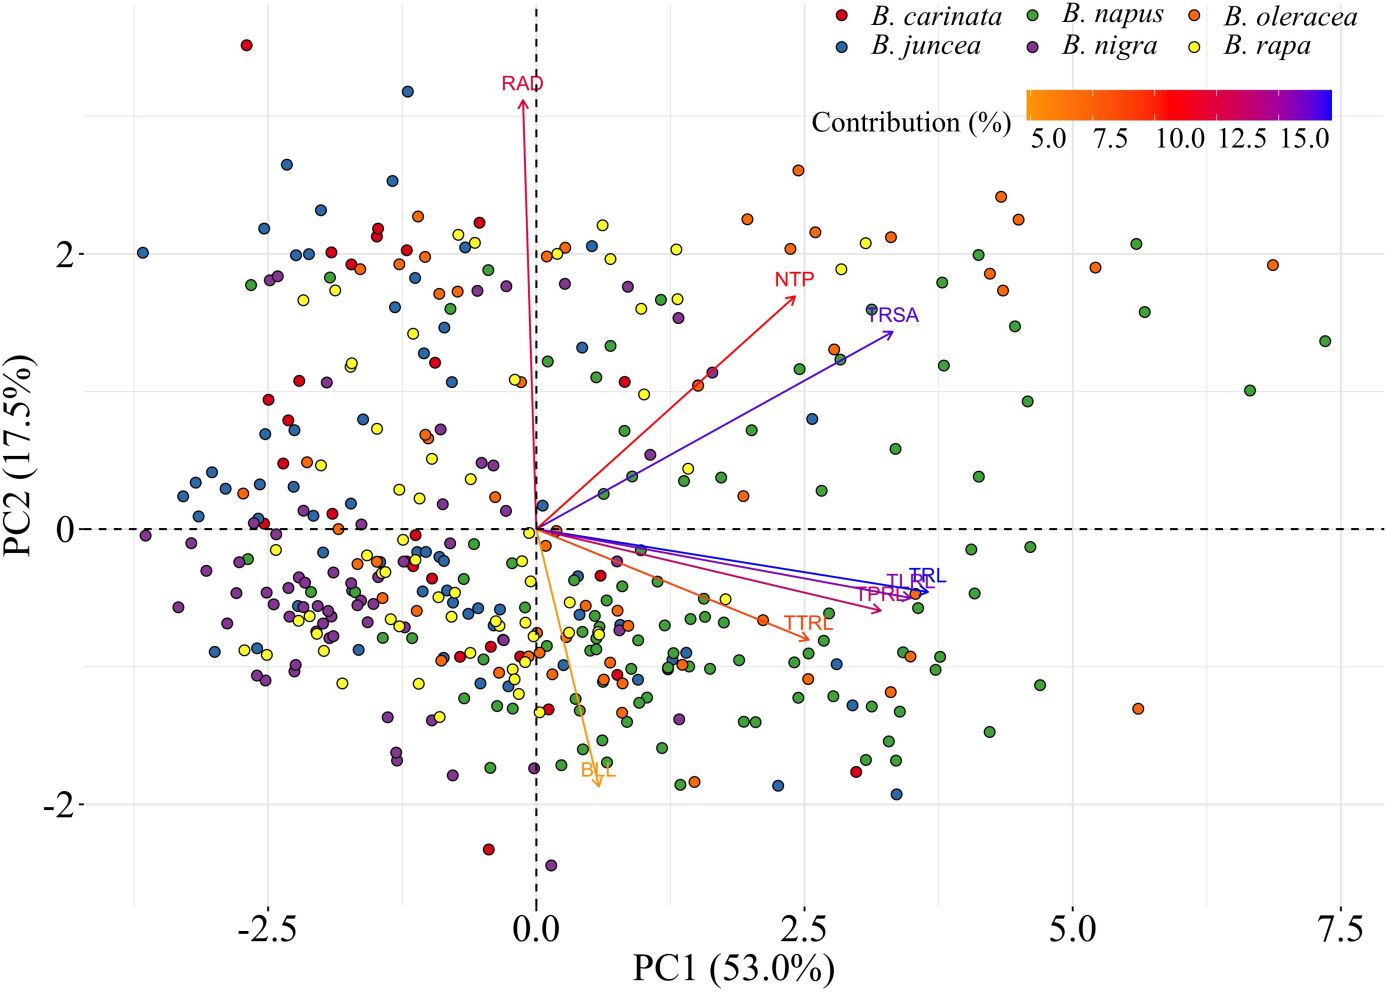
Figure 2 Principal components analysis (PCA) biplot among six Brassica species including B. napus, B. oleracea, B. rapa, B. nigra, B. carinata, and B. juncea. Traits include total root length (TRL/cm), total surface area of roots (TRSA/cm2), root average diameter (RAD/cm), number of tips (NTP), total primary root length (TPRL/cm), total lateral root length (TLRL/cm), total tertiary root length (TTRL/cm), and basal link length (BLL/cm). The different species are indicated by different colors. With the increase of PC1, most of the values of the root system architecture (RSA) traits increased, except for RAD. With the increase of PC2, RAD, NTP, and TRSA increased, while values of other traits decreased. Most of the B. juncea, B. nigra, B. rapa, and B. carinata genotypes are located in a cloud on the left side of the biplot, while most B. napus and B. oleracea genotypes are located on the right side of the biplot with relatively larger values for the root traits. This suggests that B. napus and B. oleracea have relatively larger root systems.
Duncan’s test of the eight RSA traits led to conclusions similar to the findings in the PCA biplot (Table 2). Brassica napus and B. oleracea exhibited relatively greater values of TRL, TRSA, NTP, TPRL, TLRL, and TTRL (Table 2, Figure 3), again indicating larger and more complex root systems than the other species. Brassica juncea and B. carinata did not show significant differences for seven out of eight parameters (except for NTP). In addition, B. juncea and B. carinata had the largest RAD compared with the other species (Table 2, Figure 3), indicating that their roots were thicker, possibly due to lower numbers of fine roots (root diameter < 0.2 cm). Among all species, B. nigra had the lowest values for six of the eight RSA traits examined (the only exceptions being NTP and BLL), suggesting that this species had the smallest root system. There were no significant differences observed for BLL in B. juncea, B. napus, B. rapa, B. carinata, or B. nigra, while this trait was lowest in B. oleracea (Table 2, Figure 3).
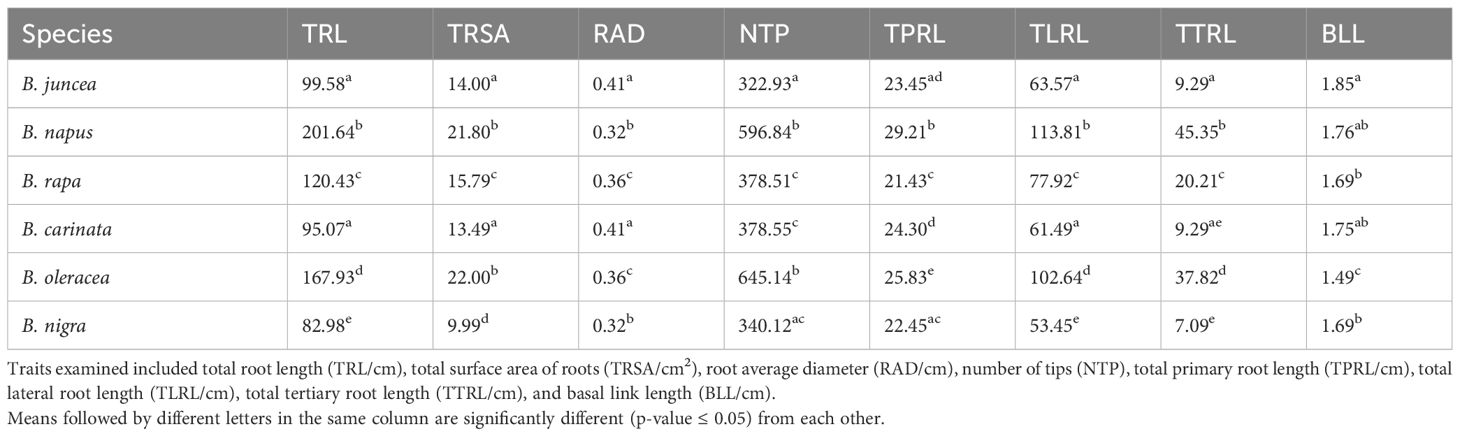
Table 2 Least square means of eight root system architecture traits among six Brassica species, B. napus, B. oleracea, B. rapa, B. nigra, B. carinata, and B. juncea, based on Duncan’s test.
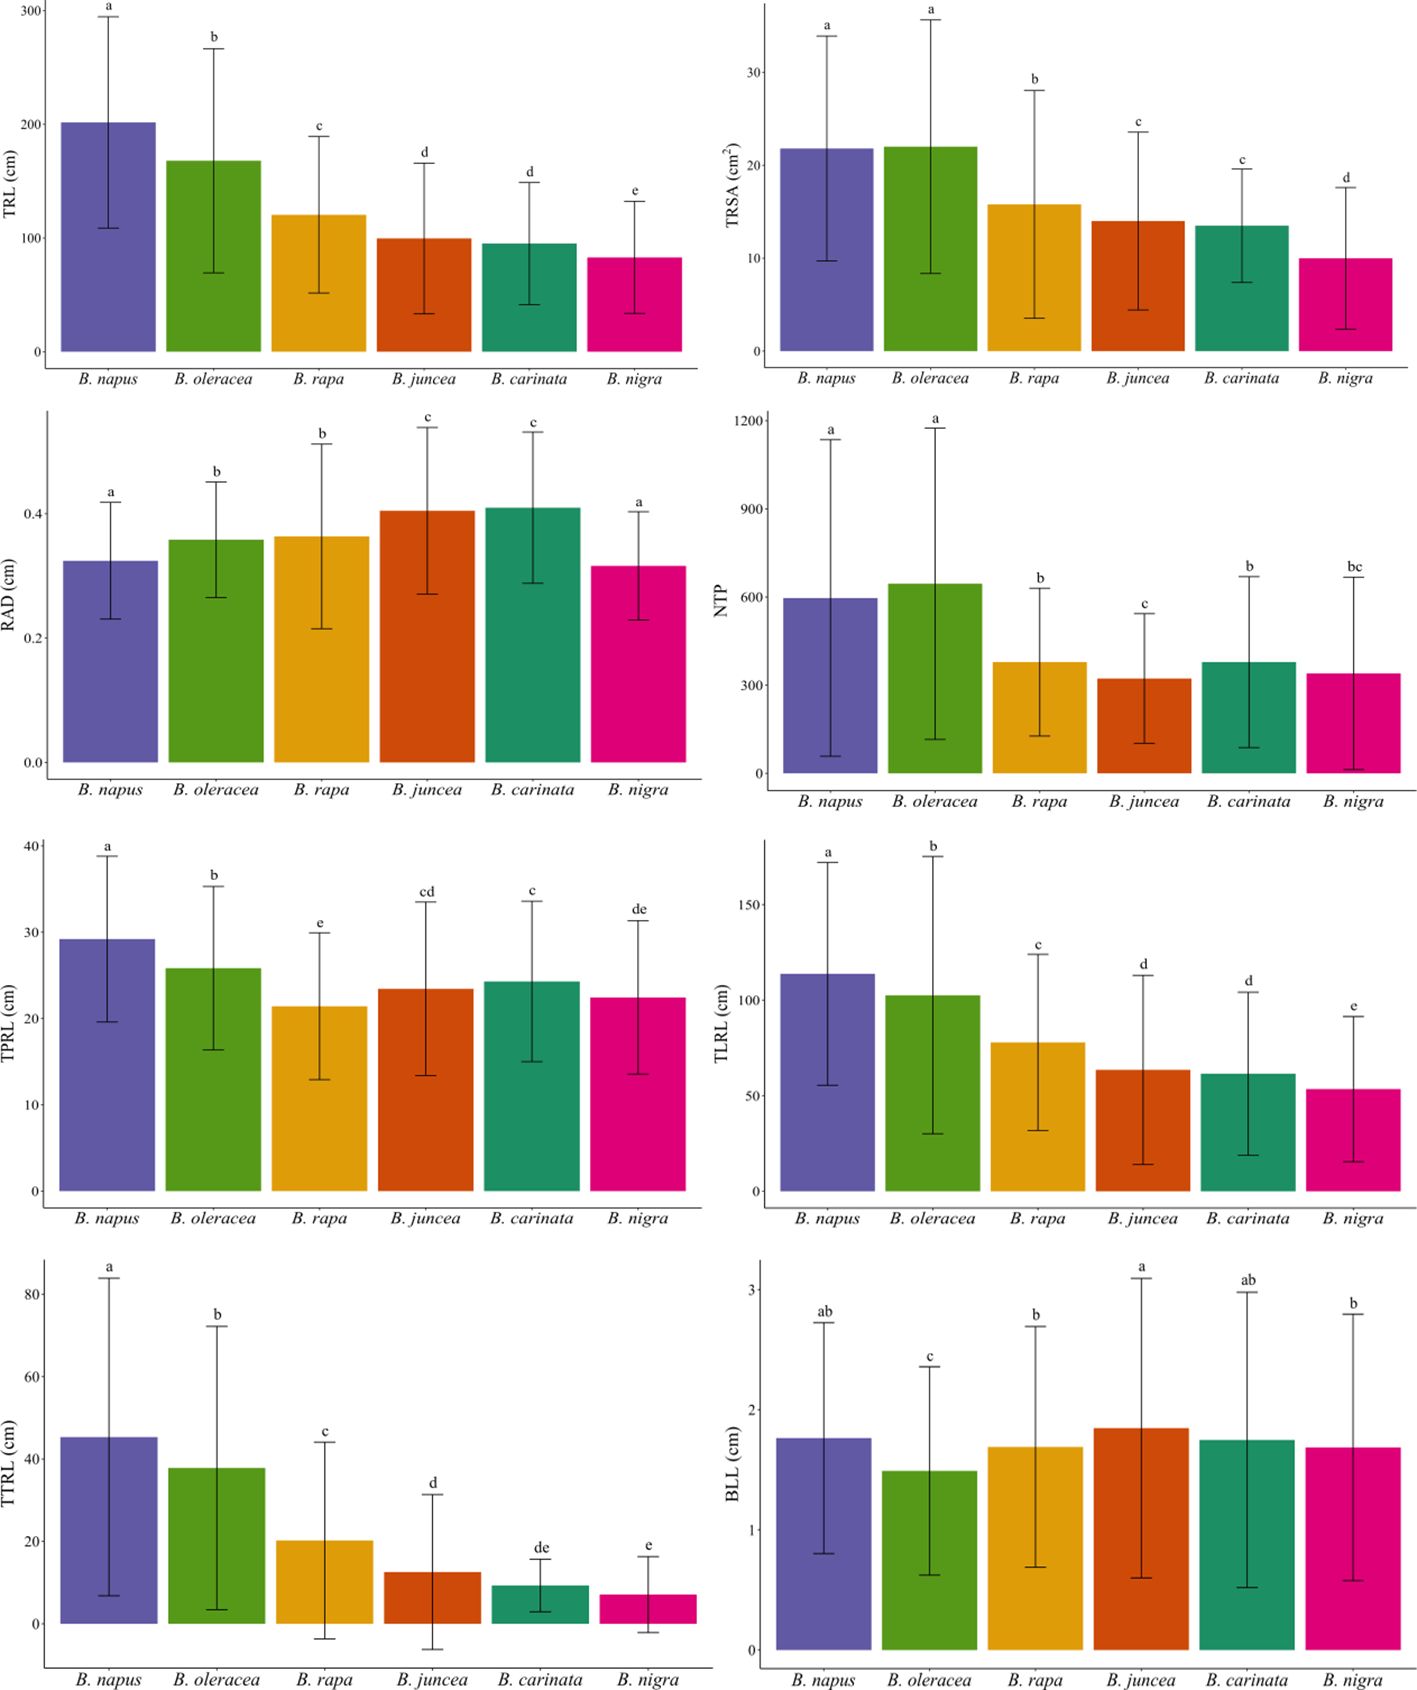
Figure 3 Bar plot of eight root system architecture traits among six Brassica species. B. napus, and B. oleracea had a relatively greater total root length (TRL/cm), total surface area of roots (TRSA/cm2), root average diameter (RAD/cm), number of tips (NTP), total primary root length (TPRL/cm), total lateral root length (TLRL/cm), and total tertiary root length (TTRL/cm), and basal link length (BLL/cm). In general, values for six of the eight traits (except for NTP and BLL) were lowest in B. nigra. Different letters indicate significant differences.
Comparisons of RSA traits within the Six Brassica species
Based on TRL, the root sizes of the six Brassica species were of the order: B. napus (87% large, 5% medium, and 8% small) (Figure 4A) > B. oleracea (63% large, 9% medium, and 28% small) (Figure 4E) > B. rapa (40% large, 11% medium, and 49% small) (Figure 4C) > B. juncea (24% large, 6% medium, and 70% small) (Figure 4B) > B. carinata (14% large, 14% medium, and 72% small) (Figure 4F) > B. nigra (12% large, 6% medium, and 82% small) (Figure 4D). These results were consistent with results from PCA described above.
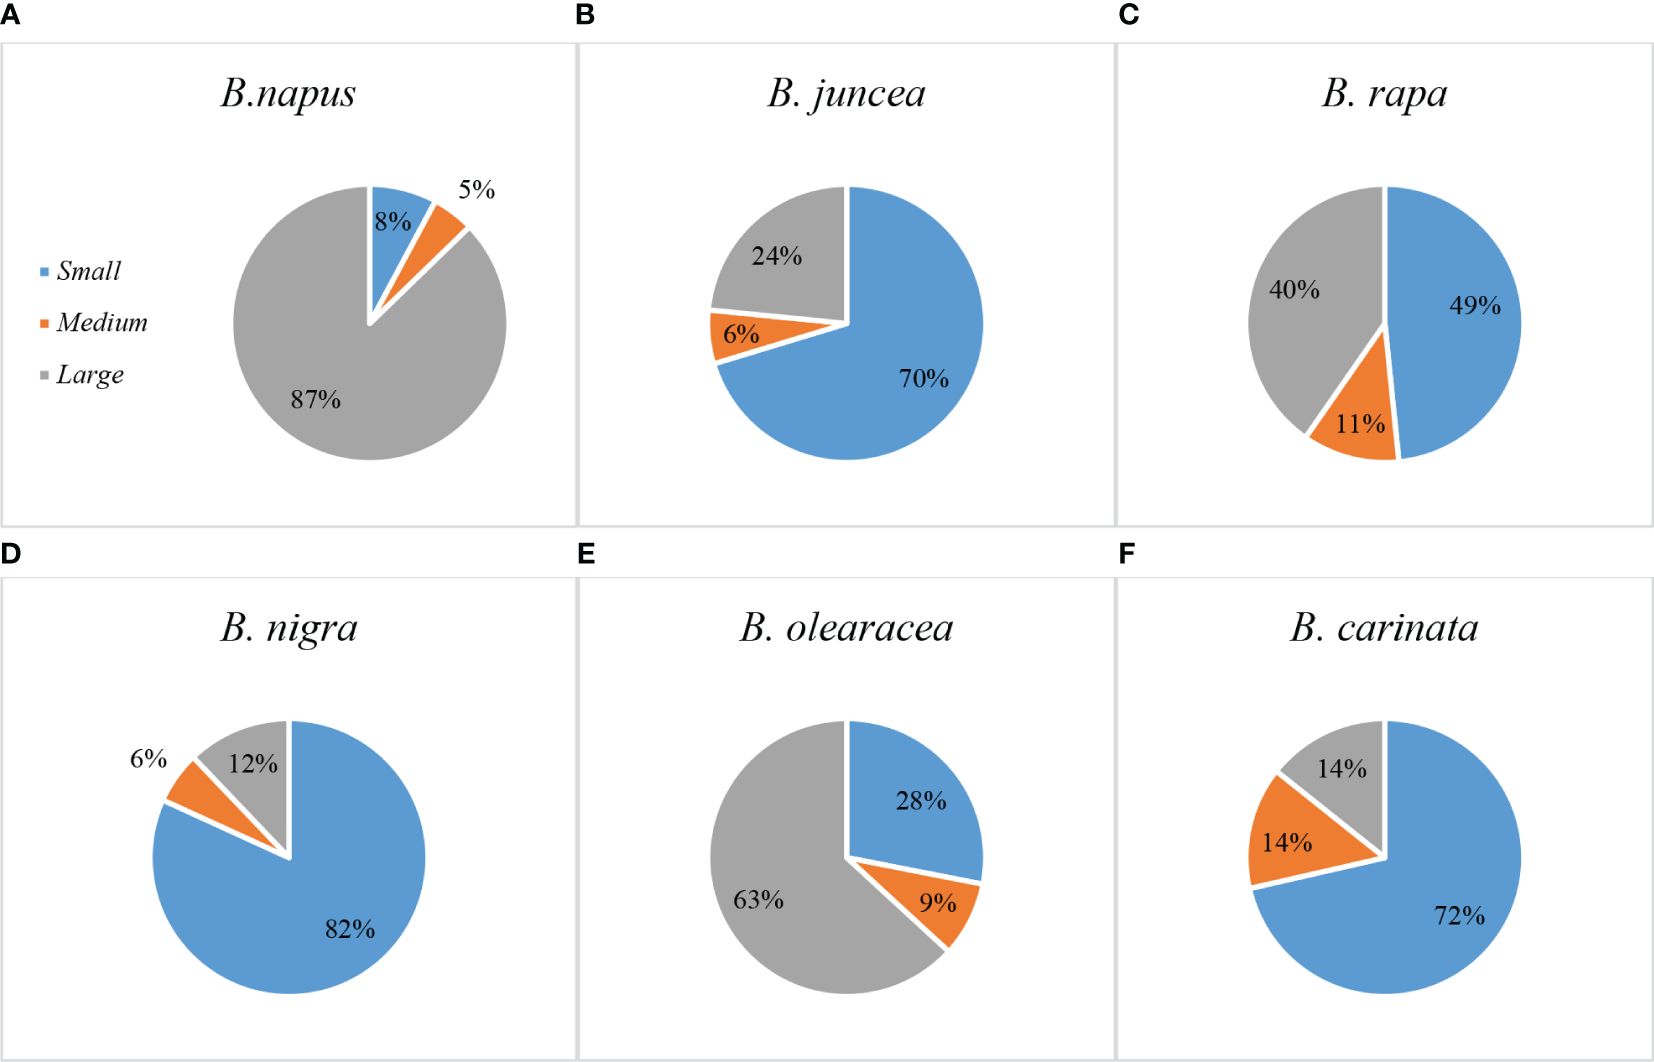
Figure 4 Percentage of genotypes with small, medium, or large sized root systems in six Brassica species – (A) B. napus, (B) B. juncea, (C) B. rapa, (D) B. nigra, (E) B. oleracea, and (F) B. carinata. Most B. napus and B. oleracea genotypes had larger-sized root systems, while most B. juncea, B. rapa, B. nigra, and B. carinata genotypes had smaller-sized root systems. Genotypes with medium-sized root system represented the smallest percentage for all the species. .
SNP genome coverage and marker density
The plots of correlation coefficient (r2) and physical distance (in Mb) for SNP markers on chromosomes A and C are presented in Supplementary Figure 6. The mean number of filtered SNP markers was 510.3 ± 152.5 (range of 359 to 808) on the A-genome and 123.3 ± 34.0 (range of 88 to 190) on the C-genome. The filtered set of 5,103 and 1,110 markers covered 302,504.3 kilobases (kb) and 452,763.7 kb of the A- and C-genomes, respectively (Table 3). The mean inter-SNP marker distance or density for the A-genome was 62.9 ± 20.1 kb (range of 38.1 to 106.8), while for the C-genome it was 426.3 ± 106.9 kb (range 324.4 to 663.5) (Table 3). Thus, the marker density on the A-genome was about 7× higher than on the C-genome.
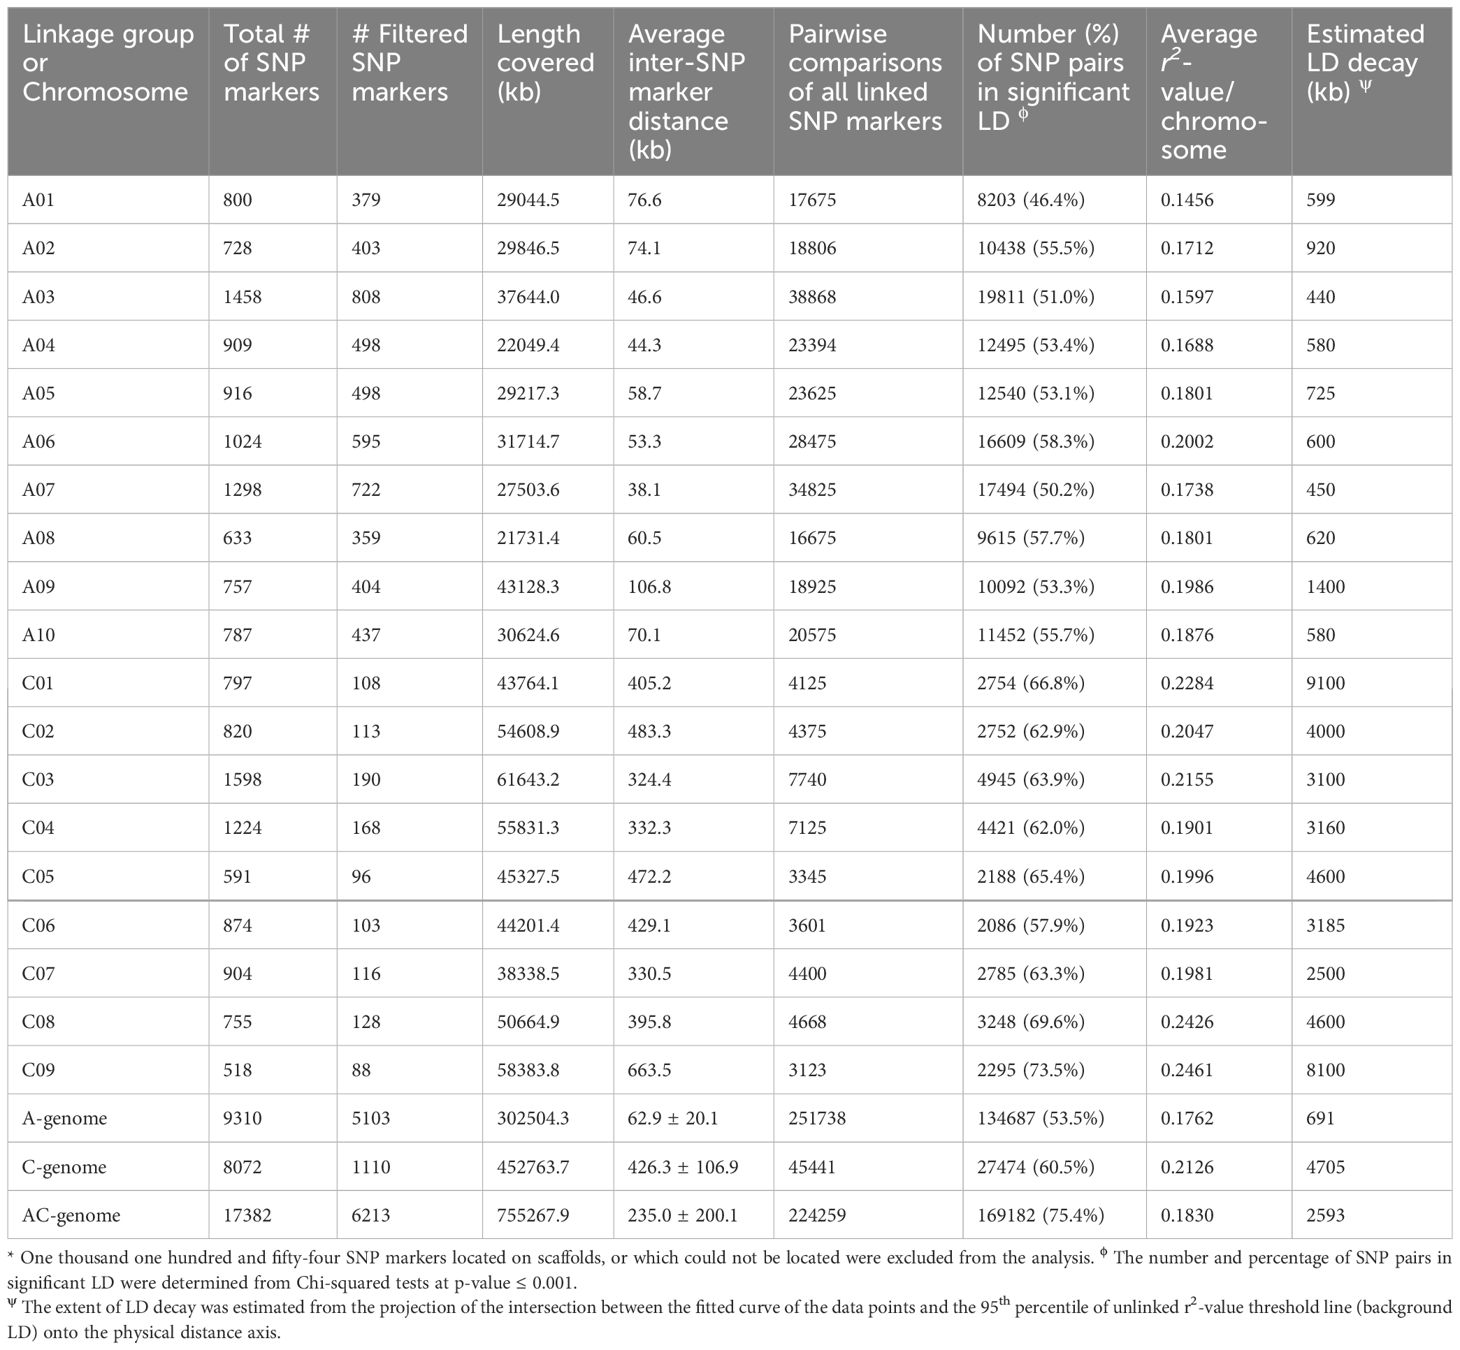
Table 3 Single nucleotide polymorphism (SNP) marker density and extent of intra-chromosomal linkage disequilibrium (LD) on A-, C- and AC- genome used in genome-wide association studies for the determination of root architecture traits.
Estimation of linkage disequilibrium
The average values of r2 and the schematic representation of decay for all chromosomes are presented in Table 3. Significant variation in the LD among chromosomes and between the A- and C-genomes was observed. The mean r2-value was 0.1762 ± 0.0168 (range of 0.1456 to 0.2002) for the A-genome, and 0.2126 ± 0.0213 (range 0.1901 to 0.2461) for the C-genome (Table 3). The average r2-value for the entire genome was 0.1830. Similarly, the estimated mean LD decay for the A-genome was 691.4 ± 283.6 kb (range of 440 to 1,400), while for the C-genome it was 4,705.0 ± 2,331.8 kb (range of 2,500 to 9,100); the mean LD decay was 2,592.6 ± 2,587.6 kb for the entire genome (Table 3). Thus, the LD decay for the A-genome was in the hundreds of kilobases, while it persisted for several thousands of kilobases for the C-genome.
Population structure
Population structure analyses were conducted to comprehend the population stratification for the GWAS. ΔK statistic values from STRUCTURE analyses runs with fewer than 10,000 burn-in iterations and 10,000 MCMC lengths suggested that the Brassica accessions could be grouped into three or six clusters, while runs with 20,000, 50,000, and 100,000 burn-in iterations and MCMC lengths consistently indicated three clusters. The population structure determined with the Puechmaille (2016) and Li and Liu (2018) alternative statistics (MedMedK, MedMeaK, MaxMedK and MaxMeaK) indicated three clusters for all STRUCTURE runs (Figure 5). Based on a threshold of 70%, all commercial cultivars and the B. napus accessions clustered in group 1, all B. juncea accessions clustered in group 2, and the B. rapa accessions (except ECD 05) clustered in group 3. The B. oleracea and B. carinata accessions were classified as admixtures, dispersed in clusters 1 and 2.
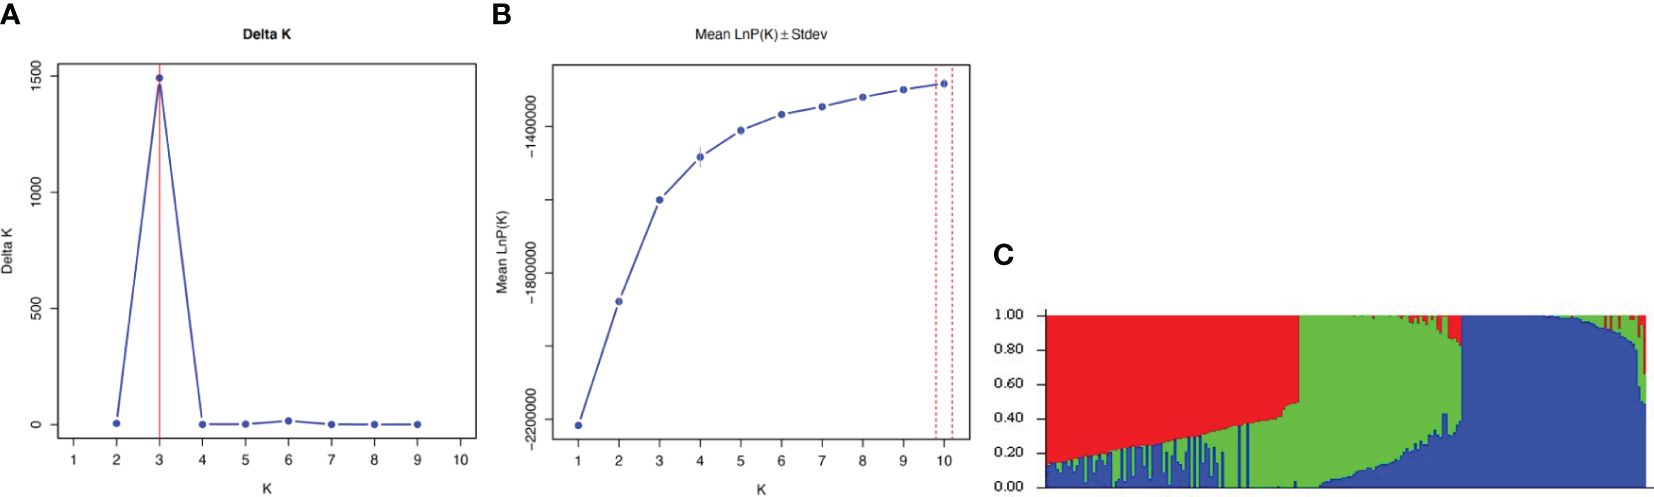
Figure 5 Bayesian cluster analysis of 313 Brassica accessions representing five species, including B. napus, B. oleracea, B. rapa, B. carinata, and B. juncea, estimated with STRUCTURE based on 6,213 SNP markers using 50,000 burn-in iterations and Markov Chain Monte Carlo (MCMC) lengths. The value of K determined following Evanno et al. (2005), and the population structure determined with the Puechmaille (2016) and Li and Liu (2018) alternative, indicated three clusters for all runs (A, B). Detailed Bayesian clustering of the 313 accessions is shown in (C), with each colour represents one ancestry component. The simplified view suggests three ancestral populations. The clusters were obtained based on the standard 70% threshold of similarity with STRUCTURE software (e.g., Yu et al., 2021). Genotypes not meeting this threshold were classified as admixtures or not belonging to any of the groups (Yu et al., 2021).
Significant marker-RSA trait associations
The Quantile-Quantile plots for the eight RSA traits across the six models are presented in Supplementary Figure 3, while Supplementary Figure 4 displays the individual plots for each trait. The PCA + K model showed the smallest deviation between the observed and expected values in the Q-Q plots. Therefore, the Manhattan plots for this model were used to identify the significant MTAs (Figure 6). Manhattan plots for all other models are presented in Supplementary Figure 5. Based on GWAS, 79 significant SNP markers were detected for the eight RSA traits. These comprised 6, 9, 26, 16, 12, and 6 SNP markers that were significantly associated with TRL, TRSA, RAD, TPRL, TTRL, and BLL, respectively (Table 4). Two markers, Bn_scaff_16414_1_p539478 and Bn_scaff_16514_1_p41089, were found to be co-associated with TPRL and TRL, while two other markers, Bn_A03_p5039586 and Bn_A06_p17049401, were co-associated with TTRL and TRL. No SNP markers were associated with NTP or TLRL. The number of significant markers and their chromosomal locations are presented in Table 4. Sixty-five of the MTAs were located on the A-genome, while 14 were located on the C-genome. The number of significant markers on chromosomes A01 to A10 was 6, 8, 9, 8, 2, 8, 5, 5, 12, and 2, respectively, while the number on chromosomes C01 to C09 (excluding chromosome C06) was 1, 3, 1, 1, 2, 1, 3, and 2, respectively (Table 4).
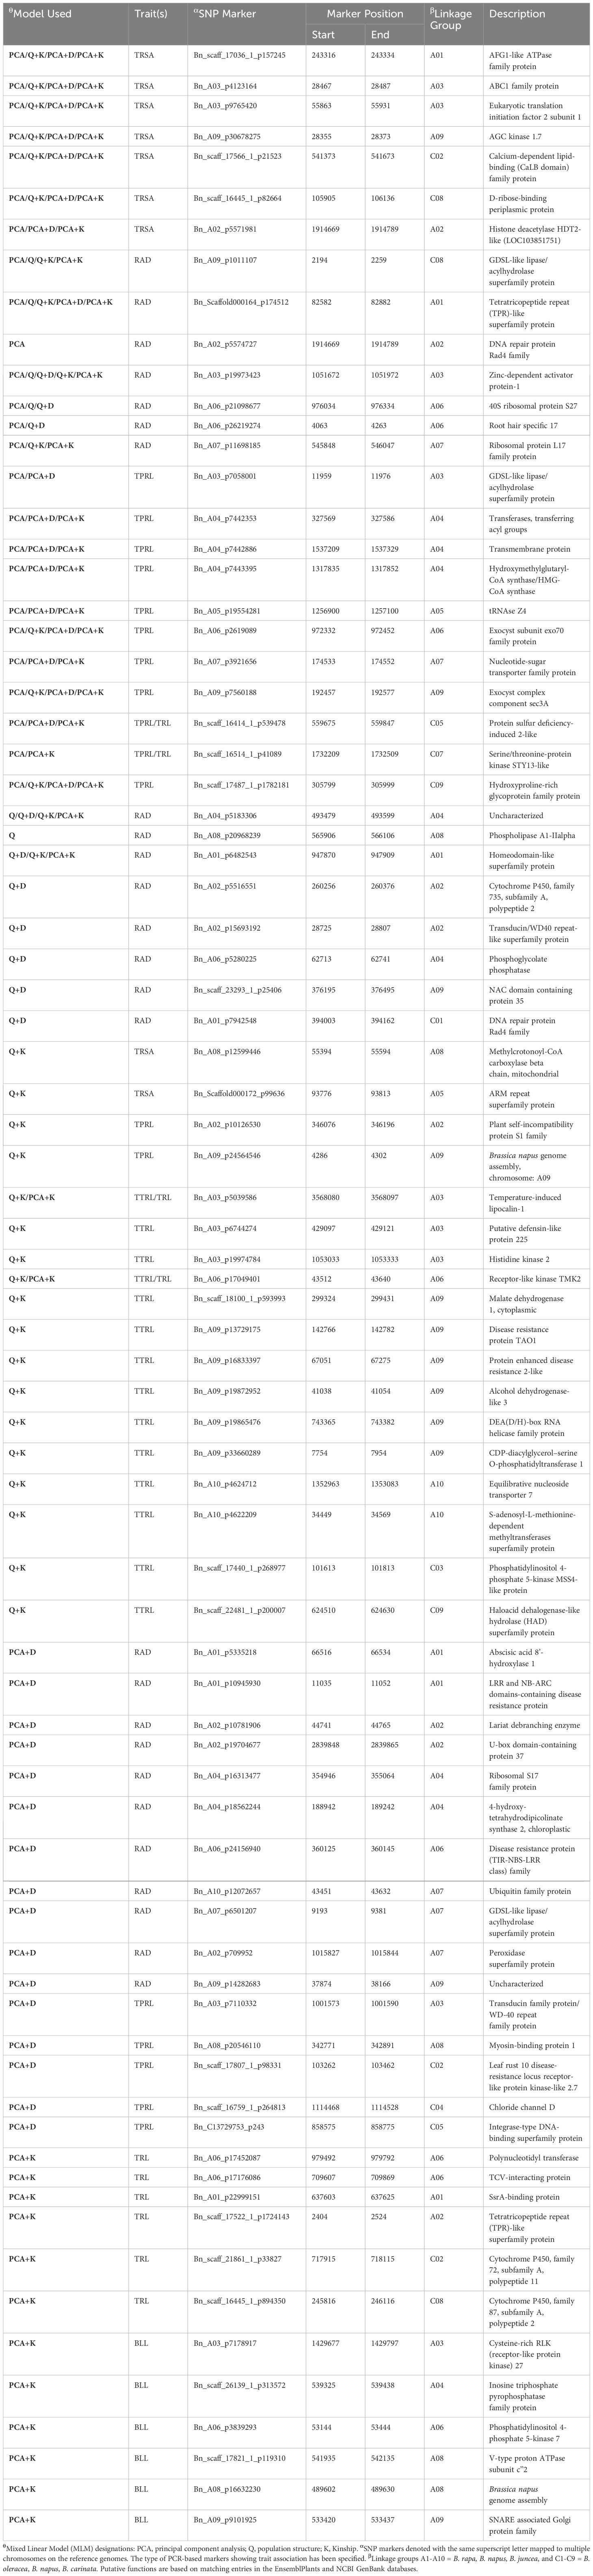
Table 4 Chromosomal location of significant single nucleotide polymorphism (SNP) markers associated with root system architecture traits in five Brassica species, including B. napus, B. oleracea, B. rapa, B. carinata, and B. juncea.
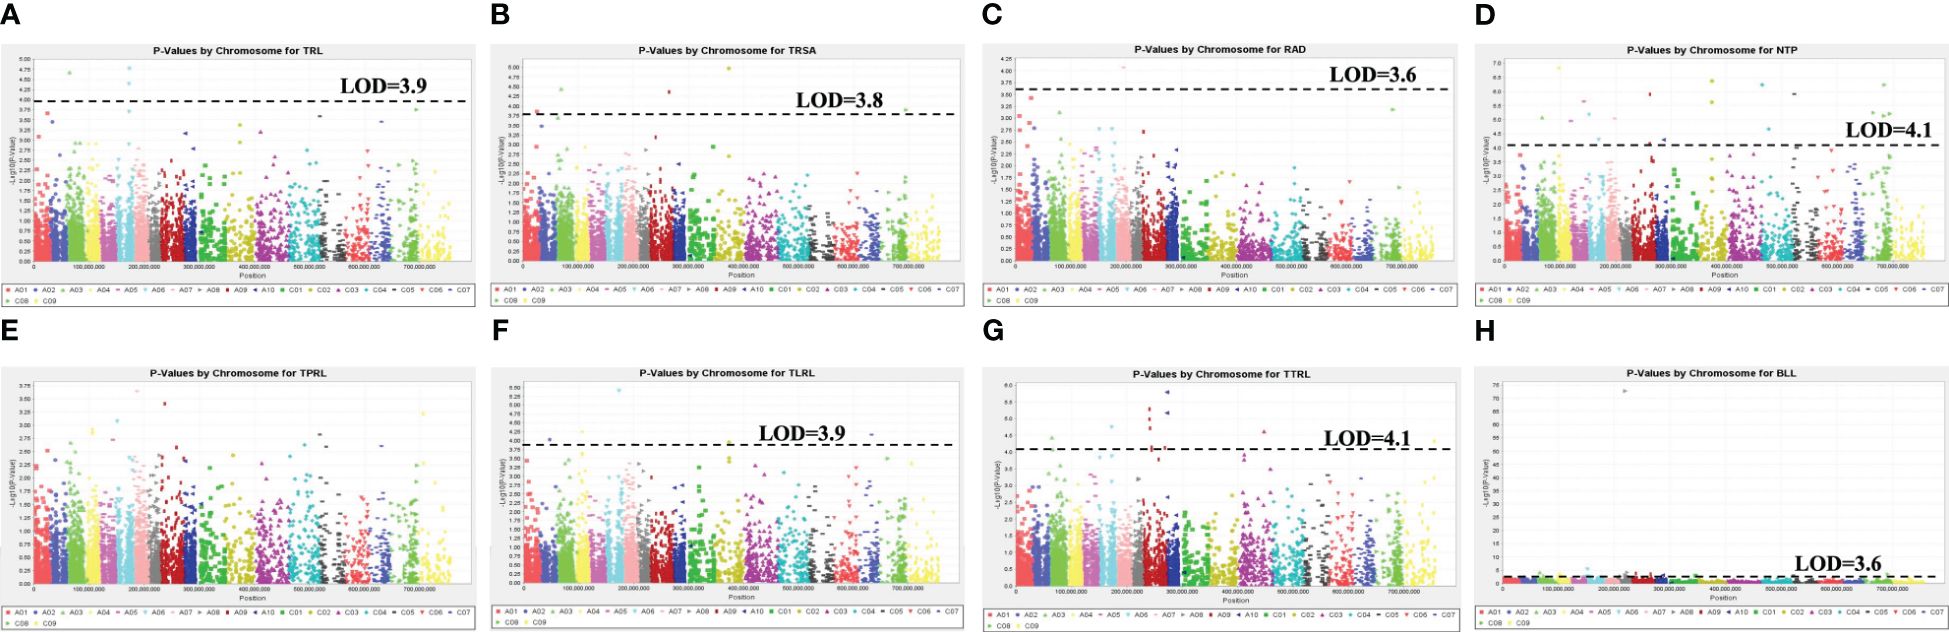
Figure 6 Manhattan plots of the PCA + K MLM models for identifying root system architecture traits loci in 313 Brassica accessions representing five species, including B. napus, B. oleracea, B. rapa, B. carinata, and B. juncea. Traits include (A) total root length (TRL/cm), (B) total surface area of roots (TRSA/cm2), (C) root average diameter (RAD/cm), (D) number of tips (NTP), (E) total primary root length (TPRL/cm), (F) total lateral root length (TLRL/cm), (G) total tertiary root length (TTRL/cm), and (H) basal link length (BLL/cm). The dashed horizontal lines indicate the Bonferroni-adjusted significance threshold (“logarithm-of-odds” (LOD) score). The dots above the significance threshold indicate single nucleotide polymorphisms (SNPs) associated with each trait.
Functions of proteins encoded by significant sequences
The identified sequences encoded proteins associated with functions involved in various cellular and biochemical processes, including ATP binding, lipid binding, ribosome binding, DNA binding, mRNA binding, RNA binding, metal ion binding, ATPase activity, ATP hydrolysis activity, kinase activity, lipase activity, transferase activity, transcription and translation factor activity, substrate selectivity, catalytic activity, and carbohydrate metabolism (Table 4). More importantly, other proteins were associated with cell wall synthesis, cell growth, organ morphogenesis, transmembrane transporter activity, sugar-phosphatase activity, and vesicle fusion. These processes are related to fundamental biological and physiological mechanisms involved in root growth and development. Some other sequences encoded stress tolerance and disease resistance proteins, such as NAC domain containing protein 35, ARM repeat superfamily protein, DEA(D/H)-box RNA helicase family protein, and LRR and NB-ARC domains. Proteins of unknown molecular function were also detected (Table 4).
Discussion
Root system architectural traits are critical to the plant’s ability to absorb water and nutrients from the soil (Zobel et al., 2007; Lynch, 2019; Wen et al., 2019; Liu et al., 2021; Sun et al., 2021). The response of crops to abiotic stresses is influenced by their RSA. Since roots grow underground, they serve as the first line of defense in detecting stress signals and adapting their genetic program for post-embryonic growth to cope effectively with these challenges (Lynch, 1995). Morphological variations often correspond to physiological or functional variations (de Dorlodot et al., 2007). In this study, a highly positive correlation was observed for seven of the eight RSA traits (except RAD) evaluated in the 379 Brassica genotypes. Ibrahim et al. (2021) also reported a positive correlation between RSA traits in a study of 388 B. napus accessions. The mean BLL values were similar across all six species examined, indicating that the potential growth of the roots of these species is quite similar, probably due to the phenotyping platform.
Root architectural traits can serve as a focal point for enhancement and optimization, tailored to meet the specific requirements dictated by soil conditions (Arifuzzaman and Rahman, 2017). For example, Thomas et al. (2016) examined the root structure of various growth types of B. napus and determined that root morphology has the potential to enhance crop yield, provided that appropriate genetic markers associated with agronomic traits can be identified (Arifuzzaman and Rahman, 2017). The findings from this study revealed that root traits dynamics were significantly influenced by the genotype and species, highlighting the significant role of genetic factors in RSA. The presence of shared QTL between root characteristics and productivity measures such as yield, water usage, or nutrient acquisition suggests that the former contributes to determining the latter in numerous instances (Steele et al., 2006; Ibrahim et al., 2021). One example is the utilization of a QTL termed DRO1, which governs both root growth angle and root depth in rice, for improving the root traits of an Indian upland rice variety through marker-assisted selection to enhance water efficiency (Steele et al., 2006; Ibrahim et al., 2021). In the case of Brassica crops, additional studies regarding the relationship between root-related traits and productivity or nutrient and water use efficiency are needed.
From a functional perspective, a root tip is the primary site for nutrient and water uptake in a plant. In addition, root tips produce exudates that attract significantly higher levels of microorganisms to the rhizosphere surrounding the root tips compared with the bulk soil located a few millimeters away (Curlango-Rivera and Hawes, 2011). Furthermore, individual root tips that develop in soil provide strong anchorage, which facilitates deeper penetration of roots into hard soil niches or areas (Bengough et al., 2016). In this study, significantly greater NTP per plant in B. napus and B. oleracea accessions suggests they possess the potential for stronger soil anchorage, as well as better nutrient and water uptake capabilities. Longer primary roots (Wasson et al., 2012), a larger root diameter (Uga et al., 2013), and abundant and steeper lateral roots (Lynch, 2013) were reported to lead to a deeper and more resilient root system with increased radial hydraulic conductivity at depth and decreased metabolic costs for drought adaptation (Khan et al., 2016). The aforementioned root traits were also reported to increase the efficiency of exudation of organic anions (Lynch, 2015) and enhance interactions with microbes (Walch-Liu et al., 2006), resulting in a high tolerance to deficiencies in nutrients such as nitrogen and phosphate (Khan et al., 2016). In the current study, the B. napus and B. oleracea accessions that possessed relatively larger root systems with larger root surface area, and longer and more vigorous roots, would be expected to provide good anchorage and penetration into the soil. This suggests high developmental plasticity in case of drought or nutrient deficiency (Choi and Cho, 2019). Akhatar and Banga (2015) reported a positive association between seed yield and root length in B. juncea under irrigated conditions. However, negative correlations between root length, root surface area, and root mass with yield under drought stress have been observed in potatoes (Solanum tuberosum) (Zarzyńska et al., 2017). Hammond et al. (2009) and Pongrac et al. (2020) reported that genotypes of B. oleracea with high phosphorus absorption efficiency were characterized by more and longer lateral roots, and had significantly increased yields independent of external phosphorus concentration. Thus, the B. oleracea genotypes with large TLRL identified in this study will have the potential for high phosphorus absorption efficiency, and likely have the potential for higher yields. However, the efficiency of nutrient use is complex and influenced by physiological traits specific to each species and other factors (Pongrac et al., 2020).
The distribution of roots, especially those with strong and thick root systems capable of deeper penetration in the soil, is pivotal in influencing a plant’s capacity to acquire essential resources like water (Fenta et al., 2014). Compared with other species, B. juncea and B. carinata, with the largest RAD, might be better at surviving in dry and compacted soil given their relatively thick and stronger roots. Similar patterns have been identified in other crop species. For example, rice (Oryza sativa L.) varieties with deeper and thicker root systems exhibited increased yields and quality under drought conditions (Suji et al., 2012). Similar trends were also observed in four common bean (Phaseolus vulgaris L.) cultivars, wherein varieties with deeper and stronger roots exhibited enhanced yield, growth, reduced canopy temperature, and decreased soil moisture extraction; in poor soil, however, root variations were not evident (Sponchiado et al., 1989; Lopes et al., 2011).
Salinity is an abiotic stress with detrimental effects on agricultural productivity and sustainability, making it a significant global concern (Shahid et al., 2018). Approximately 830 million ha are projected to be affected by salinity (Szabolcs, 1989), which is still increasing every year (Qadir et al., 2014; Minhas et al., 2020). Agricultural productivity under saline conditions is low, posing a perpetual risk of crop failure. This underscores the significance of enhancing crops to thrive in such environments (Minhas et al., 2020). Reducing main root elongation limits the transport of sodium ions from roots to shoots in saline soils (Rus et al., 2006; Munns and Tester, 2008; Katori et al., 2010). In addition, the storage of sodium ions in root vacuoles and steles can increase the efficiency of water extraction and ion exclusion for salinity tolerance (Gupta and Huang, 2014; Khan et al., 2016). The current study suggests that B. nigra and B. rapa, which had relatively shorter primary roots compared with the other four species, may exhibit greater tolerance to salinity.
Soilborne pathogens also represent a major threat to crop production. Clubroot, caused by Plasmodiophora brassicae, is a particularly important disease of Brassica species (Strelkov and Hwang, 2014). In general, Fredua-Agyeman et al. (2019) found that the order of clubroot resistance, from greatest to smallest, was B. nigra > B. oleracea > B. rapa > B. napus. As such, while B. nigra had the smallest root system in this study, this species also appears to have the strongest resistance to clubroot. A similar association was noted between root size and Verticillium stripe (Verticillium longisporum) severity (Cui et al., 2023). Inoculation of 3-week-old canola plants resulted in more severe disease compared with inoculation of 1- or 2-week-old plants, which had smaller root systems. Furthermore, B. nigra, B. carinata, and B. juncea, characterized by relatively smaller and less intricate root systems in the present study, also exhibited greater resistance to Sclerotinia stem rot (Sclerotinia sclerotiorum) (Navabi et al., 2010; Neik et al., 2017) and blackleg (Leptosphaeria maculans and L. biglobosa) (Roy, 1984; Sjödin and Glimelius, 1988; Rimmer and van den Berg, 1992; Li et al., 2015; You et al., 2016; Neik et al., 2017). Infection by soilborne pathogens can destroy the roots, reduce root density, and diminish the functional effectiveness of the surviving infected roots (Román-Avilés et al., 2004). It is likely that host genotypes with smaller root systems offer fewer opportunities for pathogen invasion, given the smaller surface area and reduced opportunity for contact. As such, the greater resistance may be due to disease escape during the early growth stages of the plant. In the GWAS, 6,213 SNP markers were used to measure RSA traits, including 5,103 A-genome and 1,110 C-genome markers. Comparative genomic studies on Brassica genomes have reported that 1 centimorgan (cM) on a genetic map corresponds to ~500 kb (Suwabe et al., 2006; Ecke et al., 2010; Delourme et al., 2013). Therefore, the 302.5 Mb marker coverage estimated in this study for the A-genome and 452.8 Mb for the C-genome corresponded to ~605 cM and ~905 cM, respectively. As such, the 6,213 SNP markers covered a total of ~1,510 cM, which represents ~60% of the estimated 2,500 cM B. napus genome. The determined genome coverage was comparable with a value of ~645 Mb obtained in studies using a Brassica 60K array (Qian et al., 2014; Qu et al., 2017) and specific-locus amplified fragment sequencing technology (Zhou et al., 2017). In comparison, the filtered set of 6,213 markers on the Brassica 19K SNP array provided about 3× more coverage than the Brassica 13.2K SNP array from the same company used in a previous study (Fredua-Agyeman et al., 2020).
The mean marker density using the Brassica 19K SNP array was 62.9 ± 20.1 (8.43 SNP markers/cM) on the A-genome, 426.3 ± 106.9 (1.22 SNP markers/cM) on the C-genome, and 235.0 ± 200.1 (4.1 SNP markers/cM) on the entire genome. In comparison, the mean marker density using the Brassica 13.2K SNP array was 63.4 ± 21.9 (8.46 SNP markers/cM) for the A-genome, 15.0 ± 8.4 (44.3 SNP markers/cM) for the C-genome, and 40.5 ± 29.8 (11.8 SNP markers/cM) for the entire B. napus genome (Fredua-Agyeman et al., 2020). Thus, the marker density remained consistent for the A-genome, but it was 2–3× lower on the C-genome when genotyping was conducted with the Brassica 19K vs. 13.2K SNP array. This discrepancy was anticipated, as the 1,110 filtered set of SNP markers on the C-genome was distributed over 302.5 Mb or 905.5 cM on the 19K array, in contrast to 2,367 markers on the C-genome spread over 26.7 Mb or 53.4 cM on the 13.2K array.
Linkage disequilibrium, which is the non-random association between alleles at different loci, determines the power and precision of association mapping studies using molecular markers and unobserved QTL (Goddard and Hayes, 2009; Qu et al., 2020). Determination of the extent of LD is essential for making inferences regarding the genetic forces shaping a population (Qanbari, 2019). The extent of LD reported by Fredua-Agyeman et al. (2020) using the Brassica 13.2K SNP array varied from 1,100 to 2,300 kb for the A-genome and from 200 to 1,500 kb for the C-genome. In the present study using the Brassica 19K SNP array, LD varied from 440 to 1,400 kb for the A-genome and from 2,500 to 9,100 kb for the C-genome. The difference in LD values obtained with the two Brassica arrays could reflect the different marker densities. The low marker density on the C-genome might be responsible for the extended ranges of the LD decay. However, the LD values for the A- and C-genomes were consistent with those reported in other studies (Wu et al., 2016; Qu et al., 2017; Zhou et al., 2017). Based on the minimum LD decay (440 kb or 0.88 cM), a minimum of 3,200 markers were needed to perform the GWAS. Therefore, the 6,213 SNP markers in this study represented approximately twice the number needed to perform the analysis.
The MTAs analyses identified three genomic regions on chromosomes A02, A03, and A06 that were associated with RSA traits. In the case of the A02 chromosome, the SNP marker Bn_A02_p5571981 overlapped with a histone deacetylase HDT2-like protein. This protein negatively regulates GIBBERELLIN 2-OXIDASE2 (GA2ox2) expression, which determines cell number in the Arabidopsis root meristem and elongation zone (Li et al., 2017). The increased expression of GA2ox2 in HDT1/2 was reported to cause a decrease in gibberellin (GAs) levels, leading to an earlier transition from cell division to the expansion phase of transit-amplifying cells (Li et al., 2017). On chromosome A03, a histidine kinase 2 (AHK2) encoded by genes that overlap SNP marker Bn_A03_p19974784 can positively regulate the level of cytokinin, which negatively regulates root development in Arabidopsis (Nishimura et al., 2004; Riefler et al., 2006). In Arabidopsis, histidine kinase homologs function as receptors for cytokinin and play an overlapping role in regulating the growth of shoots and roots (Nishimura et al., 2004). Root hair specific 17, encoded by genes associated with SNP marker Bn_A06_p26219274 on chromosome A06, is an expressed protein controlling root hair cell expression for regulating the root growth of Arabidopsis (Won et al., 2009).
This study characterized the RSA traits of the six most economically important Brassica species. It represents the most comprehensive study of its kind, where the root traits of such a large number of Brassica accessions have been examined. This broader scope enabled a deeper exploration of the genetic basis underlying root development, and its implications for crop improvement strategies. However, this study was conducted in a hydroponic system, which does not fully reflect root growth in soil environments. Therefore, further studies will focus on cultivating a subset of identified accessions with small, medium, and large root sizes in soil to validate the findings. Additionally, accurate mapping of genomic regions associated with RSA traits in Brassica species is necessary. To achieve this, bi-parental mapping populations (F2 and doubled haploid) will be developed through crosses between selected large and small root-sized accessions to precisely map these genomic regions. Despite these limitations, this study, which encompassed a wide range of Brassica species and root traits, has laid the groundwork for future investigations aimed at breeding programs tailored to enhance root traits and stress tolerance in Brassica crops.
Conclusion
Overall, this study demonstrated that significant genetic variation exists in the RSA of different Brassica species under controlled environmental conditions. The results also indicated correlations between specific RSA traits, with TRL, TRSA, TPRL, and TLRL exhibiting the strongest associations. These identified RSA traits can serve as valuable indicators for further investigations into stress tolerance under field conditions or abiotic stress scenarios. GWAS identified significant MTAs associated with proteins involved in cell wall synthesis, cell growth, and organ morphogenesis, as well as various proteins associated with cellular, biological, and physiological processes involved in root growth and development. The candidate genes related to root growth were located on chromosomes A02, A03, and A06 of the B. rapa genome. We identified B. napus, B. juncea, B. rapa, B. nigra, B. oleracea, and B. carinata accessions with variable RSA traits. These accessions hold promise for breeding Brassica crops suitable for different environments.
Data availability statement
The datasets presented in this study can be found in online repositories. The names of the repository/repositories and accession number(s) can be found in the article/Supplementary Material.
Author contributions
CY: Conceptualization, Formal analysis, Investigation, Methodology, Software, Validation, Visualization, Writing – original draft. RF: Conceptualization, Formal analysis, Methodology, Resources, Software, Supervision, Writing – review & editing. SH: Conceptualization, Data curation, Funding acquisition, Project administration, Resources, Supervision, Writing – review & editing. LG: Methodology, Resources, Software, Writing – review & editing. SS: Conceptualization, Data curation, Funding acquisition, Project administration, Resources, Supervision, Writing – review & editing.
Funding
The author(s) declare financial support was received for the research, authorship, and/or publication of this article. Funding for this research was provided by Results Driven Agriculture Research (RDAR), the Western Grains Research Foundation (WGRF) and Alberta Canola Producers Commission via Project No. 2021F063R, and by RDAR and the Canadian Agriculture Partnership (CAP) via Project No. 2022N029R. SS received these grants as the Principal Investigator, with RF-A and S-FH as Co-Investigators.
Acknowledgments
LG provided constant kind guidance. The University of Alberta provided in-kind support, including access to growth chambers and laboratory infrastructure.
Conflict of interest
The authors declare that the research was conducted in the absence of any commercial or financial relationships that could be construed as a potential conflict of interest.
Publisher’s note
All claims expressed in this article are solely those of the authors and do not necessarily represent those of their affiliated organizations, or those of the publisher, the editors and the reviewers. Any product that may be evaluated in this article, or claim that may be made by its manufacturer, is not guaranteed or endorsed by the publisher.
Supplementary material
The Supplementary Material for this article can be found online at: https://www.frontiersin.org/articles/10.3389/fpls.2024.1389082/full#supplementary-material
References
Ahmad, N., Ibrahim, S., Kuang, L., Ze, T., Wang, X., Wang, H., et al. (2023). Integrating genome-wide association study with transcriptomic data to predict candidate genes influencing Brassica napus root and biomass-related traits under low phosphorus conditions. Biotechnol. Biofuels Bioprod. 16, 149. doi: 10.1186/s13068-023-02403-2
Akhatar, J., Banga, S. S. (2015). Genome-wide association mapping for grain yield components and root traits in Brassica juncea (L.) Czern & Coss. Mol. Breed. 35, 48. doi: 10.1007/s11032-015-0230-8
Alcock, T. D., Havlickova, L., He, Z., Wilson, L., Bancroft, I., White, P. J., et al. (2018). Species-wide variation in shoot nitrate concentration, and genetic loci controlling nitrate, phosphorus and potassium accumulation in Brassica napus L. Front. Plant Sci. 9. doi: 10.3389/fpls.2018.01487
Anderson, T. W., Darling, D. A. (1954). A test of goodness of fit. J. Am. Stat. Assoc. 49, 765–769. doi: 10.1080/01621459.1954.10501232
Arif, M. R., Islam, M. T., Robin, A. H. K. (2019). Salinity stress alters root morphology and root hair traits in Brassica napus. Plants 8, 192. doi: 10.3390/plants8070192
Arifuzzaman, M., Rahman, M. (2017). A comparative study on root traits of spring and winter canola (Brassica napus L.) under controlled and water stressed conditions. J. Agric. Sci. 9, 58. doi: 10.5539/jas.v9n7p58
Barro, F., Martín, A. (1999). Response of different genotypes of Brassica carinata to microspore culture. Plant Breed. 118, 79–81. doi: 10.1046/j.1439-0523.1999.118001079.x
Bellucci, R., Martin, A., Bommarito, D., Wang, K., Hansen, S. H., Freeman, G. J., et al. (2015). Interferon-γ-induced activation of JAK1 and JAK2 suppresses tumor cell susceptibility to NK cells through upregulation of PD-L1 expression. Oncoimmunology 4, e1008824. doi: 10.1080/2162402X.2015.1008824
Bengough, A. G., Loades, K., McKenzie, B. M. (2016). Root hairs aid soil penetration by anchoring the root surface to pore walls. J. Exp. Bot. 67, 1071–1078. doi: 10.1093/jxb/erv560
Benjamini, Y., Hochberg, Y. (1995). Controlling the false discovery rate: A practical and powerful approach to multiple testing. J. R. Stat. Soc Ser. B Stat. (Methodol.) 57, 289–300. doi: 10.1111/j.2517-6161.1995.tb02031.x
Bradbury, P. J., Zhang, Z., Kroon, D. E., Casstevens, T. M., Ramdoss, Y., Buckler, E. S. (2007). TASSEL: software for association mapping of complex traits in diverse samples. Bioinform. 23, 2633–2635. doi: 10.1093/bioinformatics/btm308
Branca, F., Cartea, E. (2011). “Brassica,” in Wild Crop Relatives: Genomic and Breeding Resources. Ed. Kole, C. (Springer Berlin Heidelberg, Berlin, Heidelberg), 17–36. doi: 10.1007/978–3-642–14871-2_2
Breseghello, F., Sorrells, M. E. (2006). Association mapping of kernel size and milling quality in wheat (Triticum aestivum L.) cultivars. Genet. 172, 1165–1177. doi: 10.1534/genetics.105.044586
Center for Agriculture, Food, and the Environment (2015) Cover Crops, Brassicas (UMass Extension Vegetable Program University of Massachusetts Amherst (MA). Available online at: https://ag.umass.edu/vegetable/fact-sheets/cover-crops-brassicas (Accessed October 6, 2022).
Choi, H. S., Cho, H. T. (2019). Root hairs enhance Arabidopsis seedling survival upon soil disruption. Sci. Rep. 9, 11181. doi: 10.1038/s41598–019-47733–0
Cui, J., Strelkov, S. E., Fredua-Agyeman, R., Hwang, S. F. (2023). Development of optimized Verticillium longisporum inoculation techniques for canola (Brassica napus). Can. J. Plant Pathol. 45, 92–102. doi: 10.1080/07060661.2022.2120913
Curlango-Rivera, G., Hawes, M. C. (2011). Root tips moving through soil: An intrinsic vulnerability. Plant Signal. Behav. 6, 726–727. doi: 10.4161/psb.6.5.15107
de Dorlodot, S., Forster, B., Pagès, L., Price, A., Tuberosa, R., Draye, X. (2007). Root system architecture: opportunities and constraints for genetic improvement of crops. Trends Plant Sci. 12, 474–481. doi: 10.1016/j.tplants.2007.08.012
Delourme, R., Falentin, C., Fomeju, B. F., Boillot, M., Lassalle, G., André, I., et al. (2013). High-density SNP-based genetic map development and linkage disequilibrium assessment in Brassica napus L. BMC Genom. 14, 120. doi: 10.1186/1471-2164-14-120
Ecke, W., Clemens, R., Honsdorf, N., Becker, H. C. (2010). Extent and structure of linkage disequilibrium in canola quality winter rapeseed (Brassica napus L.). Theor. Appl. Genet. 120, 921–931. doi: 10.1007/s00122-009-1221-0
Evanno, G., Regnaut, S., Goudet, J. (2005). Detecting the number of clusters of individuals using the software structure: a simulation study. Mol. Ecol. 14, 2611–2620. doi: 10.1111/j.1365-294X.2005.02553.x
Falk, K. G., Jubery, T. Z., O’Rourke, J. A., Singh, A., Sarkar, S., Ganapathysubramanian, B., et al. (2020). Soybean root system architecture trait study through genotypic, phenotypic, and shape-based clusters. Plant Phenomics 2020, 2020/1925495. doi: 10.34133/2020/1925495
Fenta, B. A., Beebe, S. E., Kunert, K. J., Burridge, J. D., Barlow, K. M., Lynch, J. P., et al. (2014). Field phenotyping of soybean roots for drought stress tolerance. Agron. 4, 418–435. doi: 10.3390/agronomy4030418
Fletcher, R. J., McCleery, R. A., Greene, D. U., Tye., C. A. (2016). Integrated models that unite local and regional data reveal larger-scale environmental relationships and improve predictions of species distributions. Landscape Ecol. 31, 1369–1382. doi: 10.1007/s10980-015-0327-9
Fredua-Agyeman, R., Hwang, S. F., Strelkov, S. E., Zhou, Q., Manolii, V. P., Feindel, D. (2019). Identification of Brassica accessions resistant to ‘old’ and ‘new’ pathotypes of Plasmodiophora brassicae from Canada. Plant Pathol. 68, 708–718. doi: 10.1111/ppa.12980
Fredua-Agyeman, R., Yu, Z., Hwang, S. F., Strelkov, S. E. (2020). Genome-wide mapping of loci associated with resistance to clubroot in Brassica napus ssp. napobrassica (rutabaga) accessions from Nordic countries. Front. Plant Sci. 11. doi: 10.3389/fpls.2020.00742
Goddard, M. E., Hayes, B. J. (2009). Mapping genes for complex traits in domestic animals and their use in breeding programmes. Nat. Rev. Genet. 10, 381–391. doi: 10.1038/nrg2575
Govindaraj, M., Vetriventhan, M., Srinivasan, M. (2015). Importance of genetic diversity assessment in crop plants and its recent advances: an overview of its analytical perspectives. Genet. Res. Int. 2015, e431487. doi: 10.1155/2015/431487
Griffiths, M., Delory, B. M., Jawahir, V., Wong, K. M., Bagnall, G. C., Dowd, T. G., et al. (2022). Optimisation of root traits to provide enhanced ecosystem services in agricultural systems: A focus on cover crops. Plant Cell Environ. 45, 751–770. doi: 10.1111/pce.14247
Gupta, S. K. (2016). “Chapter 3 - Brassicas,” in Breeding Oilseed Crops for Sustainable Production. Ed. Gupta, S. K. (Academic Press, San Diego), 33–53. doi: 10.1016/B978–0-12–801309–0.00003–3
Gupta, B., Huang, B. (2014). Mechanism of salinity tolerance in plants: Physiological, biochemical, and molecular characterization. Int. J. Genomics 2014, e701596. doi: 10.1155/2014/701596
Hammond, J. P., Broadley, M. R., White, P. J., King, G. J., Bowen, H. C., Hayden, R., et al. (2009). Shoot yield drives phosphorus use efficiency in Brassica oleracea and correlates with root architecture traits. J. Exp. Bot. 60, 1953–1968. doi: 10.1093/jxb/erp083
Ibrahim, S., Li, K., Ahmad, N., Kuang, L., Sadau, S. B., Tian, Z., et al. (2021). Genetic dissection of mature root characteristics by genome-wide association studies in rapeseed (Brassica napus L.). Plants 10, 2569. doi: 10.3390/plants10122569
Ingram, P. A., Malamy, J. E. (2010). “Chapter 2 - root system architecture,” in Advances in Botanical Research. Eds. Kader, J. C., Delseny, M. (Cambridge, MA: Academic Press), 75–117. doi: 10.1016/B978–0-12–380868–4.00002–8
Katori, T., Ikeda, A., Iuchi, S., Kobayashi, M., Shinozaki, K., Maehashi, K., et al. (2010). Dissecting the genetic control of natural variation in salt tolerance of Arabidopsis thaliana accessions. J. Exp. Bot. 61, 1125–1138. doi: 10.1093/jxb/erp376
Khan, M. A., Gemenet, D. C., Villordon, A. (2016). Root system architecture and abiotic stress tolerance: Current knowledge in root and tuber crops. Front. Plant Sci. 7. doi: 10.3389/fpls.2016.01584
Kuijken, R. C. P., van Eeuwijk, F. A., Marcelis, L. F. M., Bouwmeester, H. J. (2015). Root phenotyping: from component trait in the lab to breeding. J. R. Stat. Soc Ser. B Stat. Methodol 66, 5389–5401. doi: 10.1093/jxb/erv239
Li, Y. L., Liu, J. X. (2018). StructureSelector: A web-based software to select and visualize the optimal number of clusters using multiple methods. Mol. Ecol. Resour. 18, 176–177. doi: 10.1111/1755-0998.12719
Li, H., Torres-Garcia, J., Latrasse, D., Benhamed, M., Schilderink, S., Zhou, W., et al. (2017). Plant-specific histone deacetylases HDT1/2 Regulate GIBBERELLIN 2-OXIDASE2 expression to control Arabidopsis root meristem cell number. Plant Cell 29, 2183–2196. doi: 10.1105/tpc.17.00366
Li, J., Zhao, Z., Hayward, A., Cheng, H., Fu, D. (2015). Integration analysis of quantitative trait loci for resistance to Sclerotinia sclerotiorum in Brassica napus. Euphytica 205, 483–489. doi: 10.1007/s10681-015-1417-0
Liu, S., Begum, N., An, T., Zhao, T., Xu, B., Zhang, S., et al. (2021). Characterization of root system architecture traits in diverse soybean genotypes using a semi-hydroponic system. Plants 10, 2781. doi: 10.3390/plants10122781
Lopes, M. S., Araus, J. L., van Heerden, P. D. R., Foyer, C. H. (2011). Enhancing drought tolerance in C4 crops. J. Exp. Bot. 62, 3135–3153. doi: 10.1093/jxb/err105
Lynch, J. P. (1995). Root architecture and plant productivity. Plant Physiol. 109, 7–13. doi: 10.1104/pp.109.1.7
Lynch, J. P. (2007). Roots of the second green revolution. Aust. J. Bot. 55, 493. doi: 10.1071/BT06118
Lynch, J. P. (2013). Steep, cheap and deep: an ideotype to optimize water and N acquisition by maize root systems. Ann. Bot. 112, 347–357. doi: 10.1093/aob/mcs293
Lynch, J. P. (2015). Root phenes that reduce the metabolic costs of soil exploration: Opportunities for 21st century agriculture. Plan Cell Environ. 38, 1775–1784. doi: 10.1111/pce.12451
Lynch, J. P. (2019). Root phenotypes for improved nutrient capture: an underexploited opportunity for global agriculture. New Phytol. 223, 548–564. doi: 10.1111/nph.15738
Meister, R., Rajani, M. S., Ruzicka, D., Schachtman, D. P. (2014). Challenges of modifying root traits in crops for agriculture. Trends Plant Sci. 19, 779–788. doi: 10.1016/j.tplants.2014.08.005
Minhas, P. S., Ramos, T. B., Ben-Gal, A., Pereira, L. S. (2020). Coping with salinity in irrigated agriculture: Crop evapotranspiration and water management issues. Agric. Water Manage. 227, 105832. doi: 10.1016/j.agwat.2019.105832
Molefe, R. R., Amoo, A. E., Babalola, O. O. (2023). Communication between plant roots and the soil microbiome; involvement in plant growth and development. Symbiosis 90, 231–239. doi: 10.1007/s13199-023-00941-9
Munns, R., Tester, M. (2008). Mechanisms of salinity tolerance. Annu. Rev. Plant Biol. 59, 651–681. doi: 10.1146/annurev.arplant.59.032607.092911
Navabi, Z. K., Strelkov, S. E., Good, A. G., Thiagarajah, M. R., Rahman, M. H. (2010). Brassica B-genome resistance to stem rot (Sclerotinia sclerotiorum) in a doubled haploid population of Brassica napus × Brassica carinata. Can. J. Plant Pathol. 32, 237–246. doi: 10.1080/07060661.2010.484229
Neik, T. X., Barbetti, M. J., Batley, J. (2017). Current status and challenges in identifying disease resistance genes in Brassica napus. Front. Plant Sci. 8. doi: 10.3389/fpls.2017.01788
Nishimura, C., Ohashi, Y., Sato, S., Kato, T., Tabata, S., Ueguchi, C. (2004). Histidine kinase homologs that act as cytokinin receptors possess overlapping functions in the regulation of shoot and root growth in Arabidopsis. Plant Cell 16, 1365–1377. doi: 10.1105/tpc.021477
Pearson, K. (1901). LIII. On lines and planes of closest fit to systems of points in space. London Edinburgh Dublin Philos. Mag. J. Sci. 2, 559–572. doi: 10.1080/14786440109462720
Pongrac, P., Castillo-Michel, H., Reyes-Herrera, J., Hancock, R. D., Fischer, S., Kelemen, M., et al. (2020). Effect of phosphorus supply on root traits of two Brassica oleracea L. genotypes. BMC Plant Biol. 20, 368. doi: 10.1186/s12870-020-02558-2
Prince, S. J., Valliyodan, B., Ye, H., Yang, M., Tai, S., Hu, W., et al. (2019). Understanding genetic control of root system architecture in soybean: Insights into the genetic basis of lateral root number. Plant Cell Environ. 42, 212–229. doi: 10.1111/pce.13333
Pritchard, J. K., Stephens, M., Donnelly, P. (2000). Inference of population structure using multilocus genotype data. Genet 155, 945–959. doi: 10.1093/genetics/155.2.945
Puechmaille, S. J. (2016). The program structure does not reliably recover the correct population structure when sampling is uneven: subsampling and new estimators alleviate the problem. Mol. Ecol. Resour. 16, 608–627. doi: 10.1111/1755-0998.12512
Qadir, M., Quillérou, E., Nangia, V., Murtaza, G., Singh, M., Thomas, R. j., et al. (2014). Economics of salt-induced land degradation and restoration. Nat. Resour. Forum 38, 282–295. doi: 10.1111/1477-8947.12054
Qanbari, S. (2019). On the extent of linkage disequilibrium in the genome of farm animals. Front. Genet. 10. doi: 10.3389/fgene.2019.01304
Qian, L., Qian, W., Snowdon, R. J. (2014). Sub-genomic selection patterns as a signature of breeding in the allopolyploid Brassica napus genome. BMC Genom 15, 1170. doi: 10.1186/1471-2164-15-1170
Qu, C., Jia, L., Fu, F., Zhao, H., Lu, K., Wei, L., et al. (2017). Genome-wide association mapping and Identification of candidate genes for fatty acid composition in Brassica napus L. using SNP markers. BMC Genom 18, 232. doi: 10.1186/s12864-017-3607-8
Qu, J., Kachman, S. D., Garrick, D., Fernando, R. L., Cheng, H. (2020). Exact distribution of linkage disequilibrium in the presence of mutation, selection, or minor allele frequency filtering. Front. Genet. 11. doi: 10.3389/fgene.2020.00362
Riefler, M., Novak, O., Strnad, M., Schmülling, T. (2006). Arabidopsis cytokinin receptor mutants reveal functions in shoot growth, leaf senescence, seed size, germination, root development, and cytokinin metabolism. Plant Cell 18, 40–54. doi: 10.1105/tpc.105.037796
Rimmer, S. R., van den Berg, C. G. J. (1992). Resistance of oilseed Brassica spp. to blackleg caused by Leptosphaeria maculans. Can. J. Plant Pathol. 14, 56–66. doi: 10.1080/07060669209500906
Román-Avilés, B., Snapp, S. S., Kelly, J. D. (2004). Assessing root traits associated with root rot resistance in common bean. Field Crops Res. 86, 147–156. doi: 10.1016/j.fcr.2003.08.001
Roy, N. N. (1984). Interspecific transfer of Brassica juncea-type high blackleg resistance to Brassica napus. Euphytica 33, 295–303. doi: 10.1007/BF00021125
Rus, A., Baxter, I., Muthukumar, B., Gustin, J., Lahner, B., Yakubova, E., et al. (2006). Natural variants of AtHKT1 enhance Na+ accumulation in two wild populations of Arabidopsis. PloS Genet. 2, e210. doi: 10.1371/journal.pgen.0020210
Santner, A., Calderon-Villalobos, L. I. A., Estelle, M. (2009). Plant hormones are versatile chemical regulators of plant growth. Nat. Chem. Biol. 5, 301–307. doi: 10.1038/nchembio.165
Shahid, S. A., Zaman, M., Heng, L. (2018). “Soil salinity: historical perspectives and A world overview of the problem,” in Guideline for Salinity Assessment, Mitigation and Adaptation Using Nuclear and Related Techniques. Eds. Zaman, M., Shahid, S. A., Heng, L. (Springer International Publishing, Cham), 43–53. doi: 10.1007/978–3-319–96190-3_2
Shi, L., Shi, T., Broadley, M. R., White, P. J., Long, Y., Meng, J., et al. (2013). High-throughput root phenotyping screens identify genetic loci associated with root architectural traits in Brassica napus under contrasting phosphate availabilities. Ann. Bot. 112, 381–389. doi: 10.1093/aob/mcs245
Sjödin, C., Glimelius, K. (1988). Selection for Resistance to Phomalingam using pycniospore infections of plants in-vivo and sirodesmin PL as selective agent in-vitro. Prog. Plant Protoplast Res. Curr. Plant Sci. Biotechnol. Agric. (Dordrecht) 7. doi: 10.1007/978-94-009-2788-9_103
Smith, S., De Smet, I. (2012). Root system architecture: Insights from Arabidopsis and cereal crops. Phil. Trans. R. Soc B 367, 1441–1452. doi: 10.1098/rstb.2011.0234
Sponchiado, B. N., White, J. W., Castillo, J. A., Jones, P. G. (1989). Root growth of four common bean cultivars in relation to drought tolerance in environments with contrasting soil types. Exp. Agric. 25, 249–257. doi: 10.1017/S0014479700016756
Steele, K. A., Price, A. H., Shashidhar, H. E., Witcombe, J. R. (2006). Marker-assisted selection to introgress rice QTLs controlling root traits into an Indian upland rice variety. Theor. Appl. Genet. 112, 208–221. doi: 10.1007/s00122-005-0110-4
Strelkov, S. E., Hwang, S. F. (2014). Clubroot in the Canadian canola crop: 10 years into the outbreak. Can. J. Plant Pathol. 36, 27–36. doi: 10.1080/07060661.2013.863807
Strelkov, S. E., Hwang, S. F., Manolii, V. P., Cao, T., Fredua-Agyeman, R., Harding, M. W., et al. (2018). Virulence and pathotype classification of Plasmodiophora brassicae populations collected from clubroot resistant canola (Brassica napus) in Canada. Can. J. Plant Pathol. 40, 284–298. doi: 10.1080/07060661.2018.1459851
Suji, K. K., Prince, K. S. J., Mankhar, P. S., Kanagaraj, P., Poornima, R., Amutha, K., et al. (2012). Evaluation of rice (Oryza sativa L.) near iso-genic lines with root QTLs for plant production and root traits in rainfed target populations of environment. Field Crops Res. 137, 89–96. doi: 10.1016/j.fcr.2012.08.006
Sun, X., Ren, W., Wang, P., Chen, F., Yuan, L., Pan, Q., et al. (2021). Evaluation of maize root growth and genome-wide association studies of root traits in response to low nitrogen supply at seedling emergence. Crop J. 9, 794–804. doi: 10.1016/j.cj.2020.09.011
Suwabe, K., Tsukazaki, H., Iketani, H., Hatakeyama, K., Kondo, M., Fujimura, M., et al. (2006). Simple sequence repeat-based comparative genomics between Brassica rapa and Arabidopsis thaliana: The genetic origin of clubroot resistance. Genet. 173, 309–319. doi: 10.1534/genetics.104.038968
Szabolcs, I. (1989) Salt-affected soils. Available online at: https://www.cabdirect.org/cabdirect/abstract/19911957184 (Accessed January 22, 2024).
Tanimoto, E. (2005). Regulation of root growth by plant hormones—roles for Auxin and Gibberellin. Crit. Rev. Plant Sci. 24, 249–265. doi: 10.1080/07352680500196108
Thomas, C. L., Alcock, T. D., Graham, N. S., Hayden, R., Matterson, S., Wilson, L., et al. (2016). Root morphology and seed and leaf ionomic traits in a Brassica napus L. diversity panel show wide phenotypic variation and are characteristic of crop habit. BMC Plant Biol. 16, 214. doi: 10.1186/s12870–016-0902–5
Tuberosa, R., Sanguineti, M. C., Landi, P., Michela Giuliani, M., Salvi, S., Conti, S. (2002). Identification of QTLs for root characteristics in maize grown in hydroponics and analysis of their overlap with QTLs for grain yield in the field at two water regimes. Plant Mol. Biol. 48, 697–712. doi: 10.1023/A:1014897607670
Uffelmann, E., Huang, Q. Q., Munung, N. S., de Vries, J., Okada, Y., Martin, A. R., et al. (2021). Genome-wide association studies. Nat. Rev. Methods Primers 1, 1–21. doi: 10.1038/s43586-021-00056-9
Uga, Y., Sugimoto, K., Ogawa, S., Rane, J., Ishitani, M., Hara, N., et al. (2013). Control of root system architecture by DEEPER ROOTING 1 increases rice yield under drought conditions. Nat. Genet. 45, 1097–1102. doi: 10.1038/ng.2725
Vissenberg, K., Claeijs, N., Balcerowicz, D., Schoenaers, S. (2020). Hormonal regulation of root hair growth and responses to the environment in Arabidopsis. J. Exp. Bot. 71, 2412–2427. doi: 10.1093/jxb/eraa048
Walch-Liu, P., Ivanov, I. I., Filleur, S., Gan, Y., Remans, T., Forde, B. G. (2006). Nitrogen regulation of root branching. Ann. Bot. 97, 875–881. doi: 10.1093/aob/mcj601
Wang, J., Dun, X., Shi, J., Wang, X., Liu, G., Wang, H. (2017). Genetic dissection of root morphological traits related to nitrogen use efficiency in Brassica napus L. under two contrasting nitrogen conditions. Front. Plant Sci. 8. doi: 10.3389/fpls.2017.01709
Wang, J., Kuang, L., Wang, X., Liu, G., Dun, X., Wang, H. (2019). Temporal genetic patterns of root growth in Brassica napus L. revealed by a low-cost, high-efficiency hydroponic system. Theor. Appl. Genet. 132, 2309–2323. doi: 10.1007/s00122-019-03356-7
Wasson, A. P., Richards, R. A., Chatrath, R., Misra, S. C., Prasad, S. V. S., Rebetzke, G. J., et al. (2012). Traits and selection strategies to improve root systems and water uptake in water-limited wheat crops. J. Exp. Bot. 63, 3485–3498. doi: 10.1093/jxb/ers111
Wen, Z., Li, H., Shen, Q., Tang, X., Xiong, C., Li, H., et al. (2019). Tradeoffs among root morphology, exudation and mycorrhizal symbioses for phosphorus-acquisition strategies of 16 crop species. New Phytol. 223, 882–895. doi: 10.1111/nph.15833
Won, S. K., Lee, Y. J., Lee, H. Y., Heo, Y. K., Cho, M., Cho, H. T. (2009). Cis-element- and transcriptome-based screening of root hair-specific genes and their functional characterization in Arabidopsis. Plant Physiol. 150, 1459–1473. doi: 10.1104/pp.109.140905
Wu, Y., Xun, Q., Guo, Y., Zhang, J., Cheng, K., Shi, T., et al. (2016). Genome-wide expression pattern analyses of the Arabidopsis leucine-rich repeat receptor-like kinases. Mol. Plant 9, 289–300. doi: 10.1016/j.molp.2015.12.011
Yang, M., Ding, G., Shi, L., Feng, J., Xu, F., Meng, J. (2010). Quantitative trait loci for root morphology in response to low phosphorus stress in Brassica napus. Theor. Appl. Genet. 121, 181–193. doi: 10.1007/s00122-010-1301-1
Yang, C., Fredua-Agyeman, R., Hwang, S. F., Gorim, L. Y., Strelkov, S. E. (2024). Optimizing the evaluation of root system architectural traits in Brassica napus. Can. J. Plant Sci. doi: 10.1139/cjps-2023-0169
You, M. P., Uloth, M. B., Li, X. X., Banga, S. S., Banga, S. K., Barbetti, M. J. (2016). Valuable new resistances ensure improved management of Sclerotinia Stem Rot (Sclerotinia sclerotiorum) in horticultural and oilseed Brassica species. J. Phytopathol. 164, 291–299. doi: 10.1111/jph.12456
Yu, Z., Fredua-Agyeman, R., Hwang, S. F., Strelkov, S. E. (2021). Molecular genetic diversity and population structure analyses of rutabaga accessions from Nordic countries as revealed by single nucleotide polymorphism markers. BMC Genom. 22, 442. doi: 10.1186/s12864-021-07762-4
Zarzyńska, K., Boguszewska-Mańkowska, D., Nosalewicz, A. (2017). Differences in size and architecture of the potato cultivars root system and their tolerance to drought stress. Plant Soil Environ. 63, 159–164. doi: 10.17221/4/2017-PSE
Zhang, Y., Thomas, C. L., Xiang, J., Long, Y., Wang, X., Zou, J., et al. (2016). QTL meta-analysis of root traits in Brassica napus under contrasting phosphorus supply in two growth systems. Sci. Rep. 6, 33113. doi: 10.1038/srep33113
Zhou, Q., Zhou, C., Zheng, W., Mason, A. S., Fan, S., Wu, C., et al. (2017). Genome-wide SNP markers based on SLAF-Seq uncover breeding traces in rapeseed (Brassica napus L.). Front. Plant Sci. 8. doi: 10.3389/fpls.2017.00648
Zhu, J., Ingram, P. A., Benfey, P. N., Elich, T. (2011). From lab to field, new approaches to phenotyping root system architecture. Curr. Opin. Plant Biol. 14, 310–317. doi: 10.1016/j.pbi.2011.03.020
Keywords: Brassica, GWAS, marker-root trait associations, plant breeding, root system architecture
Citation: Yang C, Fredua-Agyeman R, Hwang S-F, Gorim LY and Strelkov SE (2024) Genome-wide association studies of root system architecture traits in a broad collection of Brassica genotypes. Front. Plant Sci. 15:1389082. doi: 10.3389/fpls.2024.1389082
Received: 20 February 2024; Accepted: 29 April 2024;
Published: 28 May 2024.
Edited by:
Yong-Bi Fu, Agriculture and Agri-Food Canada (AAFC), CanadaReviewed by:
Admas Alemu, Swedish University of Agricultural Sciences, SwedenFuyou Fu, Agriculture and Agri-Food Canada (AAFC), Canada
Copyright © 2024 Yang, Fredua-Agyeman, Hwang, Gorim and Strelkov. This is an open-access article distributed under the terms of the Creative Commons Attribution License (CC BY). The use, distribution or reproduction in other forums is permitted, provided the original author(s) and the copyright owner(s) are credited and that the original publication in this journal is cited, in accordance with accepted academic practice. No use, distribution or reproduction is permitted which does not comply with these terms.
*Correspondence: Rudolph Fredua-Agyeman, ZnJlZHVhYWdAdWFsYmVydGEuY2E=; Stephen E. Strelkov, c3RyZWxrb3ZAdWFsYmVydGEuY2E=