 Yufan Zhou†Hossam Salah Mahmoud Ali†Jinshan XiDongdong YaoHuanhuan ZhangXujiao Li
 Kun Yu*Fengyun Zhao*
- The Key Laboratory of Characteristics of Fruit and Vegetable Cultivation and Utilization of Germplasm Resources of the Xinjiang Production and Construction Corps, Shihezi University, Shihezi, China
Due to the enclosed environment of greenhouse grape production, the supply of CO2 required for photosynthesis is often insufficient, leading to photosynthetic downregulation and reduced yield. Currently, the optimal CO2 concentration for grape production in greenhouses is unknown, and the precise control of actual CO2 levels remains a challenge. This study aims to investigate the effects of different CO2 concentrations on the photosynthetic characteristics and yield of grapes, to validate the feasibility of a CO2 gas irrigation system, and to identify the optimal CO2 concentration for greenhouse grape production. In this study, a CO2 gas irrigation system combining CO2 enrichment and gas irrigation techniques was used with a 5-year-old Eurasian grape variety (Vitis vinifera L.) ‘Flame Seedless.’ Four CO2 concentration treatments were applied: 500 ppm (500 ± 30 µmol·mol−1), 700 ppm (700 ± 30 µmol·mol−1), 850 ppm (850 ± 30 µmol·mol−1), and 1,000 ppm (1,000 ± 30 µmol·mol−1). As CO2 concentration increased, chlorophyll a, chlorophyll b, and carotenoids in grape leaves all reached maximum values at 700 ppm and 850 ppm during the same irrigation cycle, while the chlorophyll a/b ratio was lower than at other concentrations. The net photosynthetic rate (Pn) and water use efficiency (WUE) of grape leaves were the highest at 700 ppm. The transpiration rate and stomatal conductance at 700 ppm and 850 ppm were significantly lower than those at other concentrations. The light saturation point and apparent quantum efficiency reached their maximum at 850 ppm, followed by 700 ppm. Additionally, the maximum net photosynthetic rate, carboxylation efficiency, electron transport rate, and activities of SOD, CAT, POD, PPO, and RuBisCO at 700 ppm were significantly higher than at other concentrations, with the highest yield recorded at 14.54 t·hm−2. However, when the CO2 concentration reached 1,000 ppm, both photosynthesis and yield declined to varying degrees. Under the experimental conditions, the optimal CO2 concentration for greenhouse grape production was 700 ppm, with excessive CO2 levels gradually inhibiting photosynthesis and yield. The results provide a theoretical basis for the future application of CO2 fertilization and gas irrigation techniques in controlled greenhouse grape production.
1 Introduction
With the development of modern industry, the world sees an increasing consumption of coal, oil, natural gas, and fossil fuels, resulting in a sharp rise of CO2 concentration in the atmosphere from 278 ppm before the Industrial Revolution to 420.41 ppm at present, with an annual growth rate of 2 ppm. It is expected that the CO2 concentration will increase to 800 ppm by the end of the 21st century (Davis, 2023). Relevant studies suggest that changes in CO2 concentration have a direct effect on photosynthesis and further influence the final yield of plants (Rakhmankulova et al., 2023). Plants are cultivated more densely during greenhouse cultivation, making a smaller total photosynthetic area for every plant. Greenhouses are less ventilated and even closed all day due to heat preservation, moisture preservation, and other types of pressure. Failure to timely replenish the greenhouse with CO2 usually leads to a shortage in CO2, causing a severe adverse effect on the plants’ photosynthesis and yield formation even though CO2 concentrations in the atmosphere will increase significantly (Zhang et al., 2023b). Photosynthetic performance is one of the significant predictive indicators of plant yield formation. Researchers have conducted considerable research on this aspect. The final results show that the increase in CO2 concentration has a substantial effect on the improvement of plant photosynthetic performance and the increase of fruit yield under the condition of sufficient moisture and nutrients (Kimball, 2016; Wei et al., 2024). A moderate increase in CO2 concentrations in the environment can effectively improve the yield and quality of grapefruits (Kizildeniz et al., 2015). Nevertheless, no specific studies are available on the plant mechanism of photosynthetic response to different high CO2 concentrations in facility production. For this reason, we need to determine the CO2 concentration required for plants under facility conditions to achieve optimal photosynthetic performance. Meanwhile, an exploratory study on the changes in characteristic parameters of plant photosynthesis enables us to predict plant growth and yield under different atmosphere CO2 concentrations in the future and finally achieve a high plant yield and efficiency and sustainable agricultural development under controllable conditions in the facility.
Many studies have discovered the promotive effect of elevated CO2 concentration on plant photosynthesis. Growth chamber, closed-top chamber, open-top chamber (OTC), and free-air CO2 enrichment (FACE) experiments have been performed over the past three decades to simulate the response of plant growth to elevated CO2 concentration (Miyoshi et al., 2017; Wang et al., 2022). Due to the reduction of carbon constraint, elevated CO2 concentration can improve the photosynthetic efficiency of plants and enhance the supply of photoassimilates (Linkosalo et al., 2017). Moreover, elevated CO2 concentration helps improve the net Pn of plant leaves (Ariura et al., 2023). Such gain effect is a typical result where elevated CO2 concentration promotes the RuBisCO carboxylation reaction of plant leaves, inhibits the RuBisCO oxygenation reaction, and increases the total amount of carbon (C) fixation in the photosynthetic metabolic pathway (Suboktagin et al., 2023). Many studies have shown that elevated CO2 concentration can induce plant leaf stomatal closure, increase stomatal resistance, reduce stomatal conductance, and improve water use efficiency (Gamage et al., 2018; Zong et al., 2021). While affecting the photosynthetic efficiency of plants, elevated CO2 concentration significantly affects the characteristic parameter change of CO2 response and light response (Ofori-Amanfo et al., 2021). Therefore, determination of the plant photosynthesis–CO2 response curve is identified as an essential method to learn about the photosynthetic capacity of plants. Based on fitting analysis, we can estimate many important photosynthetic parameters, such as apparent quantum yield (AQY), light compensation point (LCP), light saturation point (LSP), maximum net photosynthetic rate (Pnmax), CO2 saturation point (Cisat), and CO2 compensation point (CCP). Many studies have shown that elevated CO2 concentration effectively increases the Pnmax, LSP, AQY, and Cisat of plants and reduces LCP and CCP (Tang et al., 2017; Hou et al., 2021). Under the CO2 concentration of 1,000 to 1,500 µmol·mol−1, tomato yield was increased by 38% (Shimomoto et al., 2017); under CO2 concentration of 700 µmol·mol−1, tomato yield was increased by 125% (Dorneles et al., 2019). Under the condition that CO2 concentration is 60 µmol·mol−1 higher than the environment, the yield of rice was increased by 11.4% to 19.7% compared with elevated CO2 concentration (Zheng et al., 2018). Some studies have found that elevated CO2 concentration can significantly affect the antioxidant enzyme activity of plants, which may be a potential cause of changes in fruit yield (Jo et al., 2022). Most researchers only study the response of plants to elevated CO2 concentration at a single high CO2 concentration level (for example, 550, 850, or 900 µmol·mol−1), thereby limiting the prediction of optimal CO2 concentrations for plants under facility conditions.
China is the world’s largest producer and consumer of table grapes, with a grape production of 14.998 million tons in 2021 and a domestic output value of approximately US $400 billion (Medda et al., 2022). Grapes cultivated in the open field are directly affected by climate change, resulting in many factors limiting grapes’ growth, yield, and quality. Moreover, the field conditions are very complex, and the cost of artificially increasing CO2 is too high, but the benefit is low (Vogel et al., 2019). The grapes in the facility environment are located in a closed space, and the concentration of CO2 can be precisely controllable to obtain the best yield (Ainsworth and Long, 2021). Therefore, there is a need to study the response of facility grapes to different CO2 concentrations, helping field-grown grapes adapt to and mitigate climate change and optimize the facility production system. With the continuous development and improvement of aerated irrigation technology in recent years, several studies have found that the short-term application of aerated irrigation technology significantly improves soil aeration and water use efficiency near plant roots, effectively mitigating the problem of plant root hypoxia and then increasing the fruit yield (Zhu et al., 2022; Jin et al., 2023). Aerated irrigation technology uses an intelligent central control system for scientific and accurate gas injection and irrigation on plants. Furthermore, aerated irrigation in relevant current studies mainly uses O2 injection into the roots (Ouyang et al., 2020). However, the type and concentration of gas sources are too simple, causing many limitations. In earlier studies, suspended chemical bags, canopy enrichments, and blow-in injections were employed by the CO2 enrichment technology, failing to control the gas concentration accurately. With the application of OTC and FACE systems for CO2 enrichment in recent years (Lewin et al., 2009; Choi et al., 2017), CO2 is directly injected into an enclosed or semi-enclosed space, and its concentration remains constant at a single level, which overlooks the effect of gas on the plant root–soil environment. Based on the benefits of CO2 fertilization, our laboratory uses CO2 as the source of gas injection, combines CO2 enrichment technology with aerated irrigation technology, and develops an intelligent CO2 injection system to inject CO2 through the roots. In this way, CO2 gas is transported to the vicinity of the plant roots through existing underground cavity tank drip irrigation pipes and dissipates into the enclosed environment. In this test, the 10-year-old ‘Flame Seedless’ grapes were used as the material, and the intelligent CO2 gas injection system was used for CO2 enrichment treatment. Then, we explored the effect of different CO2 concentrations on the photosynthetic characteristics and yield of the facility ‘Flame Seedless’ grapes, and the optimum CO2 concentration in grapes was picked out to achieve the optimal production effect, thus providing a theoretical basis for the application of aerated irrigation technology under controllable conditions of facility grapes in the future.
2 Materials and methods
2.1 Experimental site
The test was conducted in the sunlight greenhouse of Xinjiang Shihezi University Comprehensive Experimental Base (45°20′N, 86°03′E) from June 2022 to December 2023. The soil texture in the greenhouse was sandy soil, and the basic physical and chemical properties of the soil were as follows: pH 7.21, organic matter 13.67 g·kg−1, total nitrogen 0.38 g·kg−1, rapidly available phosphorus 25.6 mg·kg−1, and rapidly available potassium 21.3 mg·kg−1. The grape varieties in the greenhouse were ‘Flame Seedless’ table grapes planted in 2018. Vertical trellises were arranged with the trellis surface located east of the grape trees and in a north–south row direction. Cement upright pillars were erected at two ends of each grape tree row. Four galvanized iron wires were laid on the pillars, and the trellis was approximately 1.5 m. Five grape trees were planted in each row with a row spacing of 2.5 m and plant spacing of 0.8 m. Six fertile branches were retained on each grape tree during spring pruning. All grape trees in the greenhouse were irrigated and fertilized by an underground cavity tank drip irrigation system.
2.2 Experimental design
Four rows of grape vines with the same consistent growth in the greenhouse were selected for the test. Enclosed artificial chambers (2.5 m × 7 m × 2.3 m) made of polyethylene (PE) film were used to separate the rows of grape trees (Figure 1). Each chamber corresponded to a treatment, each treatment contained five grape vines, and each grape vine was regarded as a repeat. The gas exchange did not exist between each chamber and the external environment. Cylindrical complex polyvinyl chloride (PVC) cavities with a diameter of 10 cm and a height of 10 cm were buried in circular soil pits with a depth of 25 cm. Each soil pit was located 5 cm south of the grape vines. The bottom of the cavity tank was open, and small holes with a diameter of 1.5 cm were evenly distributed on the cavity tank body. Only a gas injection pipe with a diameter of 6 mm was connected to the top seal. The gas injection was performed in 35 days, from 25 June 2023 to 30 July 2023. Using a liquefied CO2 cylinder as the gas source, we injected CO2 with concentrations of (500 ± 30), (700 ± 30), (850 ± 30), and (1,000 ± 30) µmol·mol−1 and recorded these concentrations as 500 ppm, 700 ppm, 850 ppm, and 1,000 ppm, respectively. Root CO2 injection was adopted for each chamber. Specifically, after being released from the gas source, CO2 flows into the cavity tank in the vicinity of grape tree roots under the control of the CO2 injection control system and then dissipates to the entire chamber through small holes in the cavity tank. Different CO2 concentration levels were maintained in each chamber from 9:00 to 14:00 and from 17:00 to 22:00 each day, and the gas injection was stopped when the CO2 concentration in the gas chamber reached the processing setpoint. The CO2 concentration in each chamber was monitored using four CO2 concentration sensors suspended at a height of 0.5 m (Figure 1). The external surface of the chamber was washed with clear water every 3 days to prevent the light transmittance of films from being degraded by the accumulation of dust and sand in the air. We have collected the sunlight intensity, air temperature, and CO2 concentration in each chamber daily and recorded the data every 10 min since 25 June 2023.
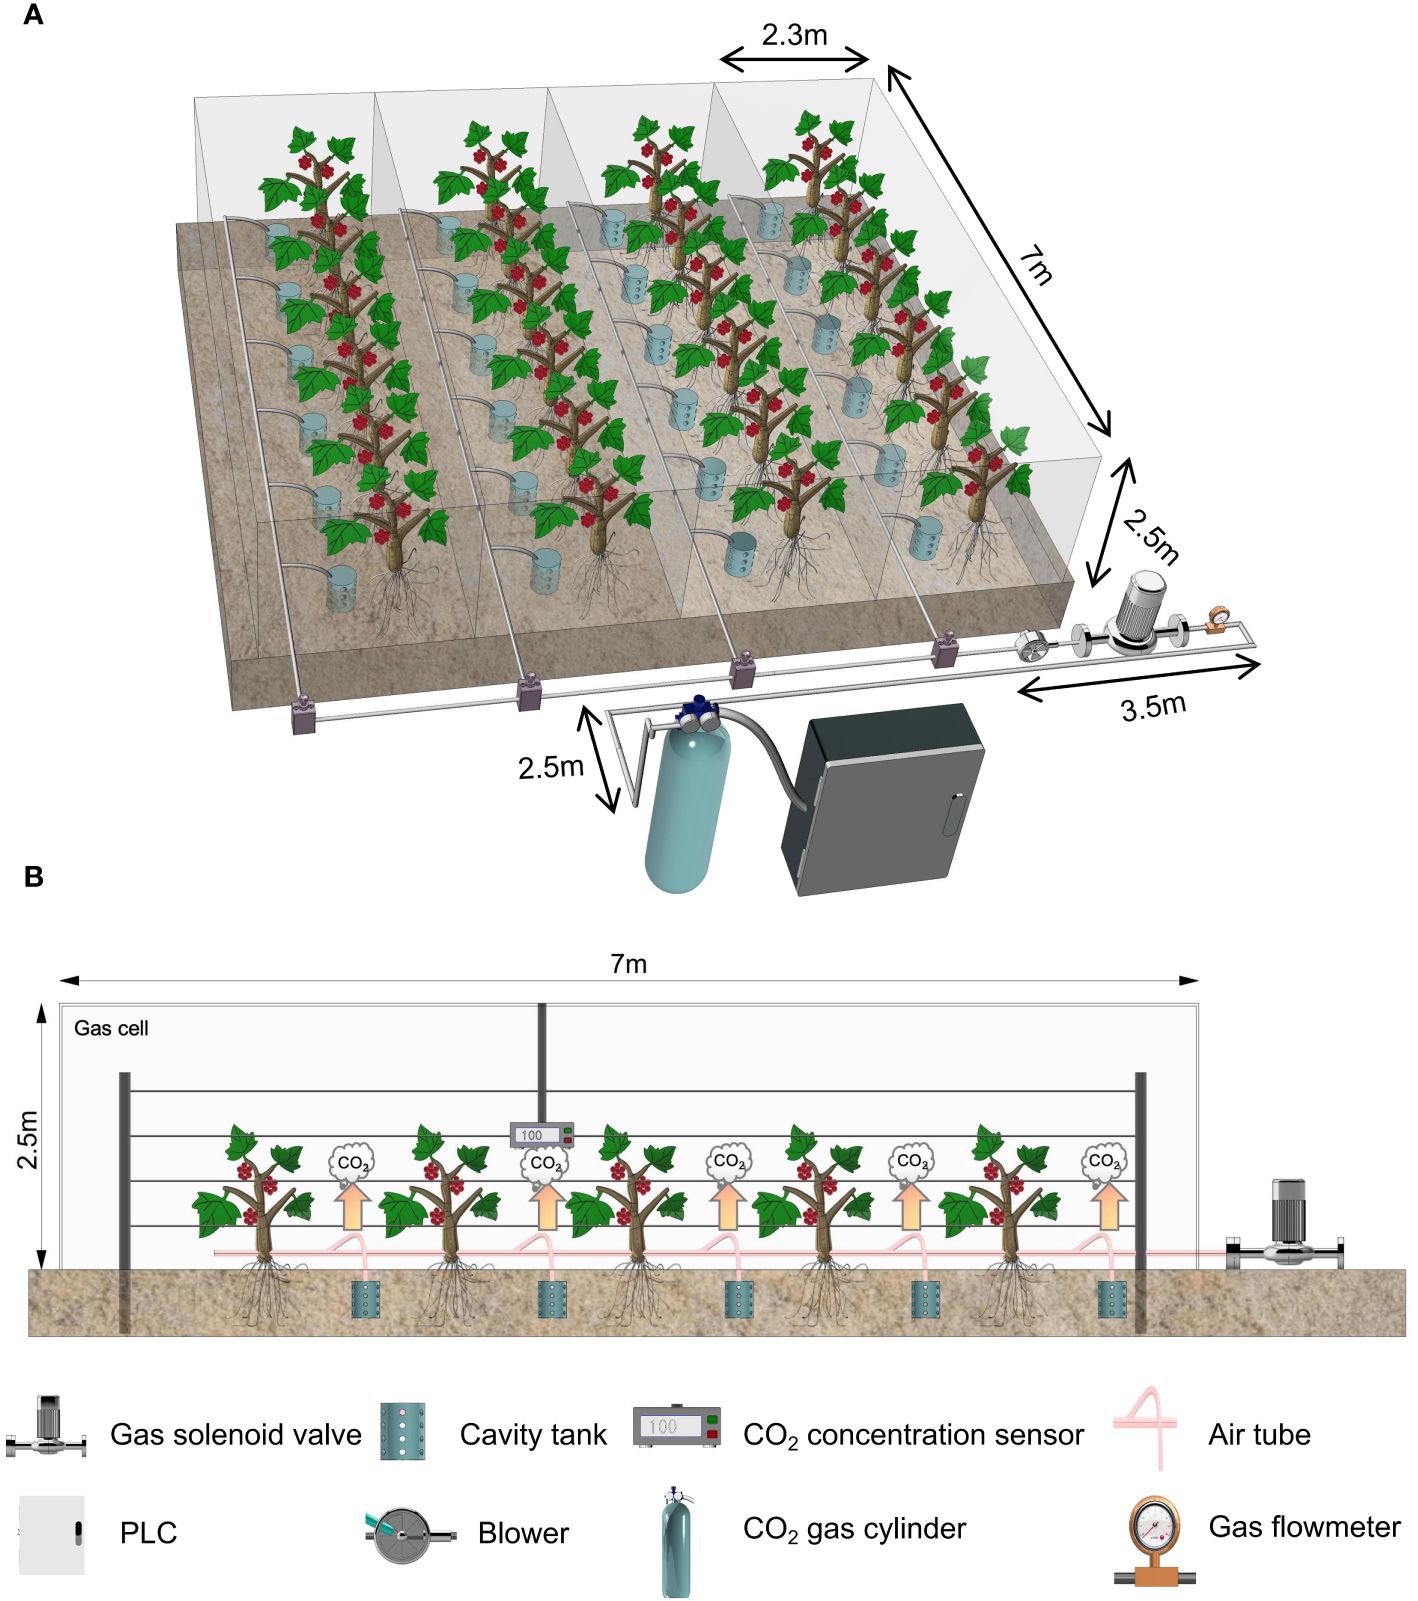
Figure 1 Schematic diagram of the test treatment. (A) CO2 gas injection system, which consists of a central control node (industrial computer and communication port), a gas application node (gas solenoid valve, gas electromagnetic flow meter, and convection device). (B) Closed artificial climate chamber, monitoring node: CO2 concentration sensor, gas application node: gas solenoid valve.
2.3 CO2 injection system
The CO2 gas injection system consisted of a central control node, a monitoring node, and a gas application node (Figure 1). The monitoring node consists of a power supply module and a CO2 concentration monitoring module to collect the environmental information of each chamber. It obtains the CO2 concentration data in each chamber and transmits the environmental parameters to the central control node as current signals through wires. The gas application node comprises a power supply module, a gas solenoid valve, convection devices, and a gas electromagnetic flow meter. It mainly completes the execution of terminal commands and the feedback of control information. It also obtained control instructions analyzed from the terminal commands to determine the opening and closing of the gas solenoid valve in each chamber. Furthermore, the gas electromagnetic flow meter was used to monitor the real-time flow and transmit signals to the central control node to maintain the system’s stable operation. The central control node consists of a power supply module, industrial computer development module, and serial communication module to interact with chamber environment information and model processing. This node implements model processing through the industrial computer capable of human–computer interaction, combines the feedback information of the gas electromagnetic flow meter, and then sends a control signal to the gas application node. The central control node is responsible for starting up automatic equipment. It is located far from the north side of the chamber to prevent any human factor from affecting the test. The CO2 monitoring device is arranged in the middle of the chamber because this location can reflect the average CO2 concentration. The supplementary gas application node is placed near the central control and node, diverting the gas into the chamber through a gas duct. Grape trees are high, and CO2 has a larger relative molecular mass than air. After considering these factors, we set convection devices in the system chamber to reduce the gradient of CO2 concentration increase and ensure a uniform application of CO2. We could maintain the CO2 concentration in each chamber within the desired range depending on the information interaction between the nodes.
2.4 Sampling and measurements
2.4.1 Leaf photosynthetic pigment content
Samples were collected on the 1st, 4th, 7th, and 10th day in the same irrigation cycle (21 July 2023 to 30 July 2023) after 25 days of treatment. Five repeated samples were set for each treatment, and three branches with similar consistent growth were randomly selected for each repeated sample. The well-grown functional leaves were selected and collected from basal node 3 to node 5 and immediately stored in a sealed bag. Then, the samples were taken back to the laboratory using a foam box with ice bags and tested to determine the content of chlorophyll a (Chl a), chlorophyll b (Chl b), and carotenoid in the grape leaves through spectrophotometry, and this was repeated five times. The specific methods were as follows: weigh 0.1 g of freshly washed leaves in a 5-mL centrifuge tube, add 2.5 mL of anhydrous ethanol and 2.5 mL of acetone, and leach the leaves overnight in the dark until the leaves turned white. The extract was poured into a 1-cm aperture cuvette, and the absorbance at 663 nm, 646 nm, and 470 nm was determined by zeroing with an extract reagent blank. Equations (1–4)
2.4.2 Photosynthetic characteristics
We conducted a 4-day measurement on the 1st, 4th, 7th, and 10th day (21 July 2023 to 30 July 2023) in the same irrigation cycle after 25 days of treatment to determine the parameters related to the photosynthetic characteristics of the sampled leaves using an LI-6800 portable photosynthetic apparatus (LI-COR, USA), and repeated five times. The days of measurement were during sunny and cloudless days. At approximately 11:00 a.m., three paper strips of similar length were randomly selected for each treatment, and the functional leaves with good growth from basal nodes 3 to 5 were labeled, to determine the Pn, transpiration rate (Tr), stomatal conductance (Gs), and water use efficiency (WUE) of these leaves. The leaf chamber parameters were set as follows: photosynthetically active radiation (PAR) 1,500 μmol·m−2·s−1, VPD 0.1 kPa, flow rate 500 μmol·s−1, CO2 concentration of reference chamber 400 μmol·mol−1, and leaf chamber temperature 30°C.
2.4.3 Photosynthesis–CO2 response curve and characteristic parameters
The light response curve and the CO2 response curve were determined after 35 days of treatment, and three function leaves were randomly sampled for each treatment. Measurements were performed using the LI-6800 portable photosynthesis apparatus and repeated five times. In the light response curve measurement process, only the light intensity was changed, and the light intensity gradients were set to 1,800, 1,500, 1,200, 900, 600, 300, 200, 150, 100, 50, and 0 μmol·m−2·s−1. When the light intensity changed, the minimum stable time was 120 s, and the maximum tough time was 200 s. The temperature was set at 30°C, the relative humidity was set at 50%, and the CO2 concentration was set at 400 μmol·mol−1. The measured data were used to simulate the light response curve and finally obtain the LSP, LCP, Pnmax, and AQY. While calculating the CO2 response curve, we only changed the CO2 concentration gradients of light intensity into 400, 300, 200, 100, 50, 400, 600, 800, 1,000, 1,200, and 1,500 µmol·mol−1. When the CO2 concentration changed, the minimum stable time was 120 s, and the maximum tough time was 180 s. During the measurement, only the CO2 concentration was changed, the temperature was set at 30°C, the relative humidity was set at approximately 60%, and the light intensity was 1,500 μmol·m−2·s−1. The CO2 response curve was simulated using the measured data to obtain the maximum carboxylation rate (Vcmax), the maximum electron transfer efficiency (Jmax), CO2 compensation point (CCP), and other related parameters.
2.4.4 Leaf antioxidant enzyme and RuBisCO enzyme activities
Grape leaf samples were collected on the 35th day after treatment with different CO2 concentrations. For each treatment, five grape vine branches with similar growth were randomly selected, and the fourth to sixth functional leaves were collected from the base upward. Then, the samples were immediately transported back to the laboratory in a foam box with ice bags, washed with deionized water, and cut into blocks to measure the relevant enzyme activities, and this was repeated five times.
Antioxidant enzymes were determined by the method of Cakmak and Marschner (1992) using the azurotetrazole photochemical reduction method for superoxide dismutase (SOD), the guaiacol method for peroxidase (POD), the spectrophotometric method for catalase (CAT), and the catechol method for polyphenol oxidase (PPO). The soluble protein content was determined using the Caulmers Brilliant Blue G-250 method (Zou et al., 1995).
RuBisCO enzyme activity was determined by referring to the method of Reid et al. (1997) and using a plant enzyme-linked immunoassay kit (Suzhou Comin Biotechnology Co., China).
2.4.5 Fruit yield
After the grapefruit reached the maturity stage (30 July 2023), three grape vines were randomly selected for each treatment. All fruit clusters on these grape vines were collected to determine the weight of every ear and calculate the grape production per grape vine. Three fruit clusters were randomly selected and a balance with an accuracy of 0.01 measured the weight of a single cluster. The final yield was obtained after conversion with the single cluster weight and plot area. Ten grapes were randomly picked from the upper, middle, and lower parts of a grape fruit cluster to determine the weight of a single grape, and this was repeated five times.
2.5 Data analysis
One-way analysis of variance (ANOVA) was performed using SPSS statistical software (version 22.0, IBM Electronics) to reveal the response of the measured variables to different CO2 concentrations. Duncan’s test and Tukey’s multiple comparison test using SPSS 20.0 (SPSS Inc., Chicago, IL, United States) were used to find significant differences between treatments (P < 0.05). Measurements were expressed as the mean ± standard error, and correlation analysis was performed using Pearson’s method. Graphing was performed using the Origin 2022 (Origin Software, Inc. Guangzhou, China) software.
3 Results
3.1 Effect of different CO2 concentrations on the content of photosynthetic pigments in the leaves of ‘Flame Seedless’ grapes
As shown in Table 1, the content of Chl b in the leaves treated with 700 ppm was significantly higher than in those treated with 500 ppm, 850 ppm, and 1,000 ppm of CO2 concentrations 1 day, 4 days, 7 days, and 10 days after irrigation (P < 0.05). Both Chl a and Chl b in the leaves 4 days, 7 days, and 10 days after irrigation showed 700 ppm > 850 ppm > 500 ppm > 1,000 ppm. The content of Chl b in the leaves treated with 700 ppm was significantly increased by 37.9%, 15.7%, and 30.0%, respectively, 4 days, 7 days, and 10 days after irrigation compared with that in the leaves treated with 500 ppm (P < 0.05). One day, 4 days, 7 days, and 10 days after irrigation, the content of carotenoids in the leaves treated with different concentrations of CO2 showed the following sequence: 700 ppm > 850 ppm > 1,000 ppm > 500 ppm. Chl a/b showed a trend of decreasing first and then increasing with the increase of CO2 concentration 1 day, 4 days, 7 days, and 10 days after irrigation. After 4 days and 10 days of irrigation, all treatments on Chl a/b showed 700 ppm < 850 ppm < 500 ppm < 1,000 ppm.
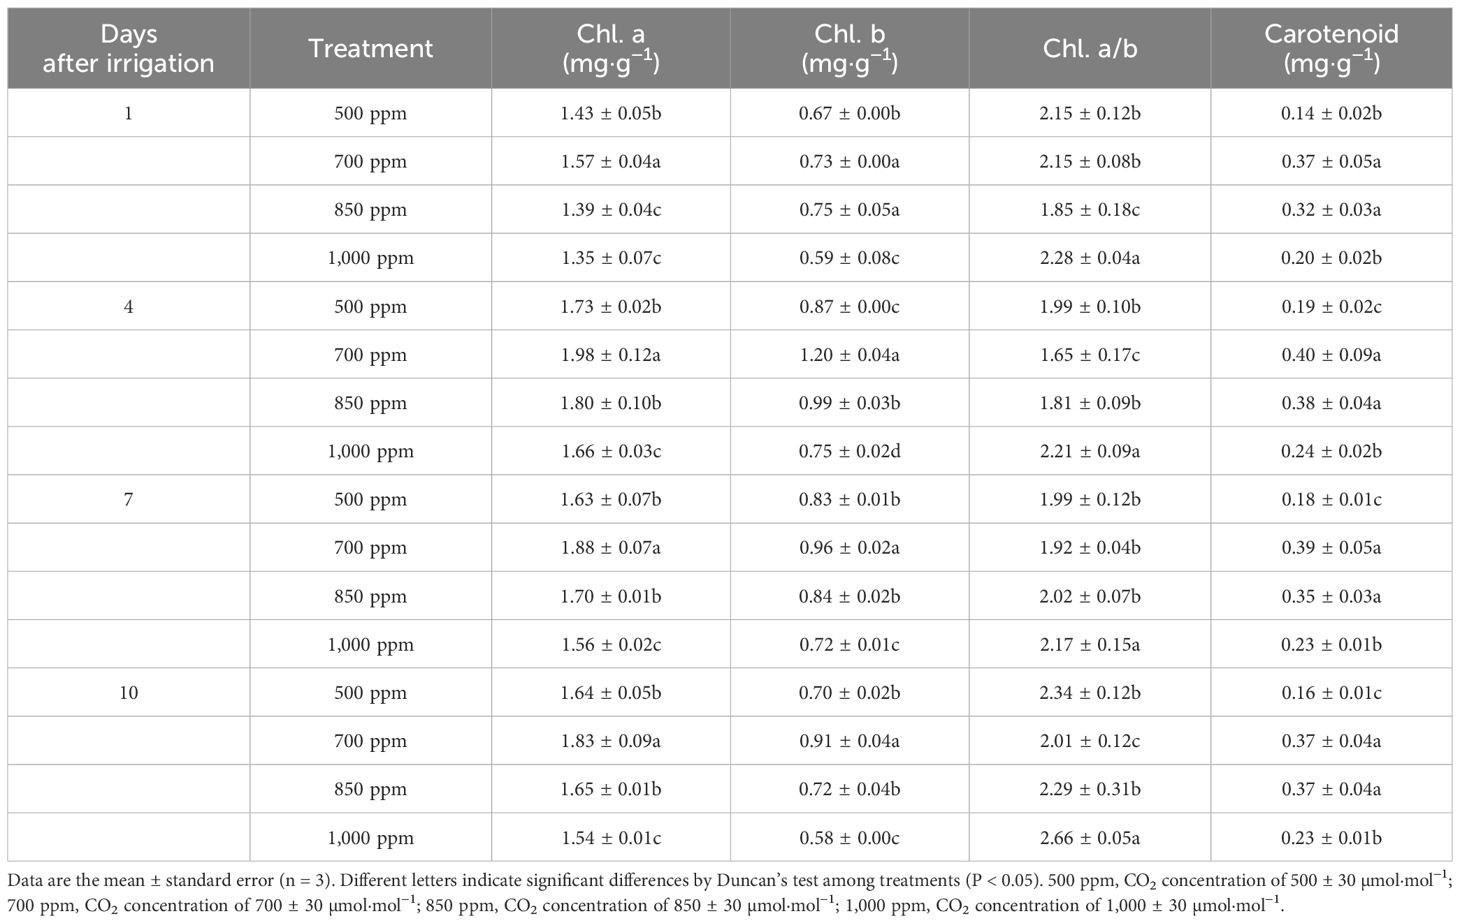
Table 1 Effect of different CO2 concentrations on the content of photosynthetic pigments in the leaves of ‘Flame Seedless’ grapes.
3.2 Effect of different CO2 concentrations on the photosynthetic characteristics in the leaves of ‘Flame Seedless’ grapes
As shown in Figure 2A, the Pn of the leaves treated with different concentrations of CO2 shows a trend of increasing first and then decreasing in the same irrigation cycle. Four days, 7 days, and 10 days after irrigation, the Pn of the leaves in different treatments showed the following sequence: 700 ppm > 850 ppm > 500 ppm > 1,000 ppm. The Pn of the leaves treated with 700 ppm was significantly increased 28.6%, 28.1%, 31.6%, and 28.8%, respectively, 1 day, 4 days, 7 days, and 10 days after irrigation compared with that in the leaves treated with 500 ppm (P < 0.05). As can be seen from Figures 2B, C, both the Gs and Tr of the leaves in different treatments showed a trend of decreasing first and then increasing in the same irrigation cycle. Both the Gs and Tr of the leaves treated with 700 ppm were significantly lower than those of the leaves in other treatments and 10 days after irrigation (P < 0.05). Four days and 7 days after irrigation, both the Tr and Gs of the leaves in different treatments showed the following sequence: 500 ppm > 1,000 ppm > 850 ppm > 700 ppm. The leaves treated with 700 ppm were decreased by 42.2% and 40.7%, respectively, 1 day and 4 days after irrigation compared with that of the leaves treated with 500 ppm. The Tr of the leaves treated with 700 ppm was significantly decreased by 34.3% and 50.4%, respectively, 4 days and 10 days after irrigation compared with the leaves treated with 500 ppm (P < 0.05). As shown in Figure 2D, the grape leaves’ WUE in different treatments showed the same change trend with the Pn. The WUE of the leaves treated with 700 ppm was significantly higher than those treated with 500 ppm, 850 ppm, and 1,000 ppm 1 day, 4 days, 7 days, and 10 days after irrigation (P < 0.05). The WUE of the leaves treated with 700 ppm was increased by 122.4%, 116.2%, 151.7%, and 104.1%, respectively, 1 day, 4 days, 7 days, and 10 days after irrigation compared with that of the leaves treated with 500 ppm (P < 0.05).
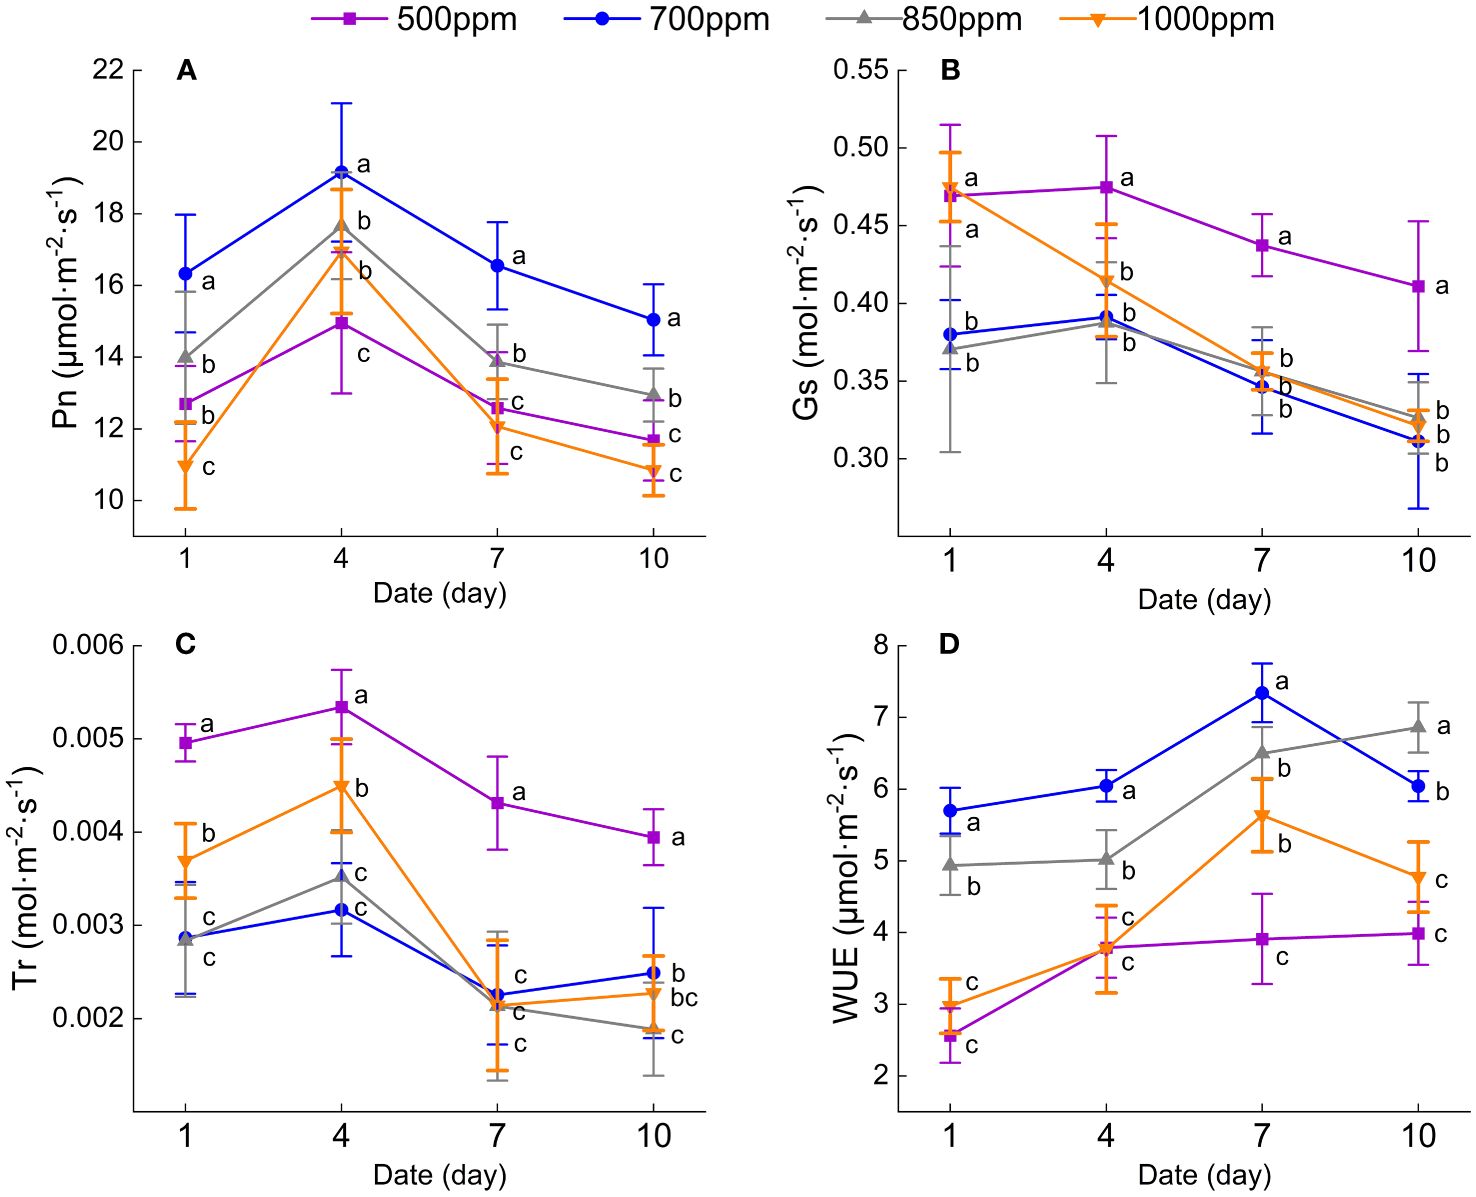
Figure 2 Effect of different CO2 concentrations on the photosynthetic characteristics of ‘Flame Seedless’ grape leaves. Data are the mean ± standard error (n = 3). Different letters indicate significant differences by Duncan’s test among treatments (P < 0.05). (A) Net photosynthetic rate of the leaves under different treatments. (B) Leaf stomatal conductance under different treatments. (C) Leaf transpiration rate under different treatments. (D) Leaf water use efficiency under different treatments. (1 d, 4 d, 7 d, 10 d) Different days after irrigation. 500 ppm, CO2 concentration of 500 ± 30 µmol·mol−1; 700 ppm, CO2 concentration of 700 ± 30 µmol·mol−1; 850 ppm, CO2 concentration of 850 ± 30 µmol·mol−1; 1,000 ppm, CO2 concentration of 1,000 ± 30 µmol·mol−1.
3.3 Effect of different CO2 concentrations on the light response curve and characteristic parameters of ‘Flame Seedless’ grape leaves
The light response curve of ‘Flame Seedless’ grape leaves in the color transformation period (Figure 3A) was obtained by fitting with the rectangular hyperbola correction model (Ye, 2010). Under the treatment of different CO2 concentrations, photosynthetically active radiation (PAR) significantly affected the Pn of the leaves. When the PAR was lower than 800 µmol·m−2·s−1, the Pn of the leaves in different treatments increased rapidly with the increase of PAR. When the PAR was higher than 1,000 µmol·m−2·s−1, the Pn of the leaves in other treatments increased slowly with the growth of the PAR. After the PAR exceeded 1,600 µmol·m−2·s−1, the Pn of the leaves treated with 700 ppm had the lowest increase rate compared with the leaves in other treatments. We calculated the LSP, LCP, Pnmax, and AQY of ‘Flame Seedless’ grape leaves as per the light response curve fitting formula.
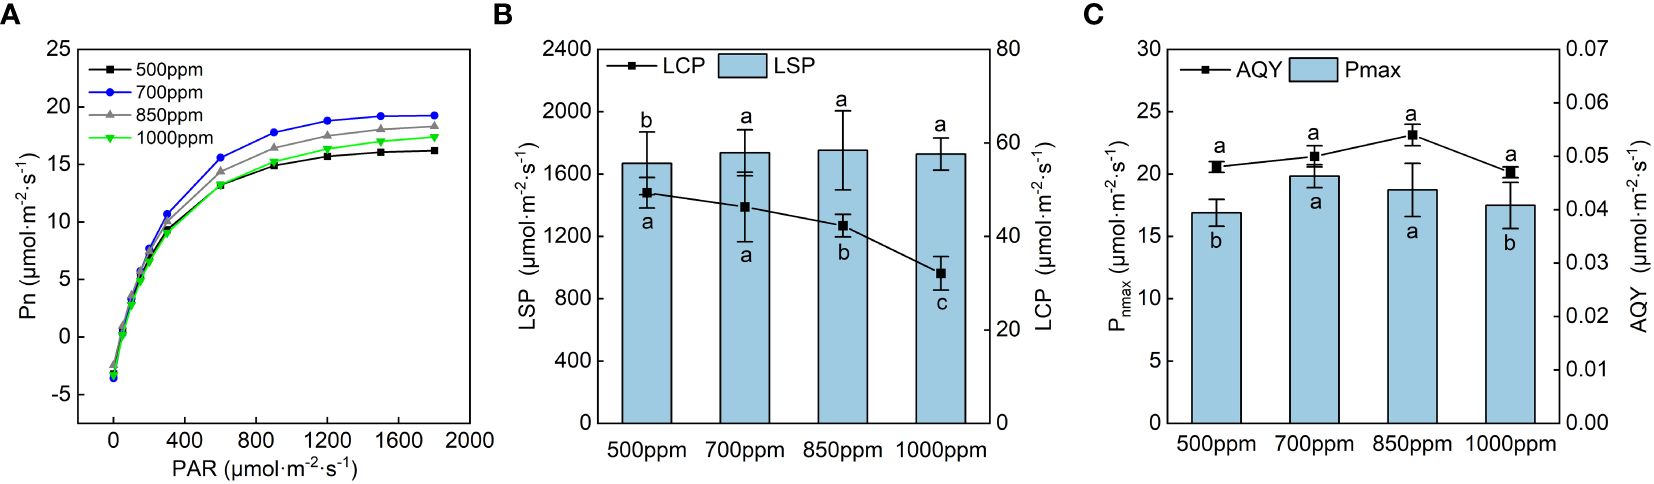
Figure 3 Effects of different CO2 concentrations on the light response curve and its characteristic parameters of grapevine leaves. Data are the mean ± standard error (n = 3). Different letters indicate significant differences by Duncan’s test among treatments (P < 0.05). (A) 500 ppm, CO2 concentration of 500 ± 30 µmol·mol−1; 700 ppm, CO2 concentration of 700 ± 30 µmol·mol−1; 850 ppm, CO2 concentration of 850 ± 30 µmol·mol−1; 1,000 ppm, CO2 concentration of 1,000 ± 30 µmol·mol−1. (B) LSP, light saturation point; LCP, light compensation point. (C) Pnmax, maximum net photosynthetic rate; AQY, apparent quantum yield.
As shown in Figure 3B, the LCP showed a trend of gradually decreasing with the increase in CO2 concentration, while the LSP, Pnmax, and AQY showed a trend of increasing first and then decreasing with the rise in CO2 concentration. In all the treatments, the LSP of the leaves showed 850 ppm > 700 ppm > 1,000 ppm > 500 ppm. The LSPs of the leaves treated with 700 ppm, 850 ppm, and 1,000 ppm were significantly increased by 4.06%, 4.98%, and 3.39%, respectively, compared with those treated with 500 ppm (P < 0.05). Under different CO2 concentrations, the leaves treated with 700 ppm had the highest Pnmax, followed by those treated with 850 ppm. The AQY of the leaves in other treatments showed the sequence of 850 ppm > 700 ppm > 500 ppm > 1,000 ppm.
3.4 Effect of different CO2 concentrations on the CO2 response curve and characteristic parameters of ‘Flame Seedless’ grape leaves
The CO2 response curve of ‘Flame Seedless’ grape leaves in the color transformation period (Figure 4A) was obtained by fitting with the rectangular hyperbola correction model (Ye et al., 2010). The CO2 response curve reflected the law of Pn change of the grape leaves with the change of intercellular CO2 concentration (Ci). As shown in Figure 4A, the Pn of the leaves in different treatments increased rapidly when Ci was in the range of 0 to 600 µmol·m−2·s−1. When Ci was within the range of 600 to 1,200 µmol·m−2·s−1, the Pn of the leaves in different treatments increased at a lower rate with the increase of Ci. When Ci was within the range of 1,200 to 1,600 µmol·m−2·s−1, the Pn of the leaves treated with 500 ppm declined with the increase of Ci, and the Pn of the leaves in other treatments tended to be stable. We calculated the CSP, CCP, maximum photosynthetic capacity (Amax), and photorespiration rate (Rp) (Figures 4B, C) as per the CO2 response curve fitting formula.
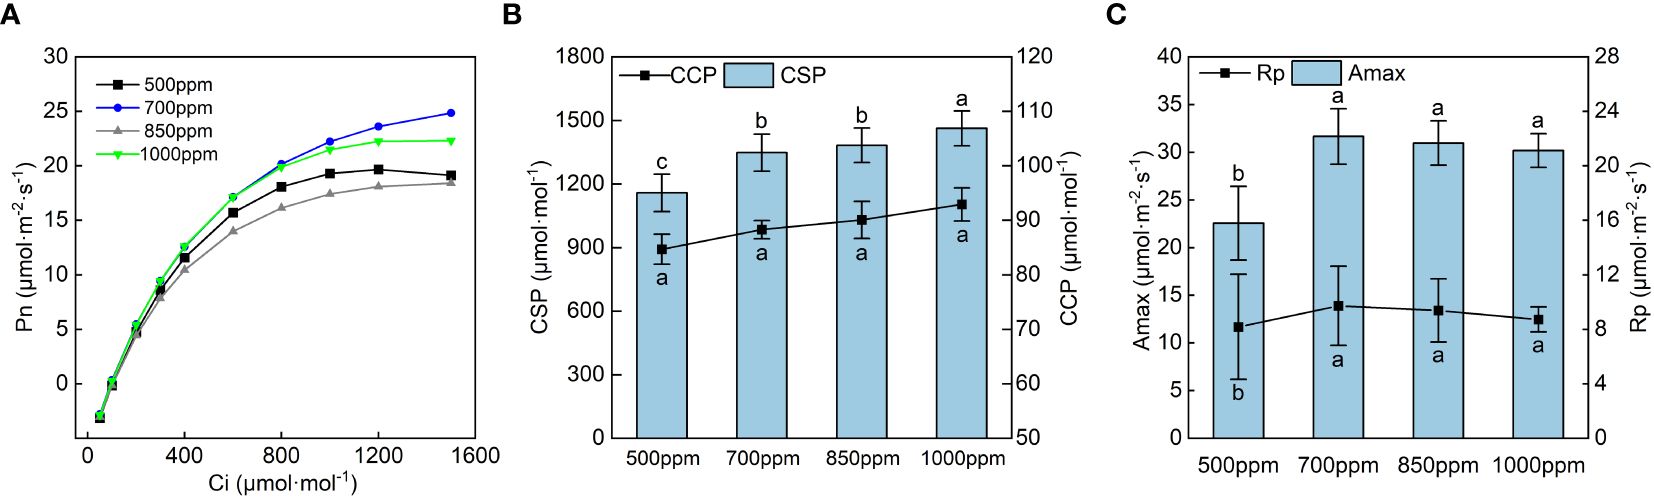
Figure 4 Effects of different CO2 concentrations on the CO2 response curve and its characteristic parameters of grapevine leaves. Data are the mean ± standard error (n = 3). In the same color, different letters indicate significant differences by Duncan’s test among treatments (P < 0.05). (A) 500 ppm, CO2 concentration of 500 ± 30 µmol·mol−1; 700 ppm, CO2 concentration of 700 ± 30 µmol·mol−1; 850 ppm, CO2 concentration of 850 ± 30 µmol·mol−1; 1,000 ppm, CO2 concentration of 1,000 ± 30 µmol·mol−1. (B) CSP, CO2 saturation point; CCP, CO2 compensation point. (C) Amax, maximum photosynthetic capacity; Rp, photorespiration rate.
As seen in Figure 4B, the CSP and CCP showed a trend of increasing gradually with the increase in CO2 concentration, and the Amax and Rp showed a trend of increasing first and then decreasing with the rise in CO2 concentration. CCP showed the sequence of 850 ppm > 700 ppm > 1,000 ppm > 500 ppm, and the Amax and Rp of the leaves showed the sequence of 700 ppm > 850 ppm > 1,000 ppm > 500 ppm Figure 4C. As shown in Figure 5, both the maximum carboxylation rate and the maximum electron transfer rate showed the same change trend with the Amax. The leaves treated at 700 ppm had the highest maximum carboxylation and electron transfer rates, followed by those treated at 850 ppm. Both the maximum carboxylation rate and the maximum electron transfer rate of the leaves treated with 700 ppm significantly increased by 54.57% and 51.37% (P < 0.05), respectively, compared with those treated with 500 ppm.
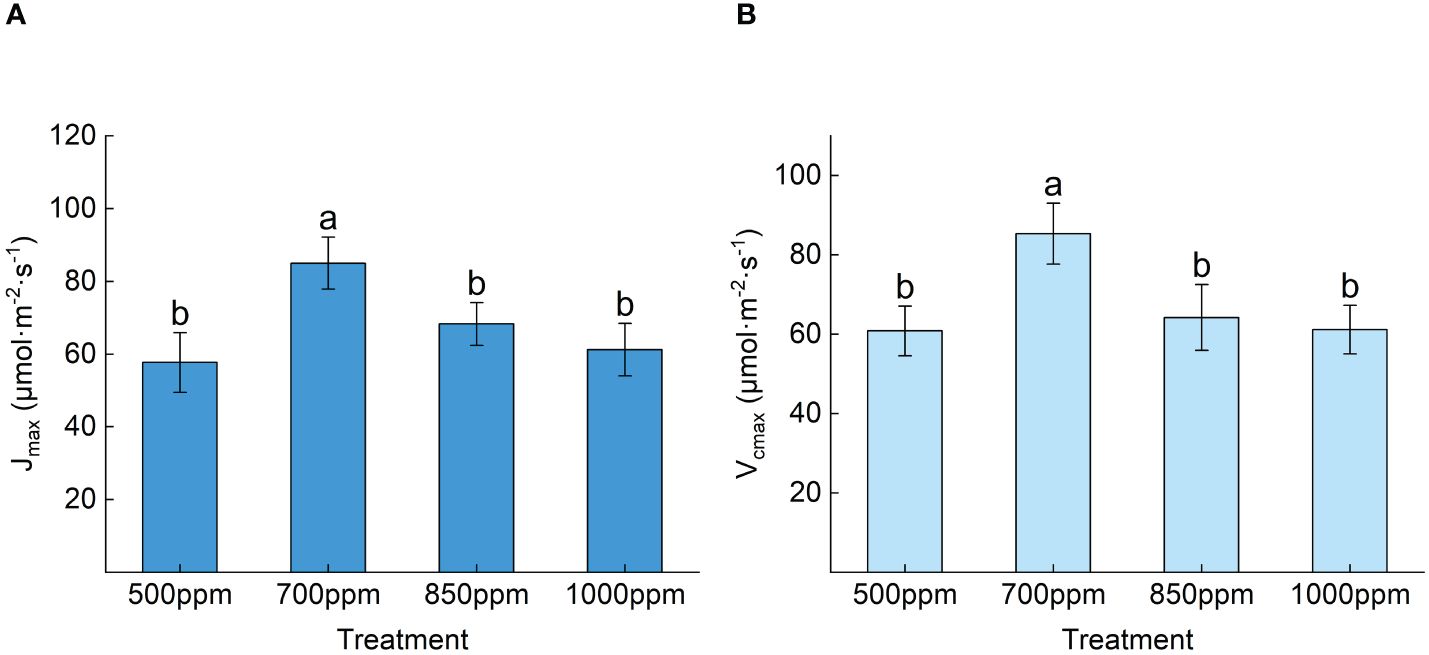
Figure 5 Effect of different CO2 concentrations on the maximum carboxylation rate and maximum electron transfer rate of ‘Flame Seedless’ grape leaves. Data are the mean ± standard error (n = 3). Different letters indicate significant differences by Duncan’s test among treatments (P < 0.05). (A) Maximum electron transfer rate of blades under different treatments. (B) Maximum carboxylation efficiency of the leaves under different treatments. 500 ppm, CO2 concentration of 500 ± 30 µmol·mol−1; 700 ppm, CO2 concentration of 700 ± 30 µmol·mol−1; 850 ppm, CO2 concentration of 850 ± 30 µmol·mol−1; 1,000 ppm, CO2 concentration of 1,000 ± 30 µmol·mol−1.
3.5 Effect of different CO2 concentrations on the activity of related enzymes in the leaves of ‘Flame Seedless’ grapes
As shown in Figure 6, the activity of SOD, POD, CAT, and PPO showed a trend of increasing first and then decreasing with the increase of CO2 concentration. Both CAT and SOD in different treatments showed a sequence of 850 ppm > 700 ppm > 1,000 ppm > 500 ppm, while POD and PPO in different treatments showed a sequence of 700 ppm > 850 ppm > 500 ppm > 1,000 ppm. As shown in Figure 7, RuBisCO activity offered the same change trend with CAT, SOD, POD, and PPO with the increase of CO2 concentration. RuBisCO activity of the leaves treated with 700 ppm and 850 ppm was significantly increased by 89.11% and 66.12%, respectively, compared with that of the leaves treated with 500 ppm (P < 0.05) (Figure 7).
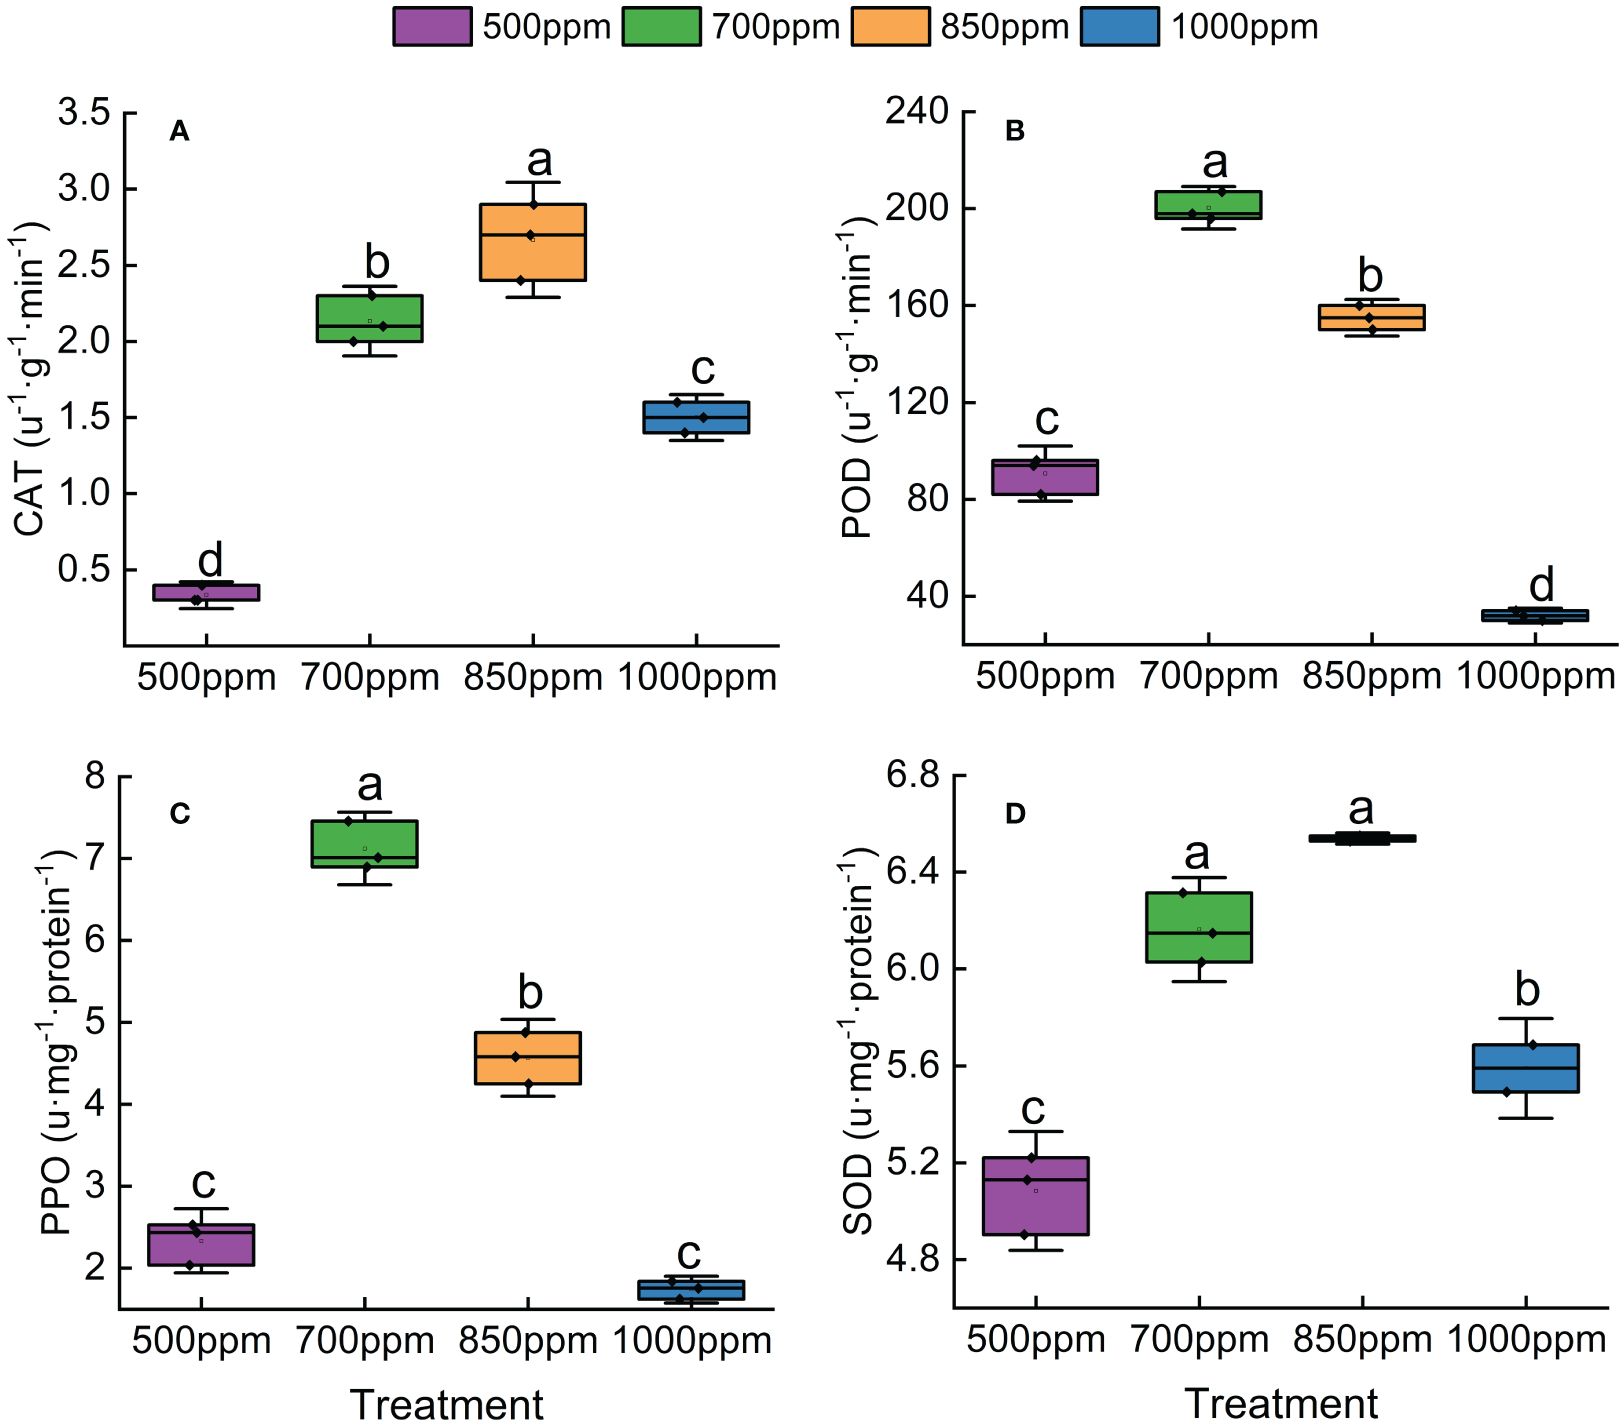
Figure 6 Effect of different CO2 concentrations on antioxidant enzymes in ‘Flame Seedless’ grape leaves. (A) Catalase activity under different treatments. (B) Peroxidase activity under different treatments. (C) Polyphenol oxidase activity under different treatments. (D) Superoxide dismutase activity under different treatments. Data are the mean ± standard error (n = 3). Different letters indicate significant differences by Duncan’s test among treatments (P < 0.05). 500 ppm, CO2 concentration of 500 ± 30 µmol·mol−1; 700 ppm, CO2 concentration of 700 ± 30 µmol·mol−1; 850 ppm, CO2 concentration of 850 ± 30 µmol·mol−1; 1,000 ppm, CO2 concentration of 1,000 ± 30 µmol·mol−1.
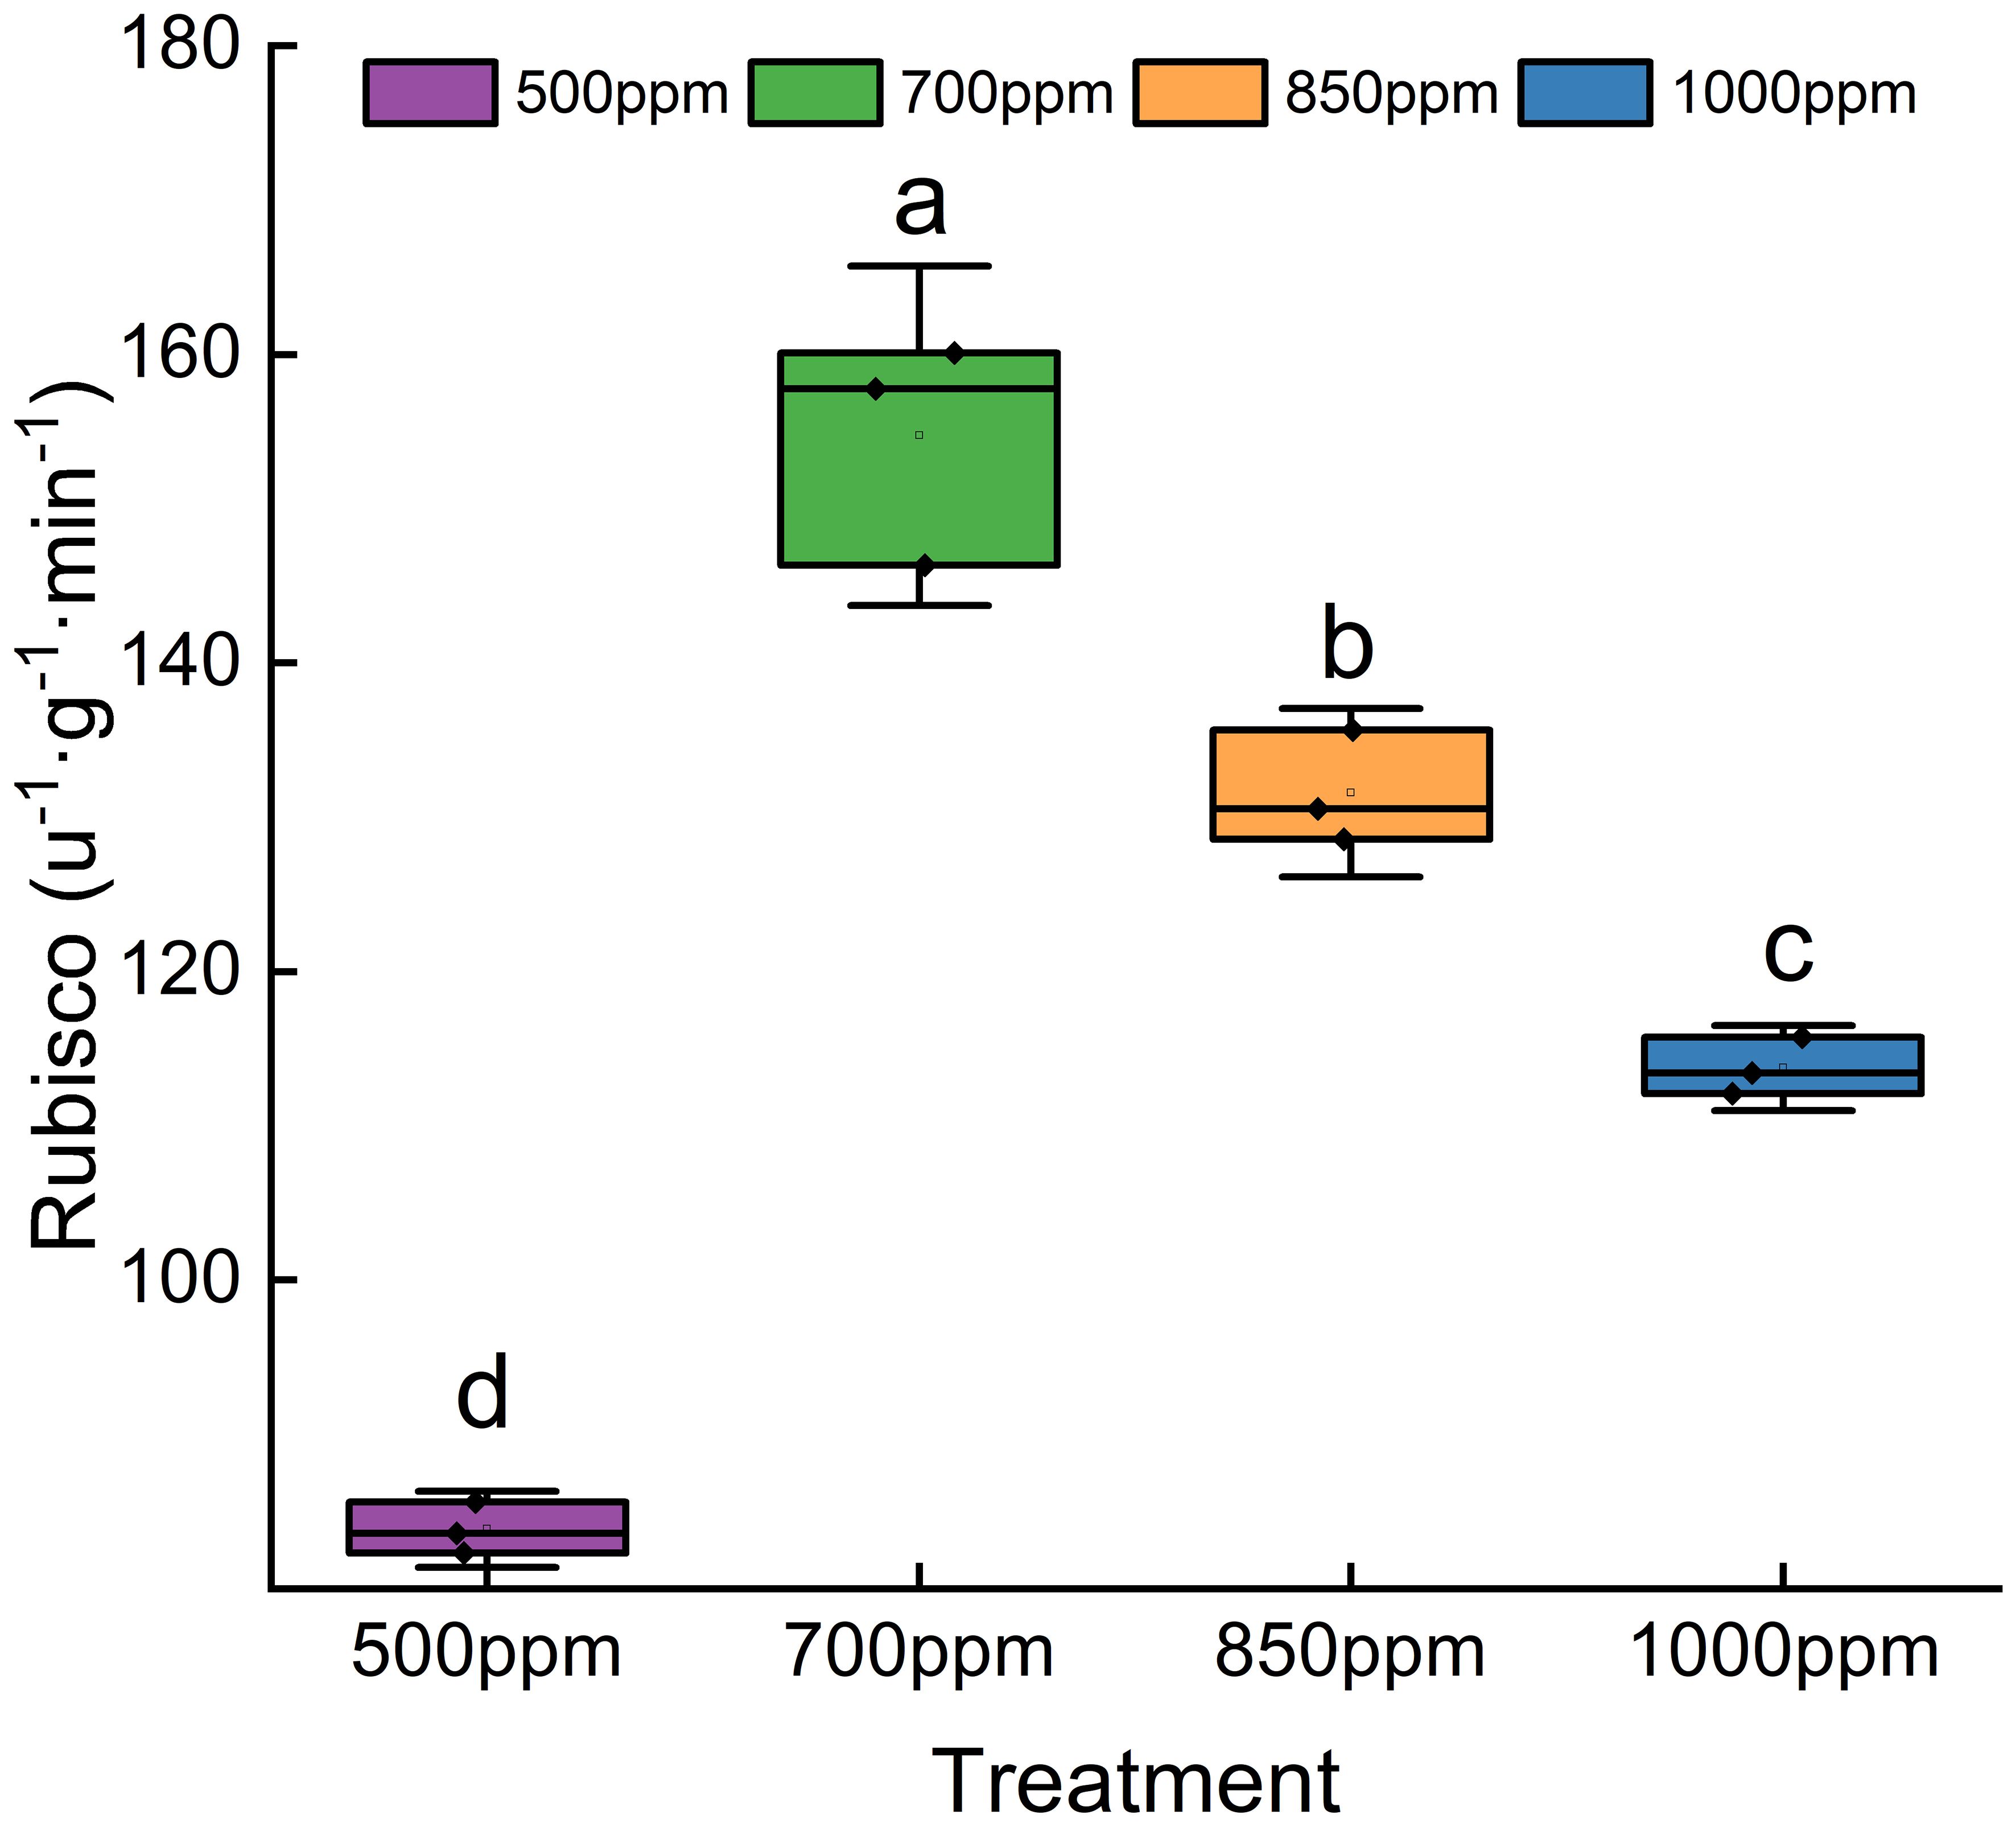
Figure 7 Effect of different CO2 concentrations on RuBisCO activity in ‘Flame Seedless’ grape leaves. Data are the mean ± standard error (n = 3). Different letters indicate significant differences by Duncan’s test among treatments (P < 0.05). 500 ppm, CO2 concentration of 500 ± 30 µmol·mol−1; 700 ppm, CO2 concentration of 700 ± 30 µmol·mol−1; 850 ppm, CO2 concentration of 850 ± 30 µmol·mol−1; 1,000 ppm, CO2 concentration of 1,000 ± 30 µmol·mol−1.
3.6 Effect of different CO2 concentrations on the yield of ‘Flame Seedless’ grapes
As shown in Table 2, the single grape mass, mass per fruit cluster, and yield of ‘Flame Seedless’ grapes treated with different concentrations of CO2 showed the sequence of 700 ppm > 850 ppm > 1,000 ppm > 500 ppm. The single grape mass of the grapes treated with 700 ppm, 850 ppm, and 1,000 ppm significantly increased by 37.9%, 26.8%, and 21.8%, respectively, compared with those treated with 500 ppm (P < 0.05). The yield of the grapes treated with 700 ppm and 850 ppm was 14.54 t·hm−2 and 12.91 t·hm−2, respectively, 3.04 t·hm−2 and 1.41 t·hm−2 higher than the yield of the grapes treated with 500 ppm.
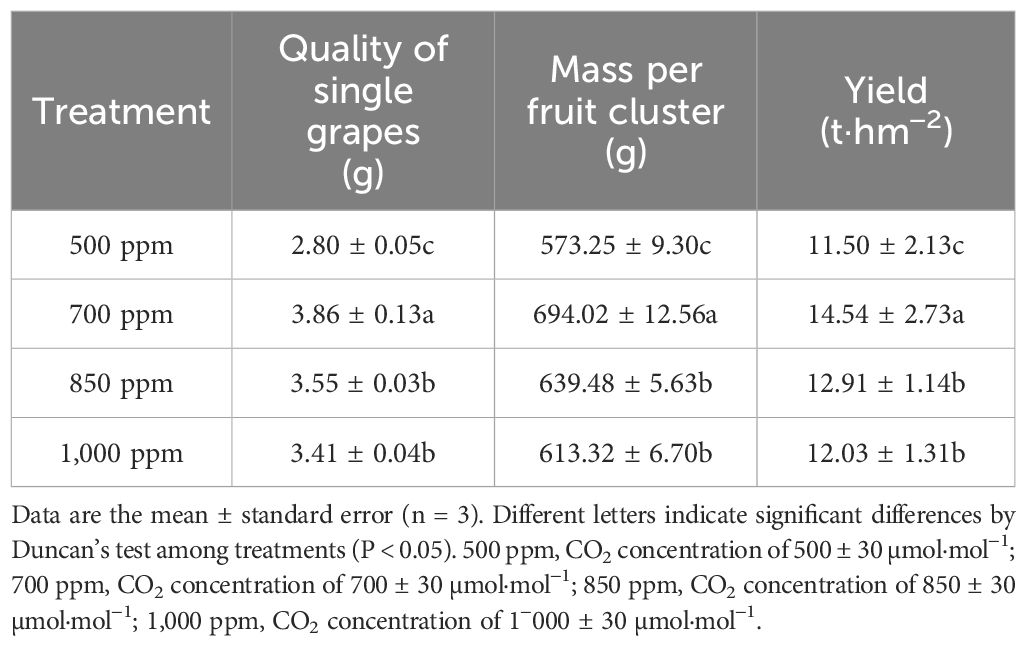
Table 2 Effect of different CO2 concentrations on the yield components and yield of ‘Flame Seedless’ grapes.
3.7 Correlation of leaf photosynthetic pigment content, photosynthetic characteristics, photosynthetic CO2 curve characteristic parameters, and related enzyme activities with fruit yield
As shown in Figure 8, the SGW of ‘Flame Seedless’ grapes showed a highly significant positive correlation with the LSP, Vcmax, Pn, WUE, and RuBisCO activity (P ≤ 0.01) and offered a significant positive correlation with Chl a content and Chl b content (P ≤ 0.05). Fruit yield had a significant positive correlation with chlorophyll content, Chl b content, carotenoid content, LSP, Pn, WUE, Vcmax, CAT, POD, and RuBisCO activity (P ≤ 0.01) and a significant negative correlation with the Gs and Tr (P ≤ 0.01). In addition, the yield and SGW showed a significant negative correlation with carotenoid content (P < 0.05). Chlorophyll a and chlorophyll b contents significantly correlated with the CCP, Pn, Gs, and RuBisCO activity (P ≤ 0.05).
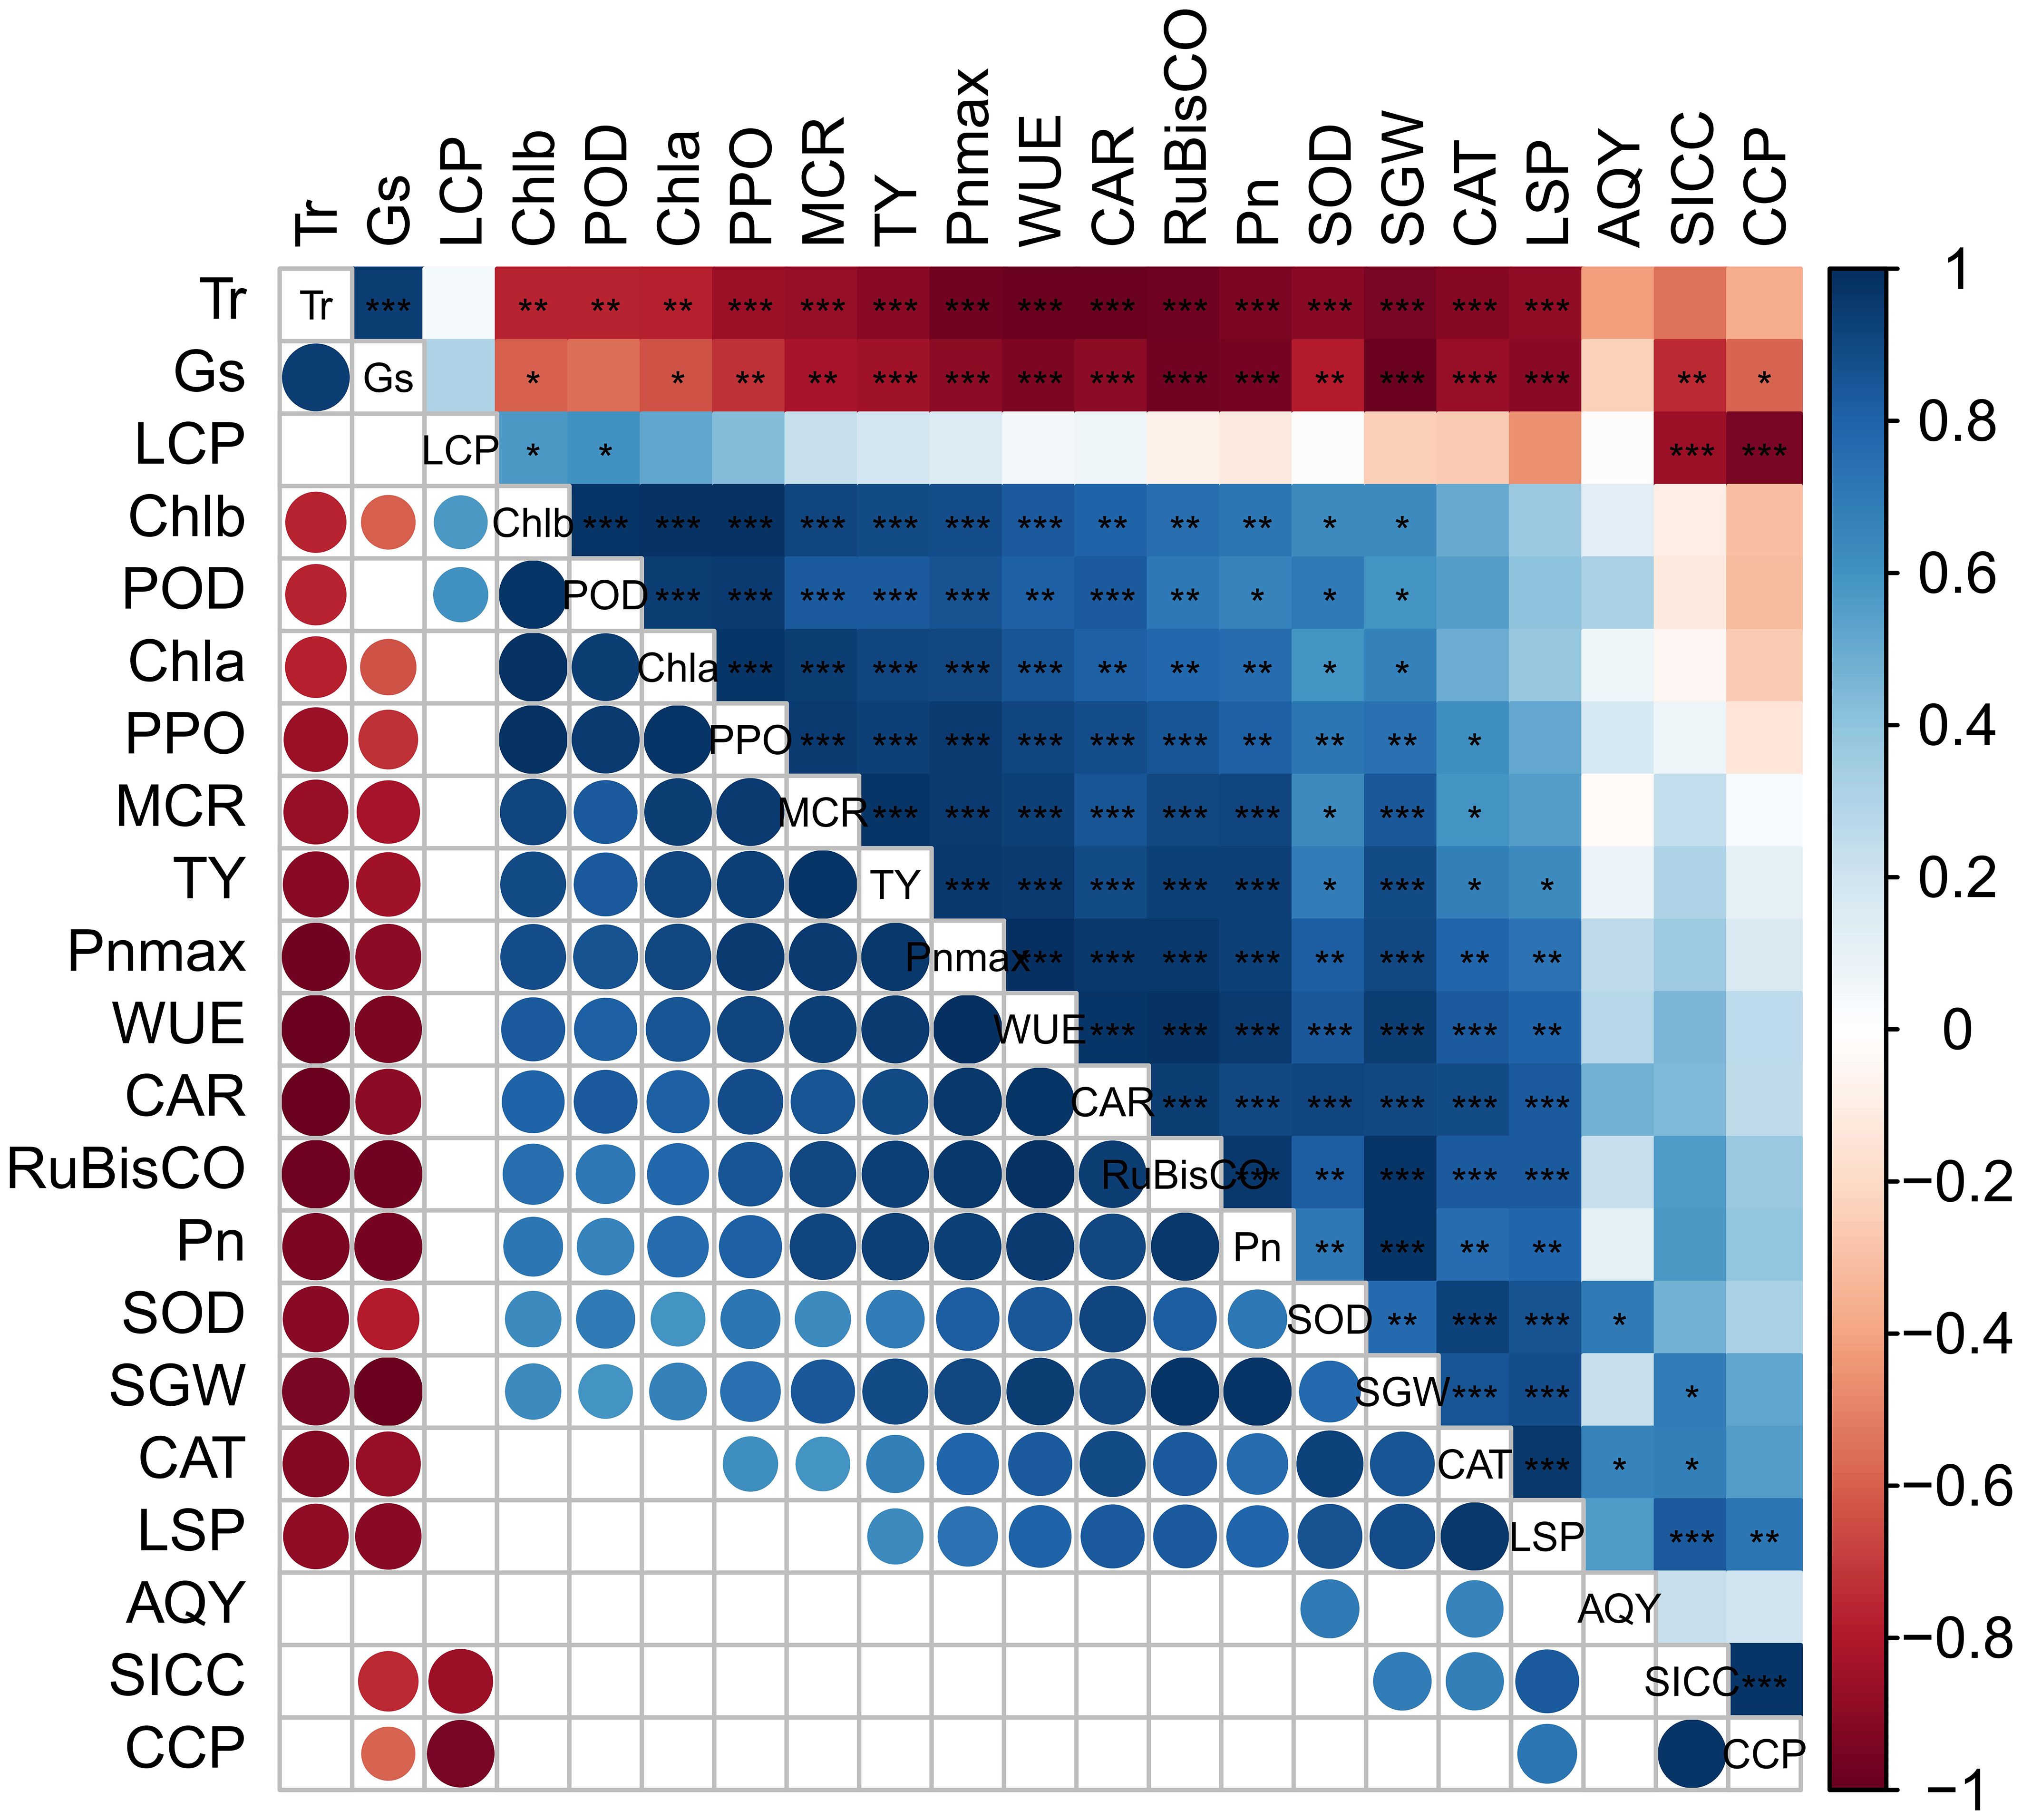
Figure 8 Correlation of leaf photosynthetic pigment content, photosynthetic characteristics, photosynthetic CO2 curve characteristic parameters, and related enzyme activities with fruit yield. Blue and red indicate significant positive and negative correlations, while white indicates no significant correlation. *: P ≤ 0.05; **: P ≤ 0.01; ***: P ≤ 0.001. CAR, carotenoid content in the leaves; CCP, CO2 compensation point; Pn, net photosynthetic rate; LCP, light compensation point; SICC, soil inorganic carbon content; SGW, single grape weight; LSP, light saturation point; MCR, maximum carboxylation rate of the leaves; Tr, transpiration rate; Gs, stomatal conductance; WUE, water use efficiency; AQY, apparent quantum yield; POD, peroxidase; CAT, catalase; SOD, superoxide dismutase; PPO, polyphenol oxidase; Pnmax, maximum net photosynthetic rate; Chl a, chlorophyll a content; Chl b, chlorophyll b content; TY, total yield; RuBisCO: RuBisCO activity.
4 Discussion
4.1 Effect of different CO2 concentrations on the content of photosynthetic pigments in the grapes in the same irrigation cycle
Photosynthetic pigments play a basic role in the photosynthesis of plants. There are two kinds of chlorophyll, namely, Chl a and Chl b, which functions to capture, transfer, and convert light energy (Palit et al., 2020). A large number of studies demonstrated that an increased application of CO2 helped increase the chlorophyll content in the leaves of tomatoes, rice, wheat, and corn (Wang et al., 2013; Mamatha et al., 2014; Ksiksi et al., 2018; Mao et al., 2021). According to the study by Ullah et al. (2021), high CO2 concentration could effectively increase chlorophyll a and chlorophyll b in wheat leaves at the filling stage of wheat (Ullah et al., 2021). The results of this study showed that the chlorophyll a and chlorophyll b contents in the leaves were higher than 500 ppm when the CO2 concentrations were 700 ppm and 850 ppm, respectively. However, according to a study related to cherries, the content of chlorophyll a and chlorophyll b in cherry trees was much lower than 700 ppm when the CO2 concentration was 1,400 ppm (Druta, 2001). Feng et al. (2022) discovered that chlorophyll b content in Schima superba seedlings was lower than 400 ppm when the CO2 concentration was 1,000 ppm. We also obtained similar results based on this study. When the CO2 concentration was 1,000 ppm, the content of chlorophyll a and chlorophyll b in the leaves was lower than that under other CO2 concentrations. This situation implied that a high CO2 concentration could reduce the chlorophyll content in ‘Flame Seedless’ grape leaves because a high concentration of CO2 would promote the rapid growth of plants, thus causing a dilution effect and reducing the chlorophyll content. Based on this study, we also discovered that the content of photosynthetic pigments in the leaves treated with 700 ppm and 850 ppm would decrease in a smaller amplitude with the increase of days after irrigation. The study of Han et al. (2023) showed that the content of photosynthetic pigments of American fringe trees gradually decreased with the deepening of soil water stress. The finding implied that the treatments with 700 ppm and 850 ppm under experimental conditions could effectively moderate the effect of drought and other adverse conditions on plant photosynthetic pigments. Based on a study, Kant et al. (2012) found that high CO2 concentrations led to a decrease in crop chlorophyll a/b. In this study, CO2 at concentrations of 700 ppm and 850 ppm reduced the content of chlorophyll a/b. In comparison, a high concentration of CO2 (1,000 ppm) increased the content of chlorophyll a/b probably because the high concentration of CO2 weakened the promotive effect for chlorophyll b. Known as the auxiliary pigment in photosynthetic pigments, carotenoids could transfer the absorbed light energy to chlorophyll (Ashikhmin et al., 2023). Wang et al. (2015) found that an appropriately high concentration of CO2 could promote the rapid increase of carotenoid content in C3 plants, while an abnormally high concentration of CO2 (3,000 ppm) inhibited the promotion effect. Bao et al., 2016 also found that high concentrations of CO2 increased the growth rate of plants and inhibited the increase of carotenoid content. In this experiment, when the concentration of CO2 was 1,000 ppm, the increase of carotenoid content in the leaves was less than 700 ppm and 850 ppm, which shows that a too high CO2 concentration would also inhibit the efficiency of carotenoid content in the leaves of ‘Flame Seedless’ grapes.
4.2 Effect of different CO2 concentrations on the photosynthetic characteristics of grape leaves in the same irrigation cycle
Photosynthesis plays a critical role in the growth of plants (Cheng et al., 2023). Plant photosynthesis uses CO2 as a substrate for reactions, and the photosynthetic capacity of plants increases with the increase in CO2 concentration (Sanchez-Lucas et al., 2023). Previous studies have found that in a specific range of atmospheric CO2 concentration, high concentrations of CO2 could promote the Pn and WUE of the plant leaves (Khamis et al., 2023). In this study, the Pn and WUE of the leaves treated with 700 ppm and 850 ppm of CO2 were significantly higher than those of the leaves treated with 1,000 ppm, indicating that an abnormally high CO2 concentration would inhibit the photosynthesis of the leaves. The possible reason was that an unusually high CO2 concentration, a relatively low O2 concentration, and anaerobic respiration of plants produced toxic effects of ethanol, lactic acid, and other substances, thus inhibiting photosynthesis. As demonstrated by the study of Scher et al. (2022), photosynthesis did not continue to increase with the increase of atmospheric CO2 concentration. Still, it could reflect the changes in stomatal response and transpiration rate. Some relevant studies suggest that the increase in CO2 concentration would reduce the stomatal conductance of plant leaves (Zhang et al., 2022b), and high CO2 concentration would reduce not only the stomatal conductance but also the transpiration rate of the leaves (Liang et al., 2023). Among the different CO2 concentrations used in this study, the leaves treated with 700 ppm had the lowest Gs and Tr but the highest Pn and WUE. A decrease in Gs and an increase of Amax due to the increase of CO2 concentration were identified as a significant cause of the increase in plant WUE. Furthermore, this study discovered that both Gs and Pn show a trend of gradual decrease with the increase of days after irrigation and have the lowest decreasing amplitude at the CO2 concentration of 700 ppm, indicating that the treatment with 700 ppm effectively mitigates the effect of drought and other stresses on plant photosynthetic characteristics.
4.3 Effect of different CO2 concentrations on the light response curve and characteristic parameters of plants
The utilization of light energy in plants plays a vital role in the whole process of plant growth and development (Lu et al., 2019), and the ability of the plant leaves to respond to light can be reflected by the change in the plant’s light response curve (Serôdio et al., 2022). We could calculate the LSP, LCP, Pnmax, and AQY of grape leaves per the fitting formula. According to relevant previous studies, the LCP of hops gradually decreased, and the AQY gradually increased with the increase of CO2 concentration (Bauerle, 2021). The study of Song et al. (2023) concluded that high CO2 concentration can increase the LSP and Pnmax of flue-cured tobacco, which coincided with the findings of this study. With the increase in CO2 concentration, the LCP of grapes decreased gradually, indicating that a high CO2 concentration can improve the ability of plants to utilize weak light. Plant LSP reflects the tolerance of plants to solid light (Pinnamaneni et al., 2022), and Pnmax reflects the maximum photosynthetic potential of plants (Niu et al., 2023). In this study, both LSP and Pnmax showed the sequence of 700 ppm > 850 ppm > 1,000 ppm > 500 ppm, indicating that the photosynthetic potential and tolerance of plants to solid light were the strongest when the CO2 concentration was 700 ppm, followed by 850 ppm. The AQY reflected the photosynthetic capacity of plants under weak light (Zhang et al., 2022a). In this study, the AQY of plants at 850 ppm CO2 concentration was the highest. In other words, when the CO2 concentration is 850 ppm, the plant has the strongest adaptability to weak light. The results of this study showed that the appropriately high concentration of CO2 can significantly improve the photosynthetic curve characteristic parameters of ‘Flame Seedless’ grapes. Specifically, the CO2 concentration of 700 ppm and 850 ppm contributed to the optimal effect.
4.4 Effect of different CO2 concentrations on the CO2 response curve and characteristic parameters of plants
We can judge the level of demand for CO2 in the external environment according to the change in CO2 response characteristic parameters. The main photosynthetic curve characteristic parameters are the CSP, CCP, Amax, Rp, Vcmax, and Jmax. Vcmax and Jmax are two critical parameters that characterize the photosynthetic capacity of plants (Bermudez et al., 2021). The study of Fauset et al. (2019) showed that a high CO2 concentration significantly increases Vcmax and Jmax. According to the findings of this study, both Vcmax and Jmax of the plants treated with 700 ppm and 850 ppm of CO2 were significantly higher than those of the plants treated with 500 ppm, probably because an appropriate increase of CO2 concentration has increased the substrate of photosynthesis and then promoted the rate of carboxylation and the rate of electron transfer in the plant. An appropriate increase in CO2 concentration can effectively promote the carboxylation rate and electron transfer rate of ‘Flame Seedless’ grapes. The study of Lamba et al. (2018) on Picea suggested that an abnormally high CO2 concentration would inhibit the increase of Vcmax and Jmax. We have obtained a similar result with the above study, indicating that Vcmax and Jmax of the plants treated with 1,000 ppm were significantly lower than those of the plants treated with other concentrations of CO2. This may be due to the continuous increase in CO2 concentration, which accelerates the accumulation of plant biomass and reduces the N content in plant leaves, leading to an overall decrease in leaf protein content, resulting in a decrease in the quantity or activity of RuBisCO protein per unit leaf area of plants, ultimately limiting the carboxylation efficiency of RuBP (Andrews et al., 2019). In accordance with the study of Xiao et al. (2020), high CO2 concentration significantly increased the CSP, CCP, and Amax of plants and reduces the Rp. In this study, the CO2 concentrations of 700 ppm and 850 ppm significantly increased the CSP, CCP, and Amax of ‘Flame Seedless’ grapes. However, the CO2 concentration of 1,000 ppm reduced the Amax of the grapes. The possible reason was that a high CO2 concentration reduces plant WUE and inhibits plant photosynthesis, thereby weakening the maximum photosynthetic capacity of the plants. When the CO2 concentration was 700 ppm, ‘Flame Seedless’ grapes have higher photosynthetic performance and stronger carbon fixation and carboxylation capacity.
4.5 Effect of different CO2 concentrations on the activity of antioxidant enzymes and RuBisCO in the leaves of grapes
CAT, POD, SOD, and PPO have been identified as four important protective enzymes in the plant antioxidant enzyme system (Sinan et al., 2020; Gouda et al., 2023). The relevant previous studies demonstrated that the activity of antioxidant enzymes in plants increases with the increase of CO2 concentration and then decreases sharply or gradually after reaching a peak value (Hu et al., 2020). In this study, the activity of CAT and SOD increased sharply with the increase of CO2 concentration when the CO2 concentration was in the range of 500 ppm to 850 ppm, reached the maximum when the CO2 concentration was 850 ppm, and decreased sharply since then. The activity of POD and PPO increased sharply with the increase of CO2 concentration when the CO2 concentration was in the range of 500 ppm to 700 ppm, reached the maximum when the CO2 concentration was 700 ppm, and decreased gradually since then. This conclusion coincides with the findings of the relevant previous studies (Zhang et al., 2020). It indicates that CO2 in a specific range of concentrations can effectively protect grape leaves from oxidative damage probably because the increase of CO2 concentration could enhance stomatal resistance, reduce transpiration rate, and increase the WUE, thereby resulting in a stronger tolerance of plants to stress. Moreover, more nicotinamide adenine dinucleotide phosphate (NADPH) was formed by the electron transfer system in the process of photosynthesis regulation with the increase of CO2 concentration, thus promoting the ascorbate–glutathione cycle and improving the activity of related antioxidant enzymes. Aydi et al. (2020) believed that the decrease in antioxidant enzyme activity was caused by the situation that CO2 enrichment reduced the demand of removing active oxygen in cellular metabolism. The decrease of antioxidant enzyme activity in the grapes treated with a high concentration of CO2 was probably caused by the situation that CO2 enrichment can increase the pCO2/O2 ratio and CO2 assimilation and reduce the formation of active oxygen with O2 as electron acceptors. However, the increase in CO2 concentration can reduce H2O2 formed by photorespiration. Furthermore, the increase in CO2 concentration may reduce the demand of cells for antioxidant activity. Plant photosynthetic performance was jointly affected by the leaf antioxidant system, RuBisCO activity, and other related factors. As demonstrated by the study of Sharwood et al. (2016), an appropriate CO2 concentration can promote RuBisCO carboxylation activity and then enhance plant photosynthesis. This study showed that RuBisCO activity increased rapidly when the CO2 concentration was 500 ppm to 700 ppm, reached the maximum when the CO2 concentration was 700 ppm, and decreased slowly since then. This situation suggests that an appropriate increase of CO2 activity can effectively promote RuBisCO activity of ‘Flame Seedless’ grape leaves but an abnormally high concentration would inhibit the initial promotive effect of CO2. The possible reason was that the distribution of nutritional elements in plant bodies was affected if the CO2 concentration was too high. As a result, RuBisCO synthesis was inhibited.
4.6 Effect of different CO2 concentrations on the yield of ‘Flame Seedless’ grapes and correlation between the indicators
CO2 concentration is one of the important environmental factors affecting photosynthesis. Increased CO2 concentration helps promote the photosynthetic reaction rate of plants and accelerate plant growth and yield accumulation (Yamaura et al., 2023). A large number of scholars have conducted extensive studies to explore the effect of increased atmospheric CO2 concentration on plant photosynthesis and yield and concluded that increased CO2 concentration could promote plant photosynthesis and yield (Kanno et al., 2017; Choi and Kang, 2019; Akhlaq et al., 2023). According to the results of this test, CO2 concentrations of 700 ppm and 850 ppm had significantly increased single grape weight and total yield. When the CO2 concentration was 700 ppm, the largest increasing amplitude occurred. The smallest increasing amplitude was when the CO2 concentration was 1,000 ppm. The yield of grapes treated with 700 ppm and 850 ppm of CO2 has been increased by 3.03 t·hm−2 and 1.41 t·hm−2, respectively, compared with those treated with 500 ppm. As reflected by the above data, the increasing amplitude of single grape weight and yield of the grapes treated with 1,000 ppm had decreased probably because an abnormally high CO2 concentration (1,000 ppm) will reduce the concentration of most mineral elements in plant bodies, thereby inhibiting plant yield. Many studies demonstrate that photosynthetic pigment content, photosynthetic characteristic parameters, and photosynthetic performance have a direct effect on the final yield of plants (Peng et al., 2020; Markovic et al., 2021; Zhang et al., 2023a). As reflected by the findings of this study, fruit yield showed a highly significant positive correlation with the Pn, WUE, photosynthetic pigment content, and RuBisCO activity and a significant positive correlation with the antioxidant enzyme activity of the leaves. The above correlations indicated that photosynthetic upregulation can effectively promote the formation of ‘Flame Seedless’ grape yield, and an enhanced antioxidant system can help avoid severe yield reductions of ‘Flame Seedless’ grapes. The RuBisCO activity of plant leaves mainly reflects the RuBP carboxylation rate. Any change in the activity will directly affect the carbon fixation and carboxylation capacity of the plants and further affect the formation of fruit yield (Tanambell et al., 2024). According to the correlation between RuBisCO activity and yield in this study, the increased RuBisCO activity could improve the carbon assimilation efficiency of ‘Flame Seedless’ grapes, thus promoting the formation of fruit yield.
5 Conclusion
In conclusion, CO2 concentrations of 700 ppm and 850 ppm significantly increased the photosynthetic pigment content and physiological characteristics of grape leaves, promoting an increase in grape yield. The photosynthetic pigment content was higher in CO2 concentrations of 700 ppm and 850 ppm than in other treatments, with leaf stomatal conductance and transpiration rate lower in CO2 concentration of 700 ppm than in other treatments. The light saturation point, CO2 saturation point, and maximum photosynthetic capacity are all at their maximum values when the CO2 concentration is 700 ppm. The antioxidant enzyme activity is higher than the other treatments, and the yield is the highest, at 14.54 t·hm−2. Compared to the control treatment, the yield increased by 3.04 t·hm−2. The promotion effect of plant photosynthesis and yield is better when the CO2 concentration is 700 ppm. When the CO2 concentration is 1,000 ppm, grape photosynthesis is inhibited. This study provides a certain theoretical basis for achieving carbon neutrality and green and sustainable development under the conditions of digital agriculture in future facility production. Due to limitations in research content, this paper only compares the aboveground photosynthetic performance and fruit yield. Further research is needed on the impact of different CO2 concentrations on the rhizosphere environment.
Data availability statement
The original contributions presented in the study are included in the article/supplementary material. Further inquiries can be directed to the corresponding authors.
Author contributions
YZ: Writing – original draft. HM: Writing – original draft. JX: Writing – review & editing. DY: Writing – review & editing. HZ: Writing – review & editing. XL: Writing – review & editing. KY: Writing – review & editing. FZ: Writing – review & editing.
Funding
The author(s) declare financial support was received for the research, authorship, and/or publication of this article. This study was supported by the National Natural Science Foundation of China (32360718), the Corps “Strong Youth” Scientific and Technological Innovation Talent Program (2023CB008–05), the Shihezi University Scientific Research Program (CXBJ202002, RCZK201925), and the Tianshan Talent - Three Agricultural Talent Program, Bashi Division Project of Key Talents in Science and Technology Innovation for Middle-Aged and Young People in Shihezi City (2022RC01).
Acknowledgments
We would like to express our sincere thanks to Guangxin Zhang and Xiaobo Li for their assistance in the field.
Conflict of interest
The authors declare that the research was conducted in the absence of any commercial or financial relationships that could be construed as a potential conflict of interest.
Publisher’s note
All claims expressed in this article are solely those of the authors and do not necessarily represent those of their affiliated organizations, or those of the publisher, the editors and the reviewers. Any product that may be evaluated in this article, or claim that may be made by its manufacturer, is not guaranteed or endorsed by the publisher.
References
Ainsworth, E. A., Long, S. P. (2021). 30 years of free-air carbon dioxide enrichment (FACE): What have we learned about future crop productivity and its potential for adaptation? Global Change Biol. 27, 27–49. doi: 10.1111/gcb.15375
Akhlaq, M., Chuan, Z., Haofang, Y., Shaowei, L., Ni, Y., Zhou, J., et al. (2023). Exploring adequate CO2 elevation for optimum tomato growth and yield under protected cultivation. J. Plant Physiol. 289, 154093. doi: 10.1016/j.jplph.2023.154093
Andrews, M., Condron, L. M., Kemp, P. D., Topping, J. F., Lindsey, K., Hodge, S., et al. (2019). Elevated CO2 effects on nitrogen assimilation and growth of C3 vascular plants are similar regardless of N-form assimilated. J. Exp. Bot. 70, 683–690. doi: 10.1093/jxb/ery371
Ariura, R., Matsumoto, M., Li, J., Fuse, T., Aoki, T., Zhang, Y., et al. (2023). Effects of elevated ozone and carbon dioxide on the dynamic photosynthesis of Fagus crenata seedlings under variable light conditions. Sci. Total Environ. 891, 164398. doi: 10.1016/j.scitotenv.2023.164398
Ashikhmin, A., Bolshakov, M., Pashkovskiy, P., Vereshchagin, M., Khudyakova, A., Shirshikova, G., et al. (2023). The adaptive role of carotenoids and anthocyanins in solanum lycopersicum pigment mutants under high irradiance. Cells. 12, 2569. doi: 10.3390/cells12212569
Aydi, S. S., Aydi, S., Kolsi, R. B. A., Haddeji, N., Rahmani, R., Ktari, N., et al. (2020). CO2 enrichment: enhancing antioxidant, antibacterial and anticancer activities in arthrospira platensis. Food Biosci. 35, 100575. doi: 10.1016/j.fbio.2020.100575
Bao, L., Dong, J., Li, X., Duan, Z. (2016). Effects of elevated CO2 concentration and nitrogen supply on photosynthetic pigments in cucumber leaves. soil 48, 653–660. doi: 10.13758/j.cnki.tr.2016.04.005
Bauerle, W. L. (2021). Intracanopy CO2 and light interactions on Humulus lupulus L. net canopy carbon gain under current and future atmospheric CO2 concentrations. Agr. For. Meteorol. 310, 108621. doi: 10.1016/j.agrformet.2021.108621
Bermudez, R., Stefanski, A., Montgomery, R. A., Reich, P. B. (2021). Short and long term responses of photosynthetic capacity to temperature in four boreal tree species in a free-air warming and rainfall manipulation experiment. Tree Physiol. 41, 89–102. doi: 10.1093/treephys/tpaa115
Cakmak, I., Marschner, H. (1992). Magnesium-deficiency and high light-intensity enhance activities of superoxide-dismutase, ascorbate peroxidase, and glutathione-reductase in bean-leaves. Plant Physiol. 98, 1222–1227. doi: 10.1104/pp.98.4.1222
Cheng, B., Yang, Z., Chen, F., Yue, L., Cao, X., Li, J., et al. (2023). Biomass-derived carbon dots with light conversion and nutrient provisioning capabilities facilitate plant photosynthesis. Sci. Total Environ. 901, 165973. doi: 10.1016/j.scitotenv.2023.165973
Choi, H. G., Kang, N. J. (2019). Effect of light and carbon dioxide on photosynthesis, chlorophyll fluorescence, and fruit yield in strawberry (Fragari x ananassa Duch.) plants. J. Berry Res. 9, 51–61. doi: 10.3233/JBR-18303
Choi, I. L., Yoon, J. S., Yoon, H. S., Choi, K., Kim, I., Kang, H. M. (2017). Effects of carbon dioxide fertilization on the quality and storability of strawberry ‘Maehyang’. Protected Horticulture Plant Factory 26, 140–145. doi: 10.12791/KSBEC.2017.26.2.140
Davis, W. J. (2023). Mass extinctions and their relationship with atmospheric carbon dioxide concentration: implications for earth’s future. Earths Future. 11, e2022EF003336. doi: 10.1029/2022EF003336
Dorneles, K. D. R., Rebhahn, I., Zeist, A. R., Deuner, S., Dallagnol, L. J. (2019). Morpho-physiological aspects and production of tomato under elavated concentration of atmospheric CO2. Rev. Bras. Cienc. Agrarias-Agraria. 14. doi: 10.5039/agraria.v14i1a5605
Druta, A. (2001). Effect of long term exposure to high CO2 concentrations on photosynthetic characteristics of Prunus avium L. plants. Photosynthetica. 39, 289–297. doi: 10.1023/a:1013757309826
Fauset, S., Oliveira, L., Buckeridge, M. S., Foyer, C. H., Galbraith, D., Tiwari, R., et al. (2019). Contrasting responses of stomatal conductance and photosynthetic capacity to warming and elevated CO2 in the tropical tree species Alchomea glandulosa under heatwave conditions. Environ. Exp. Bot. 158, 28–39. doi: 10.1016/j.envexpbot.2018.10.030
Feng, Y. X., Shang, H., Cao, J., Ni, B., Chai, L. (2022). Elevating and nitrogen application on the physiological characteristics of schima superba seedlings. J. Ecol. Environ. 31, 1773–1782. doi: 10.16258/j.cnki.1674-5906.2022.09.007
Gamage, D., Thompson, M., Sutherland, M., Hirotsu, N., Makino, A., Seneweera, S. (2018). New insights into the cellular mechanisms of plant growth at elevated atmospheric carbon dioxide concentration. Plant Cell Environ. 41, 1233–1246. doi: 10.1111/pce.13206
Gouda, M., Nassarawa, S. S., Gupta, S. D., Sanusi, N. I. I., Nasiru, M. M. (2023). Evaluation of carbon dioxide elevation on phenolic compounds and antioxidant activity of red onion (Allium cepa L.) during postharvest storage. Plant Physiol. Bioch. 200, 107752. doi: 10.1016/j.plaphy.2023.107752
Han, R., Han, L., Zhang, J. (2023). Effects of drought stress on photosynthetic characteristics and leaf structure of American tassel seedlings. J. Plant Res. Environ. 32, 61–70. doi: 10.3969/j.issn.1674-7895.2023.03.07
Hou, L., Shang, M., Chen, Y., Zhang, J., Xu, X., Song, H., et al. (2021). Physiological and molecular mechanisms of elevated CO2 in promoting the growth of pak choi (Brassica rapa ssp. chinensis). Sci. Hortic-Amesterdam. 288, 110318. doi: 10.1016/j.scienta.2021.110318
Hu, Y., Hao, Y., Wei, Z., Cui, H., Zhan, Y. (2020). Effect of 1-MCP coupling with carbon dioxide treatment on antioxidant enzyme activities and quality of fresh-cut Fuji apples. J. Food Process. Pres. 44, e14903. doi: 10.1111/jfpp.14903
Jin, C., Lei, H., Chen, J., Xiao, Z., Leghari, S. J., Yuan, T., et al. (2023). Effect of soil aeration and root morphology on yield under aerated irrigation. Agronomy-Basel. 13, 369. doi: 10.3390/agronomy13020369
Jo, N. Y., Lee, J., Byeon, J. E., Park, H. J., Ryoo, J. W., Hwang, S. G. (2022). Elevated CO2 concentration induces changes in plant growth, transcriptome, and antioxidant activity in fennel (Foeniculum vulgare Mill.). Front. Plant Sci. 13. doi: 10.3389/fpls.2022.1067713
Kanno, K., Suzuki, Y., Makino, A. (2017). A small decrease in rubisco content by individual suppression of RBCS genes leads to improvement of photosynthesis and greater biomass production in rice under conditions of elevated CO2. Plant Cell Physiol. 58, 635–642. doi: 10.1093/pcp/pcx018
Kant, S., Seneweera, S., Rodin, J., Materne, M., Burch, D., Rothstein, S. J., et al. (2012). Improving yield potential in crops under elevated CO2: integrating the photosynthetic and nitrogen utilization efficiencies. Front. Plant Sci. 3, 162. doi: 10.3389/fpls.2012.00162
Khamis, G., Reyad, A. M., Alsherif, E. A., Madany, M. M. Y., Korany, S. M., Asard, H., et al. (2023). Elevated CO2 reduced antimony toxicity in wheat plants by improving photosynthesis, soil microbial content, minerals, and redox status. Front. Plant Sci. 14. doi: 10.3389/fpls.2023.1244019
Kimball, B. A. (2016). Crop responses to elevated CO2 and interactions with H2O, N, and temperature. Curr. Opin. Plant Biol. 31, 36–43. doi: 10.1016/j.pbi.2016.03.006
Kizildeniz, T., Mekni, I., Santesteban, H., Pascual, I., Morales, F., Irigoyen, J. J. (2015). Effects of climate change including elevated CO2 concentration, temperature and water deficit on growth, water status, and yield quality of grapevine (Vitis vinifera L.) cultivars. Agr. Water Manage. 159, 155–164. doi: 10.1016/j.agwat.2015.06.015
Ksiksi, T. S., Ppoyil, S. B. T., Palakkott, A. R. (2018). CO2 enrichment affects eco-physiological growth of maize and alfalfa under different water stress regimes in the UAE. Physiol. Mol. Biol. Pla. 24, 251–259. doi: 10.1007/s12298-018-0507-6
Lamba, S., Hall, M., Rantfors, M., Chaudhary, N., Linder, S., Way, D., et al. (2018). Physiological acclimation dampens initial effects of elevated temperature and atmospheric CO2 concentration in mature boreal Norway spruce. Plant Cell. Environ. 41, 300–313. doi: 10.1111/pce.13079
Lewin, K. F., Nagy, J., Nettles, W. R., Cooley, D. M., Rogers, A. (2009). Comparison of gas use efficiency and treatment uniformity in a forest ecosystem exposed to elevated CO2 using pure and prediluted free-air CO2 enrichment technology. Global Change Biol. 15, 388–395. doi: 10.1111/j.1365-2486.2008.01748.x
Liang, X., Wang, D., Ye, Q., Zhang, J., Liu, M., Liu, H., et al. (2023). Stomatal responses of terrestrial plants to global change. Nat. Commun. 14, 2188. doi: 10.1038/s41467-023-37934-7
Linkosalo, T., el-Khouri, H., Makipaa, R., Pulkkinen, P., Juurola, E. (2017). Increased atmospheric CO2 concentration enhances the development of photosynthetic capacity beyond the temperature effect for silver birch in simulated future climate. Scand. J. For. Res. 32, 651–657. doi: 10.1080/02827581.2016.1264086
Lu, T., Yu, H., Li, Q., Chai, L., Jiang, W. (2019). Improving plant growth and alleviating photosynthetic inhibition and oxidative stress from low-light stress with exogenous GR24 in tomato (Solanum lycopersicum L.) seedlings. Front. Plant Sci. 10. doi: 10.3389/fpls.2019.00490
Mamatha, H., Rao, N. K. S., Laxman, R. H., Shivashankara, K. S., Bhatt, R. M., Pavithra, K. C. (2014). Impact of elevated CO2 on growth, physiology, yield, and quality of tomato (Lycopersicon esculentum Mill) cv. Arka Ashish. Photosynthetica 52, 519–528. doi: 10.1007/s11099-014-0059-0
Mao, Q., Tang, L., Ji, W., Rennenberg, H., Hu, B., Ma, M. (2021). Elevated CO2 and soil mercury stress affect photosynthetic characteristics and mercury accumulation of rice. Ecotox. Environ. Safe. 208, 111605. doi: 10.1016/j.ecoenv.2020.111605
Markovic, S. M., Zivancev, D., Horvat, D., Torbica, A., Jovankic, J., Djukic, N. H. (2021). Correlation of elongation factor 1A accumulation with photosynthetic pigment content and yield in winter wheat varieties under heat stress conditions. Plant Physiol. Bioch. 166, 572–581. doi: 10.1016/j.plaphy.2021.06.035
Medda, S., Fadda, A., Mulas, M. (2022). Influence of climate change on metabolism and biological characteristics in perennial woody fruit crops in the mediterranean environment. Horticulturae 8, 273. doi: 10.3390/horticulturae8040273
Miyoshi, Y., Hidaka, K., Okayasu, T., Yasutake, D., Kitano, M. (2017). Effects of local CO2 enrichment on strawberry cultivation during the winter season. Environ. Control. Biol. 55, 165–170. doi: 10.2525/ecb.55.165
Niu, Y., Lyu, H., Liu, X., Zhang, M., Li, H. (2023). Photosynthesis prediction and light spectra optimization of greenhouse tomato based on response of red-blue ratio. Sci. Hortic-Amesterdam. 318, 112065. doi: 10.1016/j.scienta.2023.112065
Ofori-Amanfo, K. K., Klem, K., Vesela, B., Holub, P., Agyei, T., Marek, M. V., et al. (2021). Interactive effect of elevated CO2 and reduced summer precipitation on photosynthesis is species-specific: The case study with soil-planted Norway spruce and sessile oak in a mountainous forest plot. Forests 12, 42. doi: 10.3390/f12010042
Ouyang, Z., Tian, J., Yan, X., Shen, H. (2020). Effects of different concentrations of dissolved oxygen or temperatures on the growth, photosynthesis, yield and quality of lettuce. Agr. Water Manage. 228, 105896. doi: 10.1016/j.agwat.2019.105896
Palit, P., Ghosh, R., Tolani, P., Tarafdar, A., Chitikineni, A., Bajaj, P., et al. (2020). Molecular and physiological alterations in chickpea under elevated CO2 concentrations. Plant Cell Physiol. 61, 1449–1463. doi: 10.1093/pcp/pcaa077
Peng, X., Wang, B., Wang, X., Ni, B., Zuo, Z. (2020). Effects of different colored light-quality selective plastic films on growth, photosynthetic abilities, and fruit qualities of strawberry. Hortic. Sci. Technol. 38, 462–46+. doi: 10.7235/HORT.20200044
Pinnamaneni, S. R., Anapalli, S. S., Reddy, K. N. (2022). Photosynthetic response of soybean and cotton to different irrigation regimes and planting geometries. Front. Plant Sci. 13. doi: 10.3389/fpls.2022.894706
Rakhmankulova, Z. F., Shuyskaya, E. V., Prokofieva, M. Y., Saidova, L. T., Voronin, P. Y. (2023). Effect of elevated CO2 and temperature on plants with different type of photosynthesis: quinoa (C3) and amaranth (C4). Russ. J. Plant Physl+. 70, 117. doi: 10.1134/S1021443723601349
Reid, C. D., Tissue, D. T., Fiscus, E. L., Strain, B. R. (1997). Comparison of spectrophotometric and radioisotopic methods for the assay of Rubisco in ozone-treated plants. Physiol. Plantarum. 101, 398–404. doi: 10.1034/j.1399-3054.1997.1010221.x
Sanchez-Lucas, R., Mayoral, C., Raw, M., Mousouraki, M. A., Luna, E. (2023). Elevated CO2 alters photosynthesis, growth and susceptibility to powdery mildew of oak seedlings. Biochem. J. 480, 1429–1443. doi: 10.1042/BCJ20230002
Scher, M. A., Barclay, R. S., Baczynski, A. A., Smith, B. A., Sappington, J., Bennett, L. A., et al. (2022). The effect of CO2 concentration on carbon isotope discrimination during photosynthesis in Ginkgo biloba: implications for reconstructing atmospheric CO2 levels in the geologic past. Geochim. Cosmochi. Ac. 337, 82–94. doi: 10.1016/j.gca.2022.09.033
Serôdio, J., Moreira, D., Bastos, A., Cardoso, V., Frommlet, J., Frankenbach, S. (2022). Hysteresis light curves: a protocol for characterizing the time dependence of the light response of photosynthesis. Photosynth. Res. 154, 57–74. doi: 10.1007/s11120-022-00954-3
Sharwood, R. E., Ghannoum, O., Kapralov, M. V., Gunn, L. H., Whitney, S. M. (2016). Temperature responses of rubisco from paniceae grasses provide opportunities for improving C3 photosynthesis. Nat. Plant 2, 1–9. doi: 10.1038/nplants.2016.186
Shimomoto, K., Nishina, H., Takahashi, N., Takayama, K. (2017). Evaluation of effects of stomatal conductance and phosphate limitation on photosynthesis through a general measurement protocol of leaf photosynthesis environmental response. Eco-Engineering 29, 73–80. doi: 10.11450/seitaikogaku.29.73
Sinan, K. I., Martinovic, L. S., Persuric, Z., Pavelic, S. K., Grbcic, P., Matulja, D., et al. (2020). Metabolite characterization, antioxidant, anti-proliferative and enzyme inhibitory activities of Lophira lanceolata Tiegh. ex Keay extracts. Ind. Crop Prod. 158, 112982. doi: 10.1016/j.indcrop.2020.112982
Song, H., Wu, P., Lu, X., Wang, B., Song, T., Lu, Q., et al. (2023). Comparative physiological and transcriptomic analyses reveal the mechanisms of CO2 enrichment in promoting the growth and quality in Lactuca sativa. PloS One 18, e0278159. doi: 10.1371/journal.pone.0278159
Suboktagin, S., Khurshid, G., Bilal, M., Abbassi, A. Z., Kwon, S. Y., Ahmad, R. (2023). Improvement of photosynthesis in changing environment: approaches, achievements and prospects. Plant Biotechnol. Rep. 18, 21–22 doi: 10.1007/s11816-023-00871-4
Tanambell, H., Danielsen, M., Devold, T. G., Moller, A. H. (2024). In vitro protein digestibility of RuBisCO from alfalfa obtained from different processing histories: Insights from free N-terminal and mass spectrometry study. K.Food Chem. 434, 137301. doi: 10.1016/j.foodchem.2023.137301
Tang, X. L., Cao, Y. H., Zhou, B. Z., Zhou, Y., Gu, L. H. (2017). Comparison of light response modeling of photosynthesis in Castanopsis sclerophylla leaves under different CO2 concentrations. Shengtaixue Zazhi 36, 2060–2067. doi: 10.13292/j.1000-4890.201707.017
Ullah, A., Al-Rajhi, R. S., Al-Sadi, A. M., Farooq, M. (2021). Wheat genotypes with higher intercellular CO2 concentration, rate of photosynthesis, and antioxidant potential can better tolerate drought stress. J. Soil Sci. Plant Nutt. 21, 2378–2391. doi: 10.1007/s42729-021-00529-6
Vogel, E., Donat, M. G., Alexander, L. V., Meinshausen, M., Ray, D. K., Karoly, D., et al. (2019). The effects of climate extremes on global agricultural yields. Environ. Res. Lett. 14, 054010. doi: 10.1088/1748-9326/ab154b
Wang, A., Lv, J., Wang, J., Shi, K. (2022). CO2 enrichment in greenhouse production: Towards a sustainable approach. Front. Plant Sci. 13. doi: 10.3389/fpls.2022.1029901
Wang, L., Feng, Z., Schjoerring, J. K. (2013). Effects of elevated atmospheric CO2 on physiology and yield of wheat (Triticum aestivum L.): A meta-analytic test of current hypotheses. Agr. Ecosyst. Environ. 178, 57–63. doi: 10.1016/j.agee.2013.06.013
Wang, M., Xie, B., Fu, Y., Dong, C., Hui, L., Liu, G., et al. (2015). Effects of different elevated CO2 concentrations on chlorophyll contents, gas exchange, water use efficiency, and PSII activity on C3 and C4 cereal crops in a closed artificial ecosystem. Photosynth. Res. 126, 351–362. doi: 10.1007/s11120-015-0134-9
Wei, G., Zhang, M., Cui, B., Wei, Z., Liu, F. (2024). Ammonium nitrogen combined with partial root-zone drying enhanced fruit quality of tomato under elevated atmospheric CO2. Sci. Hortic-Amsterdam 323, 112514. doi: 10.1016/j.scienta.2023.112514
Xiao, S., Zhang, W., Huang, F., Gan, X., Cai, J., Zhu, Z. (2020). Effect of CO2 enrichment on the photosynthetic properties of silverleaf tree seedlings leaves under salt application treatments. China Soil Water Conserv. Sci. 18, 127–135. doi: 10.16843/j.sswc.2020.05.016
Yamaura, H., Kanno, K., Iwasaki, Y., Nakano, A., Isozaki, M. (2023). Controlling growth and carbohydrate utilization of tomato seedlings through day-night temperature difference and high light intensity under elevated CO2 conditions. Sci. Hortic-Amsterdam 322, 112427. doi: 10.1016/j.scienta.2023.112427
Ye, Z. (2010). A review on modeling of responses of photosynthesis to light and CO2. Chin. J. Plant Ecol. 34, 727–740. doi: 10.3773/j.issn.1005-264x.2010.06.012
Zhang, W., Li, Y., Xu, Y., Zheng, Y., Liu, B., Li, Q. (2023a). Alternate drip irrigation with moderate nitrogen fertilization improved photosynthetic performance and fruit quality of cucumber in solar greenhouse. Sci. Hortic-Amsterdam 308, 111579. doi: 10.1016/j.scienta.2022.111579
Zhang, X., Zhai, P., Huang, J. (2022a). Leaf carbon exchange of two dominant plant species impacted by water and nitrogen application in a Semi-Arid Temperate Steppe. Front. Plant Sci. 13. doi: 10.3389/fpls.2022.736009
Zhang, Y., Yao, Q., Shi, Y., Li, X., Hou, L., Xing, G., et al. (2020). Elevated CO2 improves antioxidant capacity, ion homeostasis, and polyamine metabolism in tomato seedlings under Ca(NO3)2-induced salt stress. Sci. Hortic-Amsterdam. 273, 109644. doi: 10.1016/j.scienta.2020.109644
Zhang, Y., Yasutake, D., Hidaka, K., Kimura, K., Okayasu, T., Kitano, M., et al. (2023b). Eco-friendly strategy for CO2 enrichment performance in commercial greenhouses based on the CO2 spatial distribution and photosynthesis. Sci. Rep-UK. 13, 17277. doi: 10.1038/s41598-023-44200-9
Zhang, Y., Zhao, Y., Lu, W., Yu, X., Zhang, X., Wang, Z., et al. (2022b). Effects of CO2 concentration and soil moisture content on short-term water use efficiency of plants at individual scales. J. Appl. Ecol. 33, 1505–1510. doi: 10.13287/j.1001-9332.202206.002
Zheng, E., Yang, H., Zhang, Z. (2018). Influence of different nitrogen forms application on rice photosynthesis: fluorescence with water-saving irrigation in black soil region of Songnen Plain, Northeast China. Paddy. Water Environ. 16, 795–804. doi: 10.1007/s10333-018-0670-y
Zhu, J., Niu, W., Zhang, Z., Siddique, K. H. M., Sun, D., Yang, R. (2022). Distinct roles for soil bacterial and fungal communities associated with the availability of carbon and phosphorus under aerated drip irrigation. Agr. Water Manage. 274, 107925. doi: 10.1016/j.agwat.2022.107925
Zong, Y. Z., Zhang, H. Q., Li, P., Zhang, D. S., Hao, X. Y., Gao, Z. Q. (2021). Leaf nitrogen have a better relationship with photosynthesis performance across wheat species under elevated CO2 and drought. Plant Physiol. Bioch. 166, 964–973. doi: 10.1016/j.plaphy.2021.07.002
Keywords: air injection system, CO2, grapes, photosynthesis, yield, subsurface drip
Citation: Zhou Y, Mahmoud Ali HS, Xi J, Yao D, Zhang H, Li X, Yu K and Zhao F (2024) Response of photosynthetic characteristics and yield of grape to different CO2 concentrations in a greenhouse. Front. Plant Sci. 15:1378749. doi: 10.3389/fpls.2024.1378749
Received: 30 January 2024; Accepted: 26 June 2024;
Published: 22 July 2024.
Edited by:
Alvaro Sanz-Saez, Auburn University, United StatesReviewed by:
Mostafa Gouda, National Research Centre, EgyptRunze Yu, California State University, Fresno, United States
Copyright © 2024 Zhou, Mahmoud Ali, Xi, Yao, Zhang, Li, Yu and Zhao. This is an open-access article distributed under the terms of the Creative Commons Attribution License (CC BY). The use, distribution or reproduction in other forums is permitted, provided the original author(s) and the copyright owner(s) are credited and that the original publication in this journal is cited, in accordance with accepted academic practice. No use, distribution or reproduction is permitted which does not comply with these terms.
*Correspondence: Kun Yu, eXVrdW40MTBAMTYzLmNvbQ==; Fengyun Zhao, emhhb2Zlbmd5dW5zaGloZXppQDE2My5jb20=
†These authors have contributed equally to this work and share first authorship