- 1National Engineering Technology Research Center for Miao Medicine, Guizhou Engineering Technology Research Center for Processing and Preparation of Traditional Chinese Medicine and Ethnic Medicine, College of Pharmaceutical Sciences, Guizhou University of Traditional Chinese Medicine, Guiyang, China
- 2Resource Institute for Chinese & Ethnic Materia Medica, Guizhou University of Traditional Chinese Medicine, Guiyang, China
Eucommia ulmoides Oliver is a medicinal plant of significant economic importance. Its cortex has been employed for centuries to alleviate various conditions such as lumbar pain, knee pain, and osteoporosis. Additionally, E. ulmoides possesses substantial industrial value. With the growing demand for this medicinal herb, ensuring its sustainable supply has become imperative. Climate change has caused habitat restrictions or migration of medicinal plants. Therefore, predicting the impact of climate change on the distribution of E. ulmoides is crucial for its conservation and sustainable use. This study evaluated the potential distribution of E. ulmoides across China under various climate change scenarios since the last interglacial period by modeling suitable areas based on 257 distribution records and 19 major environmental factors related to E. ulmoides. The model selection process initially identified the MaxEnt model as the most suitable. The optimized MaxEnt model, with RM = 2.0 and FC = LQHPT settings, generated the most precise predictions. Results indicate that the minimum temperature of the coldest month, annual mean temperature, and annual precipitation significantly affect the distribution of E. ulmoides. Under current environmental conditions, highly suitable areas for E. ulmoides are found in Southwest and Southeast China, with a total suitable habitat area of 23.12 × 10⁴ km2. However, the range of suitable habitat has shifted due to global warming’s negative impact. Under different climate scenarios, suitable areas for E. ulmoides have either increased or decreased, with expansions primarily in high-latitude regions. Future climate scenarios predict shifts in the centroid of suitable E. ulmoides habitat towards Yichang City in Hubei Province. The findings of this study support the development, artificial cultivation, and conservation of E. ulmoides resources.
1 Introduction
The modification of ecological habitats and geographical distribution of plants is substantially influenced by global climate change (Li et al., 2020b; Wouyou et al., 2022; Zhang K. et al., 2019; Zhang, Y. et al., 2019). Climate change is anticipated to increasingly impact species distributions in the future (Thuiller et al., 2005). Many plant species are expected to adjust their suitable habitats in response to changing environmental conditions, potentially shifting to higher elevations or moving northward in the Northern Hemisphere (Wang et al., 2019a, b). Moreover, climate change affects sensitive ecological responses of plants, such as the duration of growing seasons and flowering periods (Hampe et al., 2013; Wang et al., 2013). Extensive research indicates that climate change has profound effects on ecosystem functions and global biodiversity (Li et al., 2019; Watson et al., 2017). Predicting how climate change will impact past and current species habitats is crucial for understanding potential responses to future environmental changes.
Modeling the impacts of climate change on species’ habitats across landscapes, both historically and currently, is essential for comprehending potential future responses (Zhang K. et al., 2019; Deb et al., 2017; Zhao et al., 2021a). Advances in technology now make it possible to predict relationships between species distributions and various environmental factors, including climate, topography, meteorological data, and species data (Zhao et al., 2022). In research on how climate change affects plant geographical distribution, niche models based on species distributions have become a significant trend (Warren et al., 2010). Ecological niche models are increasingly employed in studies of biological responses to climate change, biological invasion, conservation biology, and various aspects of ecology and evolutionary biology (Sillero et al., 2020; Ferreira et al., 2022; Feng et al., 2019). In recent decades, numerous models, such as the generalized linear (GLM) (Hirzel et al., 2001), maximum entropy (MaxEnt) (Phillips et al., 2006), and the generalized additive model (GAM) (Austin et al., 2009), have been developed and employed for predicting suitable plant areas. For example, the use of MaxEnt to predict the impact of climate change on Sinopodophyllum hexandrum (Lai et al., 2022), Paris verticillata (Ji et al., 2020), and Ophiocordyceps sinensis (Wei Y. et al., 2021). Each model has its own strengths and limitations due to differences in principles and algorithms. It is noteworthy that many previous studies have directly used one model to study the effects of climate change on species distribution and planning of protected areas, without taking into account that different modeling techniques for the same species may yield different results. Biomod is an R-based modeling platform designed to enhance prediction accuracy. Biomod offers ten commonly used species distribution models. Users can freely select models from this platform while customizing them by setting conditions to achieve optimal prediction outcomes.
Eucommia ulmoides Oliver (E. ulmoides), also known as Du Zhong, is a deciduous tree from the unique genus Eucommia. Although E. ulmoides was historically widespread across the Northern Hemisphere, it became extinct in North America and other parts of Europe during the Quaternary Ice Age, surviving only in China (Huang et al., 2021; Wu et al., 2018). Native to China, E. ulmoides is categorized as a rare and endangered species (Wang et al., 2017). Its bark has been highly esteemed as a medicinal resource for over 2000 years and is a key component in traditional Chinese medicine (TCM) formulations (Zhu et al., 2016). In addition to its historical uses for liver and kidney nourishment, bone and tendon strengthening, and fetal calming, recent studies have highlighted the medicinal value of its leaves, bark, male flowers, and fruits (Zhu and Sun, 2018). Furthermore, the gum from E. ulmoides is utilized in various industries, including transportation, sports, aerospace engineering, and construction (Li et al., 2022; Zhang et al., 2011).
Previous studies on E. ulmoides have primarily focused on its pharmacological actions and chemical composition, while the understanding of its biology and potential suitable habitats remains limited. Future climate change may influence the survival, replacement, and community dynamics of E. ulmoides. To enhance our understanding of how climate change impacts the suitable distribution range of E. ulmoides, it is crucial for effectively conserving its germplasm resources and promoting sustainable cultivation practices. Some researchers have used the MaxEnt model to identify the suitable area of E. ulmoides in Ruyang County (Wang J. et al., 2023), but the geographical distribution trend of E. ulmoides in China based on future climate change has not been reported.
This study is first to use Biomod2 to screen ecological models and optimize them to predict the potential suitable planting area of E. ulmoides in China under climate change. The objectives of this study include to (1) compare the accuracy of E. ulmoides prediction by nine models provided by Biomod2, (2) predict the distribution of potentially suitable areas for E. ulmoides in China under current climate conditions, and classify these areas into different suitability categories, (3) identify the environmental factors that restrict the potential geographical distribution of E. ulmoides, and (4) forecast the changes in potentially suitable areas under various future climate scenarios. The focus was on analyzing how the potential geographical distribution of E. ulmoides has been influenced by climate change over different periods. The results offer valuable insights for the introduction, cultivation, conservation, and effective use of E. ulmoides.
2 Materials and methods
2.1 Study area
E. ulmoides Oliver, the sole extant species of Eucommiaceae, is an endemic dioecious tree in China (Zhang et al., 2016). The current geographical distribution of E. ulmoides in China results from its artificial introduction from its central origin to various regions across the country. The distribution area of E. ulmoides is relatively extensive, covering the hills and mountains in the plains of Gansu, Shaanxi, Guizhou, Hubei, Hunan, Henan, Sichuan, Jiangxi, Anhui, Zhejiang, Shanxi, Fujian, Guangxi, Guangdong, Jiangsu, and Henan. The primary distribution area of E. ulmoides is located between 98–123°E and 18–42°N.
2.2 Occurrence data
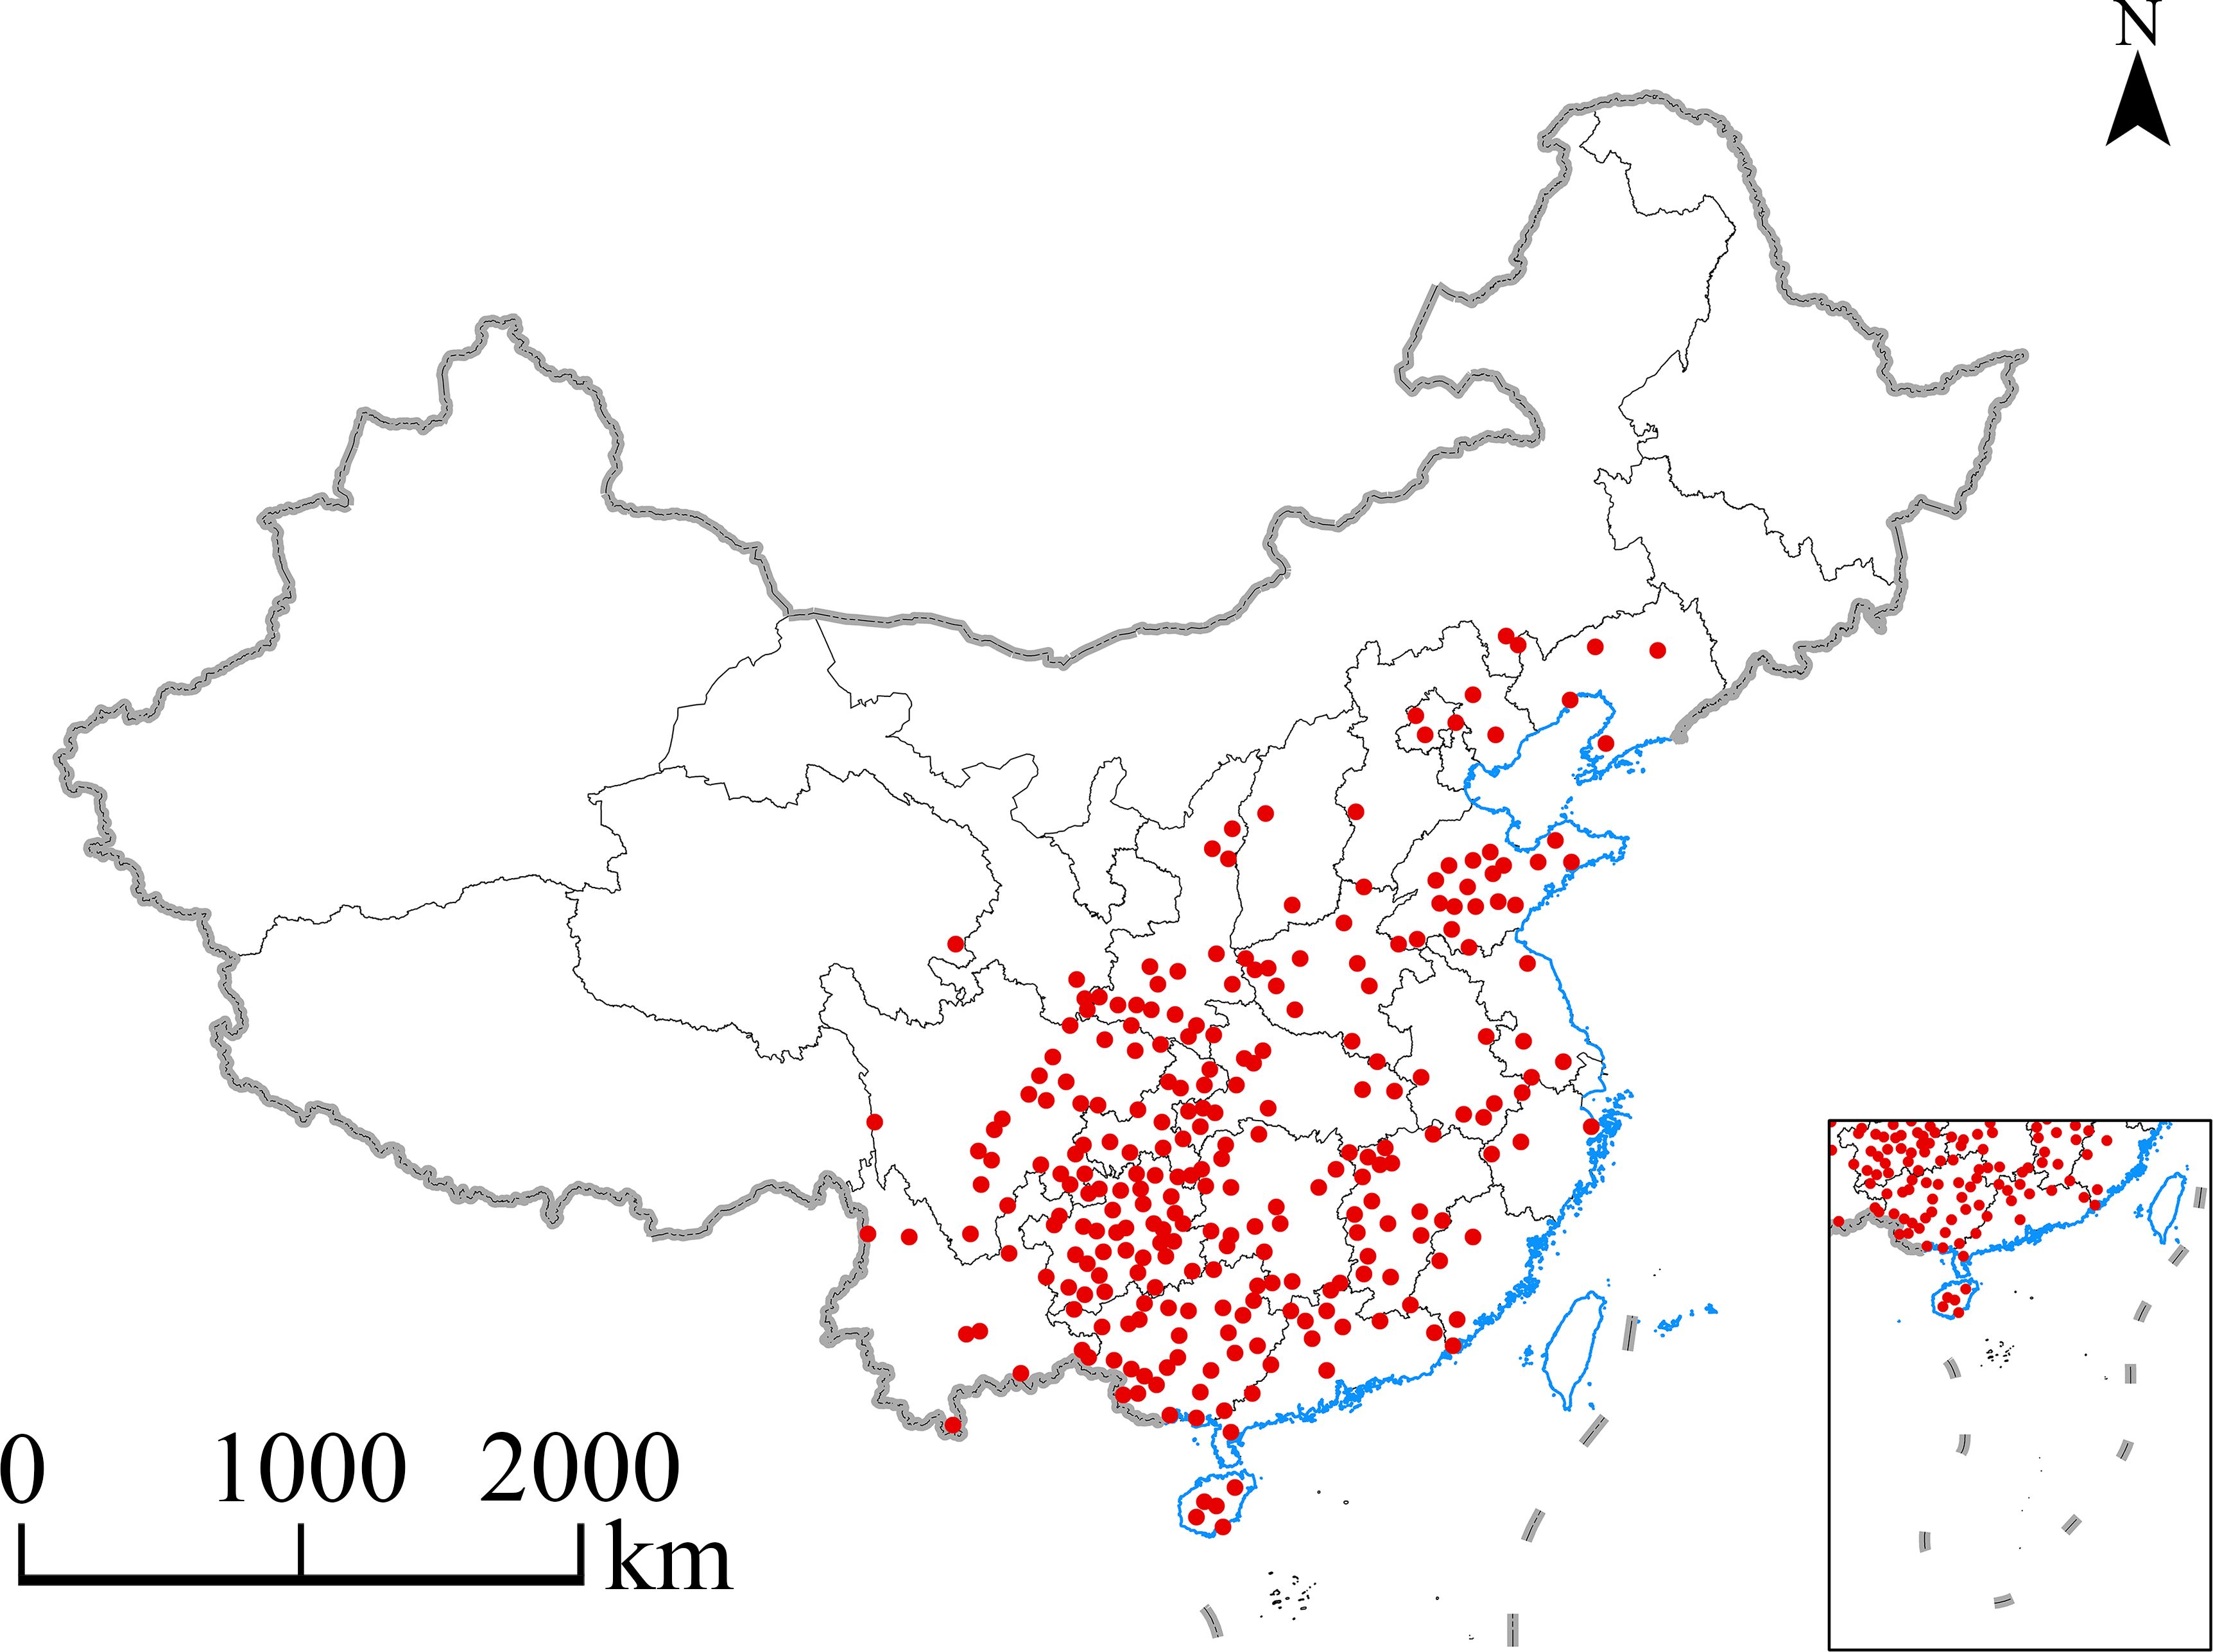
A total of 957 distribution records were gathered through a review of published documents and searches in various databases, including the China Digital Herbarium (http://www.cvh.org.cn), the Chinese Plant Image Database (http://ppbc.iplant.cn/special), the National Specimen Information Infrastructure (NSII, http://www.nsii.org.cn/), and other herbaria, between December 2022 and February 2023. The R software package “spThin” was utilized to reduce sampling bias to remove records clustered within a 10 km × 10 km area (Zhang et al., 2018). Ultimately, 257 points were selected for further analysis (Supplementary Table S1). The primary areas where E. ulmoides was found were determined based on the distribution data (Figure 1). The geographical base map of China used was a 1:400,000 vector map showing administrative divisions, downloaded from the National Basic Geographic Information System website (https://nfgis.nsdi.gov.cn).
2.3 Environmental variables
Climate data for various periods (the last interglacial period, the last glacial maximum, the mid-Holocene, the modern era, and the future) were obtained from the World Climate Database (http://worldclim.org) in March 2023. All environmental data were set to a spatial resolution of 30 arcseconds by ArcGIS software. For the analysis of past climate data, three specific periods were selected: the last interglacial period (LIG 130 ka BP), the last glacial maximum (LGM 21 ka BP), and the mid-Holocene (MH 6 ka BP). Future climate data were sourced from the Beijing Climate Center Climate System Model (BCC-CSM2-MR) of the Coupled Model Intercomparison Project Phase 6 (CMIP6) (Wu et al., 2019), covering four periods: 2021–2040 (2030s), 2041–2060 (2050s), 2061–2080 (2070s), and 2081–2100 (2090s). Data were analyzed under three shared socioeconomic pathways (SSP1-2.6, SSP2-4.5, and SSP5-8.5). Supplementary Table S2 provides information on the 19 bioclimatic variables. Since topographic and soil variables are not expected to undergo significant changes, this study focuses solely on predicting the impact of climate on the suitable habitat for E. ulmoides. The environmental variables were screened (Wang Y. et al., 2023) to evaluate the contribution of each ecological factor to the predicted distribution of E. ulmoides. First variables with cumulative contributions exceeding 95% were selected. Subsequently, Pearson correlation analysis was conducted. Among pairs of highly correlated variables (r > 0.8), the variable with the greater contribution to the response was retained. In the end, 10 major environmental variables were included in the MaxEnt simulations (Table 1).
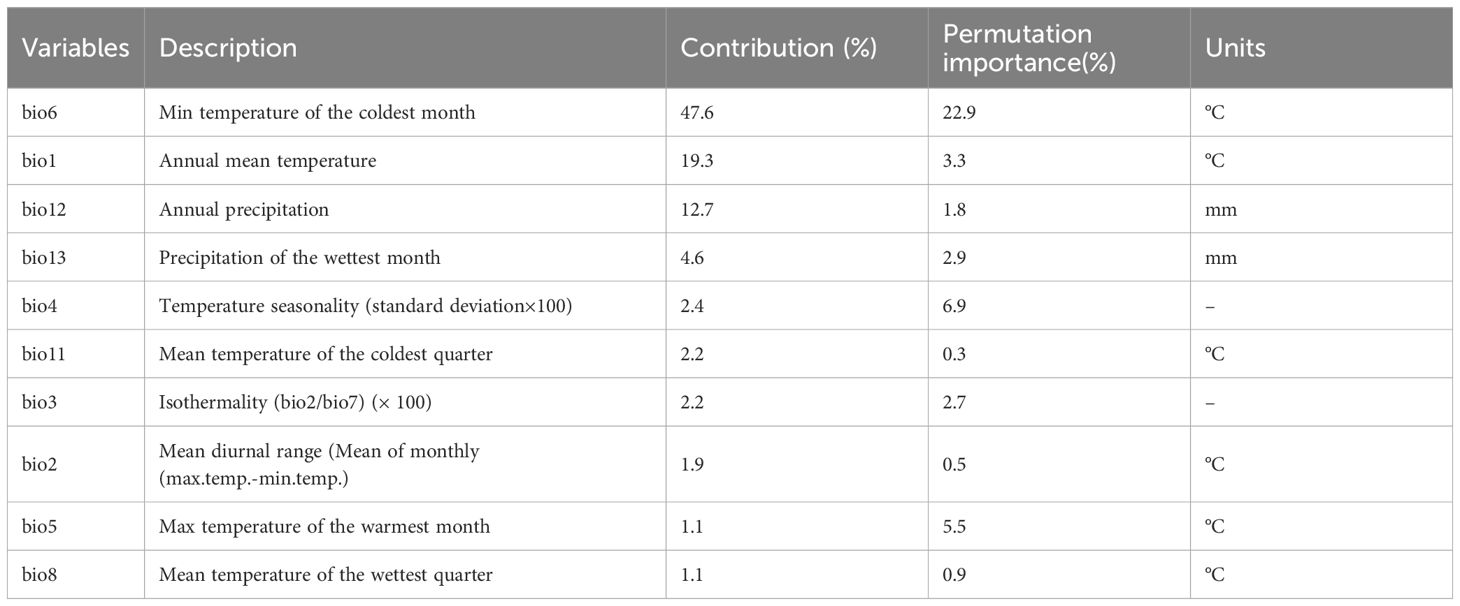
Table 1. Percent contribution and permutation importance of screened environmental variable of E. ulmoides in China.
2.4 Model calibration
Firstly, we adopted Biomod2 package to screen the models including: GLM, GBM, GAM, CTA, ANN, FDA, RF, MARS, and MaxEnt. All algorithms used the default model settings of Biomod2. In the modeling process, 75% of the 257 distribution data samples for E. ulmoides were randomly selected as training data, while the remaining 25% were used as testing data (5 replications) (Phillips et al., 2017). Additionally, 1000 pseudo-absence points were randomly chosen, and this process was repeated three times for model construction. In total, 135 distinct models were developed. The accuracy of the nine models’ predictions was evaluated using the area under the receiver operating characteristic (ROC) curve (AUC) and the true skill statistic (TSS). The AUC ranged from 0 to 1.0. The higher the AUC value is, the more accurate the prediction result. An AUC ranging from 0.5 to 0.7 indicates poor accuracy, 0.7 to 0.8 indicates mediocre accuracy, 0.8 to 0.9 indicates good accuracy, and 0.9 to 1.0 indicates very good accuracy (Dakhil et al., 2019). The TSS values range from 0 to 1.0, values from 0.55 to 0.7 indicate general values, and values from 0.7 to 0.8 indicate good values. After the screening, the selected model is further optimized.
The optimized values for the regularization multiplier (RM) and feature combination (FC) were determined using the ENMeval package in R. The RM values ranged from 0.5 to 4, in increments of 0.5 (totaling 8 values). Nine different FCs were tested: L, LQ, H, LQH, LQHP, LQHPT, QHP, QHPT, and HPT (Velasco and González-Salazar, 2019). The ENMeval package evaluated 72 parameter combinations and was used to calculate the corrected Akaike minimum information criterion (AIC) model. The AIC value assessed the model’s complexity and fit. The delta.AICc, testing AUC (avg.diff. AUC), and the average 10% test omission rate (avg.test.or10pct) were used to evaluate the model’s fit to the native species distribution points (Muscarella et al., 2015).
2.5 Changes in the spatial pattern of the suitable distribution area for E. ulmoides
The model results were processed using ArcGIS 10.4.1 software. The natural breaks method was applied to classify the results and create a gradient classification for suitable habitats, dividing the distribution areas of E. ulmoides into four categories: unsuitable (0, 0.1), less suitable (0.1, 0.25), moderately suitable (0.25, 0.5), and highly suitable (0.5, 1) (Zhan et al., 2022). An existence/nonexistence (0, 1) matrix for E. ulmoides under past, current, and future climate change scenarios was established. Using this matrix, changes in the suitable distribution area of E. ulmoides were analyzed across different climate scenarios. Area changes were calculated relative to the current suitable habitat area for E. ulmoides. Changes were defined as follows: a matrix value of 0→1 indicated a newly suitable area, 1→0 indicated a lost suitable area, 1→1 indicated a retained suitable area, and 0→0 indicated an unsuitable area (Ye et al., 2020).
2.6 Analysis of multivariate environmental similarity surface and most dissimilar variable
The environmental variables from the current potential distribution area of E. ulmoides served as the reference layer. A multivariate environmental similarity surface was used to assess climatic anomalies in present suitable habitats under historical and future climate change scenarios. The analysis focused on the most dissimilar variables to identify key factors influencing changes in potential geographical distribution. MESS measures the similarity between the climate of a given location at a specific time and the climate of the reference layer. It compares a set of predicted variables (V1, V2, Vi, etc.) with a set of reference points. In this context, mini and maxi denote the minimum and maximum values of the environmental variable Vi, respectively. Pi represents the value of Vi at a point P in the reference layer during a given time period, while fi is the percentage of study area points where Vi < pi (Elith et al., 2010). When fi = 0, the similarity surface is 100 (p - mini)/(max - mini); when 0 < fi ≤ 50, the similarity surface is 2fi; when 50 < fi < 100, it is 2(100 - fi); and when fi = 100, the similarity surface is 100(max - 100)/(max - mini). The value of the multivariate environmental similarity surface at point P reflects the minimum similarity among different environmental variables, known as the maximum dissimilarity variable. A negative similarity surface indicates that at least one variable value exceeds the reference point’s environmental range for that period, termed a climate anomaly point. A value of 100 denotes complete alignment between the climate environment and the reference layer, indicating normal climatic conditions. The variable MoD shows the lowest similarity or highest degree of anomaly at a point, while the multivariate environmental similarity surface denotes the minimum similarity among all variables, highlighting the most dissimilar variable with the highest anomaly. This variable may be critical in species geographic migration.
2.7 Analysis of the migration of the center point of the suitable area
The SDM toolbox, a Python-based GIS software package, was employed to analyze the temporal trends in changes in suitable areas and identify these regions’ geometric centers (Pierre et al., 2018). A vector file was generated to represent the overall suitable habitat for E. ulmoides, illustrating shifts in centroid positions and providing insights into the direction and magnitude of changes in species habitat suitability. By monitoring variations in centroid locations through different SDMs, shifts in the distribution of E. ulmoides across various periods and under varying climatic conditions were investigated.
3 Results
3.1 Identification of the most appropriate niche model
Nine niche models for species distribution were compared using the Biomod2 platform, with the MaxEnt model being identified as superior in terms of AUC and TSS. A comparison of the AUC and TSS of the 9 models revealed that the AUC and TSS of MaxEnt were significantly greater than those of the other 8 models (Table 2). Additionally, this model exhibited the most precise fit to the actual plant distribution (Figure 2); thus, it was selected for all subsequent analyses.
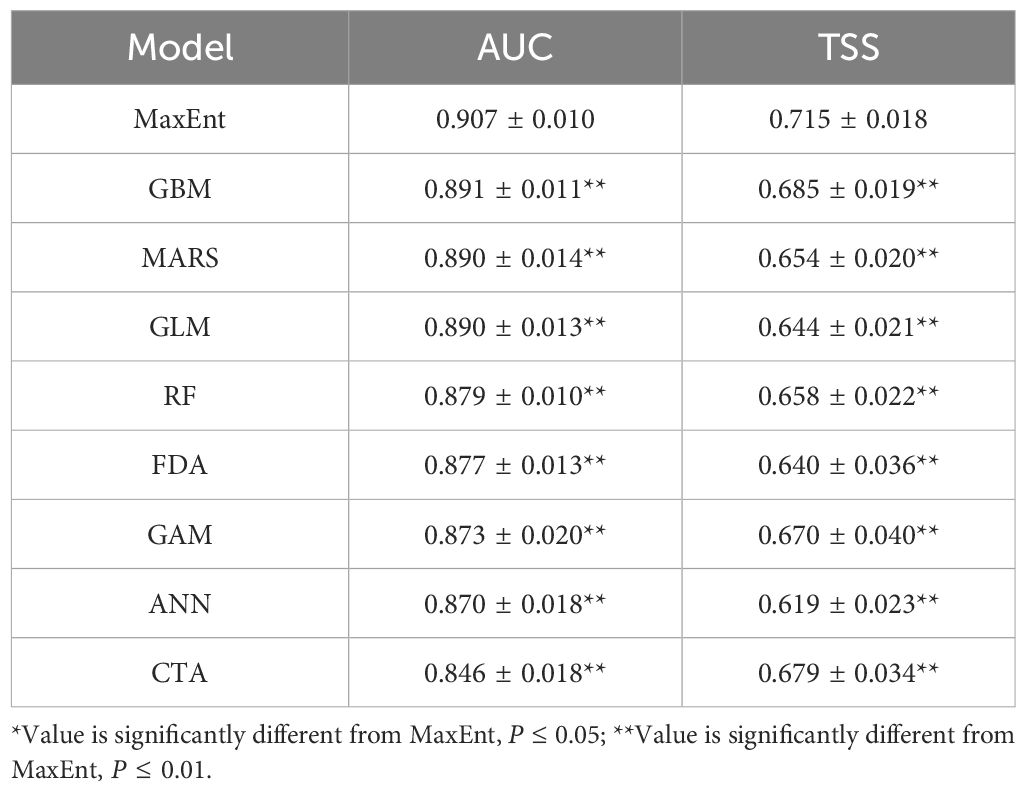
Table 2. Comparison of the E. ulmoides distribution in China predicted by nine niche models (n = 15).
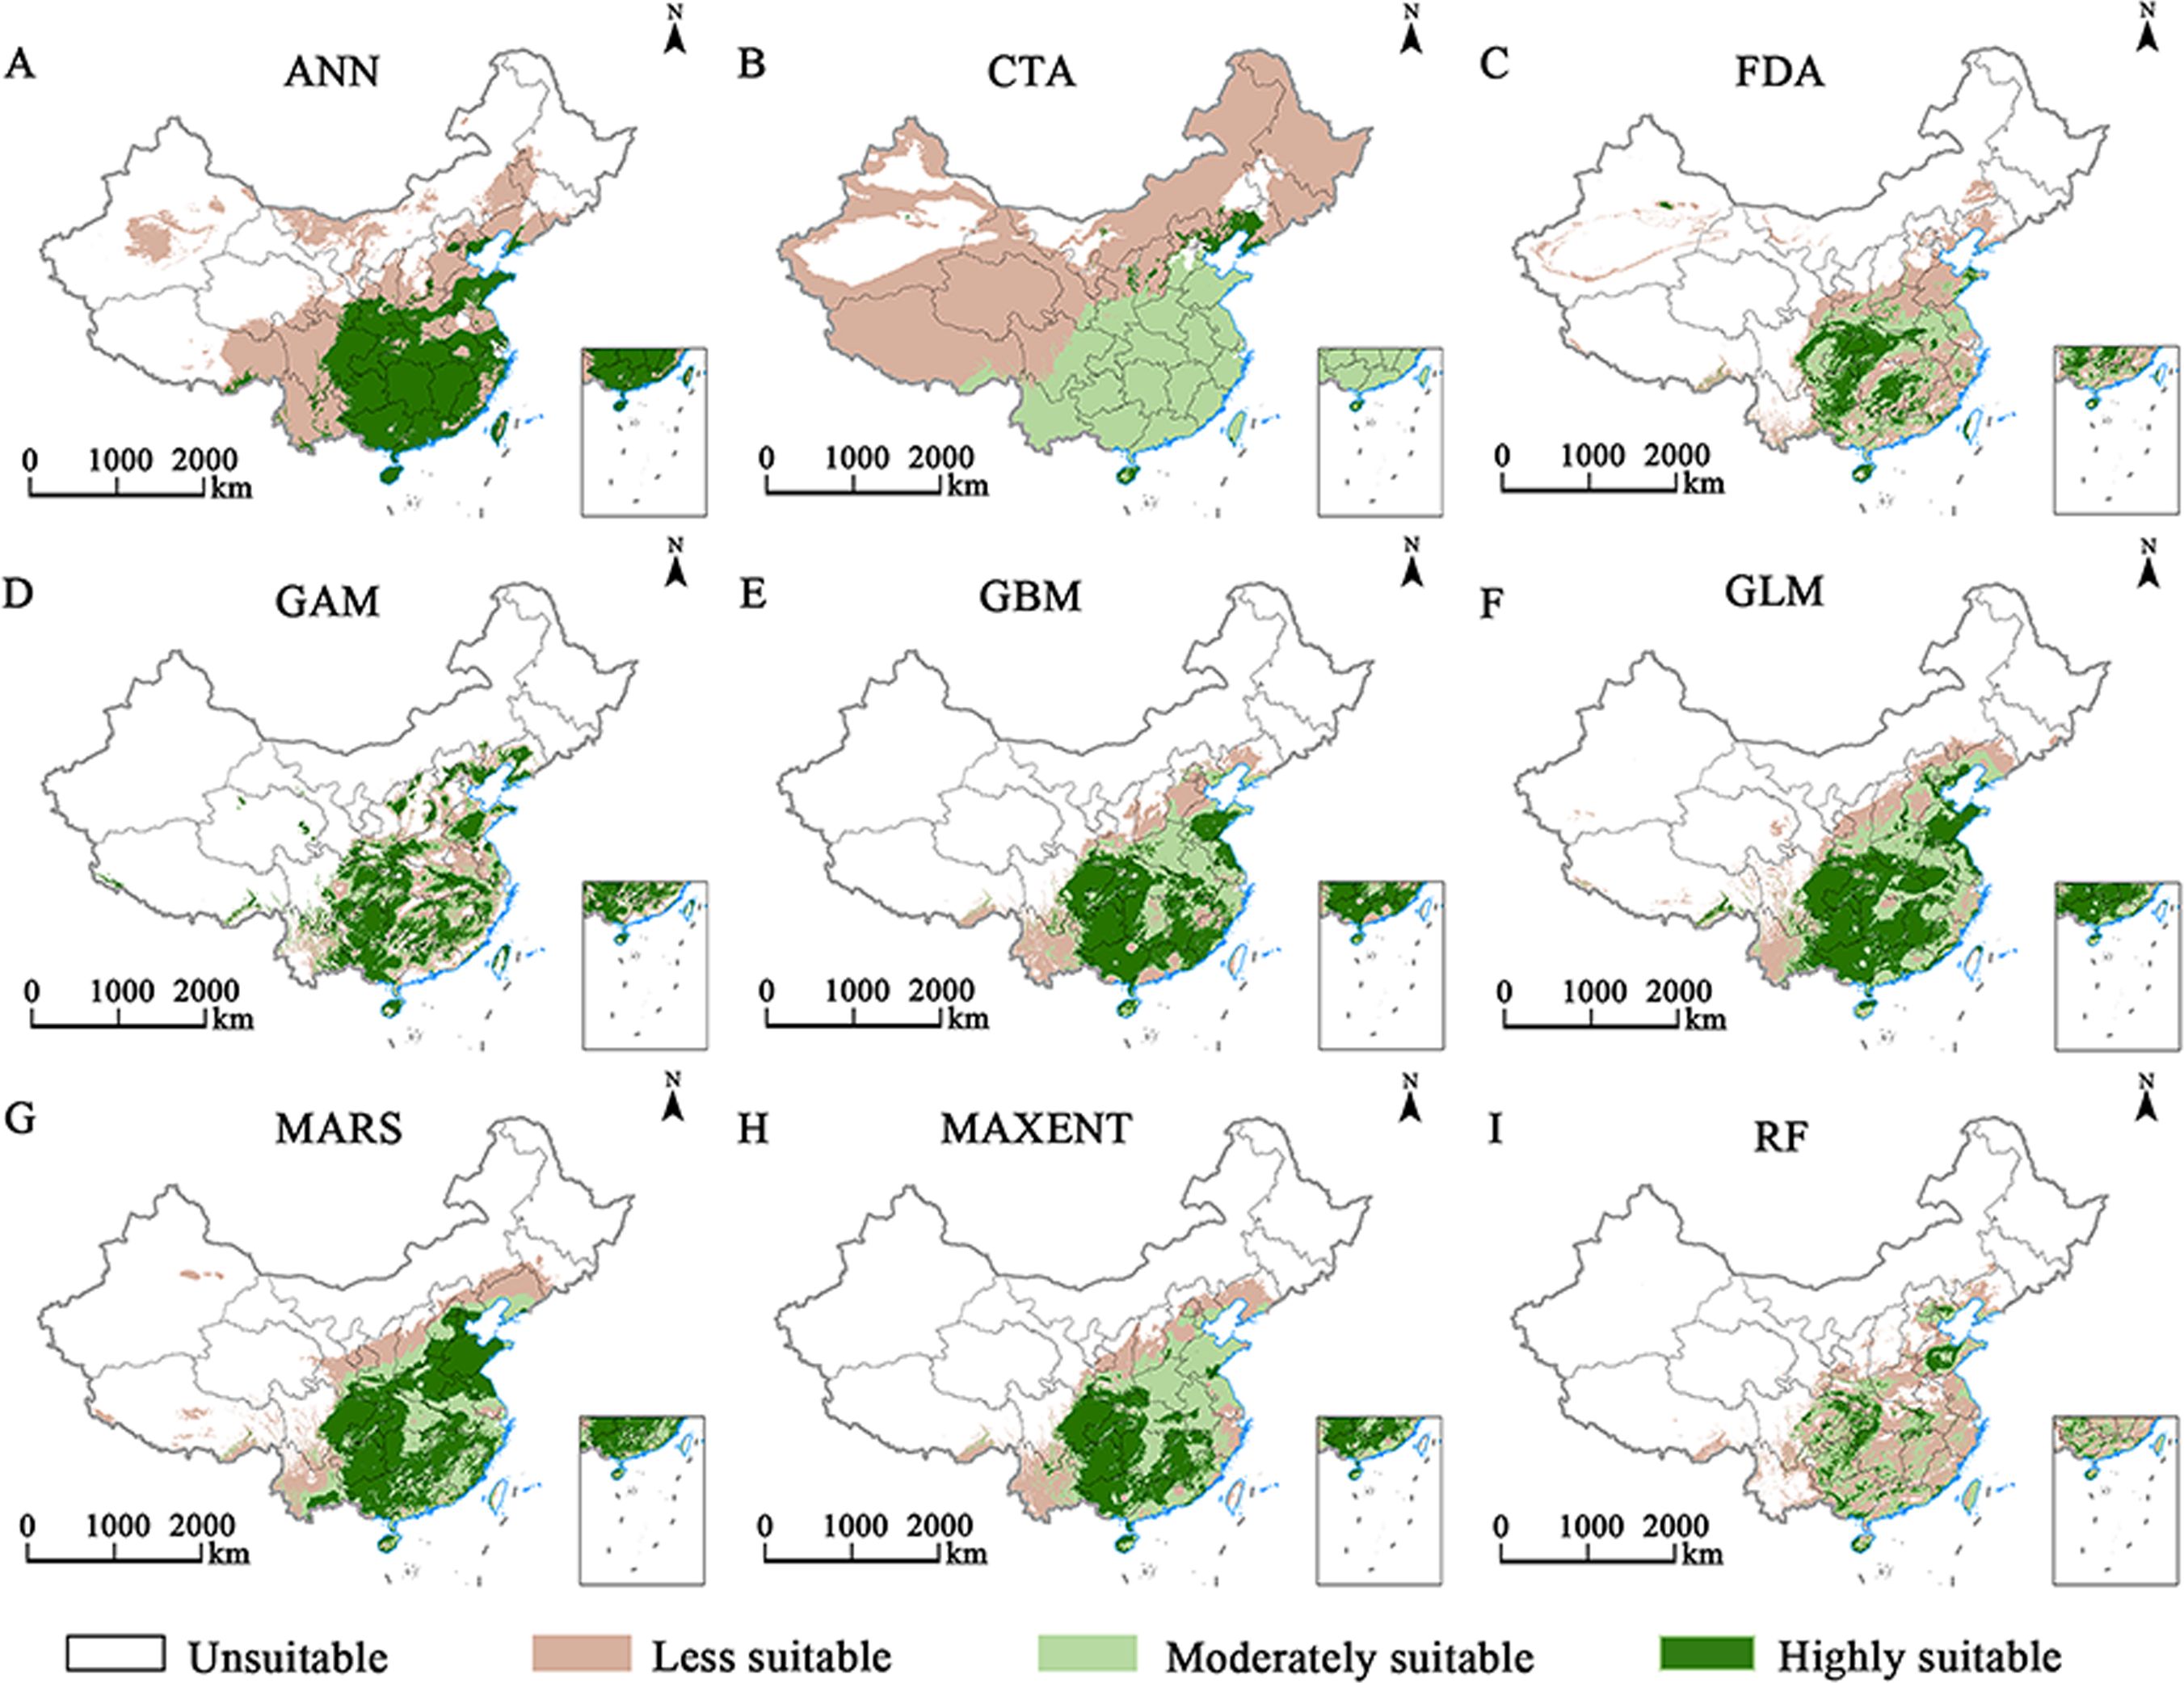
Figure 2. Predicted potential geographic distributions of E. ulmoides in China from nine spatial distribution modeling approaches (A–I).
3.2 Model accuracy evaluation
In this study, on account of the 257 distribution points and 19 environmental variables for E. ulmoides, the MaxEnt model was used to simulate and predict the potential distribution of E. ulmoides habitats in China. Under the default parameter setting of MaxEnt, the default FC was LQHPT, the RM was 1, and the delta.AICc= = 37.48 in the MaxEnt model. When RM = 2.0, FC = LQHPT, and delta.AICc = 0, according to the AIC, the model is the optimal model (Figure 3). The values of avg.diff.AUC of the optimized model was 21.18% greater than that of the model with default parameters. In the optimized model, the values of avg.test.or10pct were 31.62% lower than those in the model using default parameters. The settings of the optimized parameters notably reduced the complexity and enhanced the model’s fitting degree, making it appropriate for model transfer. Consequently, RM = 2.0 and FC = LQHPT were chosen as the final parameter settings for this research.

Figure 3. Optimization results for the MaxEnt model delta.AICc (A), avg.diff. AUC (B) and avg.test.or10pct (C).
3.3 Analysis of response curves
The ecological factor response curve demonstrates the influence of each environmental variable on MaxEnt predictions, showing that the fitness values produced by logistic regression vary with each environmental variable. Figure 4 presents the response curves for the individual ecological factors affecting the distribution of E. ulmoides. The red segment of the curve indicates the average response from 10 repeated runs using MaxEnt software. In contrast, the blue segment shows one standard deviation above and below this average value range. Logistic regression analysis within the MaxEnt model was conducted to examine the relationships between the probability of suitable habitat distribution for E. ulmoides and environmental variables, producing single-factor response curves. Of the 19 environmental variables, Bio6 (minimum temperature of coldest month), Bio1 (annual mean temperature), Bio12 (annual precipitation), Bio13 (precipitation of wettest month), Bio4 (temperature seasonality), and Bio11 (mean temperature of coldest quarter) were identified as the key variables affecting the distribution of E. ulmoides, with contributions of 47.6%, 19.3%, and 12.7% respectively from Bio6, Bio1, and Bio12. Areas with a geographical distribution probability above 0.5 are deemed suitable habitats where the minimum temperature of the coldest month exceeds -5°C, the annual mean temperature is above 14°C, the annual precipitation ranges between 900 mm and 1900 mm, and the precipitation of the wettest month is between 190 mm and 450 mm, temperature seasonality ranges from 200 to 900, and the mean temperature during the coldest quarter surpasses 0°C.
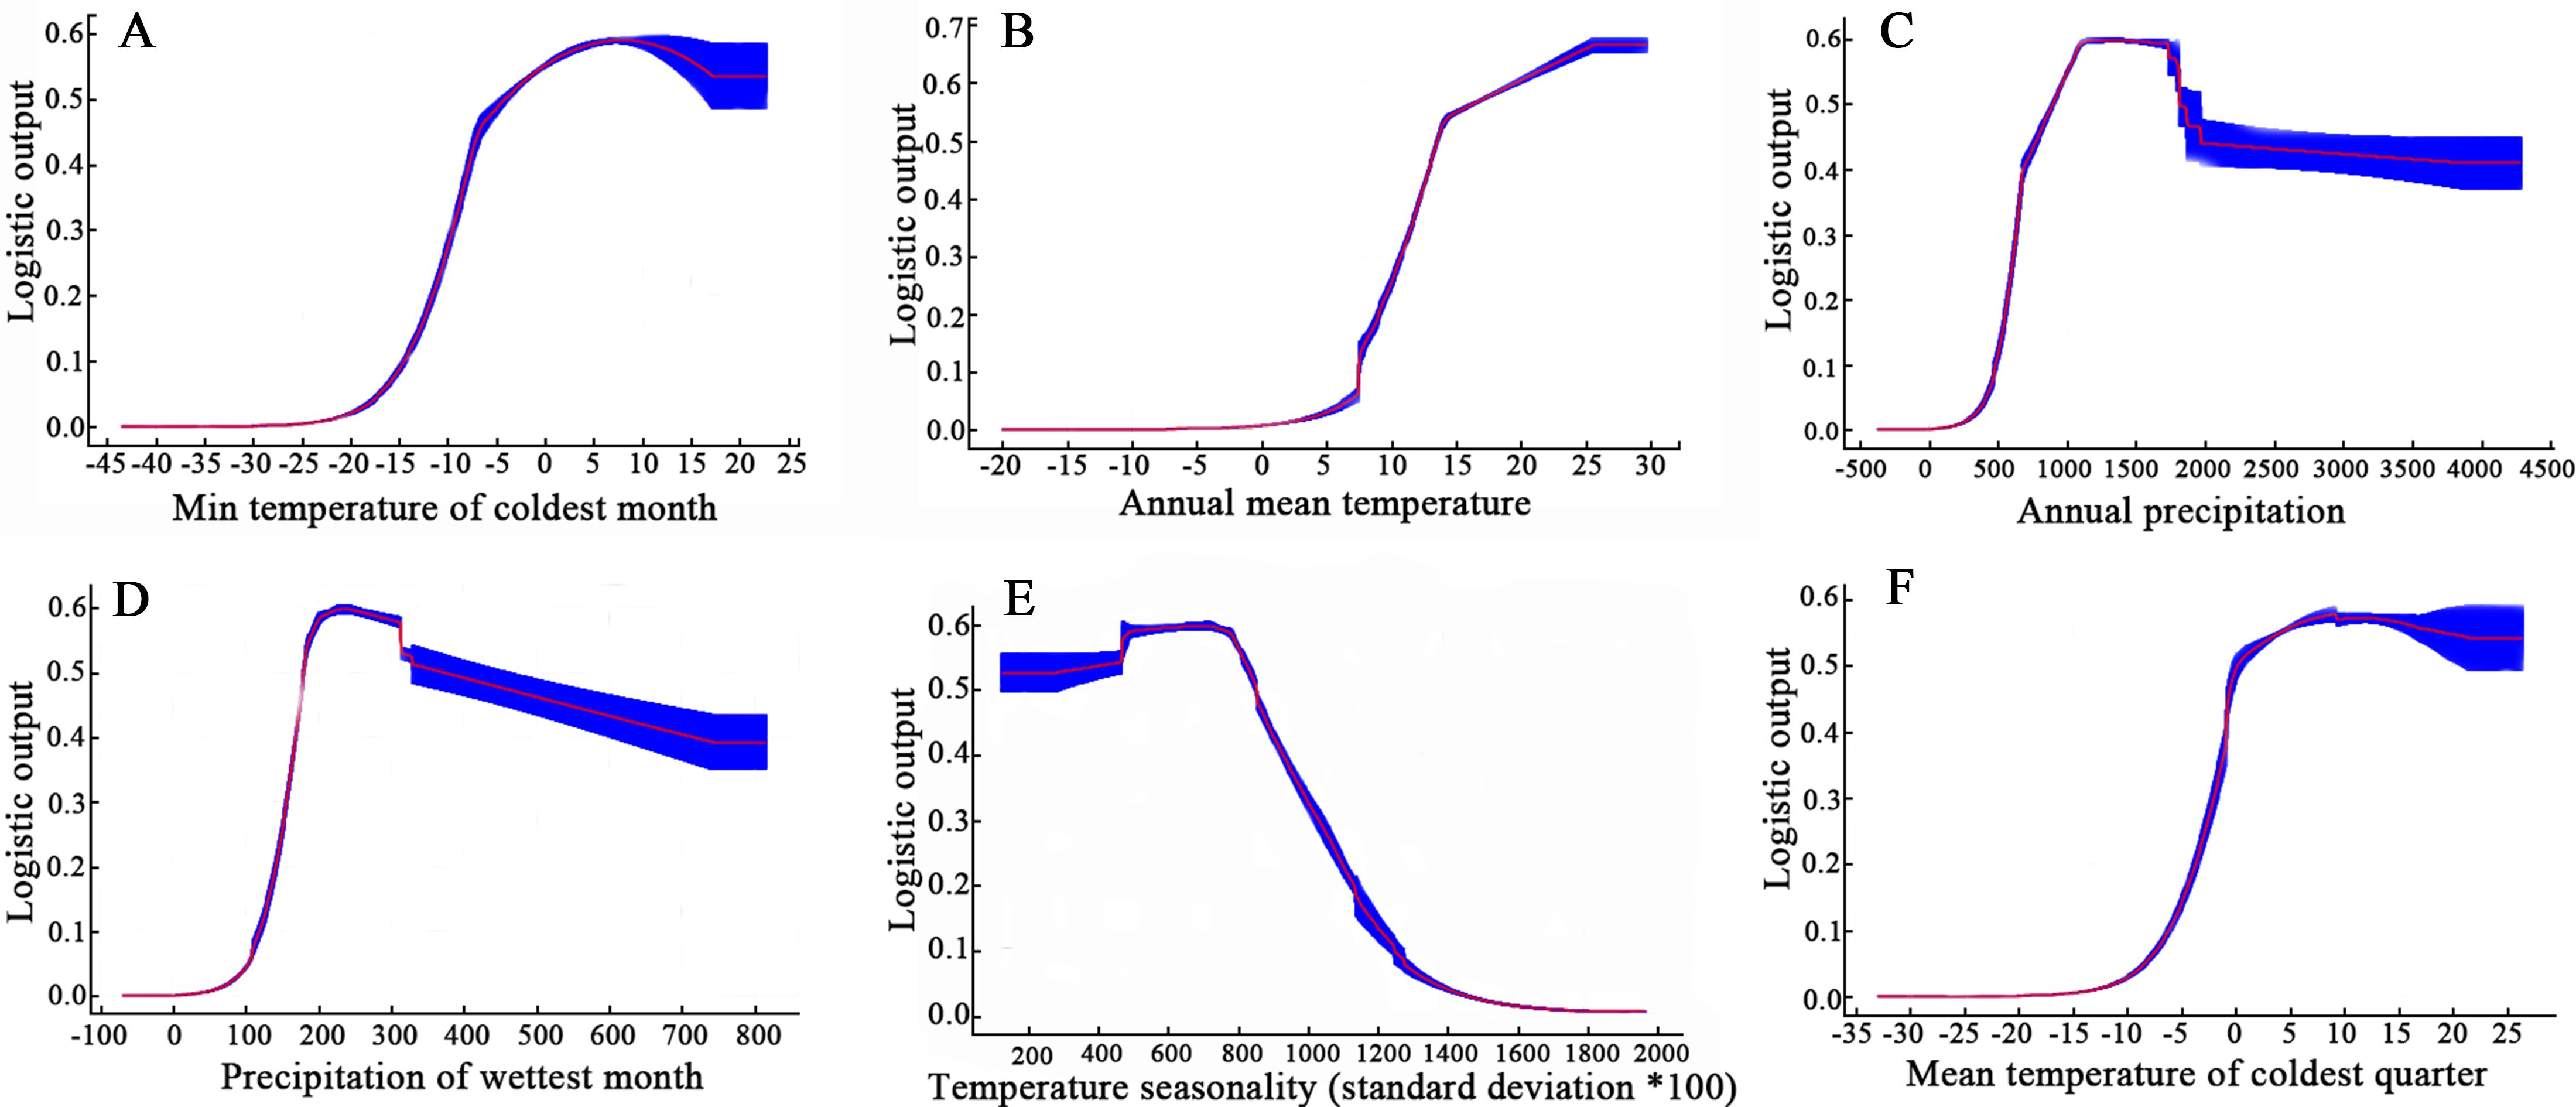
Figure 4. Response curve of six environmental variables in the MaxEnt model for E.ulmoides. (A): Bio6; (B): Bio1; (C): Bio12; (D): Bio13; (E): Bio4; (F): Bio11.
3.4 Current potentially suitable habitats for E. ulmoides
Figure 5 illustrates the suitable area for E. ulmoides under current climatic conditions. According to the optimized MaxEnt model predictions, the highly suitable habitat area for E. ulmoides covers 10.64 × 10⁴ km2, while the generally suitable habitat spans 12.48 × 10⁴ km2, totaling 23.12 × 10⁴ km2. Highly suitable areas are primarily located in eastern Sichuan, Chongqing, Guizhou, Guangxi, Jiangxi, Hunan, and northern Guangdong, whereas moderately suitable areas are found in Shandong, Henan, Anhui, Jiangsu, and Hubei. The simulation and prediction outcomes align well with the geographical distribution data of E. ulmoides, indicating a reasonable accuracy of these results. The highly suitable areas for E. ulmoides in China are extensive and concentrated in growth.
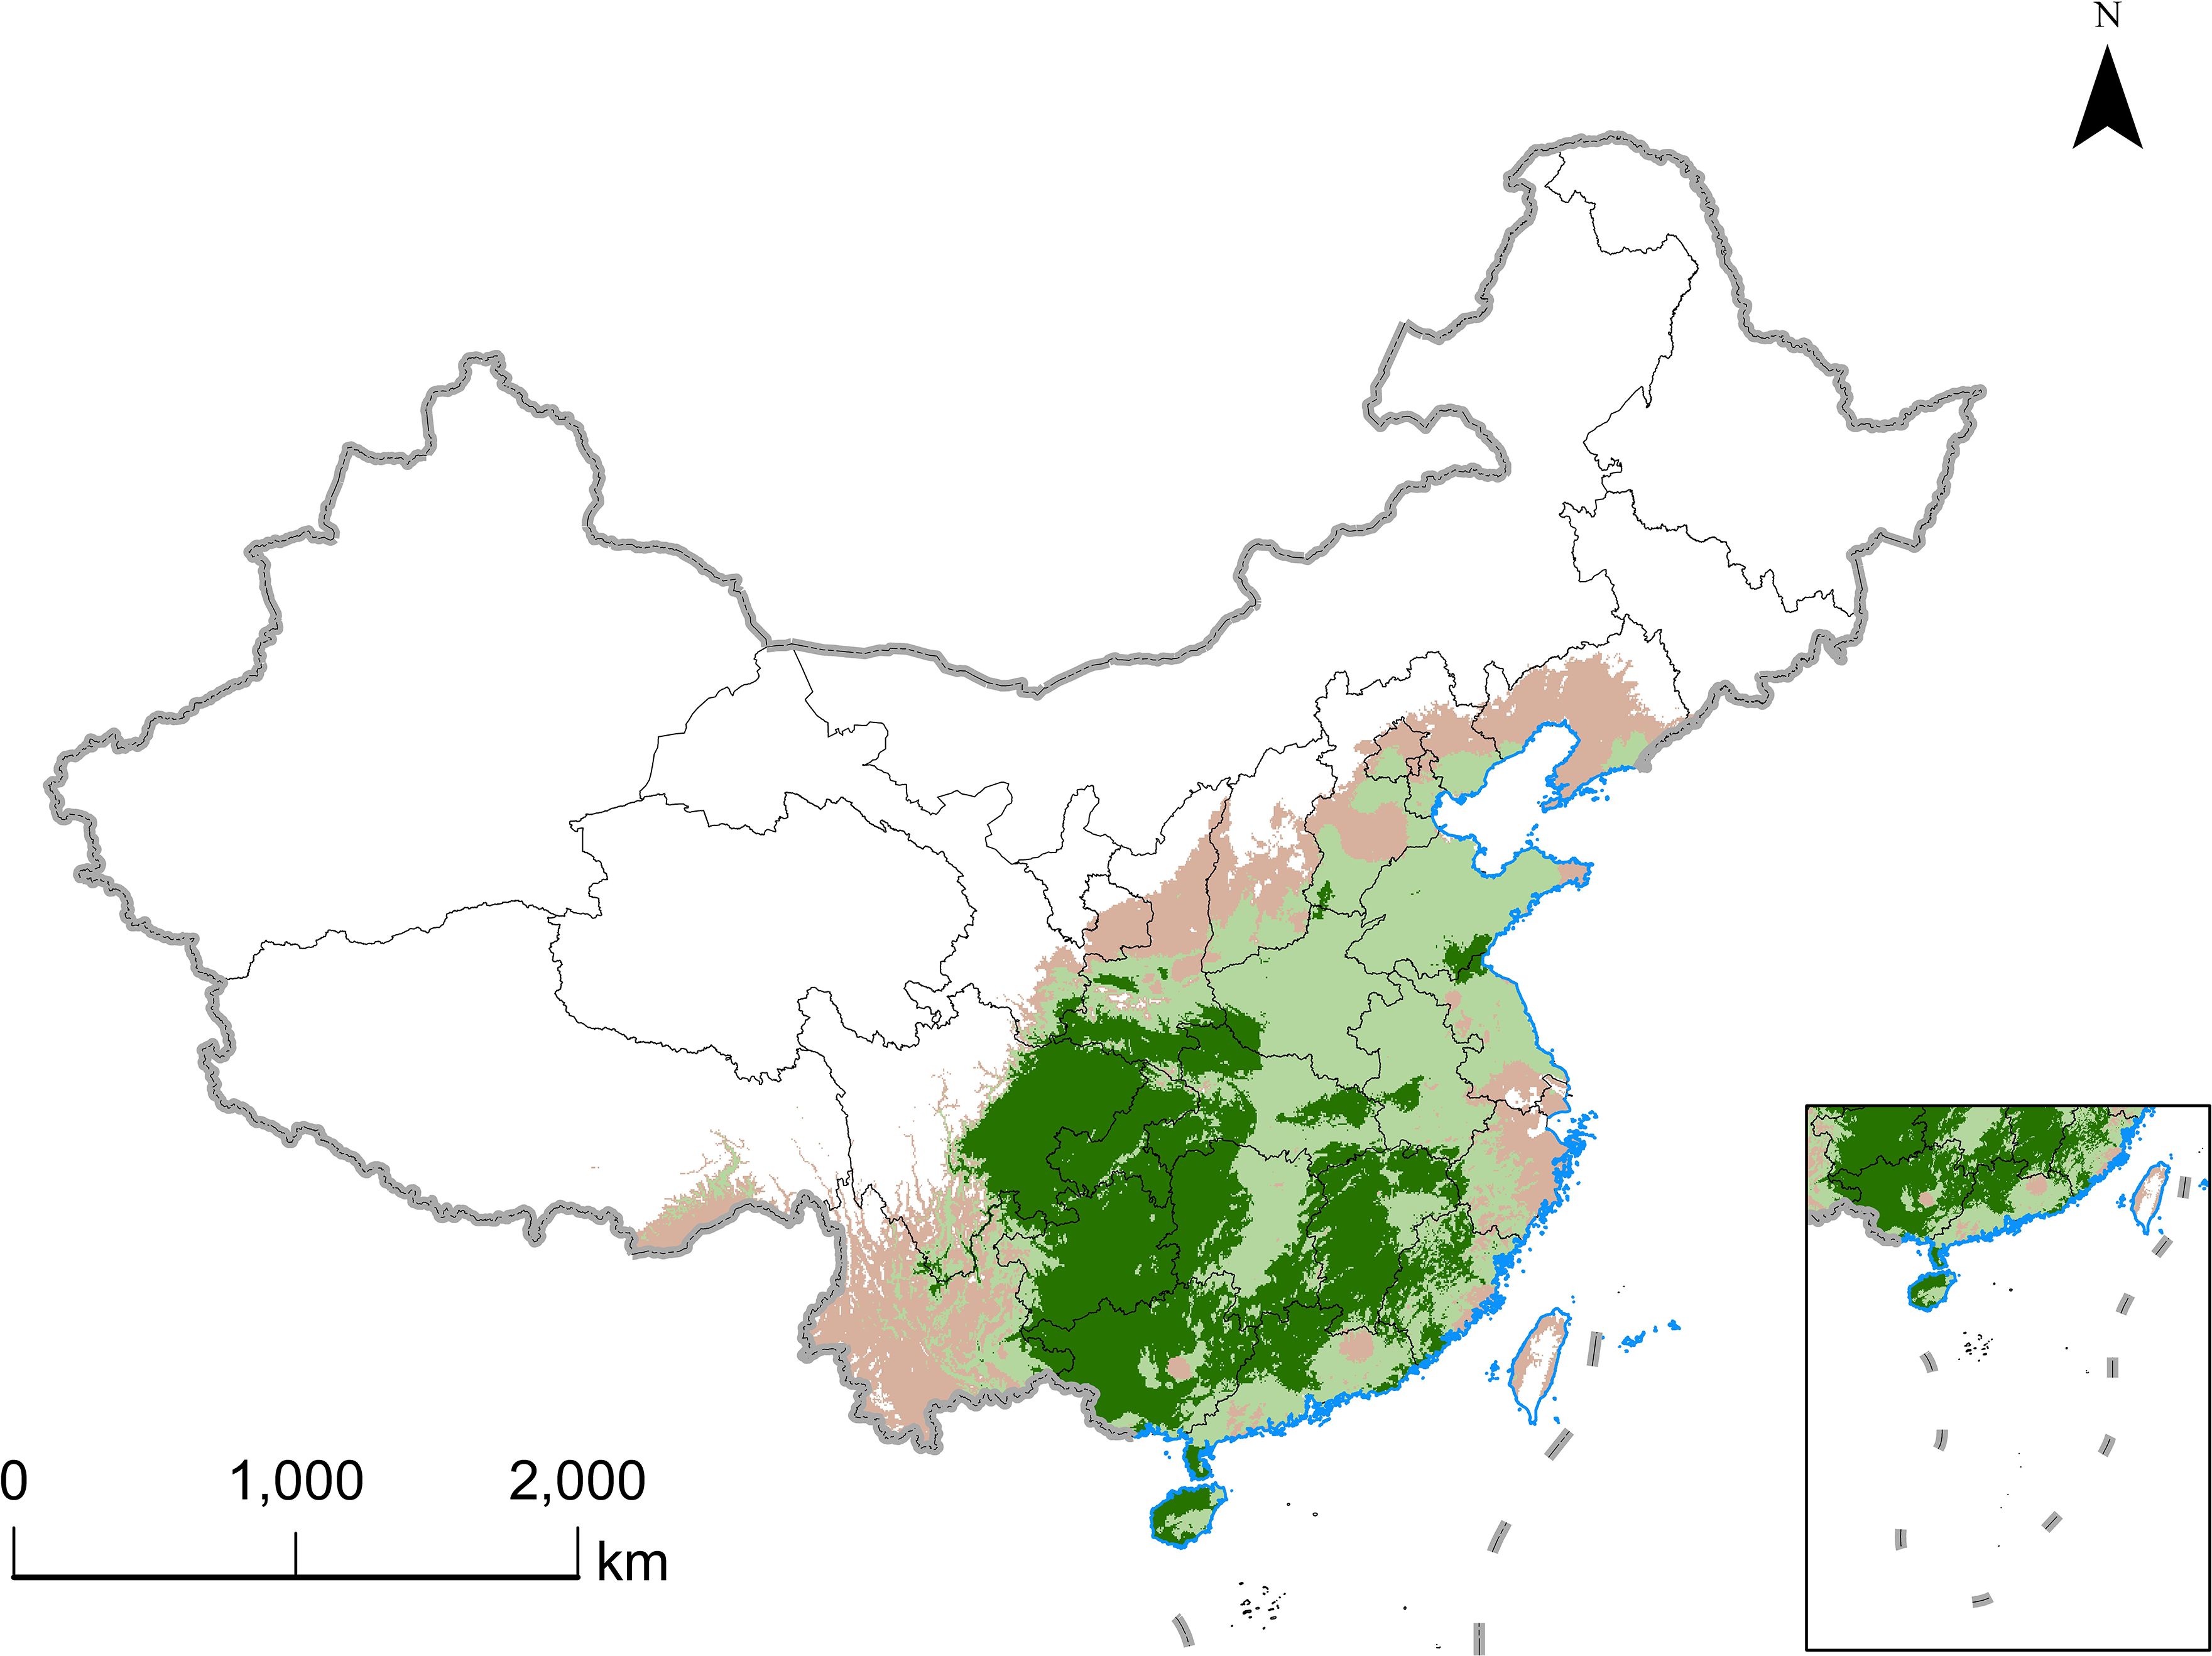
Figure 5. Distribution of suitable habitats for E. ulmoides in China under current climate scenarios predicted by MaxEnt model.
3.5 Dynamic changes in the suitable habitats for E. ulmoides under different combinations of climate scenarios/years
A comparison of the spatial distribution of suitable E. ulmoides habitats during the historical period with that of modern suitable habitats revealed that Figures 6 and 7 illustrate the changes in habitat suitability for E. ulmoides. During the last interglacial period, no suitable habitat was detected for E. ulmoides. From the last glacial maximum to the present, the suitable habitat area decreased by about 12.0663 × 10⁴ km2, mainly in the northern parts of the current suitable areas. Comparing the middle Holocene period to the present, the suitable habitat for E. ulmoides remains comparable to that of the modern era and has even slightly expanded. Additionally, an analysis of three future climate scenarios revealed that under the SSP4.5-2040s, SSP4.5-2060s, and SSP8.5-2100s projections, a decrease in suitable habitats ranging from 1.4495 × 10⁴ km2 to 1.8158 × 10⁴ km2 compared to current conditions is expected; however, aside from the mentioned above (SSP4.5-2040s, SSP4.5-2060s, and SSP8.5-2100s), all other future climate scenarios predict an increase in suitable habitats for E. ulmoides with an expanded range varying from 0.7534 × 10⁴ km2 to 6.2184 × 10⁴ km2.
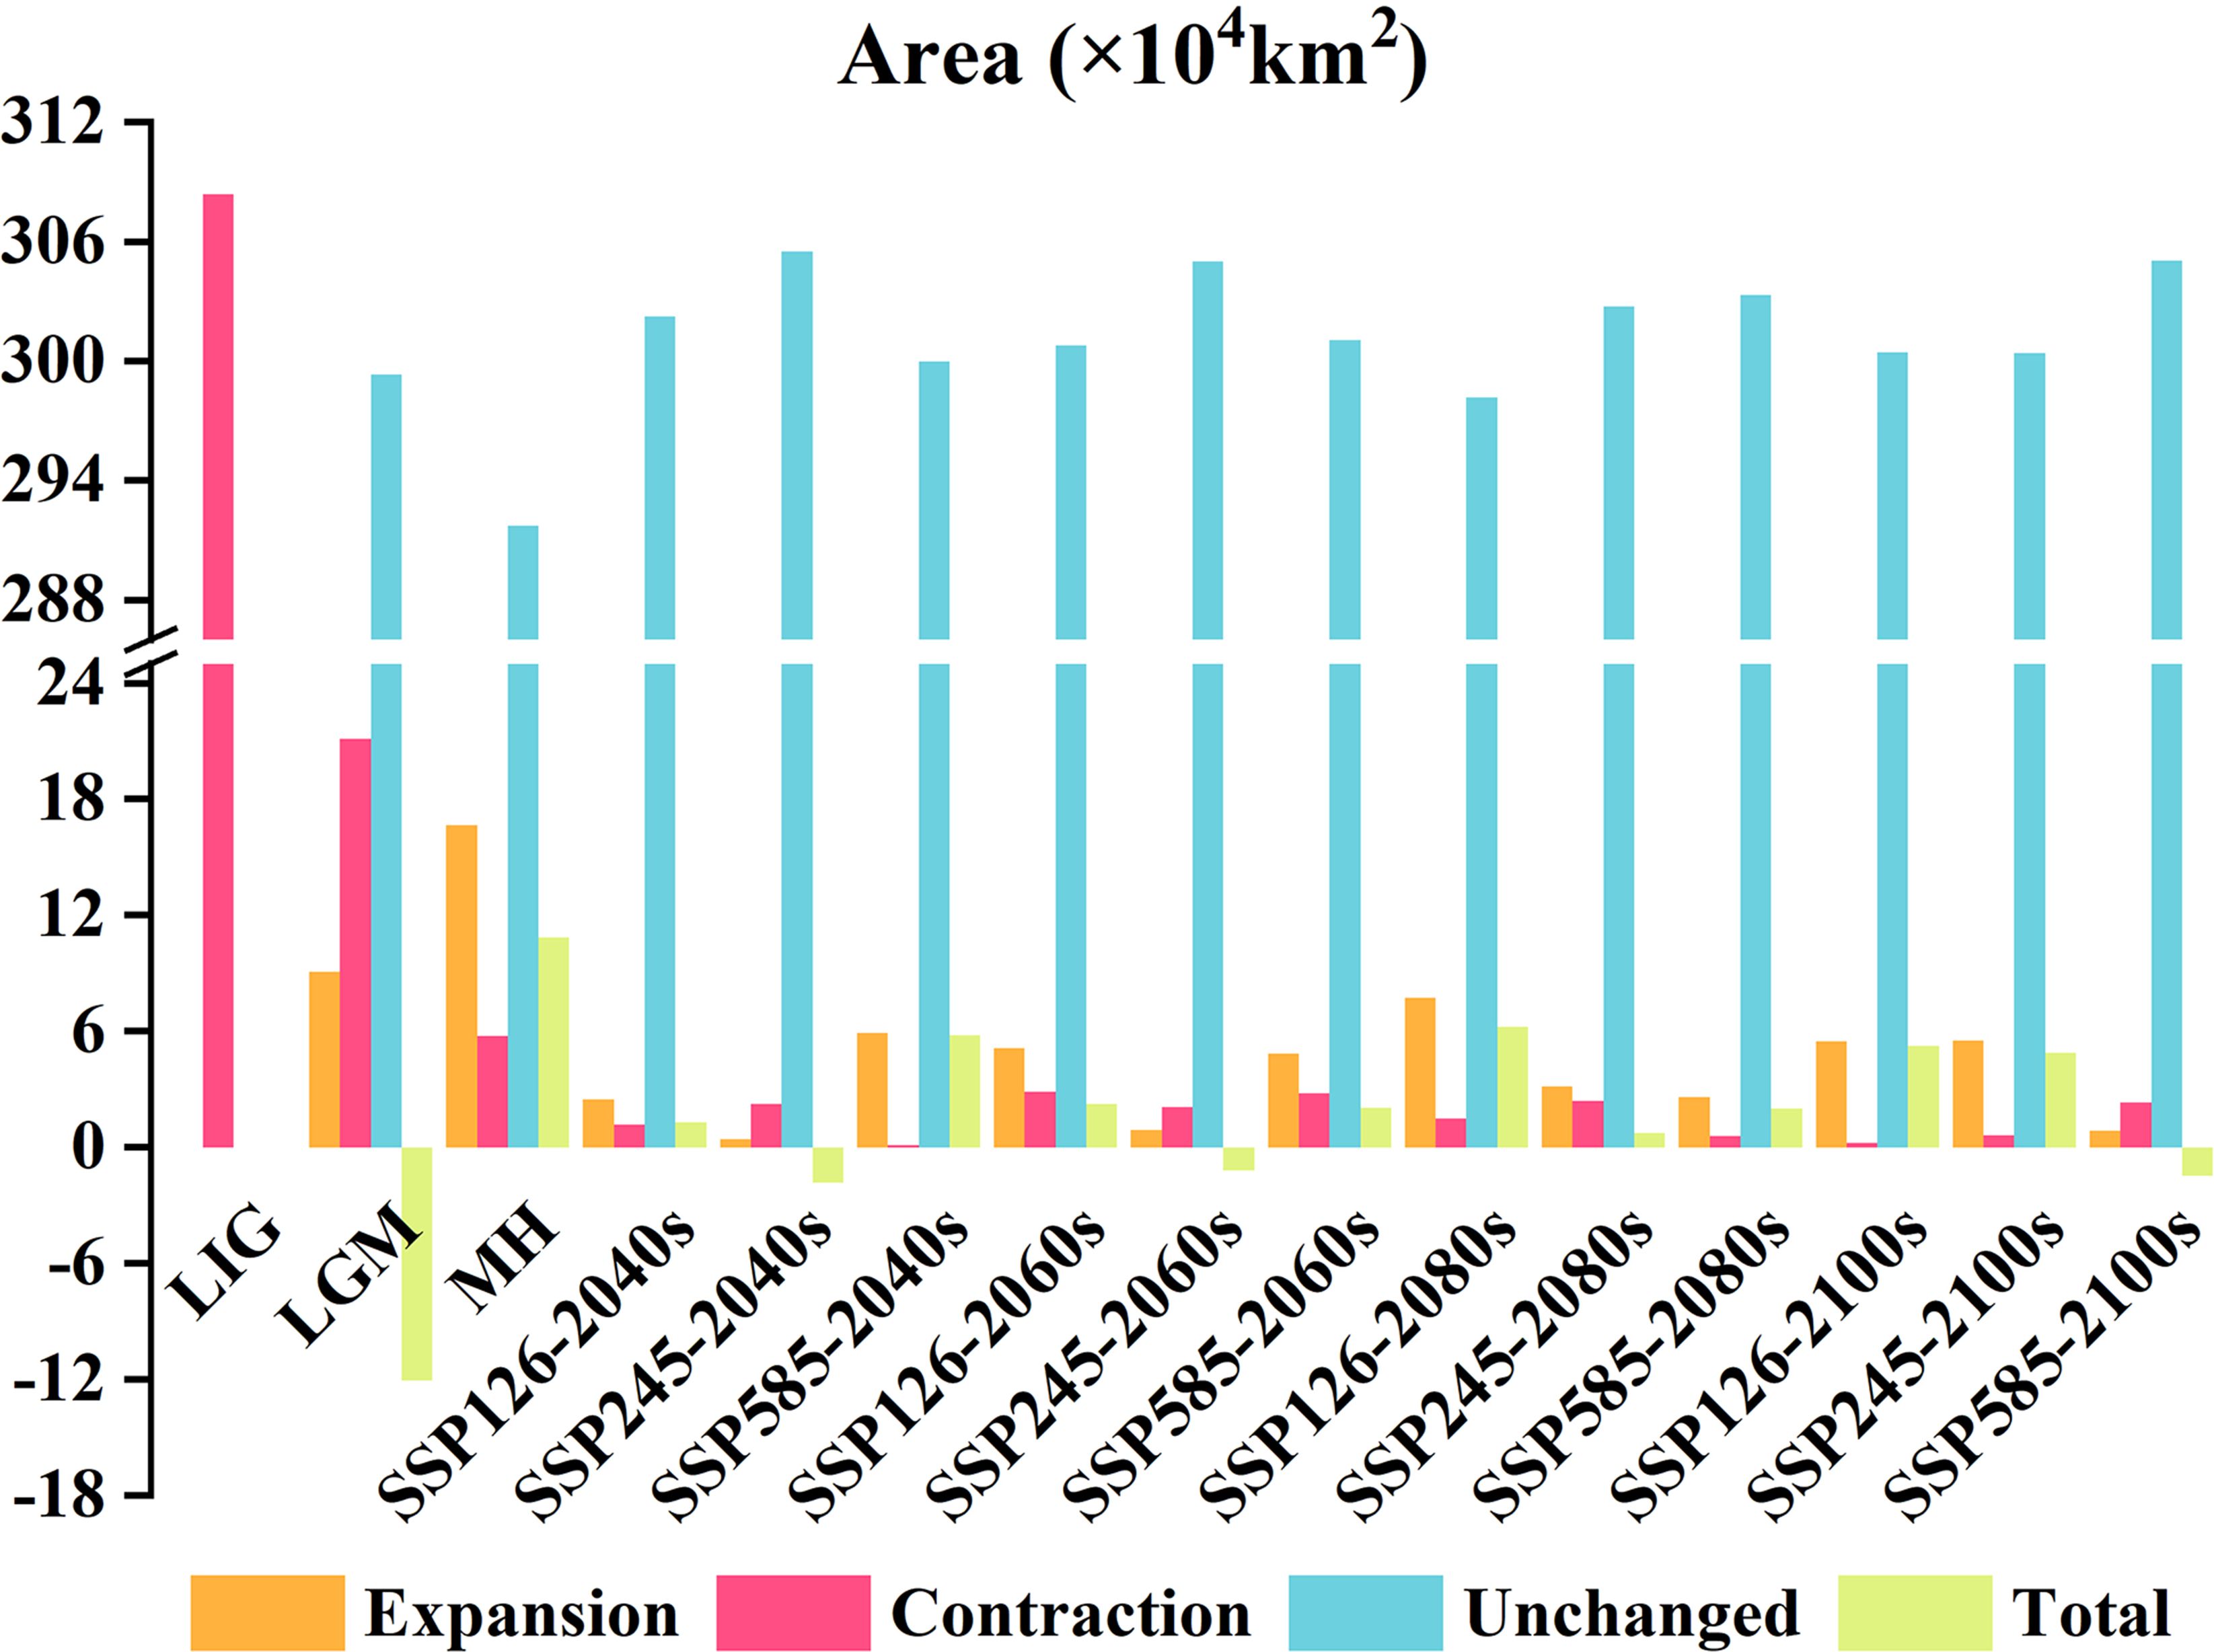
Figure 6. Areal change of E. ulmoides habitat in different periods compared with that in the current predicted by MaxEnt model.
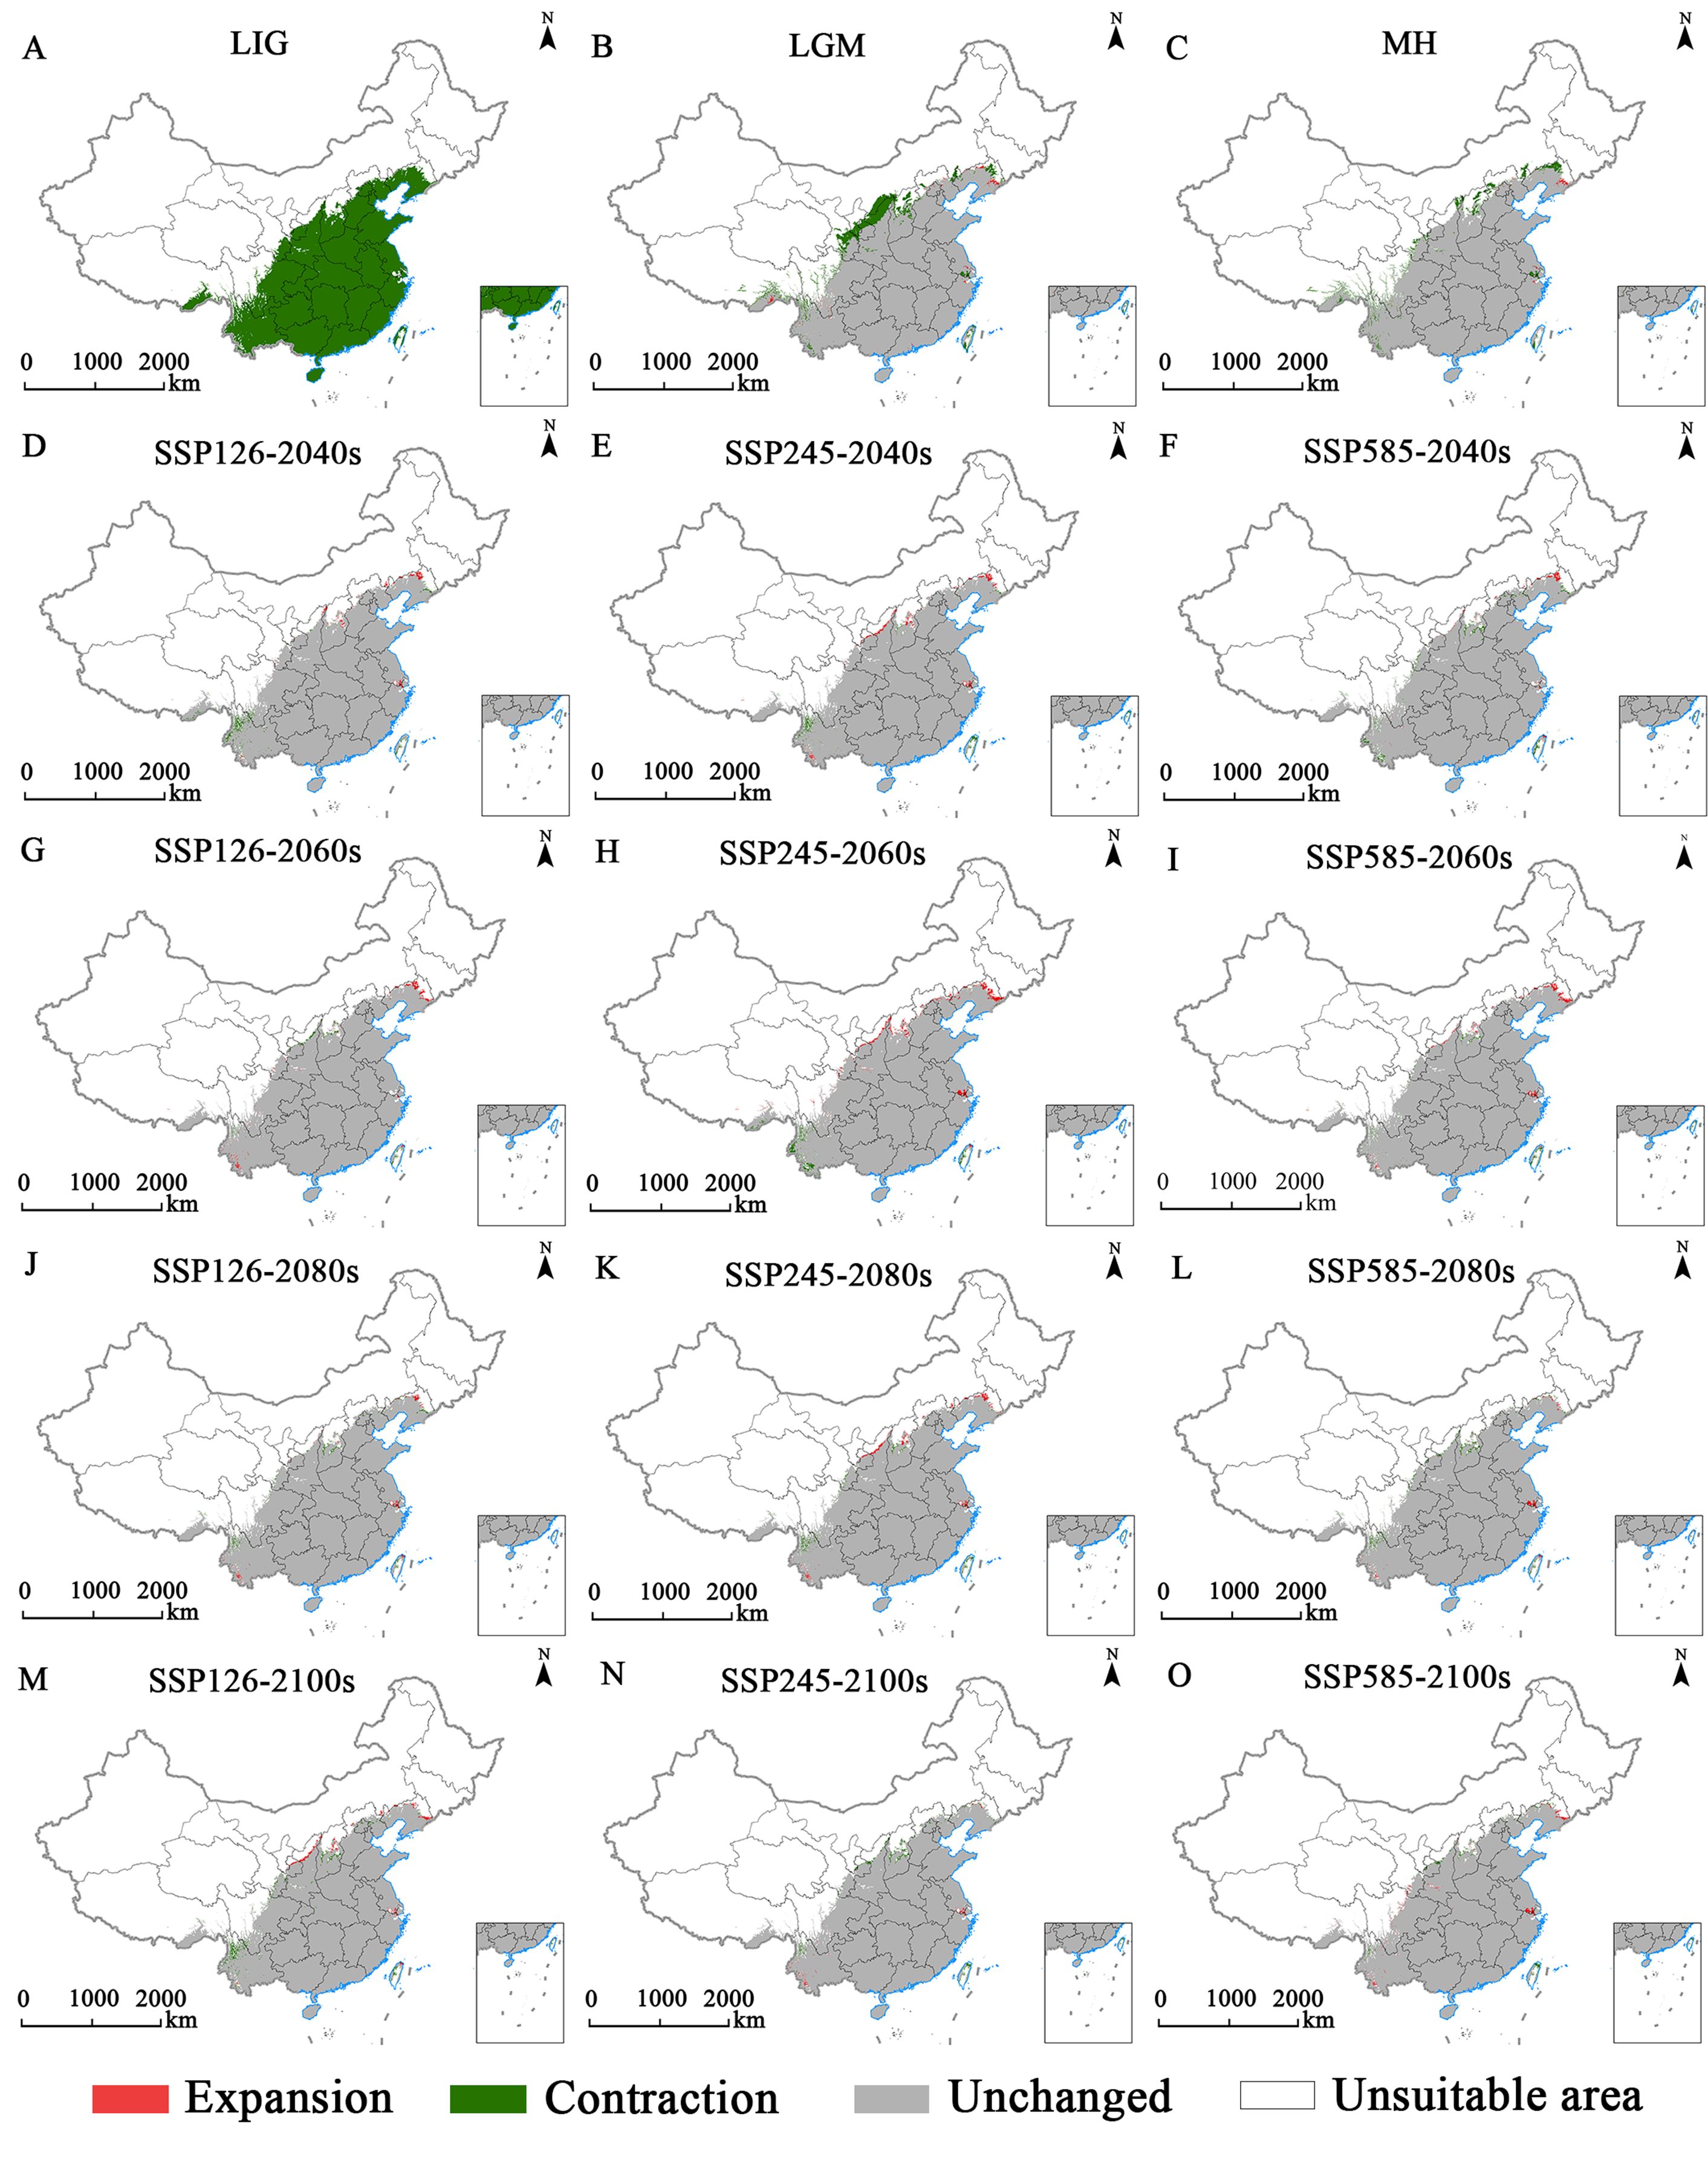
Figure 7. Spatial changes in E. ulmoides in China under the glacial epoch (A–C), SSP126 (D, G, J, M), SSP245 (E, H, K, N) and SSP585 (F, I, L, O) scenarios in the 2040s (D–F), 2060s (G–I), 2080s (J–L) and 2100s (M–O).
3.6 Multivariate environment similarity surface and most dissimilar variable analysis
The MaxEnt model was employed to predict the multiple environmental similarity surface (MESS) and the least similar variable (MOD) outcomes for E. ulmoides under different climatic scenarios (Figures 8–10). This study revealed that during the LGM, LIG, and MH, the areas of climatic anomaly (S<0) were more extensive than those projected under future climate scenarios. The historical periods were categorized by decreasing degrees of climatic anomalies in the order: LGM > MH > LIG. The primary regions of climatic anomalies were situated within the current suitable habitats. Moreover, a shift in the dominant variable affected the distribution from the mean diurnal range (bio2) to the maximum temperature of the warmest month (bio5). In contrast, under future climate scenarios, a reduction in the overall climatic anomaly area (S<0) across the potential distribution range is expected. However, changes in the severity of these anomalies are anticipated to be minor. The main regions experiencing climatic anomalies are projected to be in the northern and northwestern parts of the current suitable habitats.
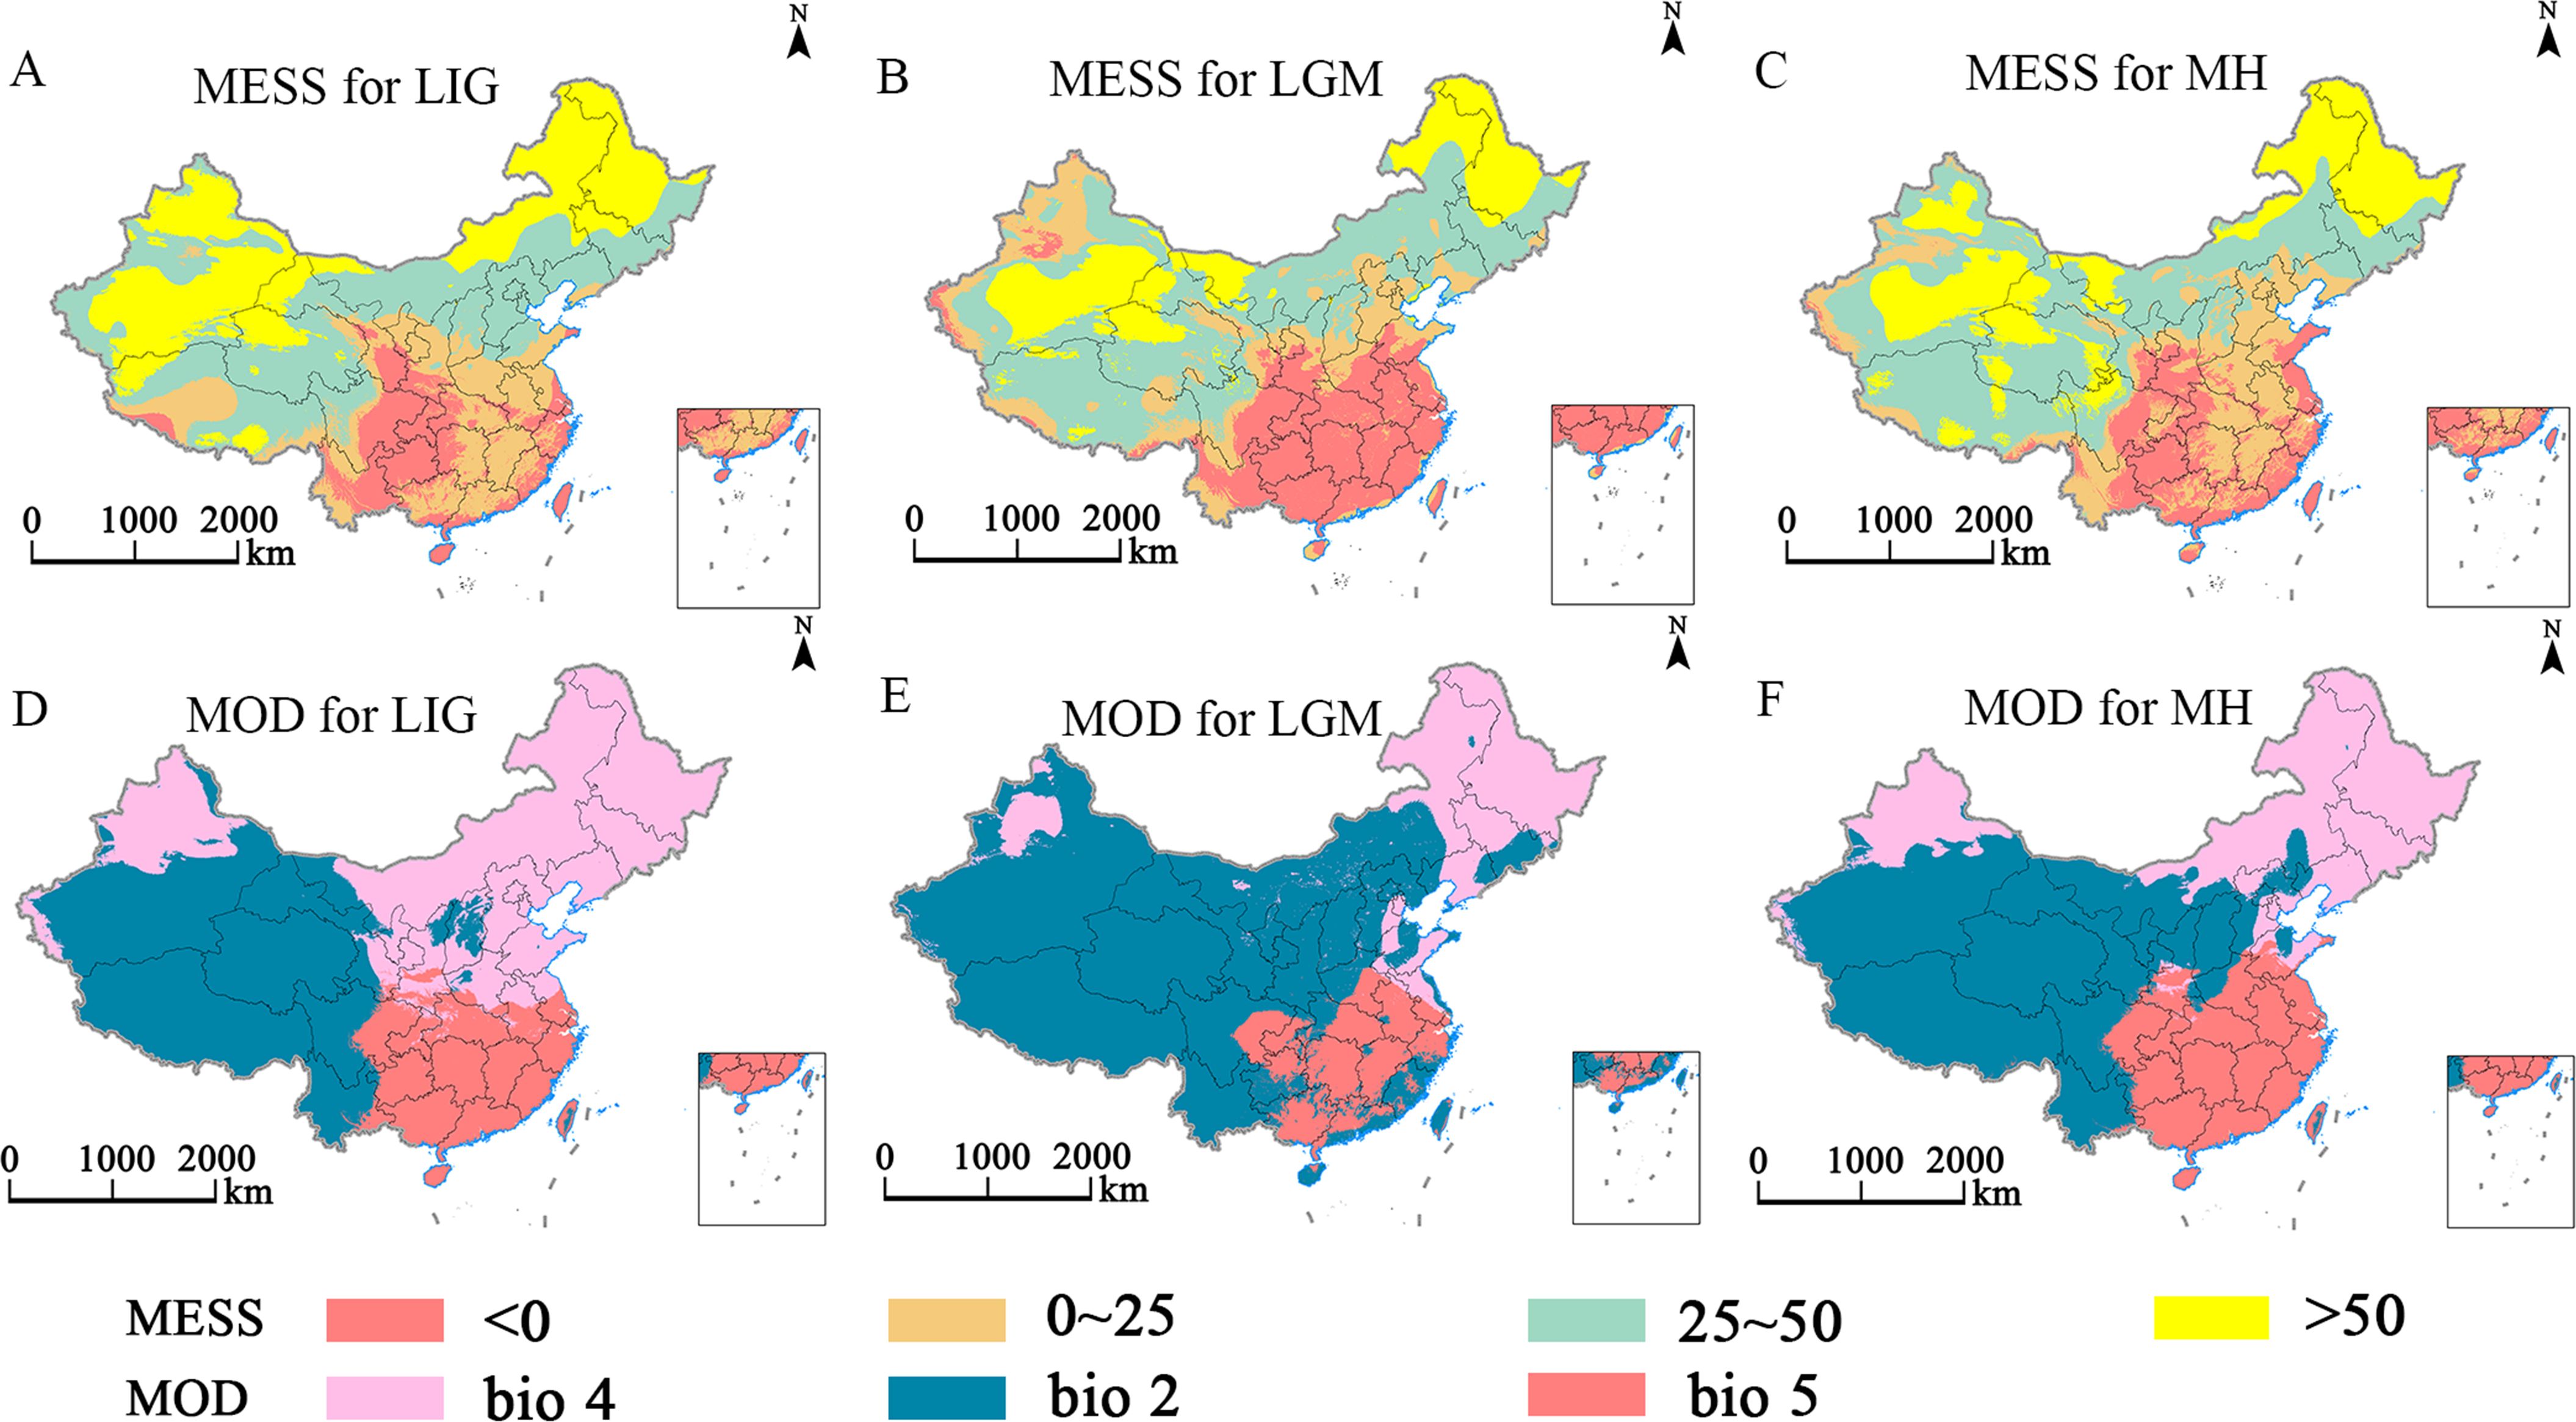
Figure 8. Multivariate environmental similarity surface (MESS, A–C) and most dissimilar variable (MoD, D–F) analysis for E. ulmoides during glacial periods.
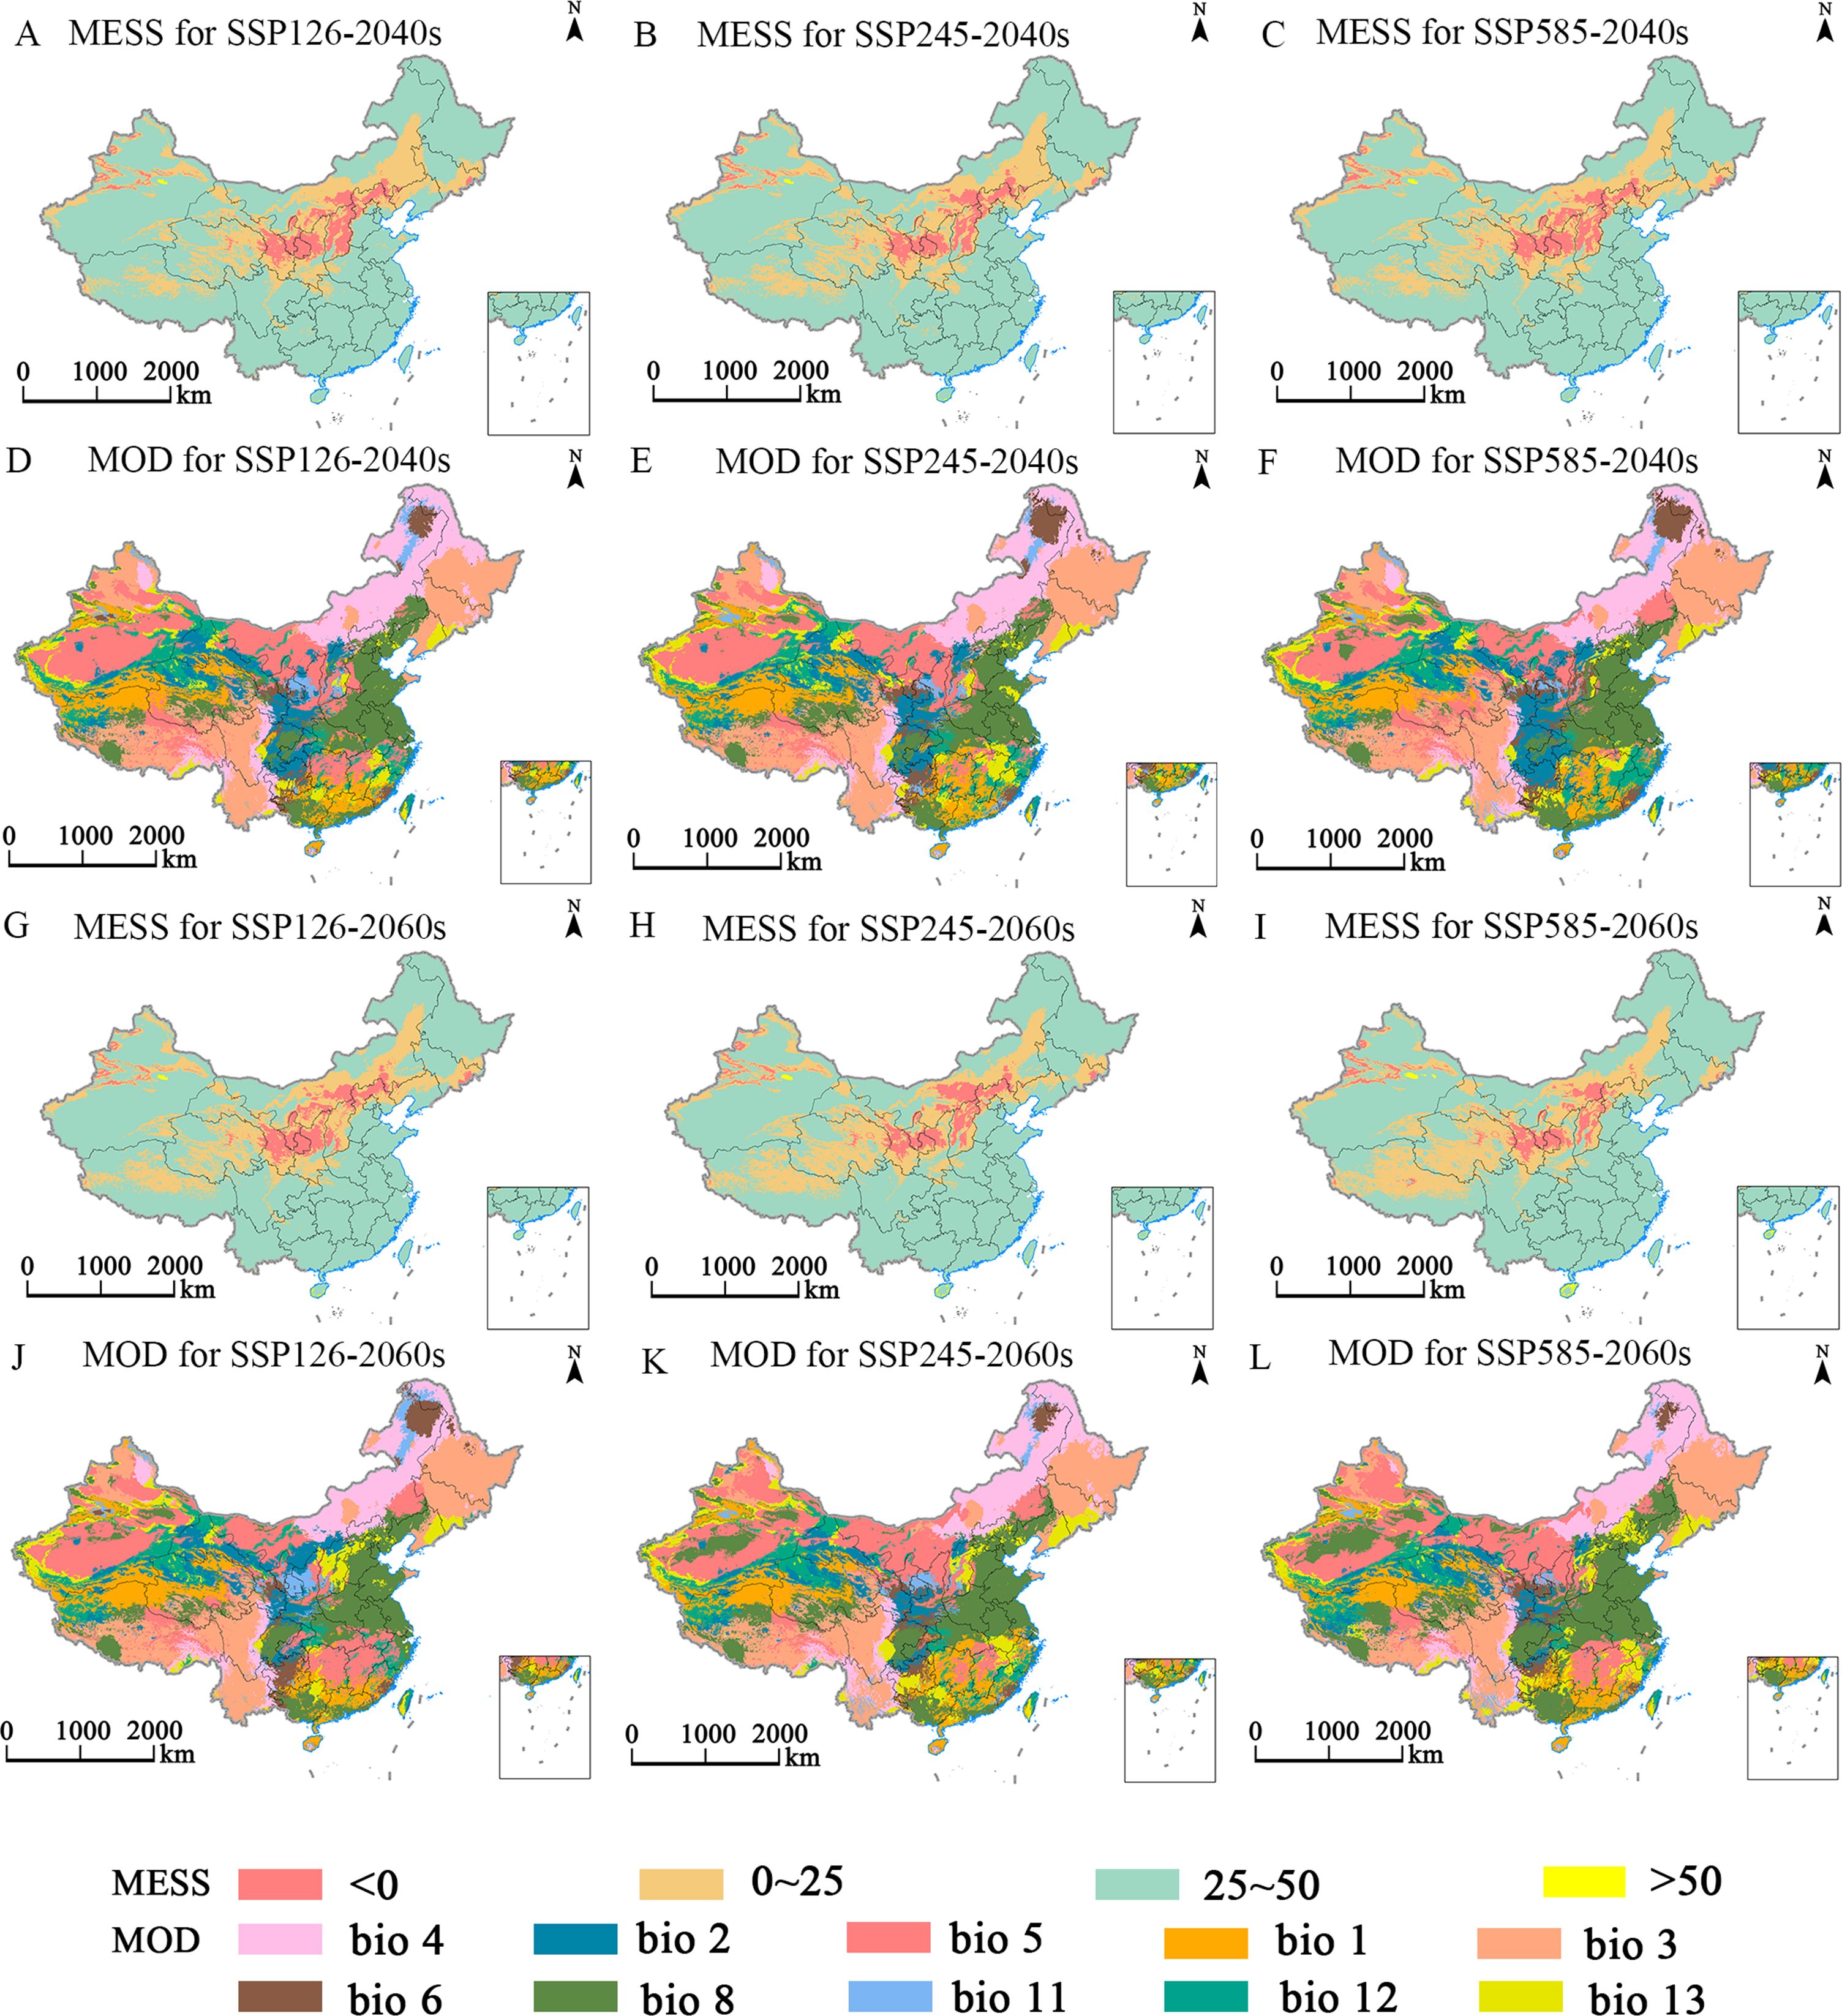
Figure 9. Multivariate environmental similarity surface (MESS, A-C, G-I) and most dissimilar (MoD, D-F, J-L) variable analysis for E. ulmoides in China under different combinations of climate change scenario in the 2040s and 2060s.
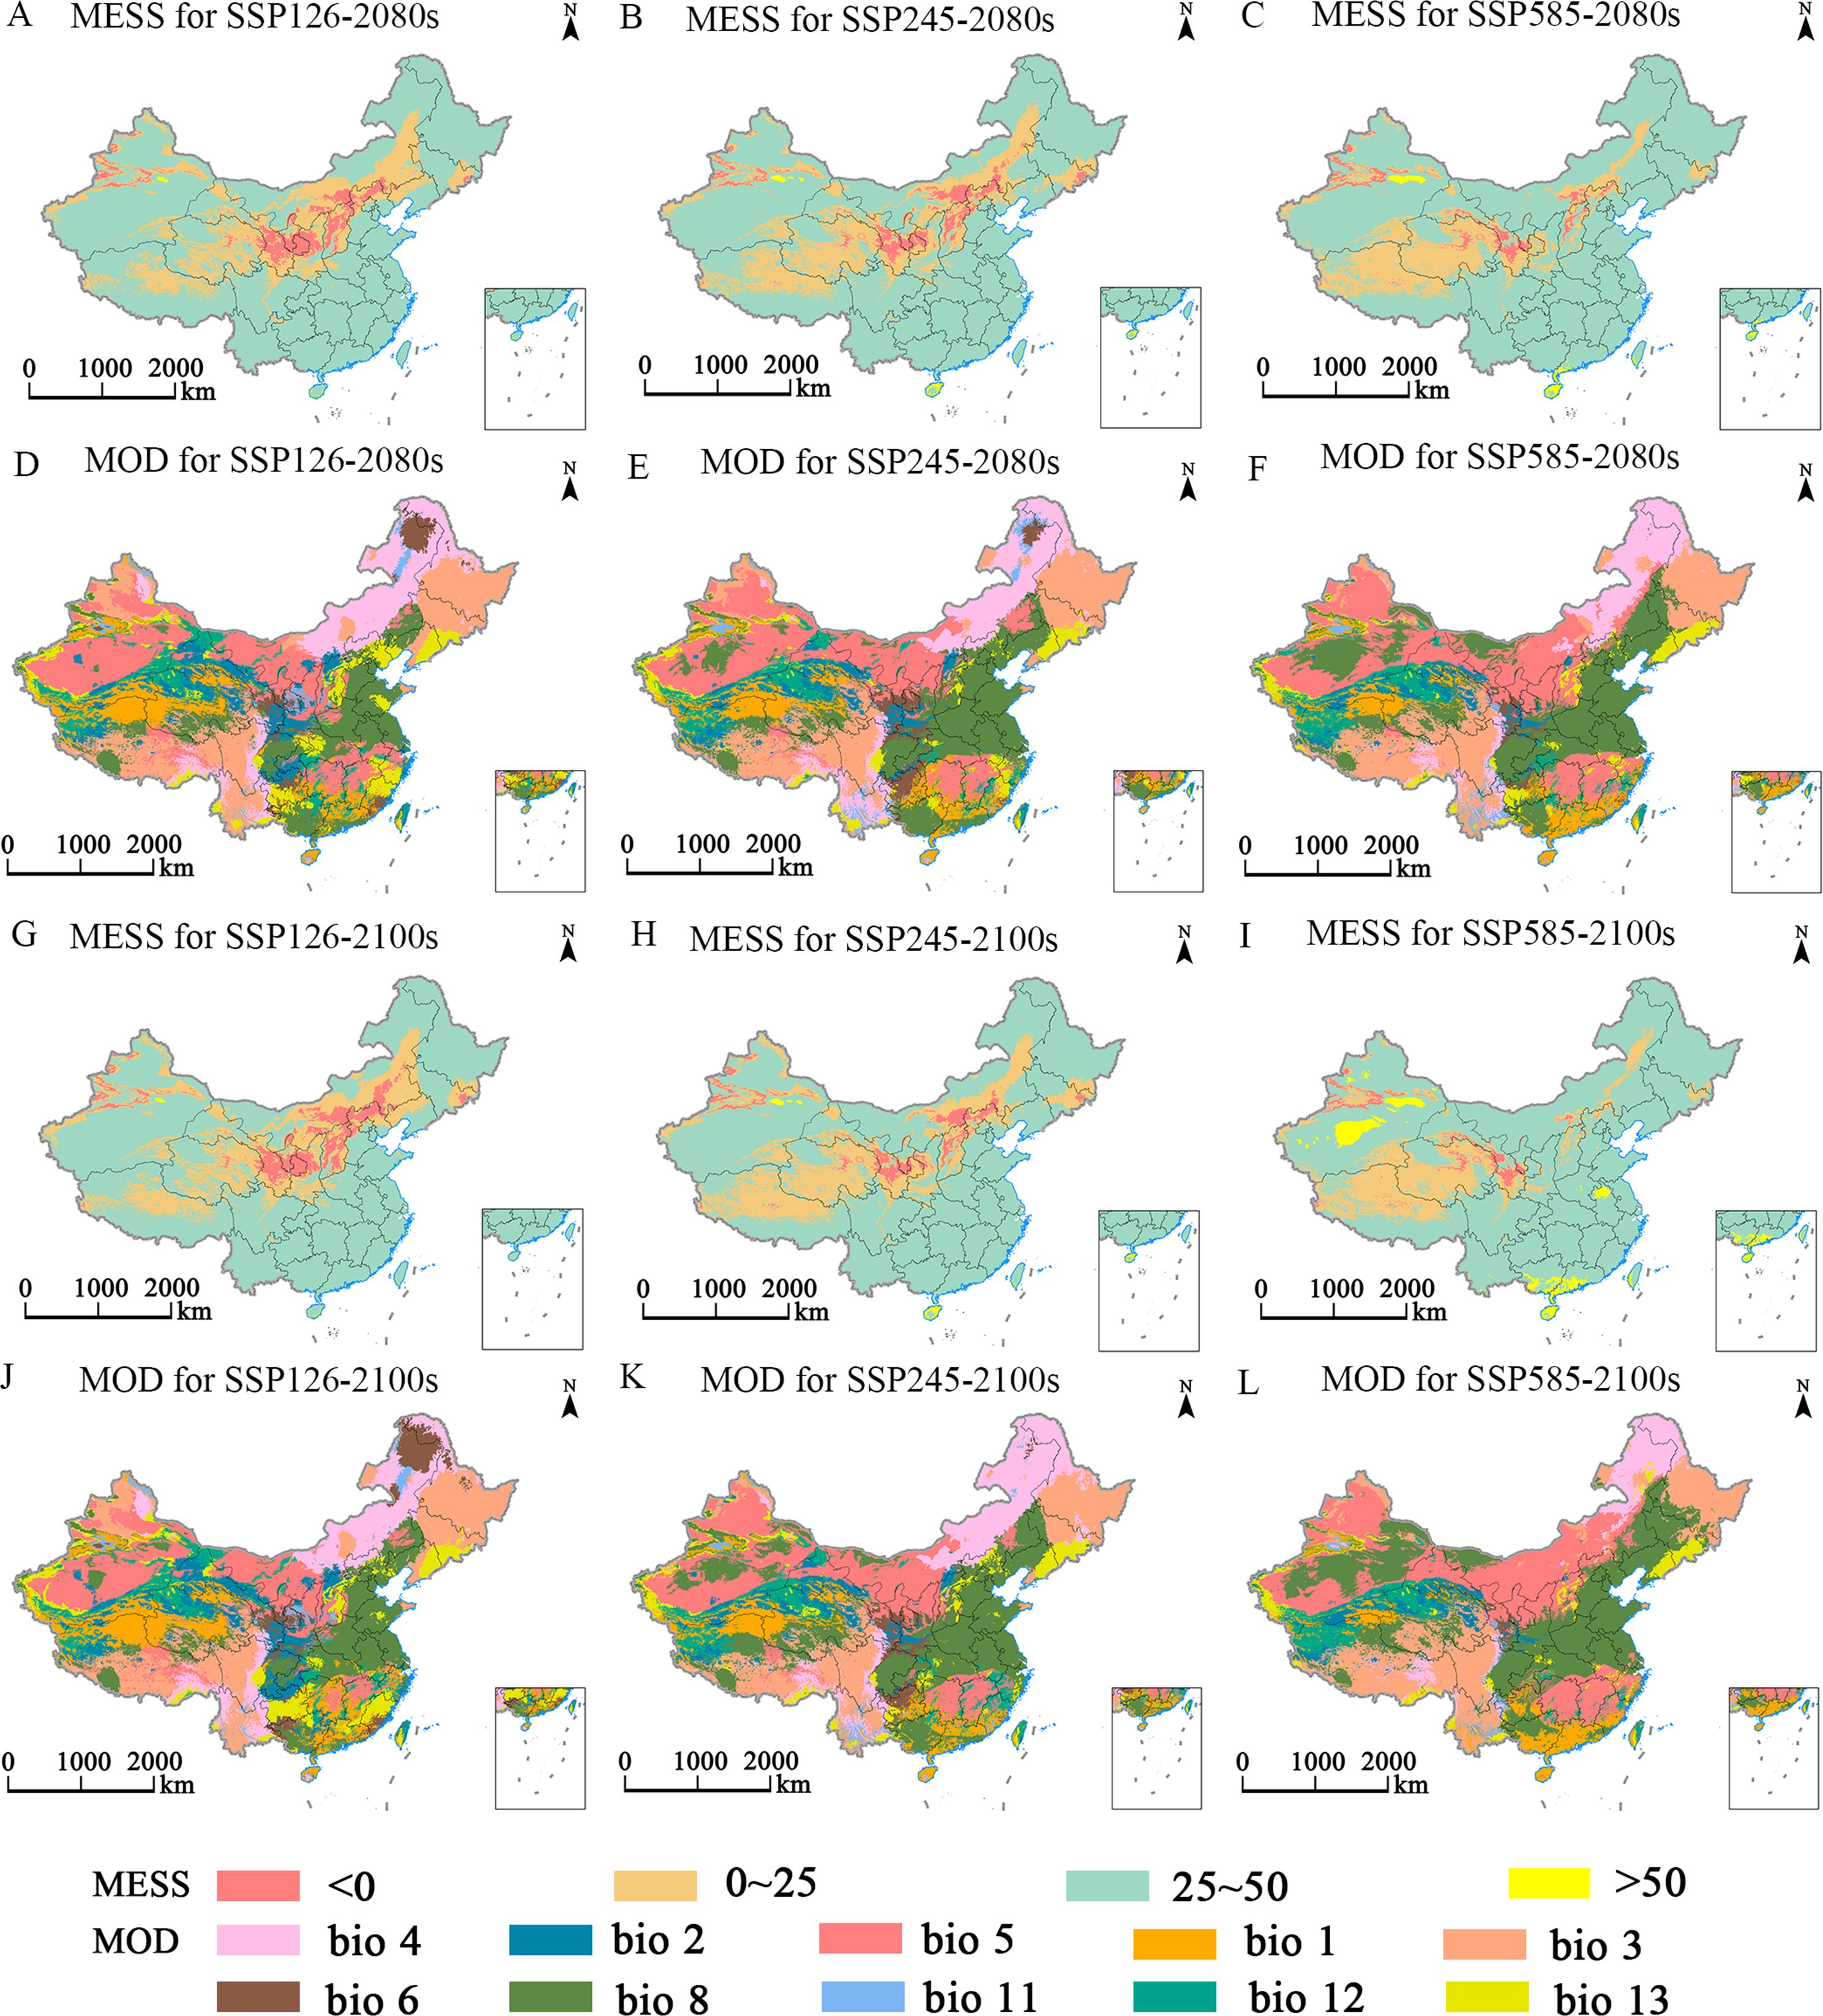
Figure 10. Multivariate environmental similarity surface (MESS, A-C, G-I) and most dissimilar (MoD, D-F, J-L) variable analysis for E. ulmoides in China under different combinations of climate change scenarios in the 2080s and 2100s.
3.7 The migration trends of the geometric centers of suitable E. ulmoides habitat under climate change during different periods
The geometric center was used in this study to represent the overall spatial position of potentially suitable E. ulmoides habitat since the last interglacial period (Figure 11). Currently, the geometric center of potentially suitable E. ulmoides habitat is located in Yiling District, Yichang City, Hubei Province. During the last interglacial period, the Last Glacial Maximum, and Mid-Holocene, the centers of E. ulmoides distributions were situated in Yiling District, Dianjun District, and Yiling District in Hubei Province, respectively. Under the SSP1-2.6 scenario, the center is projected to shift from Yiling District to Dangyang District by the 2040s, return to Yiling District by the 2060s, and move to Zhijiang District by the 2080s. Under the SSP2-4.5 scenario, the center will be in Yiling District by the 2040s, shift to Dangyang District by the 2060s, revert to Yiling District by the 2080s, and finally move to Zhijiang District by the 2100s. Under the SSP5-8.5 scenario, the center is expected to shift from Yiling District to Zhijiang District by the 2040s, revert to Yiling District by the 2060s, move to Zhijiang District by the 2080s, and finally return to Yiling District by the 2100s.
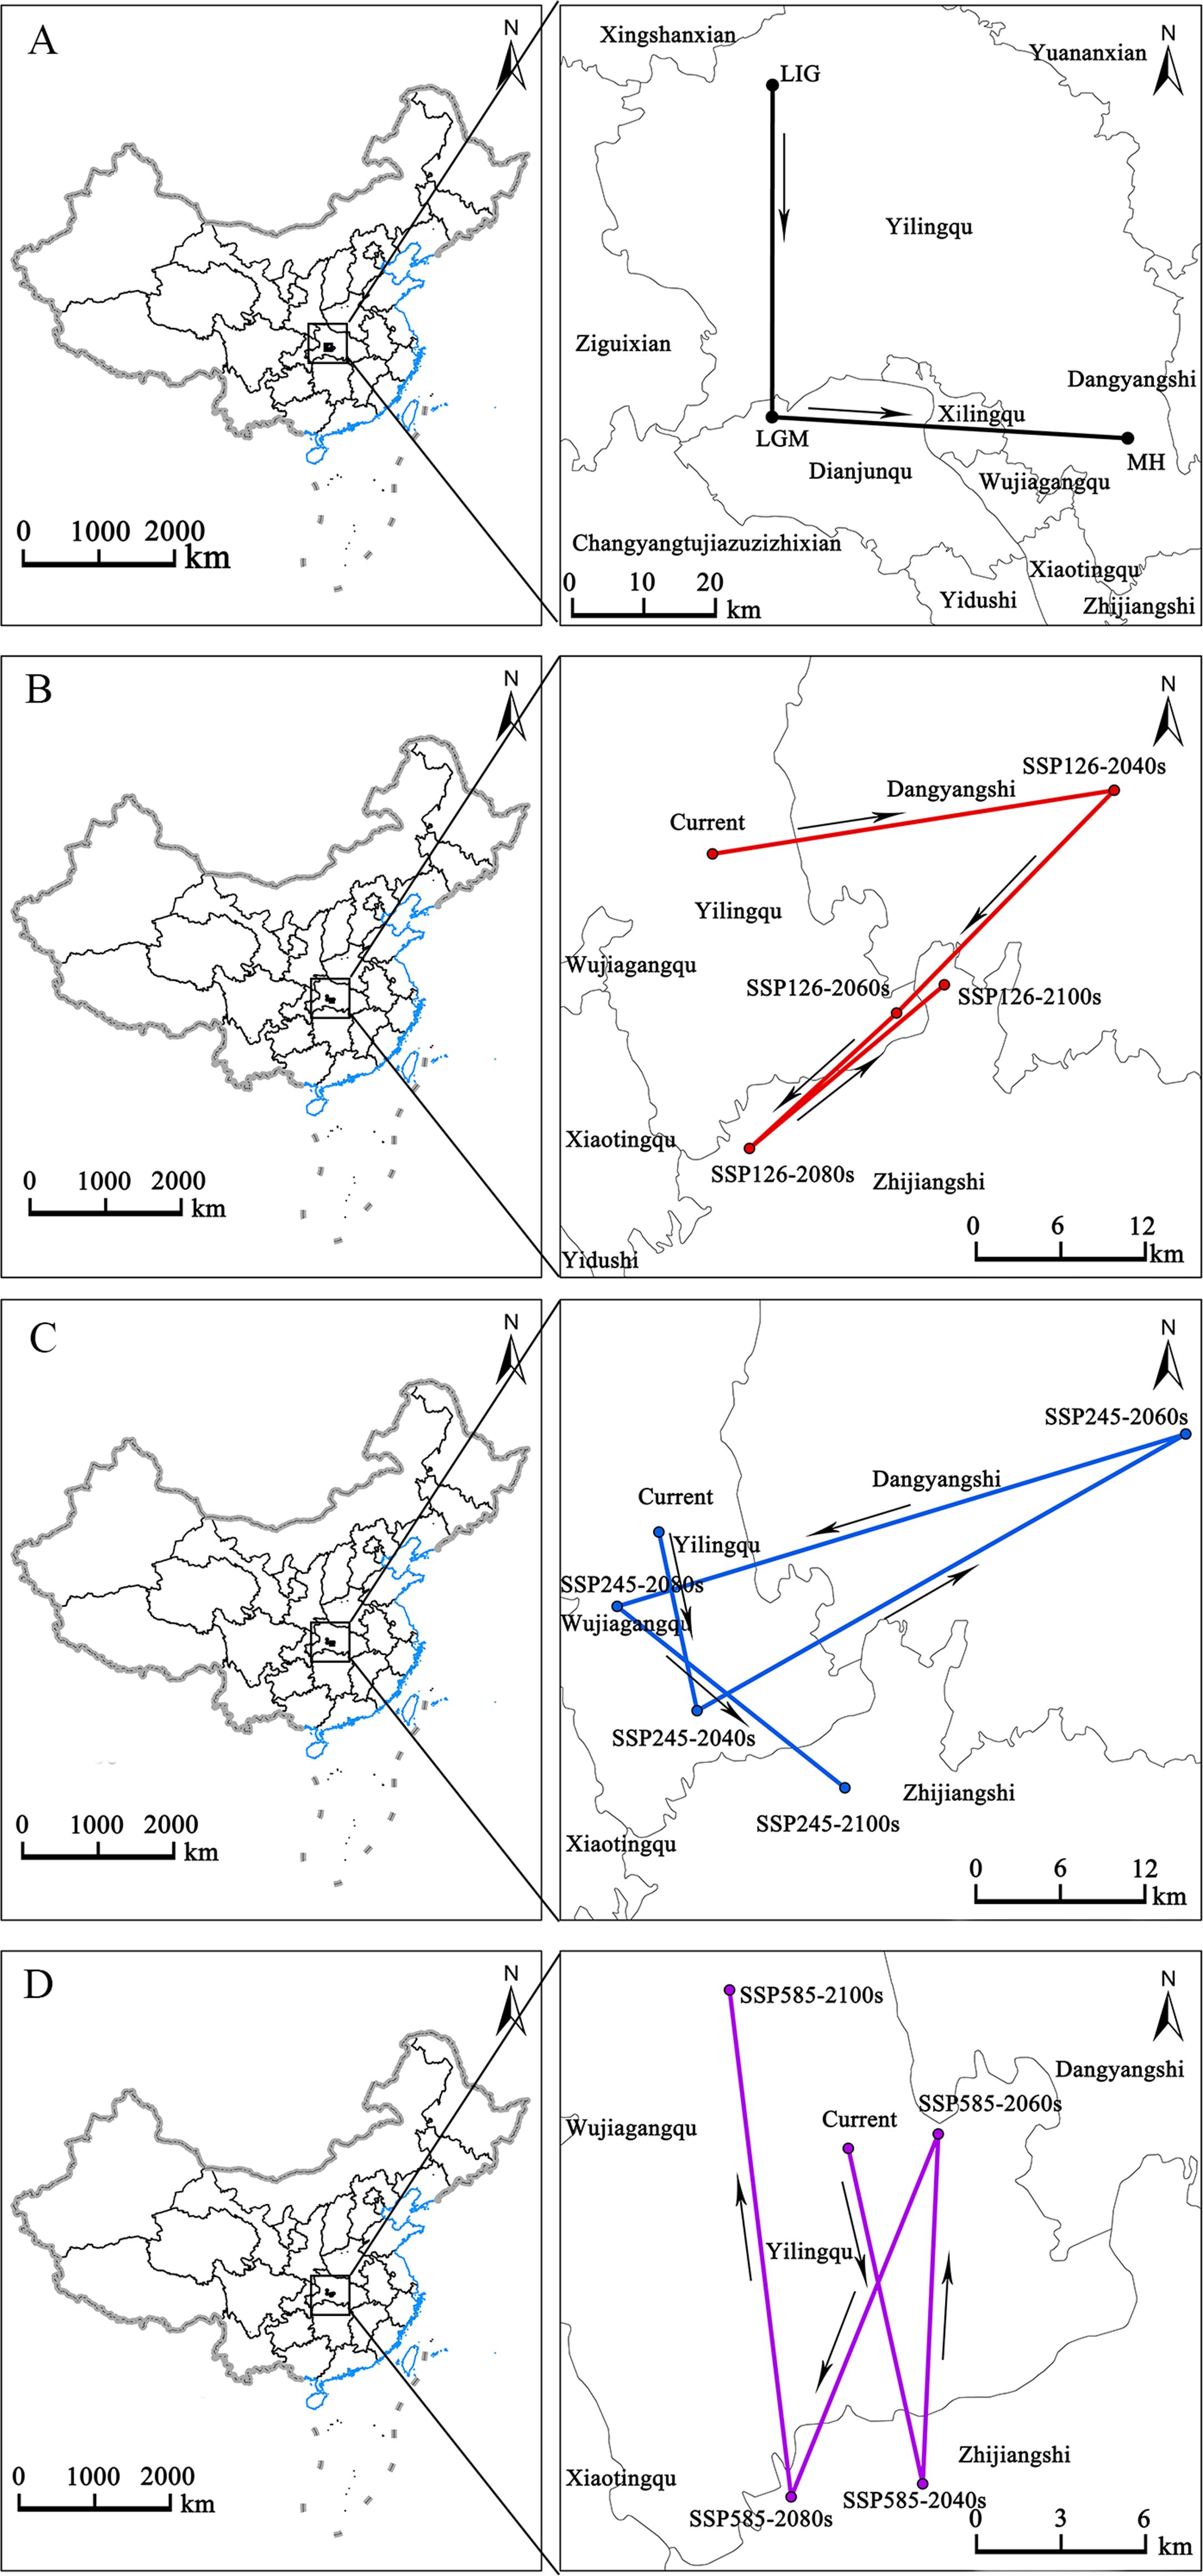
Figure 11. Migration of the center of suitable habitat for E. ulmoides under different climate scenario/year. Arrows indicate the directions in which the centers of mass migrate in different time periods. From LIG to MH (A), under the SSP126 (B), under the SSP245 (C), under the SSP245 (C), under the SSP585 (D).
4 Discussion
4.1 Model predictive performance
Predicting the changes in E. ulmoides in response to climate change is crucial for protecting resources, introducing and cultivating, refining management, and sustainable utilization (Hamid et al., 2018). Employing the same dataset, different models yield varying predictions. Before finalizing the model, verifying the accuracy of various models is essential for obtaining reliable prediction results (Huang et al., 2023). First, we used 9 Biomod2 models for prediction. The results show that the AUC and TSS of the MaxEnt model are significantly greater than those of the other models, indicating that the MaxEnt model is more accurate. The results of our study are consistent with the results of previous studies, and the prediction effect of the MaxEnt model is better (Zhao et al., 2021a).
Subsequently, a MaxEnt model combined with ArcGIS was used to simulate the potentially suitable areas for E. ulmoides in China using 257 distribution points and 19 environmental variables. To minimize errors, an extensive parameter optimization process was conducted. This process tested eight numerical regularization multipliers ranging from 0.5 to 4 and nine feature combinations. As results, in a total 72 parameter combinations were evaluated using the ENMeval package in R software. The findings indicated that optimizing the MaxEnt model parameters (RM = 2.0) with FC = LQHPT yielded the best results, as evidenced by a decrease in the AICc value of 37.48, suggesting a reduction in overfitting after optimization. Thus, employing optimized parameters within the MaxEnt model can effectively reduce overfitting problems while enhancing the predictions of species distribution.
4.2 Effects of the main environmental variables on the distribution of E. ulmoides
Environmental factors are often the most critical parameters that determine the growth and development of an organism, as well as the geographic distribution, diversity, and evolution of species (Zhao et al., 2021a, b). The analysis using the MaxEnt model indicated that the distribution of E. ulmoides in China is primarily influenced by several key factors, including the minimum temperature of the coldest month, annual mean temperature, annual precipitation, precipitation of the wettest month, temperature seasonality, and mean temperature of the coldest quarter. The environmental conditions suitable for the growth of E. ulmoides occur when the minimum temperature of the coldest month exceeds -5°C, the annual mean temperature is above 14°C, and the annual precipitation ranges between 900 mm and 1900 mm. The results demonstrated that precipitation and temperature are significant factors limiting the current distribution of E. ulmoides. Hydrothermal conditions are crucial in determining plant distribution, with terrestrial plants showing particular sensitivity to temperature and precipitation (Bradie et al., 2017). Temperature and precipitation influence a series of physiological activities during seed germination, growth, and development (Punyasena et al., 2010).
4.3 Changes in the potential geographical distribution of E. ulmoides
In China, E. ulmoides is predominantly found in regions characterized by a subtropical monsoon climate south of the Yangtze River, where hydrothermal resources are plentiful. The predictions from the MaxEnt model indicate that the potential distribution area for E. ulmoides is mainly concentrated in Chongqing, Guizhou, Guangxi, Hainan, Hunan, Jiangxi, Hubei, Anhui, Henan, Shandong Provinces, most of the provinces of Guangdong, Fujian, Jiangsu, eastern Sichuan Province, and parts of Shanxi and Shaanxi Provinces. Under future climate scenarios, the predicted potentially suitable areas for E. ulmoides are expected to expand, primarily to the north. Similar to the migration of this species to higher altitudes and latitudes (Grabherr et al., 1994; Zu et al., 2021), there is only a small range of migration observed for centroids, with some returning to their original region. Northern China, which experiences low annual rainfall and cold, dry winters, is deemed unsuitable or less suitable for E. ulmoides.
4.4 Priority protected areas of E. ulmoides
E. ulmoides has long been utilized as a medicinal resource in China. The industry surrounding E. ulmoides encompasses sectors such as daily chemicals, food, rubber, and materials (Zhu et al., 2020; Gao et al., 2023; Wei X. et al., 2021). The bark, leaves, seeds, and wood of E. ulmoides hold significant economic value (Zhu and Sun, 2018). There is a historical precedence of E. ulmoides cultivation in China to fulfill the rising demand for its products (Du and Tan, 1996). To counter the environmental impact of extensive E. ulmoides cultivation, it is essential to develop more sustainable cultivation practices that are informed by an enhanced understanding of the species’ potential distribution. The MaxEnt model has been utilized to forecast the highly suitable regional distribution of E. ulmoides in various regions, including Eastern Sichuan, Chongqing, Guizhou, Hunan, Guangxi, Guangdong, and Jiangxi. Most of these areas are warm and humid mountainous areas with good natural conditions, which are consistent with the growth habits of most medicinal plants and are very suitable for the growth of Chinese herbal medicines (Liu et al., 2021). These regions are likely to maintain stability under various climate change scenarios. The growth of E. ulmoides in these regions is expected to be minimally impacted by future climate warming. Therefore, these areas can be designated as priority conservation zones for E. ulmoides, where a substantial quantity of E. ulmoides can be cultivated.
5 Conclusions
In formulating natural resource management policies, accurate and reliable results are often required. In this study, Biomod2 platform was used to simulate the appropriate distribution of E. ulmoides. After screening 9 single models, MaxEnt model showed high accuracy and could predict the distribution and change of E. ulmoides resources well. Moreover the potential distribution map produced by the optimized MaxEnt model is closer to the actual distribution of E. ulmoides, so it can provide more accurate and valuable information. The MaxEnt model was used to ascertain the distribution of potentially suitable habitats for E. ulmoides across China under historical, current, and future climate conditions. The results indicate that the minimum temperature of the coldest month, the annual mean temperature, and the annual precipitation significantly influence the distribution of E. ulmoides. The most favorable habitats under the current climate conditions were found in the provinces of Chongqing, Guizhou, Guangxi, Guangdong, Hunan, Jiangxi, Fujian, Hubei, Anhui, Jiangsu, Henan, Shandong, and Hainan. The areas classified as highly, moderately, and minimally suitable for E. ulmoides covered 106.37 × 10⁴ km2, 124.80 × 10⁴ km2, and 77.22 × 10⁴ km2, respectively, with most highly suitable areas located in Southwest and Southeast China. In the future, under varying climate scenarios, these highly suitable regions are anticipated to remain relatively unchanged. This highlights their importance for the conservation of E. ulmoides germplasm. The Yichang region in Hubei Province is expected to become an important migratory hub for E. ulmoides under changing climatic conditions. Additionally, the suitable distribution range of E. ulmoides is predicted to expand northward in response to varying climate conditions. This study provides valuable empirical data to support the conservation and sustainable management of E. ulmoides resources in the future.
Data availability statement
The original contributions presented in the study are included in the article/Supplementary Material, further inquiries can be directed to the corresponding author/s.
Author contributions
GC: Writing – original draft, Software, Methodology, Funding acquisition, Formal Analysis, Data curation. XY: Writing – original draft, Software, Data curation. QS: Writing – original draft, Software, Data curation. YG: Writing – original draft, Software. TW: Writing – original draft, Software, Formal Analysis, Data curation. CX: Writing – original draft, Software, Formal Analysis. JX: Writing – review & editing, Formal Analysis. YZ: Validation, Supervision, Funding acquisition, Writing – review & editing.
Funding
The author(s) declare that financial support was received for the research, authorship, and/or publication of this article. This work was supported by grants from the following projects. Guizhou Province Science and Technology Support (Qian Ke He Support [2020]4Y091). National Engineering Technology Research Center for Miao Medicine improved ability, (QKHZYD[2023]006). Engineering Research Center of new dosage Form and new Preparation of Traditional Chinese Medicine (Miao medicine) in Higher Education Institutions of Guizhou Province (QJJ[2022]022). The High-level Innovative Talents of Guizhou Province of China (Qian Ke He Platform and Talent - GCC[2023]037.
Conflict of interest
The authors declare that the research was conducted in the absence of any commercial or financial relationships that could be construed as a potential conflict of interest.
Publisher’s note
All claims expressed in this article are solely those of the authors and do not necessarily represent those of their affiliated organizations, or those of the publisher, the editors and the reviewers. Any product that may be evaluated in this article, or claim that may be made by its manufacturer, is not guaranteed or endorsed by the publisher.
Supplementary material
The Supplementary Material for this article can be found online at: https://www.frontiersin.org/articles/10.3389/fpls.2024.1359271/full#supplementary-material
References
Austin, M. P., Smith, T. M., Niel, K. P. V., Wellington, A. B. (2009). Physiological responses and statistical models of the environmental niche: a comparative study of two co-occurring Eucalyptus species. J. Ecol. 97, 496–507. doi: 10.1111/j.1365-2745.2009.01494.x
Bradie, J., Leung, B. (2017). A quantitative synthesis of the importance of variables used in MaxEnt species distribution models. J. Biogeogr. 44 (6), 1344–1361. doi: 10.1111/jbi.12894
Dakhil, M. A., Xiong, Q., Farahat, E. A., Zhang, L., Huang, D. (2019). Original Articles Past and future climatic indicators for distribution patterns and conservation planning of temperate coniferous forests in southwestern China. Ecol. Indic. 107, 105559. doi: 10.1016/j.ecolind.2019.105559
Deb, J. C., Phinn, S., Butt, N., McAlpine, C. A. (2017). The impact of climate change on the distribution of two threatened Dipterocarp trees. Ecol. Evol. 7, 2238–2248. doi: 10.1002/ece3.2017.7.issue-7
Du, H. Y., Tan, Y. D. (1996). Thoughts on the cultivation and industry development of Eucommia ulmoides in China. Economic Forestry Res. S1), 137–140.
Elith, J., Kearney, M., Phillips, S. (2010). The art of modelling range-shifting species. Methods Ecol. Evol. 1, 330–342. doi: 10.1111/j.2041-210X.2010.00036.x
Feng, X., Park, D. S., Walker, C., Peterson, A. T., Merow, C., Papeş, M. (2019). A checklist for maximizing reproducibility of ecological niche models. Nat. Ecol. Evol. 3, 1382–1395. doi: 10.1038/s41559-019-0972-5
Ferreira, R. B., Parreira, M. R., de Arruda, F. V., Falcão, M. J. A., de Freitas Mansano, V., Nabout, J. C. (2022). Combining ecological niche models with experimental seed germination to estimate the effect of climate change on the distribution of endangered plant species in the Brazilian Cerrado. Environ. Monit Assess. 194, 283. doi: 10.1007/s10661-022-09897-7
Gao, R., Zhang, H., Li, B., Guo, H., Li, H., Xiong, L., et al. (2023). Extraction of Eucommia ulmoides gum and microbial lipid from Eucommia ulmoides Oliver leaves by dilute acid hydrolysis. Biotechnol. Lett. 45, 619–628. doi: 10.1007/s10529-023-03377-9
Grabherr, G., Gottfried, M., Pauli, H. (1994). Climate effects on mountain plants. Nature 369, 448. doi: 10.1038/369448a0
Hamid, M. A. A., Khuroo, B., Charles, R., Ahmad, C. P., Aravind, N. A. (2018). Impact of climate change on the distribution range and niche dynamics of Himalayan birch, a typical treeline species in Himalayas. Biodiversity Conserv. 28, 2345–2370. doi: 10.1007/s10531-018-1641-8
Hampe, A., Rodríguez-Sánchez, F., Dobrowski, S., Hu, F. S., Gavin, D. G. (2013). Climate refugia: from the Last Glacial Maximum to the twenty-first century. New Phytol. 197, 16–18. doi: 10.1111/nph.2012.197.issue-1
Hirzel, A. H., Helfer, V., Metral, F. (2001). Assessing habitat-suitability models with a virtual species. Ecol. Model. 145, 111–121. doi: 10.1016/S0304-3800(01)00396-9
Huang, D., An, Q., Huang, S., Tan, G., Quan, H., Chen, Y., et al. (2023). Biomod2 modeling for predicting the potential ecological distribution of three Fritillaria species under climate change. Sci. Rep. 13, 18801. doi: 10.1038/s41598-023-45887-6
Huang, L., Lyu, Q., Zheng, W., Yang, Q., Cao, G. (2021). Traditional application and modern pharmacological research of Eucommia ulmoides Oliv. Chin. Med. 16, 73. doi: 10.1186/s13020-021-00482-7
Ji, L. T., Zheng, T. Y., Chen, Q., Zhong, J. J., Kang, B. (2020). Responses of potential suitable area of Paris verticillata to climate change and its dominant climate factors. Chin. J. Appl. Ecol. 31, 89–96. doi: 10.13287/j.1001-9332.202001.012
Lai, W. F., Ye, X. Z., Wen, W. G. (2022). Analysis of potential suitable regions for the precious Tibetan medicine Sinopodophyllum hexandrum based on the optimized MaxEnt model. J. Fujian Agr. For. Univ 51, 112–120. doi: 10.13323/j.cnki.j.fafu(nat.sci.).2022.01.017
Li, D. H., Yang, C., Huang, Y. Q., Li, L., Han, W. C., Kang, H. L., et al. (2022). Novel Green resource material: Eucommia Ulmoides Gum. Resour. Chemicals Materials 1, 114–128. doi: 10.1016/j.recm.2022.01.005
Li, M., He, J., Zhao, Z., Lyu, R., Yao, M., Cheng, J., et al. (2020b). Predictive modelling of the distribution of Clematis sect. Fruticella s. str. under climate change reveals a range expansion during the Last Glacial Maximum. PeerJ 8, e8729. doi: 10.7717/peerj.8729
Li, W. Q., Shi, M. M., Huang, Y., Chen, K. Y., Sun, H., Chen, J. H. (2019). Climatic change can influence species diversity patterns and potential habitats of salicaceae plants in China. Forests 10, 220. doi: 10.3390/f10030220
Liu, H., Wang, D., Sun, J., Wang, Y. (2021). Spatial distribution and influencing factors of geographical indications of Chinese medicinal materials in China. J.Chin.Medicinal Materials 44, 548–554. doi: 10.13863/j.issn1001-4454.2021.03.008
Muscarella, R., Galante, P. J., Soley-Guardia, M., Boria, R. A., Kass, J. M., Uriarte, M., et al. (2015). Enmeval: an R package for conducting spatially independent evaluations and estimating optimal model complexity for maxent ecological niche models. Methods Ecol. Evol. 5, 1198–1205. doi: 10.1111/2041-210X.12261
Phillips, S. J., Anderson, R. P., Dudík, M., Schapire, R. E., Blair, M. E. (2017). Opening the black box: an open-source release of Maxent. Ecography 40, 887–893. doi: 10.1111/ecog.2017.v40.i7
Phillips, S. J., Anderson, R. P., Schapire, R. E. (2006). Maximum entropy modeling of species geographic distributions. Ecol. Model. 190, 231–259. doi: 10.1016/j.ecolmodel.2005.03.026
Pierre, L., Florent, M., Chao, Y., Philippe, C., Vanesa, M. M., Nogueira, J. M. P. (2018). Fry, a global database of fire patch functional traits derived from space-borne burned area products. Sci. Data 5, 180132. doi: 10.1038/sdata.2018.132
Punyasena, S. W., Eshel, G., Mcelwain, J. C. (2010). The influence of climate on the spatial patterning of Neotropical plant families. J. Biogeogr. 35, 117–130. doi: 10.1111/j.1365-2699.2007.01773.x
Sillero, N., Huey, R. B., Gilchrist, G., Rissler, L., Pascual, M. (2020). Distribution modelling of an introduced species: do adaptive genetic markers affect potential range? Proc. Biol. Sci. 287, 20201791. doi: 10.1098/rspb.2020.1791
Thuiller, W., Lavorel, S., Araújo, M. B., Sykes, M. T., Prentice, I. C. (2005). Climate change threats to plant diversity in Europe. Proc. Natl. Acad. Sci. U.S.A. 102, 8245–8250. doi: 10.1073/pnas.0409902102
Velasco, J. A., González-Salazar, C. (2019). Akaike information criterion should not be a “test” of geographical prediction accuracy in ecological niche modelling. Ecol. Inf. 51, 25–32. doi: 10.1016/j.ecoinf.2019.02.005
Wang, D., Cui, B., Duan, S., Chen, J., Fan, H., Lu, B., et al. (2019a). Moving north in China: The habitat of Pedicularis kansuensis in the context of climate change. Sci. Total Environ. 697, 133979. doi: 10.1016/j.scitotenv.2019.133979
Wang, H., Lu, H., Zhang, H., Yi, S., Liang, C. (2019b). Grass habitat analysis and phytolith-based quantitative reconstruction of asian monsoon climate change in the sand-loess transitional zone, northern China. Quaternary Res. 92, 1–11. doi: 10.1017/qua.2019.32
Wang, J., Wei, X., Sun, S., Li, M., Shi, T., Zhang, X. (2023). Assessment of carbon sequestration capacity of E. ulmoides in Ruyang County and its ecological suitability zoning based on satellite images of GF-6. Sensors (Basel) 23, 7895. doi: 10.3390/s23187895
Wang, J. J., Qin, X. M., Gao, X. X., Zhang, B., Du, G. H. (2017). Research progress on chemical compounds, pharmacological action, and quality status of eucommia ulmoides. Chin. Traditional Herbal Drugs 48, 3228–3237. doi: 10.7501/j.issn.0253-2670.2017.15.031
Wang, Q., Abbott, R. J., Yu, Q. S., Lin, K., Liu, J. Q. (2013). Pleistocene climate change and the origin of two desert plant species, Pugionium cornutum and Pugionium dolabratum (Brassicaceae), in northwest China. New Phytol. 199, 277–287. doi: 10.1111/nph.2013.199.issue-1
Wang, Y., Xie, L., Zhou, X., Chen, R., Zhao, G., Zhang, F. (2023). Prediction of the potentially suitable areas of Leonurus japonicus in China based on future climate change using the optimized MaxEnt model. Ecol. Evol. 13, e10597. doi: 10.1002/ece3.v13.10
Warren, D. L., Glor, R. E., Turelli, M. (2010). ENMTools: a toolbox for comparative studies of environmental niche models. Ecography 33, 607–611. doi: 10.1111/j.1600-0587.2009.06142.x
Watson, J. E. M., Pacifici, M., Visconti, P., Butchart, S. (2017). Species’ traits influenced their response to recent climate change. Nat. Climate Change 7, 205–208.
Wei, X., Peng, P., Peng, F., Dong, J. (2021). Natural polymer eucommia ulmoides rubber: A novel material. J. Agric. Food Chem. 69, 3797–3821. doi: 10.1021/acs.jafc.0c07560
Wei, Y., Zhang, L., Wang, J., Wang, W., Niyati, N., Guo, Y., et al. (2021). Chinese caterpillar fungus (Ophiocordyceps sinensis) in China: Current distribution, trading, and futures under climate change and overexploitation. Sci. Total Environ. 755, 142548. doi: 10.1016/j.scitotenv.2020.142548
Wouyou, H. G., Lokonon, B. E., Idohou, R., Zossou-Akete, A. G., Assogbadjo, A. E., Glèlè Kakaï, R. (2022). Predicting the potential impacts of climate change on the endangered Caesalpinia bonduc (L.) Roxb in Benin (West Africa). Heliyon 8, e09022. doi: 10.1016/j.heliyon.2022.e09022
Wu, D., Yu, D., Zhang, Y., Dong, J., Li, D., Wang, D. (2018). Metabolite profiles, bioactivity, and HPLC fingerprint of different varieties of eucommia ulmoides oliv.: towards the utilization of medicinal and commercial Chinese endemic tree. Molecules 23, 1898. doi: 10.3390/molecules23081898
Wu, T., Lu, Y., Fang, Y., Xin, X., Liu, X. (2019). The beijing climate center climate system model (bcc-csm): the main progress from cmip5 to cmip6. Geoscientific Model. Dev. 12, 1573–1600. doi: 10.5194/gmd-12-1573-2019
Ye, X. Z., Zhao, G. H., Zhang, M. Z., Cui, X. Y., Fan, H. H., Liu, B. (2020). Distribution Pattern of Endangered Plant Semiliquidambar cathayensis (Hamamelidaceae) in Response to Climate Change after the Last Interglacial Period. Forests 11, 434. doi: 10.3390/f11040434
Zhan, P., Wang, F. Y., Xia, P. G., Zhao, G. H., Wei, M. T., Wei, F. G., et al. (2022). Assessment of suitable cultivation region for Panax notoginseng under different climatic conditions using MaxEnt model and high-performance liquid chromatography in China. Ind. Crops Products 176), 176. doi: 10.1016/j.indcrop.2021.114416
Zhang, J. C., Xue, Z. H., Yan, R. F. (2011). Damping performance of eucommia ulmoides gum. Chin. J. Polymer Sci. 29, 157–163. doi: 10.1007/s10118-010-1008-4
Zhang, K., Yao, L., Meng, J., Tao, J. (2018). Maxent modeling for predicting the potential geographical distribution of two peony species under climate change. Sci. Total Environ. 634, 1326–1334. doi: 10.1016/j.scitotenv.2018.04.112
Zhang, K., Zhang, Y., Tao, J. (2019). Predicting the potential distribution of paeonia veitchii (paeoniaceae) in China by incorporating climate change into a maxent model. Forests 10, 190. doi: 10.3390/f10020190
Zhang, W. R., Li, Y., Zhao, J., Wu, C. H., Ye, S., Yuan, W. J. (2016). Isolation and characterization of microsatellite markers for Eucommia ulmoides (Eucommiaceae), an endangered tree, using next-generation sequencing. Genet. Mol. Res. 15, 15027789. doi: 10.4238/gmr.15027789
Zhang, Y. B., Liu, Y. L., Qin, H., Meng, Q. X. (2019). Prediction on spatial migration of suitable distribution of Elaeagnus mollis under climate change conditions in Shanxi Province, China. Chin. J. Appl. Ecol. 30, 496–502. doi: 10.13287/j.1001-9332.201902.040
Zhao, G. H., Cui, X. Y., Sun, J. J., Li, T. T., Wang, Q., Ye, X. Z., et al. (2021a). Analysis of the distribution pattern of Chinese Ziziphus jujuba under climate change based on optimized biomod2 and MaxEnt models. Ecol. Indic. 132, 108256. doi: 10.1016/j.ecolind.2021.108256
Zhao, Q., Mi, Z. Y., Lu, C., Zhang, X. F., Chen, L. J., Wang, S. Q., et al. (2022). Predicting potential distribution of Ziziphus spinosa (Bunge) H.H. Hu ex F.H. Chen in China under climate change scenarios. Ecol. Evol. 12, e8629. doi: 10.1002/ece3.8629
Zhao, Q., Zhang, Y., Li, W. N. H., Bang, W. Z., Jia, B. W., Shi, Q. N., et al. (2021b). Predicting the potential distribution of perennial plant coptis chinensis franch. in China under multiple climate change scenarios. Forests 12, 1464–1464. doi: 10.3390/f12111464
Zhu, M. O., Sun, R. C. (2018). Eucommia ulmoides oliver: A potential feedstock for bioactive products. J. Agr. Food Chem. 66, 5433–5438. doi: 10.1021/acs.jafc.8b01312
Zhu, M. Q., Wen, J. L., Zhu, Y. H., Su, Y. Q., Sun, R. C. (2016). Isolation and analysis of four constituents from barks and leaves of Eucommia ulmoides Oliver by a multi-step process[J]. Industr. Crops Prod. 83, 124–132. doi: 10.1016/j.indcrop.2015.12.049
Zhu, S., Li, J., Liu, Y., Chen, L. (2020). Formation and stability of Eucommia ulmoides Oliver seed oil-loaded inverse microemulsion formed by food-grade ingredients and its antioxidant activities. J. Food Sci. 85, 1489–1499. doi: 10.1111/1750-3841.15103
Keywords: climate change, potentially suitable area, species distribution models, woody medicinal plant, MaxEnt
Citation: Cao G, Yuan X, Shu Q, Gao Y, Wu T, Xiao C, Xu J and Zhang Y (2024) Prediction of the potentially suitable areas of Eucommia ulmoides Oliver in China under climate change based on optimized Biomod2 and MaxEnt models. Front. Plant Sci. 15:1359271. doi: 10.3389/fpls.2024.1359271
Received: 21 December 2023; Accepted: 09 October 2024;
Published: 15 November 2024.
Edited by:
Lei Shu, Nanjing Agricultural University, ChinaReviewed by:
Liangjin Yao, Zhejiang Academy of Forestry, ChinaPedzisai Kowe, Midlands State University, Zimbabwe
Miguel Alfonso Ortega-Huerta, National Autonomous University of Mexico, Mexico
Copyright © 2024 Cao, Yuan, Shu, Gao, Wu, Xiao, Xu and Zhang. This is an open-access article distributed under the terms of the Creative Commons Attribution License (CC BY). The use, distribution or reproduction in other forums is permitted, provided the original author(s) and the copyright owner(s) are credited and that the original publication in this journal is cited, in accordance with accepted academic practice. No use, distribution or reproduction is permitted which does not comply with these terms.
*Correspondence: Jian Xu, MTA0MjMxMDhAcXEuY29t; Yongping Zhang, emhhbmd5b25ncGluZzE0NEBnenkuZWR1LmNu
 Guoqiong Cao
 Xiaofeng Yuan
 Qilin Shu1
 Chenghong Xiao
 Yongping Zhang