
95% of researchers rate our articles as excellent or good
Learn more about the work of our research integrity team to safeguard the quality of each article we publish.
Find out more
ORIGINAL RESEARCH article
Front. Plant Sci. , 04 July 2024
Sec. Plant Nutrition
Volume 15 - 2024 | https://doi.org/10.3389/fpls.2024.1357193
 Xianglong Fan1
 Pan Gao2Mengli Zhang2Hao Cang2Lifu Zhang3Ze Zhang1Jin Wang3
 Xin Lv1*Qiang Zhang1*Lulu Ma1*
Introduction: Rapid and accurate estimation of leaf area index (LAI) is of great significance for the precision agriculture because LAI is an important parameter to evaluate crop canopy structure and growth status.
Methods: In this study, 20 vegetation indices were constructed by using cotton canopy spectra. Then, cotton LAI estimation models were constructed based on multiple machine learning (ML) methods extreme learning machine (ELM), random forest (RF), back propagation (BP), multivariable linear regression (MLR), support vector machine (SVM)], and the optimal modeling strategy (RF) was selected. Finally, the vegetation indices with a high correlation with LAI were fused to construct the VI-fusion RF model, to explore the potential of multi-vegetation index fusion in the estimation of cotton LAI.
Results: The RF model had the highest estimation accuracy among the LAI estimation models, and the estimation accuracy of models constructed by fusing multiple VIs was higher than that of models constructed based on single VIs. Among the multi-VI fusion models, the RF model constructed based on the fusion of seven vegetation indices (MNDSI, SRI, GRVI, REP, CIred-edge, MSR, and NVI) had the highest estimation accuracy, with coefficient of determination (R2), rootmean square error (RMSE), normalized rootmean square error (NRMSE), and mean absolute error (MAE) of 0.90, 0.50, 0.14, and 0.26, respectively.
Discussion: Appropriate fusion of vegetation indices can include more spectral features in modeling and significantly improve the cotton LAI estimation accuracy. This study will provide a technical reference for improving the cotton LAI estimation accuracy, and the proposed method has great potential for crop growth monitoring applications.
Leaf area index (LAI) is a prominent influencing factor of vegetation photosynthesis and carbon cycling (Fang et al., 2019). It has been used as the most important indicator for canopy photosynthesis and energy exchange (Parker, 2020). However, accurate prediction of crop LAI remains a challenge in crop growth monitoring, production management, and yield estimation. Traditionally, LAI is measured by destructive sampling. This method is costly, labor intensive, time consuming, error-prone, and susceptible to human factors. In recent years, with the rapid development of remote sensing technology, hyperspectral remote sensing can be used to acquire detailed and rich spectral information, which can be used to quantitatively analyze the weak spectral differences of features. It has proved to have strong advantages in crop species identification, crop growth parameter inversion, yield estimation, and pest and disease monitoring (Zhu et al., 2020; Liu et al., 2021). Therefore, in this study, hyperspectral remote sensing was used to predict LAI changes.
Vegetation index (VI) is constructed by combining spectral features. In LAI prediction, the correlation between LAI and plant canopy spectral reflectance is determined first, then spectral features are screened out to construct VI. Finally, the linear or nonlinear relationship is used to estimate LAI (Li et al., 2018). Because VI can obviously reduce noises, at present, VI is widely used for the inversion of plant LAI (Qiao et al., 2020). For example, Ma et al. (2022) estimated cotton LAI by constructing NDVI, RVI, and DVI and found that DVI had the highest correlation with LAI (correlation coefficient, −0.76). Nie et al. (2023) assessed the stability and applicability of different VIs in LAI prediction for different crops and discovered that SRI (simple ratio index) had the highest accuracy in estimating cotton and winter wheat LAI, and MTCI (MERIS terrestrial chlorophyll index) had the highest accuracy in estimating maize LAI. Based on the same modeling process and parameters, Dong et al. (2019) found that the VI constructed based on red-edge reflectance had good performance in estimating the LAI of different crops. It can be seen that the correlation between LAI and VI and the modeling results for different crops are different.
However, the accuracy of a single VI in predicting LAI is not high (Yang et al., 2017). For example, Chemura et al. (2018) estimated the nitrogen content of coffee leaves by Sentinel-2 MSI spectral data and found that the estimation accuracy of the model constructed by RNDVI (R2, 0.48) was lower than that of the model directly constructed using spectral features (R2, 0.57). Xing et al. (2020) estimated the LAI by constructing triangular vegetation index (TTVI) and 14 conventional vegetation indices and found that although the accuracy of the model constructed by TTVI was higher than that of the models constructed by the conventional VIs, the accuracy was still low (the highest R2 was only 0.60). Wang et al. (2023) found that the chlorophyll spectral features of Sabina vulgaris Ant. in Mu Us Sandy Land had higher correlations with normalized vegetation index (NDVI), ratio vegetation index (RVI), and modified normalized vegetation index (mNDVI), and the difference between the accuracy of the constructed univariate linear regression model (R2 = 0.9) and the lowest accuracy (R2 = 0.1) was large, indicating a high instability of the model. The low accuracy and high instability of the models built by individual VIs may be due to the fact that a single VI contains few spectral features, and shortwave infrared (SWIR) spectra are susceptible to the influences of soil moisture, vegetation moisture, and atmospheric moisture (Thompson et al., 2018; Degerickx et al., 2019; Srinet et al., 2019), thereby reducing the accuracy and instability of spectral estimation. In addition, using all hyperspectral data for modeling can easily lead to information redundancy and model overfitting, which reduces the accuracy, versatility, and stability of the model (Moharram et al., 2023). It should be noted that multiple VI fusions could provide rich spectral information, and the constructed model could integrate the advantages of these VIs (Barzin et al., 2020); besides, the optimal VI fusion method could highlight the spectral features, significantly increasing the prediction accuracy. Therefore, it is necessary to explore the potential of multiple VI fusions in estimating cotton LAI, which is crucial to improve the accuracy of cotton LAI estimation and accurately monitor cotton growth.
In summary, although individual VIs have been widely used to estimate crop LAI, the estimation using an individual VI is easily affected by factors such as soil background and light conditions, which ultimately reduces model universality and stability. Especially, individual VIs contain limited spectral information, which always results in a low accuracy of VI estimation. In this study, a ML-based cotton LAI estimation model was constructed by fusing multiple VIs, and the optimal fusion model was selected. The specific objectives of the study were as follows: (1) to determine the VIs participating in the modeling through correlation analysis; (2) to select the optimal estimation model by constructing cotton LAI estimation models using machine learning modeling strategies (ELM, RF, BP, MLR, and SVM) based on the selected VIs; and (3) to randomly arrange and fuse the VIs participating in the modeling (i.e., for index 1, 2, and 3, there were seven fusions including 1, 2, 3, 1 + 2, 1 + 3, 2 + 3, and 1 + 2 + 3) to determine the optimal VI fusion method based on the selected optimal model. This study will provide a technical reference for large-scale rapid cotton growth monitoring and yield estimation.
The research was carried out in the Shihezi, China (86.03°E, 44.18°N, a.s.l. 429 m) (Figure 1). This region has a typical temperate continental climate. The average annual precipitation was only 125.9–207.7 mm, and the annual accumulated temperature (≥10°C) was 3,570°C–3,729°C. In addition, there was a large day–night temperature difference. The soil type was loam. Soil organic matter, alkaline hydrolyzable nitrogen, available phosphorus, and available potassium content were 20.10 g/kg, 60.92 mg/kg, 17.83 mg/kg, and 142 mg/kg, respectively. The previous crop was cotton.
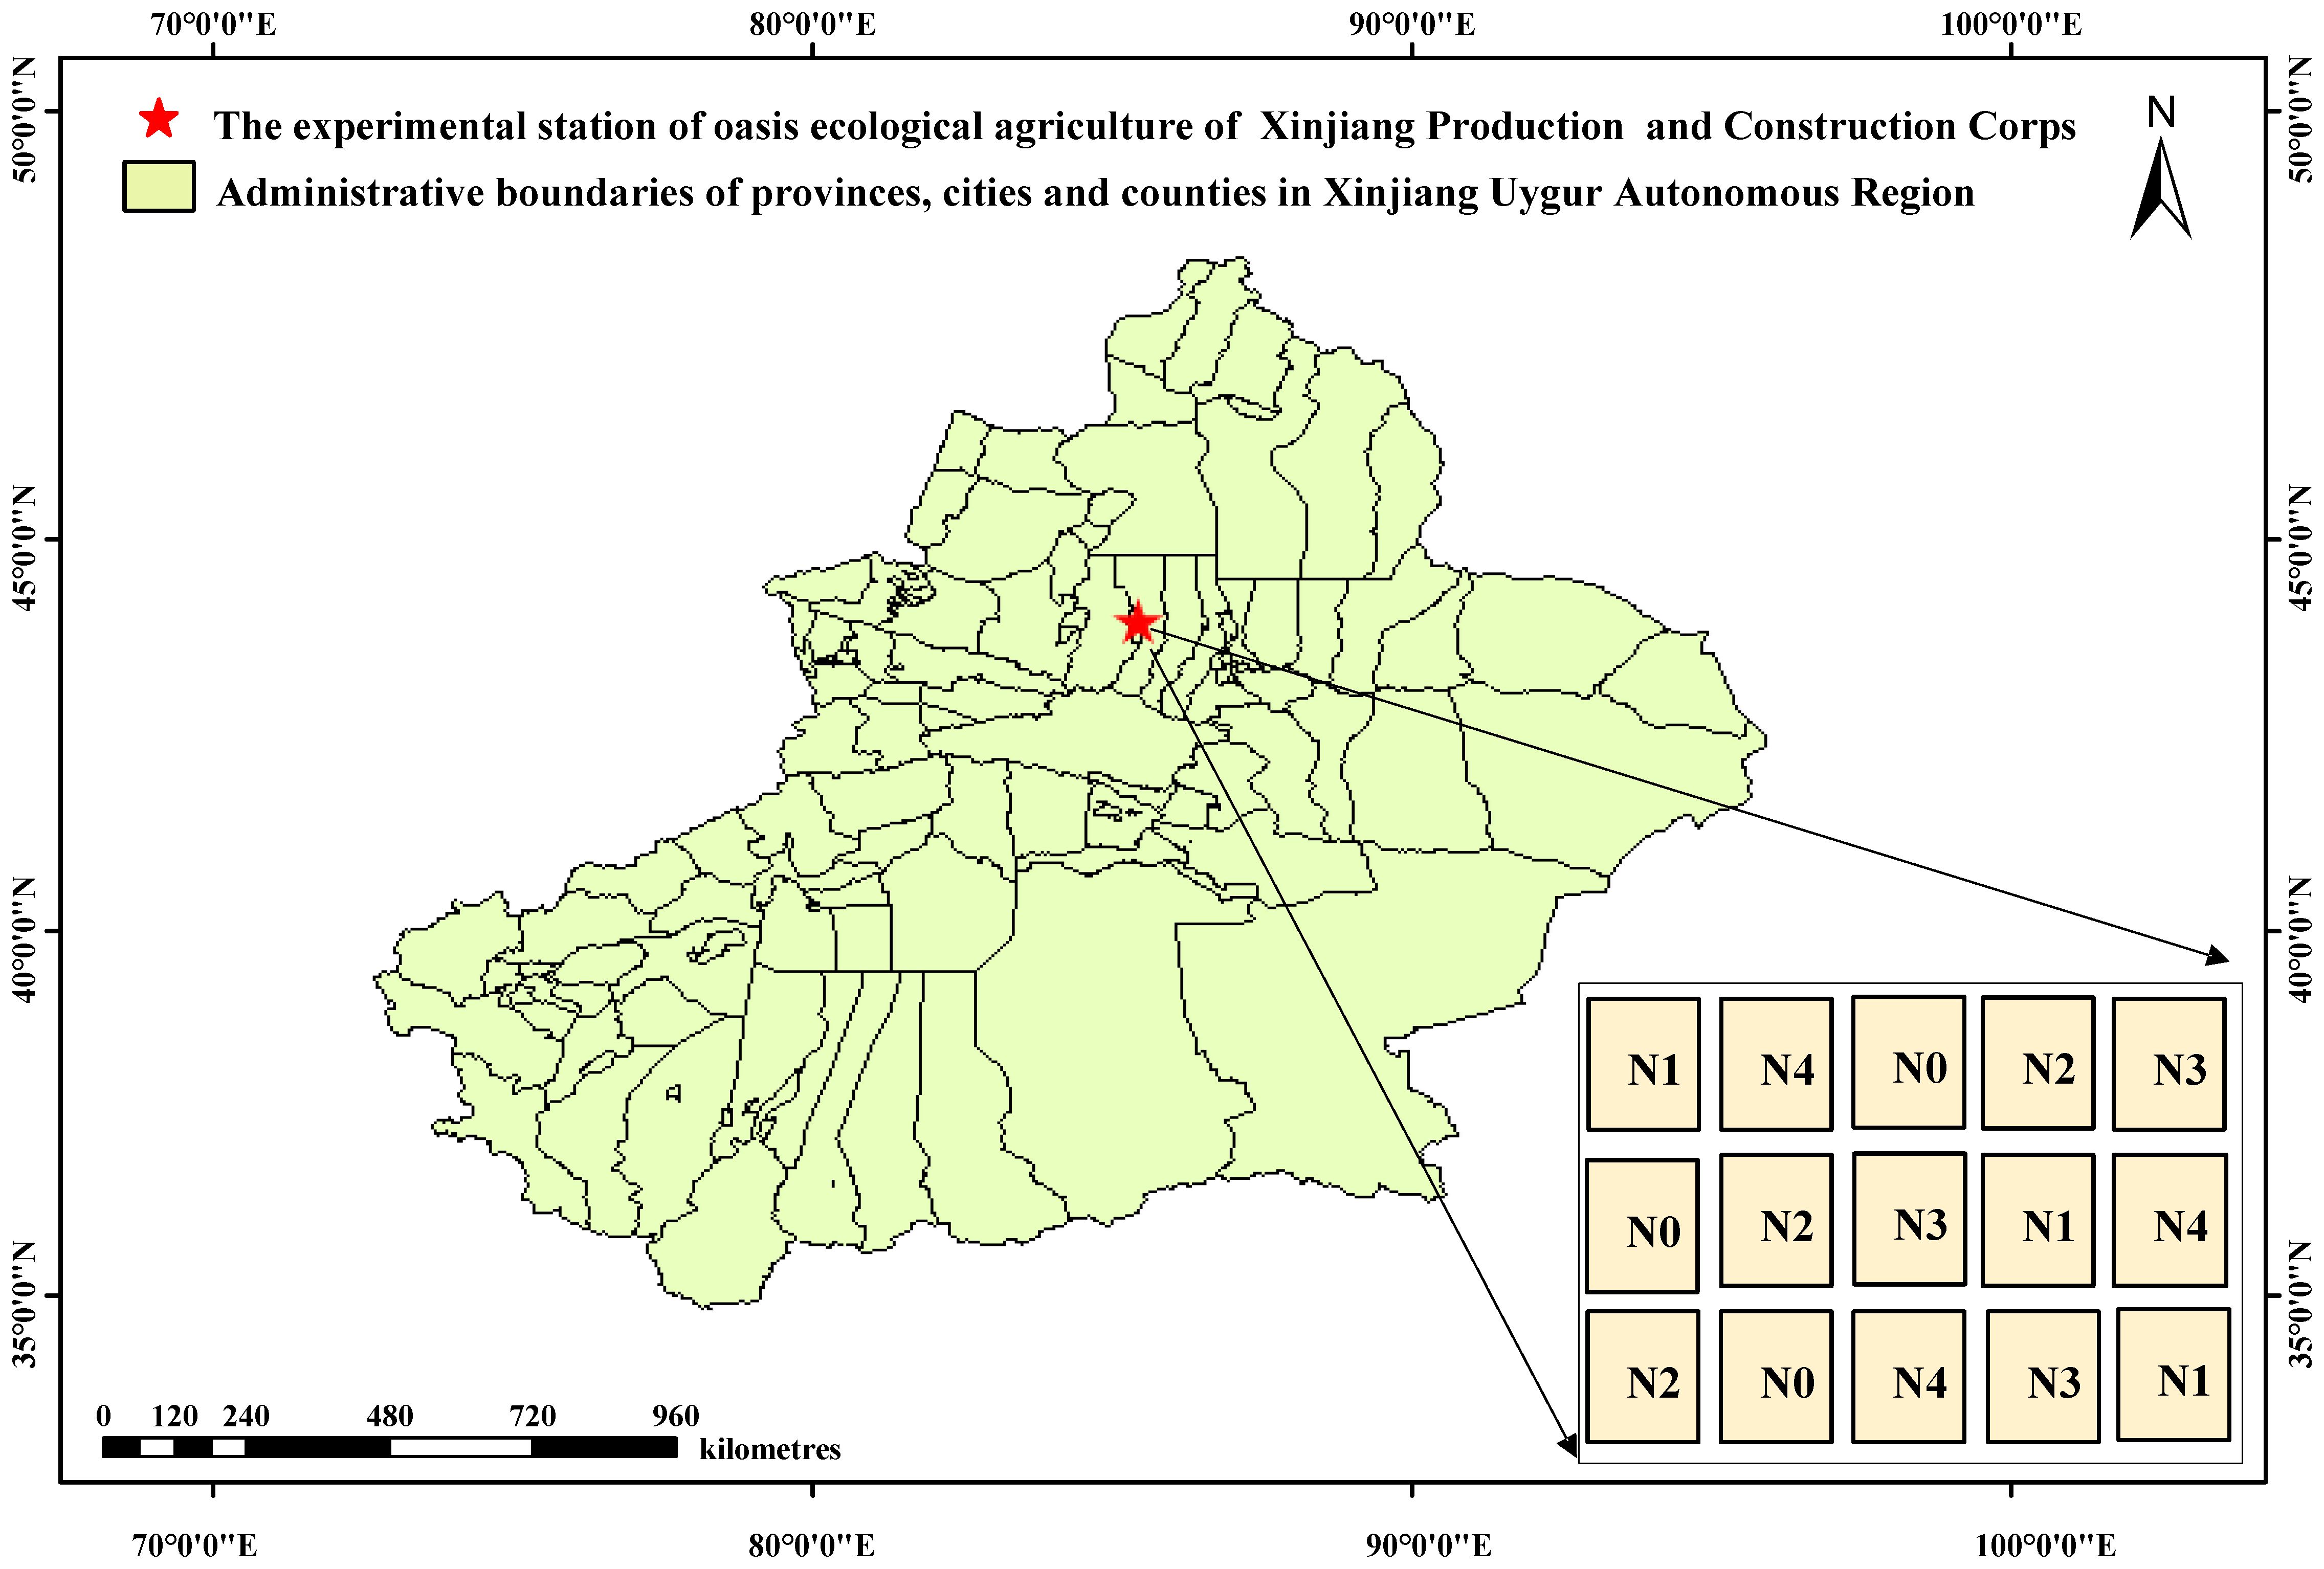
Figure 1 Location of test area and experimental design. N0, no nitrogen (N) fertilizer was applied; N1, N fertilizer application rate was 110 kg ha−1; N2, N fertilizer application rate was 220 kg ha−1; N3, N fertilizer application rate was 330 kg ha−1; N4, N fertilizer application rate was 440 kg ha−1.
In late April 2021, cotton seeds (variety Xinluzao 45) were sown, and drip irrigation and plastic film mulching were adopted [six rows and three irrigation tapes were under the mulching of one film (2.35 m in width)].
The randomized complete block design was adopted in this experiment, including five N treatments: 0 kg·ha−1 [N0 (CK)], 110 kg·ha−1 (N1), 220 kg·ha−1 (N2), 330 kg·ha−1 (N3, conventional application rate), and 440 kg·ha−1 (N4). Each treatment had three replicates (plots). Each plot was 70.5 m2 (7.05 m × 10 m), and the plot spacing was 4.7 m. Urea (N, 46%) of 345 kg·ha−1 and potassium dihydrogen phosphate (P2O5, 52%; K2O, 34%) of 240 kg·ha−1 were applied. The first fertilization was conducted on June 12, and fertilizers were applied every 8–9 days thereafter (nine times totally).
The canopy spectrum of cotton plants without pests and diseases were collected at 12:00–14:00 on sunny days at the budding stage (June 21), flowering stage (July 10), initial bolling stage (July 25), and full bolling stage (August 18) using an ASD-FieldSpec Pro FRTM spectrometer. During acquisition, the probe of the sensor was downward, the vertical height was 50 cm, the sensor angle was 25°, and the scanning time was 0.2 s. Three sampling points were selected in each plot, and spectral acquisition was performed five times for each point. Finally, the average was calculated, which was the spectrum of the sample point. Spectral acquisition were conducted eight times totally during the whole growth period, and a total of 360 data were obtained. Previous studies have shown that the spectrum at 1,800 nm–2,500 nm is greatly affected by soil background and air moisture (Chandrasekar et al., 2022). Therefore, in this study, only spectral changes at 350 nm–1,800 nm were analyzed.
After spectral acquisition, three cotton plants were selected from each plot. Then, leaves were separated, placed in a crisper box, and sent to the lab for LAI determination using a LI-3100 leaf area meter. Eight samplings were conducted during the whole growth period, and a total of 360 cotton plant samples were collected. The calculation method of LAI is shown in Equation 1:
where K0 is the representative of cotton leaf area in a plot, N is the cotton plant number of one plot, and K is plot area.
The VIs have been widely used to monitor vegetation information. Especially, VIs can distinguish non-vegetation information such as water bodies and enhance vegetation information ((Donovan et al., 2021; (Morsy et al., 2022). In this study, 20 VIs (Table 1) were selected for correlation analysis.
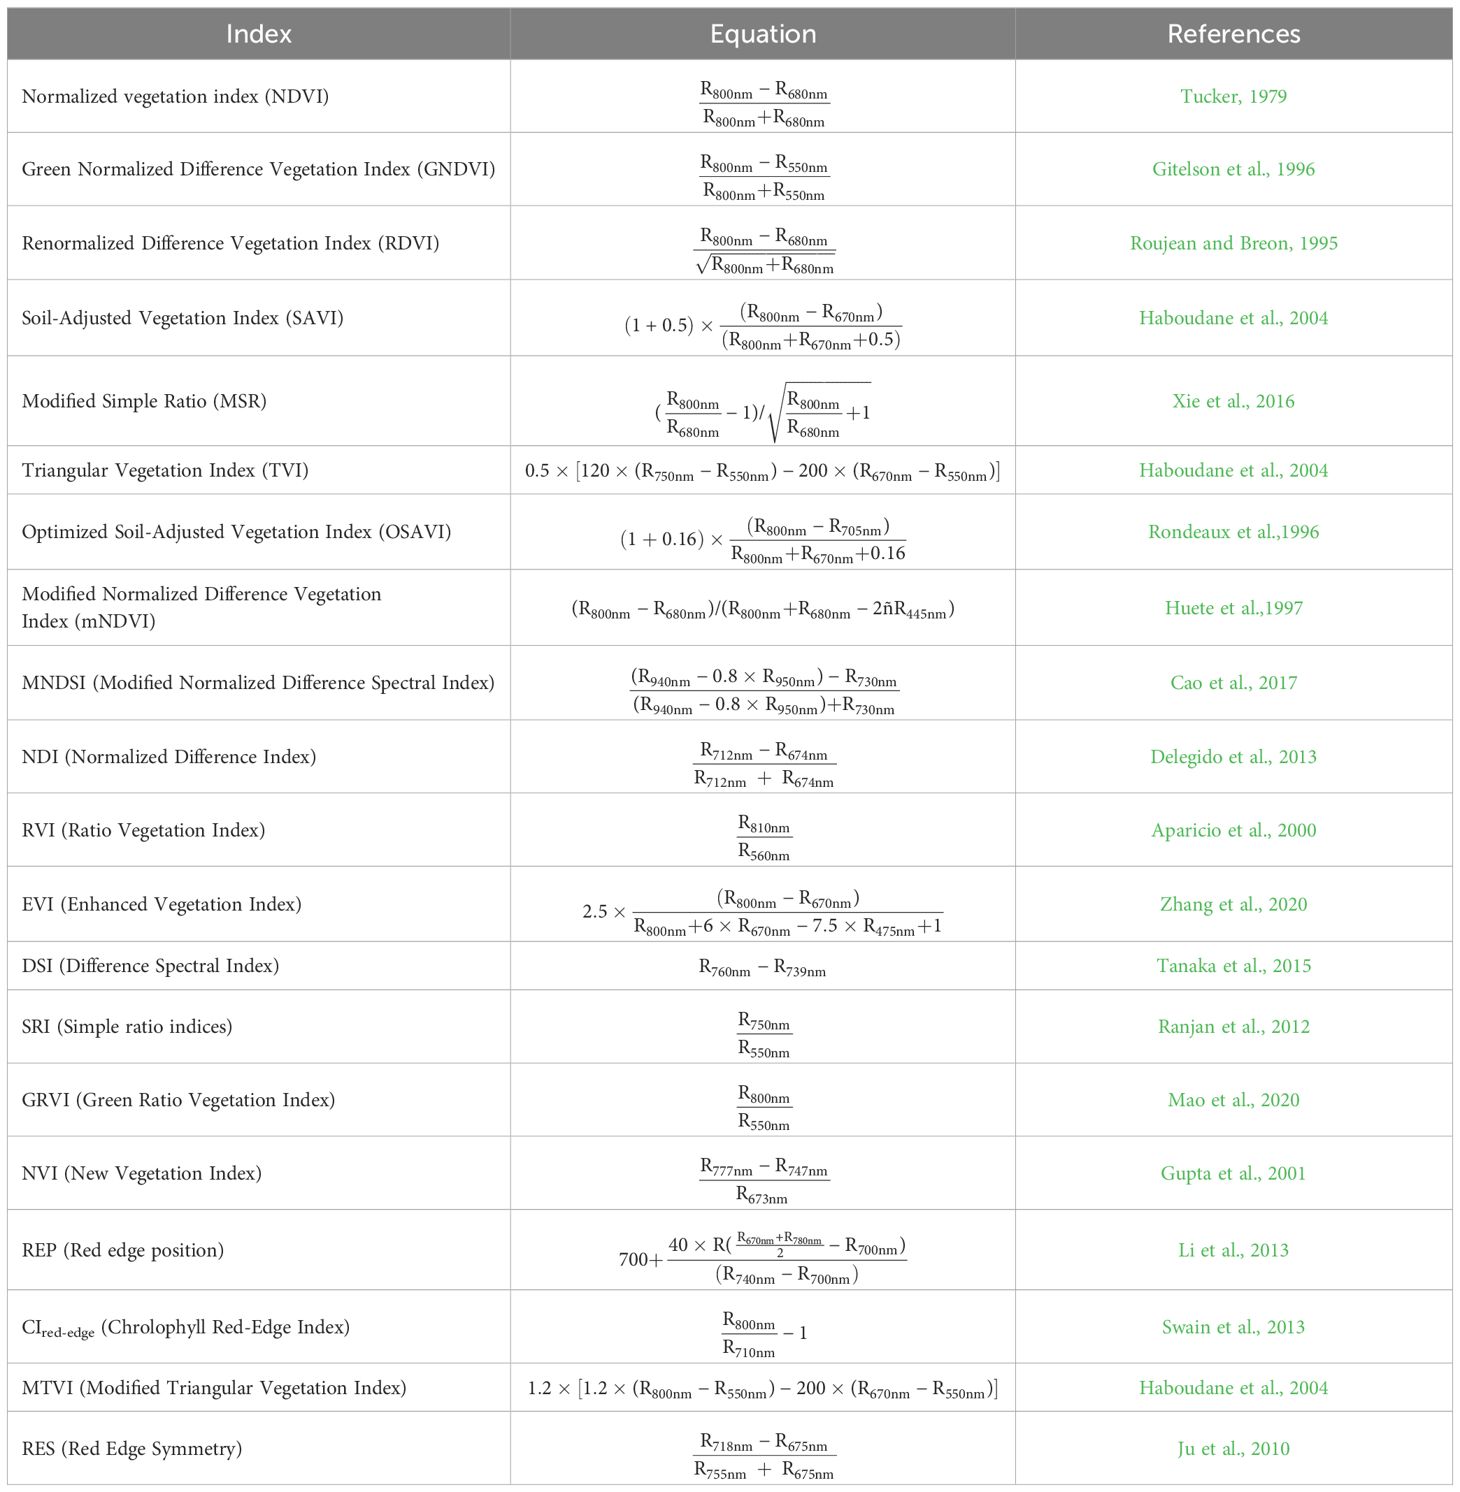
Table 1 Vegetation indices tested in this study.
To explore the interaction between VIs and the correlations between VIs and LAI, a correlation matrix between VIs and LAI was generated using Origin. Pearson correlation coefficient indicates the level of correlation (−1–1). The higher the absolute value, the closer the correlation (Bermudez-Edo et al., 2018).
In this study, the entire dataset (360) was randomly divided into a modeling set (300) and a validation set (60) (5: 1) to ensure the generality and stability of the model (Joseph, 2022). The results of statistical analysis of the entire dataset, the modeling set, and the validation set (Table 2) showed that the modeling set had a larger data range than the validation set and that the mean, minimum, maximum, standard deviation, and coefficient of variation of the modeling and validation sets were very similar. This indicates that the division of modeling and validation sets are very uniform, which is conducive to the accurate evaluation of model performance (Wu, 2023).
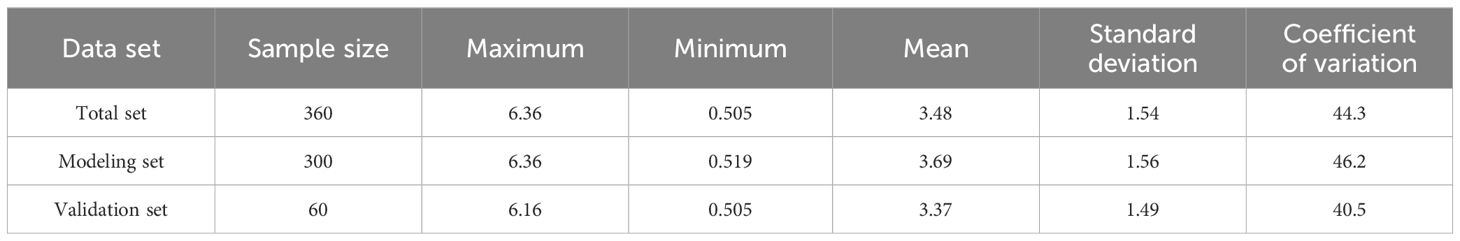
Table 2 Statistics of the modeling and validation sets.
Multiple VIs with high correlation with LAI were selected to construct ELM, RF, BP, MLR, and SVM models for LAI estimation using the Scikit-Learn package in Python. Then, the accuracy of the constructed models were compared, and the cross-validation was performed to select the optimal modeling method. Based on the optimal model, the 20 VIs (Table 1) were randomly arranged and fused, and the optimal fusion was selected. Figure 2 shows the specific workflow. In this study, the change trend of the spectral reflectance of cotton canopy and LAI during the whole growth period were first analyzed, and then, 20 VIs related to LAI were selected based on previous studies. After that, the correlations between LAI and VIs were analyzed, and the VIs with a correlation coefficient with LAI of no less than 0.6 (Meng et al., 2021) and a correlation coefficient with other VIs of less than 0.9 were selected (Pasternak and Pawluszek-Filipiak, 2022). Then, the LAI estimation models based on machine learning (ELM, RF, BP, MLR, and SVM) were constructed and compared to select the optimal model. Finally, the VIs participating in the modeling were randomly arranged and fused (i.e., for index 1, 2, and 3, there were seven fusions including 1, 2, 3, 1 + 2, 1 + 3, 2 + 3, and 1 + 2 + 3), and the model was verified to select the best vegetation index fusion model.
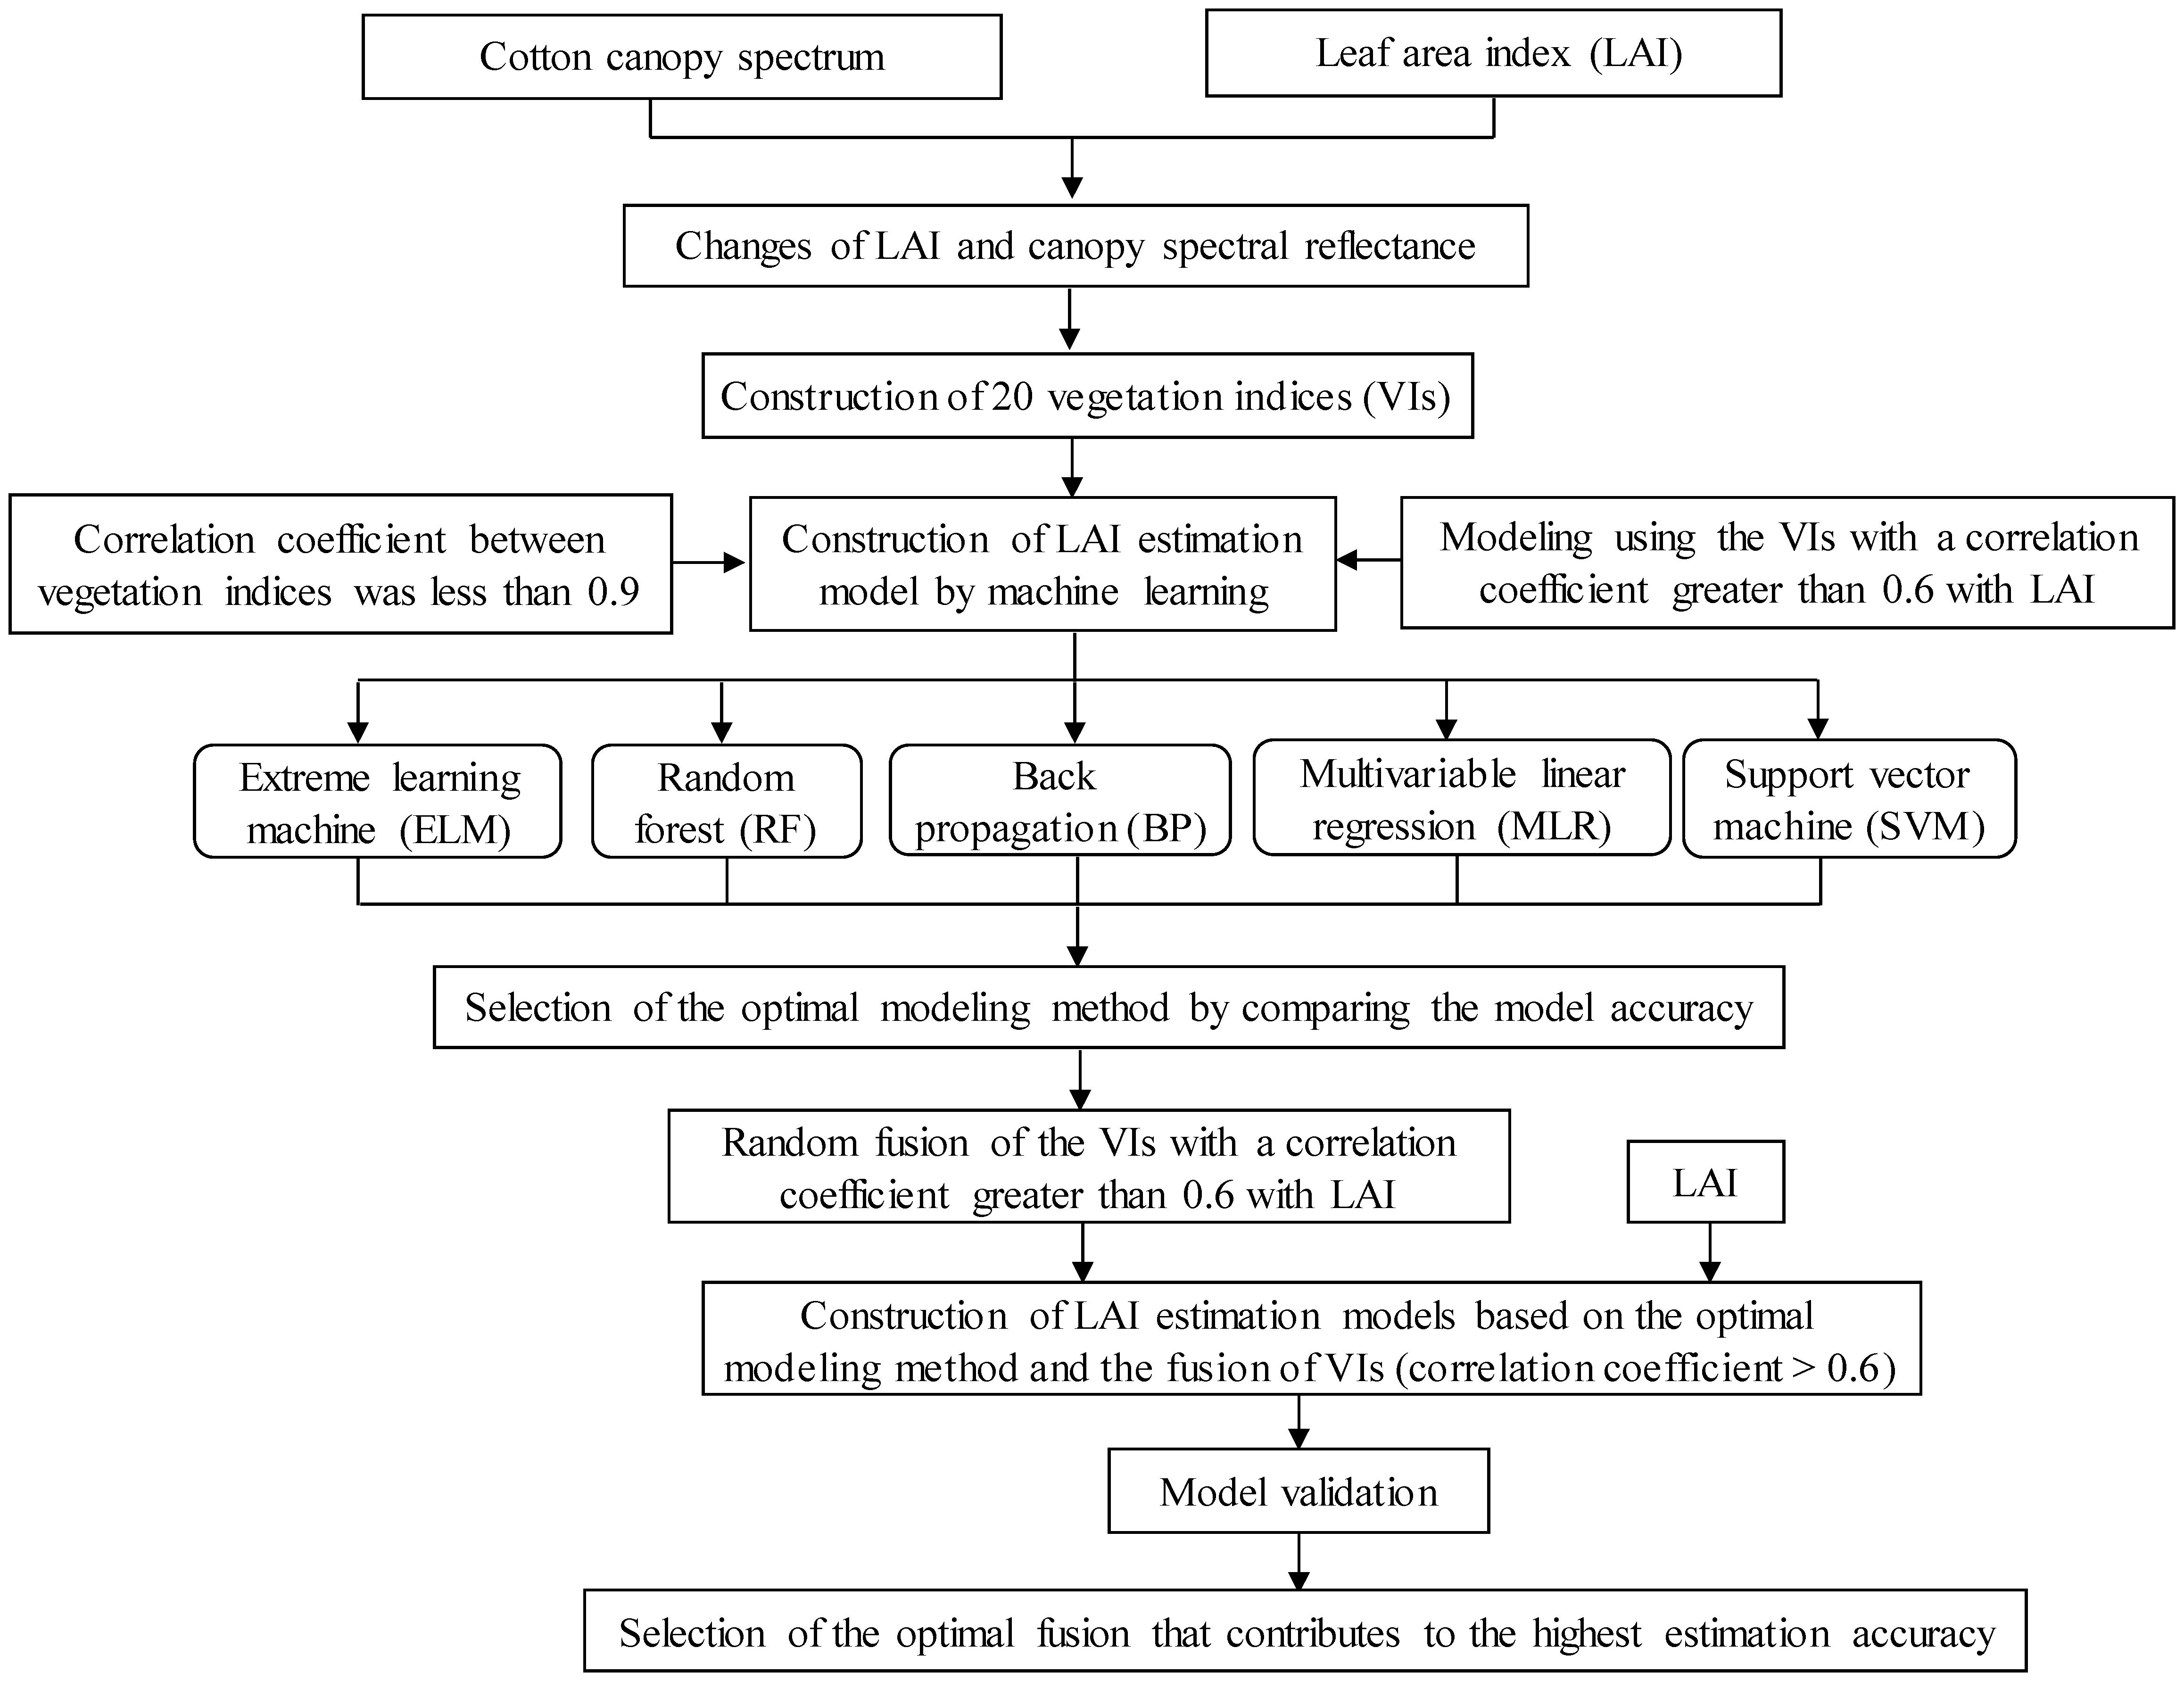
Figure 2 Flowchart of modeling.
ELM is an algorithm based on the SLFN. It is characterized by random generation of connection weights between input and hidden layers and thresholds of hidden layer neurons. No special operation is required in training, and the only value is the hidden layer neuron number. The global optimal solution is obtained after completing training (Sun and Gao, 2022).
Given N samples (xi, yi) (i ≤ N, and ), xiis the input, yi is the output (expected value). Then, an SLFN with L hidden layer nodes can be obtained by following Equation (2):
where is the output weight matrix for hidden nodes and output nodes, f(x) is the activation function, wi and xj are inner products, and oj is the value of the output.
RF is a learning algorithm integrating multiple CART decision trees. The decision tree model is constructed by randomly selecting multiple samples from the raw samples by bootstrap resampling. There are two key parameters involved in the RF modeling: mtry and ntree. mtry is the number of node splits each time the decision tree model is reconstructed. ntree is the number of decision trees. Through voting on the output of each decision tree, classification can be achieved (Liu et al., 2021b). In regression prediction, the predicted value is the average of the outputs of all trees as shown in Equation (3).
where h(x) is the predicted value, θi is an independently distributed random vector that determines the growth of the decision tree, x is the input matrix, h(x, θi) is the output of the ith regression tree, and k is the number of regression trees.
BP neural network has a good performance in nonlinear fitting and is widely used in classification and regression. In BP neural network modeling, prior assumption is not required. The ReLu function is used as the activation function by the hidden layer, and the number is 1. The linear function and Adam are used as the activation function and the optimizer, respectively, by the output layer. The node number is determined according to Jiang et al. (2021), and the number of nodes of the output layer and hidden layer is determined by an iterative loop. In this study, the iterations were 100, 500, and 1,000. In addition, the learning rates were 0.01, 0.001, and 0.0001.
SVM has been widely used in crop inversion research for its high accuracy and generalization ability for small sample data (Hosseini et al., 2021). It can map the nonlinear separable data to the kernel function-created high-dimensional feature space, and construct a linear classification equivalent to a nonlinear classification in the input space. In this study, kernel function, kernel coefficient (γ), and regularized coefficient (C) were {poly, RBF, sigmoid}, 10−8–108, and 10−8–108, respectively.
MLR predicts dependent variables through regression by the optimal combination of multiple independent variables. Multiple linear fitting can predict the relationship between multiple types of known independent variables and their corresponding single dependent variables (Meerasri and Sothornvit, 2022). The expression of MLR is as follows (Equation 4):
It can be shortened to the following matrix (Equation 5):
where y is the dependent variable (LAI), x is the independent variable (vegetation indices), and w is the coefficient of the independent variable.
In this study, the R2, RMSE, nRMSE, and MAE were used to assess the model accuracy. The larger the R2, the better the model fit; the smaller the RMSE, nRMSE, and MAE, the higher the model accuracy. The calculation of R2, RMSE, nRMSE, and MAE was based on the research of Wang et al. (2022) and Jiang et al. (2023).
Cotton LAI increased first and then reduced (Figure 3), and the influence of different N treatments on cotton LAI was great throughout the entire growth period. The more N was applied, the greater was the LAI. The dynamics of cotton LAI in different treatments were similar throughout the entire growth period. The changes of LAI in different treatments were small at the beginning. Then, the LAI increased, and the difference in LAI between different treatments also increased. The LAI peaked in the late flowering stage and then declined.
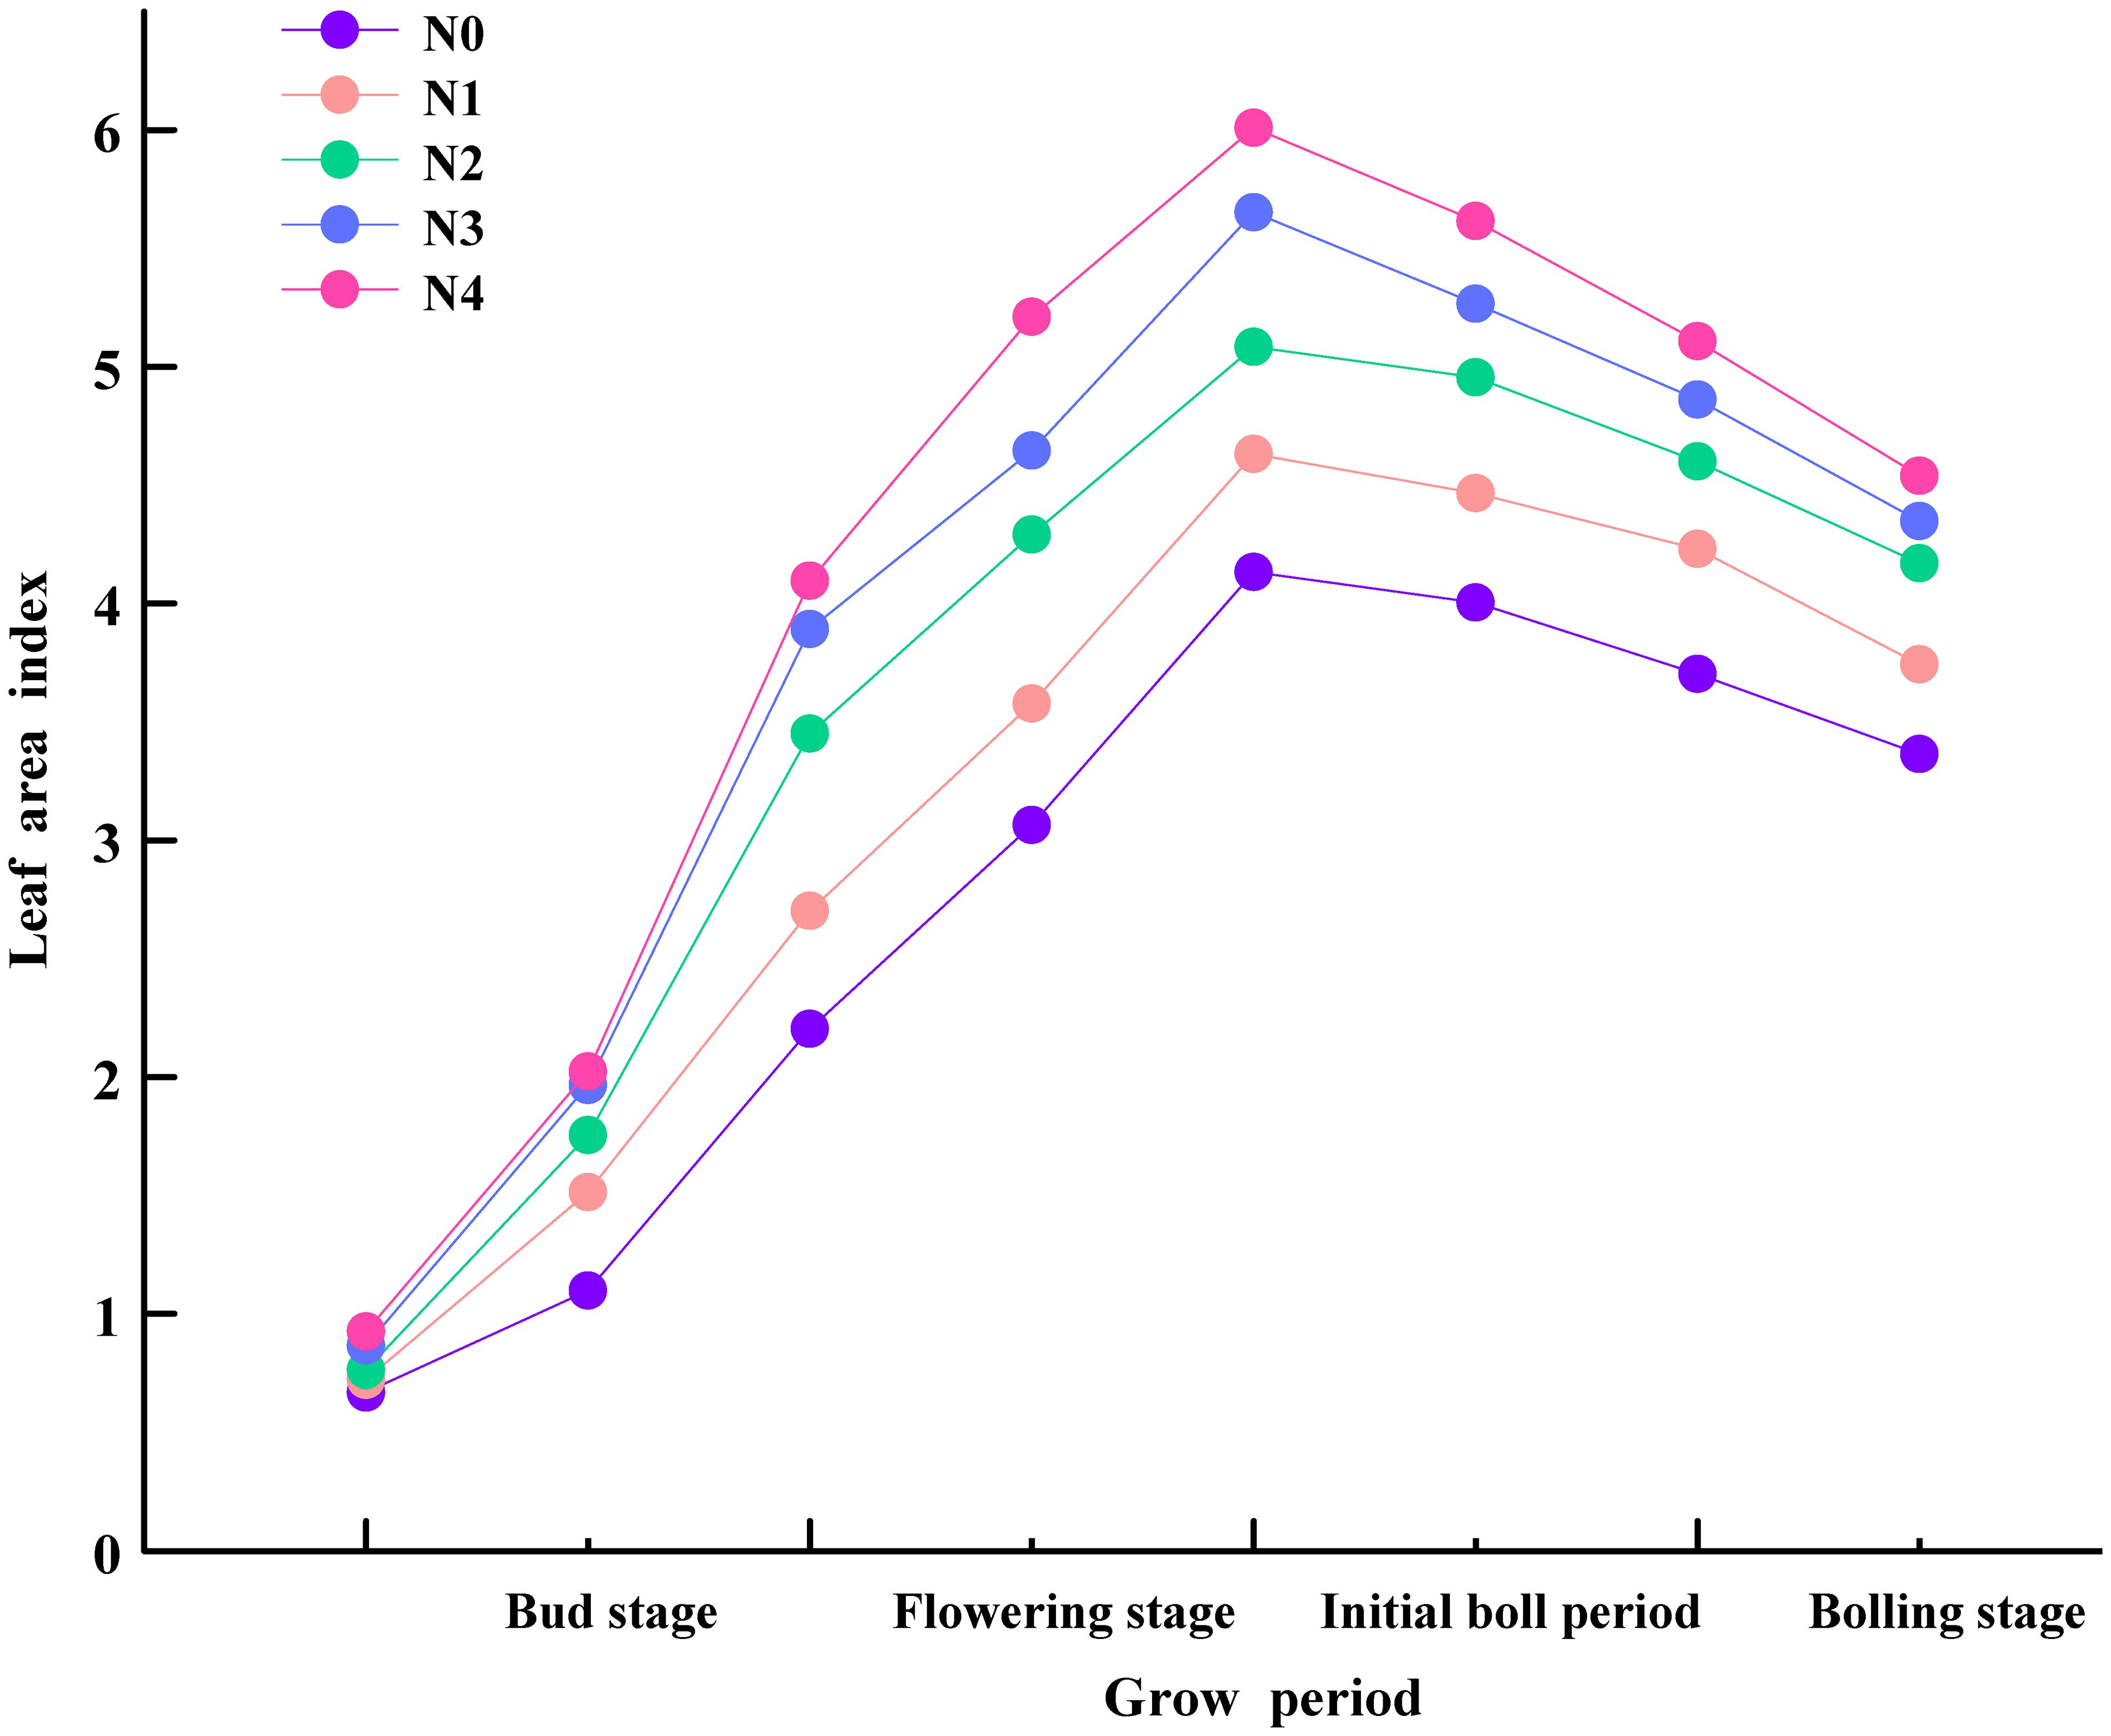
Figure 3 Cotton leaf area index (LAI) variations under N treatments.
The spectral reflectance changed consistently in different treatments (Figure 4). In the visible region, there was little difference. With the growth of N dose, the spectral reflectance declined (N0 > N1 > N2 > N3 > N4). In addition, the reflectance varied obviously among stages in the NIR region.
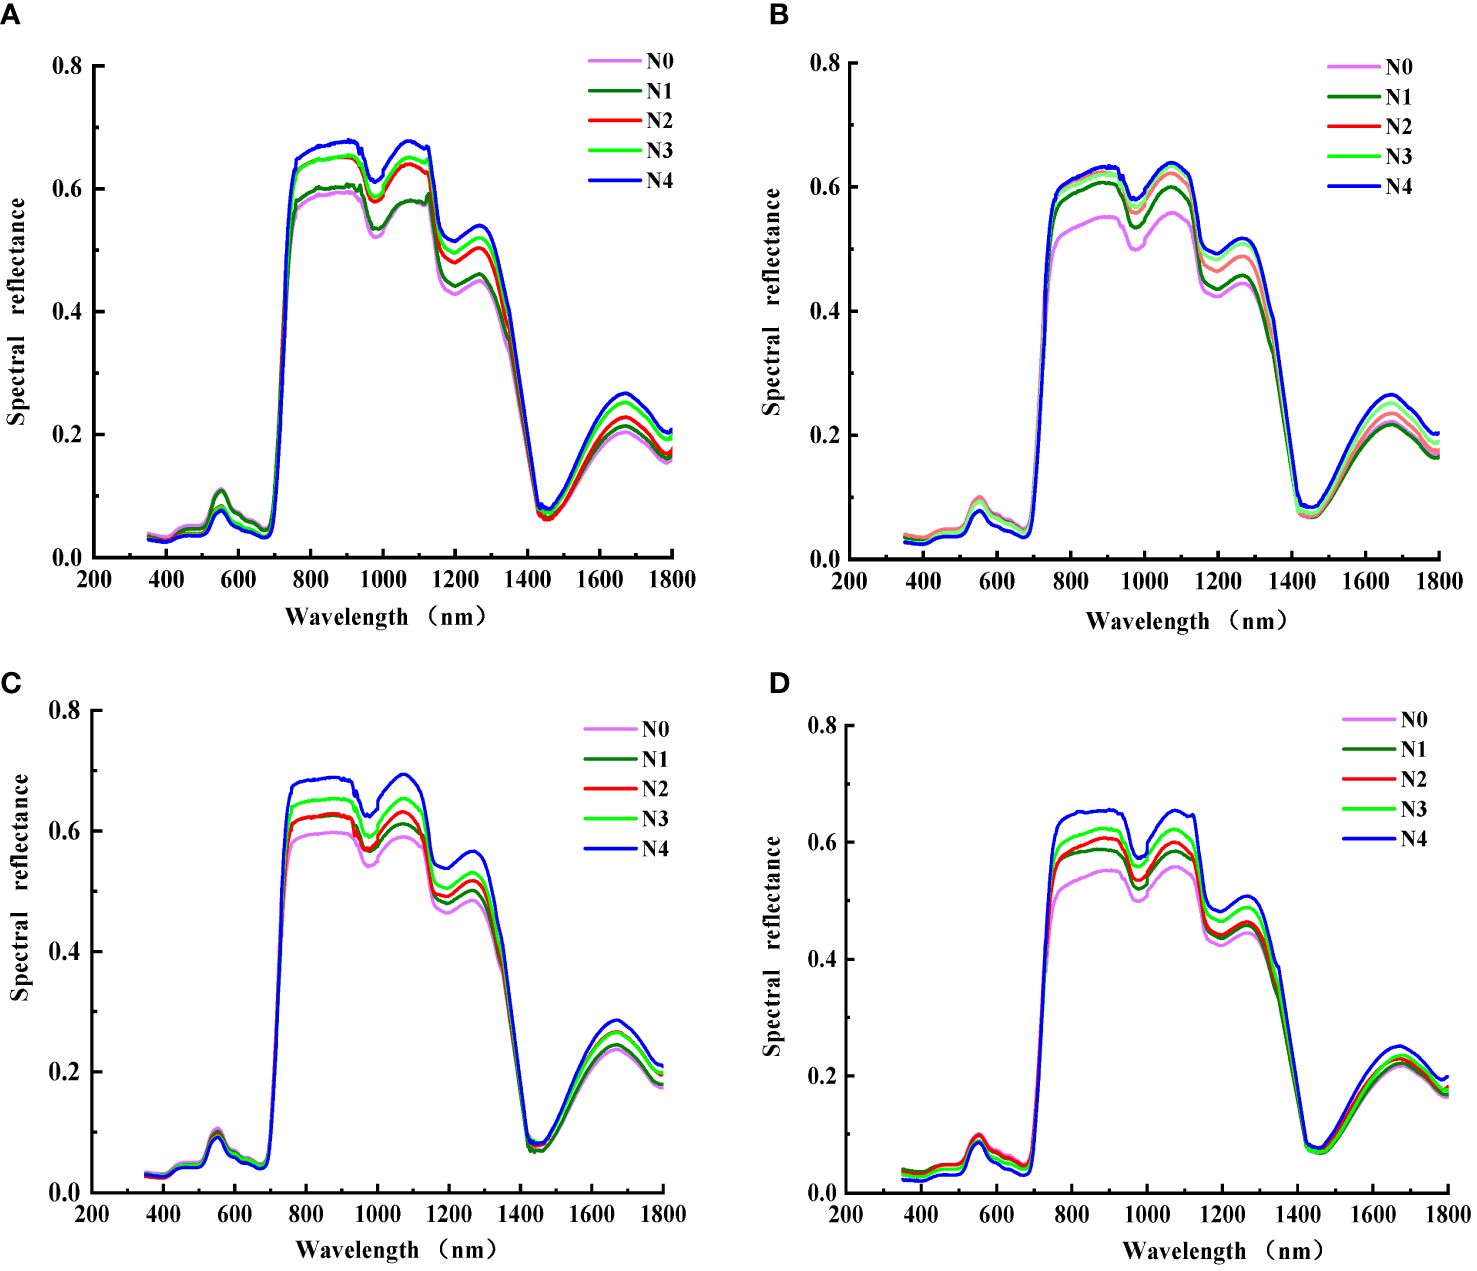
Figure 4 Cotton canopy spectral reflectance under N treatments [(A) budding stage; (B) flowering stage; (C) initial bolling stage; (D) full bolling stage].
In the bud stage, the reflectance of the N0 and N1 treatments were low (N0< N1) and that of the N2, N3, and N4 treatments were high (N4 > N3 > N2) in the NIR region. In addition, there was a significant difference in the reflectance between different treatments throughout the entire growth period. The reflectance increased with the increase in N dose (N4 > N3 > N2 > N1 > N0).
The coefficients of correlation between VIs and LAI were 0.14–0.67 (Figure 5). LAI had a negative correlation with MTVI and RES and a positive correlation with other VIs. Among them, MNDSI had the highest correlation with LAI (0.67), and TVI had the lowest correlation with LAI (0.14). The correlation between VIs varied greatly. The correlation between SAVI and MTVI was the lowest (0.033), while that between EVI and RDVI and between RES and REP were the highest (0.98). In addition, RES had a positive correlation with MTVI, but a negative correlation with other VIs. MTVI had a positive correlation with RDVI, SAVI, TVI, and EVA, and a negative correlation with other VIs.

Figure 5 Correlation analysis between vegetation indices and LAI. The ellipse tilted to the left and colored red represents a positive correlation, and the ellipse tilted to the right and colored blue represents a negative correlation.
The 20 VIs were used to construct cotton LAI prediction models based on a single VI (Table 3), and it was found that the accuracy of the models were generally low. To further explore the advantages of multi-VIs fusion and the performance of the constructed models, considering the multicollinearity between VIs and the overfitting of the model, this study selected the VIs with a correlation coefficient with LAI of not less than 0.6 and a correlation coefficient with other VIs of less than 0.9 (results of Section 3.3) for modeling (Table 4), including: GNDVI, MSR, MNDSI, RVI, SRI, GRVI, NVI, REP, and CIred-edge. The comparison of the ELM, RF, BP, LR, and SVM modeling showed that the RF models had the highest accuracy, with R2, MAE, RMSE, and NRMSE being 0.87, 0.37, 0.57, and 0.16, respectively, followed by the ELM, BP, and LR models. SVM models had the lowest accuracy, with R2, MAE, RMSE, and NRMSE being 0.51, 0.84, 1.11, and 0.32, respectively.
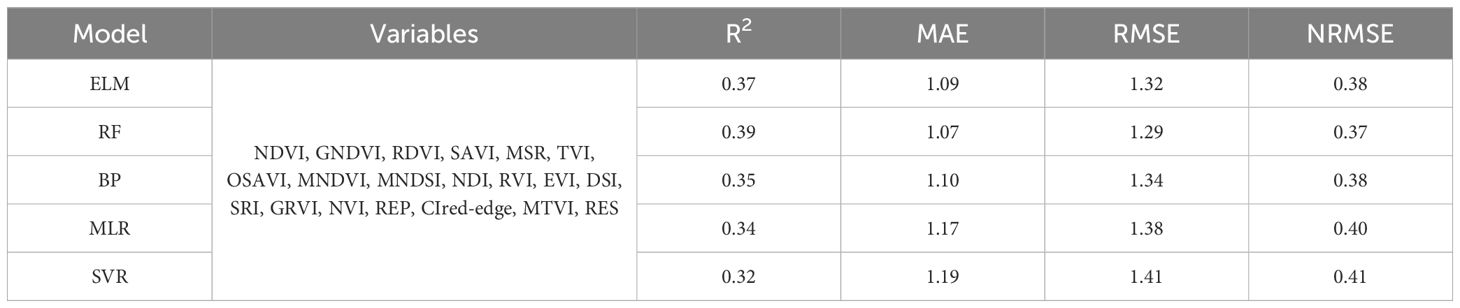
Table 3 Accuracy of cotton LAI estimation models constructed based on different modeling methods and 20 VIs.
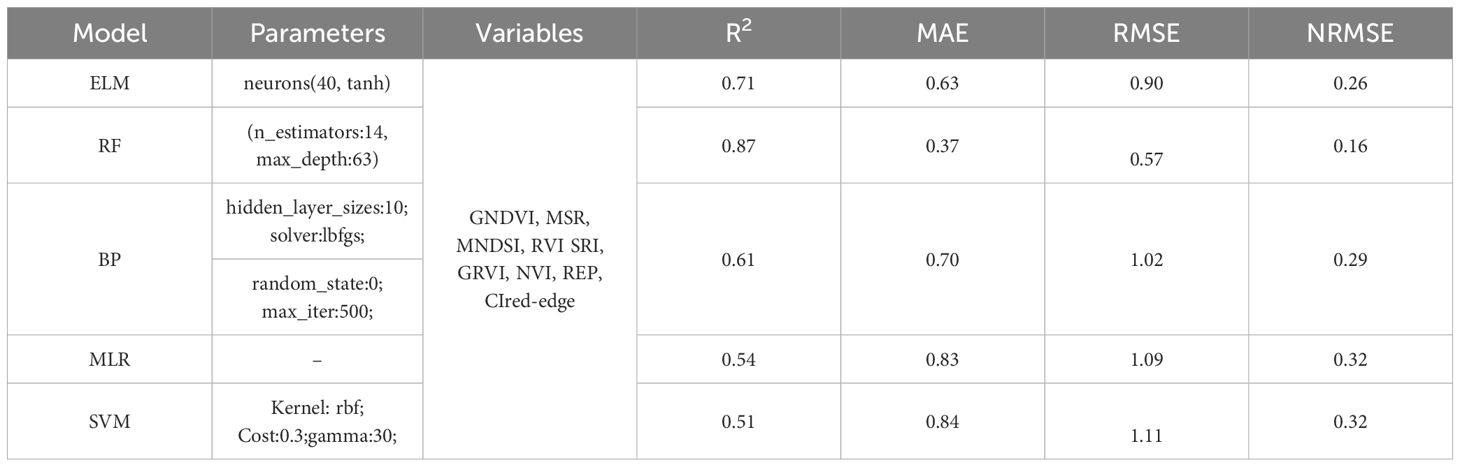
Table 4 Accuracy of cotton LAI estimation models constructed based on the vegetation indices with a correlation coefficient of not less than 0.6 with leaf area index.
The selected nine VIs were randomly arranged and fused. When there were 1, 2, 3, 4, 5, 6, 7, 8, and 9 VIs for fusion, 1, 15, 15, 15, 15, 15, 15, 9, and 1 combinations were randomly selected, respectively. Only the optimal fusions under different number of VIs are shown here. It was found that the RF model had the highest accuracy when MNDSI, SRI, GRVI, REP, CIred-edge, MSR, and NVI were fused (Table 5). The RF-7 model had the highest R2 (0.90) and the smallest RMSE (0.50), NRMSE (0.14), and MAE (0.26). The accuracy of the models built by a single VI was the lowest, with R2, MAE, RMSE, and NRMSE being 0.63, 0.82, 1.03, and 0.30, respectively.
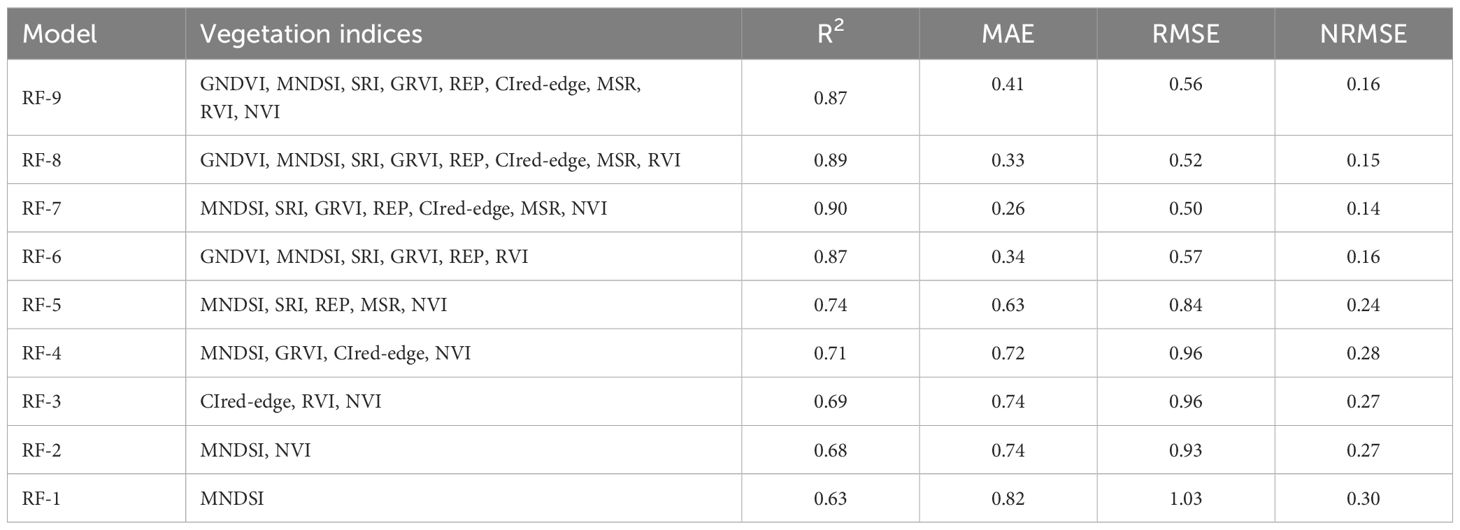
Table 5 Accuracy of the optimal RF models for cotton LAI estimation when different vegetation indices are fused.
The results of linear fitting of predicted LAI by RF models (Table 5) and measured LAI (Figure 6) showed that the slope of the fitted line of measured LAI and RF-7 was closest to 1, and the slope of the fitted lines of measured LAI and single VIs was the lowest (Figure 6A). When 1, 2, 3, 4, 5, 6, and 7 VIs were fused (Figures 6A–G), the model accuracy increased with the increase in the number of VIs fused, but the accuracy decreased when 8 and 9 VIs were fused (Figures 6H, I). The slopes of all curves were less than 1, indicating that there was no over-fitting.
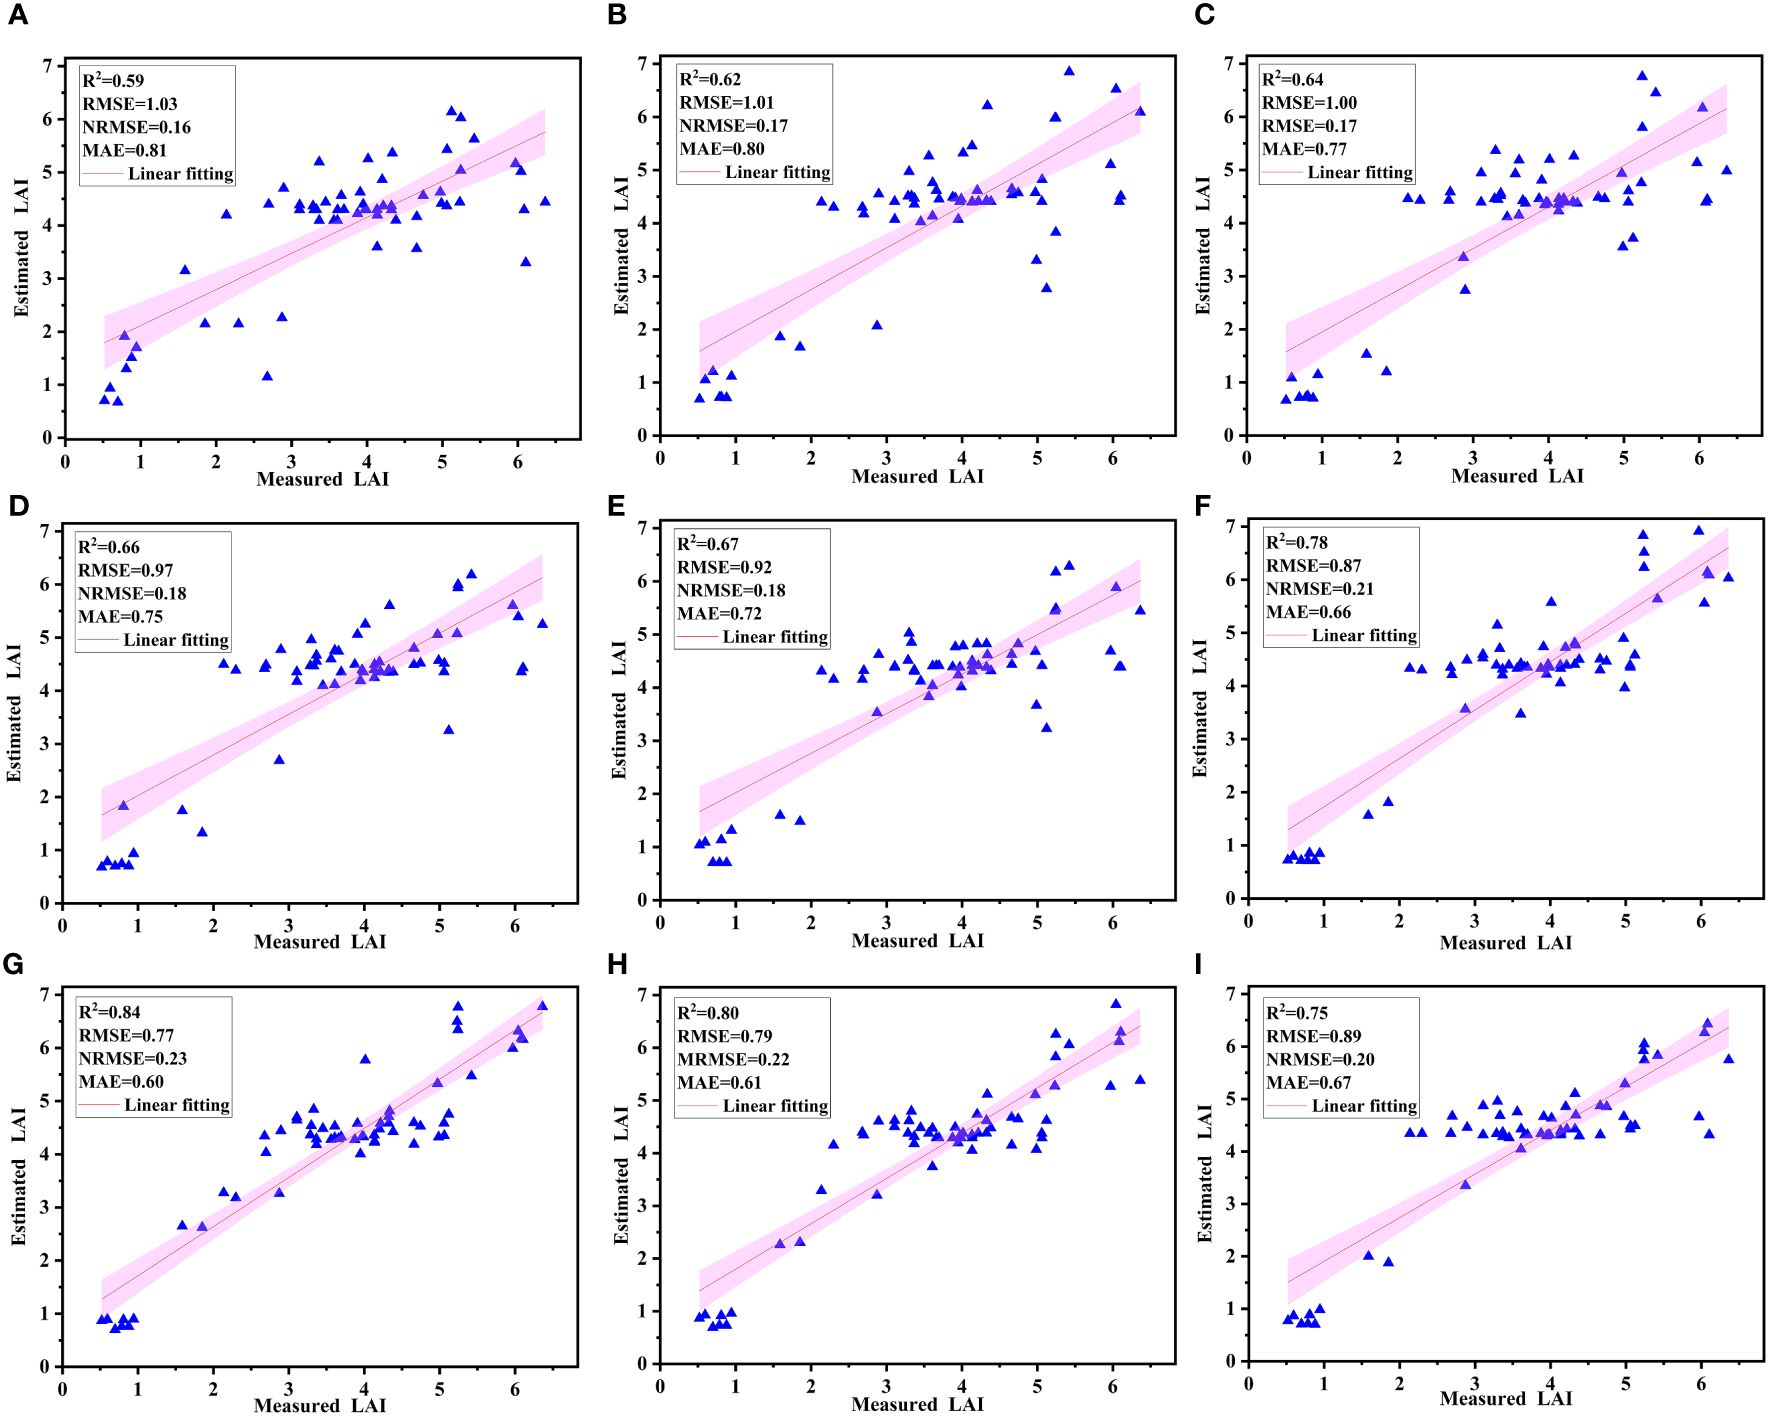
Figure 6 Fitting results of the measured and the RF model predicted LAI based on validation set (A–I) represent the optimal fusions when one to nine VIs were fused).
Leaf area index reflects the energy flow and material cycle in plant canopy and is closely related to crop yield. Therefore, it is commonly used in the study of photosynthesis, respiration, and carbon accumulation of vegetation (Lu et al., 2020; Sun et al., 2023). In this study, the cotton LAI under different N treatments showed an unimodal variation trend. This reflects that N has an obvious regulatory effect on cotton LAI, which is related to the growth characteristics of cotton at different stages (Ninkuu et al., 2023). From bud to flowering stage, due to the increase in cotton branches and leaves, the cotton leaf area continues to increase, resulting in a rapid increase in LAI, and the difference in LAI between N treatments also increases. This is similar to the results of Wen (2016). Nitrogen is the main nutrient required for cotton growth, and sufficient N supply could promote leaf enlargement. The bud stage is a key period for cotton vegetative growth. With the increase in temperature, cotton growth accelerates. This ultimately leads to increased LAI. During the flowering stage, cotton enters into the reproductive growth stage, and a large amount of organic matter is transferred to reproductive organs. In the late flowering stage, LAI is the largest, and then, LAI gradually declines in the bolling stage. However, Kumar et al. (2022) found that LAI began to decrease after the boll-opening stage. On the one hand, it may be caused by the different temperature, sunshine time, and rainfall in different regions (high temperature and long sunshine time can accelerate cotton growth, but rainfall slows down cotton growth). On the other hand, the increasing competition between vegetative and reproductive growth in the flowering and bud stages leads to leaf shedding and decreased LAI (Li, 2022). Especially, in this study, the LAI declined fastest in the N4 treatment. High N dose leads to too vigorous vegetative growth. The lower leaves block each other, leading to poor ventilation and early leaf aging and shedding. In addition, in our previous report (Fan et al., 2023), the LAI of cotton changed most significantly under the N3 treatment, while the LAI changed the most under N4 treatment in this study. This may be due to the fact that the N4 in this study was 440 kg N ha−1. However, in previous study, the N3 was 360 kg N ha−1 and the N4 was 480 kg N ha−1. Although the N application rate N4 is the largest in this study, it is lower than that in previous study. This indicates that the demand for N fertilizer in cotton is limited, and it is not that the more nitrogen is fertilized, the greater the LAI.
The uptake, transport, and assimilation of N show dynamic changes in cotton leaves, and the nutrient composition and content in leaves also change continuously, resulting in changes in leaf color, morphology, and spectral reflectance (Sun et al., 2022). In the visible region, there was no significant difference in canopy spectral reflectance at different stages, and the reflectance decreased with the growth of N dose. In the NIR region, the difference increased, and the reflectance increased with the growth of N dose. This is consistent with the results of Liu et al. (2019). However, in our previous study (Fan et al., 2023), the canopy spectral reflectance reached the maximum under N3 treatment. In this study, the canopy spectral reflectance was the largest under N4 treatment. This may be due to the fact that although the N4 in this study is the largest, it is still lower than the N4 in the previous study. Excessive or small nitrogen fertilizer application can lead to a decrease in LAI, thereby reducing the canopy spectral reflectance.
The spectral reflectance of visible region mainly reflects leaf pigment status. In crop photosynthesis, chlorophyll reflects green light and absorbs red and violet light, resulting in low canopy spectral reflectance (Li et al., 2019; Yang et al., 2022). The reflectance in the NIR region is mainly affected by optical properties and leaf structure. In addition, the differences in intercellular space, composition, and shape are also influencing factors (Richetti et al., 2019; Spafford et al., 2021). Thus, the reflectance of the NIR region gradually reduces over time.
Vegetation index can provide crop growth information. At present, a large number of remote sensing studies of cotton LAI based on a single vegetation index have been carried out (Yan et al., 2022). In this study, the correlation analysis of LAI and VIs was carried out. It was found that MNDSI had the highest correlation with LAI. This is consistent with the results of Gao et al. (2013). MNDSI can better reflect the status of cotton LAI. The spectral bands in MNDSI has a strong absorption on the spectra of cotton LAI (Li et al., 2018). Therefore, future studies can try to accurately predict cotton LAI changes through this index. In this study, the correlations between some VIs were very high, with a correlation coefficient of 0.98 (EVI and RDVI, RES and REP). This may be due to the fact that these VIs contain the same spectral bands, resulting in very high multicollinearity between the VIs, so it is necessary to filter the VIs before fusion.
It was found that the ML models based on 20 VIs had a low accuracy. This may be due to the high correlations between some VIs. Therefore, the VIs with a correlation coefficient not less than 0.6 were selected for modeling. It was found that this improved the prediction accuracy of all models (ELM, RF, BP, MLR, and SVM). This indicates that LAI has its unique spectral features and corresponding VIs. Among the models, the RF models had the highest accuracy. This is consistent with the results of Han et al. (2019) and Wang et al. (2021). RF is a tree-based ensemble learning. It higher accuracy in this study may be due to that the data are trained using randomly selected subsets at each node, and the best performing prediction variables are selected to split nodes (insensitive to noise), which can effectively solve problems such as overfitting and collinearity (Lu and He, 2019).
In this study, multiple VIs were randomly arranged and fused, and the optimal fusion was selected for RF modeling. It was found that the model accuracy constructed using VI fusion was higher than that of the model constructed using a single VI. This is similar to the results of Qi et al. (2020) and Rumora et al. (2021). This may be due to that each VI is a physical structure and has limited valid bands (only two to three bands). It was also found that the model accuracy based on the fusion of seven VIs (RF-7) had the highest accuracy. This indicates that the fusion of the seven VIs synthesizes the structural characteristics of each VI and contains more reflectance information, which ultimately improves the LAI prediction accuracy. However, when eight and nine VIs were fused, the model accuracy began to decrease. This may be due to that (1) different VIs have different sensitivities to the same parameter; the model accuracy increases when the highly sensitive VIs are fused for modeling, and vice versa. (2) The influences of canopy structure, cover, and soil background brightness on different VIs are also different (Qiao et al., 2022). (3) There is data redundancy between VIs, which affects the model accuracy. Therefore, appropriate VI fusion can eliminate the influence of environmental factors, realize the complementarity of spectral features, and increase vegetation information, which ultimately improves model accuracy and stability.
In addition, hyperspectral data are more informative than VIs. It is widely used in different remote sensing analysis and feature classification tasks because hyperspectral data covers a wide range of bands and contains all the spectral information of features. However, it faces the problem of information redundancy, which increases the complexity of data processing and analysis, and may reduce the interpretability of the model (Jiang et al., 2022). In addition, sensitive wavelengths are more susceptible to interference from non-target factors, such as soil background and light conditions (Meiyan et al., 2023). In contrast, the VI is usually based on the combination of specific wavelengths, which can effectively eliminate the interference of soil signals and other factors, and is specially used for the monitoring of vegetation parameters. It is well targeted and has a high interpretability for vegetation-related research (Cao et al., 2021).
At present, the vegetation canopy spectral acquisition instruments mainly include hyperspectral sensors and multispectral (RGB) sensors. The wide spectral range of hyperspectra, including visible light and near-infrared spectra, provides rich spectral information, which enables hyperspectral data to capture detailed spectral characteristics of features (Liu et al., 2023a), such as spectral reflectance, absorption peaks, and absorption valleys. These detailed spectral features make hyperspectral data have higher performance and application potential in object detection. However, the number of RGB bands is small and contains less information (Liu et al., 2022a), making it difficult to fully reflect the changes in the spectral features of vegetation parameters. Nevertheless, due to the processing complexity and high cost of hyperspectral data, RGB still has certain advantages in some scenarios, especially in vegetation monitoring and simple object classification tasks. For example, Liu et al. (2022b) improved the estimation accuracy of potato aboveground biomass (AGB) by extracting different texture features from RGB images.
In recent years, many scholars have preprocessed hyperspectral data and achieved good estimation results. For example, Liu et al. (2022c) used the Savitzky-Golay (SG) smoothing to smooth the spectrum collected by unmanned aerial vehicles (UAVs) and the random forest to extract the characteristic bands, and found that the PLSR model had the highest estimation accuracy for AGB. Liu et al. (2023b) extracted spectral features from UAV-collected RGB images and hyperspectral data through wavelet transform and found that the fusion of the features of RGB images and hyperspectral data could improve the estimation accuracy of AGB. Since hyperspectra can provide comprehensive spectral information, future research can transform the raw hyperspectral data to highlight spectral features, extract features by some methods to reduce data redundancy, and calculate the vegetation index based on the spectral features to construct a model. In addition, RGB images and hyperspectral data can be combined to explore the potential of multi-source remote sensing data fusion in predicting cotton LAI.
In this study, the variations in cotton canopy spectral reflectance and LAI were analyzed, and the ML models for cotton LAI prediction were constructed by multi-VI fusion, to explore the optimal VI fusion that contributes to a high cotton LAI prediction accuracy. Cotton LAI raised first and then reduced throughout the entire growth period under different N treatments. In the visible region, no obvious difference in reflectance was detected among growth stages, and the spectral reflectance decreased with the growth of nitrogen dose. However, it was opposite in the NIR region. The correlations between different VIs and LAI are different, and the correlations between some VIs are very high, resulting in data redundancy. The RF model constructed based on multi-VI fusion had the highest accuracy, while the accuracy of the SVM model was the lowest. In addition, the RF model constructed based on the fusion of MNDSI, SRI, GRVI, REP, CIred-edge, MSR, and NVI had the highest accuracy, with R2, MAE, RMSE, and NRMSE of 0.90, 0.26, 50, and 0.14, respectively. The validation results of the optimal model showed that the R2, MAE, RSME, and NRMSE were 0.84, 0.60, 0.77, and 0.21, respectively. Therefore, fusion of appropriate VIs can increase the number of spectral features and further improve the cotton LAI prediction accuracy. However, the number of VIs constructed in this study is limited, and the MLs chosen are traditional. Therefore, more VIs will be constructed in the future, and more deep learning methods will be applied to optimize the VI fusion and the LAI prediction model.
The original contributions presented in the study are included in the article/Supplementary Material. Further inquiries can be directed to the corresponding authors.
XF: Conceptualization, Data curation, Formal analysis, Investigation, Methodology, Visualization, Writing – original draft. MZ: Software, Writing – review & editing. HC: Validation, Writing – review & editing. LZ: Supervision, Writing – review & editing. ZZ: Supervision, Writing – review & editing. JW: Investigation, Writing – review & editing. XL: Conceptualization, Funding acquisition, Methodology, Resources, Supervision, Writing – review & editing. PG: Conceptualization, Funding acquisition, Methodology, Resources, Supervision, Writing – review & editing. QZ: Methodology, Funding acquisition, Writing – review & editing. LM: Investigation, Funding acquisition, Writing – review & editing.
The author(s) declare financial support was received for the research, authorship, and/or publication of this article. This study was supported by the National Key Research and Development Program Project of China (2022YFD2002400), the Xinjiang Corps Financial Science and Technology Plan Project (2023AB014), the Leading Talent Project of the Talent Support Plan of Xinjiang Production and Construction Corps (20230057102), the Autonomous Region Tianchi Talent Project (Qiang Zhang), the Shihezi University high-level talent scientific research start-up project (RCZK202345), and the Shihezi University high-level talent scientific research start-up project (RCZK202342).
The authors are grateful to Jingang Wang for their contribution to the data processing and modify the article.
The authors declare that the research was conducted in the absence of any commercial or financial relationships that could be construed as a potential conflict of interest.
All claims expressed in this article are solely those of the authors and do not necessarily represent those of their affiliated organizations, or those of the publisher, the editors and the reviewers. Any product that may be evaluated in this article, or claim that may be made by its manufacturer, is not guaranteed or endorsed by the publisher.
The Supplementary Material for this article can be found online at: https://www.frontiersin.org/articles/10.3389/fpls.2024.1357193/full#supplementary-material
Aparicio, N., Villegas, D., Casadesus, J., Araus, J. L., Royo, C. (2000). Spectral vegetation indices as nondestructive tools for determining durum wheat yield. Agron. J. 92, 83–91. doi: 10.2134/agronj2000.92183x
Barzin, R., Pathak, R., Lotfi, H., Varco, J., Bora, G. C. (2020). Use of UAS multispectral imagery at different physiological stages for yield prediction and input resource optimization in corn. Remote Sens-basel. 12, 2392. doi: 10.3390/rs12152392
Bermudez-Edo, M., Barnaghi, P., Moessner, K. (2018). Analysing real world data streams with spatio-temporal correlations: Entropy vs. Pearson correlation. Automat Constr. 88, 87–100. doi: 10.1016/j.autcon.2017.12.036
Cao, J., An, Q., Zhang, X., Xu, S., Si, T., Niyogi, D. (2021). Is satellite Sun-Induced Chlorophyll Fluorescence more indicative than vegetation indices under drought condition? Sci. Total Environ. 792, 148396. doi: 10.1016/j.scitotenv.2021.148396
Cao, Z., Cheng, T., Ma, X., Tian, Y., Zhu, Y., Yao, X., et al. (2017). A new three-band spectral index for mitigating the saturation in the estimation of leaf area index in wheat. Int. J. Remote Sens. 38, 3865–3885. doi: 10.1080/01431161.2017.1306141
Chandrasekar, K., Srikanth, P., Chakraborty, A., Choudhary, K., Ramana, K. V. (2022). Response of crop water indices to soil wetness and vegetation water content. Adv. Space. Res. 73, 1316–1330. doi: 10.1016/j.asr.2022.11.019
Chemura, A., Mutanga, O., Odindi, J., Kutywayo, D. (2018). Mapping spatial variability of foliar nitrogen in coffee (Coffea arabica L.) plantations with multispectral Sentinel-2 MSI data. ISPRS. J. Photogramm. 138, 1–11. doi: 10.1016/j.isprsjprs.2018.02.004
Degerickx, J., Roberts, D. A., Somers, B. (2019). Enhancing the performance of Multiple Endmember Spectral Mixture Analysis (MESMA) for urban land cover mapping using airborne lidar data and band selection. Remote Sens. Environ. 221, 260–273. doi: 10.1016/j.rse.2018.11.026
Delegido, J., Verrelst, J., Meza, C. M., Rivera, J. P., Alonso, L., Moreno, J. (2013). A red-edge spectral index for remote sensing estimation of green LAI over agroecosystems. Eur. J. Agrono. 46, 42–52. doi: 10.1016/j.eja.2012.12.001
Dong, T., Liu, J., Shang, J., Qian, B., Ma, B., Kovacs, J. M., et al. (2019). Assessment of red-edge vegetation indices for crop leaf area index estimation. Remote Sens. Environ. 222, 133–143. doi: 10.1016/j.rse.2018.12.032
Donovan, S. D., MacLean, D. A., Zhang, Y., Lavigne, M. B., Kershaw, J. A. (2021). Evaluating annual spruce budworm defoliation using change detection of vegetation indices calculated from satellite hyperspectral imagery. Remote Sens. Environ. 253, 112204. doi: 10.1016/j.rse.2020.112204
Fan, X., Lv, X., Gao, P., Zhang, L., Zhang, Z., Zhang, Q., et al. (2023). Establishment of a monitoring model for the cotton leaf area index based on the canopy reflectance spectrum. Land. 12, 78. doi: 10.3390/land12010078
Fang, H., Baret, F., Plummer, S., Schaepman-Strub, G. (2019). An Overview of Global Leaf Area Index (LAI): Methods, Products, Validation, and Applications. Rev Geophys. 57 (3), 739–799. doi: 10.1029/2018RG000608
Gao, S., Niu, Z., Huang, N., Hou, X. (2013). Estimating the Leaf Area Index, height and biomass of maize using HJ-1 and RADARSAT-2. Int. J. Appl. Earth. Obs. 24, 1–8. doi: 10.1016/j.jag.2013.02.002
Gitelson, A. A., Kaufman, Y. J., Merzlyak, M. N. (1996). Use of a green channel in remote sensing of global vegetation from EOS-MODIS. Remote Sens. Environ. 58, 289–298. doi: 10.1016/S0034-4257(96)00072-7
Gupta, R. K., Vijayan, D., Prasad, T. S. (2001). New hyperspectral vegetation characterization parameters. Adv. Space. Res. 28, 201–206. doi: 10.1016/S0273-1177(01)00346-5
Haboudane, D., Miller, J. R., Pattey, E., Zarco-Tejada, P. J., Strachan, I. B. (2004). Hyperspectral vegetation indices and novel algorithms for predicting green LAI of crop canopies: Modeling and validation in the context of precision agriculture. Remote Sens. Environ. 90, 337–352. doi: 10.1016/j.rse.2003.12.013
Han, L., Yang, G., Dai, H., Xu, B., Yang, H., Feng, H., et al. (2019). Modeling maize above-ground biomass based on machine learning approaches using UAV remote-sensing data. Plant Methods 15, 10. doi: 10.1186/s13007-019-0394-z
Hosseini, M., McNairn, H., Mitchell, S., Robertson, L. D., Davidson, A., Ahmadian, N., et al. (2021). A comparison between support vector machine and water cloud model for estimating crop leaf area index. Remote Sens-basel. 13, 1348. doi: 10.3390/rs13071348
Huete, A. R., Liu, H. Q., Batchily, K., Van Leeuwen, W. (1997). A comparison of vegetation indices over a global set of TM images for EOS-MODIS. Remote Sens. Environ. 59, 440–451. doi: 10.1016/S0034-4257(96)00112-5
Jiang, X., Luo, S., Fang, S., Cai, B., Xiong, Q., Wang, Y., et al. (2021). Remotely sensed estimation of total iron content in soil with harmonic analysis and BP neural network. Plant Methods 17, 116. doi: 10.1186/s13007-021-00812-8
Jiang, H., Wei, X., Chen, Z., Zhu, M., Yao, Y., Zhang, X., et al. (2023). Influence of different soil reflectance schemes on the retrieval of vegetation LAI and FVC from PROSAIL in agriculture region. Compute. Electron. Agr. 212, 108165. doi: 10.1016/j.compag.2023.108165
Jiang, X., Zhen, J., Miao, J., Zhao, D., Shen, Z., Jiang, J., et al. (2022). Newly-developed three-band hyperspectral vegetation index for estimating leaf relative chlorophyll content of mangrove under different severities of pest and disease. Ecol. Indic. 140, 108978. doi: 10.1016/j.ecolind.2022.108978
Joseph, V. R. (2022). Optimal ratio for data splitting. Stat. Anal. Data Mining: ASA Data Sci. J. 15, 531–538. doi: 10.1002/sam.11583
Ju, C. H., Tian, Y. C., Yao, X., Cao, W. X., Zhu, Y., Hannaway, D. (2010). Estimating leaf chlorophyll content using red edge parameters. Pedosphere. 20, 633–644. doi: 10.1016/S1002-0160(10)60053-7
Kumar, R., Pareek, N. K., Kumar, U., Javed, T., Al-Huqail, A. A., Rathore, V. S., et al. (2022). Coupling effects of nitrogen and irrigation levels on growth attributes, nitrogen use efficiency, and economics of cotton. Front. Plant Sci. 13. doi: 10.3389/fpls.2022.890181
Li, Z. P. (2022). Effects of irrigation regimes on the growth of filmless drip irrigation cotton and spatio-temporal and variations of soil water and heat in southern. Xinjiang. Tarim University. 1, 62.
Li, H., Liu, G., Liu, Q., Chen, Z., Huang, C. (2018). Retrieval of winter wheat leaf area index from chinese GF-1 satellite data using the PROSAIL model. Sensors-basel. 18, 1120. doi: 10.1016/j.agrformet.2021.108695
Li, F., Mistele, B., Hu, Y., Chen, X., Schmidhalter, U. (2013). Comparing hyperspectral index optimization algorithms to estimate aerial N uptake using multi-temporal winter wheat datasets from contrasting climatic and geographic zones in China and Germany. Agr. Forest. Meteorol. 180, 44–57. doi: 10.1016/j.agrformet.2013.05.003
Li, D., Tian, L., Wan, Z., Jia, M., Yao, X., Tian, Y., et al. (2019). Assessment of unified models for estimating leaf chlorophyll content across directional-hemispherical reflectance and bidirectional reflectance spectra. Remote Sens. Environ. 231, 111240. doi: 10.1016/j.rse.2019.111240
Liu, J., Dong, Z., Xia, J., Wang, H., Meng, T., Zhang, R., et al. (2021). Estimation of soil organic matter content based on CARS algorithm coupled with random forest. Spectrochim. Acta A. 258, 119823. doi: 10.1016/j.saa.2021.119823
Liu, Y., Feng, H., Yue, J., Fan, Y., Bian, M., Ma, Y., et al. (2023a). Estimating potato above-ground biomass by using integrated unmanned aerial system-based optical, structural, and textural canopy measurements. Compute. Electron. Agr. 213, 108229. doi: 10.1016/j.compag.2023.108229
Liu, Y., Feng, H., Yue, J., Jin, X., Fan, Y., Chen, R., et al. (2023b). Improved potato AGB estimates based on UAV RGB and hyperspectral images. Compute. Electron. Agr. 214, 108260. doi: 10.1016/j.compag.2023.108260
Liu, Y., Feng, H., Yue, J., Jin, X., Li, Z., Yang, G. (2022a). Estimation of potato above-ground biomass based on unmanned aerial vehicle red-green-blue images with different texture features and crop height. Front. Plant Sci. 13. doi: 10.3389/fpls.2022.938216
Liu, Y., Feng, H., Yue, J., Li, Z., Jin, X., Fan, Y., et al. (2022b). Estimation of aboveground biomass of potatoes based on characteristic variables extracted from UAV hyperspectral imagery. Remote Sens. 14, 5121. doi: 10.3390/rs14205121
Liu, Y., Feng, H., Yue, J., Li, Z., Yang, G., Song, X., et al. (2022c). Remote-sensing estimation of potato above-ground biomass based on spectral and spatial features extracted from high-definition digital camera images. Compute. Electron. Agr. 198, 107089. doi: 10.1016/j.compag.2022.107089
Liu, L., Peng, Z., Zhang, B., Wei, Z., Han, N., Lin, S., et al. (2019). Canopy nitrogen concentration monitoring techniques of summer corn based on canopy spectral information. Sensors-basel. 19, 4123. doi: 10.3390/s19194123
Liu, N., Townsend, P. A., Naber, M. R., Bethke, P. C., Hills, W. B., Wang, Y. (2021). Hyperspectral imagery to monitor crop nutrient status within and across growing seasons. Remote Sens. Environ. 255, 112303. doi: 10.1016/j.rse.2021.112303
Lu, B., He, Y. (2019). Evaluating empirical regression, machine learning, and radiative transfer modelling for estimating vegetation chlorophyll content using bi-seasonal hyperspectral images. Remote Sens-basel. 11, 1979. doi: 10.3390/rs11171979
Lu, X., Liu, Z., Zhao, F., Tang, J. (2020). Comparison of total emitted solar-induced chlorophyll fluorescence (SIF) and top-of-canopy (TOC) SIF in estimating photosynthesis. Remote Sens. Environ. 251, 112083. doi: 10.1016/j.rse.2020.112083
Ma, Y., Zhang, Q., Yi, X., Ma, L., Zhang, L., Huang, C., et al. (2022). Estimation of cotton leaf area index (LAI) based on spectral transformation and vegetation index. Remote Sens-basel. 14, 136. doi: 10.3390/rs14010136
Mao, Z. H., Deng, L., Duan, F. Z., Li, X. J., Qiao, D. Y. (2020). Angle effects of vegetation indices and the influence on prediction of SPAD values in soybean and maize. Int. J. Appl. Earth. Obs. 93, 102198. doi: 10.1016/j.jag.2020.102198
Meerasri, J., Sothornvit, R. (2022). Artificial neural networks (ANNs) and multiple linear regression (MLR) for prediction of moisture content for coated pineapple cubes. Case. Stud. Therm. Eng. 33, 101942. doi: 10.1016/j.csite.2022.101942
Meiyan, S., Jinyu, Z., Xiaohong, Y., Xiaohe, G., Baoguo, L., Yuntao, M. (2023). A spectral decomposition method for estimating the leaf nitrogen status of maize by UAV-based hyperspectral imaging. Comput. Electron. Agric. 212, 108100. doi: 10.1016/j.compag.2023.108100
Meng, L., Liu, H., Ustin, S. L., Zhang, X. (2021). Assessment of FSDAF accuracy on cotton yield estimation using different MODIS products and landsat based on the mixed degree index with different surroundings. Sens. 21, 5184. doi: 10.3390/s21155184
Moharram, M. A., Sundaram, D. M. (2023). Dimensionality reduction strategies for land use land cover classification based on airborne hyperspectral imagery: A survey. Environ. Sci. pollut. R. 30, 5580–5602. doi: 10.1007/s11356-022-24202-2
Morsy, M., Michaelides, S., Scholten, T., Dietrich, P. (2022). Monitoring and integrating the changes in vegetated areas with the rate of groundwater use in arid regions. Remote Sens-basel. 14, 5767. doi: 10.3390/rs14225767
Nie, C., Shi, L., Li, Z., Xu, X., Yin, D., Li, S., et al. (2023). A comparison of methods to estimate leaf area index using either crop-specific or generic proximal hyperspectral datasets. Eur. J. Agron. 142, 126664. doi: 10.1016/j.eja.2022.126664
Ninkuu, V., Liu, Z., Sun, X. (2023). Genetic regulation of nitrogen use efficiency in Gossypium spp. Plant Cell. Environ. 46, 1749–1773. doi: 10.1111/pce.14586
Parker, G. G. (2020). Tamm review: Leaf Area Index (LAI) is both a determinant and a consequence of important processes in vegetation canopies. Forest. Ecol. Manage. 477, 118496. doi: 10.1016/j.foreco.2020.118496
Pasternak, M., Pawluszek-Filipiak, K. (2022). The evaluation of spectral vegetation indexes and redundancy reduction on the accuracy of crop type detection. Appl. Sci. 12, 5067. doi: 10.3390/app12105067
Qi, H., Zhu, B., Wu, Z., Liang, Y., Li, J., Wang, L., et al. (2020). Estimation of peanut leaf area index from unmanned aerial vehicle multispectral images. Sensors-basel. 20, 6732. doi: 10.3390/s20236732
Qiao, L., Gao, D., Zhao, R., Tang, W., An, L., Li, M., et al. (2022). Improving estimation of LAI dynamic by fusion of morphological and vegetation indices based on UAV imagery. Comput. Electron. Agr. 192, 106603. doi: 10.1016/j.compag.2021.106603
Qiao, K., Zhu, W., Xie, Z. (2020). Application conditions and impact factors for various vegetation indices in constructing the LAI seasonal trajectory over different vegetation types. Ecol. Indic. 112, 106153. doi: 10.1016/j.ecolind.2020.106153
Ranjan, R., Chopra, U. K., Sahoo, R. N., Singh, A. K., Pradhan, S. (2012). Assessment of plant nitrogen stress in wheat ( Triticum aestivum L.) through hyperspectral indices. Int. J. Remote Sens. 33, 6342–6360. doi: 10.1080/01431161.2012.687473
Richetti, J., Boote, K. J., Hoogenboom, G., Judge, J., Johann, J. A., Uribe-Opazo, M. A. (2019). Remotely sensed vegetation index and LAI for parameter determination of the CSM-CROPGRO-Soybean model when in situ data are not available. Int. J. Appl. Earth. Obs. 79, 110–115. doi: 10.1016/j.jag.2019.03.007
Rondeaux, G., Steven, M., Baret, F. (1996). Optimization of soil-adjusted vegetation indices. Remote Sens. Environ. 55, 95–107. doi: 10.1016/0034-4257(95)00186-7
Roujean, J. L., Breon, F. M. (1995). Estimating PAR absorbed by vegetation from bidirectional reflectance measurements. Remote Sens. Environ. 51, 375–384. doi: 10.1016/0034-4257(94)00114-3
Rumora, L., Majić, I., Miler, M., Medak, D. (2021). Spatial video remote sensing for urban vegetation mapping using vegetation indices. Urban Ecosyst. 24, 21–33. doi: 10.1007/s11252-020-01002-5
Spafford, L., le Maire, G., MacDougall, A., de Boissieu, F., Féret, J. B. (2021). Spectral subdomains and prior estimation of leaf structure improves PROSPECT inversion on reflectance or transmittance alone. Remote Sens. Environ. 252, 112176. doi: 10.1016/j.rse.2020.112176
Srinet, R., Nandy, S., Patel, N. R. (2019). Estimating leaf area index and light extinction coefficient using Random Forest regression algorithm in a tropical moist deciduous forest, India. Ecol. Informatics. 52, 94–102. doi: 10.1016/j.ecoinf.2019.05.008
Sun, C. J., Gao, F. (2022). Remote sensing image recognition based on LOG-T-SSA-LSSVM and AE-ELM network. Comput. Intel Neurosc. 2022, e8077563. doi: 10.1155/2022/8077563
Sun, Q., Gu, X., Chen, L., Xu, X., Wei, Z., Pan, Y., et al. (2022). Monitoring maize canopy chlorophyll density under lodging stress based on UAV hyperspectral imagery. Comput. Electron. Agr. 193, 106671. doi: 10.1016/j.compag.2021.106671
Sun, X., Yang, Z., Su, P., Wei, K., Wang, Z., Yang, C., et al. (2023). Non-destructive monitoring of maize LAI by fusing UAV spectral and textural features. Front. Plant Sci. 14. doi: 10.3389/fpls.2023.1158837
Swain, S., Wardlow, B. D., Narumalani, S., Rundquist, D. C., Hayes, M. J. (2013). Relationships between vegetation indices and root zone soil moisture under maize and soybean canopies in the US Corn Belt: a comparative study using a close-range sensing approach. Int. J. Remote Sens. 34, 2814–2828. doi: 10.1080/01431161.2012.750020
Tanaka, S., Kawamura, K., Maki, M., Muramoto, Y., Yoshida, K., Akiyama, T. (2015). Spectral index for quantifying leaf area index of winter wheat by field hyperspectral measurements: A case study in gifu prefecture, central Japan. Remote Sens-basel. 7, 5329–5346. doi: 10.3390/rs70505329
Thompson, D. R., Natraj, V., Green, R. O., Helmlinger, M. C., Gao, B. C., Eastwood, M. L. (2018). Optimal estimation for imaging spectrometer atmospheric correction. Remote Sens. Environ. 216, 355–373. doi: 10.1016/j.rse.2018.07.003
Tucker, C. J. (1979). Red and photographic infrared linear combinations for monitoring vegetation. Remote Sens. Environ. 8, 127–150. doi: 10.1016/0034-4257(79)90013-0
Wang, N., Guo, Y. C., Wei, X., Zhou, M. Y., Wang, H. J., Bai, Y. B. (2022). UAV-based remote sensing using visible and multispectral indices for the estimation of vegetation cover in an oasis of a desert. Ecol. Indic. 141, 109155. doi: 10.1016/j.ecolind.2022.109155
Wang, X., Miao, Y., Dong, R., Zha, H., Xia, T., Chen, Z., et al. (2021). Machine learning-based in-season nitrogen status diagnosis and side-dress nitrogen recommendation for corn. Eur. J. Agron. 123, 126193. doi: 10.1016/j.eja.2020.126193
Wang, N., Yang, G., Han, X., Jia, G., Li, Q., Liu, F., et al. (2023). Study of the spectral characters–chlorophyll inversion model of Sabina vulgaris in the Mu Us Sandy Land. Front. Earth. Sc-switz. 10. doi: 10.3389/feart.2022.1032585
Wen, P. F. (2016). Study on the spectral estimation model and diagnosis system of cotton nitrogen nutrition. Shi He Zi University. 2, 13. Available at: https://kns.cnki.net/reader/flowpdf?invoice=v%2Fe0IsHYT0ik6yMQrqwWJF23nJwrXIZtnuV7sWhlhCNMpbELG9BFqEi9qacjeMb9V1%2B5ZURLpvaBcnhL1DKxbyXbLJrkYkDgdPDjfPH1oB4%2BPKMCLt73IYyWP0Xxs4N3r1LGe57JKMbvbtgt4mQwumzR1u4dd28jjs2%2B79KMxH8%3D&platform=NZKPT&product=CMFD&filename=1016779171.nh&tablename=cmfd201701&type=DISSERTATION&scope=trial&cflag=pdf&dflag=&pages=&language=chs&trial=&nonce=9DBC5D37E60941899262F5A81B42CFD4.
Wu, Q. (2023). Wheat growth monitoring and yield prediction in the hetao imigation district based on UAV remote sensing and machine learning. Inner Mongolia Agricultural University. 3, 32.
Xie, Q., Huang, W., Zhang, B., Chen, P., Song, X., Pascucci, S., et al. (2016). Estimating winter wheat leaf area index from ground and hyperspectral observations using vegetation indices. IEEE. J-Stars. 9, 771–780. doi: 10.1109/JSTARS.4609443
Xing, N., Huang, W., Xie, Q., Shi, Y., Ye, H., Dong, Y., et al. (2020). A transformed triangular vegetation index for estimating winter wheat leaf area index. Remote Sens-basel. 12, 16. doi: 10.3390/rs12010016
Yan, P., Han, Q., Feng, Y., Kang, S. (2022). Estimating LAI for cotton using multisource UAV data and a modified universal model. Remote Sens-basel. 14, 4272. doi: 10.3390/rs14174272
Yang, H., Ming, B., Nie, C., Xue, B., Xin, J., Lu, X., et al. (2022). Maize canopy and leaf chlorophyll content assessment from leaf spectral reflectance: estimation and uncertainty analysis across growth stages and vertical distribution. Remote Sens-basel. 14, 2115. doi: 10.3390/rs14092115
Yang, Z., Shao, Y., Li, K., Liu, Q., Liu, L., Brisco, B. (2017). An improved scheme for rice phenology estimation based on time-series multispectral HJ-1A/B and polarimetric RADARSAT-2 data. Remote Sens. Environ. 195, 184–201. doi: 10.1016/j.rse.2017.04.016
Zhang, Q., Yao, T., Huemmrich, K. F., Middleton, E. M., Lyapustin, A., Wang, Y. (2020). Evaluating impacts of snow, surface water, soil and vegetation on empirical vegetation and snow indices for the Utqiaġvik tundra ecosystem in Alaska with the LVS3 model. Remote Sens. Environ. 240, 111677. doi: 10.1016/j.rse.2020.111677
Keywords: canopy spectrum, fusion of vegetation indices, machine learning, monitoring, LAI
Citation: Fan X, Gao P, Zhang M, Cang H, Zhang L, Zhang Z, Wang J, Lv X, Zhang Q and Ma L (2024) The fusion of vegetation indices increases the accuracy of cotton leaf area prediction. Front. Plant Sci. 15:1357193. doi: 10.3389/fpls.2024.1357193
Received: 19 December 2023; Accepted: 10 June 2024;
Published: 04 July 2024.
Edited by:
Xiaorong Fan, Nanjing Agricultural University, ChinaReviewed by:
Haikuan Feng, Beijing Research Center for Information Technology in Agriculture, ChinaCopyright © 2024 Fan, Gao, Zhang, Cang, Zhang, Zhang, Wang, Lv, Zhang and Ma. This is an open-access article distributed under the terms of the Creative Commons Attribution License (CC BY). The use, distribution or reproduction in other forums is permitted, provided the original author(s) and the copyright owner(s) are credited and that the original publication in this journal is cited, in accordance with accepted academic practice. No use, distribution or reproduction is permitted which does not comply with these terms.
*Correspondence: Xin Lv, bHhzaHpAMTI2LmNvbQ==; Qiang Zhang, enFibW5nQHNoenUuZWR1LmNu; Lulu Ma, bWFfMDUxN0BzaHp1LmVkdS5jbg==
Disclaimer: All claims expressed in this article are solely those of the authors and do not necessarily represent those of their affiliated organizations, or those of the publisher, the editors and the reviewers. Any product that may be evaluated in this article or claim that may be made by its manufacturer is not guaranteed or endorsed by the publisher.
Research integrity at Frontiers
Learn more about the work of our research integrity team to safeguard the quality of each article we publish.