
95% of researchers rate our articles as excellent or good
Learn more about the work of our research integrity team to safeguard the quality of each article we publish.
Find out more
ORIGINAL RESEARCH article
Front. Plant Sci. , 16 July 2024
Sec. Plant Breeding
Volume 15 - 2024 | https://doi.org/10.3389/fpls.2024.1346046
 Veronica F. Guwela1,2,3
 Moses F. Maliro3
 Martin R. Broadley1,2
 Malcolm J. Hawkesford2
 James M. Bokosi3
 Surbhi Grewal1Benedict Coombes4Anthony Hall4Caiyun Yang1
 Mike Banda3Lolita Wilson1
 Julie King1*
Micronutrient deficiencies (MNDs) particularly zinc (Zn) and iron (Fe) remain widespread in sub-Saharan Africa (SSA) due to low dietary intake. Wheat is an important source of energy globally, although cultivated wheat is inherently low in grain micronutrient concentrations. Malawian wheat/Am. muticum and Malawian wheat/T. urartu BC1F3 introgression lines, developed by crossing three Malawian wheat varieties (Kenya nyati, Nduna and Kadzibonga) with DH-348 (wheat/Am. muticum) and DH-254 (wheat/T. urartu), were phenotyped for grain Zn and Fe, and associated agronomic traits in Zn-deficient soils, in Malawi. 98% (47) of the BC1F3 introgression lines showed higher Zn above the checks Paragon, Chinese Spring, Kadzibonga, Kenya Nyati and Nduna. 23% (11) of the introgression lines showed a combination of high yields and an increase in grain Zn by 16-30 mg kg -1 above Nduna and Kadzibonga, and 11-25 mg kg -1 above Kenya nyati, Paragon and Chinese Spring. Among the 23%, 64% (7) also showed 8-12 mg kg -1 improvement in grain Fe compared to Nduna and Kenya nyati. Grain Zn concentrations showed a significant positive correlation with grain Fe, whilst grain Zn and Fe negatively and significantly correlated with TKW and grain yield. This work will contribute to the efforts of increasing mineral nutrient density in wheat, specifically targeting countries in the SSA.
Micronutrient deficiencies (MNDs) remain a global challenge, affecting an approximated 2 billion people worldwide (White and Broadley, 2009; World Health, 2009). Zinc (Zn) and iron (Fe) deficiencies are widespread in low-income countries, particularly in sub-Saharan Africa (SSA) and South-east Asia (Gupta et al., 2020). Inadequate intake and bioavailability of these elements in diets remain the major reasons for increased deficiency risks (Caulfield and Black, 2002; Maret and Sandstead, 2006; Prasad et al., 2014). A high dependence on cereal diets and inability to afford foods that are rich in essential micronutrients for a majority of people in SSA has resulted in risk deficiencies of up to 96%, with a number of countries falling above 50% (Kumssa et al., 2015). In Malawi for instance, Zn deficiency risk is at ~60% of the population with most households having deficiency risks in the range of 50-75% (Joy et al., 2014; NSO, 2016; Likoswe et al., 2020). It is estimated that malnutrition results in an annual economic burden of 10.3% of Malawi’s gross domestic product (UNICEF, 2019). Food based approaches, particularly food fortification, agronomic biofortification and genetic biofortification of staple crops, were identified as strategies to combat Zn deficiencies globally (Gibson and Ferguson, 1998; Graham et al., 1999; Welch, 2002; Bouis, 2003; Velu et al., 2014). However, food fortification and agronomic biofortification programs are more feasible in developed countries compared to the least-developed, low-income countries, owing to low accessibility and cost of industrially processed food and micronutrient rich fertilisers (Horton, 2006; Cakmak, 2008; Gomez-Galera et al., 2010). In contrast, genetic biofortification, which aims at enhancing grain micronutrient concentration and substances that promote nutrient bioavailability through plant breeding (Velu et al., 2014; Bouis and Saltzman, 2017), is a viable and cost-effective approach for delivering essential micronutrients to low-income countries.
Wheat is an important staple crop providing more than 20-25% daily calorie intake in Africa (FAO, 2019). In recent years, demand for wheat and wheat products in SSA has substantially increased and is projected to increase further in the immediate future (Shiferaw et al., 2011; Mason et al., 2015; Guwela et al., 2021). Previous work has shown that genetic variation for grain Zn and Fe concentration in most of the cultivated wheat is not enough to meet the estimated average requirement (EAR) for both children and adults of reproductive and non-reproductive age. In contrast, wheat progenitor species and other wild relatives in the wheat secondary and tertiary gene pools have revealed a substantial genetic variation for grain concentrations of Zn, Fe and other essential minerals (Chhuneja et al., 2006; Rawat et al., 2009; Neelam et al., 2011; Rawat et al., 2011; Tiwari et al., 2015). Through introgression breeding, genetic variation from wheat progenitors and wild relatives can be successfully transferred to modern cultivated wheat (Anderson, 1949; Thórsson et al., 2001) to tap some useful genetic variability for wheat improvement. Several studies have shown higher grain Zn and Fe concentrations in introgression lines developed from cultivated hexaploid/tetraploid wheat and several wild species compared to their modern cultivated wheat parents (Rawat et al., 2009; Tiwari et al., 2010; Neelam et al., 2011; Wang et al., 2011; Farkas et al., 2014). For example, wheat/wild relative derivatives from Ae. kotschyii and Ae. peregrina have shown up to a five-fold increase in grain Zn concentration above their recurrent parents (Tiwari et al., 2010; Neelam et al., 2011; Rawat et al., 2011). Progenitor species, particularly Ae. tauschii have also shown to increase grain Zn and Fe concentrations by 20-40% compared to local varieties (Singh et al., 2017).
Thus, the transfer of genetic variation from wheat wild relatives to cultivated wheat through introgression of chromosome segments from wheat wild relatives offers a useful approach for improving the nutritional quality of wheat to the target levels required for improving human nutrition. Pre-breeding efforts have resulted in the successful transfer of a number of progenitor and wild relative chromosomes from the genus, Triticum, Aegilops, Amblyopyrum and Thinopyrum (King et al., 2018; Grewal et al., 2018b; King et al., 2019; Grewal et al., 2021). Mineral analysis of some of the pre-breeding materials have shown substantial variation in grain Zn and Fe (Guwela, 2023) and these may be useful sources for transferring the introgressions into other adapted wheat backgrounds.
The breeding targets for grain Zn and Fe concentration in wheat were set at an additional 12 and 22 mg/kg from 25 and 30 mg/kg respectively (Bouis et al., 2011; Bouis and Saltzman, 2017). These targets were set to meet 60-80% of EAR for preschool children (4–6 years old) and for non-pregnant and non-lactating women of reproductive age (Bouis and Saltzman, 2017). Previously, rye translocations in a Pavon 76 wheat background significantly increased grain zinc concentrations above the recurrent parent (Velu et al., 2019). In CIMMYT, the use of Triticum aestivum ssp. spelta- and Triticum turgidum ssp. dicoccum-based synthetics have resulted in the release of varieties with 20-40% higher Zn levels compared to local varieties (Singh et al., 2017; Guzman et al., 2019; Velu et al., 2019). Similarly, HarvestPlus Yield Trials (HPYT) of CIMMYT biofortified wheat varieties released in Nepal showed a combination of high yields and high grain Zn and Fe concentrations above the local checks (Thapa et al., 2022).
This paper describes the transfer of Am. muticum (TT) and T. urartu (AuAu) introgressions, from doubled haploid introgression lines into Malawian wheat varieties to achieve increased grain mineral concentration.
The introgression lines used in this study were developed by crossing DH-348 and DH-254 with three Malawian wheat varieties (Kadzibonga, Nduna and Kenya nyati). The Nottingham Wheat Research Centre (WRC), at the University of Nottingham previously developed the DH lines. Briefly, DH-348 was developed by pollinating hexaploid wheat cv. Pavon 76 with Am. muticum accession 2130012 and T. urartu DH-254 was developed from a cross between hexaploid wheat cv. Chinese Spring (ph1/ph1) and T. urartu accession 1010002 (King et al., 2017; Grewal et al., 2018a). The F1 interspecific hybrid carrying the Am. muticum/wheat and the T. urartu/wheat recombinant chromosome were backcrossed as females to Paragon up to BC3, which was used to produce the DH lines (King et al., 2019; Grewal et al., 2021). The three Malawian wheats, Kenya Nyati, Kadzibonga and Nduna were obtained from stocks retained at Lilongwe University of Agriculture and Natural Resources (LUANAR) Malawi. The three Malawian varieties represent the most widely cultivated wheat varieties in Malawi.
For the crossing program, two parental DH lines (DH-254 and DH-348) were sequenced to determine their genetic makeup, with a target on the size and site of introgression of the alien chromosome segments. Genomic DNA (deoxyribonucleic acid) was collected from 2-week-old leaf samples. Extraction was performed using extraction buffer (0.1 m Tris–HCl (pH 7.5), 0.05 m EDTA (pH 8.0), 1.25% SDS). Library preparation and DNA sequencing was performed by the Novogene (UK) Company Limited. The DNA sample used for library preparation was prepared following the manufacture’s recommendations of NEBNext® DNA Library Prep Kit (New England BioLabs, US). Index codes were added to each sample. Briefly, the genomic DNA was randomly fragmented to size of 350 bp. DNA fragments were end polished, A-tailed, ligated with adapters, size selected, and further PCR enriched. Then polymerase chain reaction (PCR) products were purified (AMPure XP system), followed by size distribution by Agilent 2100 Bioanalysis (Agilent Technologies, CA, USA), and quantification using real-time PCR. The library was then sequenced for 10x whole genome sequencing (WGS) on NovaSeq 6000 S4 flow cell with PE150 strategy.
Hybridisation of the donor (DH-348 and DH-254) and the reciprocal parents (Nduna, Kadzibonga and Kenya nyati) was performed in both directions (as both male and female). In total, six cross combinations were made for each of the DH lines. Selected F1 interspecific hybrids were backcrossed to respective recurrent parents to obtain the BC1 population, which was selfed up to BC1F3. Germination was followed by 4 weeks vernalisation (6°C and photoperiod for 12 hours) seven day after sowing. The plants were left under glasshouse conditions with the photoperiod set at 25°C, light at 16 hours and 8 hours dark. Emasculation was done before the spikes completely emerged from the flag leaf. Emasculated spikes were covered with glassine bags following removal of the anthers. Pollination was done two days after emasculation.
To characterise the introgression lines, genomic DNA of the BC1 and BC1F1 populations was extracted in a 96 well plate from leaf samples collected from 10 day old seedlings (Thomson and Henry, 1995). Extraction was performed using template preparation solution (TPS) buffer and isopropanol. Malawian wheats, Kadzibonga, Kenya nyati and Nduna alongside wheat/Am. muticum, DH 348, wheat/T. urartu, DH-254 Am. muticum accession 2130012 and T. urartu accession 1010002 were used as controls. The KASP assays comprised of two allele specific primers and one common reverse primer. A final reaction volume of 5 μl, which included 1ng genomic DNA, 2.5 μl KASP reaction mix (ROX), 0.068 μl primer mix and 2.43 μl nuclease free water Primer mix, was dispensed into the 386 well plates using Gilson pipette max 268 (Gilson, INC. 3000 Parmenter St. Middleton, WI 53562). Plates were sealed with optical quantitative polymerase chain reaction (qPCR) seals (Sarstedtstr AG & Co. KG, Numbrecht, Germany) following a brief centrifuge. Genotyping was done using ProFlex PCR system (Applied Biosystems by Thermo Fisher Scientific). PCR conditions were set as 15 min at 94°C; 10 touchdown cycles of 10 s at 94°C, 1 min at 65–57°C (dropping 0.8°C per cycle); and 35 cycles of 10 s at 94°C, 1 min at 57°C.
To validate the presence of the chromosome segments in the introgression lines, genomic in-situ hybridisation (GISH) was performed following a protocol described by Kato et al. (2004) and King et al. (2017). Genomic DNA was extracted from Am. muticum and the three progenitors of bread wheat: T. urartu, Ae. speltoides, and Ae. tauschii using an extraction buffer (0.1 M Tris-HCl, 0.05 m EDTA and 1.25% SDS). Genomic DNAs of Am. muticum, T. urartu, Ae. tauschii and Ae. speltoides were labelled by nick translation with ChromaTide Alexa Fluor 546-14-dUTP (Alexa Fluor-546), ChromaTide Alexa Fluor 488-5-dUTP (Alexa fluor-488) [Thermo Fisher Scientific (Invitrogen), Waltham, MA, United States] and Alexa Fluor 594-5-dUTP (Alexa fluor-594) [Thermo Fisher Scientific (Invitrogen), Waltham, MA, United States] and ChromaTide Alexa 405 dUTP, respectively. Metaphase spreads were prepared from root tips using a nitrous oxide-enzymatic maceration method. Malawian wheat/Am. muticum slides were probed using a probe mixture containing 1.5μl of T. urartu, 1.5μl Ae. speltoides, 2μl Ae. tauschii and 0.3μl Am. muticum labelled genomic DNA in 2 × SSC and 1 × TE buffer (pH 7.0) to a final volume of 10μl per slide. Malawian wheat/T. urartu slides were probed using a similar probe mixture with the exception of Am. muticum genomic DNA. Slides were counterstained with Vectashield mounting medium with 4-6-diamidino-2phenylindole dihydrochloride (DAPI). Analysis was done using a Zeiss Axio ImagerZ2 upright epifluorescence microscope (Carl Zeiss Ltd, Oberkochen, Germany) with filters for DAPI (Ex/Em 358/461 nm, blue), Alexa Fluor 488 (Ex/Em 490/520 nm, green), Alexa Fluor 594 (Ex/Em 590/615 nm, red) and Alexa Fluor 546 (Ex/Em 555/570 nm, yellow). Photographs were taken using a MetaSystems Coolcube 1 m CCD camera.
A composite soil sample was collected on each block at the trial site before trial establishment. Soil samples were air-dried, crushed with a pestle and mortar before passing them through a 2 mm sieve. 200 grams of each of the composite soil sample was transferred into zip-loc bags, labelled and shipped to the University of Nottingham for analysis. Soil pH was determined following suspension of 5 g of soil sample into 12.5 ml Milli-Q water (18.2 MΩ cm; 1:2.5 m/v). Total nitrogen (N) was measured using the Kjeldahl method (Kjeldahl, 1883). Organic matter was determined using the Walkley and Black method (Walkley and Black, 1934). Extractable soil Zn and Fe were determined by the diethylene triamine penta-acetic acid (DTPA) extraction method (Lindsay and Norvell, 1978) followed by multi-element analysis with ICP-MS. Available phosphorus (P) and K were measured using the Mehlich- 3 extraction (Mehlich, 1984).
The experiment was conducted in the winter of 2022 (May to October). Wheat lines were grown under field conditions in an optimally irrigated environment at LUANAR (14.18’S 33.76’ E) in Lilongwe, Malawi. Forty-eight BC1F3 introgression lines (11 Malawian wheat/T. urartu DH-254 and 37 Malawian wheat/Am. muticum DH-348) were planted alongside three Malawian wheat varieties (Kadzibonga, Kenya nyati and Nduna), two DH lines (DH-348 and DH-254) and Paragon, Pavon 76 and Chinese spring, in a randomised complete block design (RCBD) with three replicates. Plots were 2 m2 each, with six rows spaced at 0.15 m. Plot spacing was 0.30 m and block spacing was 1.0 m. Basal dressing fertiliser 23N:10P:5K +6S +1Zn (SuperFert Fertilisers, Harare, Zimbabwe) was applied 14 days after planting at a rate of 200 kg N/ha. Three weeks later, Urea (46% N) was applied as top dressing at a rate of 100 kg N/ha. Basal and top dressing were applied according to the Malawi guide to agriculture production (MoAI, 2020) guidelines. The Malawi government recently approved the NPK (23:10:5 + 6S +1Zn) basal fertiliser with 1% Zn due to severe deficiencies (< 2 mg kg-1) of plant available soil Zn across the country (IFDC et al., 2018). Thus, all basal fertiliser blends for selected cereals and legumes in Malawi have 1% Zn. First weeding was done 4 weeks after planting and subsequent weeding as soon as weeds appeared. Insect pests were controlled by applying Profex Super (Profencfos 40% + Cypermenthrin 4% EC –Kewalram Chanrai group). Data collected included days to heading (DH), days to flowering (DF), days to maturity (DM), plant height, thousand kernel weight (TKW) and grain yield. Grain yield was converted from g/m2 to kg/ha. Plant height and number of tillers were collected from five randomly selected plants in the net plot, to get an average of both.
Grain samples were digested using a hot block acid digestion system (Anton Paar Gmbh, Graz, Austria) as described by Gashu et al., 2021. Approximately 0.4 g of each of the grain samples along with certified reference material (wheat flour 1567b-CRM) and laboratory reference material (Paragon wheat-LRM) were digested using a Multicube 48 digestion block (Anton Paar Gmbh, Graz, Austria). Two operational blanks were added in each run. The digestion block was set at 105°C for 2h. Samples were diluted with milliQ water (18.2 MΩ cm; Fisher Scientific UK Ltd, Loughborough, UK) up to 50 mL. Grain multi-element analysis was undertaken using inductively coupled plasma mass spectrometry (Thermo Fisher Scientific iCAPQ, Thermo Fisher Scientific, Bremen, Germany) as described by Gashu et al. (2021) and Khokhar et al., 2018. A total of 189 grain samples including blanks, CRMs and LRMs were analysed. The Zn and Fe specific recovery from CRMs from grain samples was 99 and 97% respectively. The limit of detection (LOD) values for grain Zn and Fe were 0.7 and 2.2 respectively.
The Earlham Institute bioinformatics pipeline (Coombes et al., 2022) was used to analyse the sequencing data. Florescence detection and data analysis of KASP reactions was performed using Quant Studio Design and Analysis Software V1.5.0 (Applied Biosystems by Thermo Fisher Scientific). GISH analysis was carried out using Meta Systems ISIS and Metafer software (Metasystems GmbH, Altlussheim, Germany). For field data, one-way analysis of variance (ANOVA) was performed using GenStat for windows statistical package, version 21 (VSN, 2022). A post-hoc test was performed using Tukey’s HDS test. Pearson correlation analyses were performed in RStudio (version 4.1.3), and correlation heatmaps were created using the same software (RStudio Team, 2022). The statistical linear model considered the response Yij of the jth treatment in the ith replication expressed as:
where μ is the grand mean of all genotypes, βi is the block effect, τj is the effect of the jth treatment (genotype) and eij is the average experimental error.
The sequence reads from the parental lines, hexaploid wheat cvs. Chinese Spring and Paragon, and Am. muticum DH-348 were mapped to the wheat reference genome assembly cv. Chinese Spring RefSeq v.1.0 (IWGSC et al., 2018). Whole genome sequence analysis of Am. muticum DH-348 revealed the presence of two Am. muticum segments on wheat chromosomes (Chr) 4D and 7A as shown in the drop in read coverage (red blocks) in Figure 1A. Analysis of the size of the introgressed segments showed that the segment on Chr 4D is bigger (51.2 Mbp) compared to the segment on Chr 7A (9.1 Mbp). Sequence analysis also revealed a monosomic deletion on the short arm of Chr 5D. GISH analysis of Am muticum DH-348 (Figure 1B) partially validated the sequencing results, as it showed a pair of recombinant chromosomes with a large D chromosome (red) and a small T segment (gold) at the distal end of the D chromosome. The Am. muticum segment visible from the GISH metaphase spread is likely from Chr 4D as the segment on 7A is too small to be detected by GISH.
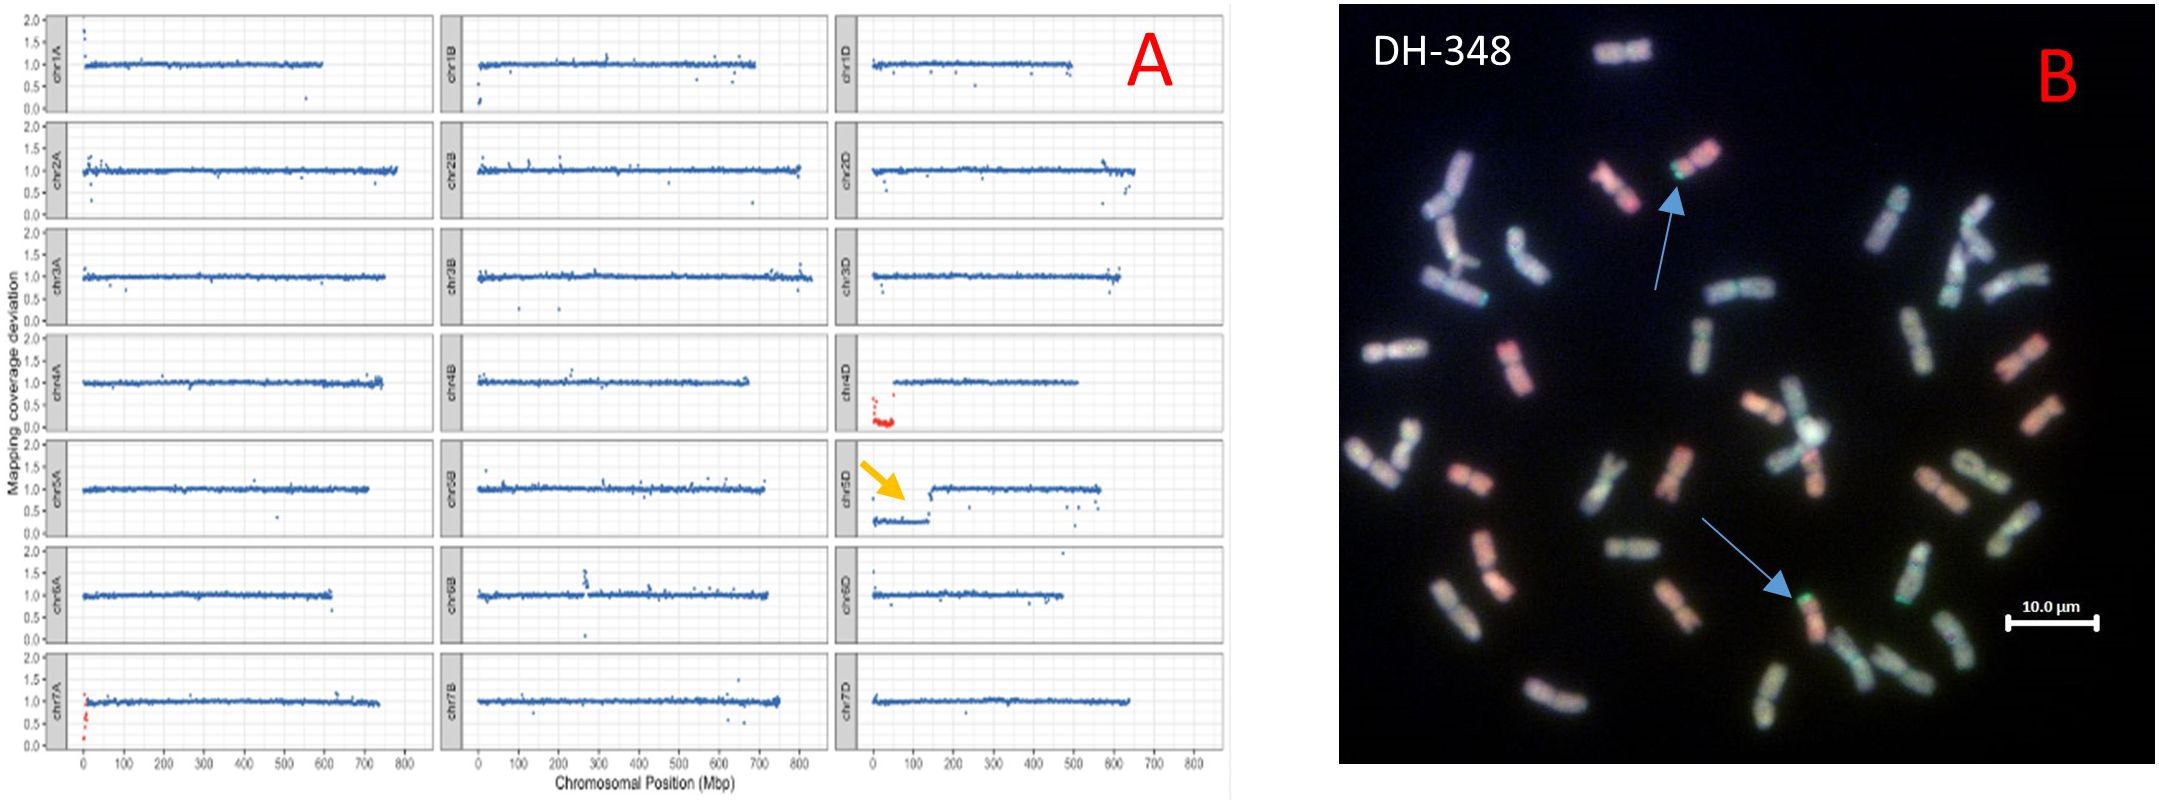
Figure 1 (A) Sequencing visualisation of DH-348 showing the Am. muticum segment introgressed on wheat Chr 4D and on Chr 7A (Am. muticum chromosomes in red blocks, wheat chromosomes in blue blocks), and a monosomic deletion on wheat Chr 5D (yellow arrow). (B) GISH image of metaphase spreads from roots of DH-348 showing the A, B, D and T genomes (A genome - green, B genome - blue, D genome – red, T genome - gold). The blue arrows indicate the site of Am. muticum introgressions.
Analysis of T. urartu DH-254 showed two segments of T. urartu recombined with the 5A chromosome of wheat. The segments were 76.40 and 28.77 Mbps. Sequence analysis also showed that a portion of chromosome 5A had duplicated and translocated to Chr 5D to replace the 5DL chromosome portion (Figure 2A). GISH analysis did not validate the presence of the 5Au segments translocated to the 5A chromosome of wheat (Figure 2B) because the probe used for detecting the A genome of wheat is prepared from the wheat progenitor, T. urartu and thus in wheat/T. urartu introgression lines, the probe detects both the A and Au genomes (Grewal et al., 2021).
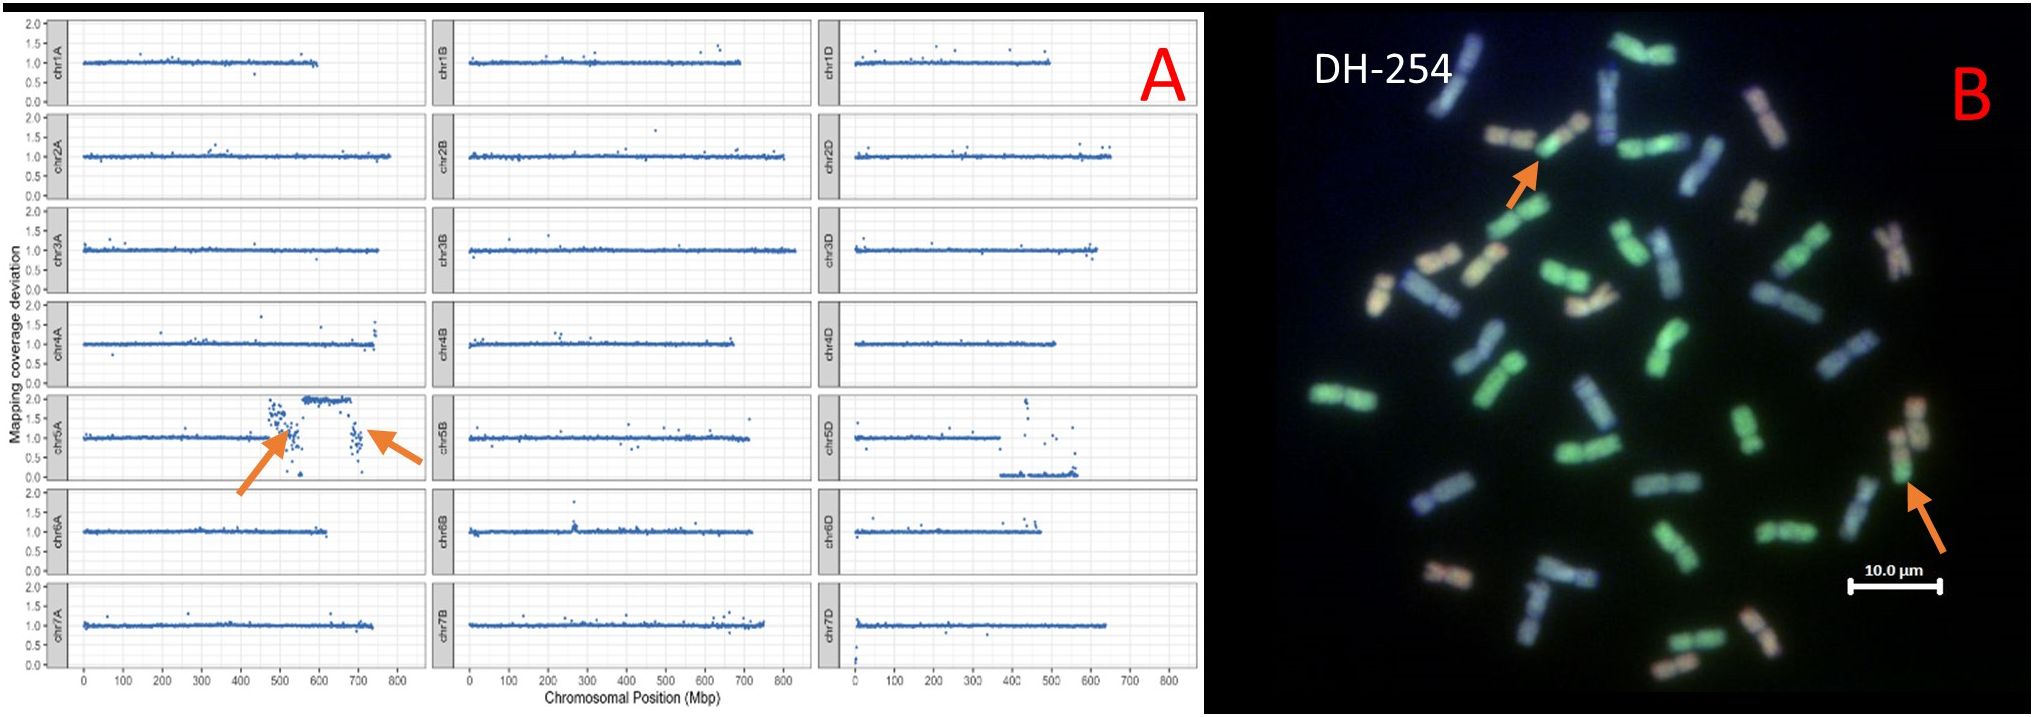
Figure 2 (A) Sequencing visualisation of DH-254 showing T. urartu segments introgressed on wheat Chr5A (shown by orange arrows) and the 5D-5A intergenomic recombination shown by the drop in chromosome block on chromosome 5D. (B) GISH image of metaphase spreads from roots of DH-254 showing the A, B and D genomes (A genome - green, B genome - blue, D genome – red). Orange arrows show the 5A-5D recombinant chromosomes.
In the initial round of crossing, 262 and 120 F1 seeds were obtained for the Malawian wheats/Am. muticum DH-348 and Malawian wheats/T. urartu DH-254 combinations, respectively. Backcrossing selected F1 seeds generated 362 and 190 BC1 seeds, and Self-fertilisation of the BC1 plants generated 11,058 Malawian wheat/Am. muticum DH-348 and 5,300 Malawian wheat/T. urartu DH-254 BC1F2 seeds. Further self-fertilisation/bulking of the seeds resulted in the generation of 46,950 Malawian wheat/Am. muticum DH-348 and 16,535 Malawian wheat/T. urartu DH-254 BC1F3 seeds. Among the Malawian wheat/T. urartu DH-254 cross combinations, three combinations (T. urartu DH 254 ×Kadzibonga, Kadzibonga ×T. urartu DH 254 and Nduna × T. urartu DH 245) were lost at F1 and BC1F2 due to the inability to produce seed, and failure of the selected seeds to germinate, respectively. Among the Malawian wheat/Am. muticum DH-348 cross combinations, only one combination (Am. muticum DH 348 × Kenya nyati) was lost at BC1F2 due to failure of the selected seeds to germinate.
One hundred and eighty-two chromosome-specific KASP markers were tested on the parental line, three of the Am. muticum DH-348, three of the Am. muticum accession 2130012 and the three Malawian wheat varieties. Eight to ten markers were selected for each linkage group (1A-7A, 1B-7B and 1D-7D) based on their position and results from previous work (King et al., 2019). The markers were designated codes between WRC1001-WRC1329 (Grewal et al., 2020) and WRC1330-WRC169 (Grewal et al., 2022). Genotyping of 80 wheat/Am. muticum BC1 plants with group 4 (WRC1314, WRC1315, WRC1316 and WRC1784) and group 7 markers (WRC2020 and WRC2104), detected the presence of heterozygous Am. muticum segments on wheat Chr 4D and Chr 7A in 19 lines, the 4D segment in 15 lines, and the 7A segment in 13 lines. To validate the genotyping results, multi-colour GISH was performed on 40 of 47 BC1 plants heterozygous for the Am. muticum segments. GISH analysis of the 19 lines with the 4T and 7T segments validated the presence of a heterozygous segment on the distal end of the short arm of wheat Chr 4D but not the 7T segment because of the small size (Figure 3). Lines with only the 4T segment also showed heterozygous segments on wheat chromosome 4D, whilst lines with only the 7A segment were not verified by GISH. Subsequent genotyping of 85 BC1F1 plants obtained from selfing the heterozygous BC1 population detected 25 lines homozygous for the 4T segment on Chr 4D, 14 lines homozygous for the 7T segment on Chr 7A and 2 lines (BC1F1 64-2 and BC1F1 61-2) with both the segments on Chr 7A and Chr 4D homozygous. Further analysis showed that 26 lines remained heterozygous for the segment on Chr 4D while the rest of the lines had lost the segments (Table 1). To validate these results mcGISH was performed on 31 of the 41 BC1F1 plants homozygous for the Am. muticum segments. The presence of a pair of 4T segments in the lines observed with only a 4T/4D recombination was also validated in 23 of the 25 introgression lines, and no segment was detected in seven of the fourteen lines with the 7T/7D recombination. In the lines with both the 4T and 7T segments, GISH validated the presence of a pair of the 4T in line BC1F1 64-2 whilst line BC1F1 61-2 could not be validated, because the roots obtained did not give good metaphase spreads. GISH also showed that 25 of the 31 BC1F1 lines analysed had maintained the euploid chromosome condition, while five lines had a missing D chromosome, likely inherited from the monosomic deletion observed in the sequence of the parental line DH-348. Line BC1F1 58-1 showed the entire chromosome set, plus an extra B chromosome (Figure 4).
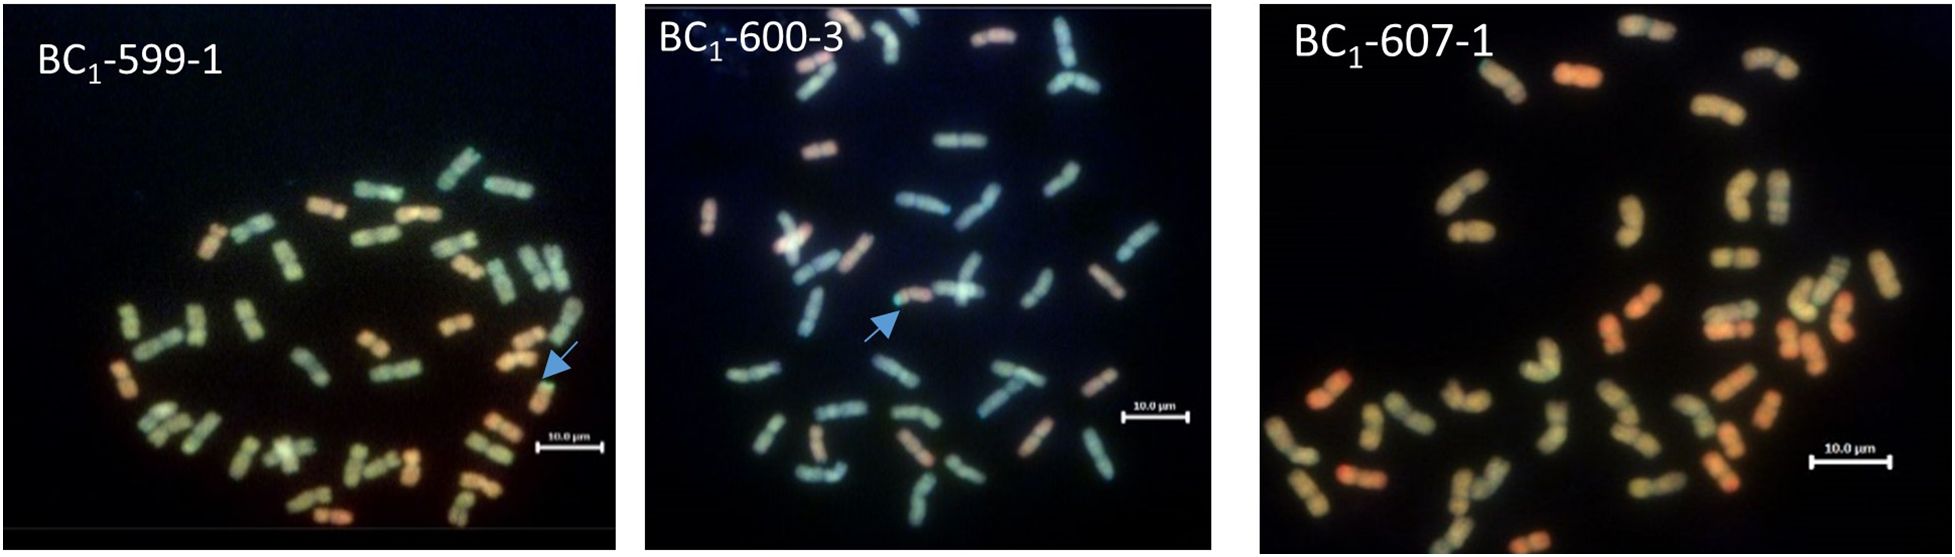
Figure 3 GISH images of BC1 root metaphase spreads showing the A, B, D and T genomes (A genome - green, B genome - blue, D genome – red, T genome - gold). The blue arrows indicate the site of Am. muticum (T) introgressions into Chr 4D of wheat. GISH image for line BC1-607-1 shows a plant where KASP showed a segment on wheat chromosome 7A, and GISH showed no segment present.
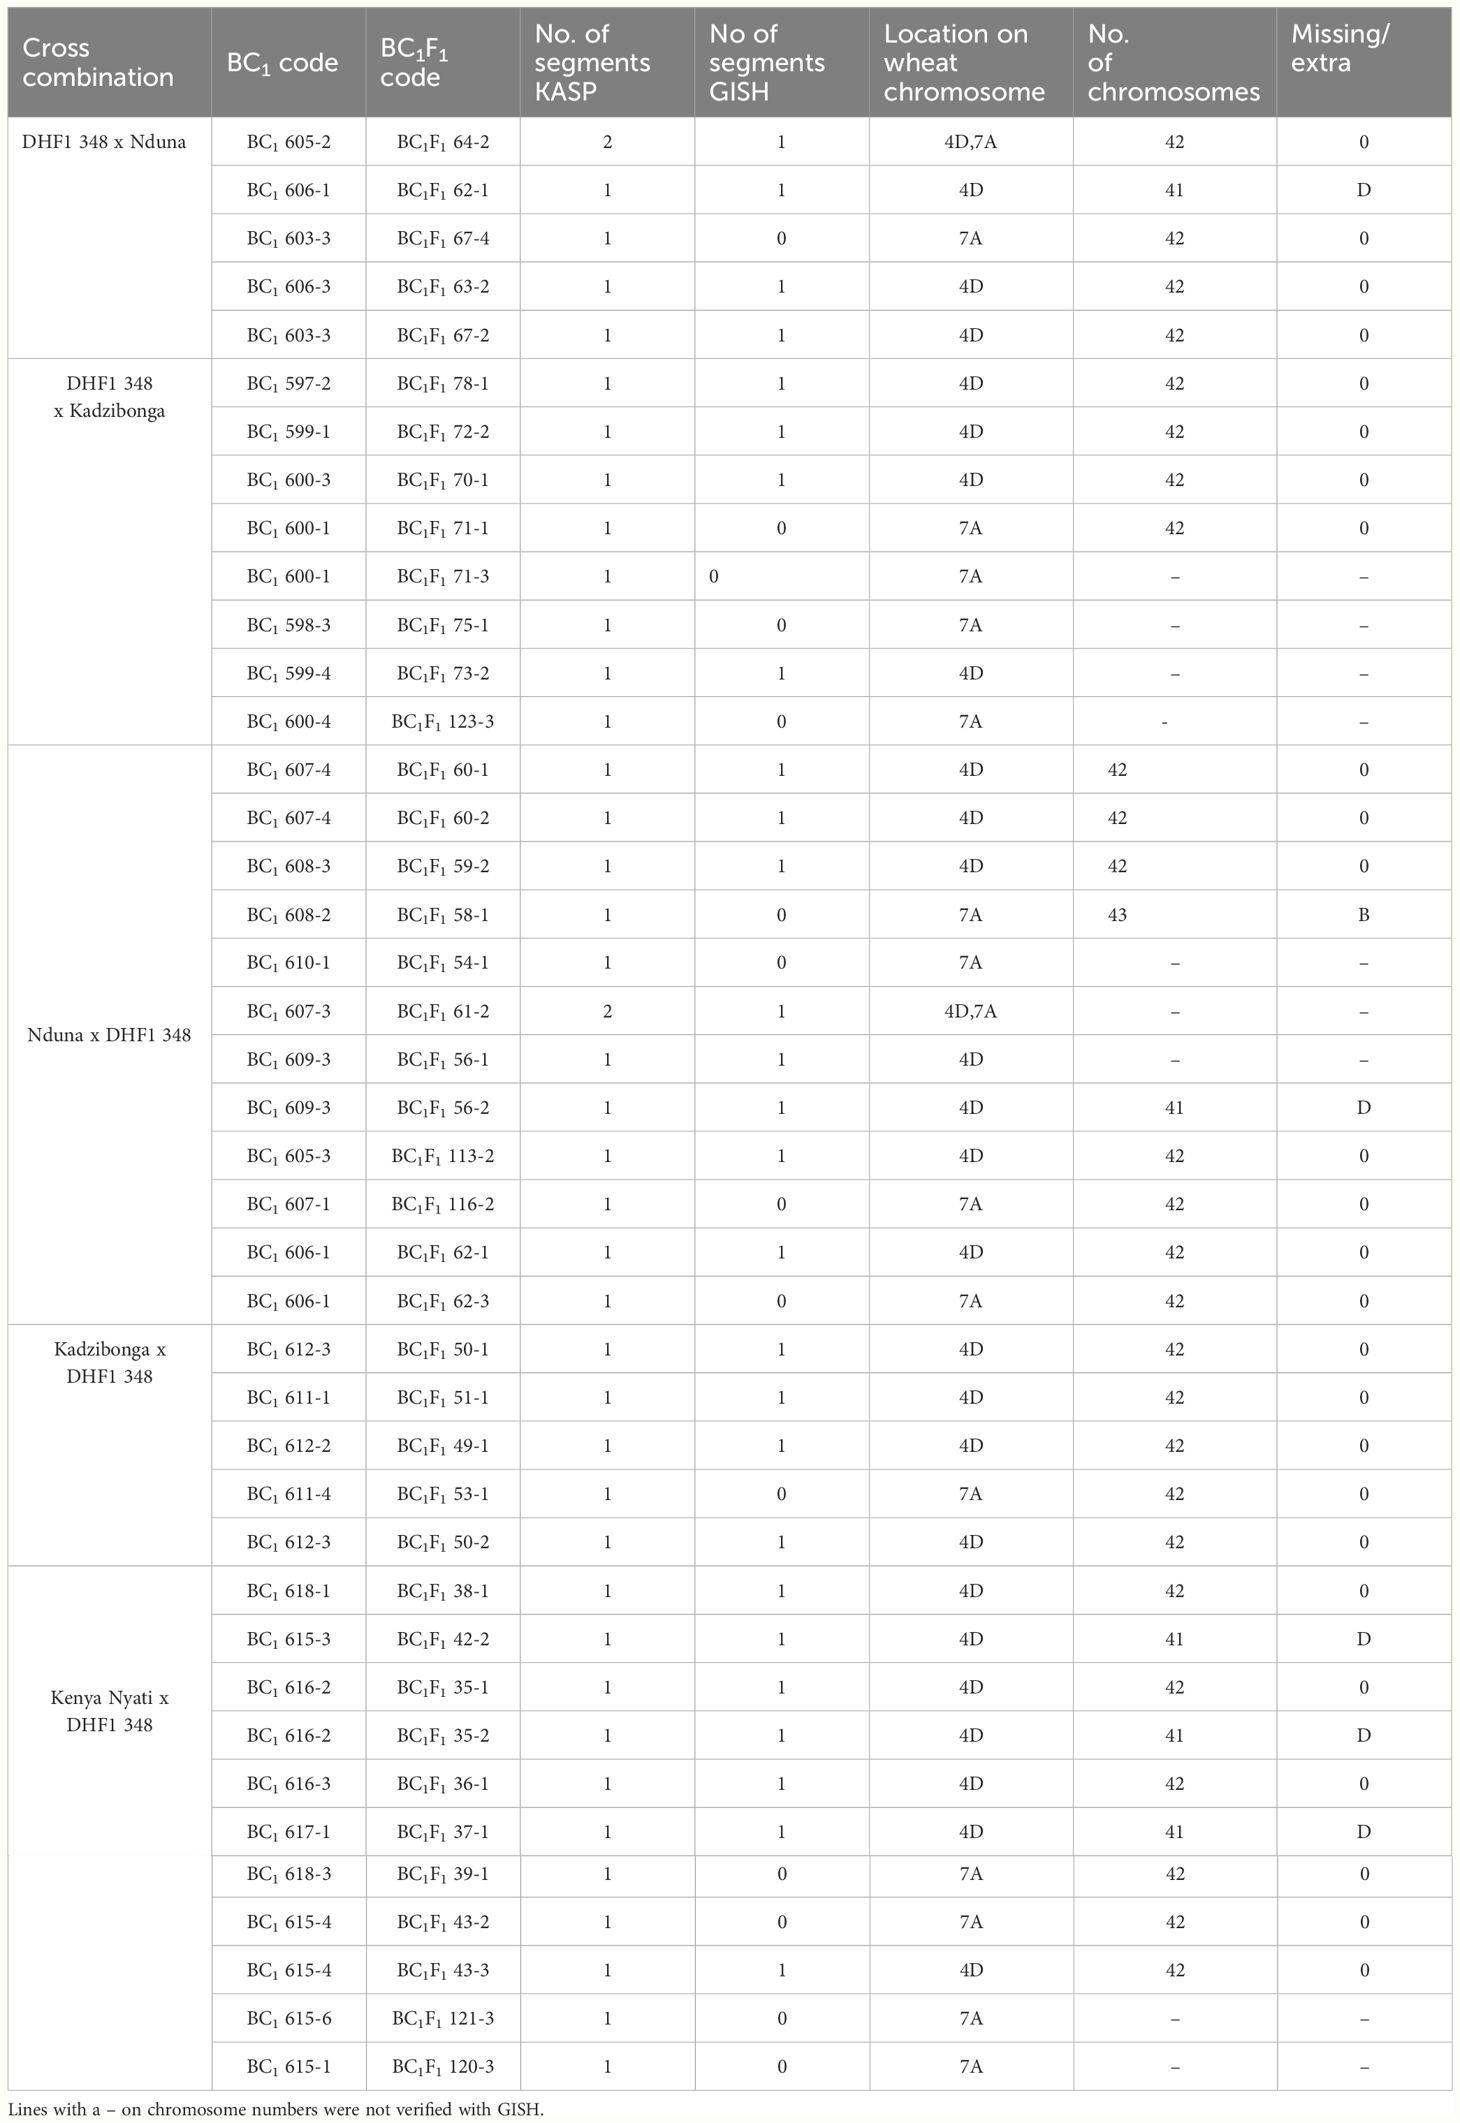
Table 1 A list of Malawian wheat/Am. muticum DH-348 BC1 and BC1F1 lines showing number of Am. muticum segments detected by chromosome specific KASP markers and verified by GISH, location of the segments on the wheat chromosomes and number of chromosomes revealed by GISH analysis.
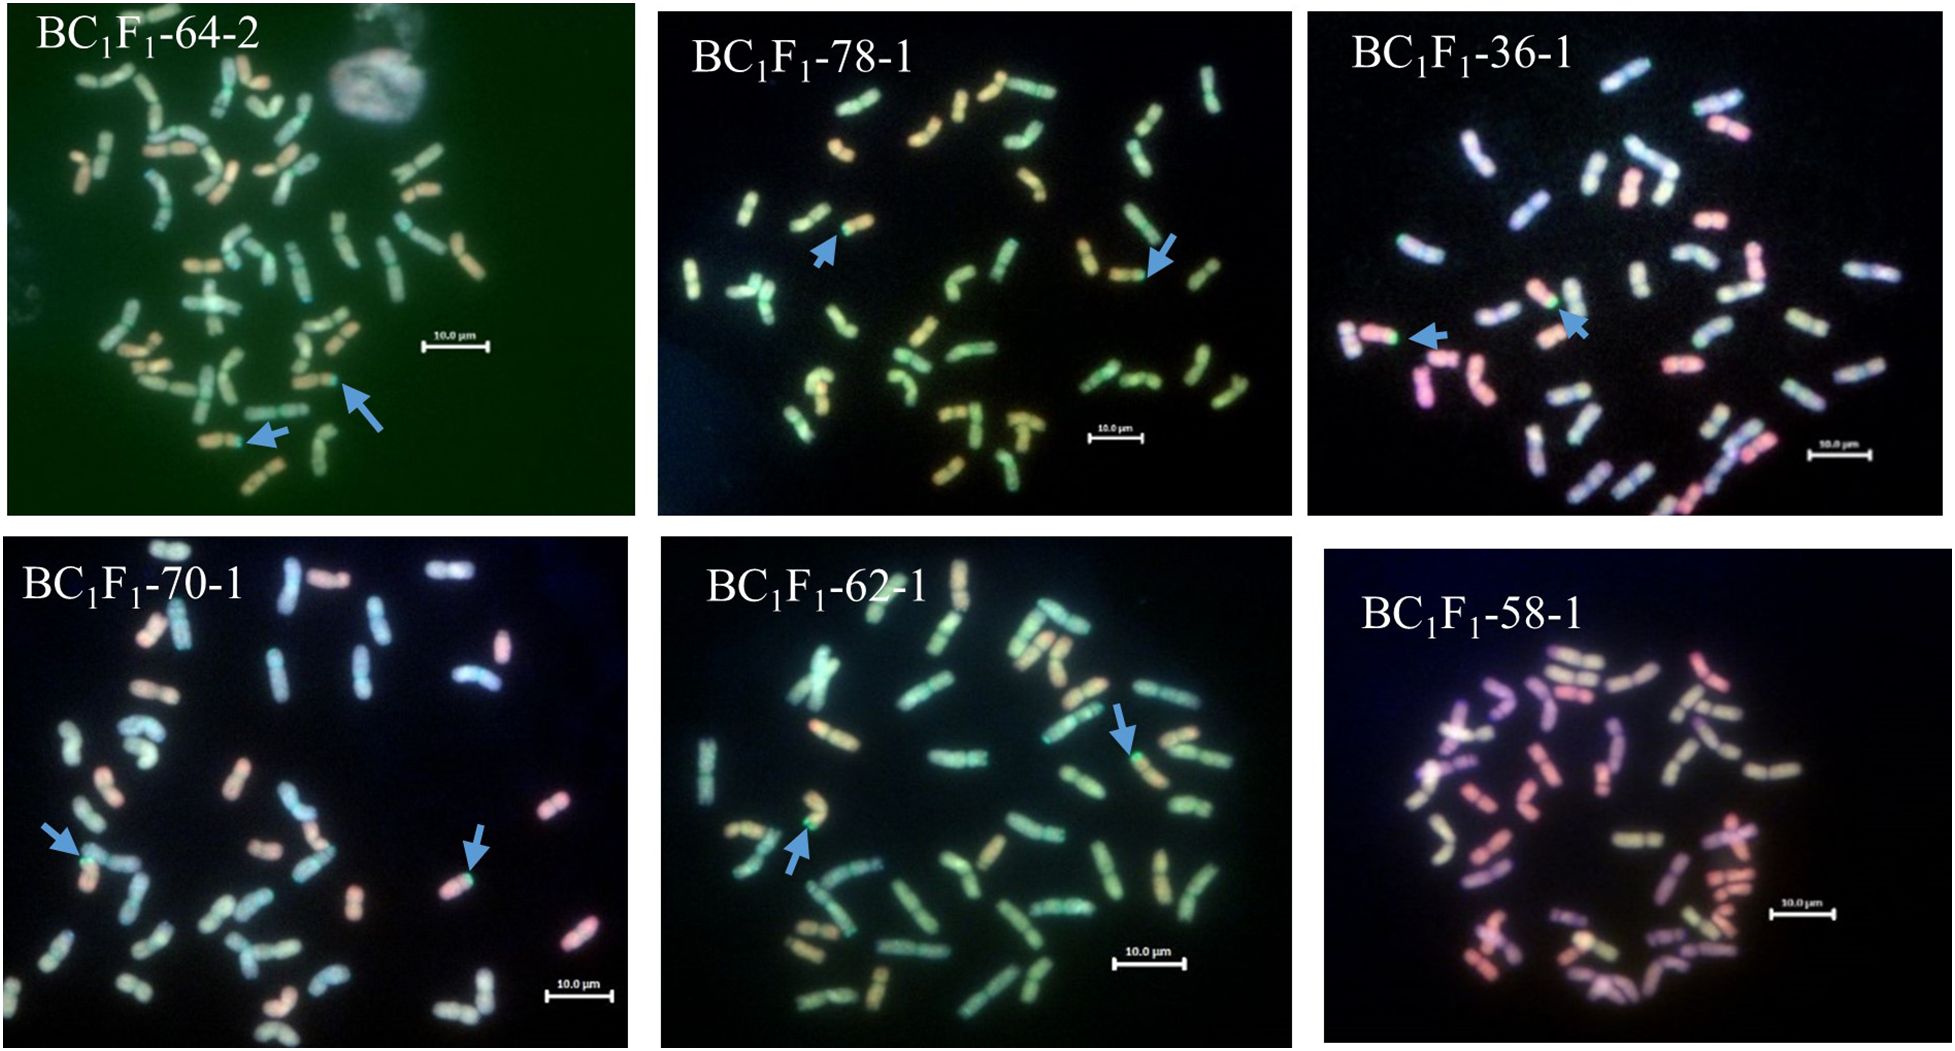
Figure 4 GISH images of BC1F1 root metaphase spreads showing the A, B, D and T genomes (A genome - green, B genome - blue, D genome – red, T genome - gold). The blue arrows indicate the site of Am. muticum (T) introgressions into Chr 4D of wheat. BC1F1-64-2 shows only a pair of 4T segments on wheat Chr 4D, GISH did not capture the other set of 7T segments revealed by KASP. BC1F1-78-1, BC1F1-36-1 and BC1F1-70-1 show euploid sets of chromosomes each with a pair of 4T segments on wheat Chr 4D. BC1F1-62-1 shows an anueploid (41 with a missing D chromosome) metaphase spread with a pair of 4T segments on Chr 4D. BC1F1-58 has a 7A segment undetectable by GISH; however, this shows an aneuploid set of chromosomes (43 with an extra B chromosome).
Malawian wheat/T. urartu DH-254, three of the T. urartu accessions, three of the T. urartu DH-254 and the three Malawian varieties were genotyped using 144 chromosome-specific KASP markers polymorphic between wheat and T. urartu. Markers were selected based on their availability and results from the previous work (Grewal et al., 2018a). Genotyping of 35 BC1 plants with the group 5 markers within the region of the 76.40 Mbps segment (WRC605 and WRC608) gave heterozygous calls for the T. urartu segment on wheat Chr 5A in 31 lines and a homozygous wheat call on the remaining lines. The marker detecting the 5Au smaller segment (28.7 Mbps) was unable to detect the DH-254 controls, and thus none of the BC1 plants could be scored for the small segment. Subsequent characterisation of 81 BC1F1 plants for the larger 5Au segment detected 14 homozygous lines, 50 heterozygous lines and 21 lines with no segment (Table 2). Among the 14 homozygous lines, only 11 grew to maturity, produced seed, and could be carried forward to the next generation. GISH analysis of selected BC1 and BC1F1 did not validate the presence of the 5Au segment recombined with the 5A chromosome of wheat. However, GISH detected the presence of the 5A-5D translocation initially observed in both the sequence visualisation and GISH image of the parental line (T. urartu DH-254). GISH analysis also revealed the number of chromosomes of all the introgression lines (Figure 5).
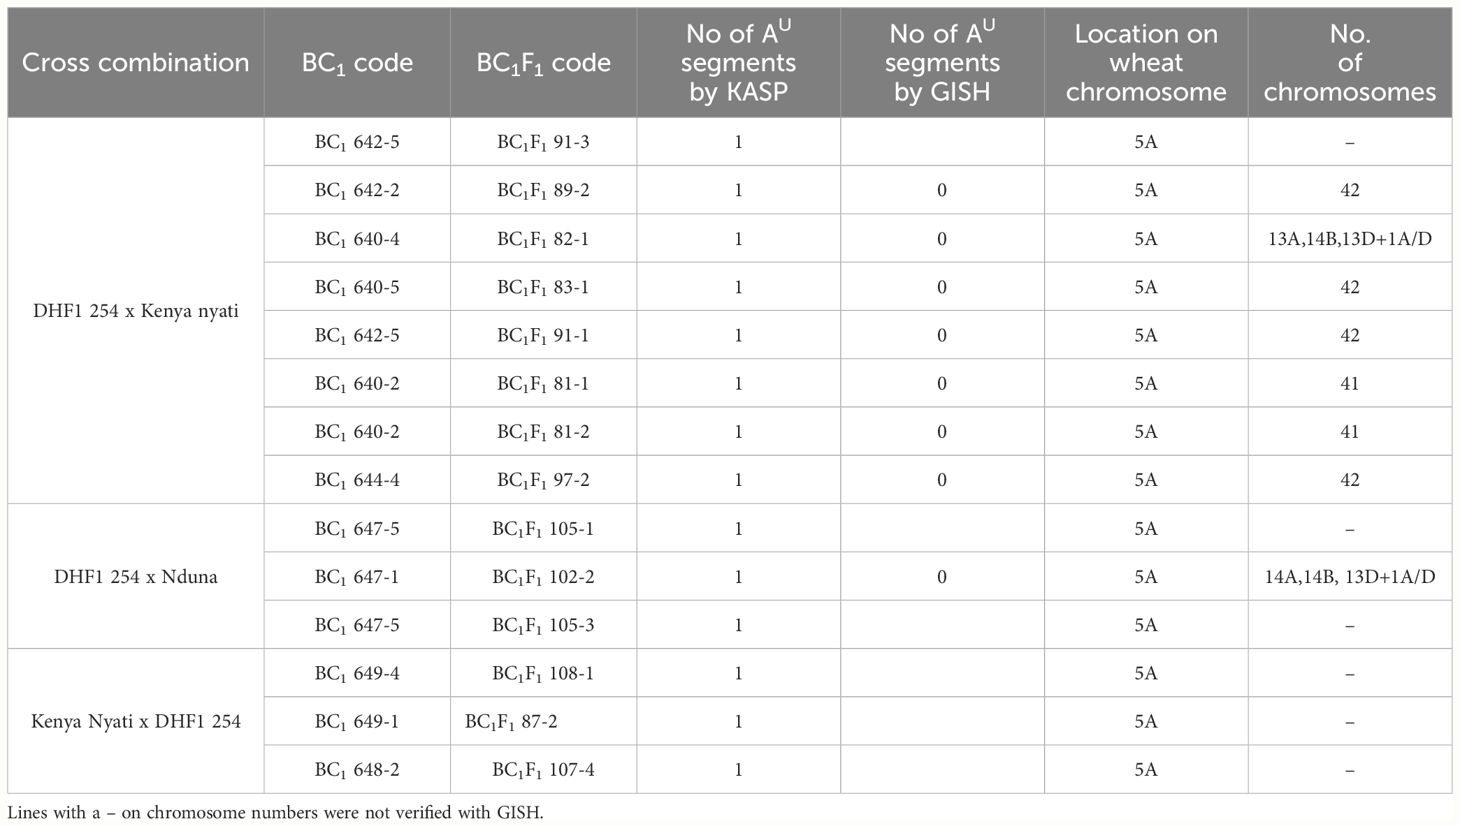
Table 2 A list of Malawian wheat/T. urartu DH 254 BC1 and BC1F1 lines showing number of T. urartu segments detected by KASP markers, their location on the wheat genome and number of chromosomes revealed by GISH analysis.
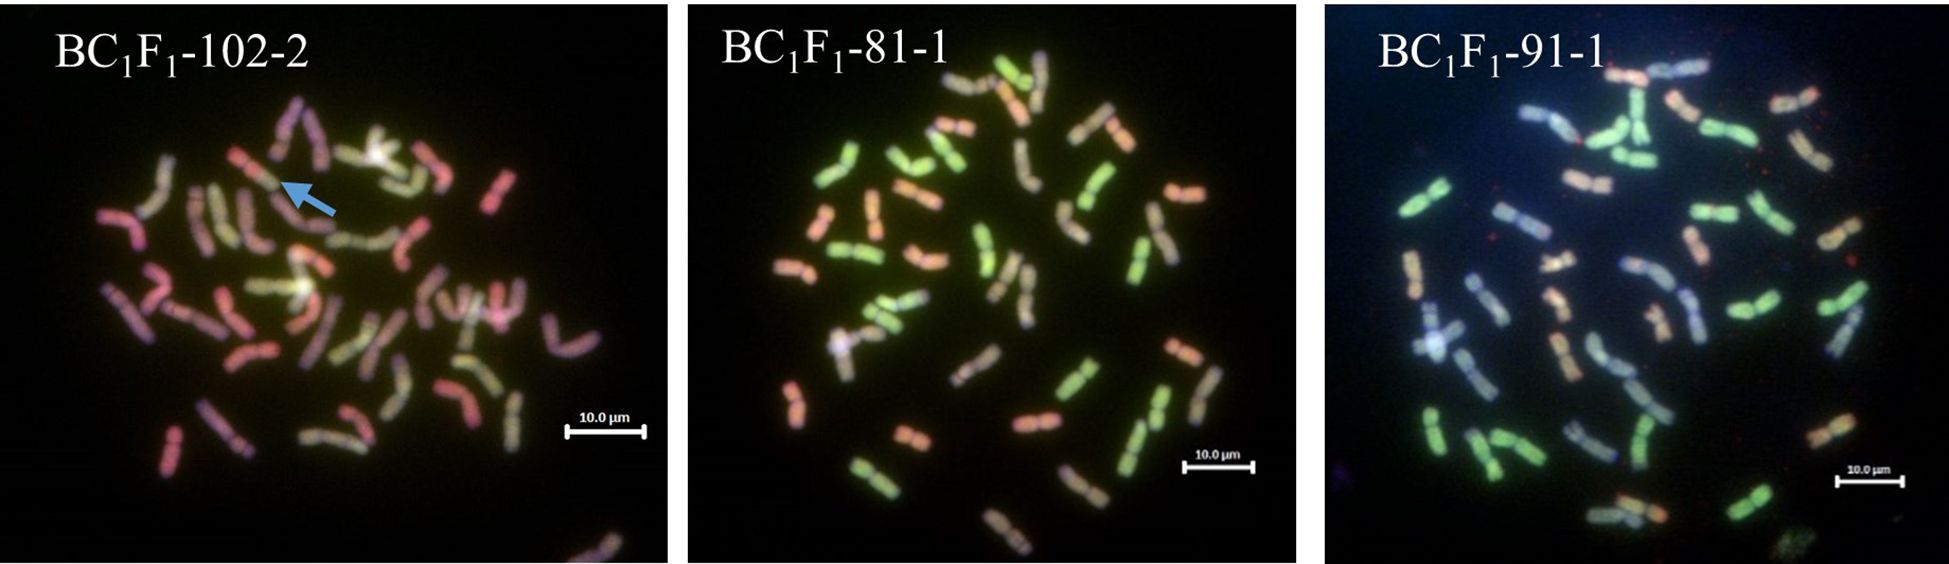
Figure 5 GISH images of metaphase spreads from the BC1F1 roots of Malawian wheat/T. urartu introgression lines showing the A, B and D genomes (A genome - green, B genome - blue, D genome – red). The blue arrow on BC1F1-102-2 shows the 5A-5D translocation.
Table 3 describes the soil physio-chemical properties of the soils at the experimental site. The soils were classified as clay loam, with an average soil pH of 6.7. DTPA-Zn and Fe were 0.3 and 7.7 mg kg-1 respectively. Soil analysis also showed that the soil samples had an average of 0.2% total nitrogen, 20.6 mg kg-1 available P and 67.4 mg kg-1 K.
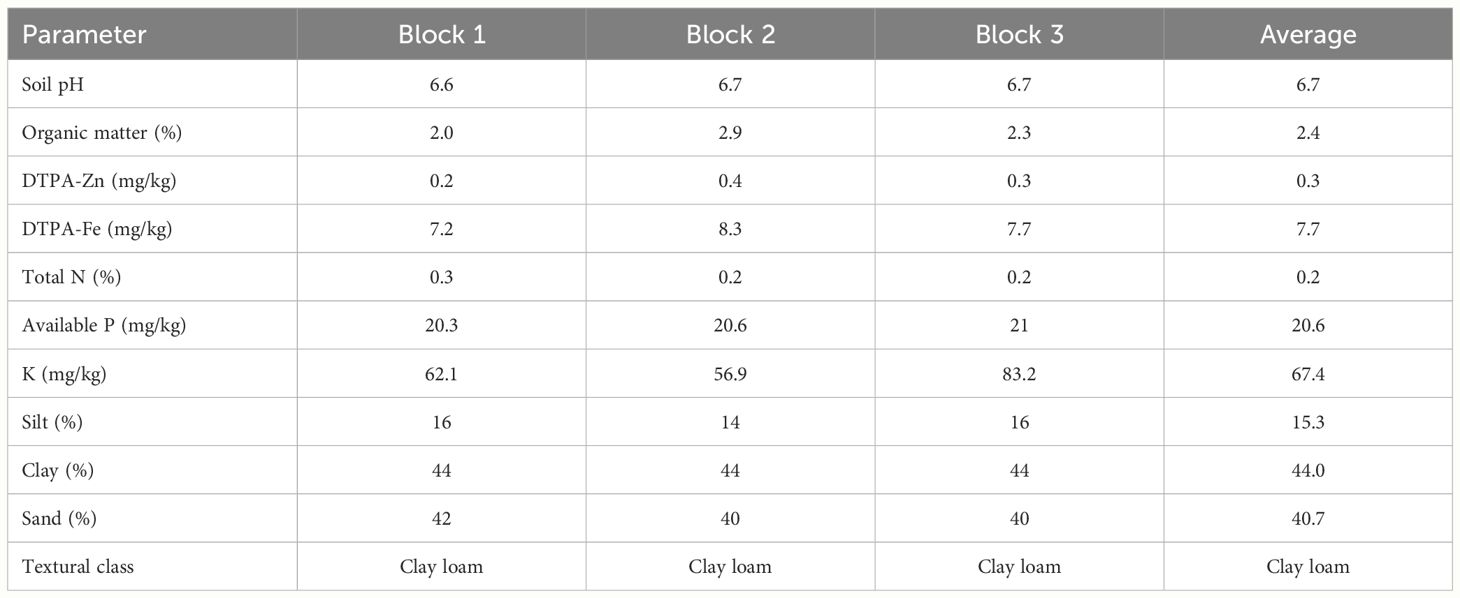
Table 3 Physio-chemical properties of soil samples collected from the three replicates of the experimental site.
Analysis of grain samples showed a significant variation in grain Zn concentrations (P<0.0001) among the 55 genotypes (Table 4). Grain Zn concentrations varied from 35.5-108.6 mg kg-1 with an overall mean of 57.9 mg kg-1. DH-348 had the highest grain Zn concentration of all the genotypes analysed with 108.6 mg kg-1, while BC1F3-30 had the highest grain Zn concentration of the BC1F3 introgression lines with 84.9 mg kg-1. Overall, 13% of the BC1F3 lines had Zn concentrations between 70-85 mg kg-1, 25% between 60-68 mg kg-1 and 43% between 50-59 mg kg-1. The three Malawian checks, Kenya nyati, Kadzibonga and Nduna had grain zinc concentrations of 42.0, 35.8 and 35.3 mg kg-1 respectively, and these were the lowest among all the genotypes, except for BC1F3-44, which had a concentration of 38.6 mg kg-1. Mineral analysis also showed a significant variation among the UK checks, with Pavon 76 having the highest concentration. Mineral analysis for T. urartu DH-254 was not conducted because the plants did not produce any seed.
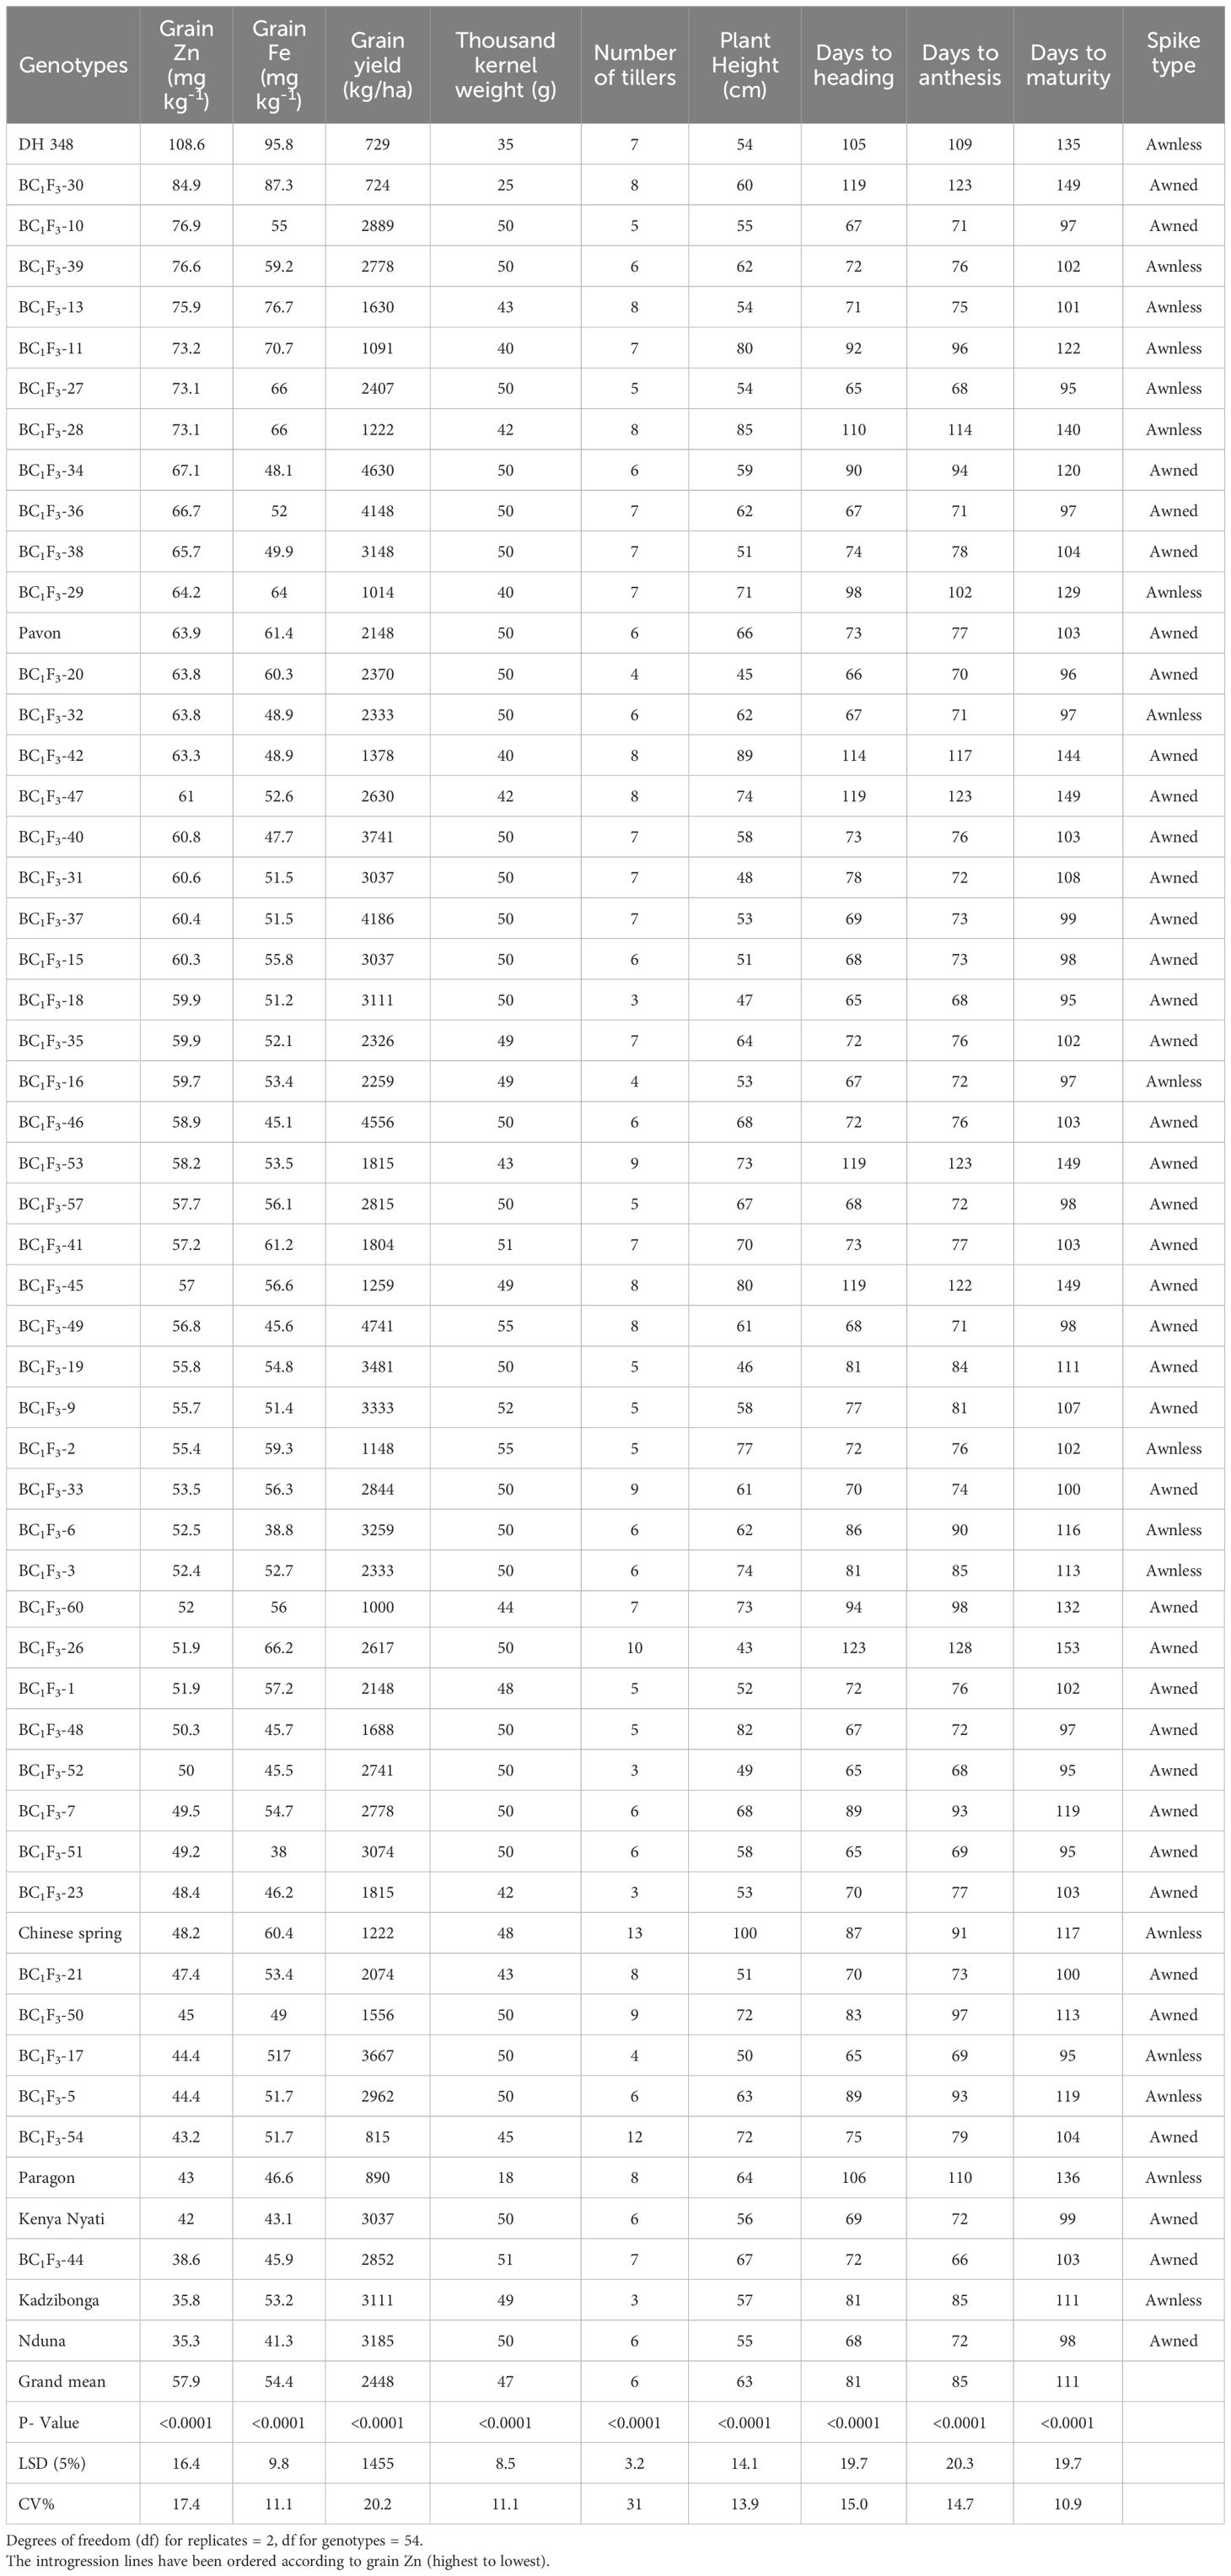
Table 4 Variation in grain zinc and iron concentration and associated grain yield, yield components and phenotypic and phenological traits of 37 Malawian wheat/DH-348 and 11 Malawian wheat/DH-254 BC1F3 introgression lines grown in 2022 winter season.
Significant variation (P<0.0001) was observed in the grain Fe concentrations of the 55 genotypes (Table 4). The Fe concentrations varied from 38.3-95.8 mg kg -1 with an overall mean of 54.2 mg kg-1. DH-348 showed the highest grain Fe concentration (95.8 mg kg -1) followed by BC1F3-30 (87.4 mg kg -1), BC1F3-13 (76.6 mg kg-1) and BC1F3-11 (70.7 mg kg-1) respectively. Overall, 6% of the BC1F3 introgression lines had Fe concentrations between 70-87 mg kg -1, 10% between 60-66 mg kg-1, 54% between 50-59 mg kg -1, and the remaining had Fe concentrations above 40 mg kg-1, with the exceptions of BC1F3-6 and BC1F3-51, which had 38.8 and 38.3 mg kg-1. The Fe concentrations of the Malawian checks, Kadzibonga, Kenya nyati and Nduna were 53.2, 42.0 and 35.3 mg kg-1 while Pavon 76, Chinese spring and Paragon had Fe concentrations of 61.4, 60.4 and 46.6 mg kg-1 respectively.
Grain yields varied significantly (P< 0.0001), ranging from 724-5741 kg ha-1, with an overall mean of 2448 kg ha-1 (Table 4). BC1F3-49, BC1F3-34 BC1F3-46, BC1F3-37, BC1F3-36, BC1F3-40, BC1F3-17, BC1F3-19, BC1F3-9 and BC1F3-6 yielded 4741, 4630, 4556, 4186, 4148, 3741, 3667, 3481, 3333 and 3259 kg ha-1 respectively. The yields of these 10 lines were higher than the highest yielding Malawian check Nduna, which had a yield of 3185 kg ha-1. Although Nduna showed the highest yield among the Malawian checks, Kadzibonga and Kenya nyati, and introgression lines BC1F3-38, BC1F3-18, BC1F3-51, BC1F3-15 and BC1F3-31 had statistically similar yields. Paragon had the lowest grain yield (890 kg ha-1) out of the three UK checks, while Pavon 76 and Chinese Spring had 1222 and 2148 kg ha-1 respectively. Grain yields for BC1F3-30 and DH-348 were 729 and 724 kg ha-1, and these were the lowest yields among all the genotypes. The thousand kernel weight varied (P<0.0001) from 18-55 g, with an overall mean of 47 g. BC1F3-49 and BC1F3-2 had the highest kernel weight (55 g each), followed by BC1F3-9 and BC1F3-26, both with 52 g. TKW for the majority of the BC1F3 introgression lines was 50 g and this was statistically comparable to all three Malawian checks, Pavon 76, and Chinese Spring. DH-348, BC1F3-30 and Paragon had the lowest TKW among all the genotypes. Significant variation (P<0.0001) was also observed in the days to flowering, days to heading and days to maturity (Table 4). Days to heading varied from 65-123, days to flowering 69-128 while days to maturity varied from 95-153. BC1F3- 26 BC1F3- 55 BC1F3-30, BC1F3-53, BC1F3-47 and BC1F3-45 had the longest time to heading, flowering and maturing, while BC1F3-18, BC1F3-52, BC1F3- 17, BC1F3-27 and BC1F3-51 took the shortest time. The majority of the BC1F3 introgression lines took 65-80 days to heading, 69-85 days to flowering, and 95-108 days to maturing. The number of tillers were significantly variable (P< 0.0001), varying from 3-13 with an overall mean of six. Chinese Spring had the highest number of tillers (13), followed by BC1F3-54 with 12 tillers. Among the introgression lines, 22, 20, 18 and 16% had seven, six, eight and five tillers respectively. Plant height of the 55 genotypes was also highly significant (P<0.0001), ranging from 33-100 cm. Plant height for the majority of the BC1F3 lines varied from 50-70 cm, with a few lines between 71-89 cm. Chinese Spring grew to 100 cm, whilst heights of Paragon and Pavon 76 were 64 and 66 cm, respectively. Nduna, Kenya nyati and Kadzibonga had heights of 55, 56 and 57 cm, respectively. It was observed that amongst the BC1F3 introgression lines, 72% of the spikes had awns while 28% were awnless. Among the checks, Paragon, Chinese Spring, DH-348 and Kadzibonga had awnless spikes, while Pavon 76, Kenya nyati and Nduna showed awned spikes.
Grain Zn concentration positively and significantly correlated with grain Fe (r = 0.72, P =<0.0001. However, grain Zn showed a weak negative correlation with both TKW (r = -0.33, P<0.0001) and grain yield (r = -0.25, P = 0.009). Grain Fe showed a weak positive correlation with days to heading (r = 0.35, P< 0.0001), days to anthesis (r = 0.35, P<0.0001) and days to maturity (r = 0.35, P< 0.0001). Correlation analysis also showed that grain Fe negatively and significantly correlated with both TKW (r = -0.39, P<0.0001), and grain yield (r = 0.47, P<0.0001). TKW positively correlated with Grain yield (r = 0.530, P<0.0001), and there were strong positive correlations between days to heading, flowering and maturity (Figure 6).
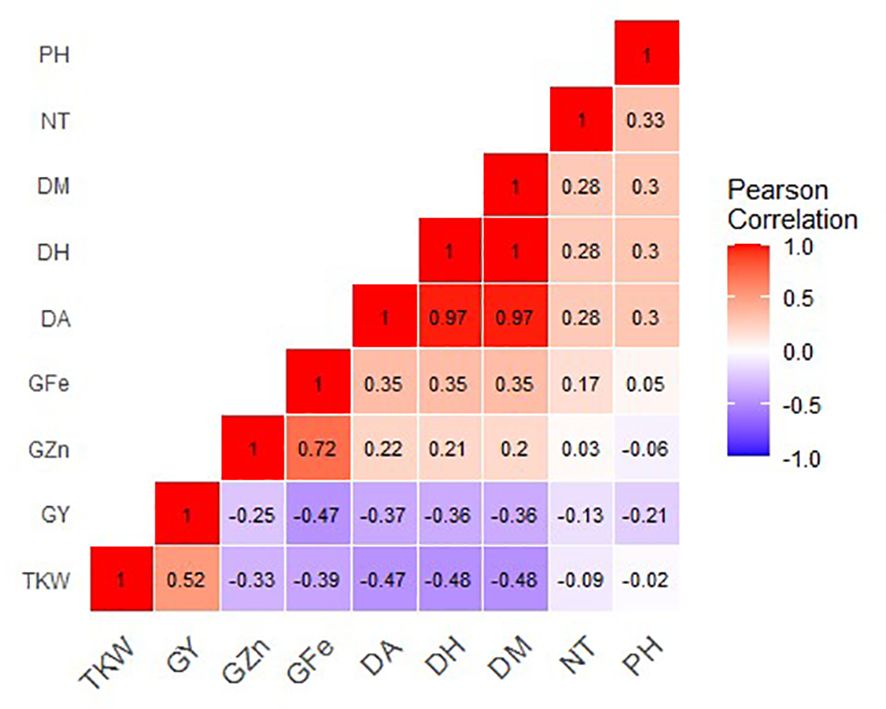
Figure 6 Correlation coefficients for grain mineral-elements and phenotypic and phenological data of 37 Malawian wheat/Am. muticum and 11 Malawian wheat/T. urartu BC1F3 introgression lines grown in 2022 winter season. G Zn, grain zinc; G Fe, grain iron; NT, number of tillers; DH, days to heading; DF, days to flowering; PH, plant height; TKW, thousand kernel weight; GY, grain yield.
The use of chromosome introgressions from distantly related or unrelated species that carry genetic variation for high mineral concentration of essential elements is one of the approaches that can be utilised to increase micronutrient concentration in crops (Velu et al., 2019). Recently, high Zn wheat varieties developed from crossing the wheat progenitor Ae. tauschii with T. durum/wild tetraploid T. dicoccum via synthetic wheat, were released in Pakistan and India (Singh et al., 2017; Velu et al., 2019). Screening of rye translocation lines in a wheat backgrounds also showed significantly higher Zn and Fe concentration above their recurrent parents (Velu et al., 2019). At the Nottingham WRC, a number of Am. muticum and T. urartu introgression lines developed for trait analysis were shown to have potential for increased grain Zn and Fe above their recurrent parents, and T. urartu, DH-254 and Am. muticum, DH-348 showed the highest grain Zn and Fe concentrations (Guwela, 2023; Guwela et al., 2024). The two lines were therefore selected for the current study based on their high Zn and Fe concentrations.
To transfer the Am. muticum (TT) and T. urartu (AuAu) introgressions, which potentially increased mineral nutrients, from the DH lines into Malawian wheat varieties, hexaploid wheat/Am. muticum DH-348 and hexaploid wheat/T. urartu DH-254 were crossed with the three Malawian wheat varieties (Kadzibonga, Nduna and Kennya nyati). A combination of whole genome sequencing, KASP analysis and genomic in situ hybridisation (GISH) revealed a 4T and a 7T segment of Am. muticum on wheat chromosome 4D and 7A of Am. muticum DH-348. Whole genome sequencing and KASP analysis also revealed the presence of two 5Au segments on wheat chromosome 5A of T. urartu DH-254. A crossing program for Am. muticum DH-348 and T. urartu DH-254 with Kadzibonga, Nduna and Kenya nyati resulted in the generation of forty-one Malawian wheat/Am. muticum BC1F3 introgression lines with both the 4T and 7T segments, 4T segments only, and 7T segments only. Eleven Malawian wheat/T. urartu BC1F3 introgression lines with the 5Au segment were also generated. The availability of high-throughput genotyping technologies has enabled the process of tracking wild chromosome segments in a wheat genetic background. Through a combination of whole genome sequencing, KASP genotyping with chromosome specific markers and GISH, a clear picture of the genetic make-up of the donor parents was revealed. This made it easier to track the chromosome segments though the breeding pedigree.
The BC1F3 introgression lines carrying Am. muticum and T. urartu chromosome segments in the three Malawian wheat genetic backgrounds were phenotyped for grain Zn and Fe concentrations, and related agronomic traits under field conditions in Malawi. Soil samples collected at the trial site showed that the soils could be classified as Zn-deficient (Noulas et al., 2018; De Groote et al., 2021). Grain Zn concentration varied widely among the introgression lines, with 98% (47) of the lines showing a grain Zn concentration above Chinese Spring, Paragon (the wheats in the background of DH-348), and the three recurrent parents/Malawian checks (Kenya nyati, Kadzibonga and Nduna), and 80% (38) of these improved in grain Zn concentration up to 50% above Kadzibonga and Nduna. Although 10% of the BC1F3 introgression lines had grain Zn between 70-80 mg kg -1, all of them had lower yields than the potential yield of the three Malawian checks (~3000 kg ha-1). However, one line (BC1F3-10) had a grain yield only slightly lower (2889 kg ha-1) than the Malawian checks, with a good combination of increased grain Zn and Fe concentrations. The number of crosses could have affected total grain yield of the introgression lines. Due to limited time, the two DH lines had only been crossed twice to the Malawian genotypes. Therefore, a quarter of the background of the introgression lines was still Chinese spring/Paragon, which are not adapted to Malawian conditions. Crossing the most promising lines four more times with the Malawian wheat varieties to remove all Chinese Spring/Paragon from the background will likely improve their yields/agronomic performance. Previous studies have also shown trade-offs between grain yield and grain Zn concentration (Liu et al., 2014; Gashu et al., 2021; Velu et al., 2022; Hasheminasab et al., 2023). Xia et al. (2023) suggested that improving agronomic management, including appropriate N fertilization and rotation can achieve high yield while ameliorating the dilution of grain Zn density in wheat. A global meta-analysis of the effects of nitrogen fertilization effects on grain Zn and Fe of major cereal crops also revealed that trade-offs between grain Zn and Fe and grain yield were higher at lower N application compared to higher N application (Zhao et al., 2022). 23% of the introgression lines (BC1F3-34, BC1F3-36, BC1F3-38, BC1F3-40, BC1F3-31, BC1F3-37, BC1F3-15, BC1F3-46, BC1F3-19, BC1F3-9 and BC1F3-6) showed a good combination of grain Zn concentration and grain yield. Grain yield of these lines was similar or exceeded most of the local checks, ranging from 3037 to 4630 kg ha-1, with Zn concentration ranging from 53-67 mg kg-1, which represents a 16-30 mg kg-1 improvement in grain Zn from Nduna and Kadzibonga and 11-25 mg kg-1 from Kenya nyati, Paragon and Chinese Spring. Interestingly, 10 of the 11 lines were awned, with a maturity period between 97-120 days, making them more suited to the SSA environments. Ten of the 11 lines carry either the 4T or 7T segments from Am. muticum, and only one carries the 5Au segment from T. urartu. Although most of the lines with the T. urartu had increased grain Zn concentrations, most of them were long duration with yields much lower than the Malawian checks. This could be an effect of the size of the 5Au segment, carrying along genes that negatively affect the performance of the introgression lines. During the period of crossing, the T. urartu donor parent (DH-254) was shown to have longer days to heading and flowering, which affected the number of crosses made, as the heading and anthesis did not coincide with that of the early maturing recurrent parents. Among the 23% (11) high Zn, high yield introgression lines, 64% (7) lines also had an 8-12 mg kg -1 higher Fe concentration than the recurrent parents Nduna and Kenya nyati, although they did not hit the HarvestPlus target for Fe biofortification in wheat (60 mg kg -1). Of the 48 BC1F3 introgression lines, only nine lines reached ~60 mg kg -1. However, the yields of the lines were much lower (< 2000 kg ha-1) than the yields of the Malawian checks. Although previous studies in wheat and other cereals have shown very low positive or a negative correlation between grain Zn and Fe (Morgounov et al., 2007; Joshi et al., 2010; Kanatti et al., 2014), this study showed a significant positive correlation between the two variables implying that the two can be improved simultaneously. Similar findings were previously reported (Velu et al., 2011; Crespo-Herrera et al., 2016; Velu et al., 2019; Thapa et al., 2022; Velu et al., 2022). The significant negative correlations between grain Zn and TKW/yield and Fe and TKW/yield implies that an increase in Zn and Fe concentration is associated with decreased TKW and yields. Similar results were reported previously (Velu et al., 2011; Liu et al., 2014; Velu et al., 2019; Thapa et al., 2022; Velu et al., 2022). Liu et al. (2014) showed that for every 1000 kg ha−1 increase in grain yield, Fe concentration decreased by 2.1 mg kg−1 for spring wheat, and Zn concentration decreased by 0.9 mg kg−1 due to dilution effects. The positive weak correlation between grain Fe and Zn concentration with crop phenological traits (days to heading, anthesis and maturity) tends to be weak, suggesting near-independence of these traits.
The results in this study show the possible significant impact of the 4T and 7T introgressions from Am. muticum and the 5Au introgression from T. urartu on the genetic biofortification of Malawian wheat varieties particularly with higher grain Zn and Fe concentration. Identifying candidate genes associated with the high accumulation of grain Zn and Fe will be useful for future work. Currently, sequencing of Am. muticum accessions and hexaploid wheat/Am. muticum introgressions lines are being undertaken at the University of Nottingham WRC. These will play a major role in gene identification. Further testing of introgression lines in replicated and multi-location trials will also be useful to measure stability, heritability, yields and other important agronomic traits. To date, early trait analyses of a small selection of lines carrying different Am. muticum and T. urartu introgressions have already revealed critical genetic variation for a range of traits. These include resistances to a range of diseases including all three wheat rusts in Am. muticum (Fellers et al., 2020), Septoria resistance and powdery mildew resistance, flowering morphology, and increased yield. These initial pilot experiments indicate the significant potential of the genetic variation that is carried by these wild relatives for future wheat improvement.
The original contributions presented in the study are publicly available. This data can be found here:PRJEB71366 and PRJEB70905/European Nucleotide Archive (ENA).
VG: Conceptualization, Data curation, Formal analysis, Investigation, Methodology, Software, Visualization, Writing – original draft. MM: Conceptualization, Project administration, Supervision, Visualization, Writing – review & editing. MBr: Conceptualization, Funding acquisition, Methodology, Resources, Supervision, Validation, Visualization, Writing – review & editing. MH: Conceptualization, Methodology, Supervision, Validation, Visualization, Writing – review & editing. JB: Conceptualization, Methodology, Supervision, Validation, Visualization, Writing – review & editing. SG: Writing – review & editing, Software, Methodology, Formal analysis, Data curation, Conceptualization, Supervision, Visualization. BC: Software, Methodology, Formal analysis, Data curation, Writing – review & editing, Investigation. AH: Writing – review & editing, Visualization, Supervision, Methodology, Data curation, Validation. CY: Writing – review & editing, Methodology, Supervision, Visualization. MBa: Writing – review & editing, Data curation, Investigation. LW: Writing – review & editing, Visualization, Supervision, Methodology, Formal analysis. JK: Conceptualization, Funding acquisition, Investigation, Methodology, Project administration, Resources, Supervision, Validation, Visualization, Writing – review & editing.
The author(s) declare financial support was received for the research, authorship, and/or publication of this article. This work was supported by a studentship funded by the Future Food Beacon of Excellence, University of Nottingham, and Rothamsted Research UK (VG, MBr, MH, JK), registered jointly at Lilongwe University of Agriculture and Natural Resources (JB, MBa, MM, VG). This work was also supported by the Biotechnology and Biological Sciences Research Council as part of the Designing Future Wheat (BB/P016855/1) (JK MH, CY and SG) and the Bill & Melinda Gates Foundation, through the GeoNutrition project (INV-009129) (MBr and LW).Rothamsted Research receives strategic funding from the Growing Health (BB/X010953/1) (MBr) Institute Strategic Programmes.
The authors would like to acknowledge Dr Liz Bailey, Dr Saul Vazquez Reina and Mr Ken Davis for supporting us through the process of mineral analysis. We would also like to acknowledge BBS/E/T/000PR9816 (NC1 - Supporting EI’s ISPs and the UK Community with Genomics and Single Cell Analysis) for data generation (AH and BC) and BB/CCG1720/1 for the physical HPC infrastructure and data centre delivered via the NBI Research Computing group and Norwich Research Park Biosciences Doctoral Training Partnership grant BB/M011216/1 (BC and AH).
The authors declare that the research was conducted in the absence of any commercial or financial relationships that could be construed as a potential conflict of interest.
All claims expressed in this article are solely those of the authors and do not necessarily represent those of their affiliated organizations, or those of the publisher, the editors and the reviewers. Any product that may be evaluated in this article, or claim that may be made by its manufacturer, is not guaranteed or endorsed by the publisher.
The Supplementary Material for this article can be found online at: https://www.frontiersin.org/articles/10.3389/fpls.2024.1346046/full#supplementary-material
Anderson, E. (1949). Introgressive hybridization (New York, Chapman and Hall, Ltd., London: John Wiley and Sons, Inc.), 01491177. doi: 10.5962/bhl.title.4553
Bouis, H. E. (2003). Micronutrient fortification of plants through plant breeding: can it improve nutrition in man at low cost? Proc. Nutr. Soc. 62, 403–411. doi: 10.1079/PNS2003262
Bouis, H. E., Hotz, C., McClafferty, B., Meenakshi, J. V., Pfeiffer, W. H. (2011). Biofortification: A new tool to reduce micronutrient malnutrition. Food Nutr. Bull. 32, S31–S40. doi: 10.1177/15648265110321S105
Bouis, H. E., Saltzman, A. (2017). Improving nutrition through biofortification: A review of evidence from HarvestPlus 2003 through 2016. Global Food Security-Agriculture Policy Economics Environ. 12, 49–58. doi: 10.1016/j.gfs.2017.01.009
Cakmak, I. (2008). Enrichment of cereal grains with zinc: Agronomic or genetic biofortification? Plant Soil 302, 1–17. doi: 10.1007/s11104-007-9466-3
Caulfield, L. E., Black, R. E. (2004). Zinc Deficiency. In Comperative quantification of health risks: Global and regional burden of diseases attributable to selected major risk factors. Ed. Majid, E., Lopez, A. D., Rodgers, A., Murray, C. J. L. World Health Organisation, Geneva. 1 (4), 257-279.
Chhuneja, P., Dhaliwal, H. S., Bains, N. S., Singh, K. (2006). Aegilops kotschyi and Aegilops tauschii as sources for higher levels of grain iron and zinc. Plant Breed. 125, 529–531. doi: 10.1111/j.1439-0523.2006.01223.x
Coombes, B., Fellers, J. P., GrewaL, S., Rusholme-Pilcher, R., Hubbart-Edwards, S., Yang, C., et al. (2022). Whole genome sequencing uncovers the structural and transcriptomic landscape of hexaploid wheat/Ambylopyrum muticum introgression lines. Plant Biotechnol. J. 21, 482–496. doi: 10.1111/pbi.13859
Crespo-Herrera, L. A., Velu, G., Singh, R. P. (2016). Quantitative trait loci mapping reveals pleiotropic effect for grain iron and zinc concentrations in wheat. Ann. Appl. Biol. 169, 27–35. doi: 10.1111/aab.12276
De Groote, H., Tessema, M., Gameda, S., Gunaratna, N. S. (2021). Soil zinc, serum zinc, and the potential for agronomic biofortification to reduce human zinc deficiency in Ethiopia. Sci. Rep. 11, 8770. doi: 10.1038/s41598-021-88304-6
FAO (2019). World food situation (Rome, Italy: Food and Agriculture Organization of The United Nations (FAO)). Available at: http://www.fao.org/worldfoodsituation/en/.
Farkas, A., Molnar, I., Dulai, S., Rapi, S., Oldal, V., Molnar-Lang, M. (2014). Increased micronutrient content (Zn, Mn) in the 3M(b)(4B) wheat - Aegilops biuncialis substitution and 3M(b).4BS translocation identified by GISH and FISH. Genome 57, 61–67. doi: 10.1139/gen-2013-0204
Fellers, J. P., Matthews, A., Fritz, A. K., Rouse, M. N., Grewal, S., Hubbart-Edwards, S., et al. (2020). Resistance to wheat rusts identified in wheat/Amblyopyrum muticum chromosome introgressions. Crop Sci. 60, 1957–1964. doi: 10.1002/csc2.20120
Gashu, D., Nalivata, P. C., Amede, T., Ander, L., Botomani, L., Broadley, M. R., et al. (2021). The nutritional quality of cereals varies geospatially in Ethiopia and Malawi. Nature 594, 71–76. doi: 10.1038/s41586-021-03559-3
Gibson, R. S., Ferguson, E. L. (1998). Nutrition intervention strategies to combat zinc deficiency in developing countries. Nutr. Res. Rev. 11, 115–131. doi: 10.1079/NRR19980008
Gomez-Galera, S., Rojas, E., Sudhakar, D., Zhu, C. F., Pelacho, A. M., Christou, P. (2010). Critical evaluation of strategies for mineral fortification of staple food crops. Transgenic Res. 19, 165–180. doi: 10.1007/s11248-009-9311-y
Graham, R., Senadhira, D., Beebe, S., Iglesias, C., Monasterio, I. (1999). Breeding for micronutrient density in edible portions of staple food crops: conventional approaches. Field Crops Res. 60, 57–80. doi: 10.1016/S0378-4290(98)00133-6
Grewal, S., Coombes, B., Joynson, R., Hall, A., Fellers, J., Yang, CY., et al. (2022). Chromosome-specific KASP markers for detecting Amblyopyrum muticum segments in wheat introgression lines. Plant Genome. 15(1):e20193. doi: 10.1002/tpg2.20193
Grewal, S., Guwela, V., Newell, C., Yang, C. Y., Ashling, S., Scholefield, D., et al. (2021). Generation of doubled haploid wheat-Triticum urartu introgression lines and their characterisation using chromosome-specific KASP markers. Front. Plant Sci. 12. doi: 10.3389/fpls.2021.643636
Grewal, S., Hubbart-Edwards, S., Yang, C., Devi, U., Baker, L., Heath, J., et al. (2020). Rapid identification of homozygosity and site of wild relative introgressions in wheat through chromosome-specific KASP genotyping assays. Plant Biotechnol. J. 18, 743–755. doi: 10.1111/pbi.13241
Grewal, S., Hubbart-Edwards, S., Yang, C. Y., Scholefield, D., Ashling, S., Burridge, A., et al. (2018a). Detection of T. urartu introgressions in wheat and development of a panel of interspecific introgression lines. Front. Plant Sci. 9. doi: 10.3389/fpls.2018.01565
Grewal, S., Yang, C., Edwards, S. H., Scholefield, D., Ashling, S., Burridge, A., et al. (2018b). Characterisation of Thinopyrum bessarabicum chromosomes through genome-wide introgressions into wheat. Theor. Appl. Genet. 131, 389–406. doi: 10.1007/s00122-017-3009-y
Gupta, S., Brazier, A. K. M., Lowe, N. M. (2020). Zinc deficiency in low- and middle-income countries: prevalence and approaches for mitigation. J. Hum. Nutr. Dietetics 33, 624–643. doi: 10.1111/jhn.12791
Guwela, V. F. (2023). High zinc wheat for sub-Saharan Africa. Loughborough, United Kingdom: [School of Biosciences], University of Nottingham. Available at: https://eprints.nottingham.ac.uk/id/eprint/73756.
Guwela, V. F., Broadley, M. R., Hawkesford, M. J., Maliro, M. F. A., Bokosi, J., King, J. (2024). Unravelling the impact of soil types on zinc, iron, and selenium concentrations in grains and straw of wheat/Amblyopyrum muticum and wheat/Triticum urartu doubled haploid lines. Front. Agron. 6. doi: 10.3389/fagro.2024.1305034
Guwela, V. F., Maliro, M. F. A., Joy, E. J. M., Tang, K., Bokosi, J., Hawkesford, M. J., et al. (2021). “Wheat value chains in Malawi: trends, gaps, challenges and opportunities,” in CABI Reviews (Boston MA, USA: CABI International). doi: 10.1079/PAVSNNR202116046
Guzman, C., Ammar, K., Govindan, V., Singh, R. (2019). Genetic improvement of wheat grain quality at CIMMYT. Front. Agric. Sci. Eng. 6, 265–272. doi: 10.15302/J-FASE-2019260
Hasheminasab, K. S., Shahbazi, K., Marzi, M., Zare, A., Yeganeh, M., Kharazmi, R. (2023). A study on wheat grain zinc, iron, copper, and manganese concentrations and their relationship with grain yield in major wheat production areas of Iran. J. Agric. Food Res. 14, 100913. doi: 10.1016/j.jafr.2023.100913
Horton, S. (2006). The economics of food fortification. J. Nutr. 136, 1068–1071. doi: 10.1093/jn/136.4.1068
IFDC, AFAP, AGRA (2018). The status of fertilizer recommendation in Malawi: Gaps, challenges and opportunities. Available online at: https://agra.org/wp-content/uploads/2020/08/Malawi-Report_Assessment-of-Fertilizer-Distribution-Systems-and-Opportunities-for-Developing-Fertilizer-Blends.pdf444.
IWGSC, Eversole, K., Feuillet, C., Keller, B., Rogers, J., Stein, N., et al. (2018). Shifting the limits in wheat research and breeding using a fully annotated reference genome. Science 17, 361(6403). doi: 10.1126/science.aar7191
Joshi, A. K., Crossa, J., Arun, B., Chand, R., Trethowan, R., Vargas, M., et al. (2010). Genotype × environment interaction for zinc and iron concentration of wheat grain in eastern Gangetic plains of India. Field Crops Res. 116, 268–277. doi: 10.1016/j.fcr.2010.01.004
Joy, E. J. M., Ander, E. L., Young, S. D., Black, C. R., Watts, M. J., Chilimba, A. D. C., et al. (2014). Dietary mineral supplies in Africa. Physiologia Plantarum 151, 208–229. doi: 10.1111/ppl.12144
Kanatti, A., Rai, K. N., Radhika, K., Mahalingam, G., Kanwar, L. S., Aluri, S. R. (2014). Grain iron and zinc density in pearl millet: combining ability, heterosis and association with grain yield and grain size. Springer Plus 3, 763. doi: 10.1186/2193-1801-3-763
Kato, A., Lamb, J. C., Birchler, J. A. (2004). Chromosome painting using repetitive DNA sequences as probes for somatic chromosome identification in maize. Proc. Natl. Acad. Sci. 101, 13554–13559. doi: 10.1073/pnas.0403659101
Khokhar, J. S., Sareen, S., Tyagi, B. S., Singh, G., Wilson, L., King, I. P., et al. (2018). Variation in grain Zn concentration, and the grain ionome, in field-grown Indian wheat. PloS One 13, e0192026. doi: 10.1371/journal.pone.0192026
King, J. L., Grewal, S., Yang, C. Y., Hubbart, S., Scholefield, D., Ashling, S., et al. (2017). A step change in the transfer of interspecific variation into wheat from Amblyopyrum muticum. Plant Biotechnol. J. 15, 217–226. doi: 10.1111/pbi.12606
King, J., Grewal, S., Yang, C. Y., Hubbart-Edwards, S., Scholefield, D., Ashling, S., et al. (2018). Introgression of Aegilops speltoides segments in Triticum aestivum and the effect of the gametocidal genes. Ann. Bot. 121, 229–240. doi: 10.1093/aob/mcx149
King, J., NewelL, C., Grewal, S., Hubbart-Edwards, S., Yang, C. Y., Scholefield, D., et al. (2019). Development of stable homozygous wheat/Amblyopyrum muticum (Aegilops mutica) introgression lines and their cytogenetic and molecular characterization. Front. Plant Sci. 10. doi: 10.3389/fpls.2019.00034
Kjeldahl, J. (1883). Neue methode zur bestimmung des stickstoffs in organischen körpern. Z. für analytische Chemie 22, 366–382. doi: 10.1007/BF01338151
Kumssa, D. B., Joy, E. J. M., Ander, E. L., Watts, M. J., Young, S. D., Walker, S., et al. (2015). Dietary calcium and zinc deficiency risks are decreasing but remain prevalent. Sci. Rep. 5, 10974. doi: 10.1038/srep10974
Likoswe, B. H., Phiri, F. P., Broadley, M. R., Joy, E. J. M., Patson, N., Maleta, K. M., et al. (2020). Inflammation adjustment by two methods decreases the estimated Prevalence of Zinc Deficiency in Malawi. Nutrients 12, 1563. doi: 10.3390/nu12061563
Lindsay, W. L., Norvell, W. A. (1978). Development of a DTPA soil test for zinc, iron, manganese, and copper. Soil Sci. Soc. America J. 42, 421–428. doi: 10.2136/sssaj1978.03615995004200030009x
Liu, H., Wang, Z. H., Li, F., Li, K., Yang, N., Yang, Y., et al. (2014). Grain iron and zinc concentrations of wheat and their relationships to yield in major wheat production areas in China. Field Crops Res. 156, 151–160. doi: 10.1016/j.fcr.2013.11.011
Maret, W., Sandstead, H. H. (2006). Zinc requirements and the risks and benefits of zinc supplementation. J. Trace Elem Med. Biol. 20, 3–18. doi: 10.1016/j.jtemb.2006.01.006
Mason, N. M., Jayne, T., Shiferaw, B. (2015). Africa’s rising demand for wheat: Trends, drivers, and policy implications. Dev. Policy Rev. 33, 581–613. doi: 10.1111/dpr.12129
Mehlich, A. (1984). Mehlich 3 soil test extractant: A modification of Mehlich 2 extractant. Commun. Soil Sci. Plant Anal. 15, 1409–1416. doi: 10.1080/00103628409367568
Ministry of Agriculture and Irrigation (MoAI) (2020). Guide to agriculture production and natural resources management in Malawi (Lilongwe, Malawi: Agriculture Communications Branch), 112–124, ISBN: ISBN 99908-34-00-9.
Morgounov, A., Gomez-Becerra, H. F., Abugalieva, A., Dzhunusova, M., Yessimbekova, M., Muminjanov, H., et al. (2007). Iron and zinc grain density in common wheat grown in Central Asia. Euphytica 155, 193203. doi: 10.1007/s10681-006-9321-2
Neelam, K., Rawat, N., Tiwari, V. K., Kumar, S., Chhuneja, P., Singh, K., et al. (2011). Introgression of group 4 and 7 chromosomes of Ae. peregrina in wheat enhances grain iron and zinc density. Mol. Breed. 28, 623–634. doi: 10.1007/s11032-010-9514-1
Noulas, C., Tziouvalekas, M., Karyotis, T. (2018). Zinc in soils, water and food crops. J. Trace Elements Med. Biol. 49, 252–260. doi: 10.1016/j.jtemb.2018.02.009
NSO (2016). Malawi Micronutrient Survey 2015-16: Key indicators report. Available online at: https://www.dhsprogram.com/pubs/pdf/FR319/FR319m.pdf (Accessed 16/05/22).
Prasad, R., Shivay, Y. S., Kumar, D. (2014). “Agronomic biofortification of cereal grains with iron and zinc,” in Advances in Agronomy, vol. 125 . Ed. SPARKS, D. L., (Delaware, USA: ) 55–91. doi: 10.1016/B978-0-12-800137-0.00002-9
Rawat, N., Neelam, K., Tiwari, V. K., Randhawa, G. S., Friebe, B., Gill, B. S., et al. (2011). Development and molecular characterization of wheat–Aegilops kotschyi addition and substitution lines with high grain protein, iron, and zinc. Genome 54, 943–953. doi: 10.1139/g11-059
Rawat, N., Tiwari, V. K., Singh, N., Randhawa, G. S., Singh, K., Chhuneja, P., et al. (2009). Evaluation and utilization of Aegilops and wild Triticum species for enhancing iron and zinc content in wheat. Genet. Resour. Crop Evol. 56, 53–64. doi: 10.1007/s10722-008-9344-8
RStudio Team (2022). RStudio: Integrated Development for R. RStudio (Boston, MA: PBC). Available at: http://www.rstudio.com/.
Shiferaw, B., Negassa, A., Koo, J., Wood, J., Sonder, K., Brown, J. A., et al. (2011). Future of wheat production in sub-Saharan Africa: Analysis of the expanding gap between supply and demand and economic profitability of domestic production. Paper presented at Increasing Agricultural Productivity and Enhancing Food Security in Africa: New Challenges and Opportunities. Available online at: https://ccafs.cgiar.org/publications/future-wheat-production-sub-saharan-africa.
Singh, R., Velu, G., Andersson, M., Bouis, H., Nelissa, J. (2017). Zinc-Biofortified Wheat: Harnessing Genetic Diversity for Improved Nutritional Quality Science Brief: Biofortification No. 1 (May 2017). CIMMYT, HarvestPlus, and the Global Crop Diversity Trust. Bonn, Germany). 283982. doi: 10.22004/ag.econ.283982
Thapa, D. B., Subedi, M., Yadav, R. P., Joshi, B. P., Adhikari, B. N., Shrestha, K. P., et al. (2022). Variation in grain zinc and iron concentrations, grain yield and associated traits of biofortified bread wheat genotypes in Nepal. Front. Plant Sci. 13. doi: 10.3389/fpls.2022.881965
Thomson, D., Henry, R. (1995). Single-step protocol for preparation of plant-tissue for analysis by PCR. Biotechniques 19, 394–7, 400.
Thórsson, Æ.T., Salmela, E., Anamthawat-Jónsson, K. (2001). Morphological, Cytogenetic, and molecular evidence for introgressive hybridization in Birch. J. Heredity 92, 404–408. doi: 10.1093/jhered/92.5.404
Tiwari, V. K., Rawat, N., Neelam, K., Kumar, S., Randhawa, G. S., Dhaliwal, H. S. (2010). Substitutions of 2S and 7U chromosomes of Aegilops kotschyi in wheat enhance grain iron and zinc concentration. Theor. Appl. Genet. 121, 259–269. doi: 10.1007/s00122-010-1307-8
Tiwari, V. K., Wang, S. C., Danilova, T., Koo, D. H., Vrana, J., Kubalakova, M., et al. (2015). Exploring the tertiary gene pool of bread wheat: sequence assembly and analysis of chromosome 5M(g) of Aegilops geniculata. Plant J. 84, 733–746. doi: 10.1111/tpj.13036
UNICEF (2019). Investing in nutrition: Building resilience and achieving development for all in Malawi. 2018/19 Nutrition Budget Briefs (Lilongwe, Malawi: UNICEF Malawi).
Velu, G., Atanda, S., Singh, R. P., Huerta-Espino, J., Crespo-HerrerA, L. A., Juliana, P., et al. (2022). Breeding increases grain yield, zinc, and iron, supporting enhanced wheat biofortification. Crop Sci. 62, 1912–1925. doi: 10.1002/csc2.20759
Velu, G., Herrera, L. C., Guzman, C., Huerta, J., Payne, T., Singh, R. P. (2019). Assessing genetic diversity to breed competitive biofortified wheat with enhanced grain Zn and Fe Concentrations. Front. Plant Sci. 10. doi: 10.3389/fpls.2018.01971
Velu, G., Ortiz-Monasterio, I., Cakmak, I., Hao, Y., Singh, R. P. (2014). Biofortification strategies to increase grain zinc and iron concentrations in wheat. J. Cereal Sci. 59, 365–372. doi: 10.1016/j.jcs.2013.09.001
Velu, G., Singh, R., Huerta-Espino, J., Pena, J., Ortiz-Monasterio, I. (2011). Breeding for enhanced zinc and iron concentration in CIMMYT spring wheat germplasm. Czech J. Genet. Plant Breed. 47, S174–S177. doi: 10.17221/3275-CJGPB
VSN (2022). Genstat for windows. 21st edition (Genstat.co.uk: VSN International, Hemel Hempstead, UK. Web page).
Walkley, A., Black, ,. I. A. (1934). An examination of the degtjareff method for determining soil organic matter, and a proposed modification of the chromic acid titration method. Soil Sci. 37, 29–38. doi: 10.1097/00010694-193401000-00003
Wang, S. W., Yin, L. N., Tanaka, H., Tanaka, K., Tsujimoto, H. (2011). Wheat-Aegilops chromosome addition lines showing high iron and zinc contents in grains. Breed. Sci. 61, 189–195. doi: 10.1270/jsbbs.61.189
Welch, R. M. (2002). Breeding strategies for biofortified staple plant foods to reduce micronutrient malnutrition globally. J. Nutr. 132, 495S–499S. doi: 10.1093/jn/132.3.495S
White, P. J., Broadley, M. R. (2009). Biofortification of crops with seven mineral elements often lacking in human diets - iron, zinc, copper, calcium, magnesium, selenium and iodine. New Phytol. 182, 49–84. doi: 10.1111/j.1469-8137.2008.02738.x
WHO (2009). Global health risks: mortality and burden of disease attributable to selected major risks (Geneva: World Health Organization), ISBN: ISBN: 9789241563871.
Xia, H., Li, X., Qiao, Y., Xue, Y., Yan, W., Ma, L., et al. (2023). Dissecting the relationship between yield and mineral nutriome of wheat grains in double cropping as affected by preceding crops and nitrogen application. Field Crops Res. 293, 108845. doi: 10.1016/j.fcr.2023.108845
Keywords: micronutrients, biofortification, zinc, iron, introgression, phenotyping, genotyping
Citation: Guwela VF, Maliro MF, Broadley MR, Hawkesford MJ, Bokosi JM, Grewal S, Coombes B, Hall A, Yang C, Banda M, Wilson L and King J (2024) The 4T and 7T introgressions from Amblyopyrum muticum and the 5Au introgression from Triticum urartu increases grain zinc and iron concentrations in Malawian wheat backgrounds. Front. Plant Sci. 15:1346046. doi: 10.3389/fpls.2024.1346046
Received: 28 November 2023; Accepted: 02 July 2024;
Published: 16 July 2024.
Edited by:
Agata Gadaleta, University of Bari Aldo Moro, ItalyReviewed by:
Satinder Kaur, Punjab Agricultural University, IndiaCopyright © 2024 Guwela, Maliro, Broadley, Hawkesford, Bokosi, Grewal, Coombes, Hall, Yang, Banda, Wilson and King. This is an open-access article distributed under the terms of the Creative Commons Attribution License (CC BY). The use, distribution or reproduction in other forums is permitted, provided the original author(s) and the copyright owner(s) are credited and that the original publication in this journal is cited, in accordance with accepted academic practice. No use, distribution or reproduction is permitted which does not comply with these terms.
*Correspondence: Julie King, anVsaWVraW5nQG5vdHRpbmdoYW0uYWMudWs=
Disclaimer: All claims expressed in this article are solely those of the authors and do not necessarily represent those of their affiliated organizations, or those of the publisher, the editors and the reviewers. Any product that may be evaluated in this article or claim that may be made by its manufacturer is not guaranteed or endorsed by the publisher.
Research integrity at Frontiers
Learn more about the work of our research integrity team to safeguard the quality of each article we publish.