
94% of researchers rate our articles as excellent or good
Learn more about the work of our research integrity team to safeguard the quality of each article we publish.
Find out more
ORIGINAL RESEARCH article
Front. Plant Sci. , 13 March 2024
Sec. Plant Breeding
Volume 15 - 2024 | https://doi.org/10.3389/fpls.2024.1328690
This article is part of the Research Topic Breeding Forage and Grain Legumes for Sustainable Protein Production View all 15 articles
 Natalia Gutierrez1*
 Marie Pégard2
 Ignacio Solis3
 Dejan Sokolovic4
 David Lloyd5
 Catherine Howarth5
 Ana M. Torres1
Yield is the most complex trait to improve crop production, and identifying the genetic determinants for high yield is a major issue in breeding new varieties. In faba bean (Vicia faba L.), quantitative trait loci (QTLs) have previously been detected in studies of biparental mapping populations, but the genes controlling the main trait components remain largely unknown. In this study, we investigated for the first time the genetic control of six faba bean yield-related traits: shattering (SH), pods per plant (PP), seeds per pod (SP), seeds per plant (SPL), 100-seed weight (HSW), and plot yield (PY), using a genome-wide association study (GWAS) on a worldwide collection of 352 homozygous faba bean accessions with the aim of identifying markers associated with them. Phenotyping was carried out in field trials at three locations (Spain, United Kingdom, and Serbia) over 2 years. The faba bean panel was genotyped with the Affymetrix faba bean SNP-chip yielding 22,867 SNP markers. The GWAS analysis identified 112 marker–trait associations (MTAs) in 97 candidate genes, distributed over the six faba bean chromosomes. Eight MTAs were detected in at least two environments, and five were associated with multiple traits. The next step will be to validate these candidates in different genetic backgrounds to provide resources for marker-assisted breeding of faba bean yield.
Faba bean (Vicia faba L.) has been cultivated since the beginning of agriculture (Cubero, 1973) and, at present, is the fourth most widely grown cool season legume after chickpea, pea, and lentil (FAOSTAT, 2020). Its nutrient-rich seeds are used as a protein source for both human consumption and as a feed grain. It is well adapted to a wide range of climatic areas and has one of the highest yield potentials (Cernay et al., 2016) and protein content (average ~29%) of the grain legumes (Warsame et al., 2018).
Legumes play a crucial role in ensuring worldwide food security, promoting agroecosystem resilience, and facilitating sustainable agriculture. The key benefits of legumes include the biological fixation of atmospheric nitrogen as a result of a symbiotic relationship with soil bacteria known as rhizobia. Among grain legumes, faba bean is the most efficient nitrogen fixer with values ranging between 50 and 200 kg N ha−1 (Schwenke et al., 1998; Carranca et al., 1999; Lopez-Bellido et al., 2006). This unique ability reduces the dependence of farmers on extensive use of fertilizers and protects soil and groundwater quality. Furthermore, implemented in crop rotations, faba bean functions as a break crop, decreasing the occurrence of weeds, pests and diseases and enhancing soil physical conditions. This leads to a higher yield of subsequent crop(s) while reducing the amount of fertilizers and biocides required (Köpke and Nemecek, 2010; Cernay et al., 2016).
Despite these nutritional and multiple environmental services, faba bean represents a minor part of European agricultural systems that have developed a high dependence on imports of grain legumes. This is partly due to a lack of economically competitive grain legume crops that can match cereals in terms of farmer profits. For the faba bean to become an economically more attractive crop and thus increase the area under cultivation, major advances in both yield and yield stability need to be achieved. Currently, faba bean yield is considered to be highly unreliable due to a significant level of genotype × environment interaction (Cernay et al., 2016). A greater understanding of the main biological and environmental factors affecting plant growth and the identification of the main yield components are critical to improve adaptation and yield in this crop. While biotic and abiotic stresses have received considerable attention in faba bean (Adhikari et al., 2021; Khazaei et al., 2021), plant architecture and yield-related traits are still poorly understood in this crop. Faba bean has lagged behind cereals in the genetic improvement of yield, due to a combination of less investment and limited genomic resources available (Adhikari et al., 2021). Recent advancements in genomic tools, such as a reference genome sequence (Jayakodi et al., 2023), enable a genomics-based breeding platform for assisting conventional breeding and accelerate the release of high-yielding and stable faba bean cultivars. Quantitative trait loci (QTLs) associated with yield-related traits have been identified previously, but the results were limited due to the use of anonymous markers and low-density maps (Ramsay et al., 1995; Avila et al., 2005). Stable QTLs for three reproductive traits were identified on chromosomes (Chr.) II and V (pod length) and VI (number of ovules per pod and number of seeds per pod), by evaluating the recombinant inbred line (RIL) population Vf6 × Vf27 (Cruz-Izquierdo et al., 2012) during two seasons. More recently, 11 plant architecture and yield-related traits were recorded in the same population across four seasons (Ávila et al., 2017), confirming the QTLs for pod length, number of ovules per pod, and number of seeds per pod and further identifying stable QTLs for hundred-seed weight on Chr. V and VI. Despite these valuable advances, the genetic architecture and determinants of faba bean yield remain uncertain.
The resolution and accuracy with which QTL mapping can identify the direct causal gene(s) controlling a trait are limited by the large confidence intervals and the relatively low number of recombination events existing in biparental mapping populations (Beji et al., 2020). With the recent development of powerful faba bean SNP array platforms (Khazaei et al., 2021), genome-wide association studies (GWAS) are now an additional tool to dissect polygenic traits by utilizing the genetic diversity and historical recombination events present in wide germplasm collections. GWAS aims at identifying markers strongly associated with quantitative traits by using the linkage disequilibrium (LD) between candidate genes and markers. Compared with family-based QTL mapping, GWAS significantly increases mapping resolution and enables minor effect genes to be detected (Abdurakhmonov et al., 2008). In recent years, GWAS studies have been reported in a range of legume crops such as soybean (Hwang et al., 2014), pigeon pea (Varshney et al., 2017), common bean (Raggi et al., 2019), chickpea (Varshney et al., 2019), red clover (Zanotto et al., 2023), alfalfa (Pégard et al., 2023), and the model legume Medicago truncatula (Bonhomme et al., 2014). In faba bean, only a few GWAS studies have been reported so far which have identified candidate genes associated with frost tolerance (Sallam et al., 2016); resistance to Ascochyta fabae (Faridi et al., 2021); tolerance to herbicides (Abou-Khater et al., 2022); drought, heat, and freezing tolerance (Ali et al., 2016; Maalouf et al., 2022; Gutiérrez et al., 2023); agronomic traits (Skovbjerg et al., 2023); and seed size (Jayakodi et al., 2023).
The aim of this work was to identify for the first time genomic regions controlling yield-related traits using a panel of 400 faba bean lines grown in a range of environments and using the recently available 60K Axiom Vfaba_v2 SNP array (O’Sullivan et al., 2019; Khazaei et al., 2021). The traits analyzed were pod shattering (SH), seeds per pod (SP), pods per plant (PP), seeds per plant (SPL), 100 seed weight (HSW), and plot yield (PY). The results obtained contribute to the discovery of new genomic regions associated with grain yield characters and the identification of candidate genes associated with the SNPs to accelerate future molecular marker-assisted breeding in this crop.
The faba bean EUCLEG collection consists of 400 accessions from Africa (25 accessions); North, Central, and South America (10); Asia (59); and Europe (185). Moreover, it also consists of 121 accessions with unknown origin. Europe, with 22 countries, is the most represented continent in the panel, followed by Asia, America, and Africa (13, 4, and 5 countries, respectively). Spain accounts for the highest number of accessions (68). The panel includes 81 breeding and advanced materials, 47 varieties, 7 parental inbred lines from different mapping populations, and 265 accessions from different germplasm banks (Supplementary Table S1). The selection was made in collaboration with public institutes including ICARDA, IFAPA, IFVCNS, INIA, and INRA; the universities of Ghent and Göttingen; and the following gene banks: ESP004, ESP046, FRA043, SWE054, SYR002, and NordGen. Private sector contributions consisted of lines/varieties from the companies Agrovegetal, NPZ, Batlle, and Fitó. Since the faba bean is a partially allogamous species, prior to genotyping, all the lines from Spain had been selfed at IFAPA, Córdoba, in the field for at least four generations using insect-proof cages with the remaining accessions selfed for two generations.
The faba bean collection was phenotyped in three geographic locations: 1) Escacena del Campo, Huelva (Spain; 2019 and 2020) by the company Agrovegetal; 2) Aberystwyth (United Kingdom (UK); 2019) by IBERS; and 3) Krusevac (Serbia; 2020) by IKBKS. The growing season in southern Spain was from November to June, while in the rest of the countries, it was from April to September. The location descriptors are as follows: Escacena del Campo (37°30′N, 6°22′W), Aberystwyth (52°41′N, 4°06′W), and Krusevac (43°58′N, 21°20′E).
In each location and year, the accessions were arranged in the field following an augmented design MAD type 2 (Lin and Poushinsky, 1983). The experimental trials included 440 plots (3 m² each), distributed in 22 rows and 20 columns. Plots consisted of 4 rows of 2 m length with 0.5 m row spacing and seeding distance of 10 cm (80 seeds/plot). Twenty accessions were chosen as checks and distributed in four incomplete blocks with different numbers of repetitions (5 checks repeated six times and 15 twice), and the remaining 380 accessions were unreplicated and randomly distributed within and between blocks.
The plants were measured and scored for six agronomic traits affecting the final yield response. Pods per plant (PP), seeds per pod (SP), and seeds per plant (SPL) were recorded as the mean value from 10 plants in the central rows. Plot yield (PY) was determined as the weight of the seeds from a whole plot in kilograms (kg). The seeds were used to determine 100 seed weight (HSW) in grams (g). Shattering (SH) was determined just before harvesting only at Escacena del Campo, Spain, in 2019 using a 0 to 3 scale as follows: indehiscent (0), fissured with valves slightly open along the ventral suture (1), dehiscent (DH) with non-twisting valves (2), and dehiscent with twisting valves (3). PP and SPL were not scored in the UK and the rest of the traits were recorded in all locations.
For DNA extraction, young leaf tissue was collected from a single plant per accession. Leaf samples were frozen and stored at −80°C until used. Genomic DNA was extracted using a DNeasy Plant Mini Kit (Qiagen Ltd., UK), and DNA quality was assessed as described in Gutiérrez et al. (2023). Pure and good-quality DNA samples with an average concentration of 40 ng/µl were used for genotyping using the Vfaba_v2 Axiom SNP array with 60K SNP (O’Sullivan et al., 2019; Khazaei et al., 2021) from Affymetrix (Thermo Fisher Scientific), University of Reading, UK. After quality control, 26 accessions with poor DNA quality and 22 revealing a low number of SNPs were excluded from the analysis. SNP calling was performed on the remaining 352 samples, and SNP markers with a call rate below 97% were discarded from the final genotyping database. The SNPs were filtered to remove those with a minor allele frequency (MAF)<0.05 and >15% of heterozygotes. The missing values were imputed with the minor allele frequency (Badke et al., 2014), and it represented less than 1% of all genomic data. The allelic genotyping matrix was transformed into a numeric format (0, for the reference allele; 1, for the heterozygous allele; and 2, for the alternative allele).
The genomic relationship matrix (G) was constructed based on VanRaden (VanRaden, 2008) (Equation 1):
where the matrix Z was calculated as (M − P). M is a matrix of minor allele counts (0, 1, and 2 for the reference, heterozygote, and alternative, respectively) with m columns (one for each marker) and n rows (one for each accession). P is a matrix that contains the minor allele frequency, expressed as a difference from 0.5 and multiplied by 2, such that column i of P is 2(pi − 0.5).
For phenotypic analysis, environments were designed as follows: Spain.2019 (Spain, season 2018/2019), Spain.2020 (Spain, season 2019/2020), Spain.Global (combined data in Spain for two seasons), UK.2019 (United Kingdom, year 2019), Serbia.2020 (Serbia, year 2020), and Global (all environments combined). The check accessions were used to capture the spatial heterogeneity at the plot level, and all traits were independently adjusted for field microenvironmental heterogeneity using a mixed linear model (MLM) by the function restricted maximum likelihood (REML) with the “breedR” package (Muñoz and Sanchez, 2020). A random effect was fitted using the tensor product of two B-spline bases with a covariance structure for the random knot effects (RKE) to account for spatial variability along the rows and the columns of the field design (Cantet et al., 2005; Cappa and Cantet, 2007; Cappa et al., 2015). The genomic estimated breeding values (GEBVs) for each trait were determined with the genomic best linear unbiased prediction-based model (GBLUP) (Whittaker et al., 2000; Meuwissen et al., 2001; Cantet et al., 2005). The following basic model was considered:
where is the raw phenotypes; the global mean; the vector of random additive effects following the distribution ), where is the additive variance and the genomic relationship matrix between accessions; is the vector of random spatial effects containing the parameters of the B-spline tensor product following ), where is the variance of the RKE for the rows and columns, while represents the covariance structure in two dimensions; and is the vector of residual effects following (0, ), where is the residual variance. The design matrices and were identity matrices relating the plot to the random effects. For analyses across environments (Spain.Global and Global), (Equation 2) is a fixed effect of the year in the same location or the effect of interaction among locations and is the design matrix relating the plot to the fixed effect. The method used to obtain the covariance structure was (Equation 3) the following: bi-splines were anchored at a given number of knots for rows and columns, and a higher number of knots smooths out the surfaces. “breedR” optimized the knot numbers by an automated grid search based on the Akaike information criterion (AIC). The microenvironmental individual effect was subtracted from the observed phenotype to obtain a spatially adjusted individual phenotype used to conduct the GWA studies. A genotypic mean of the spatially adjusted phenotypes was calculated for each trait and used for the GWAS. All measurements were tested for deviations from normality by a randomized quantile–quantile (Q–Q) plot.
Narrow sense heritability (h2) was estimated from the variance components of each model after phenotypic adjustment. For the individual environments (Spain.2019, Spain.2020, UK2019, and Serbia.2020), the following formula was used (Equation 4):
(within the environment)
where Vg is the additive genetic variance component, Vsp is the spatial variance component, and Vres is the residual variance component.
To calculate the h2 for combined environments (Spain.Global and Global), the formula used was the following (Equation 5):
(across environments)
where Vspn is the spatial variance component for each environment and n is the mean number of replicates (checks) for each accession per environment.
To understand the extent of the relationship between traits and after adjusting phenotypic data, a correlation coefficient analysis was performed using the Pearson method for all the traits across environments. Additionally, the genetic correlation was assessed using a multitrait model on adjusted phenotypes with the “breedR” package (Muñoz and Sanchez, 2020). For each random effect, including genetic and spatial effects, a full covariance matrix is estimated. The “cov2cor” function in the R package “stats” was used to compute the genetic correlation between traits from the additive genetic variance–covariance matrix. This information was based on the research by Calus and Veerkamp (2011). The genetic correlation among traits was extracted and compared with the phenotypic correlation. Descriptive analysis and correlations of the phenotypic data were conducted with the R 4.2.3 software (R Core Team, 2022).
To identify the chromosomal location of SNP markers, their flanking sequences were aligned to the Vicia faba reference genome (Jayakodi et al., 2023) using the “map to reference” option implemented in Geneious v.7.1.9. For the genomic position of the SNP markers, the information provided by Skovbjerg et al. (2023) was used. To facilitate data analysis, the extremely large chromosome I (>3 Gbp) was divided at the centromere (position 1,574,527,093 bp) by the faba bean genome consortium to form Chr1S and Chr1L. Functional annotation was done using eggNOG-mapper v.2 with the eukaryotic database (Huerta-Cepas et al., 2019; Cantalapiedra et al., 2021). The associated genes were categorized by the Clusters of Orthologous Group (COG) and plotted using the “ggplot2” R package (Wickham, 2016).
To calculate the linkage disequilibrium (LD), only SNP markers with physical position and chromosomal location within the V. faba genome were used. So, a genotyping matrix of 19,741 SNP markers was filtered for a MAF of 5% and a numerical imputation with the LD-kNNi method (Money et al., 2015) implemented in TASSEL v5.2.88 (Bradbury et al., 2007). LD was estimated for each chromosome and for the whole genome, by computing the squared allele frequency correlations (r2) for each pairwise combination of markers distanced within 1 Mbp in PLINK v.1.9 (Purcell et al., 2007). LD was plotted against the genomic distance between markers in kbp, and a curve was fitted using the LOESS regression model and R. The LD decay was estimated per chromosome and the whole genome as the point where the fitted curve reached half of its maximum value.
To infer the population structure of the SNP marker panel, a Bayesian-based clustering analysis was performed using fastSTRUCTURE v. 1.0 (Raj et al., 2014). fastSTRUCTURE was run with default settings and 10-fold cross-validation using K values ranging from 1 to 10. The most likely number of subpopulations (K) was identified by plotting the marginal likelihood of each model as a function of K and determining when the graph begins to plateau. The choice of K was further supported by applying a discriminant analysis of principal components (DAPC)-based procedure for clustering using the “fviz_pca” function in the “factoextra” R package (Kassambara and Mundt, 2020). The resulting admixture proportions were graphically displayed using the distruct.py script provided by fastSTRUCTURE.
A phylogenetic tree was constructed with the neighbor-joining method applying a bootstrap test with 1,000 replications, using MEGA 11 (Tamura et al., 2021). The R package “ggtree” was then used to visualize a circular phylogenetic tree (Xu et al., 2021, 2022).
The GWAS analyses were performed using the multi-locus mixed model method (MLMM) (Segura et al., 2012), which accounts for the genetic structure of the faba bean collection within the genomic relationship matrix (G), using the R package “mlmm.gwas” (Bonnafous et al., 2019). The MLMM method uses a stepwise mixed-model regression approach with forward inclusion of the SNPs as co-factors and a backward elimination. The variance components of the model were re-estimated at each step (maximum 10 steps) and then used to calculate p-values for the association of each SNP with the trait in the study. MLMM implements two model selection methods to determine the optimal mixed model from the set of stepwise models calculated: the extended Bayesian information criterion and the Bonferroni criterion. The Bonferroni method is considered the most stringent for selecting a threshold p-value (Kaler and Purcell, 2019) and may result in a loss of power and of true positives. For this reason, in this study, we have considered both the eBIC with a lambda value of 0.60 and the Bonferroni test (0.05 divided by the number of SNPs) as significant cutoffs. Associated markers were visualized with a p-value distribution (expected vs. observed on a −log10 scale) with a Manhattan plot and a Q–Q plot. The percentage of phenotypic variation explained by each QTL was obtained by subtracting the R2 of a linear model with all the QTL as fixed effects and the genomic relationship matrix (G) as random effect to the R2 of the same model but without the focused QTL.
The genomic regions (72 bp) harboring associated SNPs for each trait in different environments were represented on the V. faba physical map using the Pretzel platform (Keeble-Gagnère et al., 2019) (http://pulses.plantinformatics.io/mapview).
The genome sequence (Jayakodi et al., 2023) of the associated SNPs was blasted against the NCBI Medicago truncatula reference genome (MtrunA17r5.0-ANR) to annotate the potential candidate genes underlying the causal variants. Gene locations were determined using the Genome Data Viewer (GDV).
Genotyping of the EUCLEG collection with the Vfaba 60K Axiom array revealed a total of 34,354 SNP markers (57% of the total 59,871 SNPs present on the array) with a call rate above 97%. Following the Axiom Best Practices Genotyping Workflow, these SNPs were classified into three quality classes according to their clustering performance: polymorphic high resolution (PHR, 71%), monomorphic high resolution (MHR, 17%), and no minor homozygous (NMH, 12%). PHR refers to polymorphic SNPs exhibiting all three highly resolved clusters (two homozygous and one heterozygous), MHR to not informative SNPs with only one of the homozygous clusters, and NMH to SNPs with good resolution lacking one of the homozygous clusters. After the quality control, 48 accessions were removed for further analysis, 26 due to poor-quality DNA, and 22 for revealing a low number of SNP markers (7,656 SNPs). The average reference allele frequency was 44%, and for the alternative allele, it was 56%. The number of missing values in the genotyping matrix was low (0.89%). After quality control, the final matrix consisted of 352 accessions genotyped for 22,867 high-quality SNPs (MAF above 5% and without missing data) and was kept for further GWAS analysis.
Markers with known chromosomal position, present in a window of 10 Mb, were used to develop the high-density SNP-based map (Figure 1). Of the total number of SNP markers (22,867), 93% (21,271) were well-distributed across the six chromosomes after assembling against the faba bean reference genome (Jayakodi et al., 2023), and 19,741 of them (86%) were mapped to a genomic location (Table 1). The 1,596 SNP markers not assigned to chromosomes (named as Chr0) together with the ones without genomic positions (1,530 SNPs) were, however, included in the GWAS analysis. The number of SNPs on each chromosome ranged from 3,847 on Chr1L to 2,296 on Chr1S (Table 1), and the total genetic coverage was 11.4 Gbp. The highest average density of SNPs was 20 SNPs per 10 Mbp in Chr1L and Chr2 and the lowest was 14 SNPs per 10 Mbp in Chr1S. Chr3 was the one with the maximum local density of SNPs (75 SNPs per 10 Mbp) and the maximum gap between them (95,593.1 kbp). The higher average distance between two adjacent SNPs was 738.5 kbp in Chr1S and the lowest was 506.4 kbp in Chr1L.
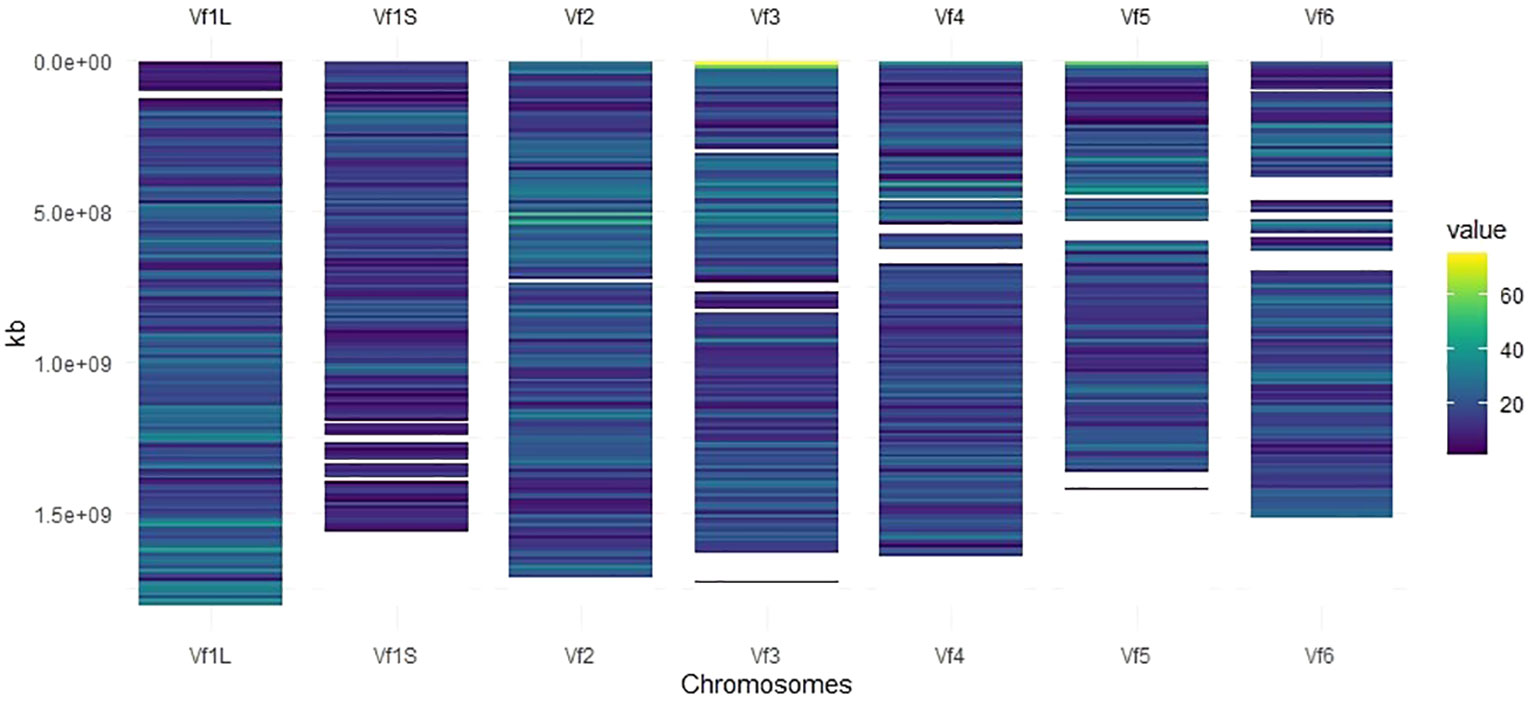
Figure 1 SNP density map across each faba bean chromosome representing the number of SNPs after quality control within a 10-Mbp window size. The color blue corresponds to the lowest density, while the color yellow corresponds to the highest density.
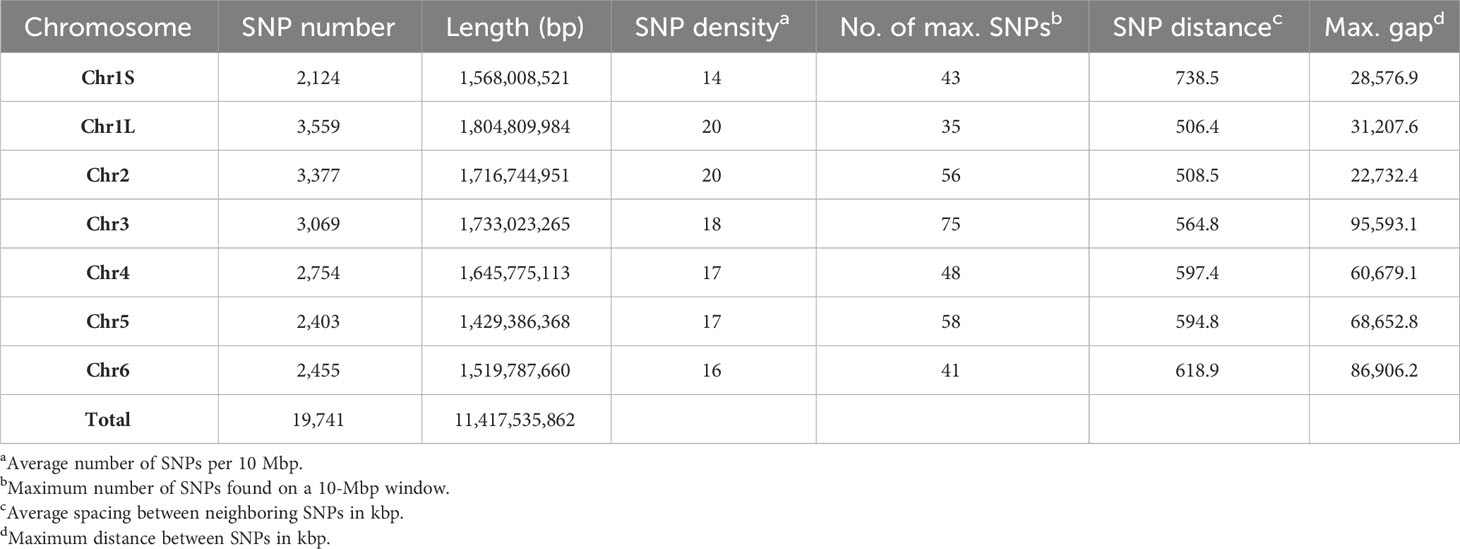
Table 1 SNP distribution and coverage per individual chromosome of 352 faba bean accessions against the Vicia faba reference genome.
Estimates of the linkage disequilibrium (using r2) for each chromosome as well as for the whole genome are presented in Figure 2. LD values showed an inverse relationship with distance, and the LD decay, estimated as the distance for which r2 decreases to half of its maximum level (0.131), was 139.2 kbp for the whole genome. Considering the chromosomes individually, the r2 values ranged from 0.125 in Chr3 to 0.140 for Chr1L and decreased to half at reaching 139.2 kbp and 151.8 kbp, respectively (Figure 2; Supplementary Table S2).
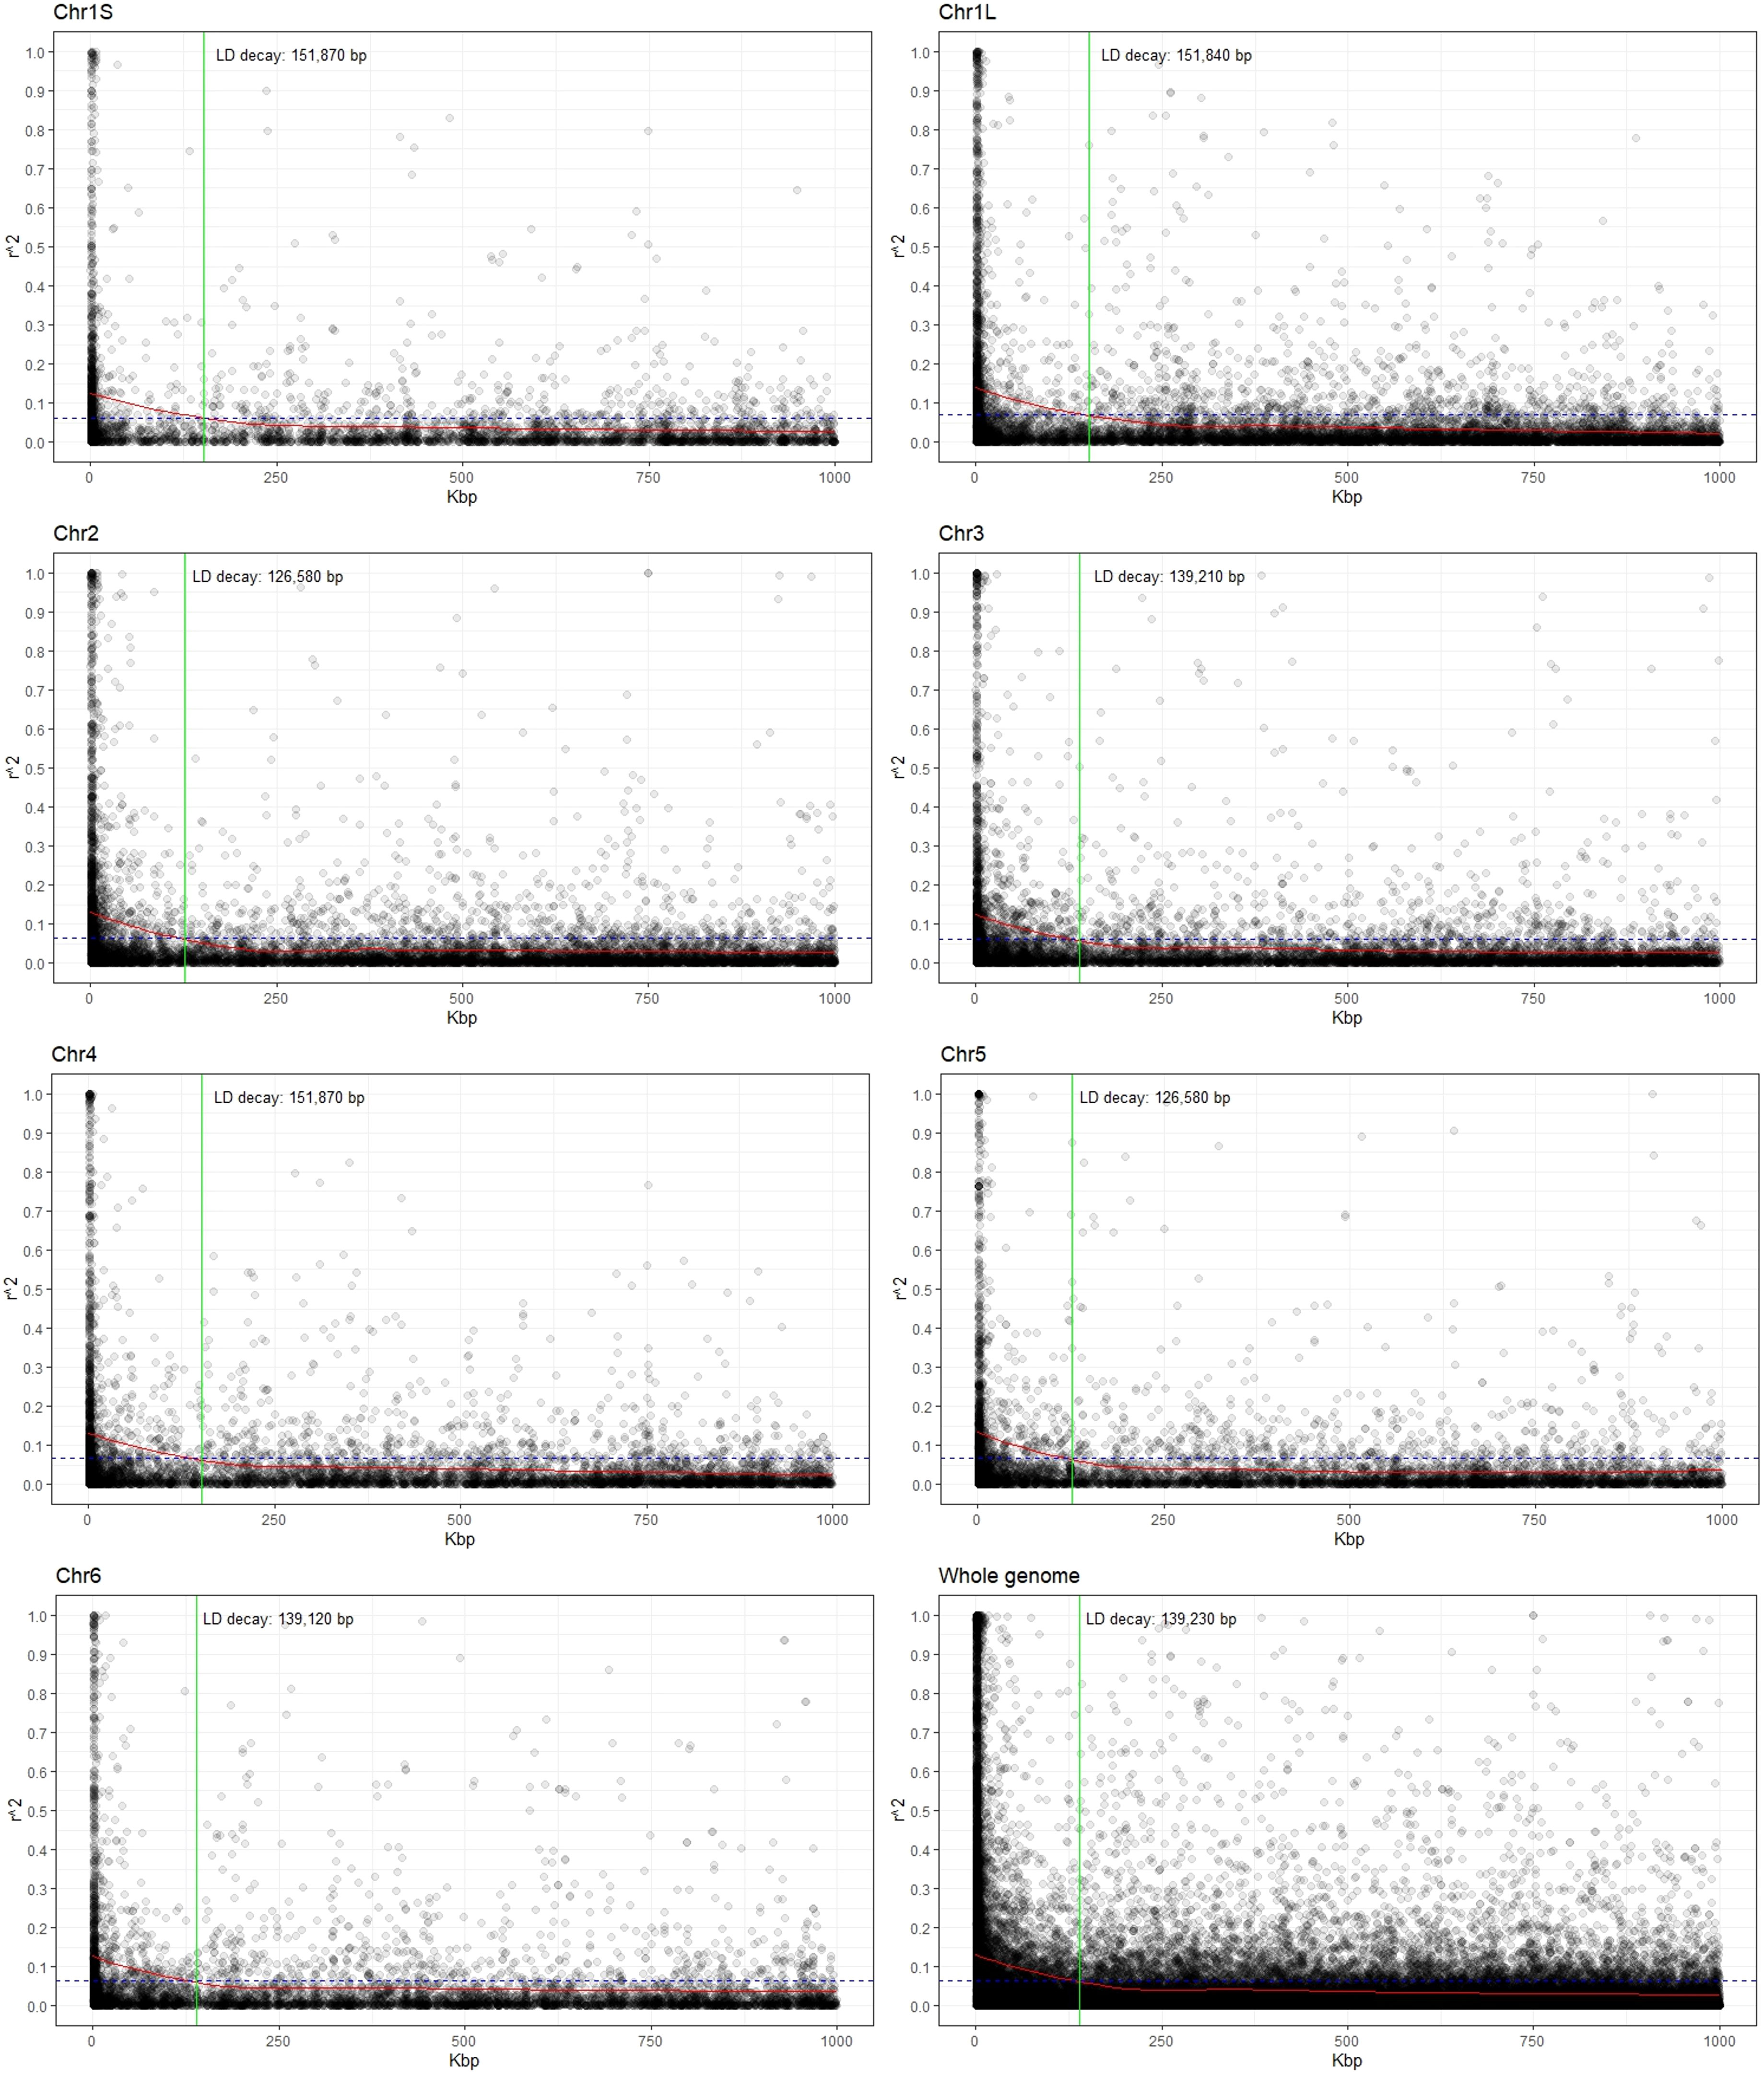
Figure 2 Scatter plot showing the linkage disequilibrium (LD) decay for each chromosome as well as for the whole genome. The values on the Y-axis represent the squared correlations of allele frequencies (r2) between markers with a maximum distance of 1 Mbp. The X-axis shows the genomic distance in kbp. The intersection (green line) between the LOESS curve (red) and the threshold (half of the average value at the minimal distance; dashed blue line) indicates the extent of LD decay in base pairs (bp).
We analyzed the population structure of the EUCLEG collection using two approaches: fastSTRUCTURE and DAPC. The marginal likelihood of the fastSTRUCTURE output from K = 2 to K = 10 was represented, and a delta-K peak at K = 3 was determined (Figure 3A). The accessions were divided into three groups (P1, P2, and P3) with clear differences in geographic origin. Based on the results of the fastSTRUCTURE analysis, accessions with membership probabilities ≥0.50 were considered to belong to the same group. The DAPC supported the choice of K = 3 using the first two PCs. PC1 distinguished the population P1 from P2 and P3, whereas PC2 further distinguished P2 and P3 populations (Figure 3B).
Figure 3 Population structure and principal component analysis of the 352 faba bean accessions. (A) Admixture vertical plot at K = 3; the vertical bars represent an individual accession, and each color corresponds to its assignment to one of the clusters based on its ancestry proportion. (B) Discriminant analysis of principal components (DAPC) for 352 faba bean genotypes revealing three clear groups. Each group is represented by circles with different colors and shapes. (C) Neighbor-joining tree of the faba bean accessions. The tips are highlighted with different colors according to the population groups.
Group P1 contained 148 accessions, of which 38% had an unknown geographic origin and 44% were associated with North European countries, with Finland (22), Sweden (15), and France (11) being the most highly represented. Population P2 included 177 accessions of which 46% belonged to Mediterranean countries and 26% had an unknown origin. Spain was the country with the highest number of accessions (61), followed by Egypt (9), Ethiopia (7), and Syria (6). P3 was the smallest group, with 22 accessions associated with countries from Asia, with China (15) being the predominant country, followed by Japan (1), Nepal (1), and Thailand (1), and the rest of the accessions (4) were of unknown geographic origin (Supplementary Table S1). Five of the 352 accessions were found to be admixed and were not assigned to a specific group.
According to the fastSTRUCTURE approach, the neighbor-joining tree generated with 352 faba bean accessions and 22,867 SNP markers further suggested the three main clades (Figure 3C) although populations P2 and P3 did not show such a clear division.
Descriptive analysis, heritability, and correlations of the phenotypic data were estimated after phenotypic adjustment. Except for SH, scored only at Spain.2019, all traits showed a high variability across the six environments (Supplementary Figure S1) and followed a normal distribution with a positive skewness (except for SH where the deviation of the data was toward indehiscent plants). SP showed the highest phenotypic mean in Serbia.2020 (3.69 ± 0.50), followed by Spain.2020 (3.22 ± 0.66). The highest phenotypic mean for PP was in Spain.Global [Spain.2019 (22.70 ± 9.94) and Spain.2020 (22.97 ± 10.13)], while SPL had a higher mean value in Spain.2020 (61.08 ± 25.59). HSW showed the highest mean value in Spain.2019 (74.97 ± 37.97) and Spain.2020 (71.37 ± 32.77), while the lowest value was in Serbia.2020 (43.52 ± 16.12). PY revealed the highest mean value in Spain.Global [Spain.2019 (1.18 ± 0.60) and Spain.2020 (1.15 ± 0.63)], while in Serbia (0.42 ± 0.25) and the UK (0.27 ± 0.19), values were three and four times lower, respectively (Figure 4; Table 2).
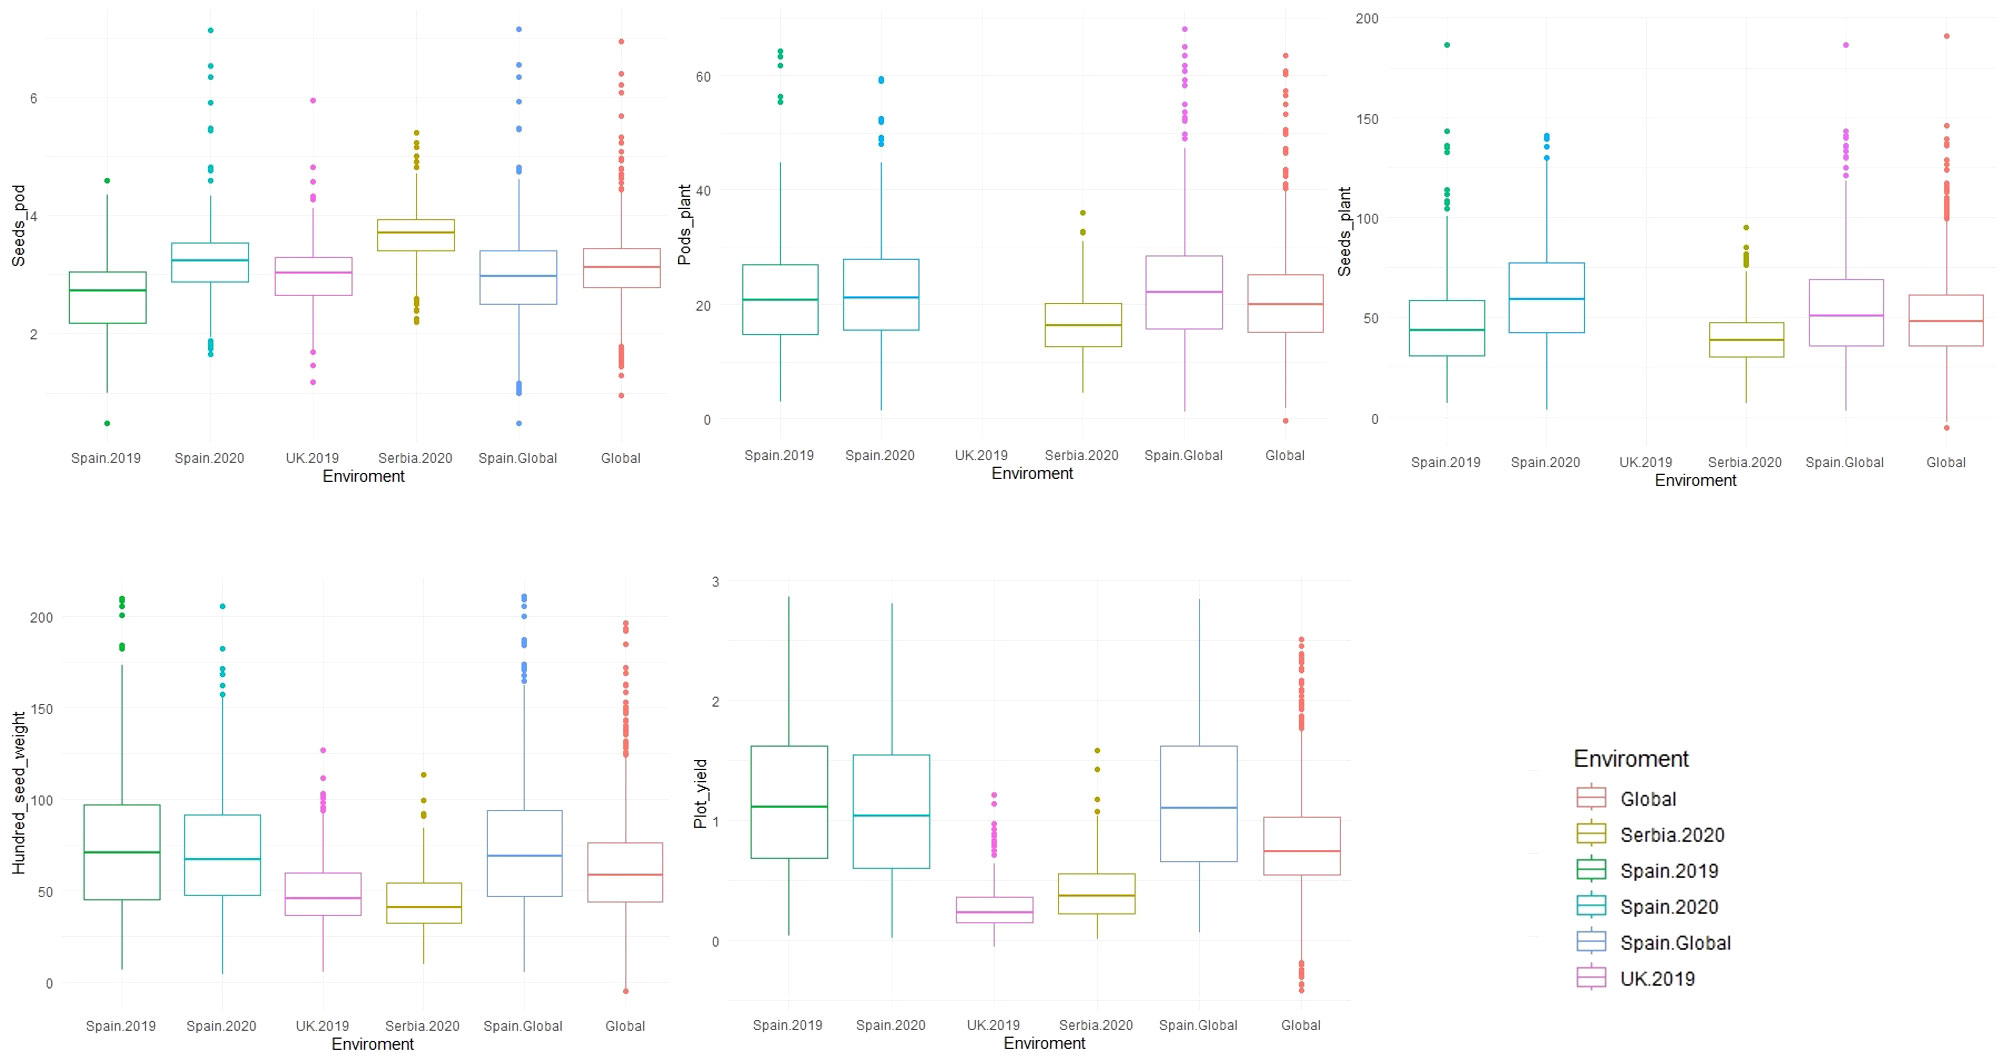
Figure 4 Boxplot of the phenotypic values for five yield-related traits measured in 352 faba bean accessions across different environments (Spain.2019, Spain.2020, UK.2019, Serbia.2020, Spain.Global, and Global). The traits were seeds per pod (SP), pods per plant (PP), seeds per plant (SPL), hundred-seed weight (HSW), and plot yield (PY).
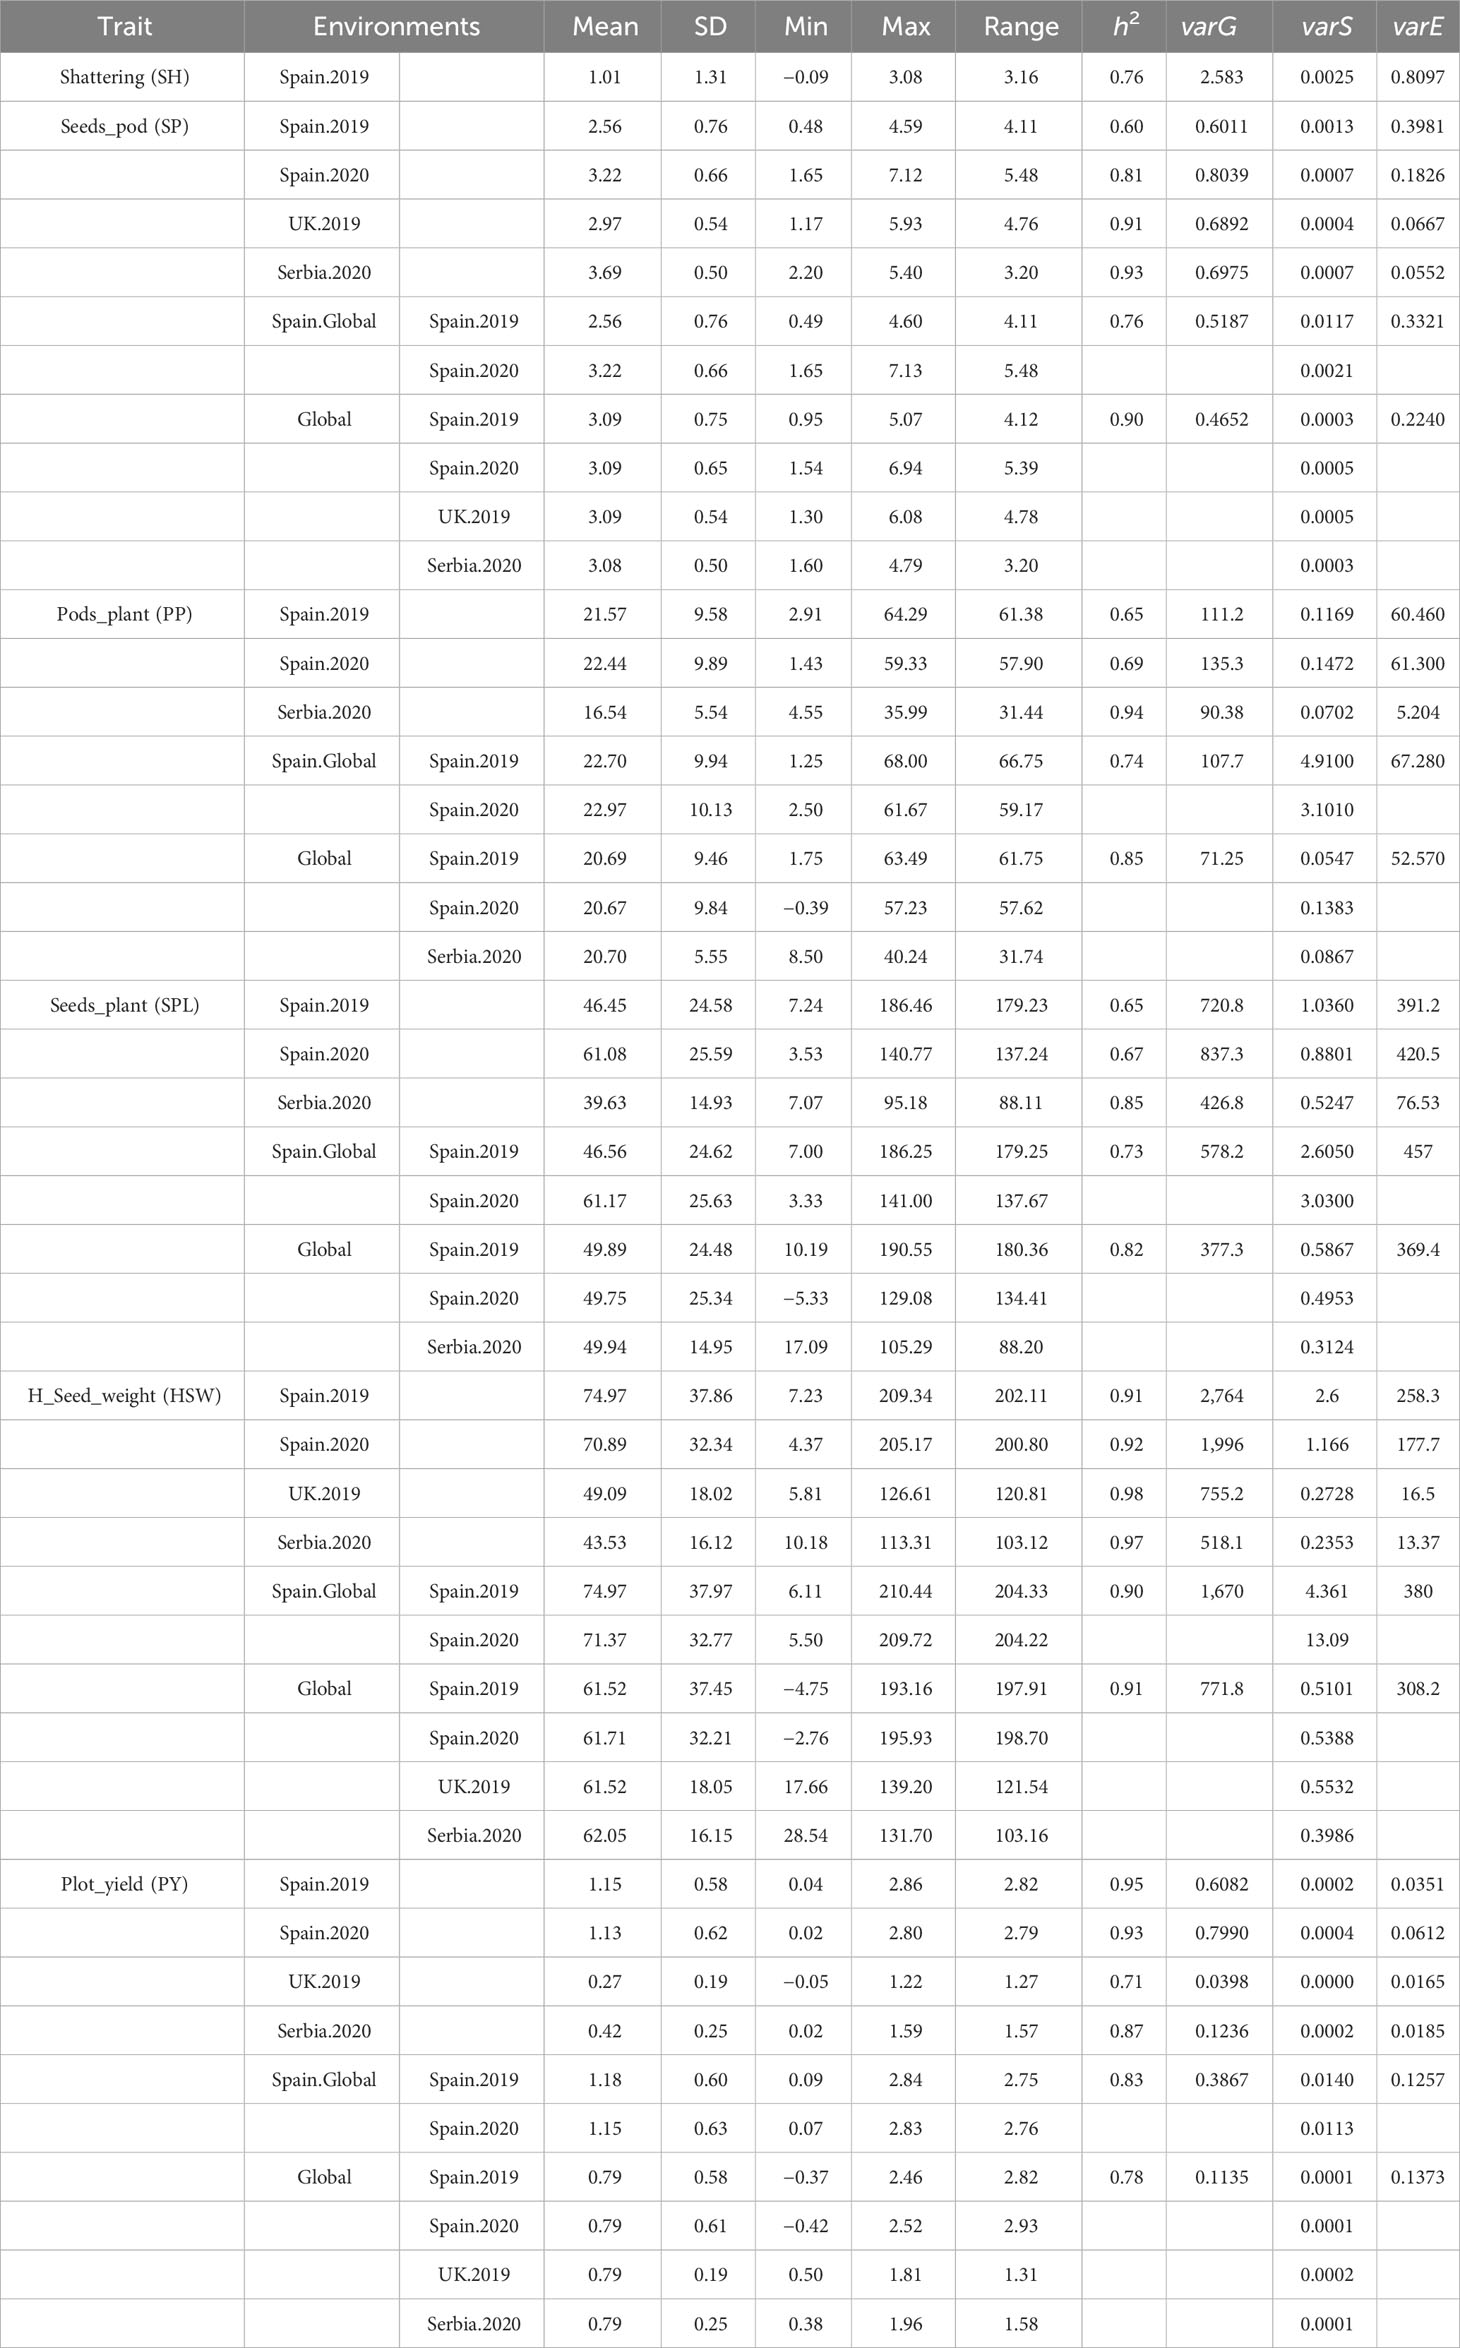
Table 2 Descriptive statistics, heritability, and proportion of phenotypic variance explained in each environment after adjusting trait phenotypic values as described in the methods.
The narrow sense heritability (h2) values are shown in Table 2. On average, the highest heritability values were observed for HSW (0.9 to 0.98), whereas the lowest values were for SPL (0.65 to 0.85). Serbia.2020 was the location with the highest mean heritability values for SP, PP, and SPL (0.93, 0.94, and 0.85, respectively), while SPL showed the lowest values in Spain.2019 and Spain.2020 (0.65 and 0.67). Furthermore, the proportion of the different components of the variance estimated from each environment is represented in Figure 5. Overall, the models combining multiple environments (Global and Spain.Global) displayed higher values for the residual variance component (varE).
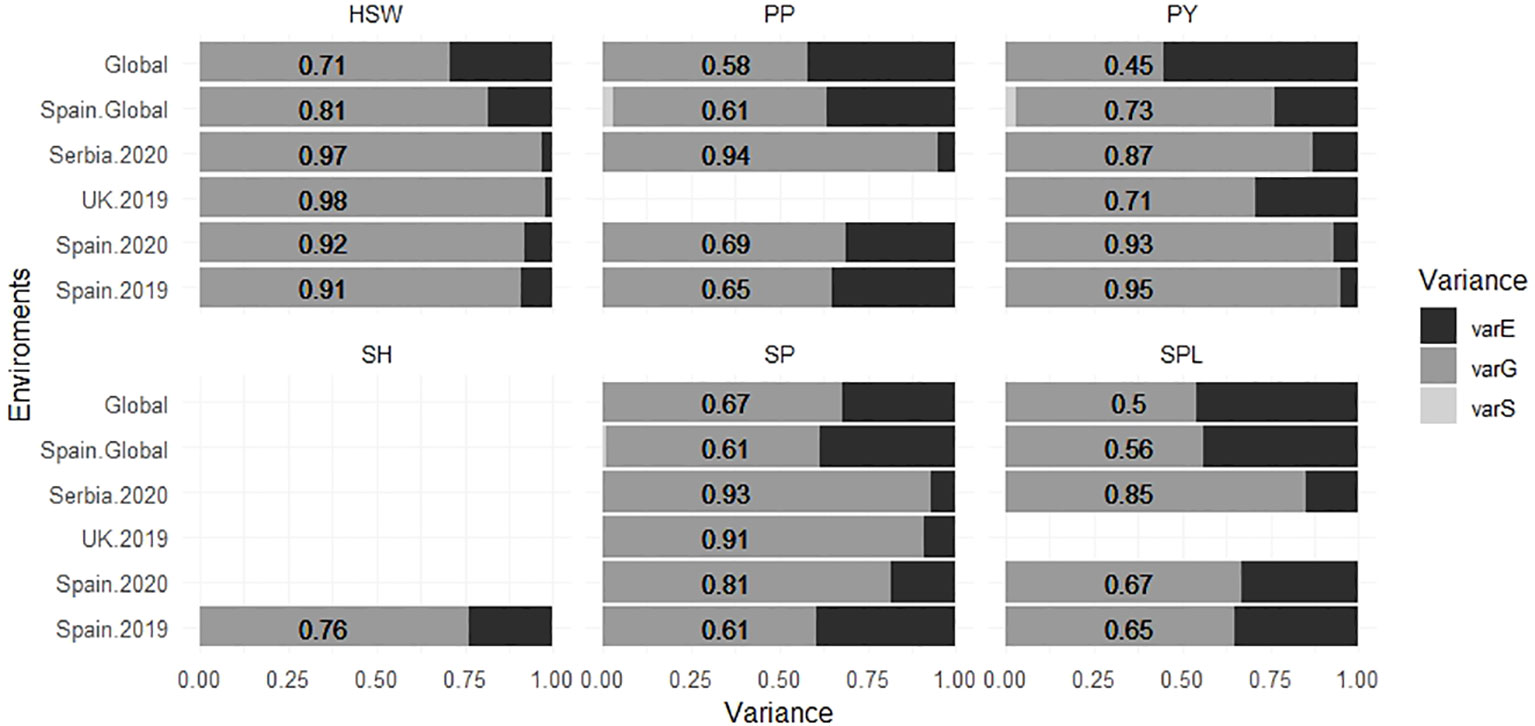
Figure 5 Proportion of the different components of the variance for six faba bean yield-related traits calculated for each environment. The numbers correspond with the value of the varG. varE is the residual variance component, varG is the additive genetic variance component, and varS is the spatial variance component for each environment. The traits were SH (shattering), SP (seeds per pod), SPL (seeds per plant), HSW (hundred-seed weight), PP (pods per plant), and PY (plot yield).
The phenotypic correlation between traits and environments after phenotypic adjustment is shown in Figure 6. In general, similar performance patterns were observed in most of the traits across environments. Thus, SH evaluated only in Spain.2019 revealed a high significance and a negative correlation with SPL, HSW, and PY (−0.22, −0.19, and −0.34, respectively). SP showed a positive correlation with SPL in all environments and a negative correlation with PP in Spain.2020 (−0.15), Spain.Global (−0.15), and Global (−0.21). PP displayed a strong positive correlation with SPL and a negative correlation with HSW in all environments, and SPL presented a negative correlation with HSW. Finally, PY revealed a positive correlation with HSW, SPL (except in Spain.2019), and PP, although no correlation between PY and PP was detected in Spain.Global or Global and a negative correlation was observed in Spain.2019. Only in UK.2019, Serbia.2020, and Global environments, PY showed a positive correlation with SP (0.35, 0.27, and 0.15, respectively).
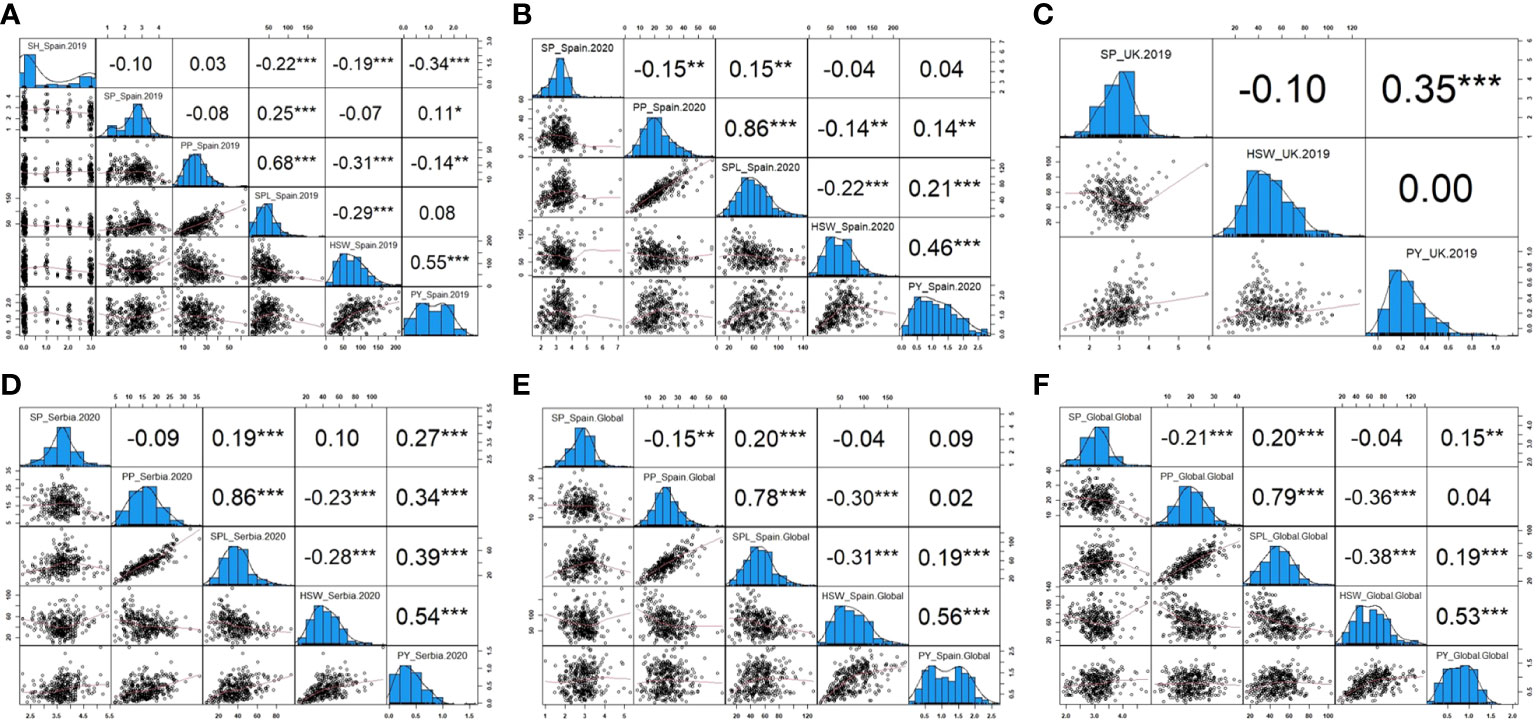
Figure 6 Pearson correlations and histograms showing the distribution of the yield-related traits in each environment. (A) Phenotypic frequency and correlation between SH (shattering), SP (seeds per pod), PP (pods per plant), SPL (seeds per plant), HSW (hundred-seed weight), and PY (plot yield) corresponding to Spain in 2019. (B) Phenotypic frequency and correlation between SP, PP, SPL, HSW, and PY corresponding to Spain in 2020. (C) Phenotypic frequency and correlation between SP, HSW, and PY corresponding to the United Kingdom in 2019. (D) Phenotypic frequency and correlation between SP, PP, SPL, HSW, and PY corresponding to Serbia in 2020. (E) Phenotypic frequency and correlation between SP, PP, SPL, HSW, and PY corresponding to Spain combined across years. (F) Phenotypic frequency and correlation between SP, PP, SPL, HSW, and PY corresponding to the Global analysis combining all locations. *, **, and *** significance at p< 0.05, p< 0.01, and p< 0.001, respectively.
The genetic correlation for each trait (Supplementary Table S3) was calculated using the data obtained in the different locations, with a genetic correlation close to one indicating a low G × E interaction and a value close to zero indicating a strong G × E interaction. The genetic correlation between traits was estimated between them when all the environmental variation was removed from the phenotype (named “Global”). It was noteworthy that the genetic correlation between SP in Spain.2019 and in Serbia.2020 (0.998) was high. Similarly, the correlation of HSW between Serbia.2019, Spain.2019, and Spain.2020 varies between 0.928 and 0.950. However, PY was the least correlated trait between the UK.2019 and the rest of the locations, showing the least (close to zero) correlated trait with Spain.2020 (−0.049). PP correlations between Serbia and Spain ranged from 0.538 to 0.686, while SPL ranged from 0.571 to 0.776 between those locations. In accordance with the phenotypic correlation (Figure 6), PP and SPL showed the highest genetic correlation between them in all environments, and higher values were observed in Serbia.2020 and Spain.2020 (0.919 and 0.904, respectively). SH showed a negative genetic correlation with the other traits, while HSW had it with PP, SPL, and SH, as well as PP and SP between them (Supplementary Table S3).
Association analyses were performed for the six yield-related traits using individual site data as well as the Spain.Global and Global values. This identified 112 MTAs in 97 candidate genes, of which 77 had functional annotation (Table 3). Of them, 40 harbored markers were significantly associated with the traits [Bonferroni threshold −log10 (p) > 5.66]. The Manhattan and their corresponding Q–Q plots are shown in Supplementary Figure S2.
Table 3 List of candidate genes associated with yield traits in different environments.
A total of 8, 17, 25, 17, 14, and 16 unique MTAs were detected for SH, SP, PP, SPL, HSW, and PY, respectively (Table 3; Supplementary Figure S2). Among the associated SNP markers, eight were detected and validated in Global environments or in at least two environments [AX-181439008 (Chr1L), AX-416789762 (Chr1L), AX-416724190 (Chr3), AX-416783339 (Chr4), AX-416765420 (Chr4), AX-181163860 (Chr5), AX-416822980 (Chr6), AX-416730393 (Chr6)], and five markers were found to be associated with multiple traits (Supplementary Table S4). Thus, markers AX-181460360 (Chr1L), AX-416788562 (Chr4), AX-416724626 (Chr5), and AX-416730393 (Chr6) were associated with both PP and SPL, which showed the highest phenotypic correlation in all environments, and AX-181205104 (Chr3) was significant for SPL and SH, which revealed a reasonable high phenotypic correlation as well. No common associated markers were identified for PY, while PP was the trait sharing more markers in different environments or with correlated traits, and all of them were further significant in the global analyses (Table 3; Supplementary Table S4).
Among environments, Spain.2019 was the one revealing the highest number of associations for all the traits, except HSW (Table 3). Thus, the eight MTAs found for both SH and PY jointly explained 80.2% and 100% of the total phenotypic variation, respectively. In Spain.2020, seven, eight, and four MTAs accounted for 49.6%, 58.5%, and 36.6% of the variation for PP, SPL and HSW, respectively. The MTAs detected in Serbia.2020 explained 56.3%, 53.3%, and 29.8% of the variation in PP, SPL and HSW, respectively. Finally, in UK.2019, the markers associated with SP, PY, and HSW accounted for 78.7%, 61.6%, and 16.9% of the respective trait variation. The global analyses Spain.Global or the combination of all the environments Global identified new candidates and confirmed some of the MTAs previously detected (Table 3).
The recent availability of the genome sequence (Jayakodi et al., 2023) enabled us to locate the significant MTAs on the faba bean physical map and visualize the genomic regions harboring multiple associations for the different traits and environments (Figure 7; Supplementary Table S5). The MTAs were distributed across the genome, but a few genomic regions harbored multiple associated SNPs (Figure 7). Four pleiotropic MTAs controlling multiple traits co-localized on Chr1L (PP-SPL), Chr3 (SH-SPL), Chr4 (PP-SPL), and Chr5 (PP-SPL). Seven stable MTAs expressed in multiple environments were identified for PP in Chr1L, Chr4, Chr5, and Chr6; for HSW in Chr1L; and SP in Chr3. Finally, we found one MTA showing pleiotropic effects between PP and SPL and stable among environments on Chr6 (Figure 7). The nucleotide sequence of each associated SNP is available in Supplementary Table S6.
Figure 7 Physical map of the marker–trait associations (MTAs) of six yield-related traits detected by GWAS in a faba bean panel (352 accessions). The traits were represented by colors and the environments by shapes. (P) represents the MTAs with pleiotropic effect and (S) the MTAs stable across different environments. SH, shattering; SP, seeds per pod; PP, pods per pod; SPL, seeds per plant; HSW, hundred-seed weight; PY, plot yield.
To understand the potential role of MTAs in faba bean yield, we searched for homologs in M. truncatula (Table 3). Functional annotation of their molecular functions helps to predict candidate genes associated with the traits studied. The COG showed that 20 of them were unknown and 16 of them had no significant similarity with previous annotated sequences (Figure 8; Supplementary Table S7). The remaining candidates were involved in a wide variety of functions such as carbohydrate metabolism and transport, signal transduction, chaperone functions, transcription, replication and repair process, and cytoskeleton (Figure 8).
Figure 8 Functional analysis of 97 significant marker–trait associations (MTAs). Candidate genes were classified by the Clusters of Orthologous Groups (COGs). The X-axis indicates the number of genes in a category. The Y-axis shows the 17 functional COG categories found.
For shattering (SH), three significant MTAs were identified accounting for 15.4%, 14.9%, and 12.2% of the phenotypic variation, respectively. The candidate genes harboring the significant SNPs were “actin-related protein 8 (ARP),” “protein LYK5,” and “WRKY transcription factor 22” (Table 3).
For seeds per pod (SP), the two main candidate genes containing the associated MTAs identified in Spain.2019 were “UDP-glucuronate 4-epimerase 3” and “pentatricopeptide repeat-containing (PPR) protein” which explained 11.2% and 10.4% of the phenotypic variation, respectively. In UK.2019, “helicase protein MOM1,” “protein phosphatase 2C 2 (PP2C),” and “splicing factor U2af small subunit B” harbored significant SNPs that explained 19.5%, 14.3%, and 13.2% of the trait variation, respectively. Two MTAs corresponding to “rhomboid-like protein” and “40S ribosomal protein S17-like (RP)” were also associated with Spain.Global and accounted for 8.1% and 3.5% of the phenotypic variation, respectively. Finally, the Global analysis identified MTAs corresponding to “rhamnogalacturonate lyase-like gene (RGL)” in addition to “40S ribosomal protein S17-like (RP)” (Table 3).
Pods per plant (PP) was the trait sharing the highest number of associated SNPs across environments and yield-related traits (SP), and most of the corresponding candidates were further significant in the global analyses (Table 3). Thus, “protection of telomeres protein 1b” (POT1) was associated with PP in Spain.2019 and with PP and SP in Serbia.2020 and was the significant marker explaining the highest percentage of variation (13.2%) of the trait. The MTA identified in the uncharacterized LOC120577622 was significant in Spain.2019, Spain.Global, and Global, explaining 8%, 11.9%, and 6.1% of the variation in PP, respectively, a fact supported by the high positive phenotypic correlations between environments (r > 0.76) (Supplementary Figure S3). Similarly, the significant MTA present in “carboxyl-terminal peptidase (CTP)” was consistently associated with PP in Spain.2019 and Spain.Global. Moreover, “cleavage stimulation factor subunit 50” (CstF-50) contained a significant MTA for PP and SPL that explained 10.2% and 12.6% of the variation, respectively. This outcome was further supported by the high positive phenotypic correlations existing between both traits (r = 0.86) (Figure 6). “Protein JINGUBANG” (JGB) also contained a significant MTA significant for PP and SPL that explained 10.6% and 9.2% of the variation, respectively. In Spain.Global, four associated MTAs uncovered new candidates, an uncharacterized gene was further confirmed in the Global analysis, “DNA repair protein RAD51 homolog” was consistently identified in PP and SP, and “E3 ubiquitin-protein ligase PRT1” was further validated in the Global analysis. As mentioned above, the pooled dataset analysis (Global) validated the genes harboring the associated SNPs (COX15, uncharacterized LOC120577622, E3 ubiquitin-ligase, and vacuolar proton pyrophosphatase) in all the environments.
For seeds per plant (SPL), the five candidate genes harboring significant MTAs consistently identified in different yield-related traits were LYK5 (Spain.2019 for SPL and SH), CstF-5 and RAD51 (Spain.2020 for SPL and PP), and JGB and POT1 (Serbia.2020 for SPL and PP). Except for CstF-50, none of the MATs accounted for more than 10% of the phenotypic variation of this trait (Table 3).
In hundred-seed weight (HSW), five of the associated SNP markers corresponded to candidate gene sequences with no significant similarity and accounted for high values of the phenotypic variation (one of them common in the UK.2019 and Global analyses). In Spain.2020, the candidate genes were “JGB” protein (different from the one detected in PP and SPL) and “protein STICHEL-like 2” and explained 16.8% and 10.3% of the total variation. In Serbia.2020, “ubiquitin carboxyl-terminal hydrolase 17” explained 14% of the trait variation. The associated SNPs in the Global analysis revealed “hydroxyproline O-galactosyltransferase HPGT1” accounting for 20.5% of the variation and BRISC and BRCA1-A complex member 2 (explaining 15.2%) (Table 3).
Plot yield (PY) was the only trait that did not share candidate genes among environments or with other correlated traits. In Spain.2019, six significant MTAs explained more than 90% of the phenotypic variation and corresponded to “DNA-binding protein ROOT HAIRLESS 1 gene (RHL1),” “hypersensitive-induced response protein 1 (HIR1),” “sucrose-phosphate synthase (SPS),” and “basic endochitinase.” In UK.2019, the study revealed three main candidates: one of them uncharacterized, “LRR receptor-like serine/threonine-protein kinases RCH1,” and “E3 ubiquitin-protein ligase BRE1-like 1,” and the associated SNPs explained 14.5%, 10.8%, and 10.4% of the variation (Table 3). The remaining candidates have not yet been functionally characterized.
Faba bean is an important crop for global food security, ecosystem resilience, and sustainable agriculture. To turn this crop into an economically attractive proposition for farmers and to increase the area under cultivation, major advances in yield and yield stability need to be achieved. Grain yield, however, is a complex trait controlled by many genes and strongly affected by the environment. Genetic improvement can be achieved, but the difficulty is in knowing which trait combinations should be selected to produce stable high-yielding genotypes. This study is a comprehensive effort to exploit a wide collection of important yield-related traits. We performed a GWAS analysis on a world collection of 400 faba bean accessions to assess its genetic diversity and population structure and to identify MTAs associated with yield using the Vfaba_v2 Axiom 60K SNP array. The panel was phenotyped for six yield-related traits (SH, SP, PP, SPL, HSW, and PY) in different locations from Spain, Serbia, and the United Kingdom. For phenotypic adjustment, we considered six models (Spain.2019, Spain.2020, Spain.Global, UK.2019, Serbia.2020, and Global). Overall, there was better performance of the genotypes in Spain than in Serbia or the UK, with better phenological development and greater range for all traits.
The high and positive phenotypic correlations detected between most of the traits in the different locations suggest that it is possible to improve multiple yield-related traits through genomics-assisted breeding. The exception was HSW, which was positively correlated with PY and negatively correlated with PP and SPL in all the environments. This outcome could be the result of genetic and/or environmental interactions with the availability and remobilization of photoassimilates during seed filling (Mangini et al., 2018). However, this explanation does not exclude the hypothesis of clusters of tightly linked genes with opposite effects and/or single genes with pleiotropic effects. On the other hand, the relatively low genetic correlation observed in PY among environments highlights a high G × E interaction with a significant effect on the final yield which is not shared with the other yield components studied. Thus, the bimodal distribution of PY in Spain (Supplementary Figure S1) suggests that the MTAs detected might differentiate between Mediterranean-adapted and not-adapted genotypes and could be related to other adaptive loci that respond to environmental factors. These outcomes highlight the fact that identifying MTAs for yield components offers more scope for future breeding than those associated with PY itself.
A high heritability was observed for all the traits in all environments, suggesting a strong genetic control and low microenvironmental effects, a fact desired for rapid progress in breeding. HSW was the least affected trait across environmental conditions, followed by PY and SP. Different studies have reported high narrow sense heritability for SP, PP, HSW, and PY (Toker, 2004; Zhou et al., 2021; Khan et al., 2022; Singh et al., 2022). Traits with high heritability will help breeders shorten the breeding cycles and can result in faster and higher genetic gain (Singh et al., 2022).
Based on the results of the population structure, the delta-K peak suggested the presence of three faba bean groups with clear differences in their geographic origin which was supported by the DAPC and the phylogenetic analysis. Three subpopulations differentiated by geographical origin were also found recently in a genetic analysis of a worldwide collection of 2,678 faba bean genotypes, including the EUCLEG panel (Skovbjerg et al., 2023) which also identified the EUCLEG collection being the most diverse among the panels analyzed. As indicated by the diagonal linear shape in the Q–Q plots (Supplementary Figure S2), the approach used controlled the population stratification, thus supporting the reliability of the GWAS detected. This collection with diverse phenotypic and molecular parameters constitutes a valuable resource for future breeding and high-resolution gene mapping, including candidate gene discovery for a wide range of traits (Govindaraj et al., 2015).
The adequacy of association studies for complex traits depends critically on the existence of LD between functional alleles and the surrounding SNP markers. LD values dropped from 0.140 to 0.125, with the increase of physical distance from 126.6 kbp to 151.8 kbp. Low LD in faba bean was previously reported (Skovbjerg et al., 2023; Zhang et al., 2023) when comparing different faba bean diversity panels. Thus, the EUCLEG collection was the one showing lower LD blocks (higher recombination), an expected outcome in outbreeding species with high genetic diversity (Pégard et al., 2023; Skovbjerg et al., 2023; Zanotto et al., 2023; Zhang et al., 2023). The rapid LD decay observed in this study (within roughly 150 kbp) revealed the variation present in a highly allogamous panmictic population and suggested that the MTAs identified (or the closely linked genes on either flanking side of the significant SNPs) were nearly or completely independent from each other and, hence, were sufficient for association mapping in faba bean.
Concerning the candidate genes harboring the significant SNPs, we will mainly discuss the ones detected consistently in different environments and traits (stable and pleiotropic MTAs), explaining more than 10% of the trait variation (Table 3). Three main candidates were associated with shattering (SH): “actin-related protein 8 (ARP),” “protein LYK5,” and “WRKY transcription factor 22.” No single specific role has been defined for nuclear ARPs that are involved in many cellular physiological processes including plant growth and development (Szymanski and Staiger, 2018). Of particular interest is the role of actin as a sensor mechanism for chemical and physical perturbations in the intracellular and extracellular environment (Porter and Day, 2016), as what may happen in mature faba bean pods. The protein LYK5 has been reported to be involved in cell wall integrity maintenance mechanisms (Baez et al., 2022). In the signaling response of Arabidopsis to fungal chitin, the LYK5 plays a direct role in chitin signaling and plant innate immunity (Bacete and Hamann, 2020). Interestingly, LYK5 was pleiotropic with the correlated trait SPL. A WRKY transcription factor has been reported to modulate floral and seed development, lignin deposition, and shattering process in sorghum (Tang et al., 2013; Ogutcen et al., 2018). In our study, the protein LYK5 showed a pleiotropic effect with SH and SPL in Spain.2019, supported by the significant negative correlation between SH and SPL in this environment (r = −0.22), thus suggesting the importance of this candidate for yield improvement through marker-assisted selection (MAS).
The seeds per pod (SP) main candidates bearing the associated MTAs were “UDP-glucuronate 4-epimerase 3” and “pentatricopeptide repeat-containing (PPR) protein.” Several authors (Duan et al., 2022; Li et al., 2022) reported that gene seed thickness 1 (ST1), encoding UDP-d-glucuronate 4-epimerase 6, influences soybean seed morphology via the pectin biosynthesis pathway. In addition, genes encoding PPR proteins have been shown to play prominent roles in seed development in different crops. Thus, a PPR protein was partly responsible for the increased seed size and weight during domestication in peanut (Li et al., 2021), and it affected photosynthesis and grain filling in maize (Liu et al., 2013; Huang et al., 2020) and regulated pod number in chickpea (Das et al., 2016). Other significant MTAs, although explaining less percentage of variation, corresponded to “histone-lysine N-methyltransferase SUVR4” with functions in plant growth and development, including pollen and female gametophyte development, flowering, and responses to stresses. The other three significant MTAs for SP corresponded to “helicase protein MOM1,” “protein phosphatase 2C 2 (PP2C),” and “splicing factor U2af small subunit B.” The in-vivo role of many helicases has not been well investigated in plants; however, through indirect evidence, it has been suggested that they play critical roles in biological pathways encompassing all aspects of cell biology, organismal physiology, development, and stress physiology (Sami et al., 2021). Plant PP2Cs have emerged as major players in stress signaling. A PP2C is a major signaling component in the ABA-dependent signaling cascade that regulates seed germination in rice (Bhatnagar et al., 2017) or seed dormancy abscisic and abscisic acid-activated protein kinases in Arabidopsis (Kim et al., 2013). The regulation of MAPK activities by PP2Cs in plants indicates that protein phosphatases may act as specificity determinants in MAPK signaling (Umezawa et al., 2009). The next candidate is the splicing factor U2af responsible for removing introns from precursor mRNAs (pre-mRNAs) in all eukaryotes. Park et al. (2019) showed that normal plant development, including floral transition, and male gametophyte development in Arabidopsis require two U2af isoforms. However, the specific molecular mechanisms related to the regulation of splicing for the control of plant growth, reproduction, and stress response are still unknown. The next significant SNP corresponded to “40S ribosomal protein S17-like (RP)” and was the only candidate validated in the different environments (Spain.2019, Spain.Global, and Global). RPs are indispensable in ribosome biogenesis and protein synthesis and play a crucial role in diverse developmental processes (Ban et al., 2000; Klein et al., 2004). In rice, RPs have been demonstrated to be involved in inflorescence development and grain filling (Saha et al., 2017), while in foxtail millet, ribosomal proteins were identified to be significantly increased during drought (Pan et al., 2018). Finally, the analysis combining all the environments also identified “rhamnogalacturonate lyase-like gene (RGL).” RGLs have been shown to have a key role during pollen tube growth and defense against pathogens in tomato (Ochoa-Jiménez et al., 2018), cell expansion and growth and plant development in cotton (Naran et al., 2007), and involvement in fruit softening and ripening (Vicente et al., 2007).
Pods per plant (PP) was the trait showing a higher number of MTAs stable among environments and/or pleiotropic with the highly correlated SPL trait. Stable candidates were “protection of telomeres protein 1b (POT1),” “carboxyl-terminal peptidase (CTP),” “cytochrome c oxidase assembly protein COX15,” “pyrophosphate-energized vacuolar membrane proton pump,” and “E3 ubiquitin-protein ligase PRT1.” Telomeres are nucleoprotein complexes that physically cap the ends of chromosomes preventing them from rapid degradation. “Carboxyl-terminal peptidase (CTP)” represents an unusual and poorly understood class of serine proteases found in a broad range of organisms, controlling multiple cellular processes (binding, posttranslational modifications, and trafficking), through posttranslational modification of proteins (Carroll et al., 2014). COX is the last enzyme of the mitochondrial respiratory chain, playing a key role in the regulation of aerobic production of energy. The lack of mutant plants in COX components, due to embryonic lethality, highlights the importance of COX activity in plants (Mansilla et al., 2018). Next, vacuolar proton pyrophosphatases facilitate auxin biosynthesis, transport, signaling, conjugation, and catabolism during seed development (Cao et al., 2020). Auxin is a regulator of yield contributing to ovule and seed growth, morphogenesis, and progression through different reproductive stages in Arabidopsis, rice, or maize among other examples (Shirley et al., 2019). Finally, E3 ubiquitin-ligases are involved in the regulation of plant innate immunity (Duplan and Rivas, 2014) and also affect the induction of flowering in angiosperms, ensuring their formation when conditions are optimal for pollination and that seeds or subsequent seedlings have time to develop. Pleiotropic candidates were “cleavage stimulation factor subunit 50 (CstF-50),” “protein JINGUBANG (JGB),” “DNA repair protein RAD51 homolog,” and “protection of telomeres protein 1b (POT1)” already mentioned above. CstF-50 has a regulatory role that is indispensable for the biogenesis of mRNA and participates in the control of gene expression under DNA-damaging conditions by regulating polyadenylation/deadenylation (Cevher et al., 2010). JGB is a pollen-specific protein containing seven WD40 repeats that regulate pollen germination and tube growth ensuring pollination in moist environments (Ju et al., 2016). Further analysis of the group revealed that JGB interacts with the transcription factor TCP4 to control pollen jasmonic acid synthesis. Interestingly, the consistent and pleiotropic effect of JGB with three yield components (PP, SP, and HSW) may be crucial for molecular breeding of yield-related traits in faba bean. Finally, RAD51 proteins contribute to genome stability by repairing DNA damage after replication, transcription, or cellular metabolic activities and play a direct role in the control of immune responses (Wang et al., 2010). Moreover, the phenotypic characterization of RAD51 in Arabidopsis revealed that this gene has an essential function in male and female meiosis (Li et al., 2004).
Seeds per plant (SPL) was the trait revealing more unknown or uncharacterized proteins. Five candidates were pleiotropic with other yield-related traits: LYK5 (with SPL and SH) and CstF-5, JGB, POT1, and RAD51 (with PP and SPL) explained above.
For hundred-seed weight (HSW), apart from JINGUBANG (JGB), the four SNPs with corresponding candidate genes, explaining a relevant percentage of the variation, were “protein STICHEL-like 2,” whose role in seed size modulation is still not known; “ubiquitin carboxyl-terminal hydrolase 1”; “hydroxyproline O-galactosyltransferase HPGT1”; and “BRISC and BRCA1-A complex member 2.” Several components of the ubiquitin pathway have been found to play critical roles in the regulation of seed and organ size in Arabidopsis and rice (Li and Li, 2014) and in cacao (Bekele et al., 2022). “Hydroxyproline O-galactosyltransferase HPGT1” has a functional role in various aspects of plant growth, development, and fertility (e.g., germination, seed set, seed size and morphology, and silique length) in Arabidopsis (Kaur et al., 2021). Finally, “BRISC and BRCA1-A complex member 2” has been shown to be involved in DNA repair (Block-Schmidt et al., 2011). Other candidates explaining a lower percentage but putatively involved in seed development were “mannan endo-1,4-beta-mannosidase 6”, “UPF0307 protein PMI3641,” and “oleoyl-acyl carrier protein thioesterase 1.”
Finally, in the case of plot yield (PY), nine of the candidates harboring the significant SNPs explained more than 10% of the variation. “DNA-binding protein RHL1” (ROOT HAIRLESS 1 gene) encodes a nuclear protein required for root hair initiation in Arabidopsis (Schneider et al., 1998) and for ploidy-dependent cell growth (Sugimoto-Shirasu et al., 2005). The next candidate was “hypersensitive-induced response protein 1” (HIR1). A highly conserved interaction between receptor-like protein kinase (LRR1) and “hypersensitive-induced response protein 1” (HIR1) homologs is a common mechanism in the defense response of both monocots and dicots (Zhou et al., 2009). “Sucrose-phosphate synthase (SPS)” is a key enzyme in the plant sugar metabolic pathways with functions on growth, development, and yield. Several authors have reported that enhancement of SPS activity provides a higher carbon partitioning that increases growth and grain yield in rice (Sharkey et al., 2000; Mulyatama et al., 2022) or potato (Ishimaru et al., 2008). The next candidate is “basic endochitinase” reported to enhance the defense system of plants (as they act on chitin, the major component of the cell wall) and also to improve plant growth and yield in different crops (Gongora and Broadway, 2002; Jeong et al., 2010). Next, “LRR receptor-like serine/threonine-protein kinases RCH1” has been reported to play vital roles in plant growth and development and the responses to environmental stress (Liu et al., 2017), while “E3 ubiquitin-protein ligase BRE1-like 1” and the ubiquitin system in general affect plant health, reproduction, and responses to the environment, processes that impact important agronomic traits such as the induction of flowering, yield, and pathogen responses (Linden and Callis, 2020).
The relatively large amounts of MTAs associated with yield components identified in this study are promising candidates for follow-up studies on the validation of genes controlling faba bean production. Although most of the MTAs were locally relevant in response to the conditions of a particular location or year, 12 of them (Supplementary Table S4) were stable across different environments and/or were associated with multiple traits. The MTAs identified or the closely linked genes on either flanking side of the significant SNPs are likely to represent significant candidates for the molecular breeding of faba bean yield-related traits.
Genetic dissection of the genomic regions controlling faba bean yield is of great interest for the development of highly productive varieties. By phenotyping a worldwide collection of 400 faba bean accessions in different environments and using a GWAS analysis, this study provides a comprehensive genomic resource for the genetic dissection of yield components in this crop. A wide variability, a high heritability, and a high positive correlation were observed for most of the traits (except for the final PY) in all the environments studied. Overall, the panel revealed 112 associated MTAs linked with six traits. Several clusters of associated markers were distributed along the genome and highlighted important genomic associations. The identification of consistent MTAs that are stable across different environments is of great value to MAS in breeding genotypes adapted to diverse ecological environments. Five of these candidates were also pleiotropic and co-localized with different highly phenotypic correlated traits (i.e., SH, SP, and SPL). Pleiotropic effects are also beneficial in the breeding process as they allow breeders to simultaneously select for multiple traits. Gene annotation showed that the highest percentages of candidates identified have unknown functions or were not found in the current version of the faba bean genome. The detection of new gene sequences in very large and highly repetitive genomes such as that of faba bean remains a significant challenge due to the presence of significant gaps, highlighting the need for a high-quality genome assembly. Even though these candidates or the closely linked genes flanking the significant SNPs remain to be validated in different genetic backgrounds, the identified markers provide a valuable genetic resource for future marker-assisted selection and fine mapping of the genes underlying yield improvement in this crop.
The original contributions presented in the study are included in the article/Supplementary Materials, further inquiries can be directed to the corresponding author/s.
NG: Conceptualization, Formal Analysis, Resources, Writing – original draft, Methodology. MP: Formal Analysis, Software, Supervision, Writing – review & editing. IS: Data curation, Visualization, Writing – review & editing. DS: Data curation, Visualization, Writing – review & editing. DL: Data curation, Visualization, Writing – review & editing. CH: Data curation, Visualization, Writing – review & editing. AT: Conceptualization, Funding acquisition, Project administration, Resources, Supervision, Writing – original draft.
The author(s) declare that financial support was received for the research, authorship, and/or publication of this article. This project has received funding from the European Union’s Horizon 2020 Programme for Research and Innovation under grant agreement n°727312 (EUCLEG Project), PID2020-114952RR-I00 and PR.AVA23.INV2023.009 co-financed by ERDF.
We thank the seed companies (NORGEN, Boreal, and NPZ) and the institutes that provided us with faba bean seeds from their accessions: Universidad de Göttingen (Germany), IFVCNS (Institute of Field and Vegetable Crops, Serbia), Research Institute for Fodder Crops (Czech Republic), University of Ghent (Belgium), INRA Dijon (Jean-Bernard Magnin-Robert), ICARDA (Fouad Maalouf), and IFAPA. The technical staff of IFAPA, “centro Alameda del Obispo” is thanked for their deep investment to multiply accessions and collect leaves for genotyping. Grace Gay and Ellen Sizer Coverdale are thanked for their hard work in phenotyping the field trial in Aberystwyth. The authors are grateful to Dragan Milic and Miroslav Zoric for setting up the experimental augmented design.
Author IS was employed by the company Agrovegetal S.A. Agrovegetal S.A. was a partner of the EUCLEG project.
The remaining authors declare that the research was conducted in the absence of any commercial or financial relationships that could be construed as a potential conflict of interest.
The handling editor ÅE declared a past collaboration with the author MP.
All claims expressed in this article are solely those of the authors and do not necessarily represent those of their affiliated organizations, or those of the publisher, the editors and the reviewers. Any product that may be evaluated in this article, or claim that may be made by its manufacturer, is not guaranteed or endorsed by the publisher.
The Supplementary Material for this article can be found online at: https://www.frontiersin.org/articles/10.3389/fpls.2024.1328690/full#supplementary-material
Abdurakhmonov, I. Y., Kohel, R. J., Yu, J. Z., Pepper, A. E., Abdullaev, A. A., Kushanov, F. N., et al. (2008). Molecular diversity and association mapping of fiber quality traits in exotic G. hirsutum L. germplasm. Genomics 92, 478–487. doi: 10.1016/j.ygeno.2008.07.013
Abou-Khater, L., Maalouf, F., Jighly, A., Rubiales, D., Kumar, S. (2022). Adaptability and Stability of Faba Bean (Vicia faba L.) Accessions under Diverse Environments and Herbicide Treatments. Plants 11 (3), 251. doi: 10.3390/plants11030251
Adhikari, K. N., Khazaei, H., Ghaouti, L., Maalouf, F., Vandenberg, A., Link, W., et al. (2021). Conventional and molecular breeding tools for accelerating genetic gain in faba bean (Vicia faba L.). Front. Plant Sci. 12. doi: 10.3389/fpls.2021.744259
Ali, M. B. M., Welna, G. C., Sallam, A., Martsch, R., Balko, C., Gebser, B., et al. (2016). Association analyses to genetically improve drought and freezing tolerance of Faba bean (Vicia faba L.). Crop Sci. 56, 1036–1048. doi: 10.2135/cropsci2015.08.0503
Ávila, C. M., Ruiz-Rodríguez, M. D., Cruz-Izquierdo, S., Atienza, S. G., Cubero, J. I., Torres, A. M. (2017). Identification of plant architecture and yield-related QTL in Vicia faba L. Mol. Breed. 37, 88. doi: 10.1007/s11032-017-0688-7
Avila, C. M., Satovic, Z., Sillero, J. C., Rubiales, D., Moreno, M. T., Torres, A. M. (2005). QTL detection for agronomic traits in faba bean (Vicia faba L.). Agriculturae Conspectus Scientificus 70, 65–73.
Bacete, L., Hamann, T. (2020). The role of mechanoperception in plant cell wall integrity maintenance. Plants 9 (5), 574. doi: 10.3390/plants9050574
Badke, Y. M., Bates, R. O., Ernst, C. W., Fix, J., Steibel, J. P. (2014). Accuracy of estimation of genomic breeding values in pigs using low-density genotypes and imputation. G3 (Bethesda) 4, 623–631. doi: 10.1534/g3.114.010504
Baez, L. A., Tichá, T., Hamann, T. (2022). Cell wall integrity regulation across plant species. Plant Mol. Biol. 109, 483–504. doi: 10.1007/s11103-022-01284-7
Ban, N., Nissen, P., Hansen, J., Moore, P. B., Steitz, T. A. (2000). The complete atomic structure of the large ribosomal subunit at 2.4 A resolution. Science 289, 905–920. doi: 10.1126/science.289.5481.905
Beji, S., Fontaine, V., Devaux, R., Thomas, M., Negro, S. S., Bahrman, N., et al. (2020). Genome-wide association study identifies favorable SNP alleles and candidate genes for frost tolerance in pea. BMC Genomics 21, 536. doi: 10.1186/s12864-020-06928-w
Bekele, F. L., Bidaisee, G. G., Allegre, M., Argout, X., Fouet, O., Boccara, M., et al. (2022). Genome-wide association studies and genomic selection assays made in a large sample of cacao (Theobroma cacao L.) germplasm reveal significant marker-trait associations and good predictive value for improving yield potential. PloS One 17, e0260907. doi: 10.1371/journal.pone.0260907
Bhatnagar, N., Min, M.-K., Choi, E.-H., Kim, N., Moon, S.-J., Yoon, I., et al. (2017). The protein phosphatase 2C clade A protein OsPP2C51 positively regulates seed germination by directly inactivating OsbZIP10. Plant Mol. Biol. 93, 389–401. doi: 10.1007/s11103-016-0568-2
Block-Schmidt, A. S., Dukowic-Schulze, S., Wanieck, K., Reidt, W., Puchta, H. (2011). BRCC36A is epistatic to BRCA1 in DNA crosslink repair and homologous recombination in Arabidopsis thaliana. Nucleic Acids Res. 39, 146–154. doi: 10.1093/nar/gkq722
Bonhomme, M., André, O., Badis, Y., Ronfort, J., Burgarella, C., Chantret, N., et al. (2014). High-density genome-wide association mapping implicates an F-box encoding gene in Medicago truncatula resistance to Aphanomyces euteiches. New Phytol. 201, 1328–1342. doi: 10.1111/nph.12611
Bonnafous, F., Duhnen, A., Gody, L., Guillaume, O., Mangin, B., Pegot-Espagnet, P., et al. (2019). mlmm.gwas: Pipeline for GWAS Using MLMM (CRAN). Available at: https://CRAN.R-project.org/package=mlmm.gwas.
Bradbury, P. J., Zhang, Z., Kroon, D. E., Casstevens, T. M., Ramdoss, Y., Buckler, E. S. (2007). TASSEL: software for association mapping of complex traits in diverse samples. Bioinformatics 23, 2633–2635. doi: 10.1093/bioinformatics/btm308
Calus, M. P. L., Veerkamp, R. F. (2011). Accuracy of multi-trait genomic selection using different methods. Genet. Sel. Evol. 43, 26. doi: 10.1186/1297-9686-43-26
Cantalapiedra, C. P., Hernández-Plaza, A., Letunic, I., Bork, P., Huerta-Cepas, J. (2021). eggNOG-mapper v2: Functional Annotation, Orthology Assignments, and Domain Prediction at the Metagenomic Scale. Mol. Biol. Evol. 38, 5825–5829. doi: 10.1093/molbev/msab293
Cantet, R. J. C., Birchmeier, A. N., Canaza Cayo, A. W., Fioretti, C. (2005). Semiparametric animal models via penalized splines as alternatives to models with contemporary groups. J. Anim. Sci. 83, 2482–2494. doi: 10.2527/2005.83112482x
Cao, J., Li, G., Qu, D., Li, X., Wang, Y. (2020). Into the seed: auxin controls seed development and grain yield. Int. J. Mol. Sci. 21 (5), 1662. doi: 10.3390/ijms21051662
Cappa, E. P., Cantet, R. J. C. (2007). Bayesian estimation of a surface to account for a spatial trend using penalized splines in an individual-tree mixed model. Can. J. For. Res. 37, 2677–2688. doi: 10.1139/X07-116
Cappa, E. P., Muñoz, F., Sanchez, L., Cantet, R. J. C. (2015). A novel individual-tree mixed model to account for competition and environmental heterogeneity: a Bayesian approach. Tree Genet. Genomes 11, 120. doi: 10.1007/s11295-015-0917-3
Carranca, C., Varennes de, A., Rolston, D. (1999). Biological nitrogen fixation by faba bean, pea and chickpea, under field conditions, estimated by the 15N isotope dilution technique. Eur. J. Agron. 10, 49–56. doi: 10.1016/S1161-0301(98)00049-5
Carroll, R. K., Rivera, F. E., Cavaco, C. K., Johnson, G. M., Martin, D., Shaw, L. N. (2014). The lone S41 family C-terminal processing protease in Staphylococcus aureus is localized to the cell wall and contributes to virulence. Microbiol. (Reading Engl) 160, 1737–1748. doi: 10.1099/mic.0.079798-0
Cernay, C., Pelzer, E., Makowski, D. (2016). A global experimental dataset for assessing grain legume production. Sci. Data 3, 160084. doi: 10.1038/sdata.2016.84
Cevher, M. A., Zhang, X., Fernandez, S., Kim, S., Baquero, J., Nilsson, P., et al. (2010). Nuclear deadenylation/polyadenylation factors regulate 3’ processing in response to DNA damage. EMBO J. 29, 1674–1687. doi: 10.1038/emboj.2010.59
Cruz-Izquierdo, S., Avila, C. M., Satovic, Z., Palomino, C., Gutierrez, N., Ellwood, S. R., et al. (2012). Comparative genomics to bridge Vicia faba with model and closely-related legume species: stability of QTLs for flowering and yield-related traits. Theor. Appl. Genet. 125, 1767–1782. doi: 10.1007/s00122-012-1952-1
Cubero, J. I. (1973). Evolutionary trends in Vicia faba. Theor. Appl. Genet. 43, 59–65. doi: 10.1007/BF00274958
Das, S., Singh, M., Srivastava, R., Bajaj, D., Saxena, M. S., Rana, J. C., et al. (2016). mQTL-seq delineates functionally relevant candidate gene harbouring a major QTL regulating pod number in chickpea. DNA Res. 23, 53–65. doi: 10.1093/dnares/dsv036
Duan, Z., Zhang, M., Zhang, Z., Liang, S., Fan, L., Yang, X., et al. (2022). Natural allelic variation of GmST05 controlling seed size and quality in soybean. Plant Biotechnol. J. 20, 1807–1818. doi: 10.1111/pbi.13865
Duplan, V., Rivas, S. (2014). E3 ubiquitin-ligases and their target proteins during the regulation of plant innate immunity. Front. Plant Sci. 5. doi: 10.3389/fpls.2014.00042
FAOSTAT (2020) FAOSTAT. Available online at: http://www.fao.org/faostat/en/#data (Accessed June 17, 2021).
Faridi, R., Koopman, B., Schierholt, A., Ali, M. B., Apel, S., Link, W. (2021). Genetic study of the resistance of faba bean (Vicia faba) against the fungus Ascochyta fabae through a genome-wide association analysis. Plant Breed. 140, 442–452. doi: 10.1111/pbr.12918
Gongora, C. E., Broadway, R. M. (2002). Plant growth and development influenced by transgenic insertion of bacterial chitinolytic enzymes. Mol. Breeding. 9, 123–135. doi: 10.1023/A:1026732124713
Govindaraj, M., Vetriventhan, M., Srinivasan, M. (2015). Importance of genetic diversity assessment in crop plants and its recent advances: an overview of its analytical perspectives. Genet. Res. Int. 2015, 431487. doi: 10.1155/2015/431487
Gutiérrez, N., Pégard, M., Balko, C., Torres, A. M. (2023). Genome-wide association analysis for drought tolerance and associated traits in faba bean (Vicia faba L.). Front. Plant Sci. 14. doi: 10.3389/fpls.2023.1091875
Huang, J., Lu, G., Liu, L., Raihan, M. S., Xu, J., Jian, L., et al. (2020). The Kernel Size-Related Quantitative Trait Locus qKW9 Encodes a Pentatricopeptide Repeat Protein That affects Photosynthesis and Grain Filling. Plant Physiol. 183, 1696–1709. doi: 10.1104/pp.20.00374
Huerta-Cepas, J., Szklarczyk, D., Heller, D., Hernández-Plaza, A., Forslund, S. K., Cook, H., et al. (2019). eggNOG 5.0: a hierarchical, functionally and phylogenetically annotated orthology resource based on 5090 organisms and 2502 viruses. Nucleic Acids Res. 47, D309–D314. doi: 10.1093/nar/gky1085
Hwang, E.-Y., Song, Q., Jia, G., Specht, J. E., Hyten, D. L., Costa, J., et al. (2014). A genome-wide association study of seed protein and oil content in soybean. BMC Genomics 15, 1. doi: 10.1186/1471-2164-15-1
Ishimaru, K., Hirotsu, N., Kashiwagi, T., Madoka, Y., Nagasuga, K., Ono, K., et al. (2008). Overexpression of a maize SPS gene improves yield characters of potato under field conditions. Plant Prod. Sci. 11, 104–107. doi: 10.1626/pps.11.104
Jayakodi, M., Golicz, A. A., Kreplak, J., Fechete, L. I., Angra, D., Bednář, P., et al. (2023). The giant diploid faba genome unlocks variation in a global protein crop. Nature 615, 652–659. doi: 10.1038/s41586-023-05791-5
Jeong, J. S., Kim, Y. S., Baek, K. H., Jung, H., Ha, S.-H., Do Choi, Y., et al. (2010). Root-specific expression of OsNAC10 improves drought tolerance and grain yield in rice under field drought conditions. Plant Physiol. 153, 185–197. doi: 10.1104/pp.110.154773
Ju, Y., Guo, L., Cai, Q., Ma, F., Zhu, Q.-Y., Zhang, Q., et al. (2016). Arabidopsis JINGUBANG is a negative regulator of pollen germination that prevents pollination in moist environments. Plant Cell 28, 2131–2146. doi: 10.1105/tpc.16.00401
Kaler, A. S., Purcell, L. C. (2019). Estimation of a significance threshold for genome-wide association studies. BMC Genomics 20, 618. doi: 10.1186/s12864-019-5992-7
Kassambara, A., Mundt, F. (2020). Factoextra: extract and visualize the results of multivariate data analyses. Available at: https://CRAN.R-project.org/package=factoextra.
Kaur, D., Held, M. A., Smith, M. R., Showalter, A. M. (2021). Functional characterization of hydroxyproline-O-galactosyltransferases for Arabidopsis arabinogalactan-protein synthesis. BMC Plant Biol. 21, 590. doi: 10.1186/s12870-021-03362-2
Keeble-Gagnère, G., Isdale, D., Suchecki, R., Kruger, A., Lomas, K., Carroll, D., et al. (2019). Integrating past, present and future wheat research with Pretzel. BioRxiv. doi: 10.1101/517953
Khan, H., Krishnappa, G., Kumar, S., Mishra, C. N., Krishna, H., Devate, N. B., et al. (2022). Genome-wide association study for grain yield and component traits in bread wheat (Triticum aestivum L.). Front. Genet. 13. doi: 10.3389/fgene.2022.982589
Khazaei, H., O’Sullivan, D. M., Stoddard, F. L., Adhikari, K. N., Paull, J. G., Schulman, A. H., et al. (2021). Recent advances in faba bean genetic and genomic tools for crop improvement. Legume Sci. 3, e75. doi: 10.1002/leg3.75
Kim, W., Lee, Y., Park, J., Lee, N., Choi, G. (2013). HONSU, a protein phosphatase 2C, regulates seed dormancy by inhibiting ABA signaling in Arabidopsis. Plant Cell Physiol. 54, 555–572. doi: 10.1093/pcp/pct017
Klein, D. J., Moore, P. B., Steitz, T. A. (2004). The roles of ribosomal proteins in the structure assembly, and evolution of the large ribosomal subunit. J. Mol. Biol. 340, 141–177. doi: 10.1016/j.jmb.2004.03.076
Köpke, U., Nemecek, T. (2010). Ecological services of faba bean. Field Crops Res. 115, 217–233. doi: 10.1016/j.fcr.2009.10.012
Li, W., Chen, C., Markmann-Mulisch, U., Timofejeva, L., Schmelzer, E., Ma, H., et al. (2004). The Arabidopsis AtRAD51 gene is dispensable for vegetative development but required for meiosis. Proc. Natl. Acad. Sci. U.S.A. 101, 10596–10601. doi: 10.1073/pnas.0404110101
Li, N., Li, Y. (2014). Ubiquitin-mediated control of seed size in plants. Front. Plant Sci. 5. doi: 10.3389/fpls.2014.00332
Li, J., Zhang, Y., Ma, R., Huang, W., Hou, J., Fang, C., et al. (2022). Identification of ST1 reveals a selection involving hitchhiking of seed morphology and oil content during soybean domestication. Plant Biotechnol. J. 20, 1110–1121. doi: 10.1111/pbi.13791
Li, Z., Zhang, X., Zhao, K., Zhao, K., Qu, C., Gao, G., et al. (2021). Comprehensive transcriptome analyses reveal candidate genes for variation in seed size/weight during peanut (Arachis hypogaea L.) domestication. Front. Plant Sci. 12. doi: 10.3389/fpls.2021.666483
Lin, C. S., Poushinsky, G. (1983). A modified augmented design for an early stage of plant selection involving a large number of test lines without replication. Biometrics 39, 553–561. doi: 10.2307/2531083
Linden, K. J., Callis, J. (2020). The ubiquitin system affects agronomic plant traits. J. Biol. Chem. 295, 13940–13955. doi: 10.1074/jbc.REV120.011303
Liu, P.-L., Du, L., Huang, Y., Gao, S.-M., Yu, M. (2017). Origin and diversification of leucine-rich repeat receptor-like protein kinase (LRR-RLK) genes in plants. BMC Evol. Biol. 17, 47. doi: 10.1186/s12862-017-0891-5
Liu, Y.-J., Xiu, Z.-H., Meeley, R., Tan, B.-C. (2013). Empty pericarp5 encodes a pentatricopeptide repeat protein that is required for mitochondrial RNA editing and seed development in maize. Plant Cell 25, 868–883. doi: 10.1105/tpc.112.106781
Lopez-Bellido, L., Lopez-Bellido, R. J., Redondo, R., Benítez, J. (2006). Faba bean nitrogen fixation in a wheat-based rotation under rainfed Mediterranean conditions: Effect of tillage system. Field Crop Res. 98, 253–260. doi: 10.1016/j.fcr.2006.03.001
Maalouf, F., Abou-Khater, L., Babiker, Z., Jighly, A., Alsamman, A. M., Hu, J., et al. (2022). Genetic dissection of heat stress tolerance in faba bean (Vicia faba L.) using GWAS. Plants 11 (9), 1108. doi: 10.3390/plants11091108
Mangini, G., Gadaleta, A., Colasuonno, P., Marcotuli, I., Signorile, A. M., Simeone, R., et al. (2018). Genetic dissection of the relationships between grain yield components by genome-wide association mapping in a collection of tetraploid wheats. PloS One 13, e0190162. doi: 10.1371/journal.pone.0190162
Mansilla, N., Racca, S., Gras, D. E., Gonzalez, D. H., Welchen, E. (2018). The complexity of mitochondrial complex IV: an update of cytochrome c oxidase biogenesis in plants. Int. J. Mol. Sci. 19 (3), 662. doi: 10.3390/ijms19030662
Money, D., Gardner, K., Migicovsky, Z., Schwaninger, H., Zhong, GY., Myles, S. (2015). LinkImpute: Fast and Accurate Genotype Imputation for Nonmodel Organisms. G3 (Bethesda) 5 (11), 2383–90. doi: 10.1534/g3.115.021667
Meuwissen, T. H., Hayes, B. J., Goddard, M. E. (2001). Prediction of total genetic value using genome-wide dense marker maps. Genetics 157, 1819–1829. doi: 10.1093/genetics/157.4.1819
Mulyatama, R. A., Neliana, I. R., Sawitri, W. D., Sakakibara, H., Kim, K.-M., Sugiharto, B. (2022). Increasing the activity of sugarcane sucrose phosphate synthase enhanced growth and grain yields in transgenic indica rice. Agronomy 12, 2949. doi: 10.3390/agronomy12122949
Muñoz, F., Sanchez, L. (2020) BreedR: Statistical Methods for Forest Genetic Resources Analysts. Available online at: https://github.com/famuvie/breedR.
Naran, R., Pierce, M. L., Mort, A. J. (2007). Detection and identification of rhamnogalacturonan lyase activity in intercellular spaces of expanding cotton cotyledons. Plant J. 50, 95–107. doi: 10.1111/j.1365-313X.2007.03033.x
Ochoa-Jiménez, V.-A., Berumen-Varela, G., Burgara-Estrella, A., Orozco-Avitia, J.-A., Ojeda-Contreras, Á.-J., Trillo-Hernández, E.-A., et al. (2018). Functional analysis of tomato rhamnogalacturonan lyase gene Solyc11g011300 during fruit development and ripening. J. Plant Physiol. 231, 31–40. doi: 10.1016/j.jplph.2018.09.001
Ogutcen, E., Pandey, A., Khan, M. K., Marques, E., Penmetsa, R. V., Kahraman, A., et al. (2018). Pod shattering: A homologous series of variation underlying domestication and an avenue for crop improvement. Agronomy 8, 137. doi: 10.3390/agronomy8080137
O’Sullivan, D. M., Angra, D., Harvie, T., Tagkouli, V., Warsame, A. (2019). “A genetic toolbox for Vicia faba improvement,” in International Conference on Legume Genetics and Genomics (ICLGG) (Dijon) pp. 157.
Pan, J., Li, Z., Wang, Q., Garrell, A. K., Liu, M., Guan, Y., et al. (2018). Comparative proteomic investigation of drought responses in foxtail millet. BMC Plant Biol. 18, 315. doi: 10.1186/s12870-018-1533-9
Park, H.-Y., Lee, H. T., Lee, J. H., Kim, J.-K. (2019). Arabidopsis U2AF65 regulates flowering time and the growth of pollen tubes. Front. Plant Sci. 10. doi: 10.3389/fpls.2019.00569
Pégard, M., Barre, P., Delaunay, S., Surault, F., Karagić, D., Milić, D., et al. (2023). Genome-wide genotyping data renew knowledge on genetic diversity of a worldwide alfalfa collection and give insights on genetic control of phenology traits. Front. Plant Sci. 14. doi: 10.3389/fpls.2023.1196134
Porter, K., Day, B. (2016). From filaments to function: The role of the plant actin cytoskeleton in pathogen perception, signaling and immunity. J. Integr. Plant Biol. 58, 299–311. doi: 10.1111/jipb.12445
Purcell, S., Neale, B., Todd-Brown, K., Thomas, L., Ferreira, M. A. R., Bender, D., et al. (2007). PLINK: a tool set for whole-genome association and population-based linkage analyses. Am. J. Hum. Genet. 81, 559–575. doi: 10.1086/519795
Raggi, L., Caproni, L., Carboni, A., Negri, V. (2019). Genome-wide association study reveals candidate genes for flowering time variation in common bean (Phaseolus vulgaris L.). Front. Plant Sci. 10. doi: 10.3389/fpls.2019.00962
Raj, A., Stephens, M., Pritchard, J. K. (2014). fastSTRUCTURE: variational inference of population structure in large SNP data sets. Genetics 197, 573–589. doi: 10.1534/genetics.114.164350
Ramsay, G., Van de Ven, W., Waugh, R., Griffiths, D. W., Powell, W. (1995). “Mapping Quantitative trait loci in faba beans,” in Improving production and utilization of grain legumes. Second European Conference on Grain Legumes(Copenhagen, Denmark), 444–445.
R Core Team (2022). A Language and Environment for Statistical Computing (Vienna, Austria: R Foundation for Statistical Computing).
Saha, A., Das, S., Moin, M., Dutta, M., Bakshi, A., Madhav, M. S., et al. (2017). Genome-wide identification and comprehensive expression profiling of ribosomal protein small subunit (RPS) genes and their comparative analysis with the large subunit (RPL) genes in rice. Front. Plant Sci. 8. doi: 10.3389/fpls.2017.01553
Sallam, A., Arbaoui, M., El-Esawi, M., Abshire, N., Martsch, R. (2016). Identification and verification of QTL associated with frost tolerance using linkage mapping and GWAS in winter faba bean. Front. Plant Sci. 7. doi: 10.3389/fpls.2016.01098
Sami, A. A., Arabia, S., Sarker, R. H., Islam, T. (2021). Deciphering the role of helicases and translocases: A multifunctional gene family safeguarding plants from diverse environmental adversities. Curr. Plant Biol. 26, 100204. doi: 10.1016/j.cpb.2021.100204
Schneider, K., Mathur, J., Boudonck, K., Wells, B., Dolan, L., Roberts, K. (1998). The ROOT HAIRLESS 1 gene encodes a nuclear protein required for root hair initiation in Arabidopsis. Genes Dev. 12, 2013–2021. doi: 10.1101/gad.12.13.2013
Schwenke, G. D., Peoples, M. B., Turner, G. L., Herridge, D. F. (1998). Does nitrogen fixation of commercial, dryland chickpea and faba bean crops in north-west New South Wales maintain or enhance soil nitrogen? Aust. J. Exp. Agric. 38, 61–70. doi: 10.1071/EA97078
Segura, V., Vilhjálmsson, B. J., Platt, A., Korte, A., Seren, Ü., Long, Q., et al. (2012). An efficient multi-locus mixed-model approach for genome-wide association studies in structured populations. Nat. Genet. 44, 825–830. doi: 10.1038/ng.2314
Sharkey, T. D., Laporte, M. M., Kruger, E. L. (2000). “Will increased photosynthetic efficiency lead to increased yield in rice? Stud. Plant Sci. 7, 73–86. doi: 10.1016/S0928-3420(00)80007-5
Shirley, N. J., Aubert, M. K., Wilkinson, L. G., Bird, D. C., Lora, J., Yang, X., et al. (2019). Translating auxin responses into ovules, seeds and yield: Insight from Arabidopsis and the cereals. J. Integr. Plant Biol. 61, 310–336. doi: 10.1111/jipb.12747
Singh, L., Dhillon, G. S., Kaur, S., Dhaliwal, S. K., Kaur, A., Malik, P., et al. (2022). Genome-wide association study for yield and yield-related traits in diverse blackgram panel (Vigna mungo L. Hepper) reveals novel putative alleles for future breeding programs. Front. Genet. 13. doi: 10.3389/fgene.2022.849016
Skovbjerg, C. K., Angra, D., Robertson-Shersby-Harvie, T., Kreplak, J., Keeble-Gagnère, G., Kaur, S., et al. (2023). Genetic analysis of global faba bean diversity, agronomic traits and selection signatures. Theor. Appl. Genet. 136, 114. doi: 10.1007/s00122-023-04360-8
Sugimoto-Shirasu, K., Roberts, G. R., Stacey, N. J., McCann, M. C., Maxwell, A., Roberts, K. (2005). RHL1 is an essential component of the plant DNA topoisomerase VI complex and is required for ploidy-dependent cell growth. Proc. Natl. Acad. Sci. U.S.A. 102, 18736–18741. doi: 10.1073/pnas.0505883102
Szymanski, D., Staiger, C. J. (2018). The actin cytoskeleton: functional arrays for cytoplasmic organization and cell shape control. Plant Physiol. 176, 106–118. doi: 10.1104/pp.17.01519
Tamura, K., Stecher, G., Kumar, S. (2021). MEGA11: molecular evolutionary genetics analysis version 11. Mol. Biol. Evol. 38, 3022–3027. doi: 10.1093/molbev/msab120
Tang, H., Cuevas, H. E., Das, S., Sezen, U. U., Zhou, C., Guo, H., et al. (2013). Seed shattering in a wild sorghum is conferred by a locus unrelated to domestication. Proc. Natl. Acad. Sci. U.S.A. 110, 15824–15829. doi: 10.1073/pnas.1305213110
Toker, C. (2004). Estimates of broad-sense heritability for seed yield and yield criteria in faba bean (Vicia faba L.). Hereditas 140, 222–225. doi: 10.1111/j.1601-5223.2004.01780.x
Umezawa, T., Sugiyama, N., Mizoguchi, M., Hayashi, S., Myouga, F., Yamaguchi-Shinozaki, K., et al. (2009). Type 2C protein phosphatases directly regulate abscisic acid-activated protein kinases in Arabidopsis. Proc. Natl. Acad. Sci. U.S.A. 106, 17588–17593. doi: 10.1073/pnas.0907095106
VanRaden, P. M. (2008). Efficient methods to compute genomic predictions. J. Dairy Sci. 91, 4414–4423. doi: 10.3168/jds.2007-0980
Varshney, R. K., Saxena, R. K., Upadhyaya, H. D., Khan, A. W., Yu, Y., Kim, C., et al. (2017). Whole-genome resequencing of 292 pigeonpea accessions identifies genomic regions associated with domestication and agronomic traits. Nat. Genet. 49, 1082–1088. doi: 10.1038/ng.3872
Varshney, R. K., Thudi, M., Roorkiwal, M., He, W., Upadhyaya, H. D., Yang, W., et al. (2019). Resequencing of 429 chickpea accessions from 45 countries provides insights into genome diversity, domestication and agronomic traits. Nat. Genet. 51, 857–864. doi: 10.1038/s41588-019-0401-3
Vicente, A. R., Saladié, M., Rose, J. K., Labavitch, J. M. (2007). The linkage between cell wall metabolism and fruit softening: looking to the future. J. Sci. Food Agric. 87, 1435–1448. doi: 10.1002/jsfa.2837
Wang, S., Durrant, W. E., Song, J., Spivey, N. W., Dong, X. (2010). Arabidopsis BRCA2 and RAD51 proteins are specifically involved in defense gene transcription during plant immune responses. Proc. Natl. Acad. Sci. U.S.A. 107, 22716–22721. doi: 10.1073/pnas.1005978107
Warsame, A. O., O’Sullivan, D. M., Tosi, P. (2018). Seed storage proteins of Faba bean (Vicia faba L): current status and prospects for genetic improvement. J. Agric. Food Chem. 66, 12617–12626. doi: 10.1021/acs.jafc.8b04992
Whittaker, J. C., Thompson, R., Denham, M. C. (2000). Marker-assisted selection using ridge regression. Genet. Res. 75, 249–252. doi: 10.1017/S0016672399004462
Wickham, H. (2016). ggplot2: Elegant Graphics for Data Analysis. Editors: Gentleman, R., Hornik, K., Parmigiani, G.. Springer. doi: 10.1007/978-3-319-24277-4
Xu, S., Dai, Z., Guo, P., Fu, X., Liu, S., Zhou, L., et al. (2021). ggtreeExtra: compact visualization of richly annotated phylogenetic data. Mol. Biol. Evol. 38, 4039–4042. doi: 10.1093/molbev/msab166
Xu, S., Li, L., Luo, X., Chen, M., Tang, W., Zhan, L., et al. (2022). Ggtree : A serialized data object for visualization of a phylogenetic tree and annotation data. iMeta. doi: 10.1002/imt2.56
Zanotto, S., Ruttink, T., Pégard, M., Skøt, L., Grieder, C., Kölliker, R., et al. (2023). A genome-wide association study of freezing tolerance in red clover (Trifolium pratense L.) germplasm of European origin. Front. Plant Sci. 14. doi: 10.3389/fpls.2023.1189662
Zhang, H., Liu, Y., Zong, X., Teng, C., Hou, W., Li, P., et al. (2023). Genetic diversity of global faba bean germplasm resources based on the 130K TNGS genotyping platform. Agronomy 13, 811. doi: 10.3390/agronomy13030811
Zhou, L., Cheung, M.-Y., Zhang, Q., Lei, C.-L., Zhang, S.-H., Sun, S. S.-M., et al. (2009). A novel simple extracellular leucine-rich repeat (eLRR) domain protein from rice (OsLRR1) enters the endosomal pathway and interacts with the hypersensitive-induced reaction protein 1 (OsHIR1). Plant Cell Environ. 32, 1804–1820. doi: 10.1111/j.1365-3040.2009.02039.x
Keywords: yield, heritability, population structure, linkage disequilibrium, GWAS, MTA markers, candidate genes, faba bean
Citation: Gutierrez N, Pégard M, Solis I, Sokolovic D, Lloyd D, Howarth C and Torres AM (2024) Genome-wide association study for yield-related traits in faba bean (Vicia faba L.). Front. Plant Sci. 15:1328690. doi: 10.3389/fpls.2024.1328690
Received: 27 October 2023; Accepted: 26 February 2024;
Published: 13 March 2024.
Edited by:
Åshild Ergon, Norwegian University of Life Sciences, NorwayCopyright © 2024 Gutierrez, Pégard, Solis, Sokolovic, Lloyd, Howarth and Torres. This is an open-access article distributed under the terms of the Creative Commons Attribution License (CC BY). The use, distribution or reproduction in other forums is permitted, provided the original author(s) and the copyright owner(s) are credited and that the original publication in this journal is cited, in accordance with accepted academic practice. No use, distribution or reproduction is permitted which does not comply with these terms.
*Correspondence: Natalia Gutierrez, bmF0YWxpYS5ndXRpZXJyZXoubGVpdmFAanVudGFkZWFuZGFsdWNpYS5lcw==
Disclaimer: All claims expressed in this article are solely those of the authors and do not necessarily represent those of their affiliated organizations, or those of the publisher, the editors and the reviewers. Any product that may be evaluated in this article or claim that may be made by its manufacturer is not guaranteed or endorsed by the publisher.
Research integrity at Frontiers
Learn more about the work of our research integrity team to safeguard the quality of each article we publish.