- College of Life Sciences, Nanchang University, Nanchang, China
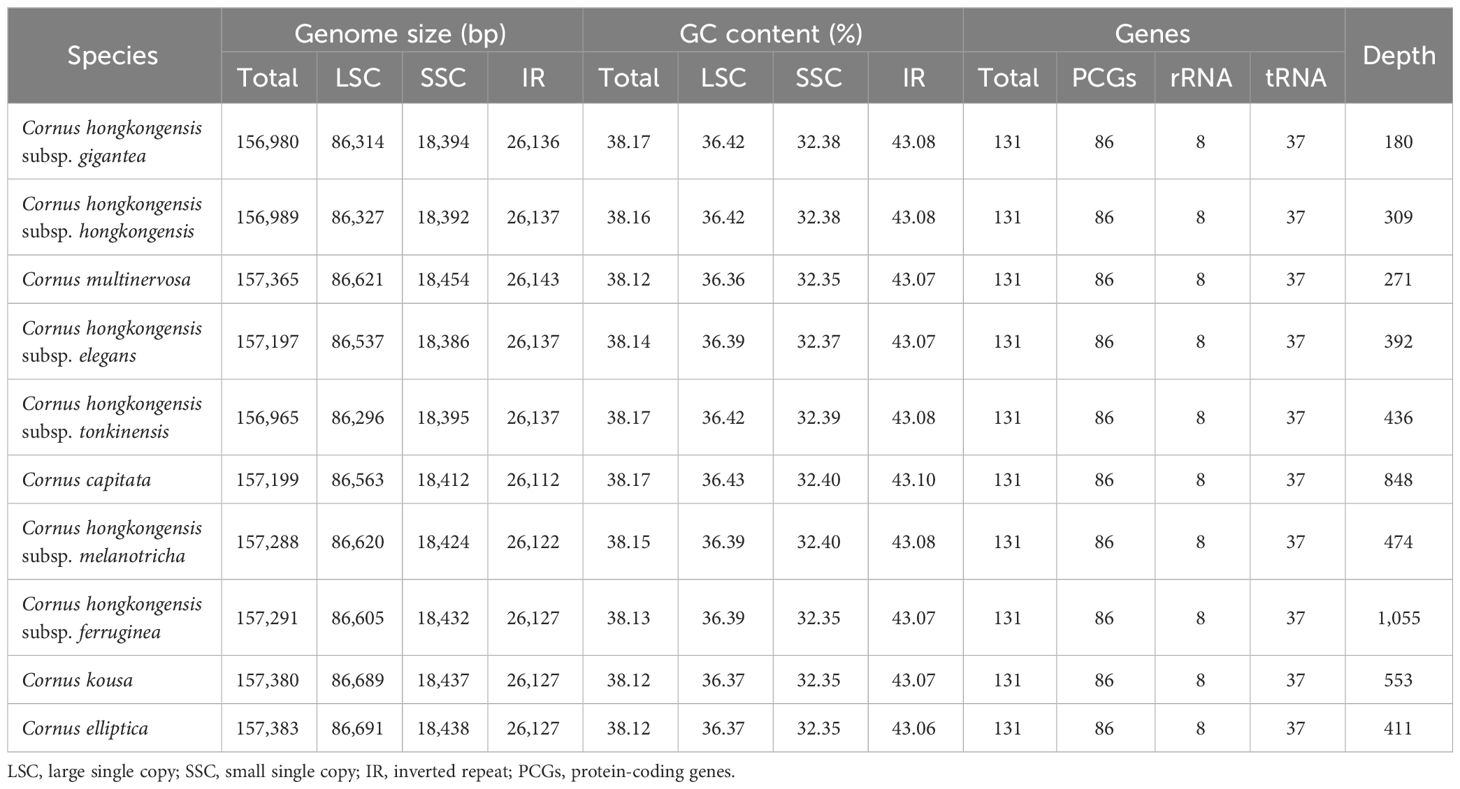
This study presents a comprehensive analysis of the chloroplast (cp) genomes of Cornus species, including comparative and phylogenetic evaluations, as well as examinations of their genomic structure and composition. The cp genomes exhibit a typical circular quadripartite structure and demonstrate highly similar gene order and genomic structure. The complete cp genome size of the 10 taxa in this study is 156,965 bp to 157,383 bp, where the length of the large single-copy (LSC) region is 86,296 bp to 86,691 bp, small single-copy (SSC) region is 18,386 bp to 18,454 bp, and inverted repeat (IR) region is 23,143 bp to 26,112 bp. A total of 131 genes were found, including 86 protein-coding genes (PCGs), eight rRNA genes, and 37 tRNA genes. The mean GC content of the 10 taxa is 38.145%, where the LSC region is 36.396%, the SSC region is 32.372%, and the IR region is 43.076%. Despite the relatively conserved nature of the cp genome within the species of Cornus, 25–31 simple sequence repeats (SSRs) were identified in the 10 taxa in our study. The SSRs were found to be distributed in the LSC, SSC, and IR regions in Cornus hongkongensis subsp. hongkongensis, C. hongkongensis subsp. elegans, C. hongkongensis subsp. gigantea, and C. hongkongensis subsp. tonkinensis, while the SSR was not found in the IR region of the other six taxa. Thus, whole cp genomics is a valuable tool for species identification, taxonomic clarification, and genomic evolutionary analysis. Furthermore, our findings reveal that C. hongkongensis and C. hongkongensis subsp. gigantea, along with Cornus kousa and Cornus elliptica, form sister groups. Notably, C. hongkongensis subsp. ferruginea and C. hongkongensis subsp. melanotricha did not exhibit affinity with C. hongkongensis subsp. hongkongensis. Our study furnishes essential data for further research on their classification and provides novel insights into the relationship within Cornus subg. Syncarpea.
1 Introduction
The classification of the species within the Cornus genus has been a subject of controversy, yielding varying conclusions drawn from different studies. As early as the 19th century, Lindley (1883) separated the Cornus elliptica Wall. from Swida and named it “Benthamia” (Xiang, 1987), and several different classifications have emerged over time. In Flora Reipublicae Popularis Sinicae, there are 10 species included in the Dendrobenthamia genus. However, in the Flora of China, this genus has been downgraded to a subgenus (Cornus subg. Syncarpea), with some species having been merged, resulting in only five remaining species (Xiang and David, 2005). Since the 1950s, more than 15 new taxa have been described. In a treatment following Xiang’s (1987) classification, five species, namely, Cornus capitata, Cornus hongkongensis, Cornus kousa, Cornus multinervosa, and C. elliptica, were recognized with 13 subspecies. However, a preliminary allozyme investigation by Dudley and Santamour revealed a significant divergence between C. capitata subsp. capitata and C. capitata subsp. angustata, prompting the recognition of C. elliptica as a distinct species. Further research is necessary to clarify the classification of the various species within this group. Advances in high-throughput sequencing technologies have enabled the use of cp genomes for phylogenetic studies.
The morphological characteristics of plants can vary due to external factors such as soil, light, precipitation, temperature, and natural enemies. This implies that plant species identification based solely on phenotype characteristics is challenging and even controversial in terms of its validity. Apart from extrinsic influencing factors, plants’ own genes also undergo changes during adaptation to the environment or climate change. In this regard, the cp genome offers several advantages: 1) cp DNA has a higher copy number within the overall cell DNA and is easily obtainable through sequencing; 2) cp DNA is primarily maternally inherited with a conservative gene structure and minimal gene reorganization; 3) the long sequence of cp genes provides sufficient genetic information for resolving issues related to species classification and evolution.
It is widely acknowledged that the process of photosynthesis is crucial for the energy and biomass production of plants, with chloroplasts playing a pivotal role (Wu et al., 2016; Tang et al., 2018). Chloroplasts are self-replicating organelles composed of homogeneous circular DNA molecules. The genetic information contained within their genomes is maternally inherited from generation to generation (Birky, 1995). The double-stranded DNA in the cp genome ranges from 70 to 520 kb in algae, while it is typically more conserved in land plants, with a range of 120 to 160 kb (Song et al., 2022; Osuna-Mascaró et al., 2018). The cp genomes of land plants are generally stable and typically contain four highly conserved regions: a small single-copy (SSC), a large single-copy (LSC), and a pair of inverted repeat (IR) regions (IRa and IRb) (Mower and Vickrey, 2018). Despite their conservative nature, there are significant variations in genome sizes and gene types among them, such as insertions, substitutions, and missing nucleotide sites. Additionally, expansions and contractions of IR regions as well as translocations and rearrangements of genes have been observed (Ahmed et al., 2012; Sloan et al., 2013). This diversity and polymorphism can be applied to phylogenetic analysis, population taxonomic and genetic research, and evolutionary investigations (Lössl and Waheed, 2011; Ahmed, 2015). Furthermore, cp genomes contain a wealth of phylogenetic information with a mutation rate sufficient for phylogenetic inference and species partitioning (Moore et al., 2010). In addition, plant cp genomes are characterized by a conserved structure and a high substitution rate, rendering them a valuable source for plant molecular identification, genetic diversity assessment, and phylogenetic analysis (Dong et al., 2012, 2014). The advent of next-generation sequencing technology has provided an efficient and cost-effective method for cp genome assembly, greatly enriching cp genome information while enabling the application of cp genomes to lower taxonomic levels in order to resolve the classification relationship among related species (Dong et al., 2012) and providing sufficient data for plant phylogenetic studies (Cronn et al., 2008; Tangphatsornruang et al., 2010). Nonetheless, there is a paucity of reports about the cp genome of Cornus subg. Syncarpea.
Regrettably, reports on the cp genome of Cornus subg. Syncarpea are scarce, hampering its potential for genetic information discovery and phylogenetic studies. The entirety of cp genomes furnishes more comprehensive genetic information compared to mere single gene fragments, which facilitates a better understanding of inter-specific genetic resources and evolutionary history. Nevertheless, prior research on Cornus subg. Syncarpea has inadequately scrutinized the inter-species relationship and genomics, impeding a comprehensive comprehension of its phylogeny. Conversely, inter-species relationship research of other species has been scrutinized through cp genomics (Song et al., 2019), yielding a reference for the inter-specific relationship of Cornus subg. Syncarpea. Therefore, this study endeavors to employ comparative cp genomics to address the ensuing issues: 1) to comprehensively comprehend the cp genome genetics of Cornus subg. Syncarpea; 2) to deduce that differences in simple sequence repeats between species, including their number and location, can furnish a molecular-level reference for subsequent exploration of Cornus subg. Syncarpea; and 3) to clarify the relatedness of the species within Cornus subg. Syncarpea, providing a scientific foundation for the classification at the species order level.
2 Materials and methods
2.1 Sampling, extraction, and genome sequencing
Ten specimens belonging to Cornus subg. Syncarpea were collected from diverse locations across China (S1). The fresh leaves were cleaned to remove stains and impurities from the surface of the leaves, excess water was removed, and the leaves were put into the silicone to dry thoroughly so that the treated leaves could be preserved for a long time, as recommended by Chase and Hills (2019). The complete cp genomic DNA of 10 samples belonging to Cornus subg. Syncarpea was extracted using a modified cetyl trimethylammonium bromide (CTAB) method. To obtain the cp genome, Huitong Biotechnology’s approach was employed to address challenges associated with extracting organellar DNA from total DNA. Initially, total cellular DNA was extracted and subsequently sequenced. Following sequence assembly, organelle DNA contigs were screened based on similarity and close sequence matches (Wang et al., 2019). The overall method involved selecting higher-quality sequences that matched well while considering their characteristics for further screening and splicing. PCR amplification products were used to fill gaps between contigs based on the annotation locations obtained after splicing, thus completing the entire organelle genome (Deng et al., 2017; Elpe et al., 2018). Additionally, the higher coverage of cp genomes in sequencing data compared to nuclear and mitochondrial genomes serves as an important criterion for distinguishing them. Sequencing was performed at Huitong Biotechnology Co., Ltd. (Shenzhen, China) utilizing the Illumina paired-end technology platform. After qualifying the samples through agarose gel electrophoresis analysis, the purified high-quality genomic DNA was randomly fragmented using the Covaris Ultrasonic Disintegrator. Subsequently, a series of treatments including end repair, A-tailing, sequencing adapter addition, purification, and PCR amplification were performed to construct sequencing adapter paired-end (PE) libraries (Jing et al., 2022). Following library construction, preliminarily quantification of the library was conducted using Qubit2.0 after dilution while detecting insert fragments using Agilent 2100 for size confirmation. Once the size criteria for insert fragments were met, accurate quantification of effective library concentration was determined using the Q-PCR method to ensure library quality control measures were in place prior to sequencing on an Illumina NovaSeq6000 platform in 150-bp paired-end mode (Tang et al., 2022).
2.2 Assembly and annotation of chloroplast genome
Low-quality data were filtered for raw data using NGS QC Tools Kit software, including reads with more than 5% N bases, low quality (mass ≤5), 50% base number, and reads with adapter contamination, resulting in clean reads. Then, SPAdes (version 3.11.0) was employed to assemble the clean reads, utilizing default parameters while disregarding the cut-off parameter (Ma et al., 2020). All identified scaffolds were collated from the clean data. To ensure accuracy, blastn and Exonerate analyses were conducted using published closed-source cp data and protein-coding gene sequences as reference material, respectively. The threshold was set to evalue 1e−10 for blastn and a protein similarity threshold of 70% for Exonerate. Scaffolds with matching genes were selected and sorted by splicing coverage, discarding any segments that were evidently not part of the target genome. Low-coverage segments were also excluded, with most being at 1,000× and only a few at 10× (Li et al., 2020). The collected fragmented target sequences were then extended and merged using PRICE and MITObim to minimize the number of scaffolds, with 50 iterations being the standard (Chen et al., 2020). For iterative splicing results, bowtie2 was utilized to match the original sequencing reads (Jin et al., 2020), and the matched paired reads were selected and re-spliced using SPAdes software. The path was scrutinized to identify the presence of an obvious ring map, extracting it if so. If not, steps 3–5 were repeated until the circular genome was complete (Xia and Liu, 2020; Zhou et al., 2020).
Both the initial and re-splicing processes employed SPAdes software. The default kmer setting was utilized for the initial splicing, while the –careful mode was used for self-correction of the hammer and reply of post-splicing to correct the sequence. The results were optimized during the re-splicing process, utilizing VelvetOptimiser to optimize the kmer settings. The subsequent repeated re-splicing process utilized kmer values of 93, 95, 97, 103, 105, 107, and 115, which were then spliced and integrated (Shao and Jiang, 2020; Zhao and Gao, 2020), the graph file was obtained, the graph file was visualized by Bandage software, and the excess contig was removed and edited into a circular sequence, the complete cp complete genome sequence.
Upon completion of homology and protein sequence alignments, the organelle sequences were consolidated into separate fasta files. The iterative extension was then performed utilizing PRICE (Paired-Read Iterative Contig Extension) until a stable and consistent sequence length was attained. PRICE harnesses paired-end sequencing data to match contig ends, allowing for the iterative lengthening of contigs and the merging of overlapping ones. Subsequent sequence recovery was carried out through the following command: “PriceTI -fpp 1.fq 2.fq 600 95 -nc 50 -dbmax 72 -mol 30 -mpi 90 -target 90 2 1 1 -o extension.fasta -icf contigs.fasta 1 1 5”. Here, an insert length of 300 bp was set (double-ended 150-bp read length plus a 300-bp insert fragment, with an estimated total length of 600 bp). The reply reads were required to have a minimum similarity of 95% with the contig. Iterative assembly was performed using kmer, with a maximum read length of 72 bp (-dbmax 72). Overlapping reads and contig edges had a minimum overlap length of 30 bp (-mol 30). The matching reads had at least 90% uniformity (-mpi 90), with the extension mode enabled (-target). After each extension, bowtie2 (-N 1 parameter) was utilized to map reads, and reads that were consistent with the extended sequence were extracted as input for subsequent reassembly. The cp genome was annotated using Plastid Genome Annotator (PGA) and to ensure the accuracy of the annotation results, the genome was also annotated simultaneously with the help of GeSeq online tool2 (Tillich et al., 2017). To validate annotated genes, Geneious-v10.2.3 software (Kearse et al., 2012) was utilized to further refine and manually correct errors in gene annotation. Particular attention was given to genes located at boundaries and highly variable genes, such as ndhF, ndhK, ycf2, and accD. Finally, the circular cp genome map of Cornus subg. Syncarpea was created and visualized using the OGDraw online tool3 (Greiner et al., 2019).
2.3 Comparative analysis of the chloroplast genome
To assess the cp genome characteristics of 10 taxa of Cornus subg. Syncarpea, Geneious-v10.2.3 software was utilized. To compare the cp genomes of these 10 taxa with 12 out-groups, genomic similarity analysis was performed using the Glocal alignment program (shuffle-LAGAN mode) in m-VISTA (Brudno et al., 2003; Frazer et al., 2004). Moreover, a boundary analysis of SC/IR was carried out using IRscope (Amiryousefi et al., 2018) to observe any expansions or contractions of genes at the borders. Codon usage bias analysis was performed using MEGA 7.0 software (Kumar et al., 2016).
2.4 Codon usage analysis
Relative synonymous codon usage (RSCU) is a measure of the relationship between observed and expected frequencies of codons in the case of random usage of preferred synonymous codons. An RSCU value greater than 1.6 indicates an overrepresented codon, while an RSCU value less than 0.6 indicates an underrepresented codon (Behura and Severson, 2012). RSCU can be calculated using the following formula:
where Xij is the observed number of the ith codon for the jth amino acid, ni is the total number of synonymous codons that encode the jth amino acid, and fi is the frequency of the ith codon among all synonymous codons for the jth amino acid.
To analyze codon usage and amino acid frequency, Geneious Prime 2020 was utilized (Kearse et al., 2012), while RSCU of protein-coding genes was evaluated using MEGA-X (Kumar et al., 2018).
2.5 Analysis of repeats
The molecular marker value of simple sequence repeats (SSRs) in biological research is highly significant. SSR represents a DNA molecular marker technology, with its core being PCR technology (Bi et al., 2020). Consequently, the advancement of simple repetitive sequences plays a crucial role in subsequent relevant molecular marker techniques. Simple repetitive sequences belong to the second generation of genetic markers and find applications in various fields such as genetic mapping, gene mapping, forensic identification, anthropology, and genetic disease diagnosis (Yan et al., 2020).
To identify repeats, the REPuter tool4 was employed, which is capable of detecting forward, reverse, palindrome, and complement sequences. The Hamming distance was set to 3, and the minimum length and identity of repeats were restricted to ≥30 bp and >90%, respectively. The SSRs were analyzed using MISA (Beier et al., 2017), with a basic repeat setting and a threshold of 10, 8, 4, 4, 3, and 3 for mono-, di-, tri-, tetra-, penta-, and hexanucleotides, respectively.
2.6 Phylogenetic analysis
To elucidate inter-species relationships among 10 taxa of Cornus subg. Syncarpea, a phylogenetic tree was constructed using maximum parsimony (MP) and Bayesian inference (BI) methods. Ten species and subspecies from Cornus subg. Syncarpea were included, while 12 species (S2), such as Cornus florida, were selected as out-groups. Phylogenetic analyses were conducted using five different data sets, each analyzed separately. These comprised 22 cp whole-genome data, 10 cp gene coding sequence (CDS region) data, 10 cp gene LSC region data, 10 cp gene intron data, and 10 cp gene IR region data. The first data set included 22 cp whole-genome data from 10 taxa of Cornus subg. Syncarpea and 12 out-groups, which had already been annotated. Each data set was initially aligned using the software MAFFT-v7.409, based on default parameters (Katoh and Standley, 2013). Stop codons were removed, and bad fragments were abandoned using the Gblock program (Talavera and Castresana, 2007). Finally, an MP tree was constructed using MEGA X (Bi et al., 2020). Phylogenetic tree inference by the Bayesian methods was performed using Mrbayes 3.2.6. Two hot chains and two cold chains were set to run 2,000,000 generations for inspection, node BI values were converged and stabilized, every 1,000 generations were counted, the top 25% of trees were discarded as aging trees, and the rest were discussed to infer tree structure. The phylogenetic trees were visualized using the software Figtree-v1.4.45, and the results were imported into the software Figtree-v1.4.4 to enhance their visualization.
3 Results
3.1 Chloroplast genome features
A staggering 40.65 G of raw data was generated from the genomic libraries, which was then refined to obtain 40.44 G of clean data, and the final number of raw reads of 10 taxa ranged from 12,523,414 to 14,894,202, while the number of clean reads after filtering ranged from 12,451,564 to 14,810,440 (S2). Using the visualization tool OGdraw, 10 chloroplast genome maps of the Cornus subg. Syncarpea were obtained (Figure 1). The assembly of the complete cp genome for 10 taxa of Cornus subg. Syncarpea yielded a genome size that ranged from 156,965 bp to 157,383 bp, inclusive of four regions that are ubiquitous in land plants and form a loop structure. These four regions comprised an LSC region spanning from 86,296 bp to 86,691 bp, an SSC region ranging from 18,386 bp to 18,454 bp, and two IR regions spanning from 23,143 bp to 26,112 bp (Table 1). In addition, the two single-copy regions were demarcated by a pair of IR regions. Across all 10 taxa of Cornus subg. Syncarpea, the GC content of the cp genome ranged from 38.12% to 38.17%, and the GC content of the IR regions (ranging from 43.06% to 43.1%) exceeded that of the LSC (ranging from 36.36% to 36.43%) and SSC (ranging from 32.35% to 32.4%) regions. It is worth noting that C. capitata exhibited the highest GC content of 43.36% in its IR regions. The lowest sequencing depth value was 180× of the C. hongkongensis subsp. gigantea, and the largest sequencing depth value was 1,055× of the C. hongkongensis subsp. ferruginea, so the error rate of the sequencing results was very low, and the sequencing results were highly credible (Table 1).
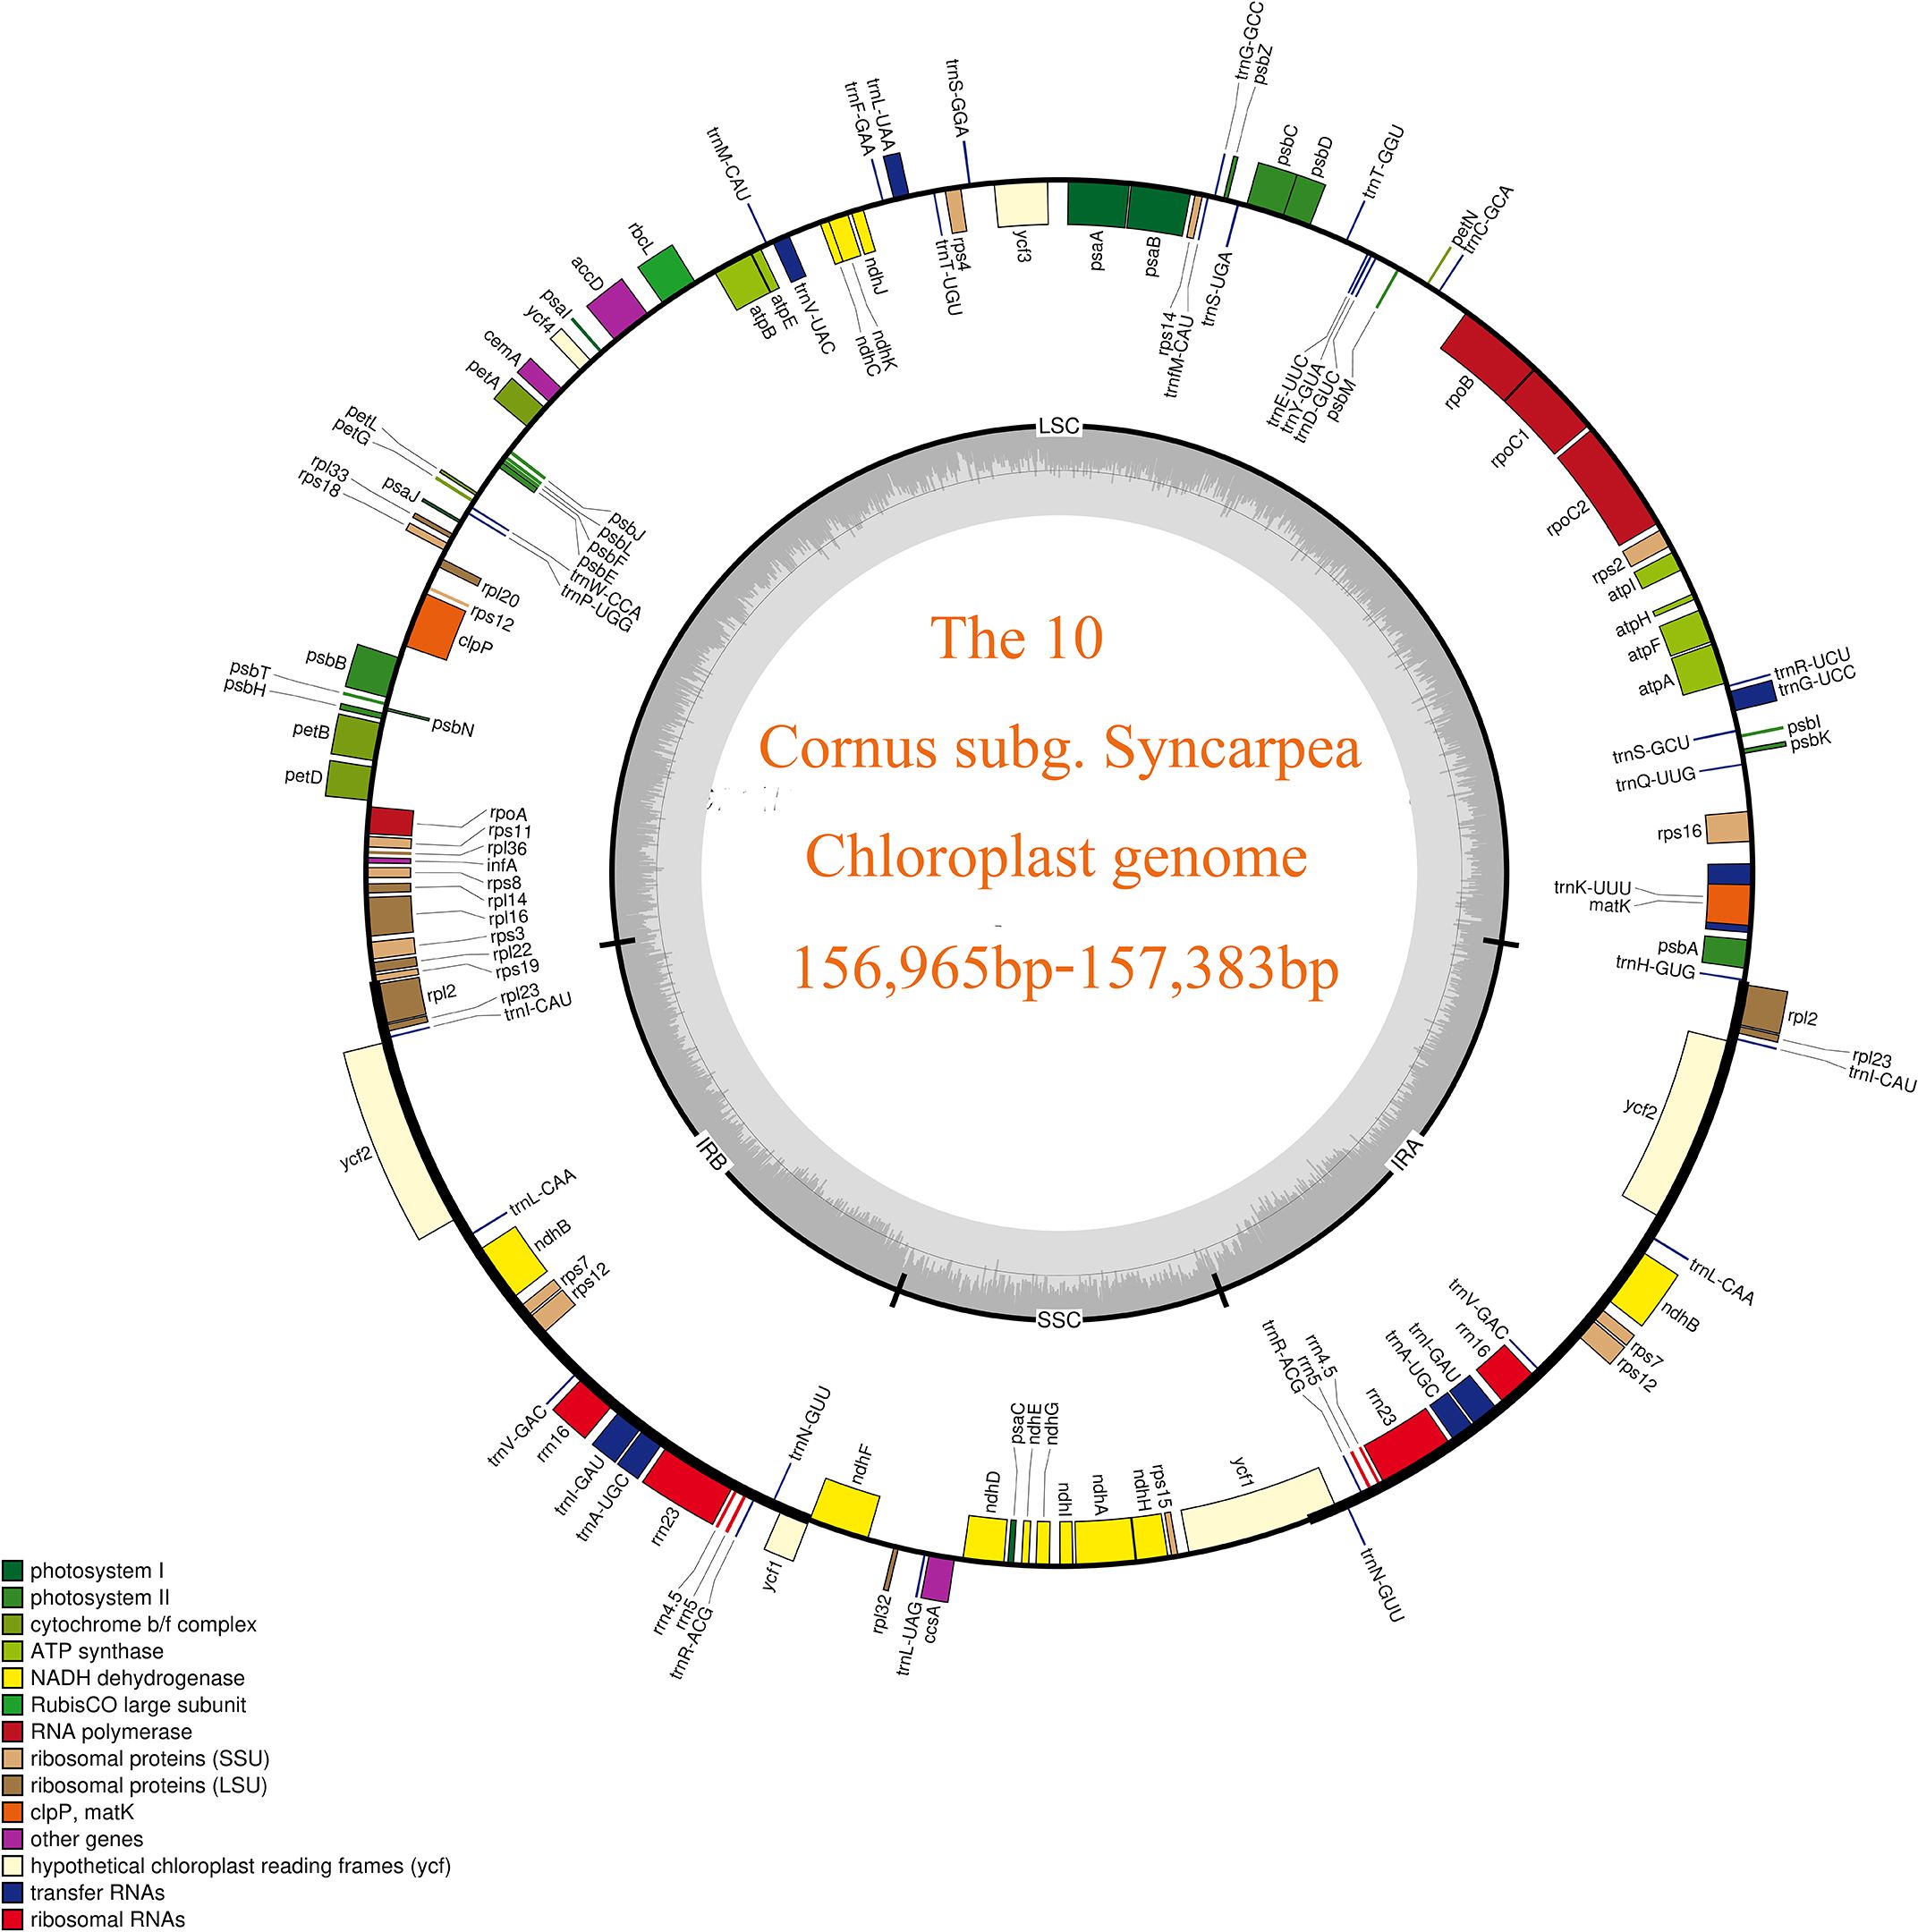
Figure 1 Chloroplast genome map of 10 taxa of Cornus subg. Syncarpea. The transcription direction of the genes in the outer circle in the figure is counterclockwise, and the transcription direction of the genes in the inner circle is clockwise. Different colors indicate that the function of the coding gene is also different. The gray part of the inner circle indicates the GC content, which is distinguished by depth.
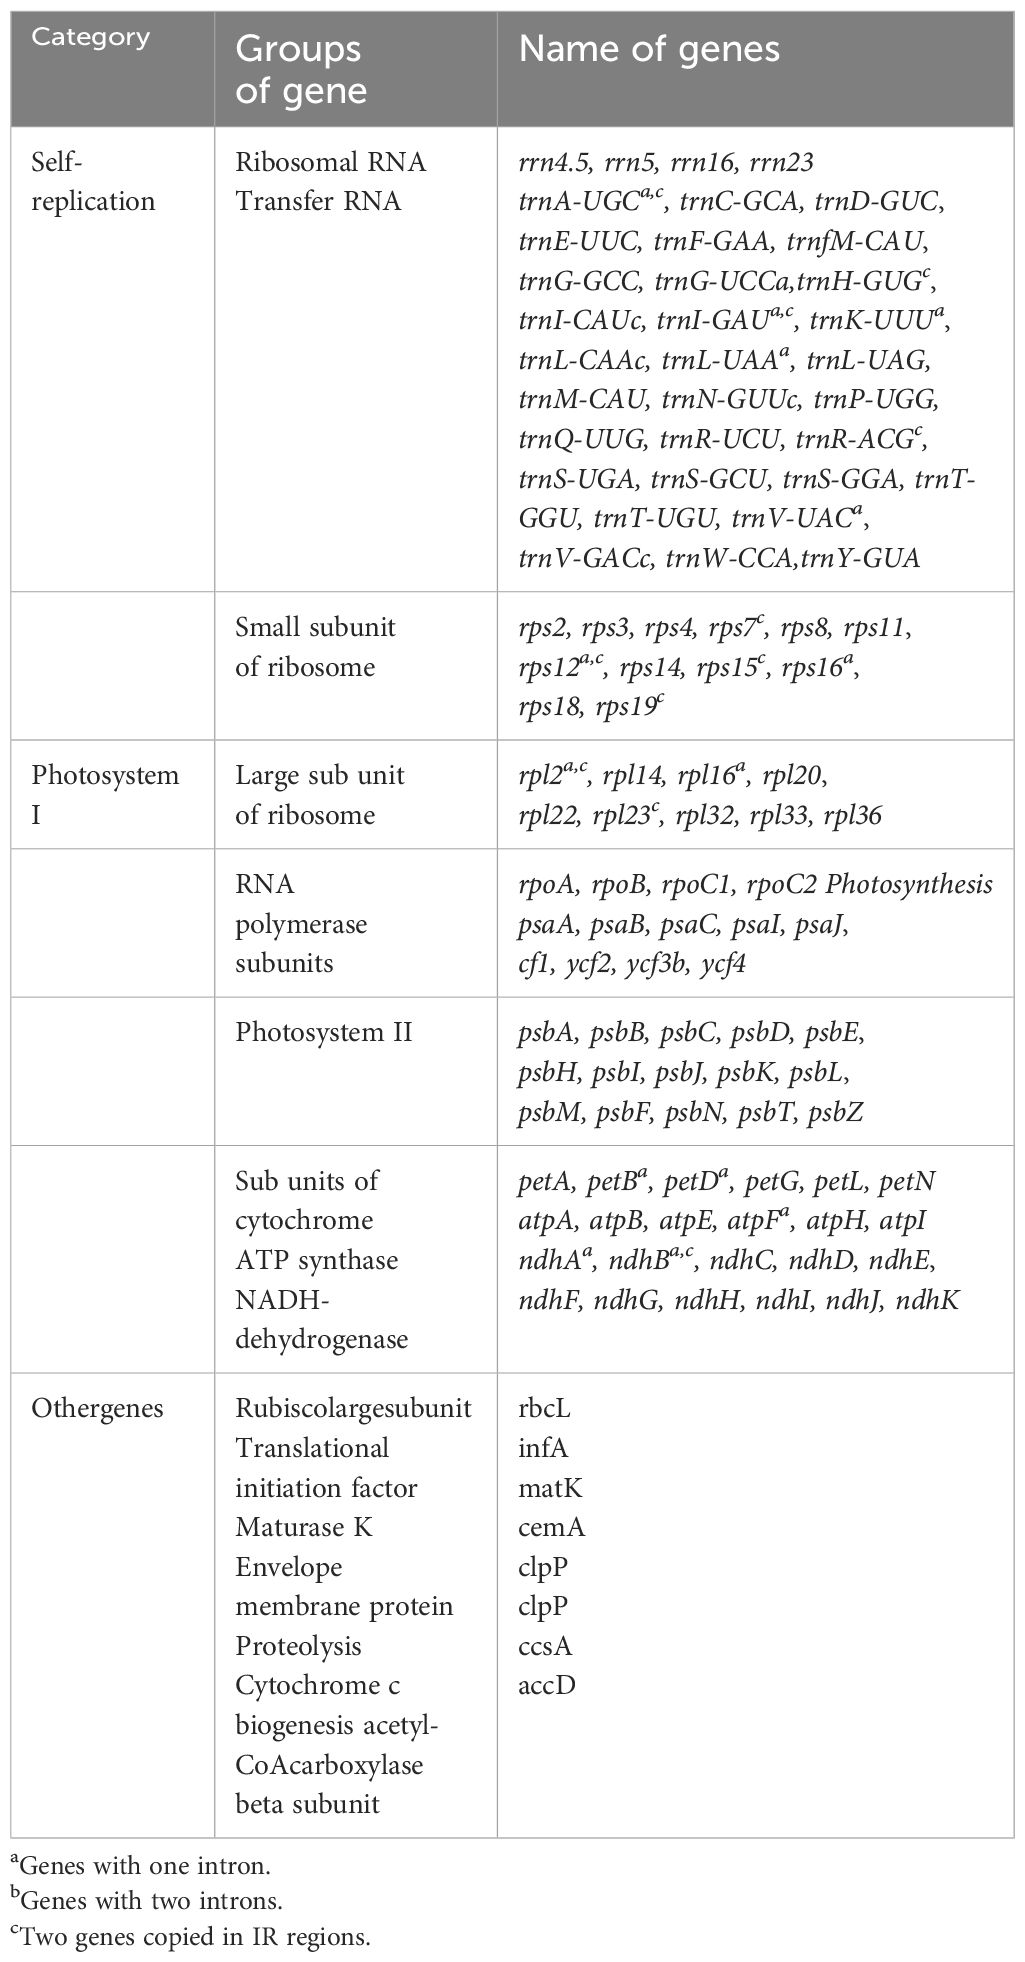
A total of 131 genes were meticulously annotated in the cp genomes of the 10 Cornus subg. Syncarpea species and subspecies, encompassing 86 protein-coding genes (PCGs), eight rRNA genes, and 37 tRNA genes. These genes were methodically grouped into three categories based on their specific functions, while 15 genes including trnK-UUU, rps16, trnG-UCC, atpF, rpoC1, trnL-UAA, trnV-UAC, petB, petD, rpl16, rpl2, ndhB, trnI-GAU, trnA-UGC, and ndhA featured one intron; clpP and ycf3 genes exhibited two introns; and rps12 gene underwent trans-splicing (see Table 2 for details).
3.2 Junction characteristics
We conducted a comparative analysis of junction structures in the cp genomes of 10 taxa of Cornus subg. Syncarpea to observe variations in their IR boundaries (Figure 2). Our results revealed striking similarities in their boundary features, with genes at the nodes primarily consisting of rpl22, rps19, rpl2, ycf1, ndhF, trnH, and psbA. Specifically, the rpl2 and rpl22 genes were replicated and fully embedded in the IRb and LSC regions, respectively. The trnH genes were entirely located to the left of the IRa/LSC junction, 6 bp from this boundary. The rps19 genes occupied the IRb/LSC junction, with only a small portion of 38 bp extending into the IRb region. The ndhF genes occupied the IRb/SSC junction, with only a small portion of 21 bp extending into the IRb region. Intriguingly, we discovered that the ycf1 genes were fully embedded in the IRb region when located in the IRb/SSC junction while occupying the IRa/SSC junction and mainly located within the SSC region. Furthermore, we observed differences between C. hongkongensis subsp. elegans and C. capitata, with 1,100 bp located within the IRa region for all 10 taxa of Cornus subg. Syncarpea and 4,480 bp of C. capitata extending into the SSC region, compared to 4,471 bp of C. hongkongensis subsp. elegans.
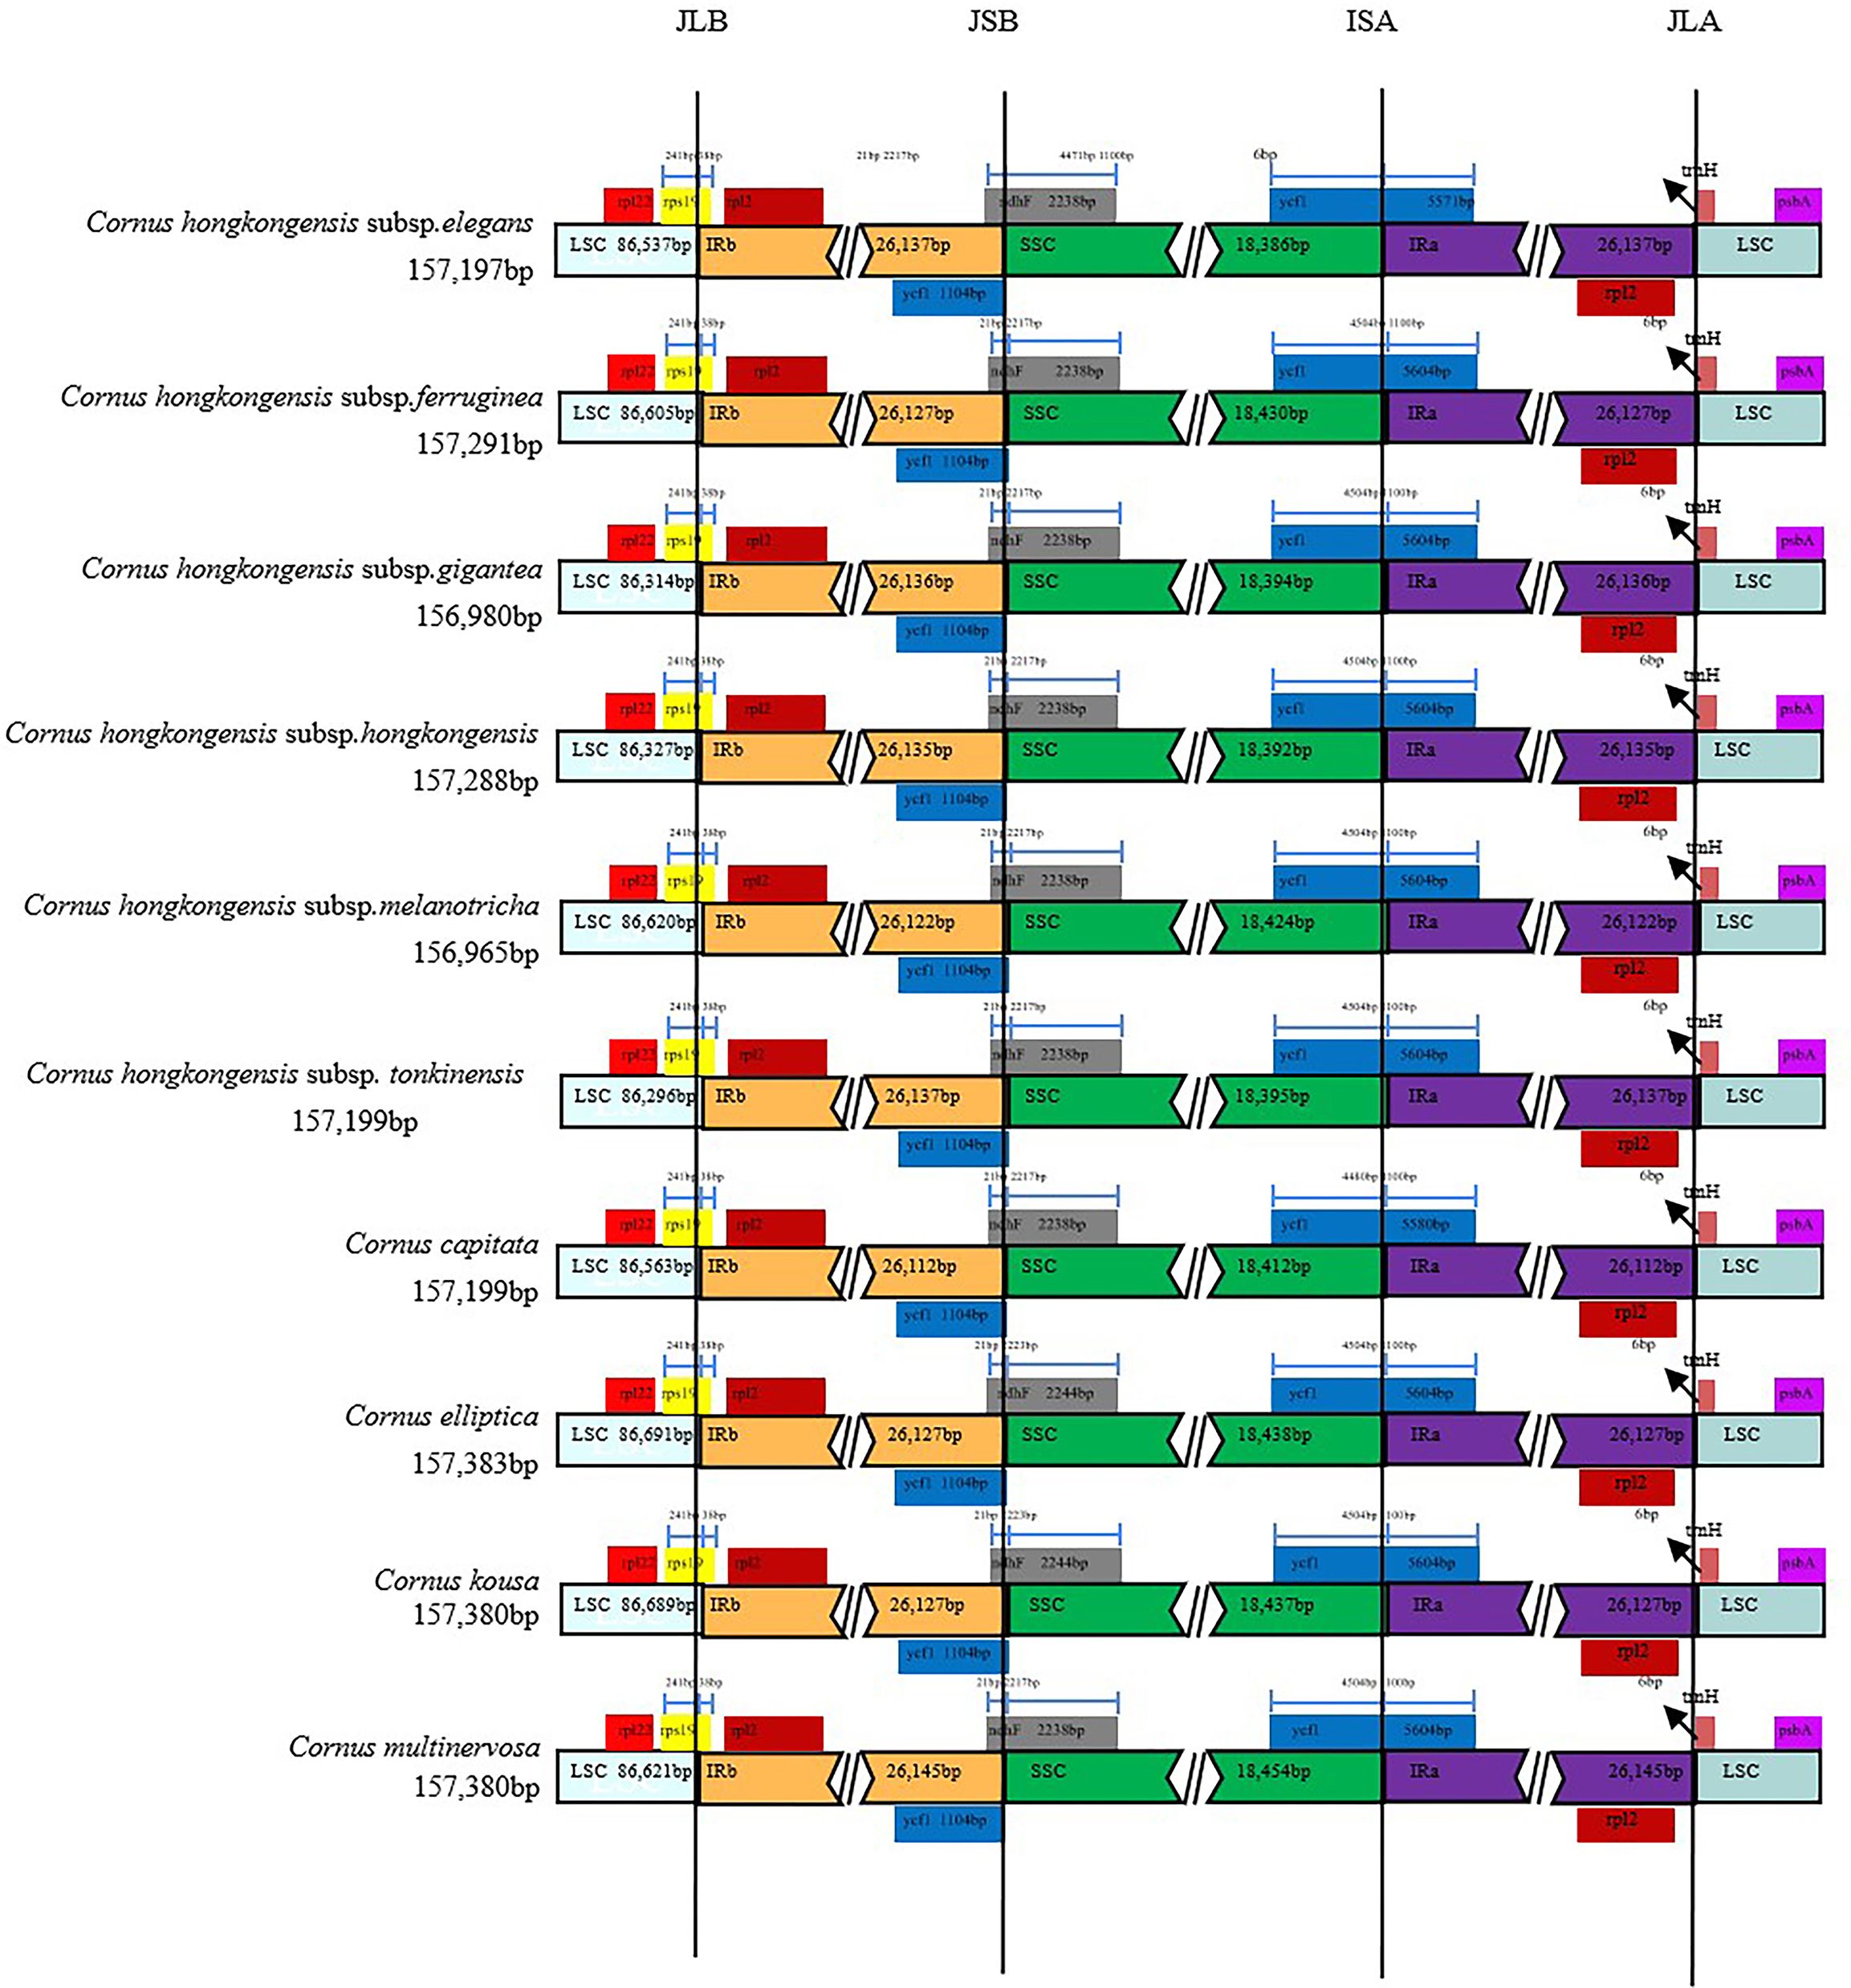
Figure 2 Alignment of SC/IR boundary of chloroplast genomes of 10 taxa of Cornus subg. Syncarpea. The different colors in the figure indicate that the function of the coding gene is also different. The number above the gene indicates the distance between the end of the gene and the boundary position.
3.3 Similarity analysis of chloroplast genomes
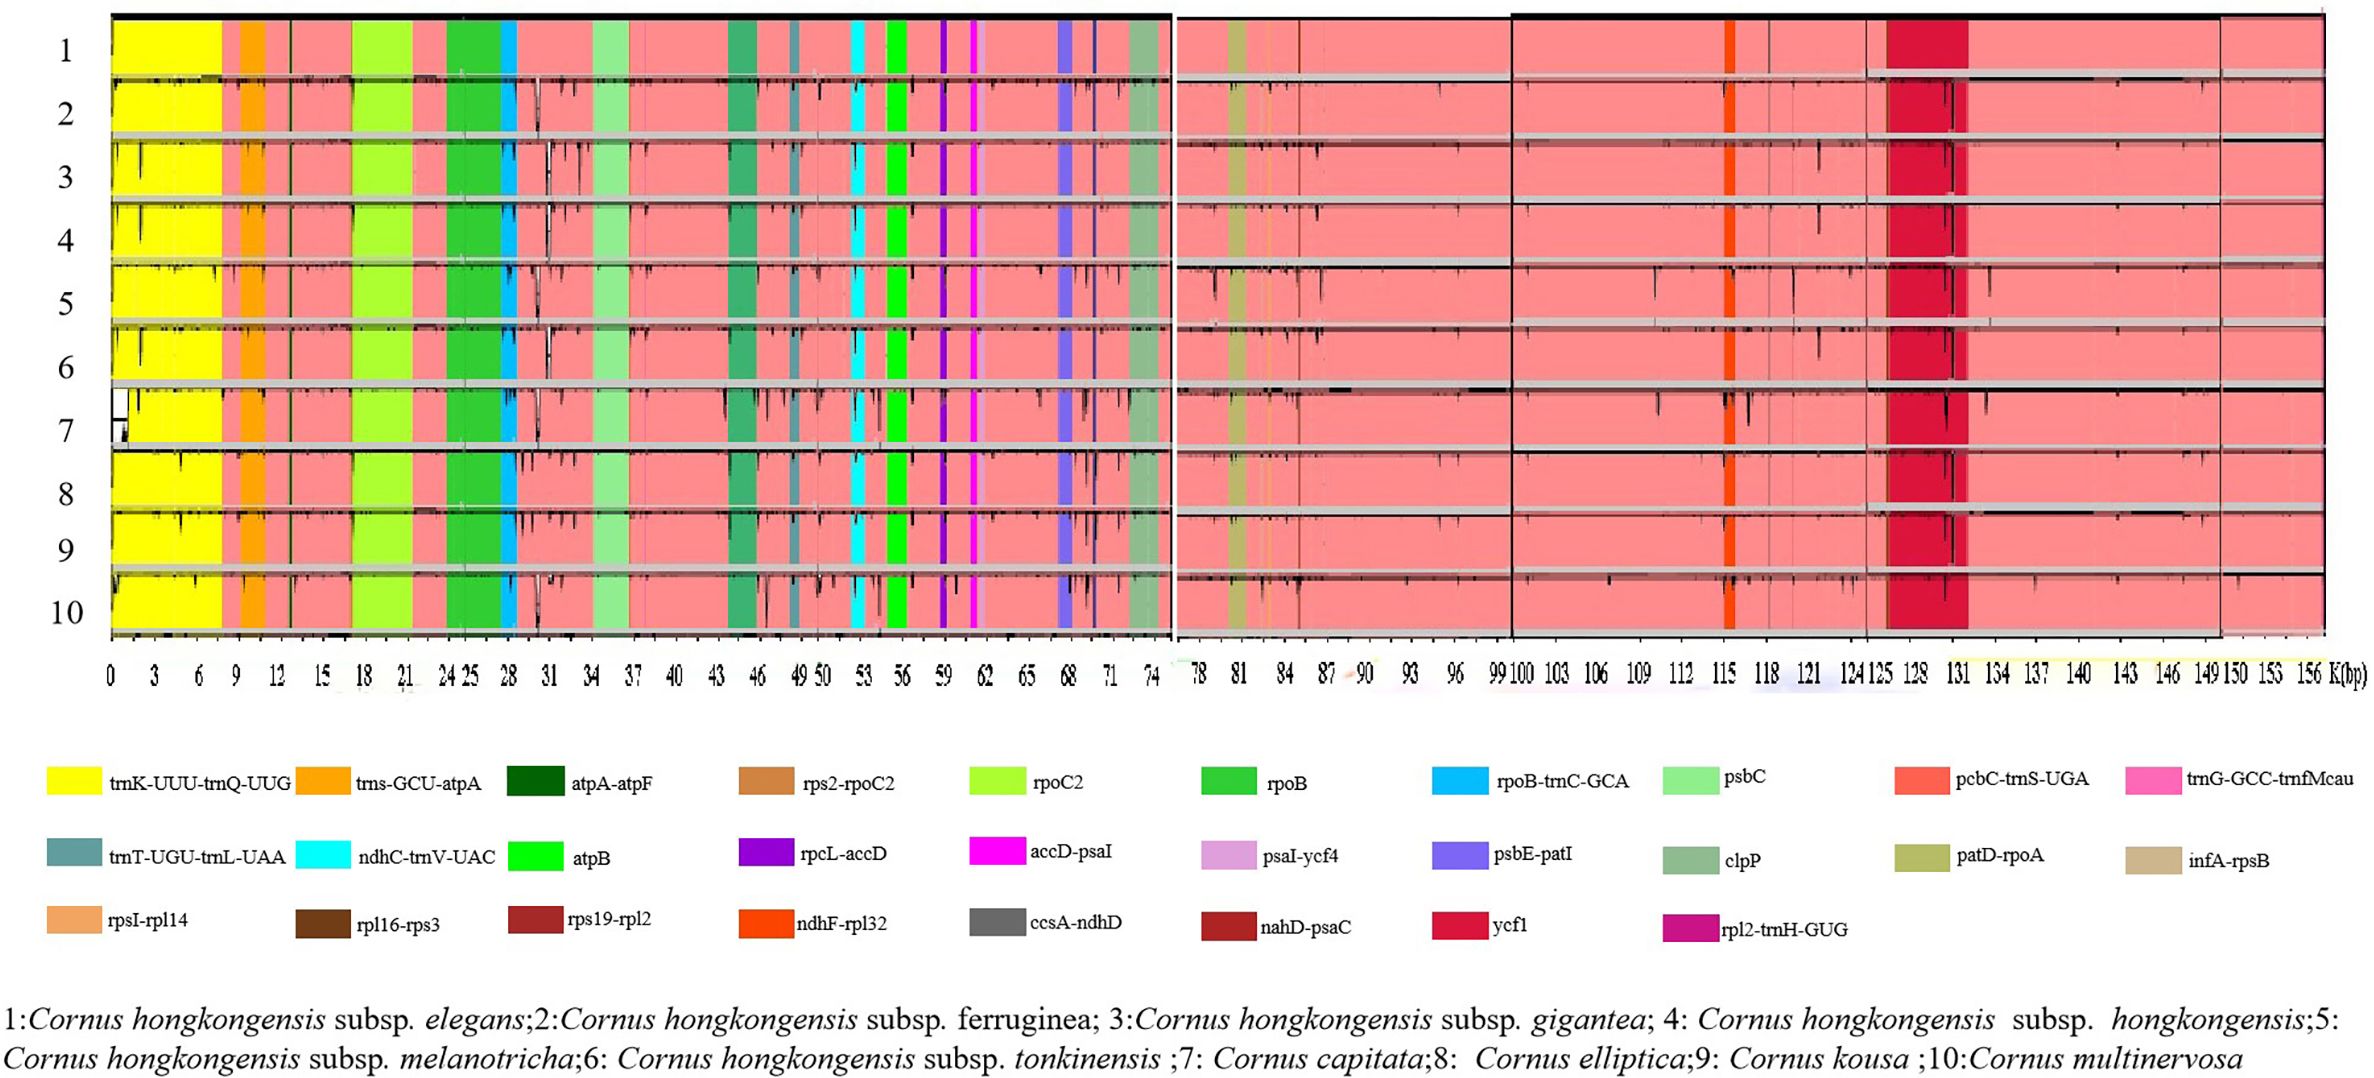
Utilizing m-VISTA and DnaSP, a comparative analysis of the complete cp genomes of 10 taxa belonging to the Cornus subg. Syncarpea was conducted. This investigation aimed to detect hyper-variable regions, construct sequence identity plots, and identify structural differences (Figure 3). Though the number and arrangement of genes were primarily identical across these species, two differential genes (ndhF and ycf1) were observed in the SSC region. Overall, non-coding regions exhibited a greater potential for variation than coding regions. While the protein-coding regions were relatively conserved, larger variants were detected in the rpoB-trnC-GCA and ndhC-trnV-UAC genes. However, the ATP synthase and Photosystem I displayed a high degree of conservation, with genes such as atpA-atpF, atpB, and psaI-ycf4 remaining virtually unaltered. Moreover, the IR regions of these species remained mostly unaltered and were notably more conserved than the two single-copy regions.
3.4 Codon usage analysis
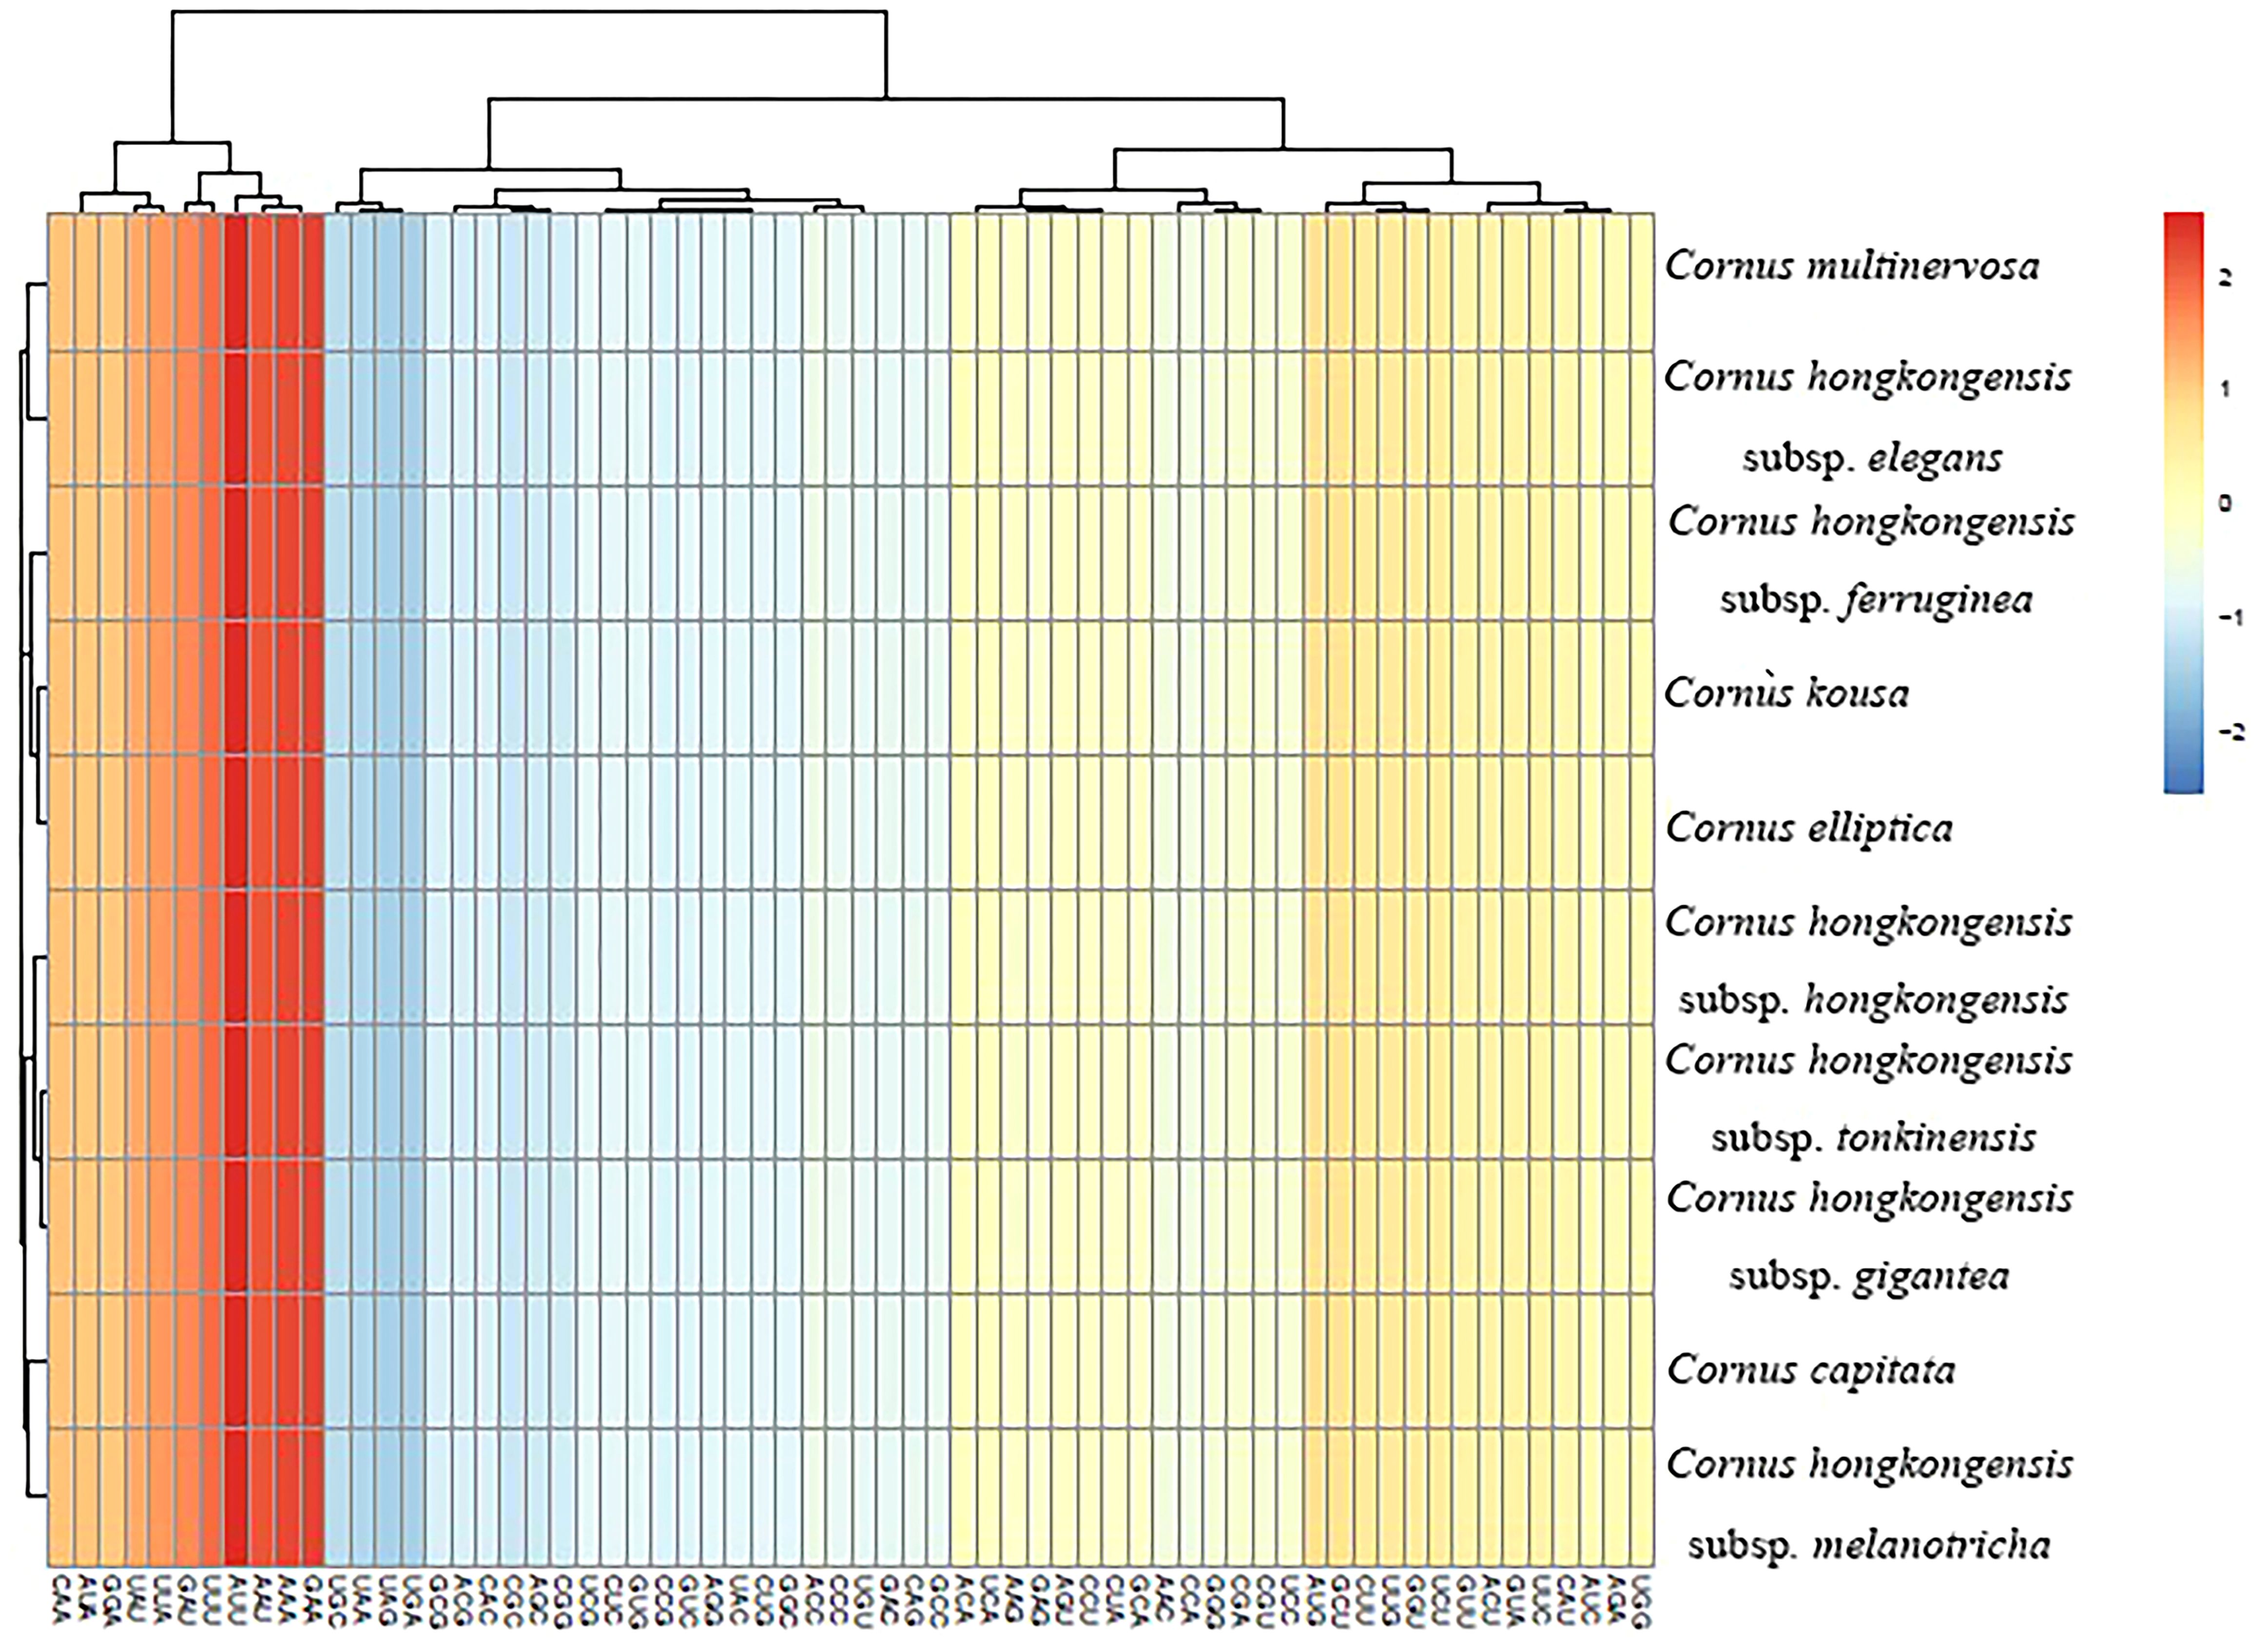
Upon analyzing the codon usage in 10 taxa belonging to the Cornus subg. Syncarpea, it was discovered that methionine and tryptophan amino acids were coded by solitary codons, AUG and UGG, respectively. However, the remaining amino acids were coded by two to six codons, with a clear preference for certain codons (Figure 4). Notably, among all codons encoding amino acids, AUU was the most commonly utilized (Figure 5). Interestingly, the majority of codons with RSCU values greater than 1 had A/U as the terminal codon, while those with C/G as the terminal codon typically had RSCU values less than 1.
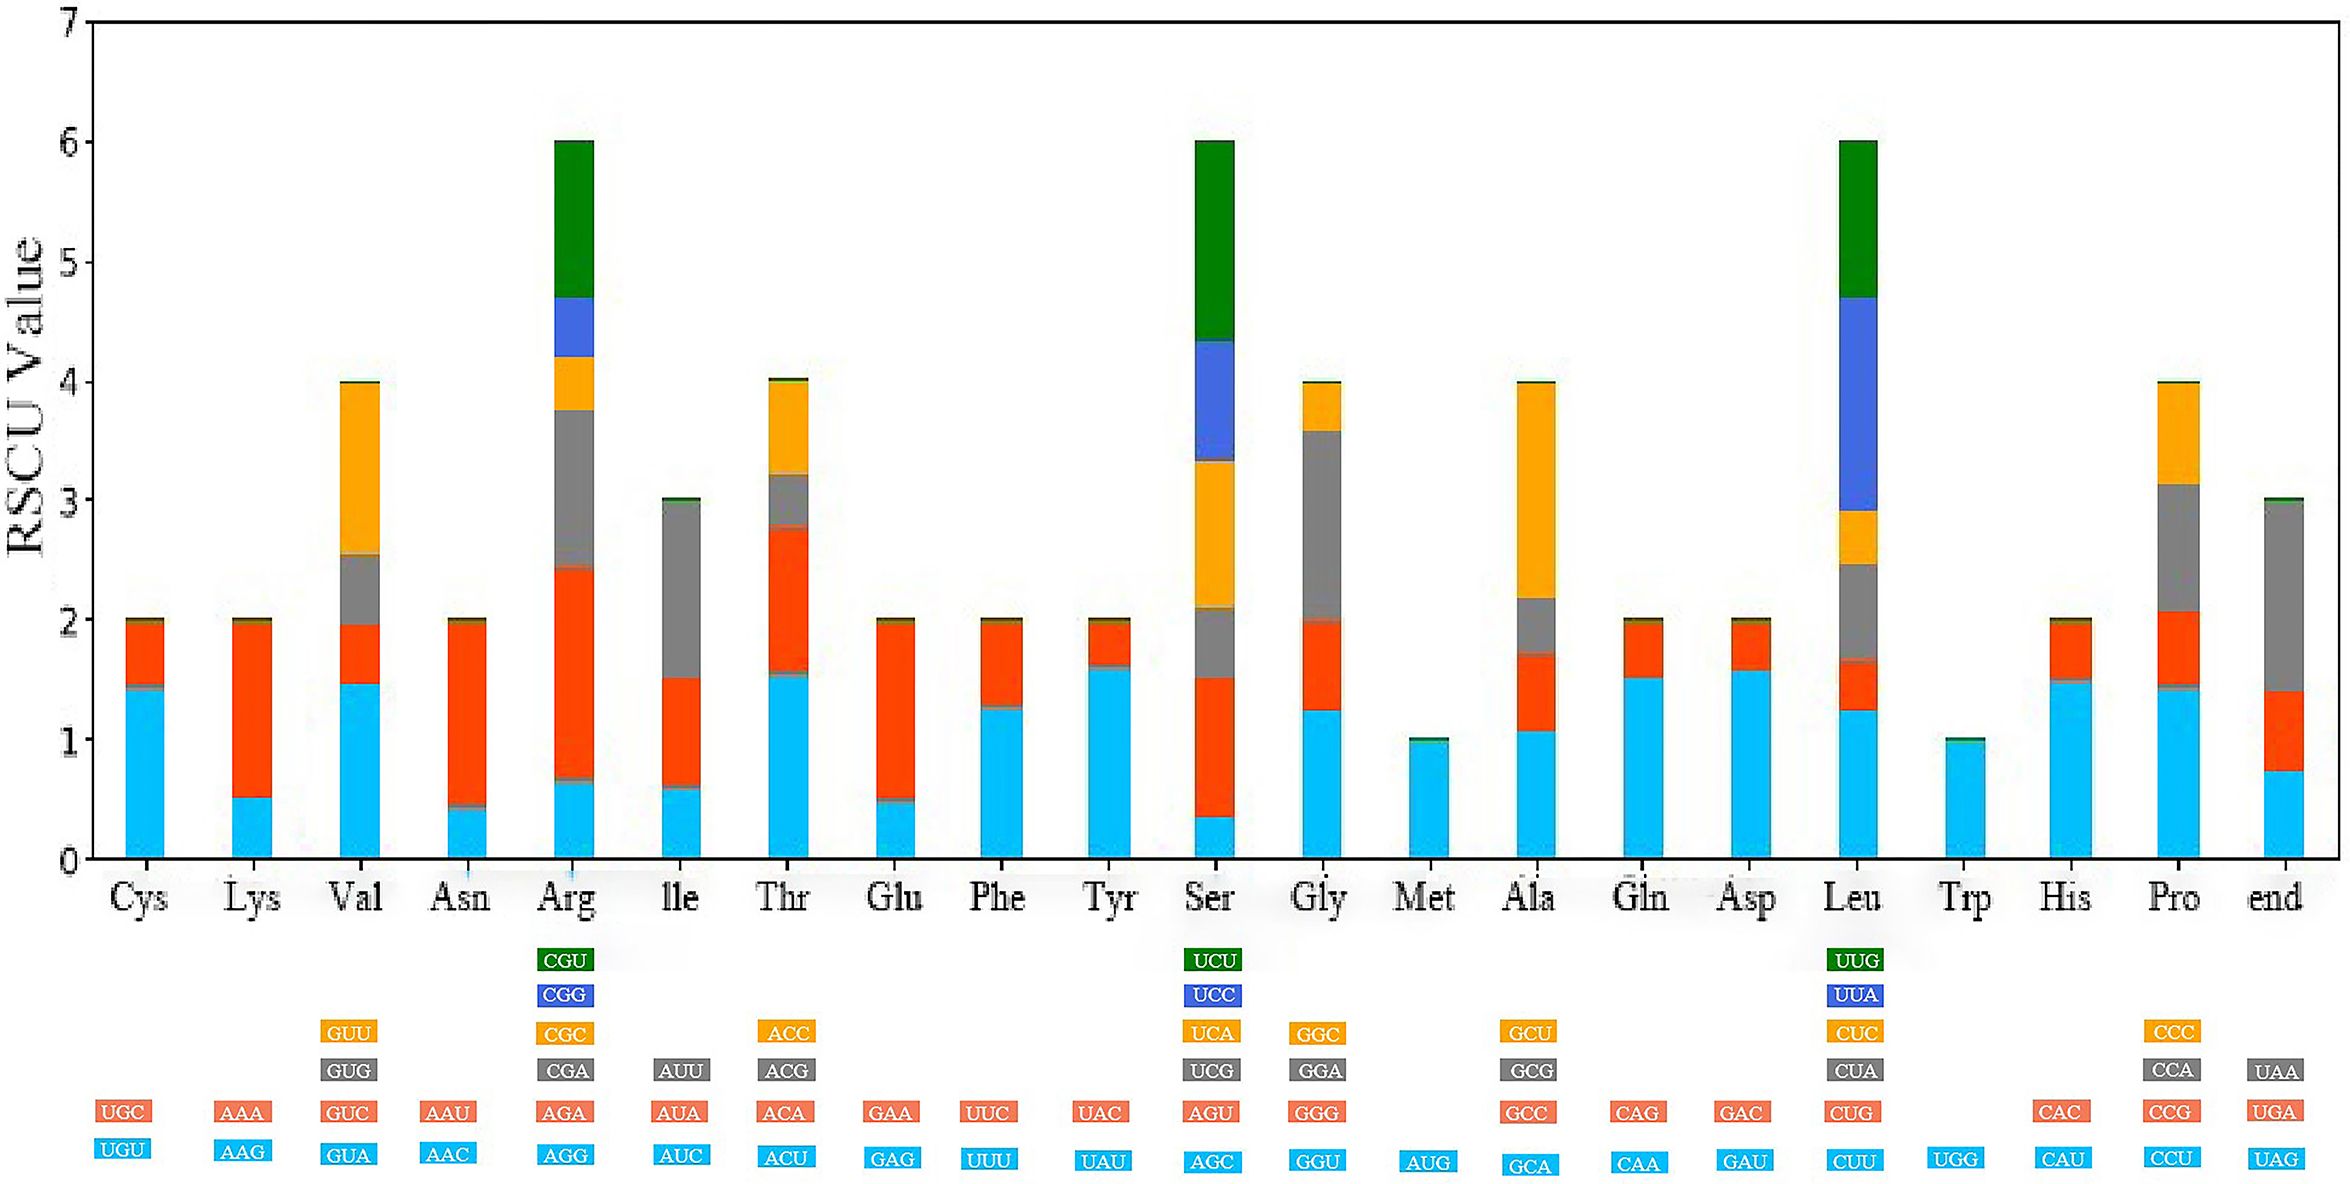
Figure 4 Relative synonymous codon usage (RSCU) values for amino acids and stop codons of Cornus capitata. The colors of the histograms correspond to the colors of the codons.
3.5 Nucleotide repeat analysis
SSRs, which are short (1–6 bp) tandemly repeated DNA sequences present in the genome, are widely used as molecular markers and play a crucial role in plant identification and classification (Luo et al., 2021). Nucleotide repeats are dominated by mononucleotide repeats, whereas dinucleotides, trinucleotides, and even hexanucleotides appear less repeatedly. In our study, mononucleotide and trinucleotide repeats were the only repeats detected in the cp genomes of 10 taxa belonging to the Cornus subg. Syncarpea, with mononucleotide repeats being more abundant than trinucleotide repeats (Figure 6A), which is similar to the chloroplast genome studies in other plants (Chen et al., 2023; Fu et al., 2023). The SSRs were primarily distributed in the LSC region, accounting for over 80% of the total distribution. The SSC regions followed with a distribution of less than 15%. The lowest occurrence of SSRs was observed in the IR regions, comprising less than 10%. Furthermore, no SSR distribution was detected in the IR region of six taxa: C. multinervosa, C. capitata, C. hongkongensis subsp. melanotricha, C. hongkongensis subsp. ferruginea, C. kousa, and C. elliptica (Figure 6B). The frequency distribution of these SSRs ranged from 17 to 21 repeats in gene spacers, five to seven repeats in protein-coding genes, and one to four repeats in introns. Notably, there were fewer variations of SSRs observed in protein-coding regions compared to spacer and intron regions (Figure 6C). A total of 25–31 SSRs were detected in the 10 taxa of Cornus subg. Syncarpea; 25 SSR were found in C. hongkongensis subsp. gigantea, C. capitata, C. hongkongensis subsp. hongkongensis, and C. hongkongensis subsp. tonkinensis; 28 SSR were found in C. elliptica, C. kousa, C. hongkongensis subsp. elegans, C. hongkongensis subsp. ferruginea, and C. hongkongensis subsp. melanotricha; and 31 SSR were found in C. multinervosa (Figure 6A). The SSR in protein-coding regions was less different, but not the SSR in spacer and introns. These results suggest that SSR can be used as a molecular marker for related research fields such as genetic diversity, evolutionary studies, and phylogeny.
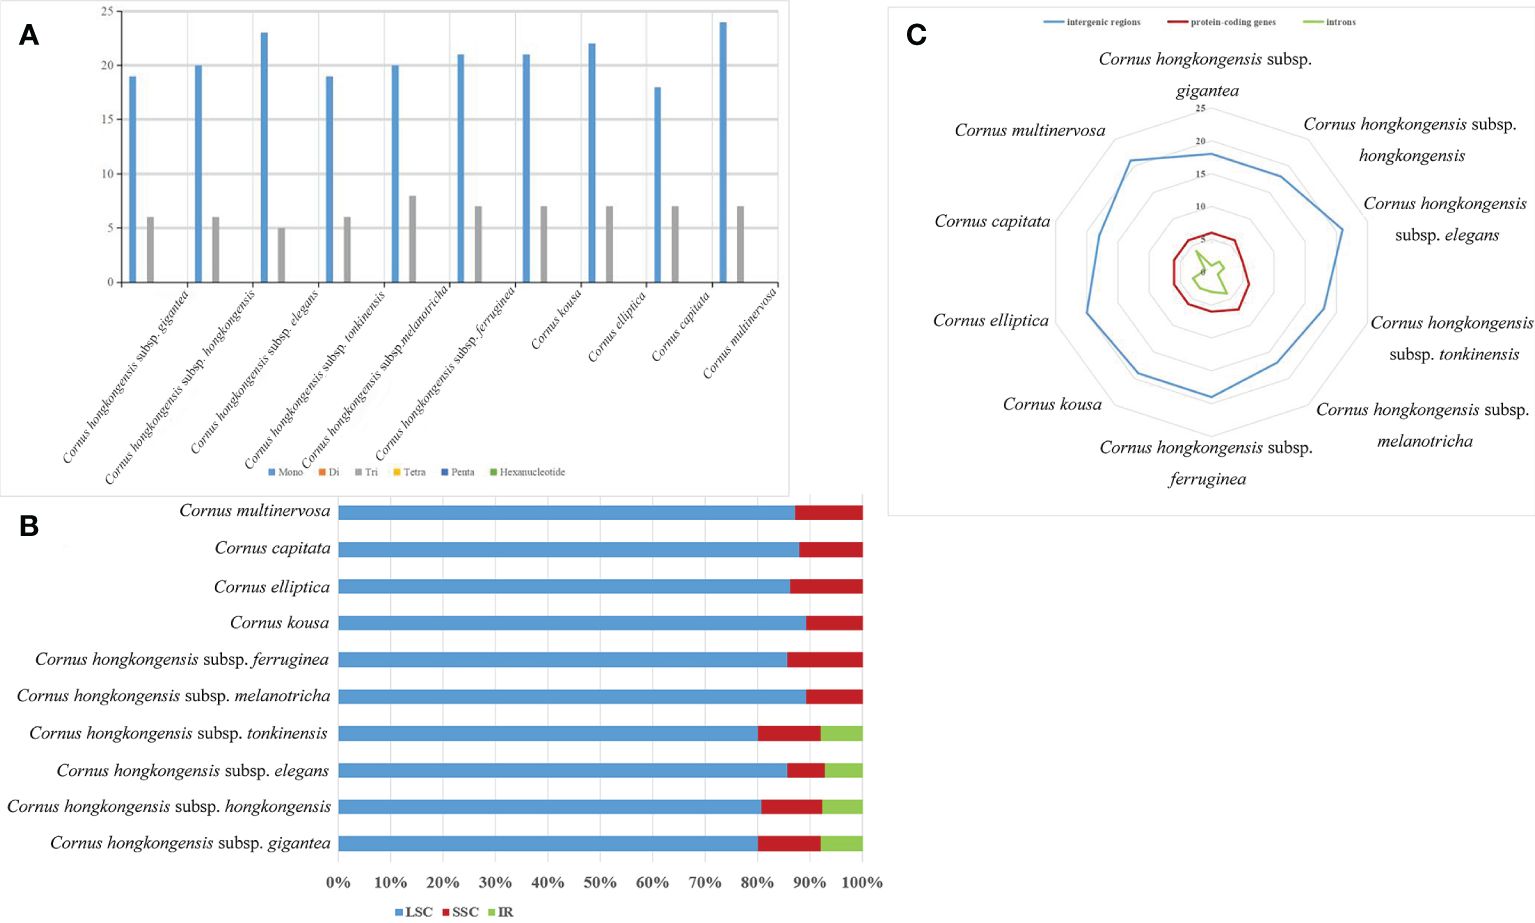
Figure 6 Comparison of SSR analysis of the chloroplast genomes of 10 taxa of Cornus subg. Syncarpea. (A) The number of different SSR types. (B) The frequency of SSR occurrence in the LSC, IR, and SSC regions. (C) The frequency of SSRs in intergenic regions, protein-coding genes, and introns. SSR, simple sequence repeat; LSC, large single copy; IR, inverted repeat; SSC, small single copy.
3.6 Phylogenetic analysis
In this research, we present, for the first time, the cp genome sequences of 10 species and subspecies belonging to the Cornus subg. Syncarpea and submitted to GenBank; their accession numbers can be found in S3. Then, we constructed a phylogenetic tree using PE and BI methods based on five data sets (Figures 7, 8).
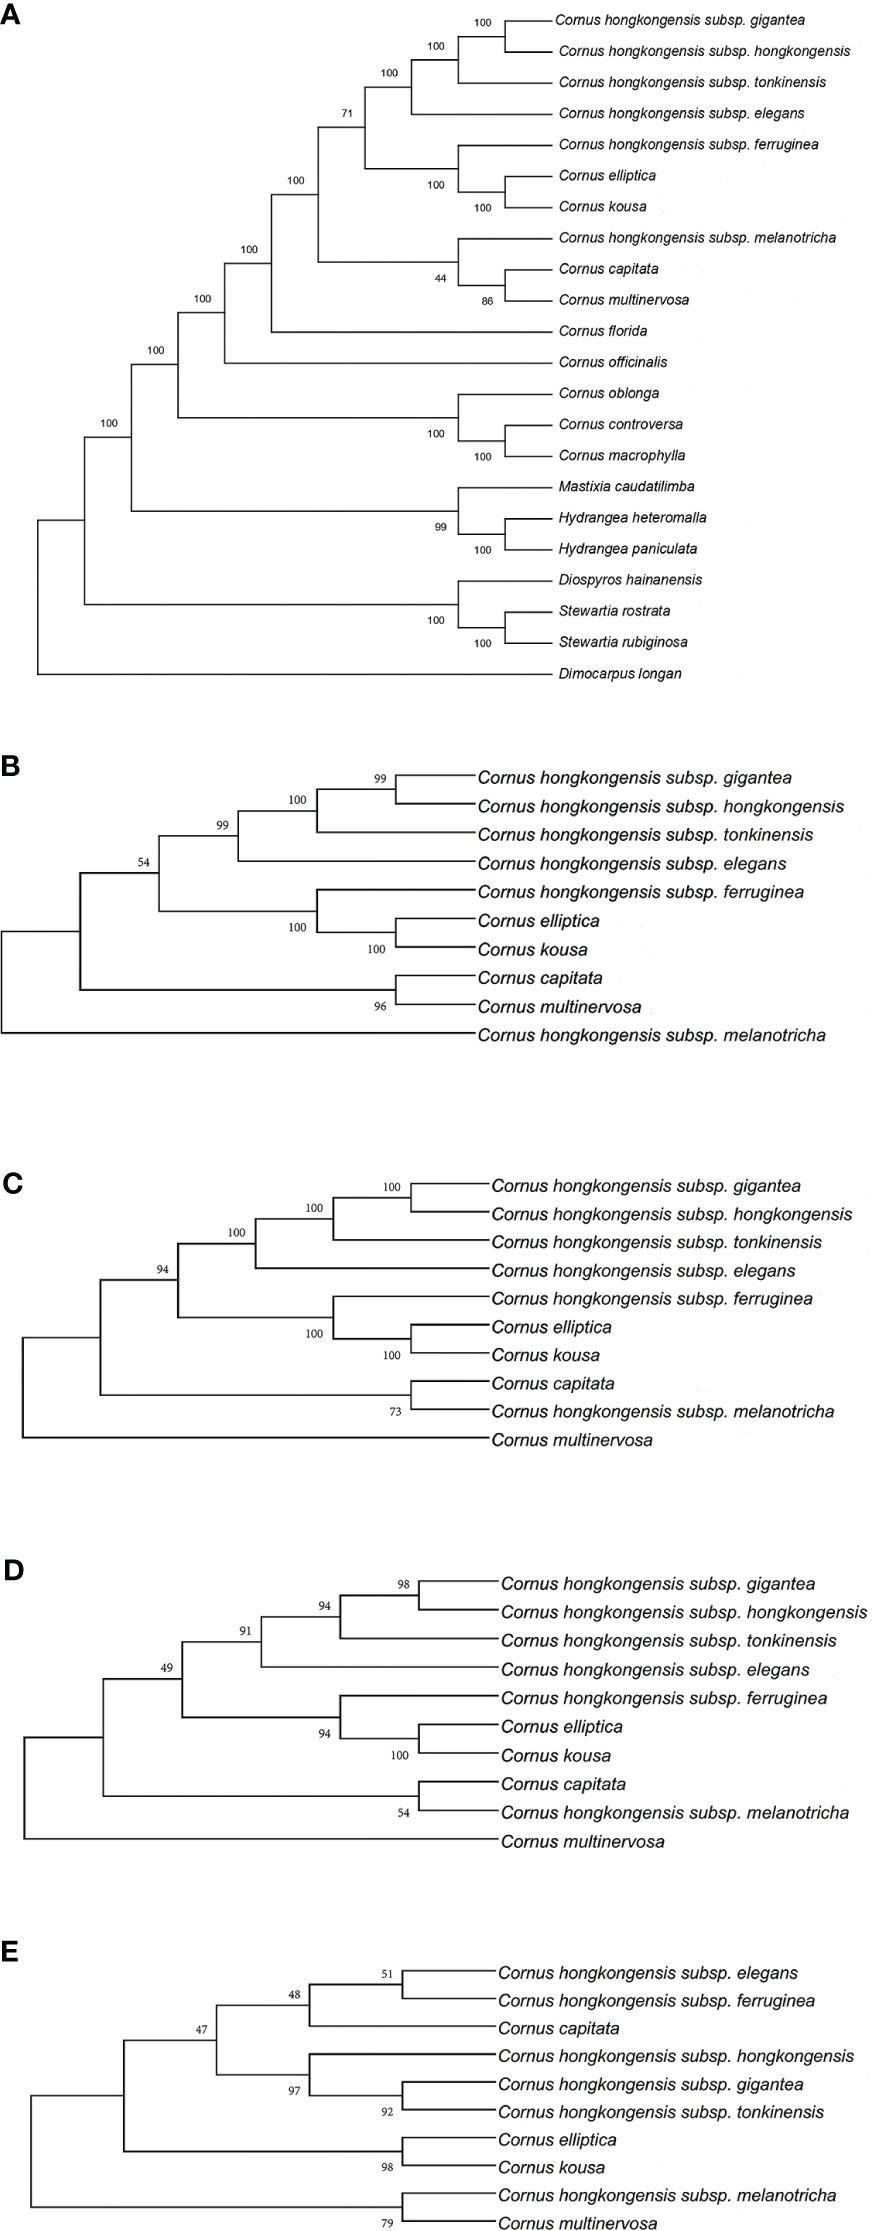
Figure 7 Phylogenetic tree of the chloroplast genome of Cornus subg. Syncarpea based on the maximum parsimony (MP) analysis. (A) Phylogenetic tree constructed using 22 chloroplast genome data. (B) Phylogenetic tree constructed using coding region data. (C) Phylogenetic tree constructed using LSC region. (D) Phylogenetic tree constructed using intron data. (E) Phylogenetic tree constructed using IR region. LSC, large single copy; IR, inverted repeat.
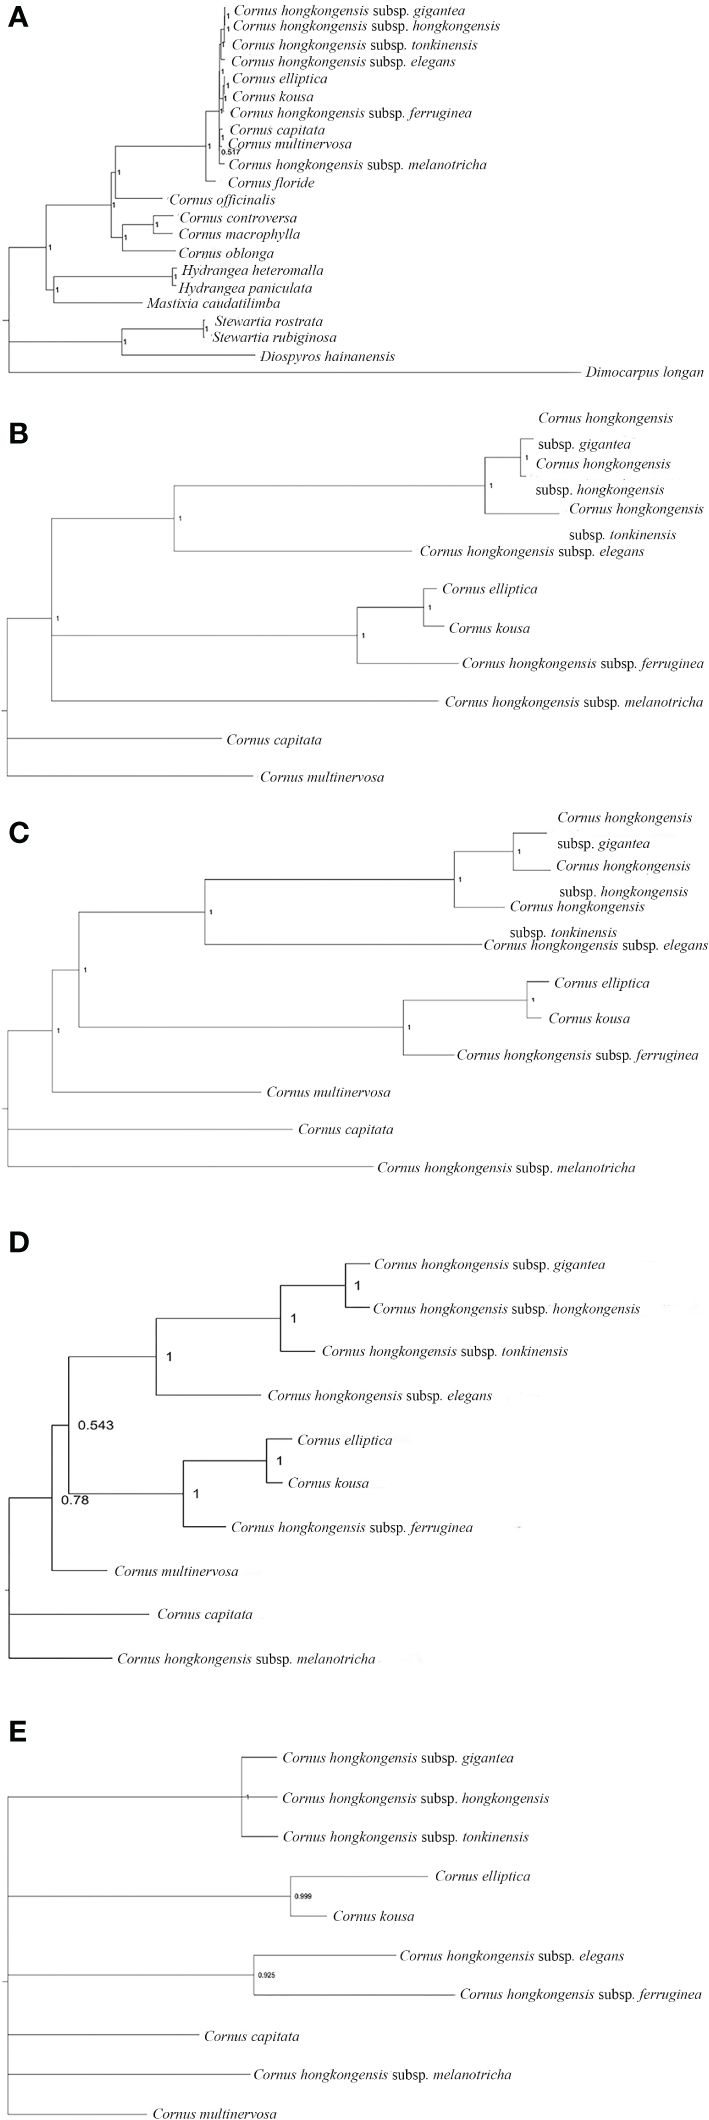
Figure 8 Phylogenetic tree of the chloroplast genome of Cornus subg. Syncarpea based on the BI analysis. (A) Phylogenetic tree constructed using 22 chloroplast genome data. (B) Phylogenetic tree constructed using coding region data. (C) Phylogenetic tree constructed using LSC region. (D) Phylogenetic tree constructed using intron data. (E) Phylogenetic tree constructed using IR region. BI, Bayesian inference; LSC, large single copy; IR, inverted repeat.
Whether PE or BI trees, we observed that two Saxifragaceae species, namely, Hydrangea paniculata and Hydrangea heteromalla, are closely related to Mastixia caudatilimba of Cornaceae, while M. caudatilimba exhibits a distant relationship with other Cornaceae species (Figures 7A, 8A).
C. hongkongensis subsp. hongkongensis formed a sister branch with C. hongkongensis subsp. gigantea, while C. elliptica formed a sister branch with C. kousa. Within the results of the phylogenetic tree, it is evident that C. hongkongensis subsp. tonkinensis, C. hongkongensis subsp. elegans, C. hongkongensis subsp. ferruginea, and C. hongkongensis subsp. melanotricha manifest as distinct branches, fortified by robust node support values (Figures 7, 8).
According to the MP method, the phylogenetic analysis suggests a close relationship between C. capitata and either C. multinervosa or C. hongkongensis subsp. melanotricha, as they form sister branches (Figures 7A–D). However, in the BI method-based analysis, there is a proclivity to consider C. capitata and C. multinervosa as separate branches (Figure 8).
In the BI method-based analysis, the phylogeny inferred from the IR region data reveals that C. hongkongensis subsp. tonkinensis, C. hongkongensis subsp. hongkongensis, and C. hongkongensis subsp. gigantea formed a closely related sister branch with a posterior probability of 1. Furthermore, C. hongkongensis subsp. elegans and C. hongkongensis subsp. ferruginea also emerged as sister branches with high node support values (PP = 0.925) (Figure 8E).
In summary, our analysis of constructing five phylogenetic trees has shed light on the relationship between various subspecies of C. hongkongensis. Our findings indicate that C. hongkongensis subsp. hongkongensis and C. hongkongensis subsp. gigantea are closely related, leading to the possibility that the latter may be a subspecies of the former. However, it is worth noting that C. hongkongensis subsp. ferruginea and C. hongkongensis subsp. melanotricha did not cluster with C. hongkongensis subsp. hongkongensis, thus suggesting that they should not be classified under the same species.
Furthermore, our results demonstrate an incredibly close relationship between C. elliptica and C. kousa, pointing toward the possibility that these two plants of Cornus subg. Syncarpea may indeed belong to the same species with high credibility.
4 Discussion
The cp genomes of 10 taxa belonging to Cornus subg. Syncarpea were analyzed in this study, and it was found that the cp genomes of the 10 Cornus subg. Syncarpea plants displayed striking similarities in their genome structure and length, GC content, and gene count. The complete genome length spanned from 156,965 bp (C. hongkongensis subsp. tonkinensis) to 157,383 bp (C. elliptica), while the LSC region length varied from 86,296 bp (C. hongkongensis subsp. tonkinensis) to 86,691 bp (C. elliptica), and the SSC region length ranged from 18,386 bp (C. hongkongensis subsp. elegans) to 18,454 bp (C. multinervosa). Moreover, the IR region length oscillated between 26,112 bp (C. capitata) and 26,143 bp (C. multinervosa), as depicted in Table 1. The overall GC content hovered at approximately 38.15%, with only negligible dissimilarities observed among the four regions. The above is consistent with the length and structural features of cp genomes found in other higher plants (Jansen et al., 2005; Daniell et al., 2016). Our analysis revealed an uneven distribution of GC content in the cp genomes of these 10 taxa. The IR regions had a higher GC content compared to the two single-copy regions. This discrepancy may be attributed to the presence of eight rRNA genes with high GC content in the IR regions. No significant differences were observed in gene expression among these 10 taxa of Cornus subg. Syncarpea, as the number of protein-coding genes, tRNA coding genes, and rRNA coding genes was equal. The cp is a vital organelle in higher plants, responsible for crucial life processes such as photosynthesis and self-replication. The genes involved in the self-replication of the cp include those responsible for the large and small subunits of the ribosomes, DNA-dependent RNA polymerases, ribosomal proteins, rRNA genes, and tRNA genes. Additionally, the genes responsible for photosynthesis, such as Photosystem I and Photosystem II, encompass 33 genes in the cp genome.
This study delves into the cp genomes of 10 species and subspecies belonging to Cornus subg. Syncarpea, revealing a plethora of gene functions crucial to the proper functioning of this essential organelle, as other plants, the cp genomes of 10 taxa of Cornus subg. Syncarpea, are conserved in gene length, content, and order, and there is no gene loss. Notably, six genes partake in ATP synthesis, and one of these, the atpF gene, contains a single intron. The synthesis of cytochrome b involves six genes, while 11 genes are responsible for NADH dehydrogenase synthesis, with ndhA and ndhB each containing one intron. Additionally, Photosystems I and II require five and 15 genes, respectively, to complete their functions. Four genes, including rpoC1 with one intron, are involved in RNA polymerase synthesis.
A total of 25 genes are associated with ribosomes, 12 of which contribute to the synthesis of proteins in small subunits, and rps12 is a trans-spliced gene. Nine genes are responsible for the synthesis of proteins in large subunits, with rpl2 containing a single intron. Furthermore, four genes play a role in ribosomal RNA synthesis. Finally, seven genes are associated with other cp gene functions, with the clpP gene containing two introns. Overall, this thorough analysis of the cp genomes in these 10 taxa of Cornus subg. Syncarpea provides valuable insights into the complex workings of this critical organelle.
Oligonucleotide repeats, a type of repetitive DNA sequence, are highly prevalent in plastid genomes and have been identified as a valuable tool for pinpointing mutational hotspots (Ahmed et al., 2012; Lee et al., 2014; Abdullah et al., 2020a; Abdullah et al., 2020b; Liu Q. et al., 2020). Specifically, SSRs, or microsatellite DNA, are tandem repeat sequences consisting of several tens of nucleotides, with repeat units typically composed of one to six nucleotides. The flanking sequences of each SSR are typically composed of relatively conserved single-copy sequences. Due to their polymorphism, co-dominance, and reliability, SSRs have emerged as a widely used molecular marker technology based on specific primer PCR (Oliveira et al., 2006; Sonah et al., 2011; Gao et al., 2018). Additionally, SSRs are invaluable for detecting genetic diversity and polymorphisms at the population, intraspecific, and cultivar levels, as well as for distinguishing between species (Thiel et al., 2003; Mader et al., 2018). In our study, we detected two distinct types of SSRs in the cp genomes of 10 species and subspecies of Cornus subg. Syncarpea, which were primarily located in the LSC region. Among these SSRs, mononucleotide repeats were the most frequently observed. We also found that the number of SSRs in intergenic regions and introns varies greatly, which can be used as potential molecular markers for genetic diversity, evolution, and phylogenetic studies.
Throughout the course of plant evolution, variations in the length of the IR region of the cp genome are a ubiquitous occurrence, leading to the emergence of diverse boundary features (Yang et al., 2010; Wang et al., 2017; Ding et al., 2021). The present study investigated the boundary genes in 10 taxa belonging to Cornus subg. Syncarpea, identifying rpl22, rps19, rps2, ycf1, ndhF, trnH, and psbA as the predominant genes. Overall, these 10 taxa exhibited a high degree of similarity in their boundary features, the gene information is stable during the transcription process, and there are no more obvious signs of recombination, providing evidence for their relative stability among closely related species. However, a few discrepancies were observed in C. capitata, C. kousa, C. hongkongensis subsp. elegans, and C. elliptica. Notably, the ndhF gene in C. elliptica (2,244 bp) was slightly longer than in the other species (2,238 bp), while ycf1 in C. hongkongensis subsp. elegans (5,571 bp) and C. capitata (5,580 bp) was slightly shorter than that in the other species.
The evolution of land plants has seen greater potential for variation in the two single-copy regions than in the IR regions, as revealed by m-VISTA analysis. These findings align with previous studies in other plant taxa (Gu et al., 2016; Xu et al., 2017; Alzahrani et al., 2020), attesting to the significance of these regions in plant evolution. While the protein-coding regions were relatively conserved, variations were also observed in the atpA-atpF, atpB, and psaI-ycf4 genes. The high GC content observed in the genome may contribute to the lower variation in tRNA sequences and IR regions, underscoring the significance of GC content in maintaining sequence stability, as previously reported (Necsulea and Lobry, 2007; Kim et al., 2019).
Codon usage preference plays a crucial role in gene expression and affects protein and mRNA levels in the genome (Zhou et al., 2013; Lyu et al., 2020). As shown in the results, codons ending in A/U have RSCU values greater than 1, while those ending in C/G are less than 1. This pattern is consistent across other plants (Wang et al., 2018; Liu X. Y. et al., 2020) and holds true in the present study, as observed in the Cornus subg. Syncarpea genome. These findings provide further insight into the role of codon usage preference in shaping the genome, ultimately contributing to our understanding of plant evolution.
In the past, the classification of Cornus subg. Syncarpea was based on morphological data, which resulted in the identification of 4–14 distinct species (Xiang, 1987; Xiang et al., 2005), while with the integration of molecular phylogeny and morphology analysis, the subgenus has been redefined to include four species and eight subspecies (Xiang and David, 2005). Furthermore, the investigation of nrDNA ITS and cp matK has been utilized to explore the phylogenetic relationships within the Cornus genus. Nevertheless, subsequent research has uncovered the presence of incomplete concerted evolution of ITS within individuals of Syncarpea (Hu et al., 2013). In this investigation, we obtained their cp genome sequence for the first time and constructed a phylogenetic tree based on these data to explore the genetic relationships among the species. The results of our phylogenetic analysis strongly support the classification of the “Flora of China”, which suggests that C. hongkongensis subsp. gigantea is closely related to C. hongkongensis subsp. hongkongensis, although in the phylogenetic tree constructed by the IR data set of the BI method, C. hongkongensis subsp. hongkongensis and they cluster together to have a high node support value, and C. hongkongensis subsp. hongkongensis should be separated in the phylogenetic tree of the other four data sets. Furthermore, our data revealed that C. hongkongensis subsp. ferruginea was distantly related to both C. hongkongensis subsp. melanotricha and the other subspecies of C. hongkongensis, forming a separate branch, and C. elliptica and C. kousa, forming another branch. This finding challenges the earlier classification in the “Flora of China” and provides a novel perspective on the relationships between species within Cornus subg. Syncarpea. Additionally, we note that C. capitata is special: in the phylogenetic tree constructed with different data sets, it can be clustered with C. hongkongensis subsp. melanotricha, C. multinervosa, or alone, and its support rate varies from high to low, requiring further research.
Overall, our investigation does not support the classification in the “Flora of China” that C. hongkongensis subsp. elegans, C. hongkongensis subsp. ferruginea, C. hongkongensis subsp. gigantea, C. hongkongensis subsp. melanotricha, C. hongkongensis, and C. hongkongensis subsp. tonkinensis are subspecies of C. hongkongensis. Our investigation yields additional corroboration that C. hongkongensis subsp. tonkinensis, C. hongkongensis subsp. elegans, C. hongkongensis subsp. ferruginea, and C. hongkongensis subsp. melanotricha distinctly form separate branches. Simultaneously, considering the nodal support values derived from the MP and BI trees, our results substantiate the proposition that C. capitata and C. multinervosa individually constitute their own unique branches. This work not only adds to our understanding of the genetic relationships among the species of Cornus but also provides valuable cp genome information for future research into the origin and differentiation of this group at the cp genome level. It is important to note, however, that our study only analyzed the cp genome of Cornus subg. Syncarpea plants. Therefore, our results should be confirmed by analyzing different regions to ensure their robustness.
Data availability statement
The datasets presented in this study can be found in online repositories. The names of the repository/repositories and accession number(s) can be found in the article/Supplementary Material.
Author contributions
BG: Writing – review & editing, Conceptualization, Funding acquisition, Project administration, Resources, Supervision. JW: Writing – original draft, Data curation, Formal analysis, Investigation, Software, Visualization. HG: Investigation, Software, Visualization, Writing – original draft. YL: Conceptualization, Project administration, Supervision, Writing – review & editing.
Funding
The author(s) declare financial support was received for the research, authorship, and/or publication of this article. This work was supported by the National Natural Science Foundation of China (Grant No. 32160053) and the Natural Science Foundation of Jiangxi Province (Grant No. 20212BAB205030).
Conflict of interest
The authors declare that the research was conducted in the absence of any commercial or financial relationships that could be construed as a potential conflict of interest.
Publisher’s note
All claims expressed in this article are solely those of the authors and do not necessarily represent those of their affiliated organizations, or those of the publisher, the editors and the reviewers. Any product that may be evaluated in this article, or claim that may be made by its manufacturer, is not guaranteed or endorsed by the publisher.
Supplementary material
The Supplementary Material for this article can be found online at: https://www.frontiersin.org/articles/10.3389/fpls.2024.1306196/full#supplementary-material
References
Abdullah, Henriquez, C. L., Croat, T. B., Poczai, P., Ahmed, I. (2020a). Mutational dynamics of aroid chloroplast genomes II. Front. Genet. 11, 610838. doi: 10.3389/fgene.2020.610838
Abdullah, Mehmood, F., Shahzadi, I., Ali, Z., Islam, M., Naeem, M. (2020b). Correlations among oligonucleotide repeats, nucleotide substitutions, and insertion-deletion mutations in chloroplast genomes of plant family Malvaceae. Syst. Evol. 59, 388–402. doi: 10.1111/jse.12585
Ahmed, I. (2015). Chloroplast genome sequencing: Some reflections. Next Gener. Seq. Appl. 2, 2469–9853. doi: 10.4172/2469-9853
Ahmed, I., Biggs, P. J., Matthews, P. J., Collins, L. J., Hendy, M. D., Lockhart, P. J. (2012). Mutational dynamics of aroid chloroplast genomes. Genome Biol. Evol. 4, 1316–1323. doi: 10.1093/gbe/evs110
Alzahrani, D. A., Yaradua, S. S., Albokhari, E. J., Abba, A. (2020). Complete chloroplast genome sequence of Barleria prionitis, comparative chloroplast genomics and phylogenetic relationships among Acanthoideae. BMC Genomics 21, 393. doi: 10.1186/s12864-020-06798-2
Amiryousefi, A., Hyvonen, J., Poczai, P. (2018). IRscope: an online program to visualize the junction sites of chloroplast genomes. Bioinformatics 34, 3030–3031. doi: 10.1093/bioinformatics/bty220
Behura, S. K., Severson, D. W. (2012). ). Comparative analysis of codon usage bias and codon context patterns between dipteran and hymenopteran sequenced genomes. PloS One 7, e43111. doi: 10.1371/journal.pone.0043111
Beier, S., Thiel, T., Munch, T., Scholz, U., Mascher, M.. (2017). MISA-web: a web server for microsatellite prediction. Bioinformatics 33, 2583–2585. doi: 10.1093/bioinformatics/btx198
Bi, H., Yang, Y. T., Hu, Q. J., Ma, Y. Z. (2020). Characterization of the complete chloroplast genome of Swertia souliei (Gentianaceae). Mitochondrial DNA Part B 5, 1901–1902. doi: 10.1080/23802359.2020.1754944
Birky, C. W. (1995). Uniparental inheritance of mitochondrial and chloroplast genes: mechanisms and evolution. Proc. Natl. Acad. Sci. United States America 92, (25). doi: 10.1073/pnas.92.25.11331
Brudno, M., Malde, S., Poliakov, A., Do, C. B., Couronne, O., Dubchak, I. (2003). Glocal alignment:finding rearrangements during alignment. Bio-informatics 19, i54–i62. doi: 10.1093/bioinformatics/btg1005
Chase, M. W., Hills, H. H. (2019). Silica gel: an ideal material for field preservation of leaf samples for DNA studies. Taxon 40, 215–220. doi: 10.2307/1222975
Chen, X. Y., Hu, B. Y., Shi, J. Z., Yang, B., Zhang, L., Peng, L. (2023). Complete genome sequence of the Rubia cordifolia chloroplast and its phylogenetic analysis. Acta Botanica Boreali-occidentalla Sin. 43 (11), 1855–1865.
Chen, B. B., Zeng, Y., Li, C. L., Xu, B., Zhang, C., Chen, W., et al. (2020). Characterization of the complete chloroplast genome of the Phoebe bournei. Mitochondrial DNA Part B 5, 3309–3310. doi: 10.1080/23802359.2020.1810153
Cronn, R., Liston, A., Parks, M., Gernandt, D. S., Shen, R., Mockler, T., et al. (2008). Multiplex sequencing of plant chloroplast genomes using Solexa sequencing by-synthesis technology. Nucleic Acids Res. 36, e122. doi: 10.1093/nar/gkn502
Daniell, H., Lin, C. S., Yu, M., Chang, W. J. (2016). Chloroplast genomes: diversity, evolution, and applications in genetic engineering. Genome Biol. 17, 134. doi: 10.1186/s13059-016-1004-2
Deng, Q., Zhang, H. R., He, Y. P., Wang, T., Su, Y. J. (2017). Chloroplast Microsatellite Markers for Pseudotaxus chienii Developed from the Whole Chloroplast Genome of Taxus chinensis var. Mairei (Taxaceae). Appl. Plant Sci. 5, 1600153–1600153. doi: 10.3732/apps.1600153
Ding, S. X., Dong, X., Yang, J. X., Guo, C. C., Cao, B., Guo, Y. (2021). Complete chloroplast genome of Clethra fargesii Franch., an original sympetalous plant from Central China: comparative analysis, adaptive evolution, and phylogenetic relationships. Forests 12, 441. doi: 10.3390/F12040441
Dong, W. P., Liu, H., Xu, C., Zuo, Y. J., Chen, Z., Zhou, S. (2014). A chloroplast genomic strategy for designing taxon specific DNA mini-barcodes: a case study on ginsengs. BMC Genet. 15, 138. doi: 10.1186/s12863-014-0138-z
Dong, W. P., Liu, J., Yu, J., Wang, L., et al. (2012). Highly variable chloroplast markers for evaluating plant phylogeny at low taxonomic levels and for DNA barcoding. PloS One 7, e35071. 2014. doi: 10.1371/journal.pone.0035071
Elpe, C., Knopf, P., Stützel, T., Schulz, C. (2018). Diversity and evolution of leaf anatomical characters in Taxaceae s.l.-fluorescence microscopy reveals new delimitating characters. J. Plant Res. 131, 125–141. doi: 10.1007/s10265-017-0973-x
Frazer, K. A., Pachter, L., Poliakov, A., Rubin, E. M., Dubchak, I. (2004). VISTA: computational tools for comparative genomics. Nucleic Acids Res. 32, W273–W279. doi: 10.1093/nar/gkh458
Fu, W. X., Guo, Y. T., Zhang, X. M., Ma, Z. (2023). Analysis of the chloroplast genome characteristic and its codon preference of Amomum maximum. Genomics Appl. Biol. 43 (01), 17–30. doi: 10.13417/j.gab.043.000017
Gao, X., Zhang, X., Meng, H., Li, J., Zhang, D., Liu, C.. (2018). Comparative chloroplast genomes of Paris Sect. Marmorata: insights into repeat regions and evolutionary implications. BMC Genomics 19, 878. doi: 10.1186/s12864-018-5281-x
Greiner, S., Lehwark, P., Bock, R. (2019). OrganellarGenomeDRAW (OGDRAW) version 1.3.1: expanded toolkit for the graphical visualization of organellar genomes. Nucleic Acids Res. 47, W59–W64. doi: 10.1093/nar/gkz238
Gu, C., Tembrock, L. R., Johnson, N. G., Simmons, M. P., Wu, Z. (2016). The complete plastid genome of Lagerstroemia fauriei and loss of rpl2 Intron from Lagerstroemia (Lythraceae). PloS One 11, e0150752. doi: 10.1371/journal.pone.0150752
Hu, Z. F., Xiang, Q. Y., Huang, H. W. (2013). Incomplete Concerted Evolution of nrDNA ITS in Cornus subg. bvncarpea (Coroaceae). J. Trop. Subtropical Botany. 01, 33–41. doi: 10.3969/j.issn.1005-3395.2013.01.004
Jansen, R. K., Raubeson, L. A., Boore, J. L., DePamphilis, C. W., Chumley, T. W., Haberle, R. C., et al. (2005). Methods for obtaining and analyzing whole chloroplast genome sequences. Mol. Evol. Producing Biochem. Data Part B 395, 348–384. doi: 10.1016/S0076-6879(05)95020-9
Jin, J. J., Yu, W. B., Yang, J. B., Song, Y., de Pamphilis, C. W., Yi, T. S., et al. (2020). Get-Organelle: a fast and versatile toolkit for accurate de novo assembly of organelle genomes. Genome Biol. 21 (1), 241. doi: 10.1186/s13059-020-02154-5
Jing, R., Jing, T., Hui, J., Zhu, X. X., Mutie, F. M., Wanga, V. O., et al. (2022). Comparative and phylogenetic analysis based on the chloroplast genome of coleanthus subtilis (Tratt.) seidel, a protected rare species of monotypic genus. Front. Plant Sci. 13. doi: 10.3389/FPLS.2022.828467
Katoh, K., Standley, D. M. (2013). MAFFT multiple sequence alignment software Version 7: improvements in performance and usability. Mol. Biol. Evol. 30, 772–780. doi: 10.1093/molbev/mst010
Kearse, M., Moir, R., Wilson, A., Stones-Havas, S., Cheung, M., Sturrock, S., et al. (2012). Geneious Basic: an integrated and extendable desktop software platform for the organization and analysis of sequence data. Bio-informatics 28, 1647–1649. doi: 10.1093/bioinformatics/bts199
Kim, H. T., Pak, J. H., Kim, U. S. (2019). The complete chloroplast genome sequence of Crepidiastrum lanceolatum (Asteraceae). Mitochondrial DNA Part B-Resour. 4, 1404–1405. doi: 10.1080/23802359.2019.1598799
Kumar, S., Stecher, G., Li, M., Knyaz, C., Tamura, K. (2018). MEGA X: Molecular evolutionary genetics analysis across computing platforms. Mol. Biol. Evol. 35, 1547–1549. doi: 10.1093/molbev/msy096
Kumar, S., Stecher, G., Tamura, K. (2016). MEGA7: molecular evolutionary genetics analysis Version 7.0 for bigger datasets. Mol. Biol. Evol. 33, 1870–1874. doi: 10.1093/molbev/msw054
Lee, J., Kang, Y., Shin, S. C., Park, H., Lee, H. (2014). Combined analysis of the chloroplast genome and transcriptome of the Antarctic vascular plant Deschampsia Antarctica Desv. PloS One 9, e92501. doi: 10.1371/journal.pone.0092501
Li, Z., Zhang, X. Y., Zhang, Q. D., Yisilam, G. (2020). Complete chloroplast genome of Lycium ferocissimum (Solanaceae), a species native to South Africa. Mitochondrial DNA Part B 5, 756–757. doi: 10.1080/23802359.2020.1715301
Liu, X. Y., Li, Y., Ji, K. K., Zhu, J., Lin, P., Zhou, T., et al. (2020). Genome wide codon usage pattern analysis reveals the correlation between codon usage bias and gene expression in Cuscuta australis. Genomics 112, 2695–2702. doi: 10.1016/j.ygeno.2020.03.002
Liu, Q., Li, X., Li, M., Xu, W. (2020). Comparative chloroplast genome analyses of Avena: insights into evolutionary dynamics and phylogeny. BMC Plant Biol. 20, 406. doi: 10.1186/s12870-020-02621-y
Lössl, A. G., Waheed, M. T. (2011). Chloroplast-derived vaccines against human diseases: Achievements, challenges and scopes. Plant Biotechnol. 9, 527–539. doi: 10.1111/j.1467-7652.2011.00615.x
Luo, C., Huang, W. L., Sun, H. Y., Yer, H. Y., Li, X., Li, Y., et al. (2021). Comparative chloroplast genome analysis of Impatiens species (Balsaminaceae) in the karst area of China: insights into genome evolution and phylogenomic implications. BMC Genomics 22, 571. doi: 10.1186/s12864-021-07807-8
Lyu, X., Liu, Y. (2020). Nonoptimal codon usage is critical for protein structure and function of the master general amino acid control regulator CPC-1. m-Bio 11, e2605–e2620. doi: 10.1128/mBio.02605-20
Ma, X., Chen, W. F., Tang, L. (2020). The complete chloroplast genome sequence of Garcinia oblongifolia (Clusiaceae). Mitochondrial DNA Part B 5, 3224–3225. doi: 10.1080/23802359.2020.1810162
Mader, M., Pakull, B., Blanc-Jolivet, C., Paulini-Drewes, M., Bouda, Z.H.-N., Degen, B., et al. (2018). Complete chloroplast genome sequences of four Meliaceae species and comparative analyses. Int. J. Mol. Sci. 19, 701. doi: 10.3390/ijms19030701
Moore, M. J., Soltis, P. S., Bell, C. D., Burleigh, J. G., Soltis, D. E.. (2010). Phylogenetic analysis of 83 plastid genes further resolves the early diversification of eudicots. Proc. Natl. Acad. Sci. USA. 107, 4623–4628. doi: 10.1073/pnas.0907801107
Mower, J. P., Vickrey, T. L. (2018). “Structural diversity among plastid genomes of land plants,” in Plastid genome evolution. Eds. Chaw, S. M., Jansen, R. K. (Academic, Amsterdam and New York), 2e382.
Necsulea, A., Lobry, J. R. (2007). A new method for assessing the effect of replication on DNA base composition asymmetry. Mol. Biol. Evol. 24, 2169–2179. doi: 10.1093/molbev/msm148
Oliveira, E. J., Padua, J. G., Zucchi, M. I., Vencovsky, R., Vieira, M. L. C. (2006). Origin, evolution and genome distribution of microsatellites. Genet. Mol. Biol. 29, 294–307. doi: 10.1590/S1415-47572006000200018
Osuna-Mascaró, C., Rubio de Casas, R., Perfectti, F. (2018). Comparative assessment shows the reliability of chloroplast genome assembly using RNA-seq. Sci. Rep. 8, 17404. doi: 10.1038/s41598-018-35654-3
Shao, W. H., Jiang, J. M. (2020). The complete chloroplast genome sequences of two Chaenomeles species (Chaenomeles cathayensis and Chaenomeles thibetica). Mitochondrial DNA Part B 5, 3209–3210. doi: 10.1080/23802359.2020.1810148
Sloan, D. B., Triant, D. A., Forrester, N. J., Bergner, L. M., Wu, M., Taylor, D. R. (2013). A recurring syndrome of accelerated plastid genome evolution in the angiosperm tribe Sileneae (Caryophyllaceae). Mol. Phylogenet. Evol. 72, 82–89. doi: 10.1016/j.ympev.2013.12.004
Sonah, H., Deshmukh, R. K., Sharma, A., Singh, V. P., Gupta, DK., Gacche, RN., et al. (2011). Genome-wide distribution and organization of microsatellites in plants: an insight into marker development in Brachypodium. PloS One 6, e21298. doi: 10.1371/journal.pone.0021298
Song, W. C., Chen, Z. M., He, L., Feng, Q., Zhang, H., Du, G., et al. (2022). Comparative chloroplast genome analysis of wax gourd (Benincasa hispida) with three Benincaseae species, revealing evolutionary dynamic patterns and phylogenetic implications. Genes 13, 461. doi: 10.3390/genes13030461
Song, X. T., Shi, W. J., Luo, X. P., Ni, S. I., et al. (2019). Comparative analysis of the complete chloroplast genome among Prunus mume, P. Armeniaca, and P. salicina. Horticulture Res. 6, 2015–2035. doi: 10.1038/s41438-019-0171-1
Talavera, G., Castresana, J. (2007). Improvement of phylogenies after removing divergent and ambiguously aligned blocks from protein sequence alignments. Syst. Biol. 56, 564–577. doi: 10.1080/10635150701472164
Tang, D. F., Ling, Y., Wei, F., Quan, C. Q., Wei, K., Wei, Y., et al. (2022). Characteristics and comparative analysis of Mesona chinensis Benth chloroplast genome reveals DNA barcode regions for species identification. Funct. Integr. Genomics 22, 467–479. doi: 10.1007/s10142-022-00846-8
Tang, D. F., Wei, F., Muhammad, H. K., Aziz, K., Li, Z., Shi, Q., et al. (2018). Analysis of chloroplast differences in leaves of rice isonuclear alloplastic lines. Protoplasmic 3, 863–871. doi: 10.1007/s00709-017-1189-6
Tangphatsornruang, S., Sangsrakru, D., Chanprasert, J., Uthaipaisanwong, P., Yoocha, T., Jomchai, N., et al. (2010). The chloroplast genome sequence of mungbean (Vigna radiata) determined by high-throughput pyrosequencing: structural organization and phylogenetic relationships. DNA Res. 17, 11–22. doi: 10.1093/dnares/dsp025
Thiel, T., Michalek, W., Varshney, R., Graner, A. (2003). Exploiting EST databases for the development and characterization of gene-derived SSRs-markers in barley (Hordeum vulgare L.). Theor. Appl. Genet. 106, 411–422. doi: 10.1007/s00122-002-1031-0
Tillich, M., Lehwark, P., Pellizzer, T., Ulbricht-Jones, E. S., Fischer, A., Bock, R., et al. (2017). GeSeq - versatile and accurate annotation of organelle genomes. Nucleic Acids Res. 45 (W1), W6–W11. doi: 10.1093/nar/gkx391
Wang, L. L., Shi, Y. L., Wang, C. X., Li, X. (2019). The complete chloroplast genome of the white-berry yew Pseudotaxus chienii (Cupressales: Taxaceae), a rare and endangered relict plant endemic to southern China. Mitochondrial DNA Part B. 4, 760–761. doi: 10.1080/23802359.2019.1565971
Wang, L., Xing, H., Yuan, Y., Wang, X., Saeed, M., Tao, J., et al. (2018). Genomewide analysis of codon usage bias in four sequenced cotton species. PloS One 13, e0194372. doi: 10.1371/journal.pone.0194372
Wang, W., Yu, H., Wang, J., Lei, W., Gao, J., Qiu, X., et al. (2017). The complete chloroplast genome sequences of the medicinal plant Forsythia suspensa (Oleaceae). Int. J. Mol. Sci. 18, 2288. doi: 10.3390/ijms18112288
Wu, L. L., Wu, J., Lui, Y., Gong, X. D., Xu, J. L., Lin, D., et al. (2016). The rice pentatricopeptide repeat gene TCD10 is needed for chloroplast development under cold stress. Rice 1, 67. doi: 10.1186/s12284-016-0134-1
Xia, M. Z., Liu, R. J. (2020). Characterization of the complete chloroplast genome of Elymus dahuricus. Mitochondrial DNA Part B 5, 1512–1513. doi: 10.1080/23802359.2020.1742218
Xiang, Q. Y. (1987). System and synopsis of Cornus subgen. Syncarpea (Nakai) QY Xiang (Cornaceae). (Harbin) 7, 33–52.
Xiang, Q. Y., David, E. B. (2005). Flora of China Vol. 14 (Beijing: Science Press, St Louis: Missouri Botanical Garden Pres), 206–221.
Xu, C., Dong, W., Li, W., Lu, Y., Xie, X., Jin, X., et al. (2017). Comparative analysis of six Lagerstroemia complete chloroplast genomes. Front. Plant Sci. 8, 15. doi: 10.3389/fpls.2017.00015
Yan, F. L., Wang, B., He, S., Li, L., Sun, Q., Wei, S., et al. (2020). Assembly and phylogenetic analysis of the complete chloroplast genome sequence of Epimedium simplicifolium (Berberidaceae), an endangered species endemic to China. Mitochondrial DNA Part B 5, 1865–1867. doi: 10.1080/23802359.2020.1751005
Yang, M., Zhang, X., Liu, G., Yin, Y., Chen, K., Yun, Q.. (2010). The complete chloroplast genome sequence of date palm (Phoenix dactylifera L.). PloS One 5, e12762. doi: 10.1371/journal.pone.0012762
Zhao, X., Gao, C. W. (2020). The complete chloroplast genome sequence of Rosa minutifolia. Mitochondrial DNA Part B 5, 3338–3339. doi: 10.1080/23802359.2020.1817807
Zhou, H., Du, L. B., Fang, Z. H. (2020). The complete chloroplast genome sequence of Nepeta cataria L. (Labiatae). Mitochondrial DNA Part B 5, 3298–3299. doi: 10.1080/23802359.2020.1813058
Keywords: Cornus subg. Syncarpea, classification, chloroplast genome, phylogenetic analysis, comparative analysis
Citation: Guan B, Wen J, Guo H and Liu Y (2024) Comparative and phylogenetic analyses based on the complete chloroplast genome of Cornus subg. Syncarpea (Cornaceae) species. Front. Plant Sci. 15:1306196. doi: 10.3389/fpls.2024.1306196
Received: 03 October 2023; Accepted: 19 February 2024;
Published: 13 March 2024.
Edited by:
Laura Emma Maria Morello, National Research Council (CNR), ItalyReviewed by:
Wenpan Dong, Beijing Forestry University, ChinaManosh Kumar Biswas, University of Leicester, United Kingdom
Copyright © 2024 Guan, Wen, Guo and Liu. This is an open-access article distributed under the terms of the Creative Commons Attribution License (CC BY). The use, distribution or reproduction in other forums is permitted, provided the original author(s) and the copyright owner(s) are credited and that the original publication in this journal is cited, in accordance with accepted academic practice. No use, distribution or reproduction is permitted which does not comply with these terms.
*Correspondence: Yizhen Liu, bGl1eWl6aGVuQG5jdS5lZHUuY24=
 Bicai Guan
 Jianteng Wen
 Yizhen Liu