
95% of researchers rate our articles as excellent or good
Learn more about the work of our research integrity team to safeguard the quality of each article we publish.
Find out more
ORIGINAL RESEARCH article
Front. Plant Sci. , 17 September 2024
Sec. Plant Breeding
Volume 15 - 2024 | https://doi.org/10.3389/fpls.2024.1294570
 Andrew F. Maule1,2*
 Jenyne Loarca1,2
 Luis Diaz-Garcia3
 Hector Lopez-Moreno1,2
 Jennifer Johnson-Cicalese4,5
 Nicholi Vorsa4,5
 Massimo Iorizzo6,7
 Jeffrey L. Neyhart8
 Juan E. Zalapa2*
Introduction: For nearly two centuries, cranberry (Vaccinium macrocarpon Ait.) breeders have improved fruit quality and yield by selecting traits on fruiting stems, termed “reproductive uprights.” Crop improvement is accelerating rapidly in contemporary breeding programs due to modern genetic tools and high-throughput phenotyping methods, improving selection efficiency and accuracy.
Methods: We conducted genotypic evaluation on 29 primary traits encompassing fruit quality, yield, and chemical composition in two full-sib cranberry breeding populations—CNJ02 (n = 168) and CNJ04 (n = 67)—over 3 years. Genetic characterization was further performed on 11 secondary traits derived from these primary traits.
Results: For CNJ02, 170 major quantitative trait loci (QTL; R2≥ 0.10) were found with interval mapping, 150 major QTL were found with model mapping, and 9 QTL were found to be stable across multiple years. In CNJ04, 69 major QTL were found with interval mapping, 81 major QTL were found with model mapping, and 4 QTL were found to be stable across multiple years. Meta-QTL represent stable genomic regions consistent across multiple years, populations, studies, or traits. Seven multi-trait meta-QTL were found in CNJ02, one in CNJ04, and one in the combined analysis of both populations. A total of 22 meta-QTL were identified in cross-study, cross-population analysis using digital traits for berry shape and size (8 meta-QTL), digital images for berry color (2 meta-QTL), and three-study cross-analysis (12 meta-QTL).
Discussion: Together, these meta-QTL anchor high-throughput fruit quality phenotyping techniques to traditional phenotyping methods, validating state-of-the-art methods in cranberry phenotyping that will improve breeding accuracy, efficiency, and genetic gain in this globally significant fruit crop.
The “American” cranberry (Vaccinium macrocarpon Ait.) is part of a rich and diverse genus with over 500 species adapted to live in marginal habitats—thriving in acidic, peaty bogs, on the rims of sulfur-belching volcanoes, and as epiphytes in the upper story of forests (Vander Kloet, 1988; Vander Kloet and Avery, 2010). Prior to its breeding in the past two centuries, cranberry had been (and continues to be) a cultural, economic, and culinary facet of some indigenous peoples (especially those from modern-day “North America”) for several millennia. The development and advancement of Vaccinium germplasm for wide commercial use offers a chance to expand agriculture beyond fast-dwindling arable land, offering opportunities to expand nutritional diversity to the human diet.
Cranberry is one of the most important commercial species in the Vaccinium genus, along with blueberries, bilberries, and lingonberries (Chandler et al., 1947; Vorsa and Zalapa, 2019). In 2022, global yield of cranberries was around 600,000 metric tonnes, with the United States (USA) producing just over 60% of global yield, followed by Canada at around 35% and Chile (extrapolated) at just under 4% (FAOSTAT, 2022). The estimated raw production value of the USA 2022 cranberry harvest was around $304 million USD (USDA NASS, 2022), not considering value-added products (Alston et al., 2014). Despite its economic importance and nearly a century of breeding, most planted cultivars are limited to only one or two generations beyond wild germplasm, with only recent introduction of third-generation cultivars in managed marshes (Diaz-Garcia et al., 2020). Limited breeding progress stems from large planting space requirements, long establishment times (3–4 years), and extended evaluation times of 6–8 years before commercial release (Vorsa and Zalapa, 2019).
Cranberries exhibit unique plant architecture among woody fruit crops, with a growth habit that is characterized by low-growing vines producing short vertical lateral branches known as “uprights.” These uprights are classified into two types: vegetative uprights and reproductive uprights. Vegetative uprights develop apical buds with only vegetative meristems (vegetative buds) and thus only produce leaves. Reproductive uprights develop both vegetative and floral meristems (reproductive buds) and thus produce leaves while also sustaining the development of flowers and fruit. Apical bud induction and differentiation is determined by both management practices and by genetics (Bolivar-Medina et al., 2019). Cranberry yield traits, such as fruit size, quality, shape, and number, were traditionally measured on these flowering vines on a per-upright basis. As such, “reproductive upright traits” have been the traditional target of selection to phenotypically improve berry quality and yield. However, given the substantial cost and time required to accurately phenotype these traits, convention is transitioning toward measuring yield and chemistry on a plot-level (or per-unit-area) basis (Vorsa and Zalapa, 2019).
The past 7 years have shown incredible progress in cranberry molecular resource development and utilization (Covarrubias-Pazaran et al., 2018; Vorsa and Zalapa, 2019). In cranberry, advancement and cost-reduction in high-throughput genome sequencing technologies have enabled assembly of plastid and mitochondrial genomes (Fajardo et al., 2013; Diaz-Garcia et al., 2019, 2014), construction of two high-quality genome (Diaz-Garcia et al., 2021; Kawash et al., 2022), de-novo sequencing of cranberry transcriptomes (Georgi et al., 2013; Sun et al., 2015; Diaz-Garcia et al., 2021), linkage map development for agronomic traits (Georgi et al., 2013; Schlautman et al., 2015, 2017a; Covarrubias-Pazaran et al., 2016; Daverdin et al., 2017), and pilot applications in association mapping and genomic selection (Covarrubias-Pazaran et al., 2018; Diaz-Garcia et al., 2020; Neyhart et al., 2022).
These technologies have enabled several marker-trait association studies on an array of commercially important cranberry traits. For example, Georgi et al. (2013) found evidence of several quantitative trait loci (QTL) in four related populations for field fruit-rot resistance, titratable acidity (TA), fruit weight, and sound fruit yield (SFY). Schlautman et al. (2015) constructed a high-density microsatellite linkage map in a breeding population and discovered QTL for mean fruit weight (MFW), total yield (TY), and biennial bearing index (BBI). Daverdin et al. (2017) generated high-density linkage maps in four diverse populations selected to demonstrate high levels of segregation for field fruit-rot resistance and found 15 QTL across all populations while demonstrating that yield traits segregate independently of field fruit-rot resistance. Image analysis and wet chemistry techniques have demonstrated the power to rapidly generate fruit shape, size, and color descriptors, which are important proxies for fruit quality and yield, and have identified QTL for anthocyanin production, MFW, and shape descriptors that are important for sweetened dried cranberry (SDC) production (Covarrubias-Pazaran et al., 2018; Diaz-Garcia et al., 2018a, 2018b). Finally, pilot applications in association mapping and genomic selection have been recently conducted in cranberry (Covarrubias-Pazaran et al., 2018; Diaz-Garcia et al., 2020; Neyhart et al., 2022).
Despite these significant advancements in molecular methods and genetic tools, no study has yet compared or validated trait phenotypes derived from traditional versus contemporary methods. We conducted QTL analysis on trait phenotypes obtained from contemporary phenotyping methods developed in the last three decades and on traditional phenotyping techniques that have been implemented by cranberry breeders in the last two centuries (Franklin et al., 1958; Eck, 1990; Vorsa and Zalapa, 2019). Many of the traits used in the current study are relevant to modern high-throughput phenomic tools, and others are traits traditionally collected per upright to make selection decisions (Diaz-Garcia et al., 2016). Leveraging advanced genomic and phenomic tools will accelerate genetic gain in cranberry breeding programs and improve understanding of which traditional traits are still useful and relevant in the modern context. This paper is the first to report correlations, heritabilities, and QTL based on both traditional and modern phenotyping methods. We propose that modern phenotyping methods are at least as accurate as traditional phenotyping methods, if not more so, for detecting heritable variation in reproductive upright traits, leading to identification of multi-year QTL for fruit yield and quality. We further expect that QTL identified across years and across studies (meta-QTL) will offer robust opportunities to perform marker-assisted selection for cranberry fruit quality and yield traits. Finally, validation of modern methods against traditional methods will open the doors to more efficient selection for these critically important traits.
The two full-sib populations used in this study, CNJ02 (n = 168) and CNJ04 (n = 67), represent the most highly studied populations in the cranberry fruit yield and quality scientific literature (Schlautman et al., 2015, 2017b; Covarrubias-Pazaran et al., 2018; Diaz-Garcia et al., 2018b; Vorsa and Zalapa, 2019; Diaz Garcia et al., 2021). These populations were established in 2007 in 2.3 m2 field plots at Rutgers’ P.E. Marucci Center for Blueberry and Cranberry Research and Extension, Chatsworth, NJ (Vorsa and Johnson-Cicalese 2012), with experimental design described in previous studies (Schlautman et al., 2015; Covarrubias-Pazaran et al., 2016; Schlautman et al., 2017b; Diaz-Garcia et al., 2018b). CNJ02 was derived from a cross between seed-bearing parent, CNJ97_105_3 (cv. Mullica Queen®) and pollen-donating parent, NJS98_23 (cv. Crimson Queen®); CNJ04 was derived from reciprocal crosses between CNJ97_105_3 (cv. Mullica Queen®) and cv. Stevens. Naming conventions of individual genotypes for populations CNJ02 and CNJ04 are as follows: CNJ<YY>_<CN>_<GID>, where <YY> is a two-digit designation indicating the year of the cross (2002 or 2004, respectively), <CN> is a number indicating the cross number (CN) for that year, <GID> is a genotype identifier (GID), and the underscore separates identifiers in the string. For example, CNJ02_1_38 is a progeny from CNJ02, derived from the first cross (CN = 1) made in 2002, with genotype individual number 38 of that cross (GID = 38).
From 2011 to 2014, reproductive uprights were collected from field plots, 10 uprights per genotype. Traits from CNJ02 and CNJ04 each were recorded over 3 years, with CNJ02 sampled for the years 2011–2013 and CNJ04 sampled for 2011, 2012, and 2014. The traits measured largely comprise those traditionally considered to be commercially important in cranberries (Vorsa and Zalapa, personal communication), along with new fruit quality traits. Traits were loosely categorized into attributes measured directly, and traits features derived from other attributes. Traits measured directly include the categories Upright Traits, Largest Berry Traits, and Plot Traits; derived traits fall into the category Berry Shape Chimera Parameters calculated from berry shape composite representations (Supplementary Table S1). Traits will frequently be referred to by both their full names and acronyms to facilitate figure interpretation and cross-referencing with the manuscript. Trait acronyms will be defined once again in each new section or paragraph.
Plot Traits were sampled the same years as the uprights and are based on 0.09 m2 plot samples of fruit. These include TY, SFY, mean fruit mass (MFM), percent fruit rot (PFR), total anthocyanins (Tacy), soluble solids (Brix), TA, and proanthocyanins (PACs) (Supplementary Table S1) (Diaz-Garcia et al., 2018b).
Upright Traits, which include Largest Berry Traits, were recorded per upright, and their abbreviations are always prefixed with the letter “U” (Supplementary Table S1). Upright Traits include total berry mass (UTBM), length (UL), secondary length (USL), dry leaf mass (UDM), rebud (URB), mean fruit mass (UMFM), number of pedicels (UNPs), number of pedicels without berries (UN0), number of pedicels with mature berries (UNBs), number of pedicels with aborted flowers (UNAFs), and number of pedicels with aborted berries (UNABs).
Largest Berry Traits were measured on the largest berry per upright (10 berries per genotype). Largest Berry yield traits include berry length (UBL), berry width (UBW), berry length:width ratio (ULvW), and berry mass (UBM). Largest Berry quality traits include berry shape (UBS), number of seeds (UNSs), calyx diameter (UCD), calyx lobe fold pattern (UCLP), calyx lobe size (UCLS), calyx end shape (UCES), berry pedicel end shape (UBES), and berry bloom level (UBBL)—a measure of berry epicuticular wax levels.
Berry Shape Chimera Properties are derived from the composite representations, or chimeras, of five berry shape categories (Figure 1). The berry chimera is rendered from the average shape of the 10 largest berries (Figure 2). These parameters were extracted and mapped to provide a data integrity benchmark of the subjective, categorical berry shape traits against their per-upright berry trait analogs (Supplementary Tables S1 and section 2.2).
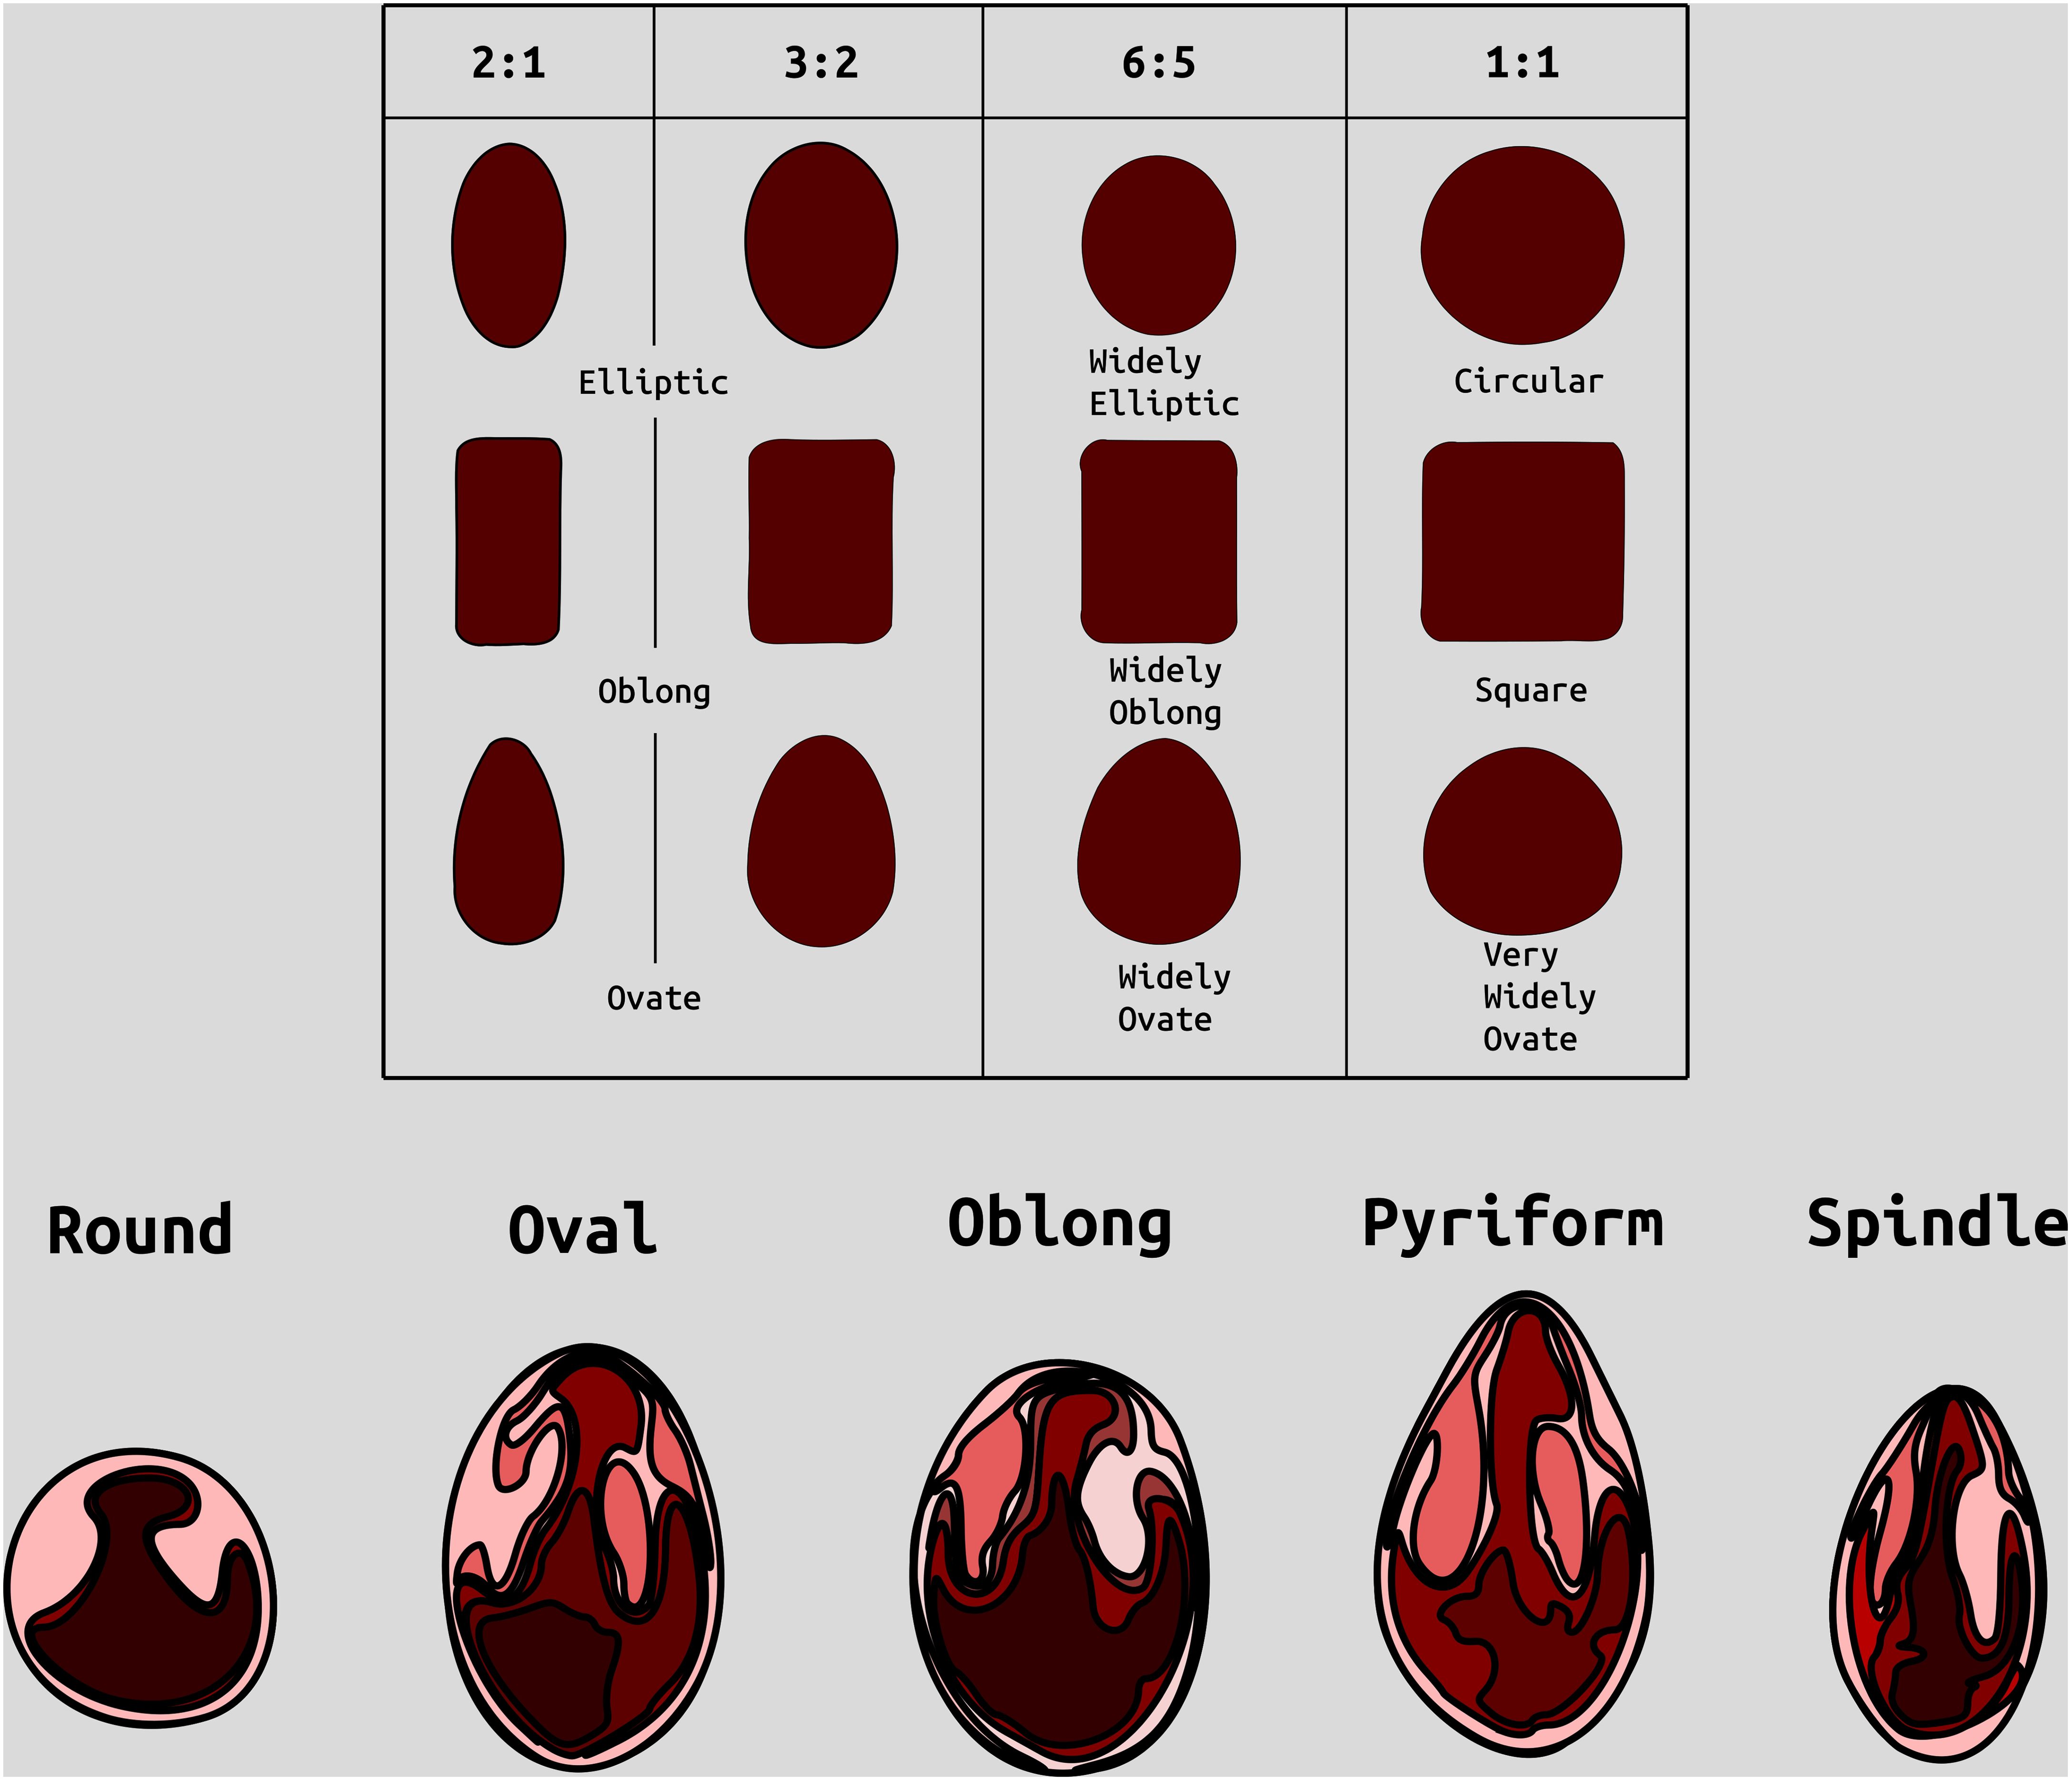
Figure 1. Examples of categories of berry shape parameters used to help classify cranberry shape. Modified from (Franklin et al. 1958).
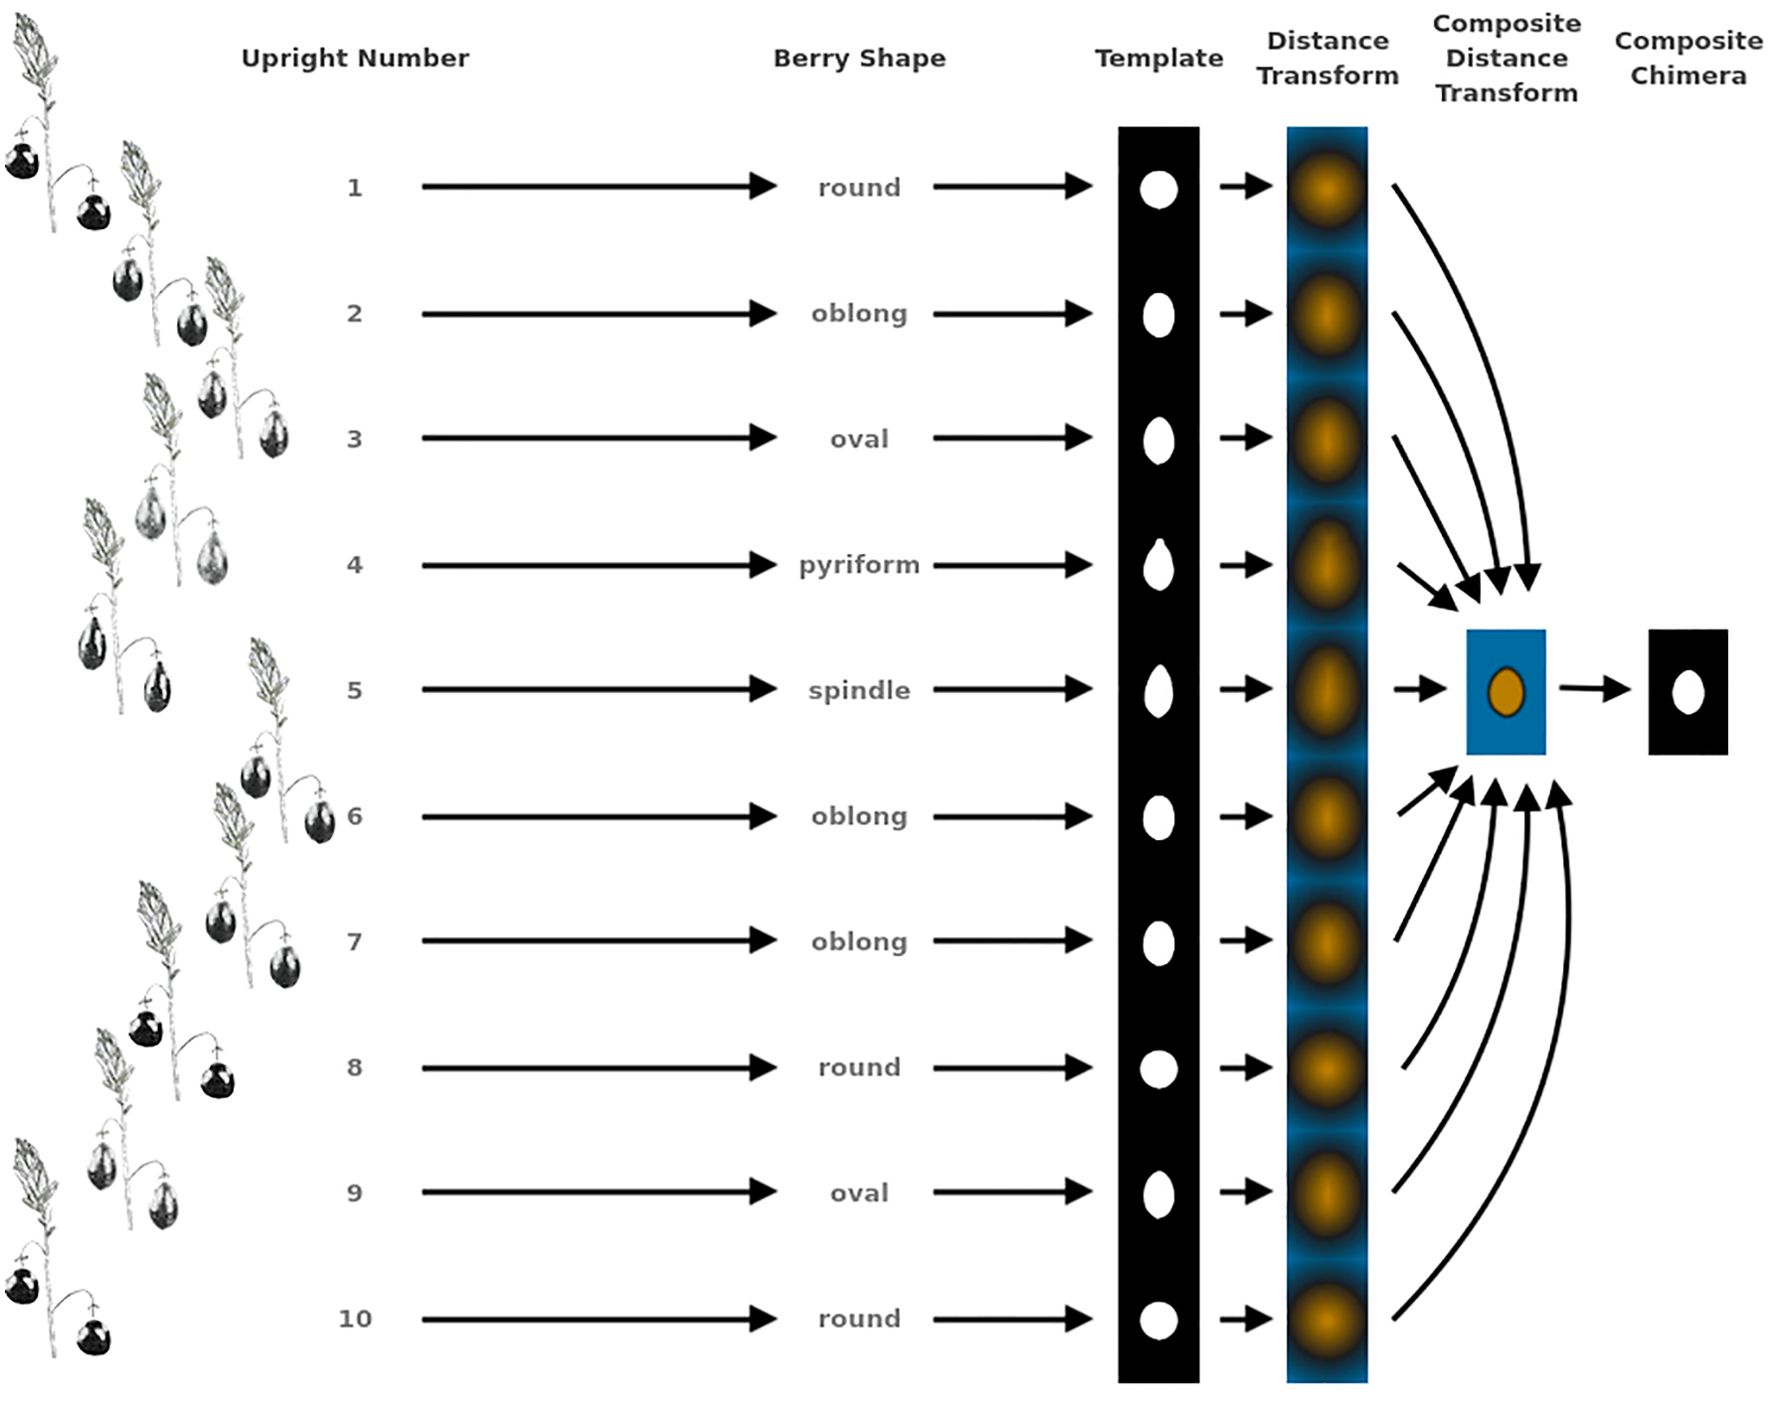
Figure 2. Example showing the methodology for generating representative genotype shape, or berry chimera, from 10 upright samples. This berry chimera is subsequently used as an image to generate digital image processing shape descriptors used in creating quantifying features for QTL mapping.
All categorical traits were transformed to numeric, discrete values (except for largest berry shape). Higher values represent more favorable characteristics. Supplementary Table S3 displays the conversions of categorical traits to numeric values.
Largest berry shape was quantified by replacing scored shape categories with their canonical digital image shapes using the template images provided to trait evaluators (Figure 1). Digital image shape descriptors derived from the representative berry chimera are listed in Supplementary Table S1 under category Berry Shape Chimera Parameters. These images were initially converted to binary images, normalized by centering all representations, and scaling so that all shape templates have the same area. Thereafter, a chimeric berry representation was derived for each genotype year by combining and thresholding the differential distance transformed representations of each corresponding upright’s normalized berry shape (Figure 2). A distance transform representation of a binary image is the Euclidean distance of any foreground pixel to its nearest background pixel. The differential distance transformation is the difference between the distance transformation of the normalized binary berry template image and the same image inverted. Positive values indicate foreground pixels, with higher values indicating the centroid of binary images. By combining the differential distance transforms and thresholding on positive values, a chimeric binary berry image representation per genotype year can be generated. The berry chimera therefore represents a synthesized berry image derived from the composition of multiple categorical berry shapes (10 berry shape classes per genotype). Shape descriptors are calculated from the synthesized berry chimera, allowing for quantitative analysis of shape traits for mapping. Traits upright chimera unsigned manhattan chain code–X-axis (UKUX) and upright chimera unsigned manhattan chain code–Y-axis (UKUY) are derivations of unsigned manhattan chain codes (UMCC) (Žalik et al., 2016). A chain code is a numerical representation describing the contour path of an object. UMCCs are one of many chain codes used to describe contour shapes and were chosen here for their highly compressible representation. Other chimera shape descriptors outlined in Supplementary Table S1 include chimera shape eccentricity (UKEC), chimera length:width ratio (UKLvW), chimera tortuosity (UKTO), and chimera solidity (UKSO). Eccentricity (EC) of a closed contour is a mathematical descriptor for the curvature of an ellipse, with zero indicating a perfect circle and values closer to one signifying a higher length:width ratio. Tortuosity describes the “waviness” of an object’s contour and, in this case, a slope chain code (SCC) method was applied to generate this tortuosity value (Bribiesca, 2013). Solidity describes the shape density relative to its convex hull. Lower solidity values indicate more waviness in the berry contour, while higher values have smoother contour curvature.
All traits were curated by removing entries marked as rotten, and outliers were detected and trimmed with the outlierTest() function of the car package (RRID: SCR_022137) with a default cutoff of p < 0.05 using a linear model of the trait regressed on population, genotype, and year (Fox and Weisberg, 2019). Additional observations were culled if they exceeded three standard deviation units from the mean under a Gaussian standard distribution. Subsequent analysis and trait mapping were applied to all traits based on the mean trait values across the ten sampled uprights, for each genotype year. From these upright means, Pearson correlation coefficients were calculated for all traits and averaged across months and all sampled years. Correlation heatmap plots were generated using the corrplot package (RRID: SCR_023081), with statistical p values calculated using the ggcorrplot package (Kassambara, 2019; Wei and Simko, 2021). Trait correlations were partitioned using hierarchical agglomerative clustering cut at an absolute value correlation tree height equal to 0.6. These partitions form clusters, or cliques, of traits, delineated by heavy black lines in the generated heatmaps. Only non-singleton clusters are reported in the results.
Linkage maps used in this study were previously created from a combination of robust single sequence repeat (SSR) markers and genotype-by-sequencing (GBS) single-nucleotide polymorphic (SNP) markers (Schlautman et al., 2017b). SSR marker data generated for CNJ02 (541 SSRs) and GRYG (189 SSRs) were discovered and curated as described in Schlautman et al. (2015) and Covarrubias-Pazaran et al. (2016). For GBS markers, genomic DNA was extracted from flash frozen leaf tissue and EcoT221-digested DNA fragments were uniquely barcoded for all progeny and parents of CNJ02 and CNJ04 using the approach described by Elshire et al. (2011). These fragments were sequenced (single-end) at the Cornell University Biotechnology Resource Center Genomics Facility on a Illumina HiSeq 2000 platform. A reference Tassel GBS analysis pipeline (Bradbury et al., 2007) was used to filter and process the resulting sequence reads and call SNPs in the resulting datasets for the CNJ02 and CNJ04 populations using the parameters described in Schlautman et al. (2017b) and aligned to the cranberry reference genome produced by Polashock et al. (2014). SNPs with >20% missing data, minor allele frequency (MAF) of <10%, or severely distorted segregation ratios were removed. Linkage analysis on the filtered SSR and SNP markers was performed with JoinMap v4.1, using a pseudo-testcross method, and biparental consensus linkage maps were separately generated for CNJ02 (n = 3925) and CNJ04 (n = 3081) (Schlautman et al., 2017b). Additionally, a composite linkage map (n = 1560) derived from three cranberry populations, CNJ02, CNJ04, and GRYG, was generated using a linear programming approach as described by Schlautman et al. (2017), and is available on the Genome Database for Vaccinium site under the map identifier Cranberry-Composite_map-F1 (https://www.vaccinium.org/bio_data/1070). QTL generated herein used the composite linkage map in order to facilitate cross-population comparison. Population-specific biparental consensus linkage maps were used to produce the additive genomic relationship matrices described in Equation 2.1.
Equation 2.1 shows the mixed model used in estimating best linear unbiased predictors (BLUPs) within years (Henderson, 1975). The equation variables are defined as follows: = phenotype value, = intercept (global mean of trait), = genotype random-effect incidence matrix, = genotypic effects (BLUPs), = row random effect incidence matrix, = row effect, = column random effect incidence matrix, = column effect, = 2D-spline random effect incidence matrix, = spline effect, = residuals, = genotype variance-covariance matrix (De Los Campos et al., 2015), = additive genomic relationship matrix (Endelman, 2011), = additive genomic variance, = identity matrix, = row variance, = column variance, = 2D-spline variance, = residual error variance.
where , , , , , and .
Equation 2.2 displays the across year mixed model used in estimating BLUPs. Year is modeled as a fixed effect. All symbols are the same as in Equation 2.1 but with the additional term = fixed-effect year incidence matrix, = year effect, = genotype-by-year random-effect incidence matrix, = genotype-by-year effect, and = genotype-by-year variance.
where levels of , and .
The mixed models detailed in Equations 2.1 and Equation 2.2 were fit using utilities defined in the R package (R Core Team, 2024) sommer (Covarrubias-Pazaran, 2016). The additive genomic relationship matrix A (also known as additive relationship matrix) is a variance-covariance matrix that was constructed using the sommer function A.mat() on biallelic markers (SNP) from each population’s respective biparental consensus linkage map. Modeling the genetic relatedness between genotypes with the A matrix adjusts for differences absent a structured experimental design. Spatial effects were also compensated for by modeling this variation as 2D-spline random effects and as row and column random effects. The 2D-spline effects are continuous random variables that model spatial variation that does not track first-order polynomial (straight-line) field effects or does not trace along the row and column effects. The row and column random effects models spatial variation by blocking according to the predefined row and column indices of the plots. The BLUPs [also known as genomic estimated breeding values (GEBV)], were estimated using the mmer() function of the sommer package.
Model selection was performed from a full model search on the random terms of models defined in Equation 2.1 or Equation 2.2 using the Akaike Information Criteria (AIC) (Akaike, 1974). The model with the lowest AIC was subsequently used to estimate BLUPs, balancing model complexity with parsimony. For across-year mixed model BLUP estimates, the genotype-by-year interaction effect was excluded from the model fit if it did not display significance (p < 0.05) using a likelihood ratio test. Random term variance estimates were used to calculate additive genomic heritability () of each trait (De Los Campos et al., 2015).
Equation 2.3 displays the formula for calculating within-year narrow-sense genomic heritability, using variances estimated from fitting the mixed model (Equation 2.1). Across year genomic heritability is calculated as shown in Equation 2.4, using variances estimated from the mixed model (Equation 2.2), with representing the number of distinct years fit per trait.
QTL mapping was performed by using the CRAN (RRID: SCR_003005) package r/QTL (RRID: SCR_009085), a software toolkit for mapping experimental crosses (Broman et al., 2003). To infer QTLs, previously modeled genotype BLUPs were substituted in lieu of raw phenotypes in the R/qtl cross table. QTL were detected using two methods: a single-QTL interval mapping method and a model selection approach. Both methods used Haley-Knott regression to model QTL between genetic map markers (Haley and Knott, 1992). The single-QTL method uses the scanone() function, with significant QTL determined using scanone() run against 1,000 permutations of the phenotypes in order to simulate the log of odds (LOD) distribution of the NULL model. The model selection approach uses the stepwiseqtl() function, which runs a forward/backward model search algorithm by which additive and interacting terms are successively added to the model, followed by “backward” pruning of other model terms that optimizes a penalized LOD score. The penalized LOD score uses percentile thresholds derived from running scantwo() against 1,000 permutations of the phenotypes in order to control the false positive rate at percent (Broman et al., 2009). More complex models are penalized higher to reduce model overfitting. For single-QTL interval mapping, the significance threshold was set for QTL with LOD scores above the permutation percentile, while for model selection, penalized LOD scores were derived from thresholds determined from the permutation percentile. QTL inferred through statistical association mapping approaches are subsequently referred to as principal or primary QTL.
Co-located QTL, or meta-QTL, represent collections of principal marker associations that are stable across corresponding traits, years (multiple models), populations, QTL inference methods, and/or other studies. Major QTL are defined as those QTL with a mean percent marker variance explained (marker ) greater than or equal to 10%. Within-trait major QTL found for populations CNJ02 and CNJ04 were assembled from principal QTL that were stable in at least three of the four models (single-year models on three separate years as defined in Equation 2.1 and the multi-year model defined in Equation 2.2). To construct multi-trait composite meta-QTL, traits were grouped into correlated sets based on observed trait Pearson correlation blocks (Figure 3) for this study, or similar groups of traits across studies. Multi-trait composite meta-QTL were grouped according to the categories detailed in Tables 1A, 1B, Supplementary Tables 1A, 1B. Within-trait major meta-QTL were assigned a separate group per trait. Using the lower and upper LOD 1.5 interval extents, all pairwise principal QTL within the same group were represented in an undirected graph structure, where nodes constitute the primary QTL and edges indicate QTL–QTL overlap. A graph was assembled for each set and trait group using the Python library NetworkX, and composite meta-QTL were synthesized from a maximal clique approximation algorithm, where each maximal clique represents a new meta-QTL (Van Rossum, 2007; Hagberg et al., 2008). For each maximal clique, the new left and right extents of the meta-QTL were taken from the maximal LOD 1.5 left extent and the minimal LOD 1.5 right extent. The meta-QTL’s synthetic position was calculated as the center, or mean, of its extents. Additionally, information was recorded for each meta-QTL by compiling summary statistics such as population count, study count, year count, mapping method count, trait count, and mean marker variance explained by QTL. Other meta-QTL information compiled included the composite list of traits, populations, models (temporal consistency), and studies.
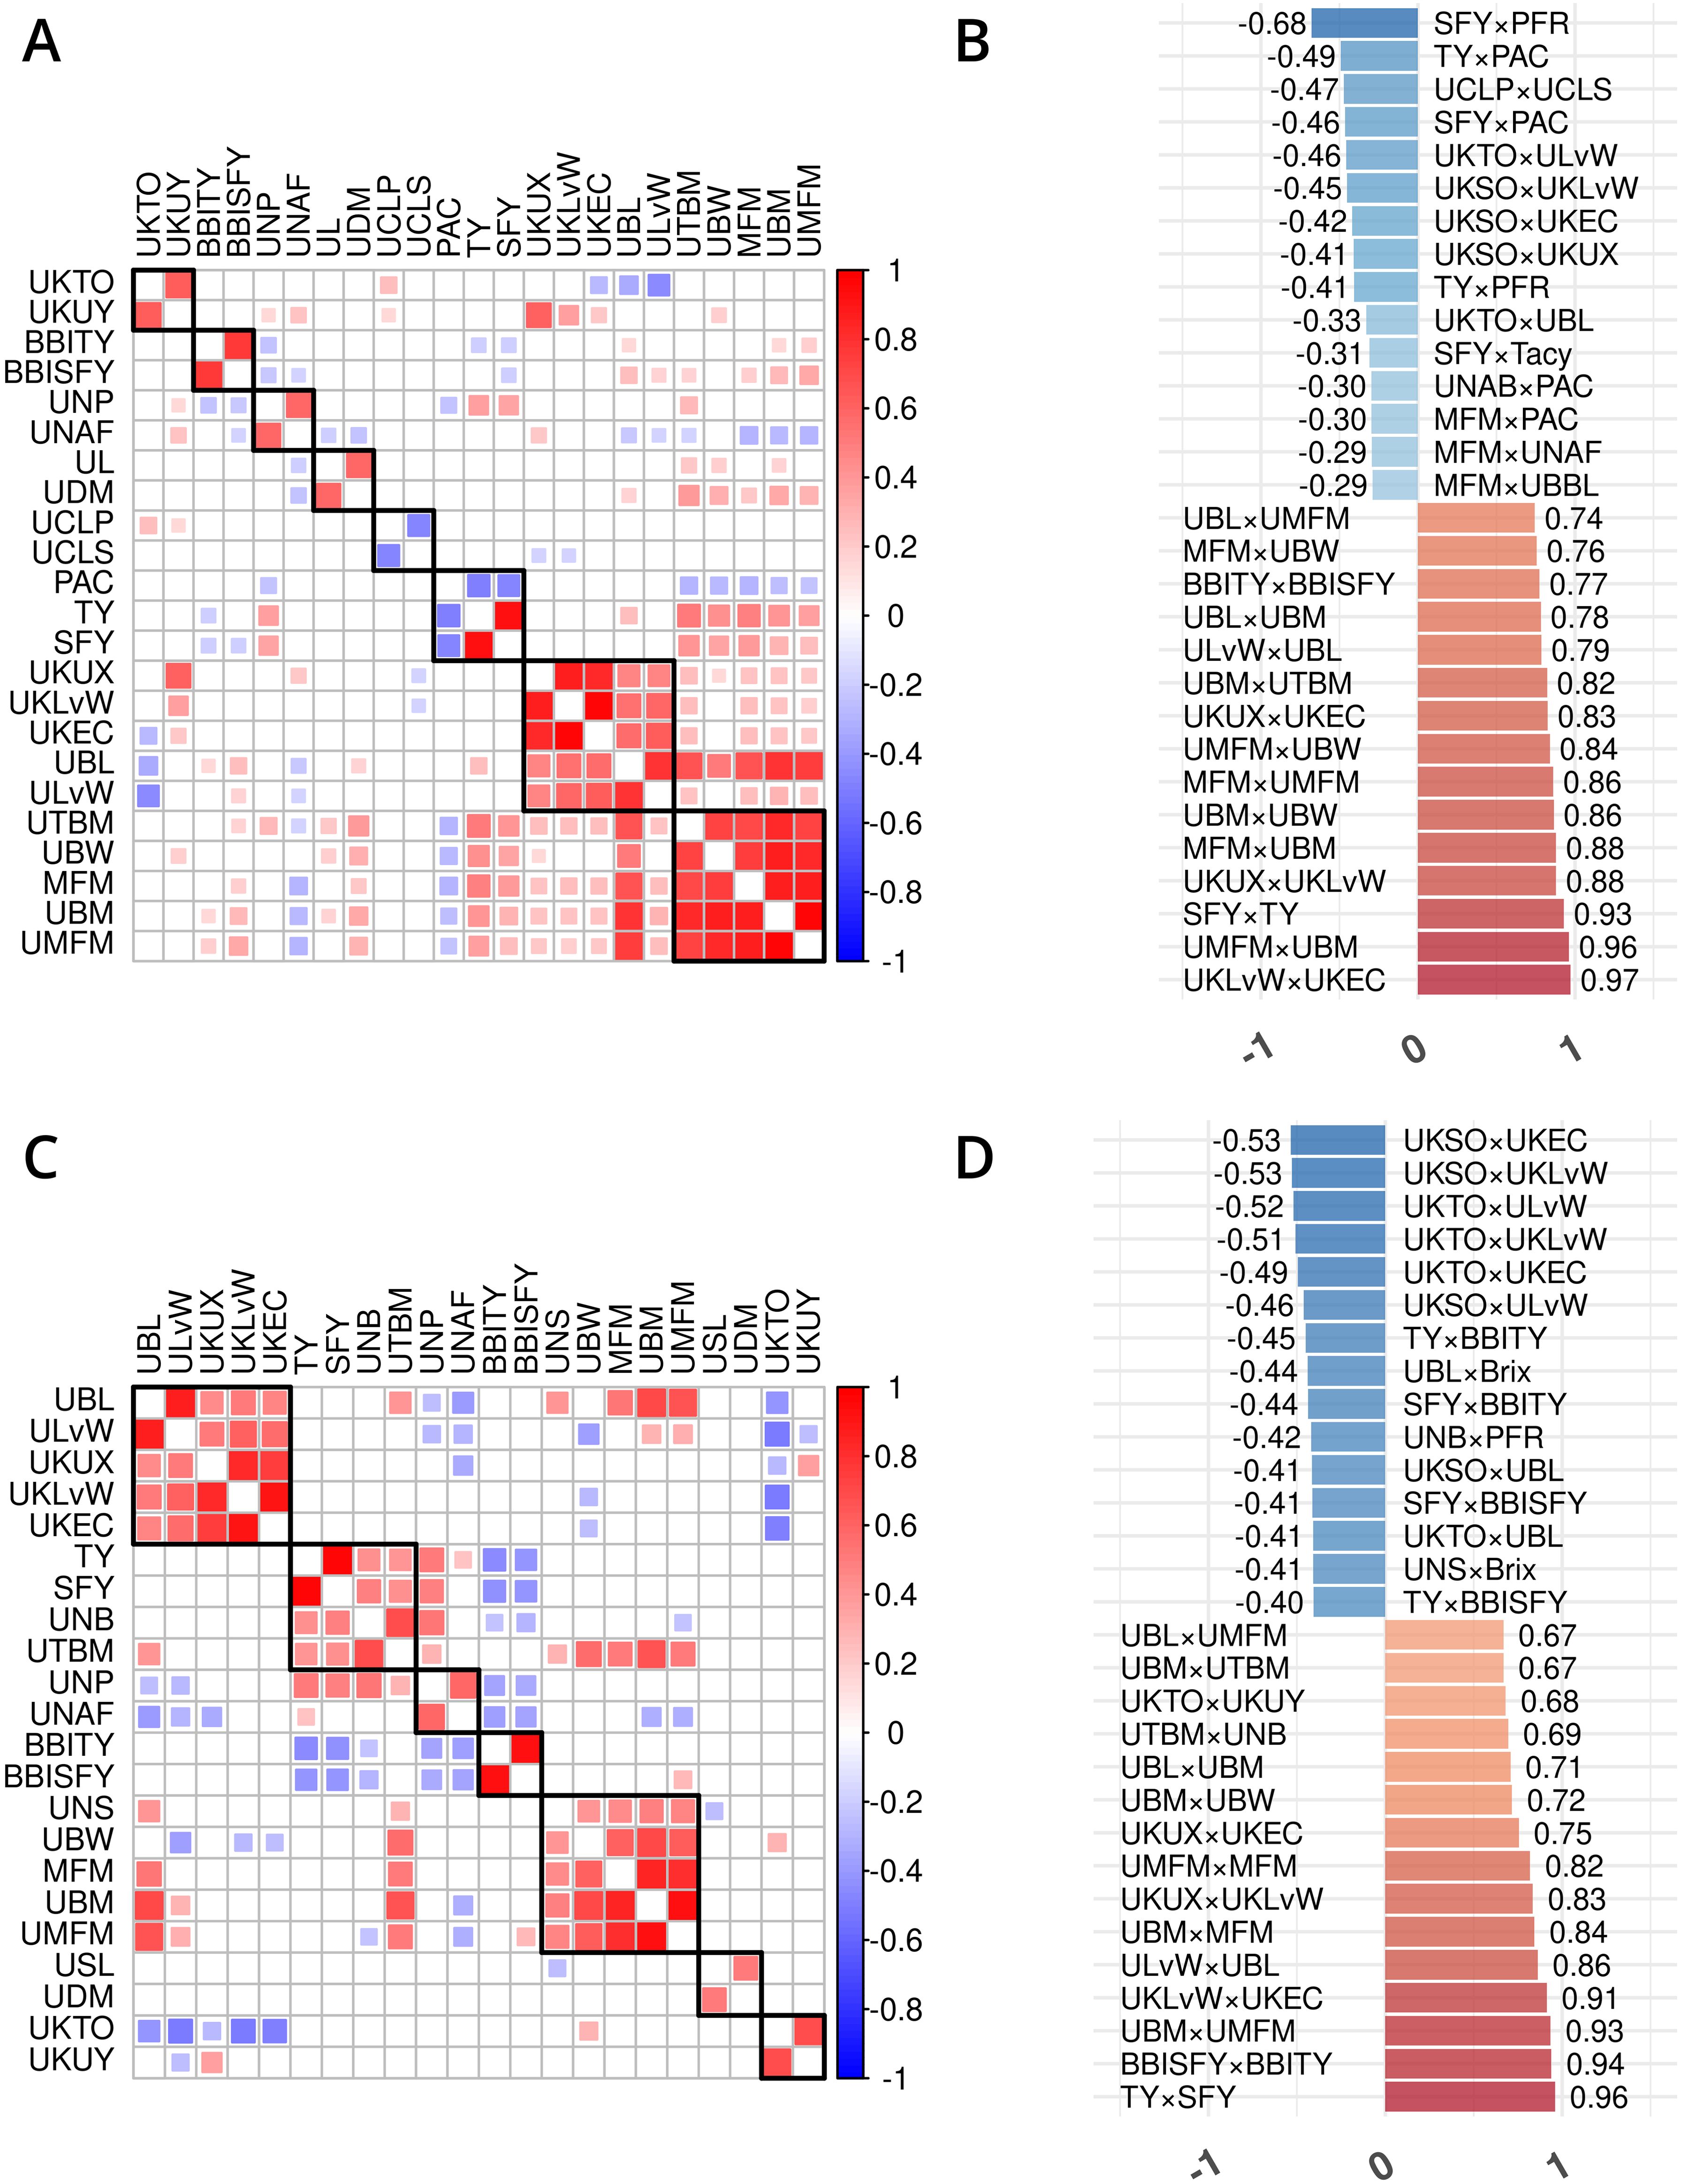
Figure 3. Trait phenotype correlation heatmaps for traits in cranberry populations CNJ02 (A, B) and CNJ04 (C, D). Only traits found within non-singleton hierarchical clusters are shown in (A, C), where black squares delineate clusters. The 15 largest positive and 15 smallest negative correlations are shown in (B,D). Only significant pairwise trait correlations (p < 0.05) are displayed.
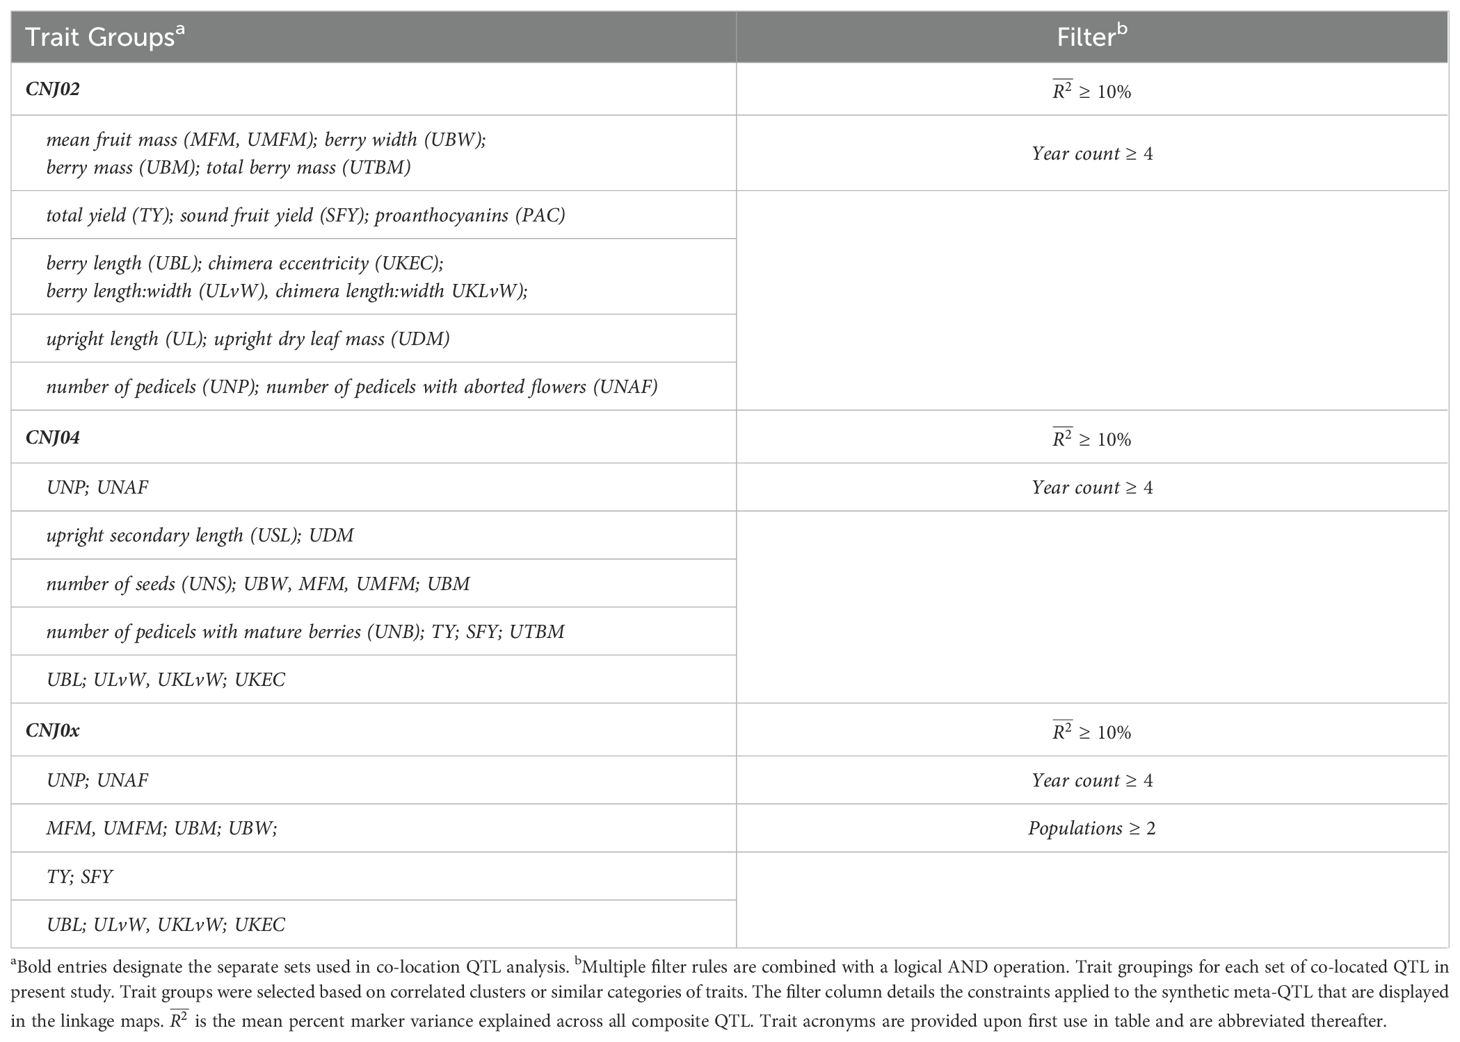
Table 1A. Trait groupings for each set of co-located QTL in present study.
Table 1B. Trait groupings for each set of co-located quantitative trait loci (QTL) across cranberry studies (present study included).
Genomic plots of composite meta-QTL were generated using a customized version of the CRAN package LinkageMapView (Ouellette et al., 2018). For each multi-trait set annotated in Tables 1A, 1B, a representative linkage map of selected meta-QTL was generated. Line segments represent the maximal LOD position of the principal trait QTL, linkage map fills represent the original LOD 1.5 intervals, labels identify the respective traits of the composite, and interval bars demarcate the intersection of principal QTL 1.5 LOD intervals. Traits and intervals are colored as defined in each figure’s respective legend (Figures 4–6). Within-trait meta-QTL for CNJ02 and CNJ04 are graphed similarly to multi-trait meta-QTL, but with each linkage group subdivided into four columns delineating the year models (Figure 4).
Figure 4. Co-located, stable QTL in cranberry populations CNJ02 (A) and CNJ04 (B) found in at least three of four BLUP models. Only QTL with are shown. Shaded bars represent the 1.5LOD confidence interval for the original QTL, with the darker line segments indicating the location of the QTL. The linkage groups are divided into four columns, one for each fitted BLUP model—from left to right: 2011, 2012, 2013, and all years (A); and 2011, 2012, 2014, and all years (B). Each QTL interval is color-coded by its corresponding trait. The labels and interval lines to the right of linkage groups show the stable meta-QTL associated with their respective genomic regions.
Prominent trait correlations illuminate phenotypic relationships for population CNJ02 (A and B) and CNJ04 (C and D) (p < 0.05) (Figure 3). The bar plots in Figures 3B, D show the 15 top positive and 15 bottom negative inter-trait correlations per respective population. Only significant correlations (p < 0.05) are displayed in Figures 3B, D. Correlated trait clusters in CNJ02 include {PACs, TY, SFY}, {MFM, UMFM, UBM, UTBM}, and {UCLP, UCLS}, {UKTO, UKUY}, {biennial bearing index-total yield (BBITY), biennial bearing index-sound fruit yield (BBISFY)}, {UNAFs}, {UBL, UDM}, and {UBL, UKLvW, UKEC, ULvW, UKUX} (Figure 3A). Pairwise positive associations evident in the CNJ02 dataset include {SFY × TY}, {MFM × UBM}, {MFM × UMFM}, {UBM × UTBM}, and {MFM × UBW}. Negative pairwise correlations found in the CNJ02 dataset include {TY × PAC}, {UCLP × UCLS}, {SFY × PAC}, {SFY × Tacy}, {PAC × UNABs}, {MFM × PAC}, {MFM × UNAFs}, and {MFM × UBBL}. For CNJ04, correlation clusters include the {TY, SFY, UTBM, UNBs} cluster and the {MFM, UMFM, UBM} cluster (Figure 3C).
Generally, all-year model trait BLUPs (Equation 2.2) have larger heritabilities relative to their respective fitted model trait BLUPs for individual years. Traits with consistently high heritability in both populations are displayed in Figure 7. Heritability values are calculated from the inter-population mean of the all-year model heritability (Figure 7A), and separately, the within-year model heritability averages between CNJ02 and CNJ04 (Figure 7B). ULvW has remarkably high heritability in both populations, followed by UBL and UNSs. Tacy, a desirable trait associated with fruit color, also shows evidence of high heritability. High heritabilities in UBM, UMFM, and TY indicate strong potential for selecting for higher yields in both populations. The fruit rot SFY and PFR exhibited low to modest heritabilities (0.3 ≤ h2 ≤ 0.6) in both populations. Fruit quality traits such as TA and Brix exhibit very low all-year heritabilities in population CNJ02 but higher heritability in CNJ04 (Figure 8).
Population CNJ02 and CNJ04 both displayed evidence of transgressive segregation for many of the traits. Tables 2, 3 show summary statistics for traits and their associated BLUPs for the all-year model. Rows are sorted by decreasing heritability, and only display the top 50% of models based on heritability () and with significant genotypic effects (p < 0.05). Raw trait associated statistics are subscripted with the italicized letter r, and BLUP associated statistics are subscripted with the italicized letter b. The top and bottom five representative genotypes are also presented both for recorded traits and for genotype BLUPs.
Table 2. Cranberry population CNJ02 trait and BLUP summary for all-year model with heritability above 0.47. Only models with significant (p < 0.05) genotypic effects are displayed.
Table 3. Cranberry population CNJ04 trait and BLUP summary for all-year model with heritability above 0.47. Only models with significant (p < 0.05) genotypic effects are displayed.
For the CNJ02 population, around six QTL per trait × model were found for the scanone method and 10 QTL per trait × model were found for the stepwiseqtl method. Of the 385 additive scanone QTL found in models with significant genotype effects (p < 0.05), 170 were major QTL (marker PVE ≥ 0.1). Of the stepwiseqtl additive QTL found in models with significant genotype effects, 150 of 702 were major. The average scanone percent variance explained (PVE) per QTL was 9.8%, with an average model PVE of 71.5%. The mean stepwiseqtl QTL PVE was 7.2%, with an average model PVE of 89.9%. A full list of QTL and their effect sizes can be found in Supplementary Tables S4, S5.
A summary of stable multi-model, within-trait meta-QTL for CNJ02 are displayed in Figure 4A, Table 4. The Tacy trait displays a prominent meta-QTL on linkage group 3 (position 55.8 cM) with an average paternal effect of −11 mg units per 100 mg fruit. UBM, UTBM, and PFR all have proximal QTL on linkage group 11 (around 30 cM) with UBM and UTBM having similar average paternal effect sizes of −0.34 g and −0.29 g. A meta-QTL for MFM (per upright) is found very close to the berry mass and upright berry mass on linkage group 11 (position 38.1 cM) with a similar paternal effect size of −0.3 g/fruit. PFR has around 10% decrease for both the maternal and paternal effects. A meta-QTL is found very close to the UBM and UTBM on linkage group 11 (position 38.1 cM), with a similar paternal effect size of −0.3 g/fruit. SFY has a meta-QTL on linkage group 12 at 40.4 cM, with a maternal effect size of 10 g/0.09 m2 and a paternal effect size of 46 g/0.09 m2. UKLvW has a modest meta-QTL on linkage groups 3 (position 30.7 cM) and 9 (position 82.7 cM). UBL has a meta-QTL on linkage group 10 (position 53.0 cM) with a maternal effect size of −1.8 mm and paternal effect size of 1.1 mm.
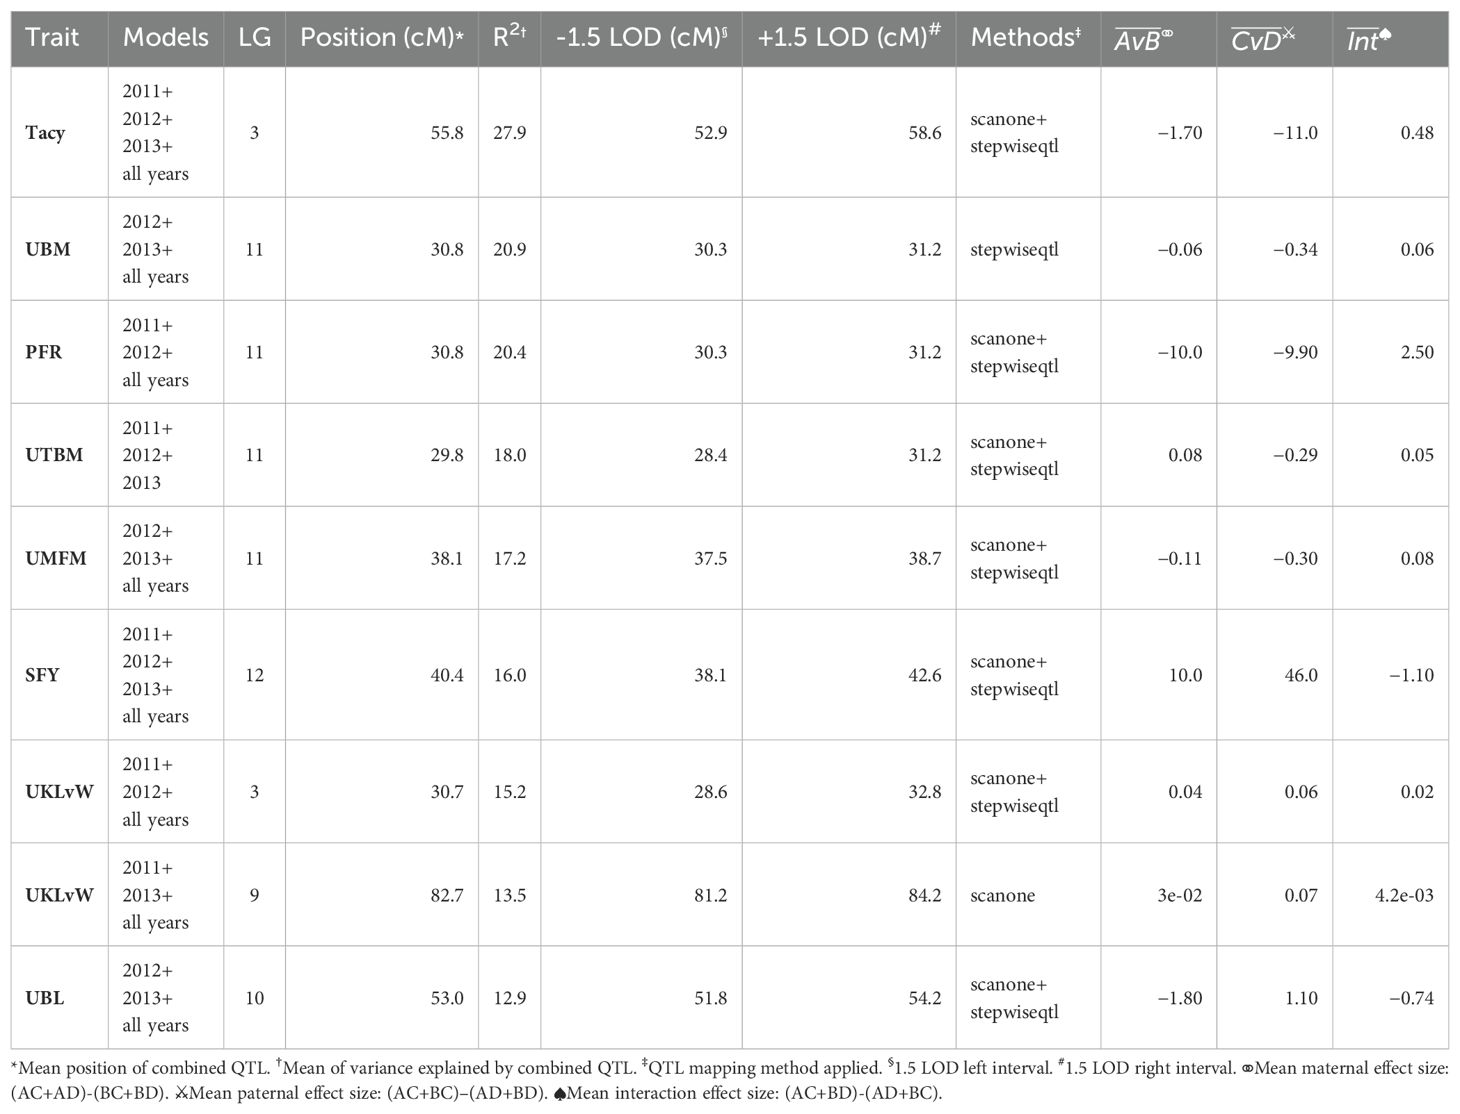
Table 4. Co-located, stable QTL in cranberry population CNJ02 found in at least three of four BLUP models. Only QTL with are shown. Table is arranged in descending order by mean marker variance.
Despite having a lower population size (n = 67), and thus lower power to find statistically significant QTL, prominent QTL were found in CNJ04. An average of three QTL per trait × model were found using scanone and nine QTL per trait × model were mapped with stepwiseqtl. Of the 90 scanone QTL found in models with significant genotype effects, 69 were major QTL. Of the stepwiseqtl QTL found in models with significant genotype effects, 81 of 365 were major. The scanone average total BLUP variance explained per QTL was 16.9%, with an average BLUP variance explained by all QTL per trait × model of 67%. The stepwiseqtl average total BLUP variance explained per QTL was 7%, with an average BLUP variance explained by all QTL per trait × model of 96.6%. A full list of QTL and their effect sizes can be found in Supplementary Tables S6, S7.
Table 5, Figure 4B show the inventory of durable multi-model, within-trait meta-QTL for CNJ04. PAC content has a meta-QTL on linkage group 7 (position 28.7 cM) with a mean maternal effect size of 0.14 mg/g fruit and a mean paternal effect size of 0.19 mg/g fruit. A meta-QTL associated with the trait UKLvW can be found on linkage group 11 (position 10.3 cM), with similar maternal and paternal effect sizes of 0.1. A meta-QTL associated with trait UBL is located nearby the trait ULvW meta-QTL on linkage group 11 (position 16.0cM) and has maternal and paternal effect sizes of 1.1 and 1.3, respectively. A meta-QTL for UTBM is found on linkage group 9 (position 82.6cM) with a maternal effect size of 0.44 g fruit/upright and paternal effect size of 0.19 g fruit/upright.
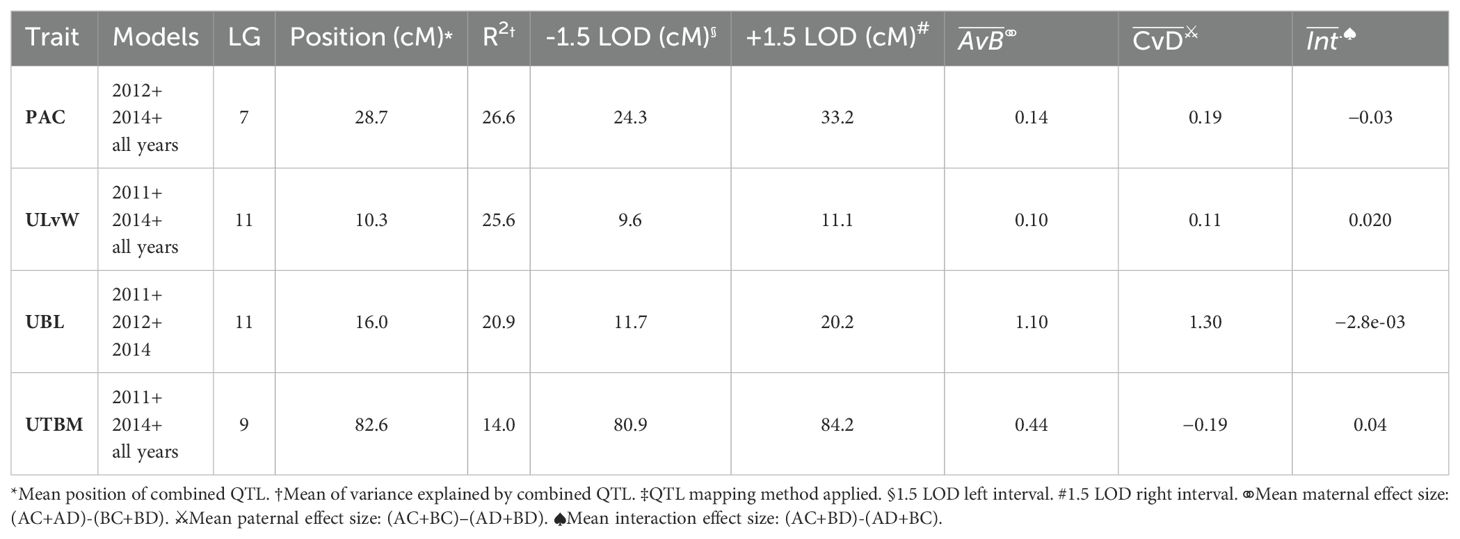
Table 5. Co-located, stable QTL in cranberry population CNJ04 found in at least three of four BLUP models. Only QTL with are shown. Table is arranged in descending order by mean marker variance. All QTL were reported below were identified with both scanone and stepwiseqtl methods‡.
Co-located trait-marker associations representing stable, cross-population QTL are shown in Figure 5. Together, they represent stable meta-QTL derived from the primary QTL found in the current study for CNJ02, CNJ04, and CNJ0x. The traits that pass the filtering constraints outlined in Table 1A are all yield or yield-adjacent traits. Composite multi-trait QTL are found on linkage groups 2, 3, 10, 11, and 12 for set CNJ02 (Table 1A, Figure 5A); linkage group 11 for set CNJ04 (Table 1A, Figure 5B); and linkage groups 3, 11, and 12 for set CNJ0x (Table 1A, Figure 5C).
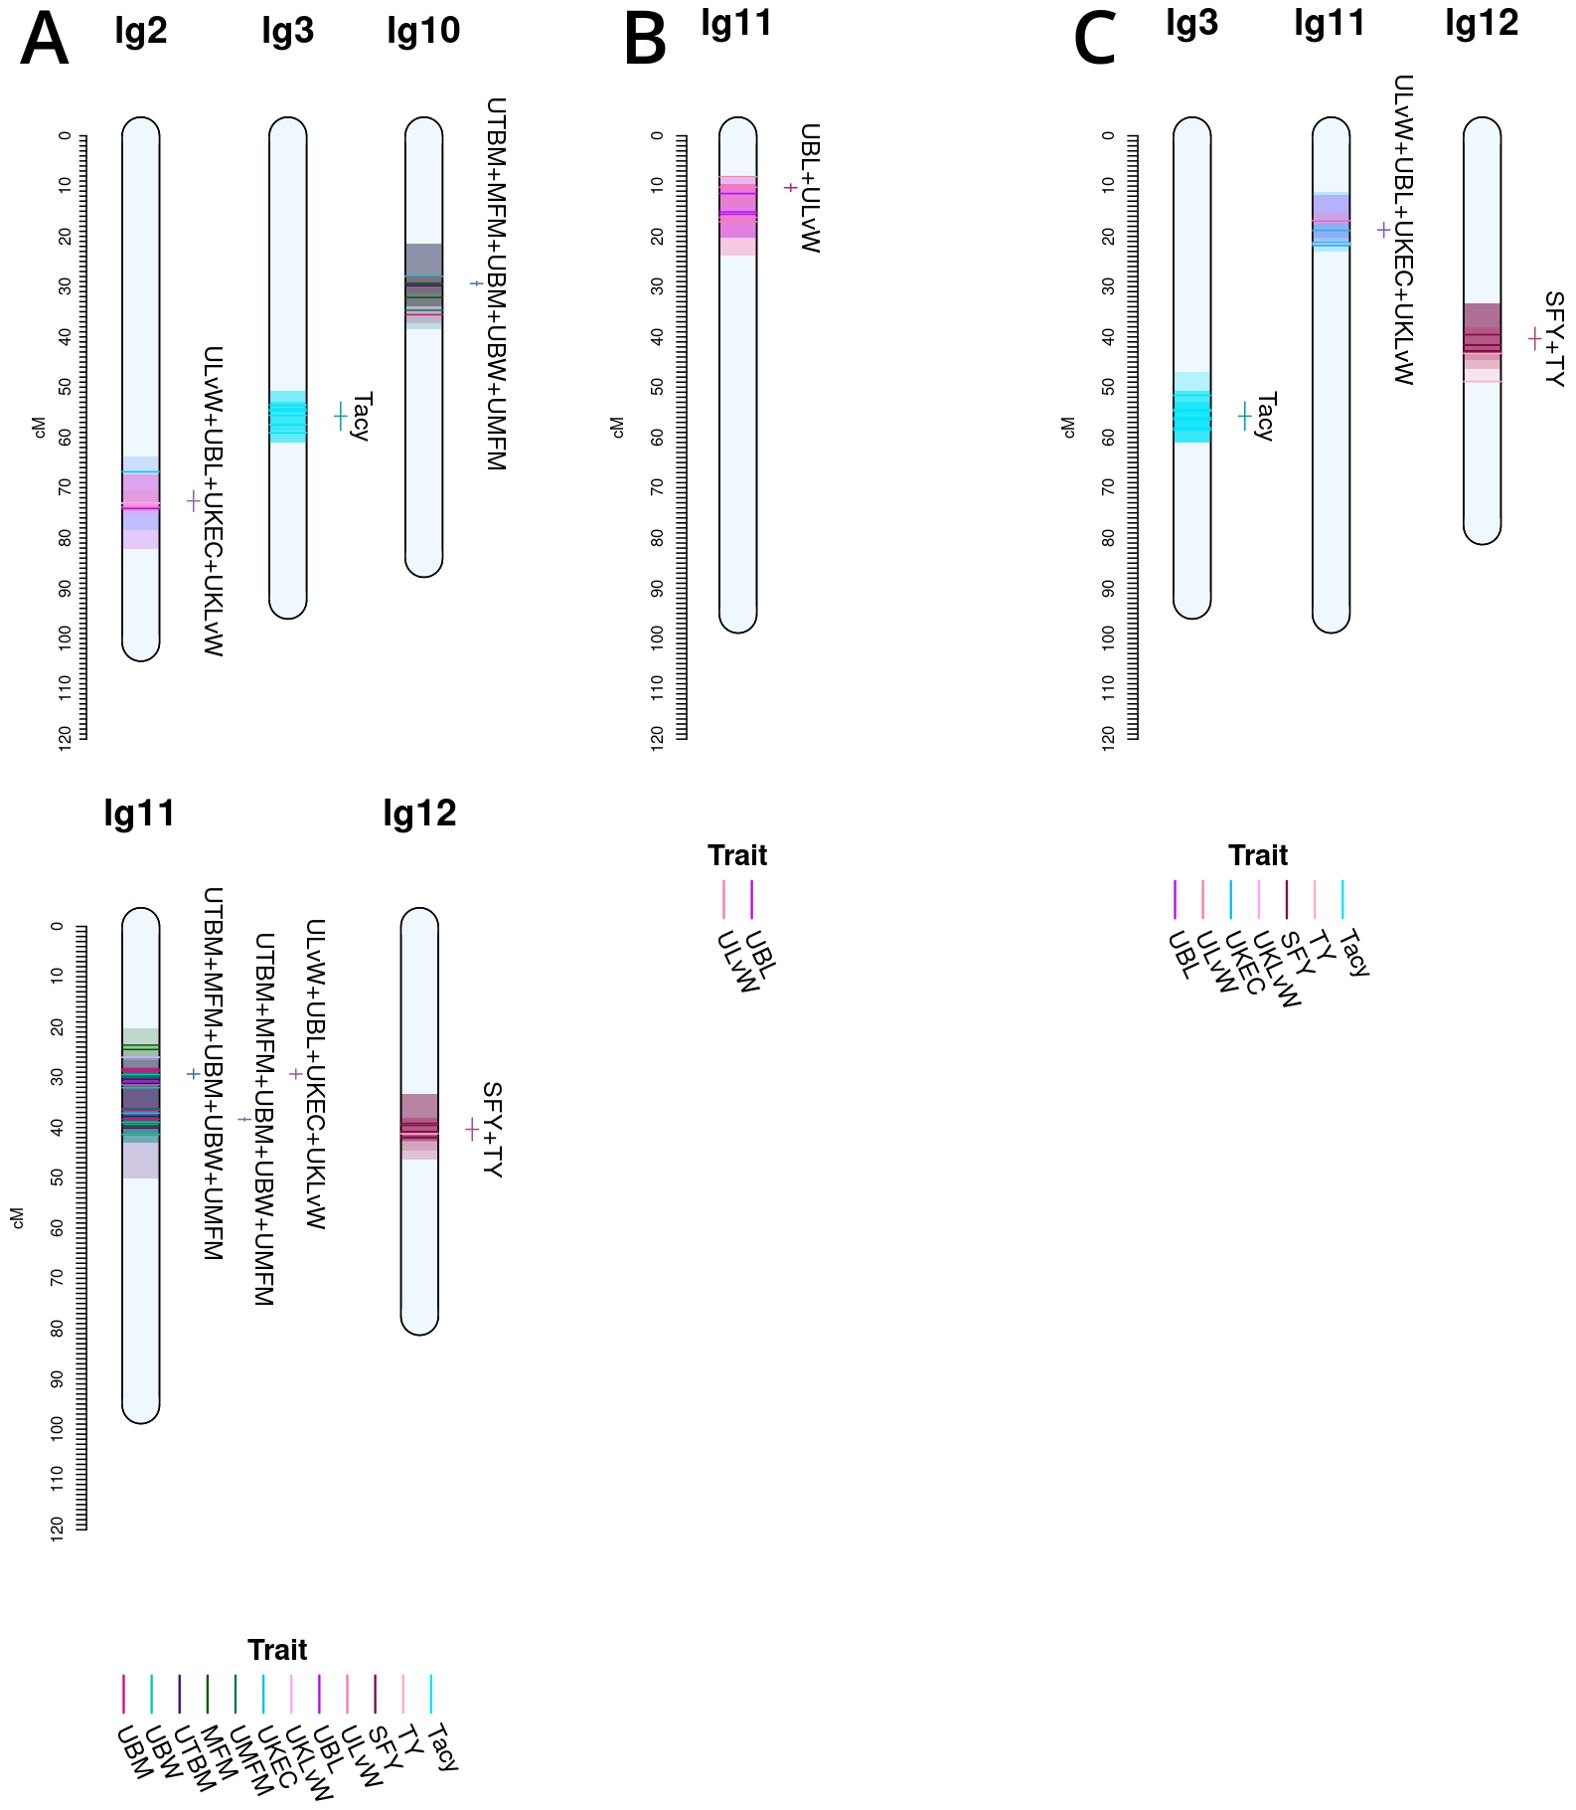
Figure 5. Noteworthy multi-trait, co-located QTL for cranberry populations CNJ02 (A), CNJ04 (B), and both CNJ02 and CNJ04 (C), based on results from this study.
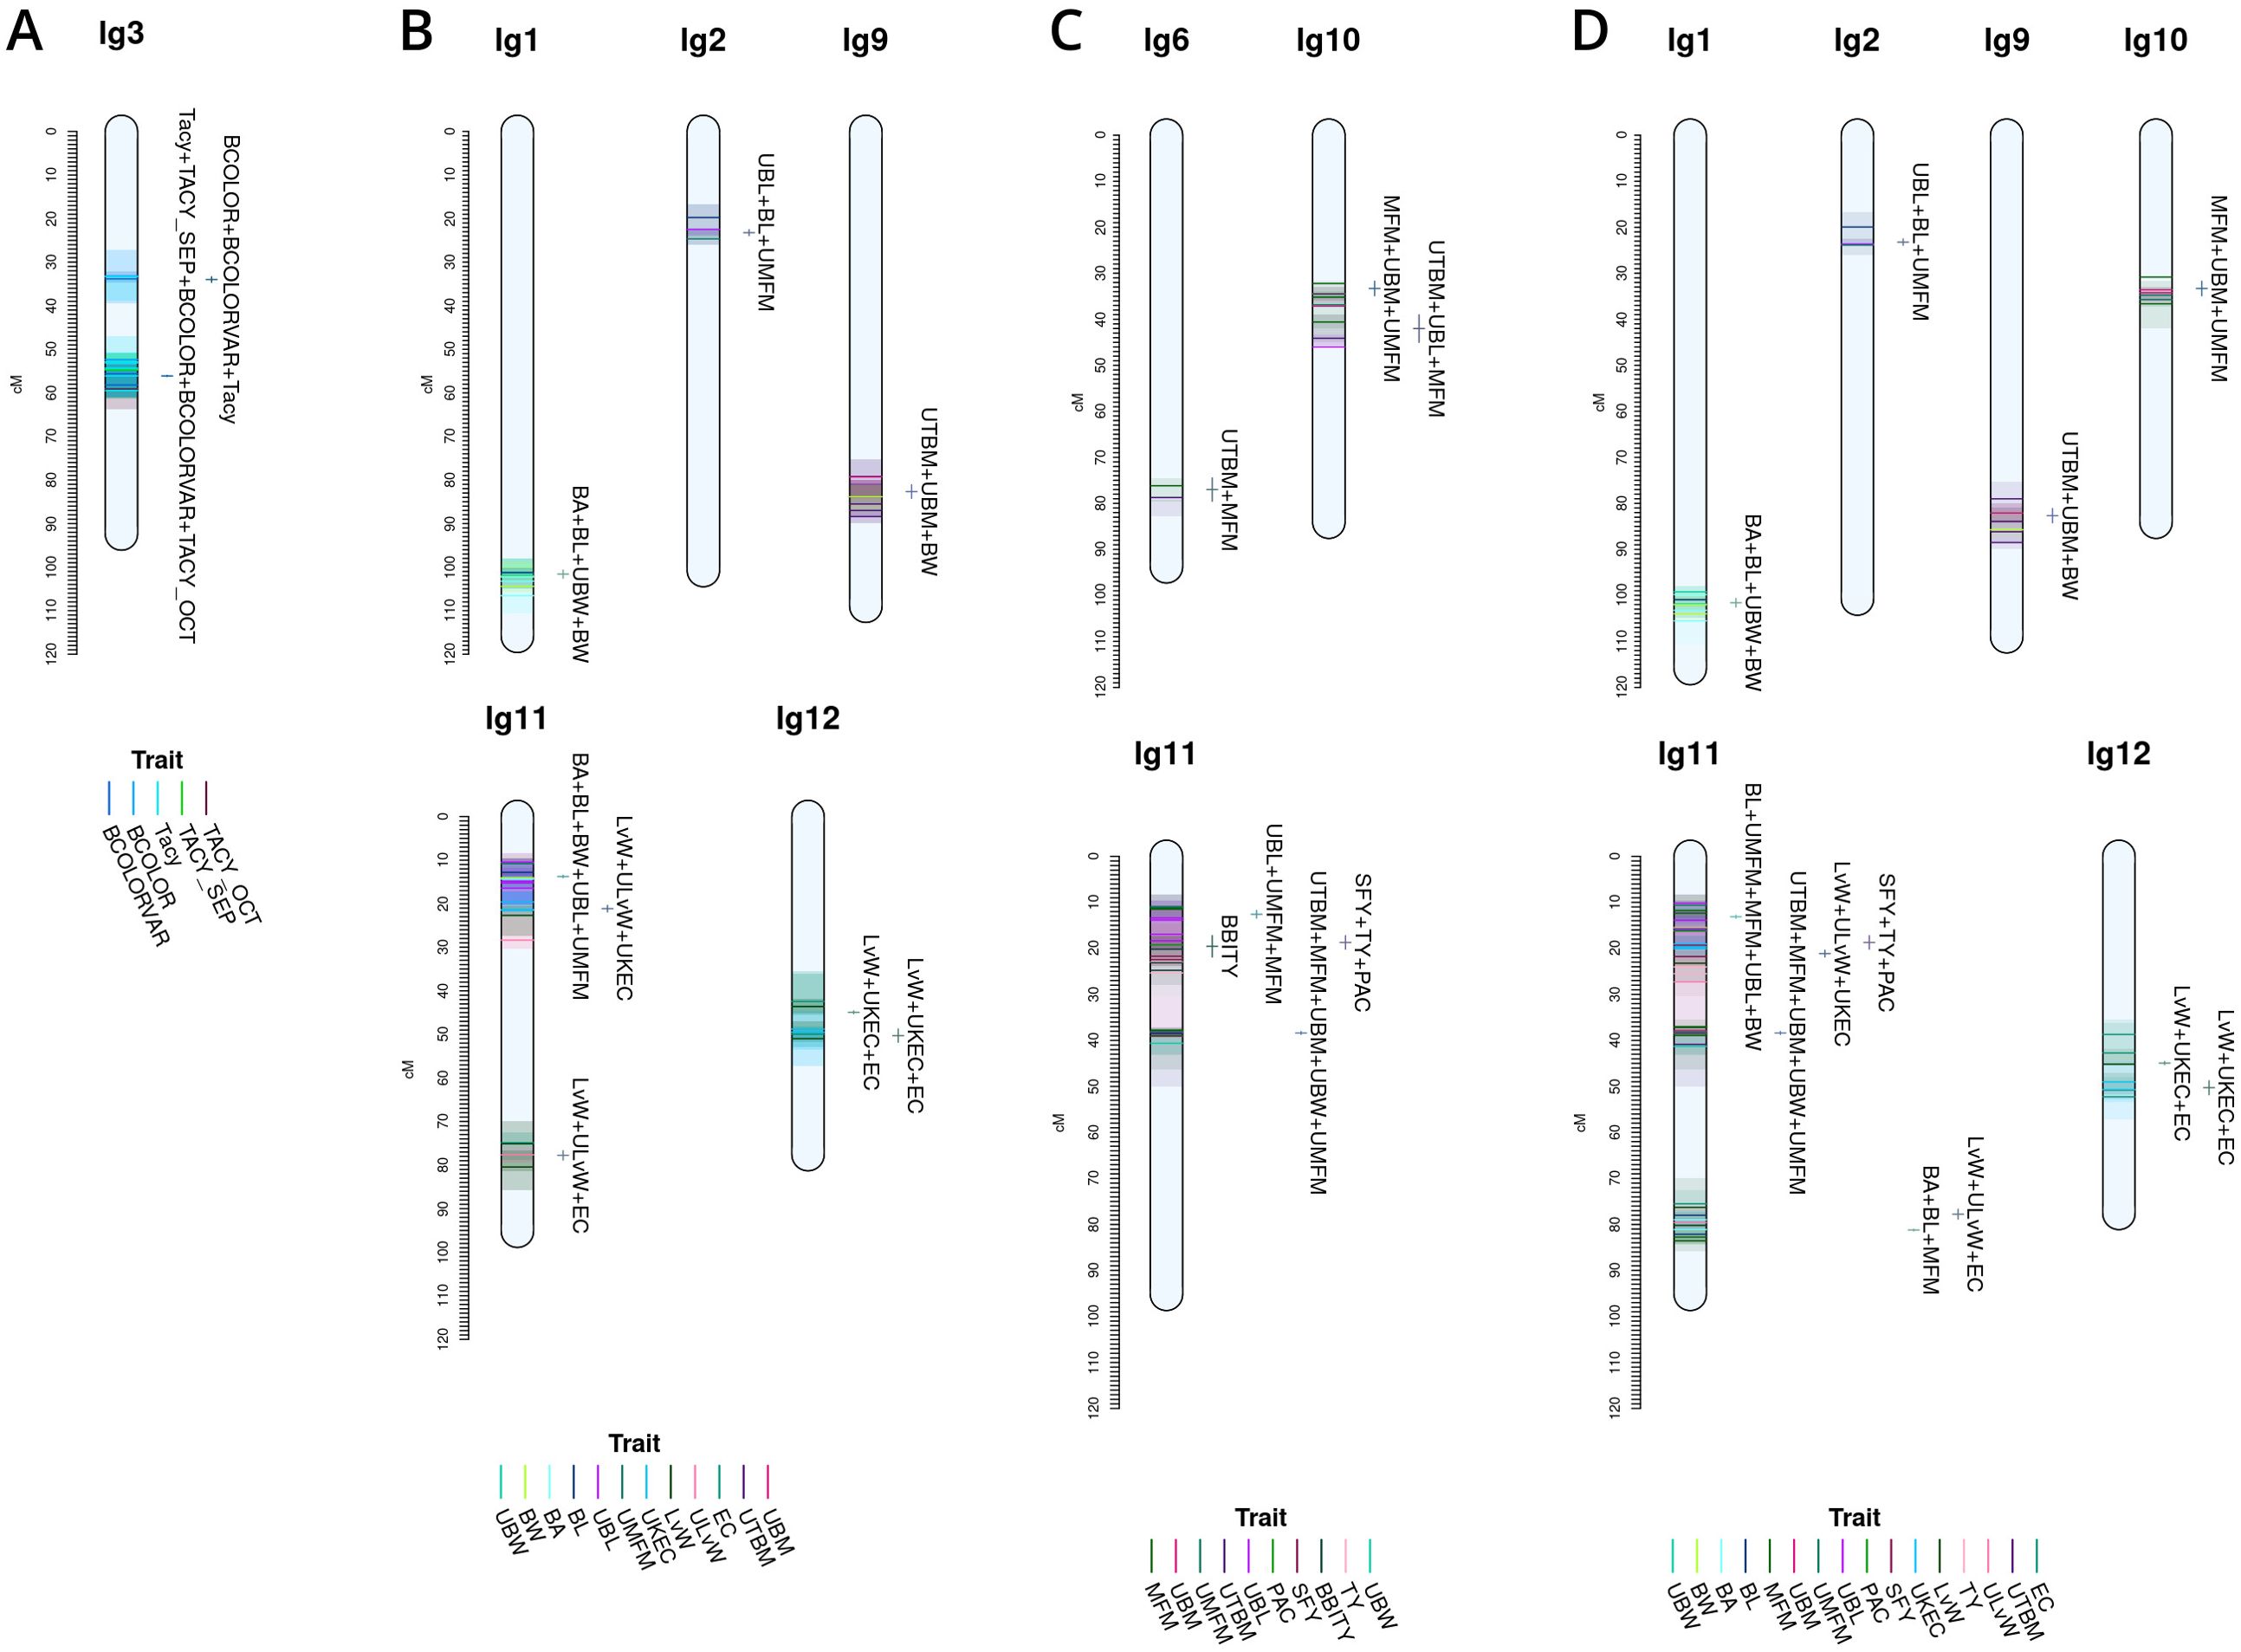
Figure 6. Cross study co-located meta-QTL found comparing QTL from this study with QTL from Diaz-Garcia et al. (2018b) (A), Diaz-Garcia et al. (2018a) (B), Schlautman et al. (2015) (C), and a combined synthesis of Diaz-Garcia et al. (2018a) and Schlautman et al. (2015) (D) in cranberry populations CNJ02, CNJ04, and GRYG.
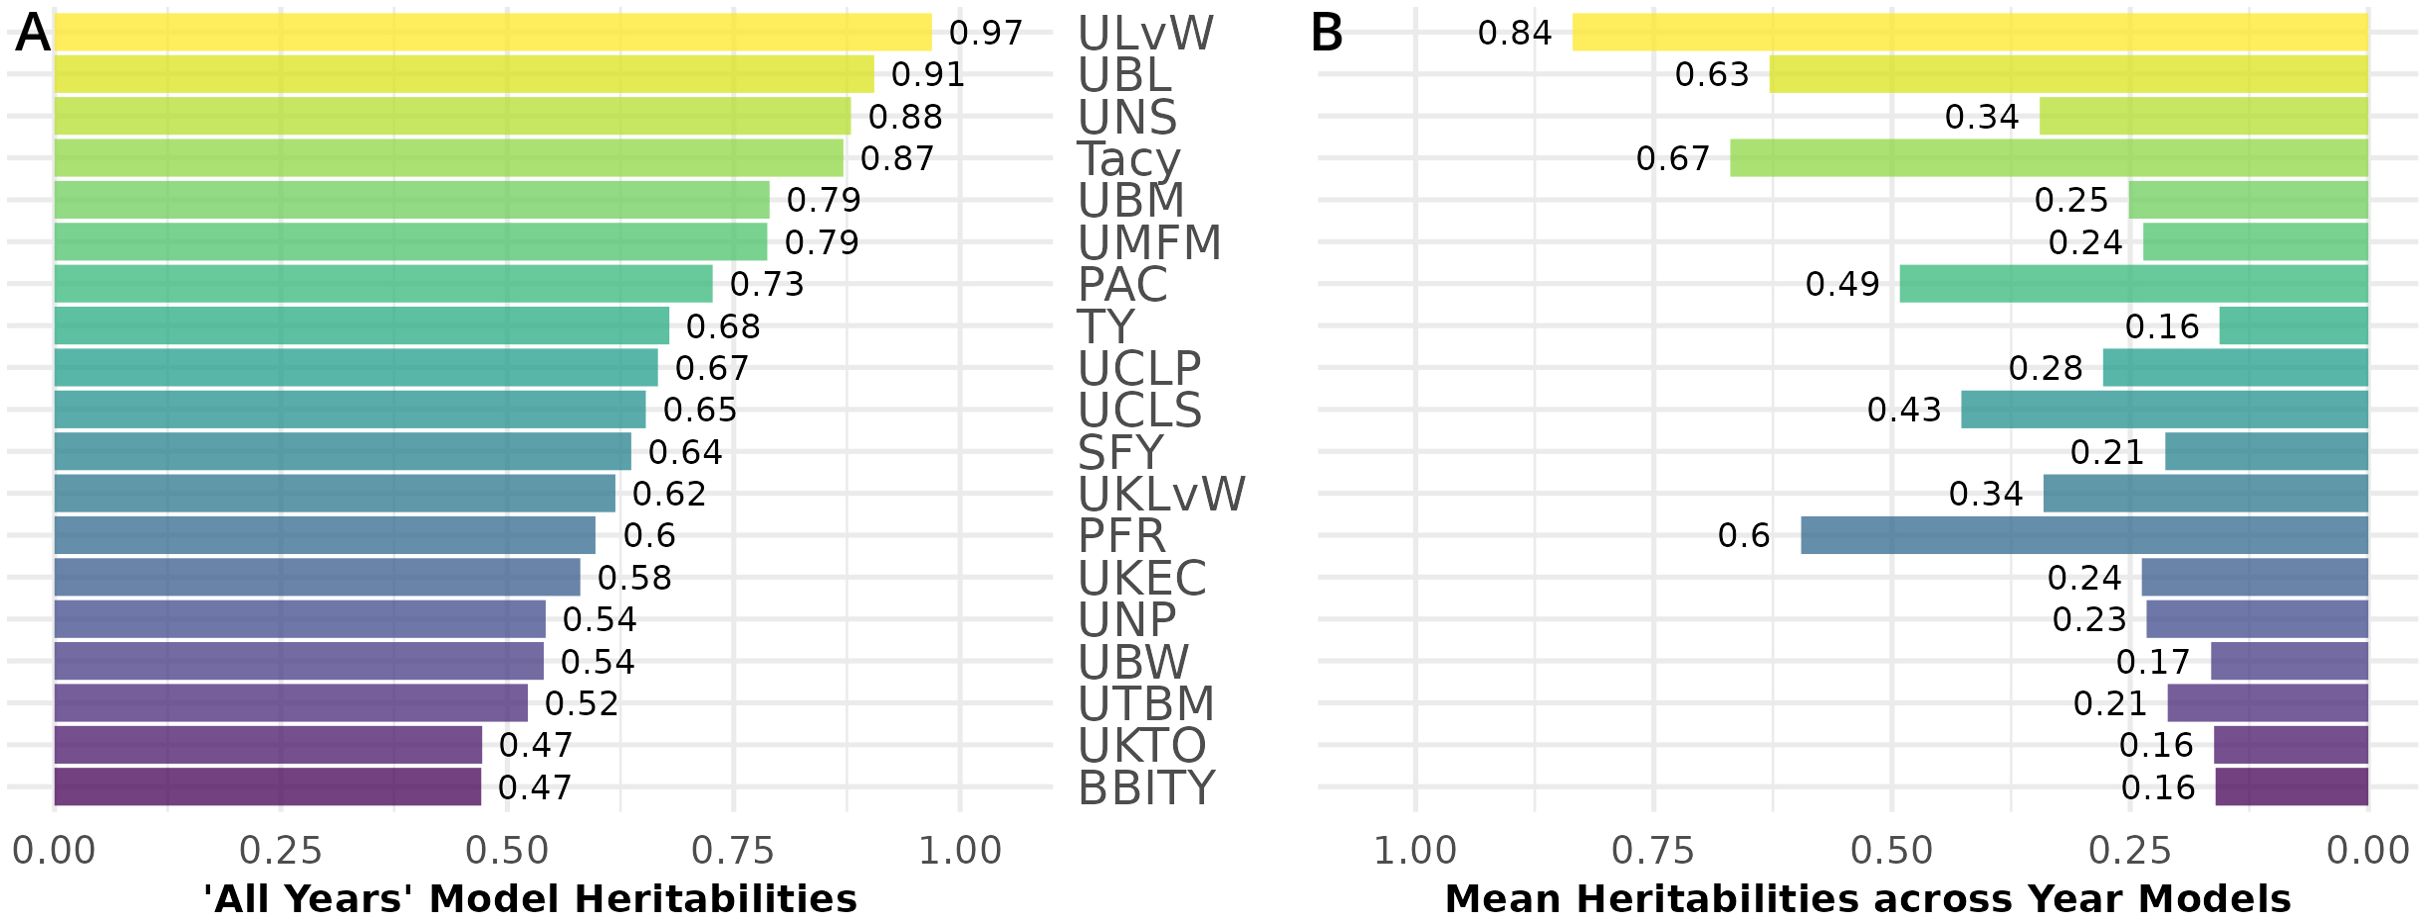
Figure 7. Mean heritability between cranberry populations CNJ02 and CNJ04 of all-year model (A) and across within-year models (B). Only the top 50% of traits based on mean within-year model heritability are displayed.
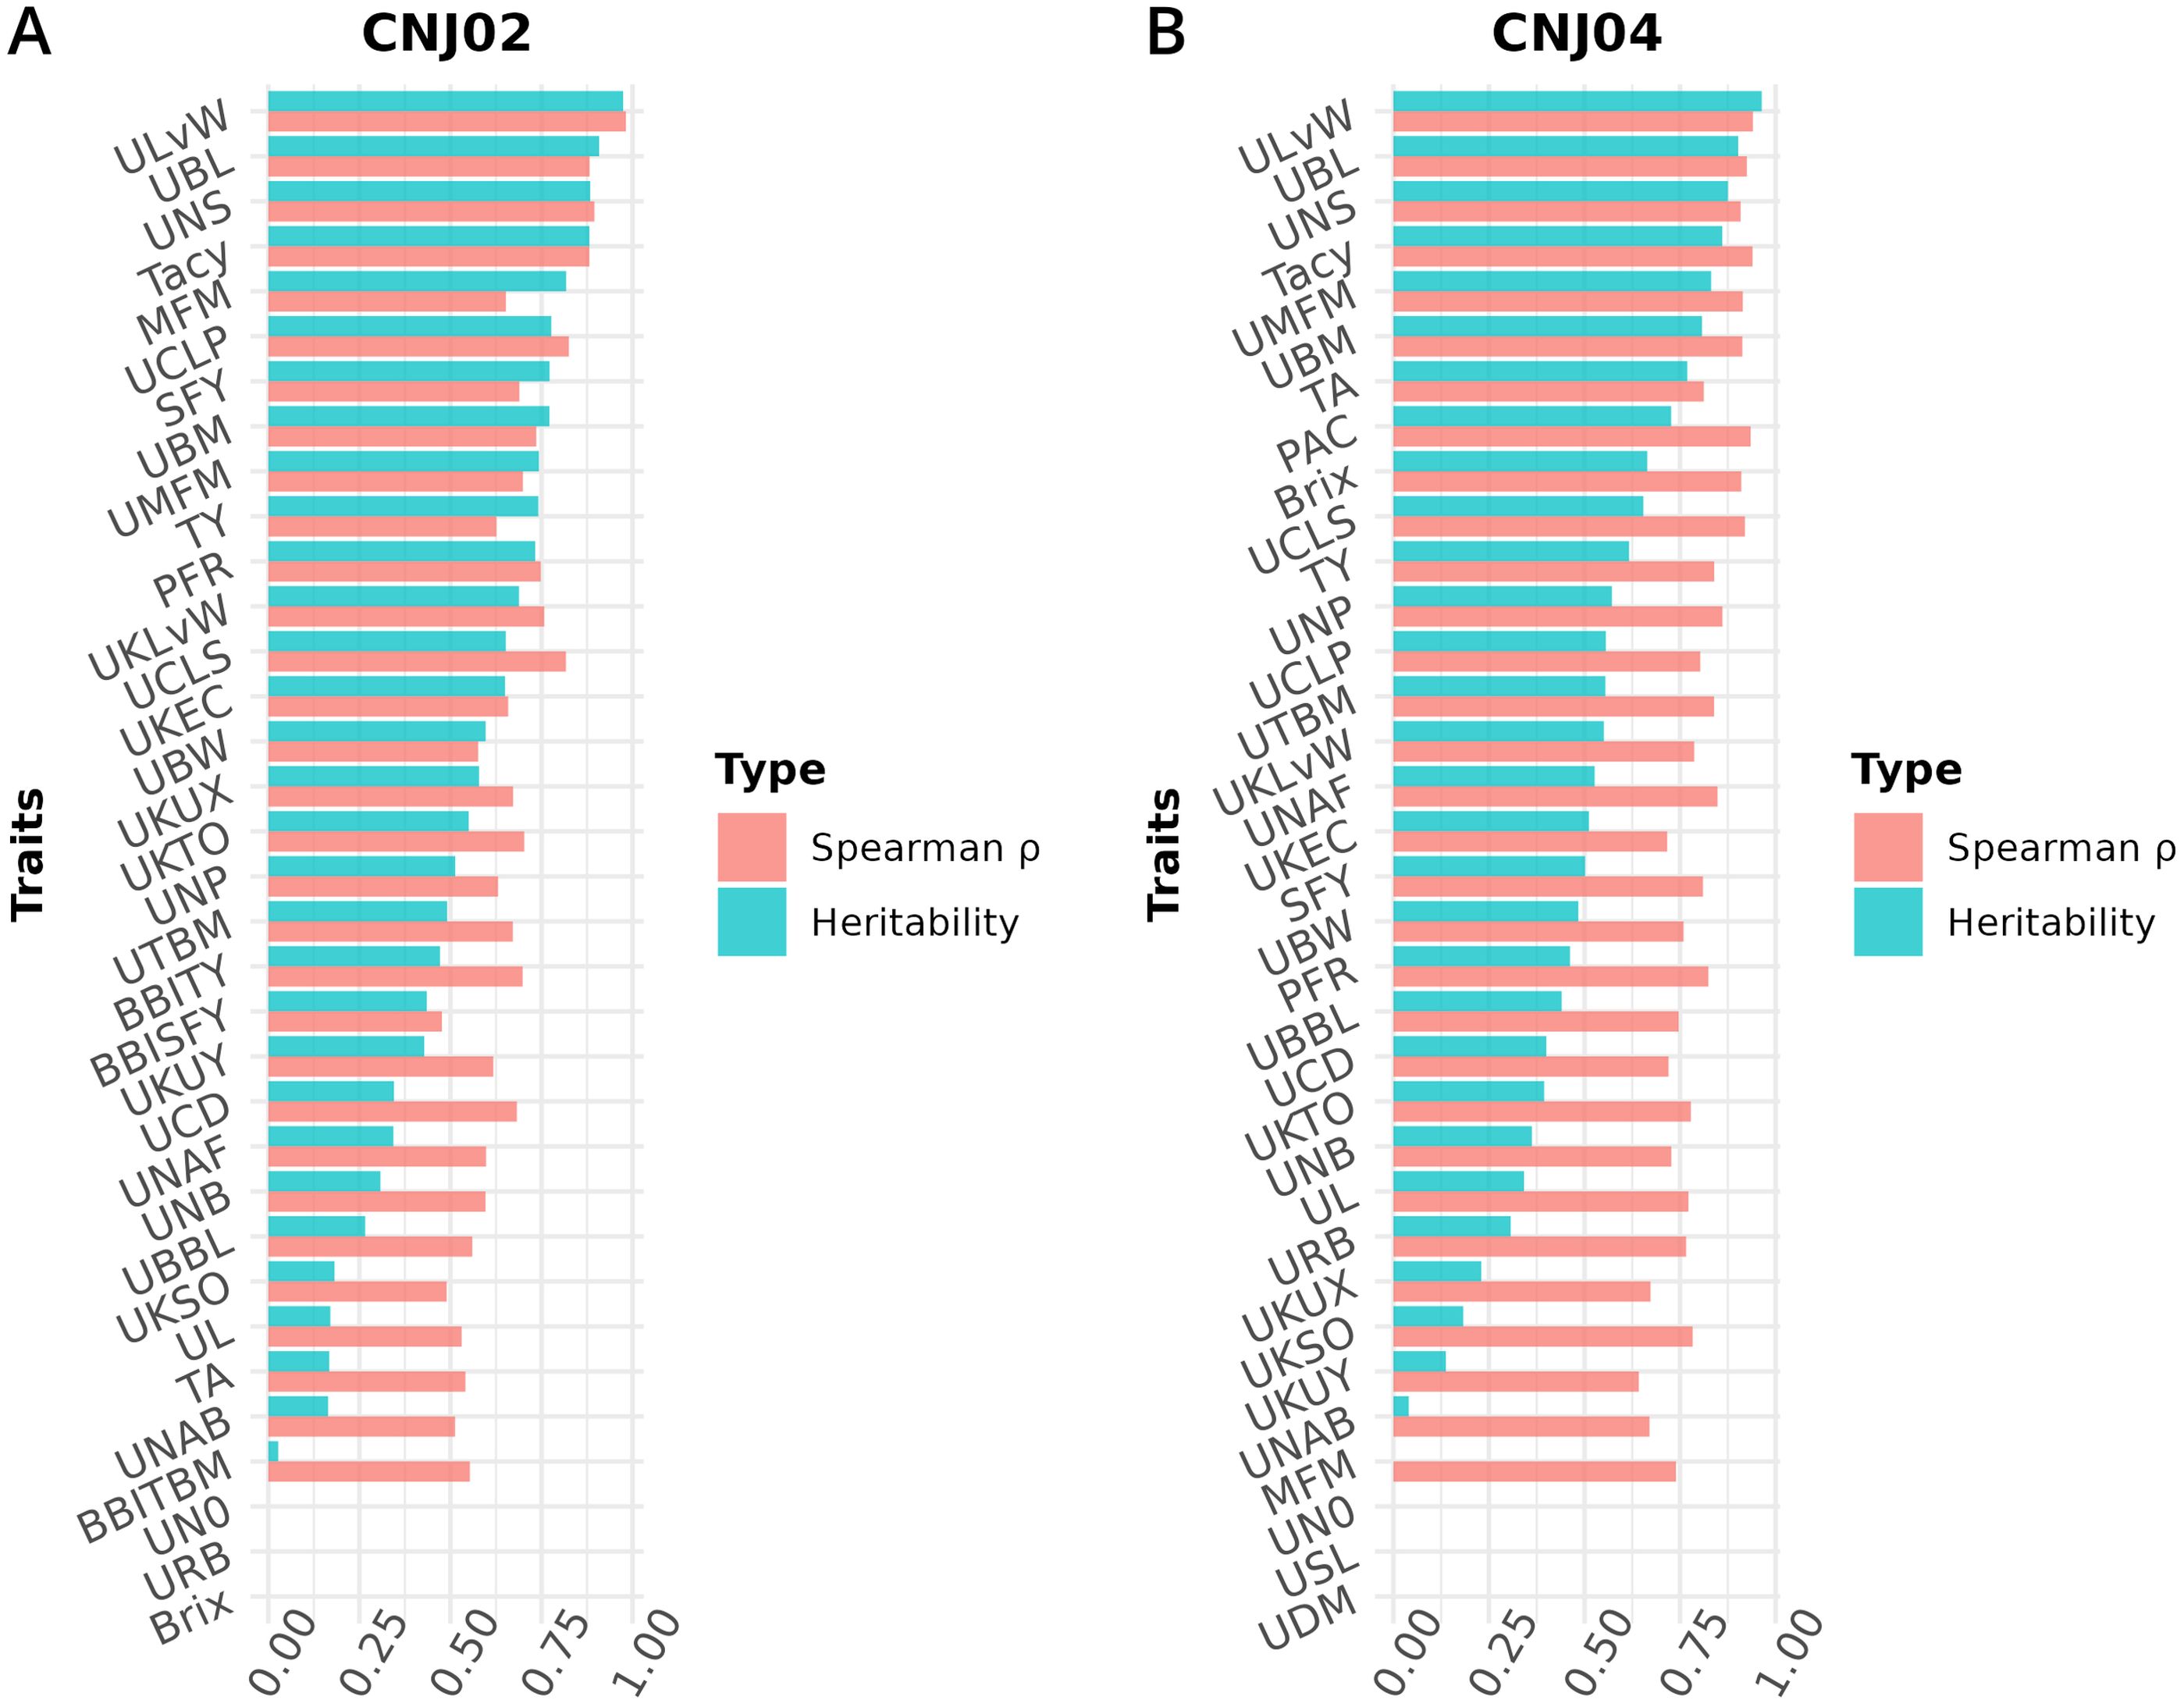
Figure 8. Heritabilities and Spearman’s rank correlation coefficients () for cranberry traits in populations (A) CNJ02 and (B) CNJ04. Correlation coefficients represent the associations between genotype BLUPs and their associated phenotypes for the all-year mixed model.
For set CNJ02 (Table 1A, Figure 5A), linkage group 2 has a composite QTL for {UBL, ULvW, UKLvW, UKEC} (position 72.6 cM); linkage group 3 has a year-stable meta-QTL for Tacy (position 55.8 cM); linkage group 10 has a compound QTL for {UBM, UTBM, UBW, MFM and UMFM} (position 29.4 cM); linkage group 11 has three meta-QTL at two positions for {MFM, UMFM, UTBM, MFM, BW} and {UBL, ULvW, UKEC, UKLvW} (position 29.4 cM) and {UBM, UTBM, UMFM, MFM, UBW} (position 38.4cM); and, last, linkage group 12 has a co-located QTL for {SFY, TY} (position 40.4 cM). Set CNJ04 (Table 1A, Figure 5B), linkage group 11 has a co-located QTL for {UBL, ULvW} (position 10.3 cM). For set CNJ0x (Table 1A, Figure 5C), linkage group 3 has a meta-QTL for Tacy (position 55.8 cM); linkage 11 has compound QTL for upright traits {UBL, ULvW, UKEC, UKLvW} (position 18.7 cM); and linkage 12 has a composite QTL for {SFY, TY} (position 40.4 cM).
Figure 6 shows meta-QTL found through comparison of this study’s QTL to QTL previously found in Diaz-Garcia et al. (2018a); Diaz-Garcia et al. (2018b), and Schlautman et al. (2015), collectively containing meta-QTL from populations CNJ02, CNJ04, and the additional linkage mapping population GRYG. Cross-study meta-QTL co-located with populations CNJ02 or CNJ04 include those associated with sets CNJ0x & Diaz-Garcia, 2018b (Table 1B; Figure 6A); CNJ0x & Diaz-Garcia, 2018a (Table 1B; Figure 6B); CNJ0x & Schlautman 2015 (Table 1B; Figure 6C), and CNJ0x & Schlautman, 2015 & Diaz-Garcia, 2018a (Table 1B; Figure 6D; Supplementary Table S2). The shared set CNJ0x & Diaz-Garcia, 2018b (Figure 6A) contains meta-QTL associated with chemistry traits, yield traits, and color traits derived from digital images of berries. Color traits are tightly associated with Tacy content (Diaz-Garcia, 2018b). Set CNJ0x & Diaz-Garcia, 2018b has two composite QTL on linkage group 3 that are stable across this study and the Diaz-Garcia et al. (2018b) QTL study for composite traits {BCOLOR, Tacy, BCOLORVAR} (34.0 cM) and {Tacy, BCOLOR, TACY_SEP, BCOLORVAR, TACY_OCT} (56.1 cM). Set CNJ0x & Diaz-Garcia, 2018a (Figure 6B) contains meta-QTL for traits affiliated with yield and berry quality, including digital traits measuring berry shape and size parameters (Diaz-Garcia et al., 2018a). For set CNJ0x & Diaz-Garcia, 2018a, linkage group 1 has a composite QTL for {BA, BL, UBW, BW} (102 cM); linkage group 2 has a meta-QTL for {upright berry length (UBL), BL, UMFM} (position 23.3 cM); linkage group 9 has a composite QTL for {UTBM, UBM, BW} (82.7 cM); linkage group 11 has three meta-QTL for {BA, BL, BW, UBL, UMFM}, {LvW, ULvW, UKEC}, and {LvW, ULvW, EC} clustered at positions 13.8, 21.1, and 77.8 cM, respectively; and linkage group 12 has two separate but close clusters of meta-QTL for {LvW, UKEC, EC} at positions 44.9 and 50.3cM, respectively. Set CNJ0x & Schlautman (Figure 6C), linkage group 6 has a compound QTL for {UTBM, MFM} (position ~77.0 cM); linkage group 10 has two meta-QTL for {UBM, MFM, UMFM} (positions 33.3 and 42.0 cM), linkage group 11 has four composite QTL for {UBL, MFM, UMFM)} (12.6 cM), {PACs, SFY, TY} (18.7 cM), multi-year {BBITY} (19.6 cM), and for {UBM, UTBM, MFM, UMFM, UBW} (38.4 cM). For set CNJ0x & Schlautman, 2015 & Diaz-Garcia, 2018a (Figure 6D), linkage group 1 has a compound QTL for {berry area (BA), BW, UBW, BL} (position 101.6 cM); linkage group 2 has a meta-QTL for {BL, UBL, UMFM} (position 23.2 cM); linkage groups 9 and 10 each have a single meta-QTL—linkage group 9 for {UBM, UTBM, BW} (position 82.7 cM) and linkage group 10 for {UBM, MFM, UMFM} (position 33.3 cM); linkage group 11 has the highest number and density of meta-QTL—a cluster of three composite QTL (13–21 cM), one meta-QTL (38.4 cM), and two co-located QTL (77.8 cM to 81.2 cM). The first cluster has meta-QTL at 13.1 cM and 16.0 cM for {UBL, MFM, UMFM, BW, BL} and {EC, ULvW} respectively, and meta-QTL at 18.7 cM and 21.1 cM for {PAC, SFY, TY} and {UKEC, LvW, ULvW}. Linkage group 11 also has compound QTL for {UBM, UTBM, MFM, UMFM, UBW} (38.4 cM), {EC, LvW, ULvW} (77.8 cM), and {BA, BL, MFM} (81.2 cM); and linkage group 12 has two meta-QTL for {LvW, EC, UKEC}—one at 45.0cM and one at 50.3 cM.
A recent acceleration of the quantity and quality of cranberry molecular resources has propelled advances in cranberry breeding (Vorsa and Zalapa, 2019; Diaz-Garcia et al., 2020). Advances in the genetic capital of this important fruit crop include development of high-density linkage maps, construction of mitochondrial, and nuclear genome assemblies, a plethora of QTL mapping studies in a variety of important traits (Vorsa and Zalapa, 2019), and a feasibility study in genomic prediction and genomic selection (Covarrubias-Pazaran et al., 2018).
Shifts and innovations in cranberry phenotyping methods have paralleled advances in genetic resource development. Up until 60 years ago, breeders would select cranberry breeding material based on traits measured from the fundamental unit of cranberry productivity: the “reproductive upright.” Since then, modernization of farming technology and management methods, improved understanding of cranberry physiology, emerging cranberry products and markets, expansion of high-yielding cultivars, and climate change have transformed how breeders prioritize and assess traits (Vorsa and Zalapa, 2019). The focus has thus shifted from assessing cranberry uprights to assessing plot-level measurements, increasingly combined with high-throughput digital imaging (Diaz-Garcia et al., 2018a, 2018b).
Despite a widespread acceptance and application of these modern trait collection methods in cranberry breeding, a translation gap exists in how upright traits relate to these newer phenotype scoring methods. With dense marker maps and parallel collection of both reproductive upright attributes and plot-level traits, the current study offers a unique opportunity to use both phenotypic paradigms for genetic mapping. This paper is the first to comprehensively report correlations, heritabilities, and QTL based on both traditional and modern phenotyping methods.
In the CNJ02 population, Tacy and PAC are negatively correlated with SFY but positively correlated with PFR. These correlations indicate that, as pigments and other flavonoids develop, cranberry fruit develop more decay, which is likely a consequence of biochemical patterns that coordinate with the timing of cranberry ripening, over-ripening, and subsequent rot (Supplementary Table S8) (Georgi et al., 2013; Daverdin et al., 2017). We also found that, in both studied populations, MFM—a plot yield trait—was strongly correlated with many of the per upright yield-related traits (e.g., UBL, UBM, and UBW). These correlations are the first reported link between a plot-level yield trait and per-upright yield traits in both CNJ02 (Figures 3A, B; Supplementary Table S8) and CNJ04 (Figures 3C, D; Supplementary Table S9). In the CNJ02 population, modest but significant positive correlations between plot trait TY and upright traits {UTBM, UBW, UBM, UMFM, UNPs, and UNBs} further links plot traits with upright traits. These plot yield × upright trait correlations (TY × {UNPs, UNB, UTBM}) were also observed in the CNJ04 population, though to a lesser degree (Figures 3C, D; Supplementary Table S9). These correlations not only establish important relationships between plot level and upright trait types but also may indicate the existence of co-located trait blocks within the genome (Diaz-Garcia et al., 2018a, 2018b). For both the CNJ02 and CNJ04 populations, we found that UKLvW, a trait derived from berry shape categorical data, had a moderate positive correlation with quantitative traits such ULvW. This result validates that berry chimeras composited from the berry shape scores track well with numerically precise, accurately measured traits such as ULvW, despite being a subjective trait prone to imprecision.
Estimating heritabilities offers breeders a chance to find confidence that their selections will be fruitful in subsequent generations. Although this study calculates heritabilities from mixed model estimates of environmental, additive genetic, and residual variances, the heritabilities derived offer breeding insights when selecting upon model derived BLUPs. Many of the calculated heritabilities in this study are comparable to the results of other studies. For example, the high mean heritability of the ULvW (ULvW ratio, ) parallels plot data findings found in GRYG, a population genetically distinct from CNJ02 and CNJ04 (Diaz-Garcia et al., 2018a). Consistently high heritability across these three populations suggests a strong genetic persistence of ULvW ratio. High heritabilities in both ULvW ratio and in related plot traits indicates that selecting rounder berries (low ULvW ratio) with either method is effective. Moderate heritability estimates of TY ( for CNJ02, for CNJ04) are lower relative to other berry size and weight parameters – these estimates are consistent with the highly polygenic nature of this trait in other crops. Schlautman et al. (2015) estimated CNJ02 heritabilities of and for mean fruit weight (MFM) and TY, respectively. Trait heritabilities for Tacy, Brix, and titratable acidity (TA) were consistent with the present study, while their lower heritability estimates for TY () are likely due to the use of small populations (Vorsa and Johnson-Cicalese, 2012). Furthermore, a study by Johnson-Cicalese et al. (2015) using midparent-progeny mean regression estimates of heritability for fruit rot resistance () found consistently higher heritability with fruit rot (%) (PFR) in the CNJ02 population of this study (). Lower heritability estimates found in CNJ04 () could be due to reduced statistical power from lower population size. Moderate heritability of traits like SFY and PFR demonstrate limited but possible potential for selecting rot-resistant varieties in regions where berry rot is a problem. The traits TA and Brix exhibited notable differences in heritability between CNJ02 and CNJ04. In CNJ04, the heritabilities of TA () and Brix () were rather high, while in CNJ02, these two traits exhibited low heritability (TA, and Brix, ). This likely has to do with differences in the standing genetic variation between the parents for each population. For CNJ02, the parents (cv. Mullica Queen® and cv. Crimson Queen®) are highly elite third-generation hybrids with little distinct genetic variation for Brix and TA, thus exhibiting low heritability in their progeny. In contrast, CNJ04 has one highly elite parent (cv. Mullica Queen®), while the other parent (cv. Stevens) is a first-generation hybrid. Since CNJ04’s two parents are genetically and phenotypically distinct and consequently have more standing genetic variation between the parents, these traits manifest higher heritability for Brix and TA.
The heritabilities presented here may have been affected by population sizes, reduced recombination history in F1 mapping populations, and higher degrees of freedom when working with heterozygous, four-way crosses, and there is lower statistical power to segregate genetic from phenotypic variances in mixed models in traits such as TY. However, the heritability estimates were overall consistent in rank relative to other traits measured in recent cranberry studies.
This analysis is one of the most comprehensive QTL mapping studies in cranberry, given the number of traits assessed, the number of factors modeled, and cross-study comparisons. Figure 5 highlights salient, multi-trait co-located QTL in population sets CNJ02, CNJ04, and CNJ0x (panels A, B, and C, respectively) of the current study. Multi-trait clusters among non-synonymous traits likely represent tight linkage or pleiotropy. Multiple linkage associations found on chromosomes 2, 3, 10, 11, and 12 together constitute traits important to both berry quality and yield. A lower fruit length versus width ratio and a higher MFM translates to larger, spherical berries—quality traits important in SDC production. Quality traits relevant to SDC production—ULvW, UKLvW, UKEC, and UMFM and MFM)—have stable and co-located QTL on linkage groups 2, 11, and 12. CNJ02 also displays a modest composite QTL {SFY, TY} on linkage group 12, where SFY is an important measure of rot. Two co-located meta-QTL on linkage group 11 ({UBM and UTBM), MFM, UMFM, UBW} and {UBL, ULvW, UKLvW, UKEC} are likely identical QTL or the result of pleiotropy (position 29.4 cM). CNJ04 only displays one robust meta-QTL on linkage group 11 for {UBL, ULvW} at position 10.32 cM. Despite a lack of a multi-year stable QTL for Tacy in CNJ04, the stable meta-QTL on linkage group 3@55.8 cM in CNJ02 is also shared with a CNJ04 QTL found in the all-year model. This shared cross-population Tacy QTL on linkage group 3 indicates the importance of this region to Tacy production, likely from the shared parent Crimson Queen® common to both CNJ02 and CNJ04. The meta-QTL {UBL, ULvW, UKEC, UKLvW} common to both CNJ02 and CNJ04 (Figure 5C) on linkage group 11@18.7 cM lacks the position stability relative to the same multi-trait meta-QTL found in population CNJ02 on linkage group 11@29.4 cM (Figure 5A). This position shift from 11@29.4 cM to 11@18.7 cM is consistent with the larger LOD 1.5 interval for the elemental trait QTL, but the relative cross-population stability still highlights the importance of this region to the composite {UBL, ULvW, UKEC, UKLvW}, with most of the region’s genetic variation likely driven by UBL. As with Tacy on linkage group 3, a meta-QTL for {SFY, TY} on linkage group 12@40.4cM is found both in CNJ02 (Figure 5A) alone and in the combined analysis of CNJ02 and CNJ04 (Figure 5C), indicating the cross-population stability of this QTL.
Figure 6A features prominent, multi-study, multi-year, and multi-trait QTL from the set CNJ0x & Diaz-Garcia et al., 2018b. Tacy and other color-relevant meta-QTL on linkage group 3@56.1cM in populations CNJ02 and CNJ04 is consistent with the results found in Figure 5C. This meta-QTL also demonstrates consistency across two separate studies, underpinning the importance of this genomic region to Tacy and color development in CNJ02 and CNJ04. Evidence of an additional meta-QTL on linkage group 3@34.0 cM in population GRYG and CNJ04 indicates an alternative genomic region responsible for regulating fruit color in a distinct population set. This is consistent with previously observed genomic regions that encompass QTL for many related fruit quality traits in cranberry for fruit quality traits
Comparing the QTL found in the current study against Diaz-Garcia et al. (2018a) offers a unique perspective to compare berry size parameter QTL found using newer digital imaging techniques against parameters assayed using the manually measured traits pertinent to this study (Figure 6B). The composite meta-QTL on linkage group 1@101.7cM establishes a correspondence of UBW (current study) with BW and berry length (BL) (digital traits; Diaz-Garcia et al., 2018a). UBL (current study) coincides with BL (digital trait; Diaz-Garcia et al., 2018a) at meta-QTL found in linkage groups 2@23.2 cM and 11@13.8 cM for populations CNJ04 and GRYG. Meta-QTL associated with round, spherical berries that also demonstrate coincidence between manual and digital traits are found on linkage groups 11 and 12. A meta-QTL in linkage group 11@21.1cM connects the current study traits UKEC and ULvW with the image-derived digital trait berry length:width ratio (LvW; Diaz-Garcia et al., 2018a). The composite QTL at 11@77.8cM links the digital traits LvW and berry shape eccentricity (EC; Diaz-Garcia et al., 2018a) to ULvW (current study) across populations GRYG and CNJ02. Two meta-QTL for composite trait {LvW, UKEC, EC} on linkage group 12, positions 45.0 cM and 50.3 cM, relate upright trait (UKEC) with digitally measured traits {LvW, EC} (Diaz-Garcia et al., 2018a) across populations GRYG and CNJ04. These QTL complexes on linkage groups 11 and 12 together highlight the interchangeability of two distinct phenotyping (upright vs. plot) methods across distinct populations.
QTL reported by Schlautman et al. (2015) are associated with plot yield traits and meta-QTL shown in Figure 6C demonstrate the coincidence of these QTL with QTL found in the current study. The meta-QTL on linkage group 6@77.0cM ties UTBM (current study) to MFM (Schlautman et al., 2015), consistent with the high correlation (p = 0.71) between these two traits (Supplementary Table S8). Linkage group 10 has two meta-QTL that demonstrate a correspondence of MFM (Schlautman et al., 2015) with {UBM, UMFM} (current study; position 33.3 cM) and {UTBM, UBL} (current study; position 42.0). Linkage group 11 contains several meta-QTL that associate the yield related plot traits biennial-bearing index - total yield (BBITY), TY, and MFM (Schlautman et al., 2015) with upright traits UBL, UMFM, UTBM, UBM, and UBW, further establishing the congruity between plot traits and upright traits.
A comprehensive comparison of cross-study meta-QTL is shown in Figure 4D. The meta-QTL displayed include compound, stable QTL found across up to three independent studies (current study; Schlautman et al., 2015; Diaz-Garcia et al., 2018a). QTL found in Figure 5D are duplicated in Figure 5B, apart from a three-study meta-QTL on linkage group 11@13.1 cM for the compound trait {UBL, MFM, UMFM, BW, berry length (BL)}, which differs inappreciably from the meta-QTL found for composite trait {berry area (BA), UBL, UMFM, BW, BL} on linkage group 11@13.8cM (Figure 4B). This meta-QTL for linkage group 11, position 13.1cM includes a MFM QTL discovered using a different dataset and different methodology by Schlautman et al. (2015). Consequently, this genomic region shows evidence of a multi-study, multi-trait, multi-year QTL for mean berry size. Other multi-study meta-QTL that include QTL from Schlautman et al. (2015) include upright traits {UBM, UMFM} and plot trait MFM on 10@33.3cM, additional evidence of an association of PAC with SFY and TY on 11@18.7cm, upright traits {UBM, UTBM, UMFM, UBW} (current study) with plot trait MFM (Schlautman et al., 2015) on 11@38.4cM, and digital traits {BA, BL} (Diaz-Garcia et al., 2018a) with plot trait MFM (Schlautman et al., 2015) on 11@81.2cM.
Traditionally, marker-trait associations derived from QTL or GWAS studies are validated using advanced molecular techniques such as genetic engineering approaches to compare knockout and knockdown mutant phenotypes. However, without efficient transformation methods, lack of protocols to re-differentiate callus tissue in culture, and an absence of research on genetically malleable genotypes, these traditional marker-trait validation methods are currently impossible to implement in cranberry. As such, the results of additional cranberry trait-mapping studies in new environments (locations and years), and their comparison to other studies’ discoveries, can serve as a viable method to fortify consistent findings and validate distinct phenotyping methods measuring analogous traits. We report here coherent results that have emerged across multiple studies to provide important targets for marker assisted selection (MAS).
This study set out to characterize and assess for the first time the genetic basis of numerous cranberry reproductive upright traits in conjunction with many plot-level and other modern phenotyping traits. The existence of strong correlations between reproductive upright traits (classical) for berry parameters and plot-level traits (modern) for yield demonstrate that more efficient, modern phenotyping methods can act as relevant proxies in QTL mapping studies. Roughly comparable heritabilities between analogous traits and consistent meta-QTL found in advanced phenotyping studies such as Diaz-Garcia et al. (2018b; 2018a), Figures 6–8, further demonstrate the near parity of older scoring techniques vis-à-vis modernized phenotyping methods.
As the time needed to measure and score classical upright traits is monumental, requiring hundreds of person hours, the use of combinations of relevant classical and modern phenotyping methods can serve to save time and increase throughput. Moreover, although some of the upright traits collected may provide a unique picture of the genetics and physiology of complex traits, they can still fail to capture certain dimensions of traits, such as TY. This is evident in how a modestly positive correlation between yield and berry size parameters loses most of its association when mapping the genetic basis of these traits. Altogether, classical upright traits when used along with plot-sampled and other modern traits (e.g., digital imaging processing) provide a more detailed picture of genotypic performance for traits important to growers, breeders, and the application of genetic studies such as QTL mapping.
All raw data can be found on the Genome Database for Vaccinium at https://www.vaccinium.org/bio_data/7547154. Software to generate BLUPs, QTL, and meta-QTL are available at https://github.com/bliptrip/CNJ0x-Trait-Mapping.
AM: Conceptualization, Writing – original draft, Writing – review & editing, Data curation, Formal analysis, Investigation, Methodology, Software, Validation, Visualization. JL: Formal analysis, Writing – review & editing. LD-G: Conceptualization, Formal analysis, Writing – review & editing. HL-M: Formal analysis, Writing – review & editing. JJ-C: Writing – review & editing, Conceptualization, Data curation, Resources. NV: Conceptualization, Resources, Writing – review & editing, Funding acquisition. MI: Conceptualization, Funding acquisition, Resources, Writing – review & editing. JN: Resources, Writing – review & editing. JZ: Resources, Writing – review & editing, Conceptualization, Funding acquisition, Project administration, Supervision, Writing – original draft.
The author(s) declare financial support was received for the research, authorship, and/or publication of this article. This project was supported by USDA-ARS (project no. 5090-21220-007-00-D provided to JZ); USDA AFRI NIFA (grant no. 2022-67012-37202 provided to JL); NIH (grant no. 5 T32 GM135066AM; UW-Madison Biotechnology Training Program; provided to AM); USDA NIFA (project no. 2019-51181-30015; VacciniumCAP); Ocean Spray Cranberries, Inc.; Wisconsin Cranberry Growers Association; and Cranberry Institute. All authors declare that the research was conducted in the absence of any commercial or financial relationships that could be construed as a potential conflict of interest. The funders had no role in the study design, data collection, and analysis, interpretation of the data, writing and preparation of this article, or decision to publish.
The authors thank Emily Gustin and Eric Wiesman for their invaluable help with data collection management. AM would also like to thank Allen Centennial Gardens for providing an oasis to recharge his mind. The authors also thank the reviewers who helped enhance the quality of this paper. JZ would like to express his gratitude through PS 136:1.
The authors declare that the research was conducted in the absence of any commercial or financial relationships that could be construed as a potential conflict of interest.
The author(s) declared that they were an editorial board member of Frontiers, at the time of submission. This had no impact on the peer review process and the final decision.
All claims expressed in this article are solely those of the authors and do not necessarily represent those of their affiliated organizations, or those of the publisher, the editors and the reviewers. Any product that may be evaluated in this article, or claim that may be made by its manufacturer, is not guaranteed or endorsed by the publisher.
The Supplementary Material for this article can be found online at: https://www.frontiersin.org/articles/10.3389/fpls.2024.1294570/full#supplementary-material
Alston, J. M., Medellín-Azuara, J., Saitone, T. L. (2014). Economic impact of the North American cranberry industry (Cranberry Marketing Committee). Available at: https://www.bccranberries.com/pdfs/Economic_Impact_of_the_NA_Cranberry_Industry_August2014.pdf.
Akaike, H. (1974). A new look at the statistical model identification. IEEE Trans. Automatic Control 19, 716–723. doi: 10.1109/TAC.1974.1100705
Bradbury, P. J., Zhang, Z., Kroon, D. E., Casstevens, T. M., Ramdoss, Y., Buckler, E. S. (2007). TASSEL: software for association mapping of complex traits in diverse samples. Bioinformatics 23, 2633–2635. doi: 10.1093/bioinformatics/btm308
Bolivar-Medina, J. L., Zalapa, J. E., Atucha, A., Patterson, S. E. (2019). Relationship between alternate bearing and apical bud development in cranberry (Vaccinium macrocarpon). Botany 97, 101–111. doi: 10.1139/cjb-2018-0058
Bribiesca, E. (2013). A measure of tortuosity based on chain coding. Pattern Recognition 46, 716–724. doi: 10.1016/j.patcog.2012.09.017
Broman, K. W., Sen, S., New York, N. Y. (2009). A guide to QTL mapping with R/qtl (New York, NY: Springer New York). doi: 10.1007/978-0-387-92125-9
Broman, K. W., Wu, H., Sen, S., Churchill, G. A. (2003). R/qtl: QTL mapping in experimental crosses. Bioinformatics 19, 889–890. doi: 10.1093/bioinformatics/btg112
Chandler, F., Wilcox, R., Bain, H. (1947). Cranberry breeding investigation of the US Dept. of Agriculture. Cranberries. 12, 6–9.
Covarrubias-Pazaran, G. (2016). Genome-assisted prediction of quantitative traits using the R package sommer. PloS One. 11, 1–15. doi: 10.1371/journal.pone.0156744
Covarrubias-Pazaran, G., Diaz-Garcia, L., Schlautman, B., Deutsch, J., Salazar, W., Hernandez-Ochoa, M., et al. (2016). Exploiting genotyping by sequencing to characterize the genomic structure of the American cranberry through high-density linkage mapping. BMC Genomics 17, 451. doi: 10.1186/s12864-016-2802-3
Covarrubias-Pazaran, G., Schlautman, B., Diaz-Garcia, L., Grygleski, E., Polashock, J., Johnson-Cicalese, J., et al. (2018). Multivariate GBLUP improves accuracy of genomic selection for yield and fruit weight in biparental populations of vaccinium macrocarpon ait. Front. Plant Sci. 9. doi: 10.3389/fpls.2018.01310
Daverdin, G., Johnson-Cicalese, J., Zalapa, J., Vorsa, N., Polashock, J. (2017). Identification and mapping of fruit rot resistance QTL in American cranberry using GBS. Mol. Breed. 37, 38. doi: 10.1007/s11032-017-0639-3
De Los Campos, G., Sorensen, D., Gianola, D. (2015). Genomic heritability: what is it? PloS Genet. 11, 1–21. doi: 10.1371/journal.pgen.1005048
Diaz-Garcia, L., Covarrubias-Pazaran, G., Johnson-Cicalese, J., Vorsa, N., Zalapa, J. (2020). Genotyping-by-sequencing identifies historical breeding stages of the recently domesticated american cranberry. Front. Plant Sci. 11. doi: 10.3389/fpls.2020.607770
Diaz-Garcia, L., Covarrubias-Pazaran, G., Schlautman, B., Grygleski, E., Zalapa, J. (2018a). Image-based phenotyping for identification of QTL determining fruit shape and size in American cranberry (Vaccinium macrocarpon L.). PeerJ 6, e5461. doi: 10.7717/peerj.5461
Diaz-Garcia, L., Covarrubias-Pazaran, G., Schlautman, B., Zalapa, J. (2016). GiNA, an efficient and high-throughput software for horticultural phenotyping. PloS One 11, e0160439. doi: 10.1371/journal.pone.0160439
Diaz-Garcia, L., Garcia-Ortega, L. F., González-Rodríguez, M., Delaye, L., Iorizzo, M., Zalapa, J. (2021). Chromosome-Level Genome Assembly of the American Cranberry (Vaccinium macrocarpon Ait.) and Its Wild Relative Vaccinium microcarpum. Front. Plant Sci. 12. doi: 10.3389/fpls.2021.633310
Diaz-Garcia, L., Rodriguez-Bonilla, L., Smith, T., Zalapa, J. (2019). Pacbio sequencing reveals identical organelle genomes between american cranberry (Vaccinium macrocarpon ait.) and a wild relative. Genes 10, 1–15. doi: 10.3390/genes10040291
Diaz-Garcia, L., Schlautman, B., Covarrubias-Pazaran, G., Maule, A., Johnson-Cicalese, J., Grygleski, E., et al. (2018b). Massive phenotyping of multiple cranberry populations reveals novel QTLs for fruit anthocyanin content and other important chemical traits. Mol. Genet. Genomics 293, 1379–1392. doi: 10.1007/s00438-018-1464-z
Elshire, R. J., Glaubitz, J. C., Sun, Q., Poland, J. A., Kawamoto, K., Buckler, E. S., et al. (2011). A robust, simple genotyping-by-sequencing (GBS) approach for high diversity species. PloS One 6, e19379. doi: 10.1371/journal.pone.0019379
Endelman, J. B. (2011). Ridge regression and other kernels for genomic selection with R package rrBLUP. Plant Genome 4, 250–255. doi: 10.3835/plantgenome2011.08.0024
Fajardo, D., Schlautman, B., Steffan, S., Polashock, J., Vorsa, N., Zalapa, J. (2014). The American cranberry mitochondrial genome reveals the presence of selenocysteine (tRNA-Sec and SECIS) insertion machinery in land plants. Gene 536, 336–343. doi: 10.1016/j.gene.2013.11.104
Fajardo, D., Senalik, D., Ames, M., Zhu, H., Steffan, S. A., Harbut, R., et al. (2013). Complete plastid genome sequence of Vaccinium macrocarpon: structure, gene content, and rearrangements revealed by next generation sequencing. Tree Genet. {&} Genomes 9, 489–498. doi: 10.1007/s11295-012-0573-9
Food and Agriculture Organization of the United Nations (2022). FAOSTAT statistical database (Rome: FAO). Available at: https://www.fao.org/faostat/en/#home. 1997. 08 Jan. 2024.
Fox, J., Weisberg, S. (2019). An R companion to applied regression. 3rd ed. (Thousand Oaks CA: Sage). Available at: https://socialsciences.mcmaster.ca/jfox/Books/Companion/.
Franklin, H. J., Kelley, J., Jr., T.W., E. (1958). Cranberry varieties of north america, bulletin 513. Experiment station, college of agriculture (University of Massachusetts).
Georgi, L., Johnson-Cicalese, J., Honig, J., Das, S. P., Rajah, V. D., Bhattacharya, D., et al. (2013). The first genetic map of the American cranberry: exploration of synteny conservation and quantitative trait loci. Theor. Appl. Genet. 126, 673–692. doi: 10.1007/s00122-012-2010-8
Hagberg, A., Swart, P. J., Schult, D. A. (2008). “Exploring network structure, dynamics, and function using NetworkX,” in Proceedings of the 7th python in science conference (SciPy 2008). (Los Alamos, NM, United States: Los Alamos National Laboratory). Available at: https://www.osti.gov/biblio/960616.
Haley, C. S., Knott, S. A. (1992). A simple regression method for mapping quantitative trait loci in line crosses using flanking markers. Heredity 69, 315–324. doi: 10.1038/hdy.1992.131
Henderson, C. R. (1975). Best linear unbiased estimation and prediction under a selection model. Biometrics 31, 423–447. doi: 10.2307/2529430
Johnson-Cicalese, J., Polashock, J. J., Honig, J. A., Vaiciunas, J., Ward, D. L. (2015). Heritability of fruit rot resistance in american cranberry. J. Am. Hortic. Soc. 140, 233–242. doi: 10.21273/JASHS.140.3.233
Kassambara, A. (2019). R package “ggcorrplot”: Visualization of a correlation matrix using “ggplot2.”
Kawash, J., Colt, K., Hartwick, N. T., Abramson, B. W., Vorsa, N., Polashock, J. J., et al. (2022). Contrasting a reference cranberry genome to a crop wild relative provides insights into adaptation, domestication, and breeding. PloS One 17, e0264966. doi: 10.1371/journal.pone.0264966
National Agricultural Statistics Service (2022). (Washington, D.C: National Agricultural Statistics Service, U.S. Dept. of Agriculture). Available online at: https://www.nass.usda.gov/. (Accessed August 30, 2023)
Neyhart, J. L., Kantar, M. B., Zalapa, J., Vorsa, N. (2022). Genomic-environmental associations in wild cranberry ( Vaccinium macrocarpon Ait.). G3 Genes|Genomes|Genetics 12, jkac203. doi: 10.1093/g3journal/jkac203
Polashock, J., Zelzion, E., Fajardo, D., Zalapa, J., Georgi, L., Bhattacharya, D. (2014). The American cranberry : first insights into the whole genome of a species adapted to bog habitat The American cranberry : first insights into the whole genome of a species adapted to bog habitat. BMC Plant Biol. 14.
Ouellette, L. A., Reid, R. W., Blanchard, S. G., Brouwer, C. R. (2018). LinkageMapView—rendering high-resolution linkage and QTL maps. Bioinformatics 34, 306–307. doi: 10.1093/bioinformatics/btx576
R Core Team (2024). R: a language and environment for statistical computing (Vienna, Austria: R Foundation for Statistical Computing). Available at: https://www.R-project.org/.
Rossum, G. van (2007). Python programming language., in USENIX annual technical conference. (Santa Clara, CA (United States), 1–36. Available at: https://api.semanticscholar.org/CorpusID:45594778.
Schlautman, B., Bolivar-Medina, J., Hodapp, S., Zalapa, J. (2017a). Cranberry SSR multiplexing panels for DNA horticultural fingerprinting and genetic studies. Scientia Hortic. 219, 280–286. doi: 10.1016/j.scienta.2017.03.005
Schlautman, B., Covarrubias-Pazaran, G., Diaz-Garcia, L., Iorizzo, M., Polashock, J., Grygleski, E., et al. (2017b). . Construction of a high-density american cranberry (Vaccinium macrocarpon ait.) composite map using genotyping-by-sequencing for multi-pedigree linkage mapping. G3 Genes|Genomes|Genetics 7, 1177–1189. doi: 10.1534/g3.116.037556
Schlautman, B., Covarrubias-Pazaran, G., Diaz-Garcia, L. A., Johnson-Cicalese, J., Iorrizo, M., Rodriguez-Bonilla, L., et al. (2015). Development of a high-density cranberry SSR linkage map for comparative genetic analysis and trait detection. Mol. Breed. 35, 177. doi: 10.1007/s11032-015-0367-5
Sun, H., Liu, Y., Gai, Y., Geng, J., Chen, L., Liu, H., et al. (2015). De novo sequencing and analysis of the cranberry fruit transcriptome to identify putative genes involved in flavonoid biosynthesis, transport and regulation. BMC Genomics 16, 652. doi: 10.1186/s12864-015-1842-4
Vander Kloet, S. P. (1988). The genus vaccinium in north america (Ottawa: Research Branch, Agriculture Canada).
Vander Kloet, S. P., Avery, T. S. (2010). Vaccinium on the edge. Edinburgh J. Bot. 67, 7. doi: 10.1007/978-1-4419-0763-9_6
Vorsa, N., Johnson-Cicalese, J. (2012). American cranberry. Fruit Breed. Handb. Plant Breed. 8, 191–223. doi: 10.1007/978-1-4419-0763-9
Vorsa, N., Zalapa, J. (2019). “Domestication, genetics, and genomics of the american cranberry,” in Plant Breeding Reviews, (John Wiley & Sons, Ltd), 279–315. doi: 10.1002/9781119616801.ch8
Wei, T., Simko, V. (2021). R package “corrplot”: visualization of a correlation matrix. Available at: https://github.com/taiyun/corrplot
Keywords: American cranberry, QTL, meta-QTL, BLUP, phenotyping, perennial crops, fruit breeding
Citation: Maule AF, Loarca J, Diaz-Garcia L, Lopez-Moreno H, Johnson-Cicalese J, Vorsa N, Iorizzo M, Neyhart JL and Zalapa JE (2024) Of buds and bits: a meta-QTL study identifies stable QTL for berry quality and yield traits in cranberry mapping populations (Vaccinium macrocarpon Ait.). Front. Plant Sci. 15:1294570. doi: 10.3389/fpls.2024.1294570
Received: 14 September 2023; Accepted: 31 July 2024;
Published: 17 September 2024.
Edited by:
Patrick Vincourt, Institut National de recherche pour l’agriculture, l’alimentation et l’environnement (INRAE), FranceReviewed by:
Kerstin Neumann, Leibniz Institute of Plant Genetics and Crop Plant Research (IPK), GermanyCopyright © 2024 Maule, Loarca, Diaz-Garcia, Lopez-Moreno, Johnson-Cicalese, Vorsa, Iorizzo, Neyhart and Zalapa. This is an open-access article distributed under the terms of the Creative Commons Attribution License (CC BY). The use, distribution or reproduction in other forums is permitted, provided the original author(s) and the copyright owner(s) are credited and that the original publication in this journal is cited, in accordance with accepted academic practice. No use, distribution or reproduction is permitted which does not comply with these terms.
*Correspondence: Juan E. Zalapa, amV6YWxhcGFAd2lzYy5lZHU=; anVhbi56YWxhcGFAdXNkYS5nb3Y=; Andrew F. Maule, bWF1bGUyQHdpc2MuZWR1
Disclaimer: All claims expressed in this article are solely those of the authors and do not necessarily represent those of their affiliated organizations, or those of the publisher, the editors and the reviewers. Any product that may be evaluated in this article or claim that may be made by its manufacturer is not guaranteed or endorsed by the publisher.
Research integrity at Frontiers
Learn more about the work of our research integrity team to safeguard the quality of each article we publish.