 Xiaoqin Wang1
 Song Yu
 Yifei Zhang
95% of researchers rate our articles as excellent or good
Learn more about the work of our research integrity team to safeguard the quality of each article we publish.
Find out more
ORIGINAL RESEARCH article
Front. Plant Sci. , 21 February 2024
Sec. Plant Abiotic Stress
Volume 15 - 2024 | https://doi.org/10.3389/fpls.2024.1283845
Background: Aldehyde dehydrogenase (ALDH) scavenges toxic aldehyde molecules by catalyzing the oxidation of aldehydes to carboxylic acids. Although ALDH gene family members in various plants have been extensively studied and were found to regulate plant response to abiotic stress, reports on ALDH genes in the common bean (Phaseolus vulgaris L.) are limited. In this study, we aimed to investigate the effects of neutral (NS) and basic alkaline (AS) stresses on growth, physiological and biochemical indices, and ALDH activity, ALDH gene expression of common bean. In addition, We used bioinformatics techniques to analyze the physical and chemical properties, phylogenetic relationships, gene replication, collinearity, cis-acting elements, gene structure, motifs, and protein structural characteristics of PvALDH family members.
Results: We found that both NS and AS stresses weakened the photosynthetic performance of the leaves, induced oxidative stress, inhibited common bean growth, and enhanced the antioxidative system to scavenge reactive oxygen species. Furthermore, we our findings revealed that ALDH in the common bean actively responds to NS or AS stress by inducing the expression of PvALDH genes. In addition, using the established classification criteria and phylogenetic analysis, 27 PvALDHs were identified in the common bean genome, belonging to 10 ALDH families. The primary expansion mode of PvALDH genes was segmental duplication. Cis-acting elemental analysis showed that PvALDHs were associated with abiotic stress and phytohormonal responses. Gene expression analysis revealed that the PvALDH gene expression was tissue-specific. For instance, PvALDH3F1 and PvALDH3H1 were highly expressed in flower buds and flowers, respectively, whereas PvALDH3H2 and PvALDH2B4 were highly expressed in green mature pods and young pods, respectively. PvALDH22A1 and PvALDH11A2 were highly expressed in leaves and young trifoliates, respectively; PvALDH18B2 and PvALDH18B3 were highly expressed in stems and nodules, respectively; and PvALDH2C2 and PvALDH2C3 were highly expressed in the roots. PvALDHs expression in the roots responded positively to NS–AS stress, and PvALDH2C3, PvALDH5F1, and PvALDH10A1 were significantly (P < 0.05) upregulated in the roots.
Conclusion: These results indicate that AS stress causes higher levels of oxidative damage than NS stress, resulting in weaker photosynthetic performance and more significant inhibition of common bean growth. The influence of PvALDHs potentially modulates abiotic stress response, particularly in the context of saline–alkali stress. These findings establish a basis for future research into the potential roles of ALDHs in the common bean.
Common bean (Phaseolus vulgaris L) is an annual herbaceous plant belonging to the family Leguminosae and subfamily Papilionoideae. As an essential leguminous plant, the common bean is rich in nutrients, such as proteins, fiber, carbohydrates, minerals, and vitamins (Duc et al., 2015; Torche et al., 2018). In addition, the common bean contains high levels of polyphenol compounds, which are crucial to human health by preventing cardiovascular disease, hyperglycemia, obesity, and colon cancer (Chung et al., 2008; Hayat et al., 2014). Recently, the gradual improvements in living standards and the ongoing refinement of consumption patterns have resulted in annual growth in the global demand for common beans. However, various abiotic and biological stresses often affect the yield and quality of common beans (Beebe et al., 2013; Yu et al., 2019).
Aldehyde molecules are common intermediates produced by catabolic and biosynthetic pathways during biological growth and development, and they can be formed through various metabolic processes, such as amino acid, carbohydrate, lipid, bioamine, vitamin, and steroid metabolism (Vasiliou et al., 2000). During their life cycle, plants frequently encounter a range of abiotic and biological challenges, including drought, salinity, cold temperatures, and diseases (Suzuki et al., 2014). In response to these stress hazards, plants produce numerous reactive oxygen species (ROS) and toxic compounds, accumulating intracellular aldehydes. Although aldehydes are indispensable substances in organisms, excessive aldehyde accumulation interferes with the metabolic balance and induces toxic conditions (Kirch et al., 2005; Stiti et al., 2011). Therefore, the balance of intracellular aldehyde content must be controlled to facilitate the optimal growth and development of living organisms. Aldehyde dehydrogenase (ALDH, EC: 1.2.1.3) consists of various NAD(P)-dependent enzymes that can irreversibly oxidize various aromatic and aliphatic aldehydes into their respective carboxylic acids, effectively clearing excess aldehydes in the body and maintaining stable intracellular metabolism (Yoshiba et al., 1997; Yoshida et al., 1998). Moreover, ALDHs are essential for maintaining redox homeostasis of plant cells by changing the content of NAD(P)H and the total amount of glutathione (Missihoun et al., 2018). Furthermore, earlier research has established that ALDH plays an important role in a multitude of physiological processes, such as amino acid metabolism, gluconeogenesis, glycolysis, and carnitine biosynthesis (Marchitti et al., 2008; Tylichová et al., 2010; Yang et al., 2011).
ALDHs are ubiquitous, occurring in both eukaryotic and prokaryotic organisms, and they exhibit robust representation across nearly all plant species (Brocker et al., 2013). To date, 24 ALDH families (ALDH1–ALDH24) have been identified in accordance with the ALDH Gene Nomenclature Committee’s criteria (Islam et al., 2022). Fourteen different ALDH families have been found in plants (ALDH-2, 3, 5, 6, 7, 10, 11, 12, 18, 19, 21, 22, 23, and 24), among which seven families are unique to plants (ALDH-11, 12, 19, 21, 22, 23, and 24) (Zhang et al., 2012). Currently, the presence of ALDH19 has exclusively been detected in Solanum lycopersicum. In this species, it encodes γ-glutamyl phosphate reductase, a crucial enzyme involved in the synthesis of proline from glutamate (García-Ríos et al., 1997).
Continuous research development has led to the discovery of an increasing number of ALDHs and their potential roles in plants. For example, ALDH3I1 and ALDH7B4 in Arabidopsis thaliana can enhance salt and drought tolerance by reducing the accumulation of H2O2 and malondialdehyde (MDA) caused by lipid peroxidation in cells (Kotchoni et al., 2006). Overexpression of BrALDH7B2 in tobacco can improve plant salt tolerance by enhancing photosynthetic performance in leaves, reducing the production of ROS, and inhibiting cell death in roots (Gautam et al., 2020). ALDH2C4 inhibition in Nicotiana benthamiana led to increased sensitivity to low-temperature stress and significant increases in MDA and ROS (Guo J. et al., 2020). Following the overexpression of the VvALDH2B4 of Chinese wild grapevine (Vitis pseudoreticulata) in Arabidopsis, the MDA levels of the transgenic lines decreased, and their resistance to salt stress and pathogenic bacteria increased (Wen et al., 2012).
The Songnen Plain in Northeast China is an important production area for common beans because of its flat terrain and fertile soil. However, owing to global climate change, secondary salinization has been increasing in this region yearly, hindering the productivity and quality of common beans (Talaat, 2014; Yu et al., 2019). Therefore, studying the adaptation mechanism of common beans to abiotic stress, especially saline–alkali stress, would improve the tolerance of common beans to field environmental stress. Moreover, it would promote the yield and quality of common beans and facilitate the efficient development of common beans in this area. Although the ALDH gene family members in numerous plants have been widely studied and their potential contribution to plant response under abiotic stress has been confirmed, reports on the ALDH genes in the common bean are relatively scarce.
In the present study, we explored the response of common bean growth and physiological indicators to neutral (NS) and alkaline salt (AS) stresses. Moreover the whole genome of the ALDH family of common beans was identified. The analysis of the physicochemical properties, phylogenetic relationships, gene replication, collinearity, cis-acting elements (CAEs), gene structure, motif, protein structure, and expression patterns of members of the ALDH family in common beans highlights the potential of the ALDH gene family in the response of common beans to abiotic stress.
Using “Qingyun No. 1”, a high-yield and high-resistance common bean variety in Northeast China, as the tested material, the selected high-quality seeds were disinfected and planted in a pot (material: polyvinyl chloride, diameter: 12 cm, height:11 cm) filled with soil mixture (black soil:vermiculite = 1:1). Four holes were made evenly in each pot, and two seeds were planted in each hole, while only one young plant was left in each hole after emergence. The weighing method was used to replenish water daily to maintain the soil water capacity at 70%. When the first compound leaf was fully unfolded, the plants were treated with 250 mM NaCl solution (NS stress) or 250 mM Na2CO3 and NaHCO3 mixed in a 1:9 molar ratio solution (AS stress). Each basin was irrigated with 200 mL of the treatment solution, and the same volume of distilled water was used as the control treatment.
After 72 h of NS or AS stress treatment, the stomatal conductance (Gs), net photosynthetic rate (Pn), transpiration rate (Tr), and intercellular CO2 concentration (Ci) of the first completely unfolded triple leaves were examined using an LI-6400 portable photosynthetic device (Li Cor BioScience, Lincoln, NE, USA). Subsequently, a portion of the tested plants was used to assess physiological and biochemical indicators and related gene expression. Furthermore, the root and shoot samples of the remaining test plants were separated and dried in an electric blast drying oven (BGZ-306, Shanghai Boxun Medical Biological Instrument Co., LTD, Shanghai, China) at 105°C for 30 min, and further dried at 85°C until the weight remained constant to determine the dry weight. The SPECORD Plus 210 UV-Vis spectrophotometer (Analytik Jena, Germany) was employed to measure the levels of MDA, chlorophyll, H2O2, superoxide radical (O2•-), superoxide dismutase (SOD), peroxidase (POD), and catalase (CAT).The amount of chlorophyll was also determined using Sartory and Grobbelaar (1984) methodology.
SOD, POD, and CAT enzymes were extracted according to the method proposed by De Azevedo Neto et al. (2005). First, 0.5 g of leaf or root tissue samples was homogenized in cold extraction buffer containing 5 mL of 50 mM sodium phosphate buffer (pH 7.8 for SOD and POD; pH 7.0 for CAT), 0.1 mM Na2EDTA, and 1% (w/v) polyvinylpyrrolidone. Then, the homogenate was centrifuged at 12000 g for 20 min at 4°C, and the resulting supernatant was used as the extract for testing. SOD activity was determined according to the nitrogen blue tetrazolium method described by Giannopolitis and Ries (1977). POD activity was determined according to the guaiacol method described by Chance and Maehly (1955). CAT activity was determined according to the method described by Havir and McHale (1987).
The hydrogen peroxide (H2O2) content was determined using the trichloroacetic acid (TCA) method described by Velikova et al. (2000). Approximately 0.5 g leaf or root tissue was mixed with 5 mL 0.1% (w/v) TCA ice bath homogenate. Subsequently, the supernatant obtained by from 12 000 g centrifugation for 15 min was used to determine the content of H2O2.
The hydroxylamine oxidation method described by Elstner et al. (1975) was used to determine O2•- content. Approximately 1.0 g of leaf or root tissue was added to 3 mL of 65 mM potassium phosphate buffer (pH 7.8) ice bath homogenate. Then, the supernatant obtained after centrifugation at 10000 g for 3 min was used to determine O2•- content.
MDA content was determined using the thiobarbituric acid reaction according to the method described by Hodges et al. (1999). Leaf or root samples (0.5 g) was homogenized in 5 mL 0.1% (w/v) TCA solution. The supernatant obtained by centrifugation at 10000 g for 20 min was used for the determination of MDA content.
ALDH enzyme activity was determined in root samples after 0, 24, 48, and 72 h of neutral or AS treatment. An ALDH assay kit (G0828F, Grace Biotechnology Co., Ltd, Suzhou, China) was used in which acetaldehyde is oxidized by ALDH and produces NADH, which reacts with the probe to produce a colorimetric (450 nm) product proportional to the amount of ALDH activity. The amount of enzyme catalyzing the production of 1 nmol of NADH per minute for each sample was regarded as one enzyme activity unit. According to the process described by Cao et al. (2023), approximately 0.1 g of the plant tissue sample was ground in a pre-cooled motor containing 1 mL of extraction buffer, and then, the ice-cold homogenate was centrifuged at 12000 g for 4°C. The extraction supernatant was placed on ice for measurement. The spectrophotometer was preheated for 30 min, and the wavelength was set to 450 nm. The reaction mixture was set up according to the kit instructions and mixed thoroughly in a 1-mL glass cuvette. The initial absorbance at 450 nm was measured as A1 after 30 s, and the final measurement of absorbance after 30 min was A2. Each sample was required to be its own control. Using the formula △A= (A2-A1) determination - (A2-A1) control, we calculated the change in measurement of the samples from initial to final. The standard curve was calculated as y = 0.0364x-0.0069, R2 = 0.9977, where x represents the molar mass of NADH (nmol), and y represents △A. ALDH activity was calculated as (nmol/min/g fresh weight) = [(ΔA+0.0069)/0.0364]/(sample mass×volume of added samples/addition of extraction buffer)/reaction time.
Genomic information (PhaVulg1_0) on the common bean was obtained from NCBI (https://www.ncbi.nlm.nih.gov/), and the Hidden Markov Model (HMM) file PF00171 of the ALDH conserved sequence (Finn et al., 2014) was obtained from the Pfam database (http://pfam.xfam.org/). HMMER was used to search the common bean protein database using the PF00171 model (Finn et al., 2015). Next, the identified Arabidopsis thaliana (TAIR10.1) ALDH protein sequence was used as a query sequence for a BLAST search (E-value < 1e-5). Next, the conserved domains of candidate proteins were validated using the SMART database(http://smart.embl-heidelberg.de/smart/batch), NCBI-Conserved Domain Database (http://smart.embl-heidelberg.de/smart/batch.pl), and Pfam database. In addition, the cysteine (PS00070) and glycine active sites (PS00687) of the ALDH family members were identified using Search InterPro (http://www.ebi.ac.uk/interpro/search/sequence/). Common bean ALDH family members were annotated taxonomically following the ALDH Gene Nomenclature Committee nomenclature standard (Wang et al., 2017). Accordingly, protein sequences with > 40% similarity to known ALDH sequences were classified as the same family. Those with > 60% similarity were classified as the same subfamily, and those with < 40% similarity were re-established as a novel ALDH family.
ExPASy (https://web.expasy.org/protparam/) was used to estimate protein physicochemical characteristics, including the theoretical amino acid number and isoelectric point, instability and lipid coefficients, molecular weight, and hydrophilicity. Plant-mPLoc (http://www.csbio.sjtu.edu.cn/bio-inf/plant-multi/) was used to estimate the subcellular localization of the PvALDH protein (Chou and Shen, 2010).
The chromosomal positions of the PvALDH genes were obtained from the NCBI database. A gene collinearity analysis was conducted with MCScanX (Wang et al., 2012), and the collinear relationships and chromosome distribution of the ALDH genes were visualized with Circos software (Krzywinski et al., 2009). According to the criteria of the MCScanX, a PvALDH gene located in an identified collinear region is considered to have been produced by whole genome or segmental duplications. Moreover, if two homologous ALDH genes are adjacent or separated by no more than one gene on the same chromosome, they are considered to have been generated by tandem duplication (Wang et al., 2012). The values of the synonymous rate (Ka) and non-synonymous rate (Ks) were measured using the Simple Ka/Ks Calculator program in the TBtools software (Chen et al., 2020). The ratio of Ka/Ks can reflect the selection pressure experienced during biological evolution. Ka/Ks ratios of =1, <1, and >1 denote neutral evolution, purifying selection, and positive selection, respectively (Hasan et al., 2021). Each duplicated gene pair of PvALDH was assigned a duplication time (T) as follows: T=Ks/(2×6.1×10−9)×10−6 Mya (Lynch and Conery, 2000).
Multiple sequence alignment and phylogenetic tree construction of PvALDH proteins were performed using MEGA X (Kumar et al., 2018). The gene structures of PvALDHs were determined using GSDS 2.0 (http://gsds.cbi.pku.edu.cn/). Using the MEME database (https://meme-suite.org/meme/index.html) conserved motif analyses were performed for the PvALDH family of proteins. The default parameters were utilized, while the maximum number of motifs was set to 10. The Search InterPro (http://www.ebi.ac.uk/interpro/search/sequence/) online software was used to identify the locations of ALDH-conserved domains and cysteine (PS00070) and glycine (PS00687) active sites. Mapping was performed with IBS 2.0 software (http://www.ebi.ac.uk/interpro/search/sequence/).
For the phylogenetic analysis of ALDH members, MEGA X was applied for multiple sequence alignments of the identified PvALDH and ALDH proteins in Sorghum bicolor, Oryza sativa, Arabidopsis thaliana, Zea mays, Brassica rapa, Glycine max, Vitis vinifera, Malus domestic, Solanum tuberosum, Solanum lycopersicum, Populus trichocarpa, Homo sapiens, Chlamydomonas reinhardtii, Physcomitrella patens, Selaginella moellendorffii, and Ostreococcus tauri (Thompson et al., 2002; Kumar et al., 2018). Phylogenetic trees were constructed using the neighbor-joining method. A bootstrap test with 1000 replicates was performed, and evolview (http://www.evolgenius.info/evolview/) was used to modify the phylogenetic tree (Guindon and Gascuel, 2003).
The 1500-bp sequence upstream of the starting codon for all the PvALDH genes was retrieved from NCBI, and stress- or hormone-responsive CAEs were predicted using PlantCARE (http://bioinformatics.psb.ugent.be/webtools/plantcare/html/). The results were visualized using TBtools.
Data on the expression levels of PvALDHs at different tissue sites and growth and developmental stages were acquired from Phytozome (https://phytozome-next.jgi.doe.gov/). A cluster analysis was performed, and a heatmap was constructed with TBtools.
Samples were taken from the root and leaf of each plant following treatment for 0, 24, 48, and 72 h. Ten individual plants were selected as one biological replicate for each treatment, and three biological replicates were employed for each treatment. After sampling, the plants were rapidly snap-frozen with liquid nitrogen and placed in a -80°C freezer until RNA isolation.
Total RNA from the root and leaf exposed to neutral or alkaline salts at 0, 24, 48, and 72 h was extracted using the TRIzol Reagent (Invitrogen, USA). First, RNA quality was detected using the Nanodrop OoneC (Thermo Fisher Scientific, Waltham, MA, USA) and visualized on a 1% gel, followed by cDNA synthesis using the ReverTra AceTM qPCR RT Master Mix with gDNA Removal kit (TOYOBO Co., Osaka, Japan). Primer-BLAST online software (http://www.ncbi.nlm.nih.gov/tools/primer-blast/) was utilized for primer design before PvALDHs amplification, and ACT11 (Zhang et al., 2022) served as a reference gene (Supplementary Table S1). Subsequently, quantitative real-time polymerase chain reaction (qRT-PCR) was performed on a CFX96 real-time fluorescence quantitative PCR detection system (Bio-Rad Laboratories Inc., USA) with SYBR®-Green-PCR-Master-Mix (TOYOBO Co., Osaka, Japan). Each treatment had three independent biological replicates (three technical replicates per sample).The 2−ΔΔCt method was used to determine the mRNA level of ALDH (Islam et al., 2019).
The secondary structures of ALDH proteins from the common bean were predicted using the Self-Optimized Prediction Method with Alignment (https://npsa-prabi.ibcp.fr/cgi-bin/npsa_automat.pl?page=/NPSA/npsa_sopma.html). PvALDHs N-glycosylation sites were identified using the NetNGlyc 1.0 server (http://www.cbs.dtu.dk/services/NetNGlyc/). Next, PvALDH2B2, PvALDH2C3, PvALDH5F1, and PvALDH10A1 were chosen for homology modeling. SWISS-MODEL server (https://swissmodel.expasy.org/) was used to generate the PvALDH protein model. The model structure was verified using the PSVS server (https://montelionelab.chem.rpi.edu/PSVS/psvs2/), and Ramachandran plots were used to calculate the number of protein residues in both favorable and allowable regions.
Growth and physiological indicators, ALDH enzyme activity, and relative gene expression data for each treatment were analyzed using the SPSS 20.0 software for variance analysis. The samples were analyzed three times for the determination of growth and physiological indicators. Duncan’s multiple approach was employed to identify significant differences in the average values between groups at the 5% level. The data were visualized using Origin 8.0.
NS–AS stress inhibited the growth and development of common bean plants, resulting in reduced plant height (Figure 1A). Compared with that in the control group, plants exposed to NS–AS stress showed significantly decreased dry weight of shoots and roots by 27.36, 62.54, 41.50, and 76.54%, at 0, 24, 48, and 72 h, respectively (Figures 1B, C). Both NS and AS stresses significantly (P<0.05) reduced Pn, Gs, Ci, Tr, and chlorophyll contents of common bean leaves compared to the control treatment, with the NS stress treatment reducing them by 40.06, 69.53, 56.01, and 39.40%, respectively, while the AS stress treatment reduced them by 63.95, 82.22, 72.66, and 79.23%, respectively (Figures 1D–H). In addition, compared with the control treatment, both NS and AS stresses significantly (P < 0.05) increased the levels of MDA, H2O2, O2•-, SOD and POD in the roots and leaves of the common bean. Under NS and AS stresses, CAT activity in the roots significantly (P < 0.05) increased, whereas CAT activity in the leaves only significantly increased under neutral salt stress (Figures 2A–F).
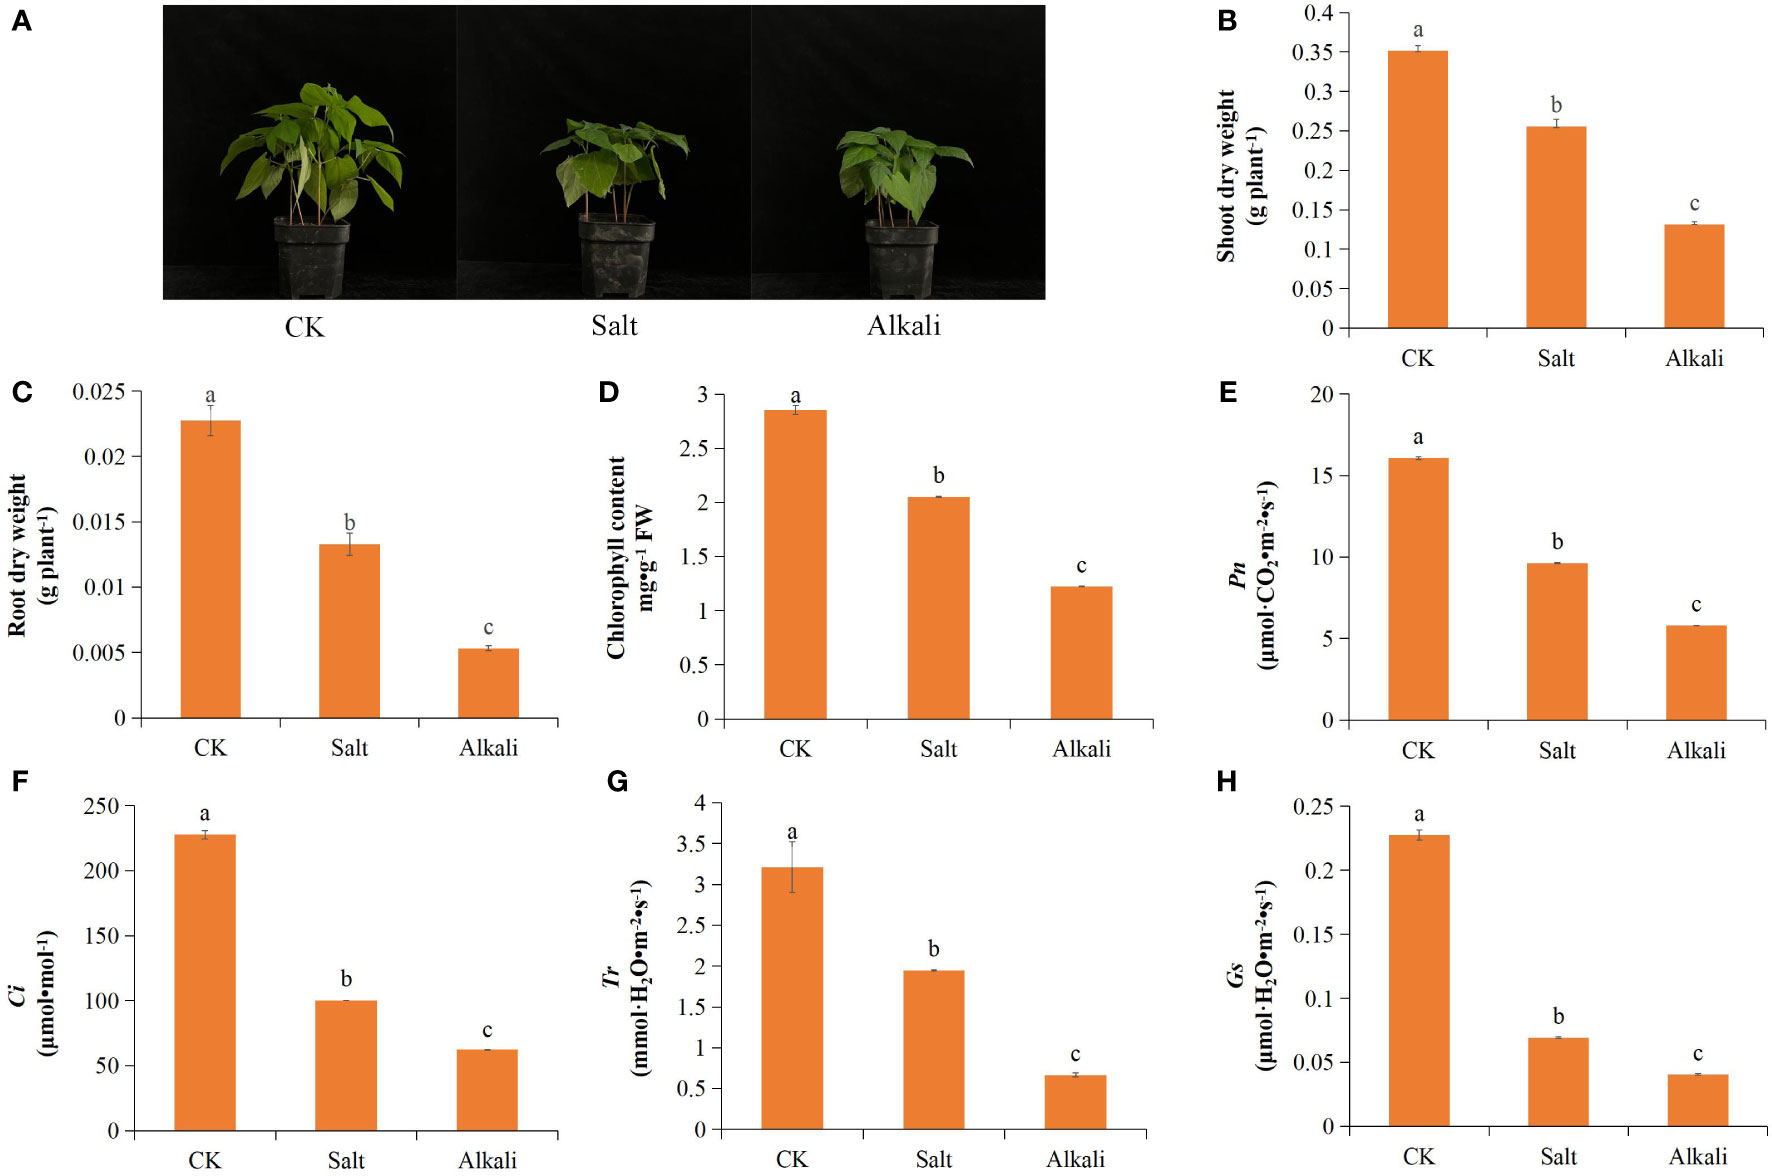
Figure 1 Effects of neutral and alkaline salt stresses on the growth and leaf photosynthetic performance of the common bean. (A) common bean phenotype; (B) shoot dry weight; (C) root dry weight; (D) chlorophyll content; (E) Pn; (F) Gs; (G) Ci; (H) Tr. Pn, net photosynthetic rate; Gs, stomatal conductance; Ci, intercellular CO2 concentration; Tr, transpiration rate; CK, control treatment. Standard deviation (SD; n = 3) is represented by error bars. Different lowercase letters indicate statistically significant differences (p < 0.05) among treatments.
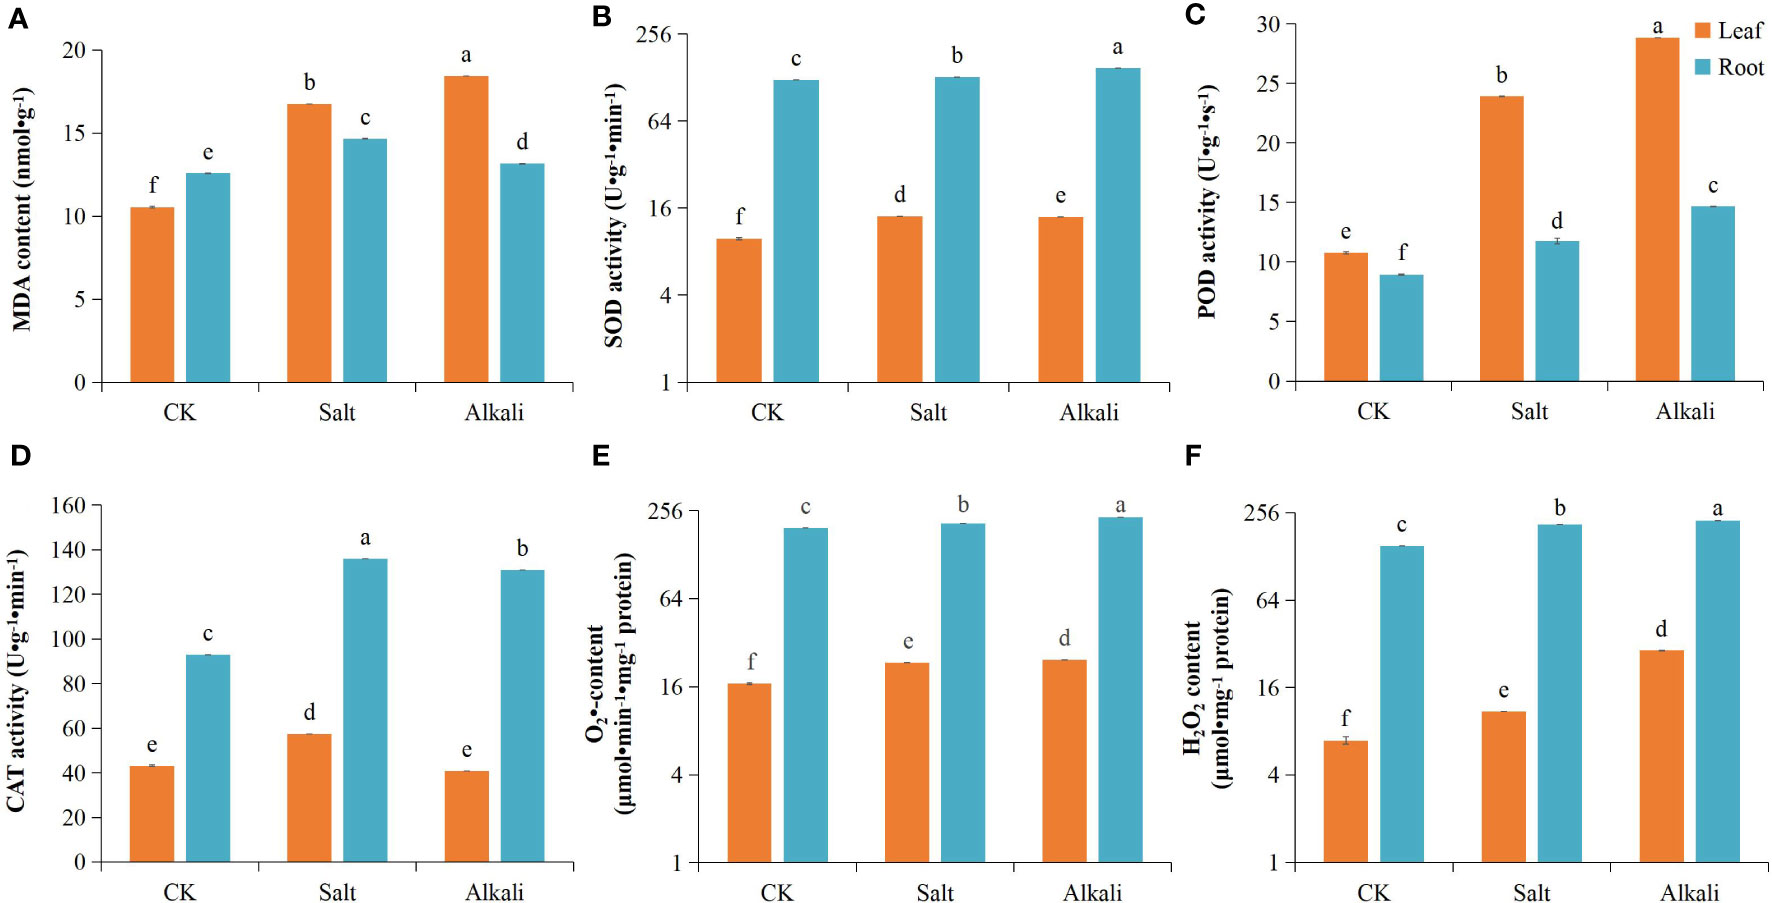
Figure 2 Effects of neutral and alkaline salt stresses on the oxidative stress of in common bean. (A) MDA content; (B) SOD activity; (C) POD activity; (D) CAT activity; (E) O2•- content; (F) H2O2 content. MDA, malondialdehyde; SOD, superoxide dismutase; POD, peroxidase; CAT, catalase; O2•-: superoxide radical; H2O2, hydrogen peroxide. Orange and blue represents the common bean leaf and root, respectively. Standard deviation (SD; n = 3) is represented by error bars. Different lowercase letters indicate statistically significant differences (p < 0.05) among treatments.
We measured the ALDH enzyme activity in the root of the common bean under different treatments. (Figure 3). ALDH activity significantly increased under NS–AS stress compared with that in the control group (0 h). Under NS stress, ALDH activity increased with stress time and reached the maximum value after 72 h, which was increased by 40.28%, compared with that in the control group. Under AS stress, ALDH activity initially increased and then decreased with stress time and reached the maximum value at 48 h, which was increased by 30.14%, compared with that observed in the control group.
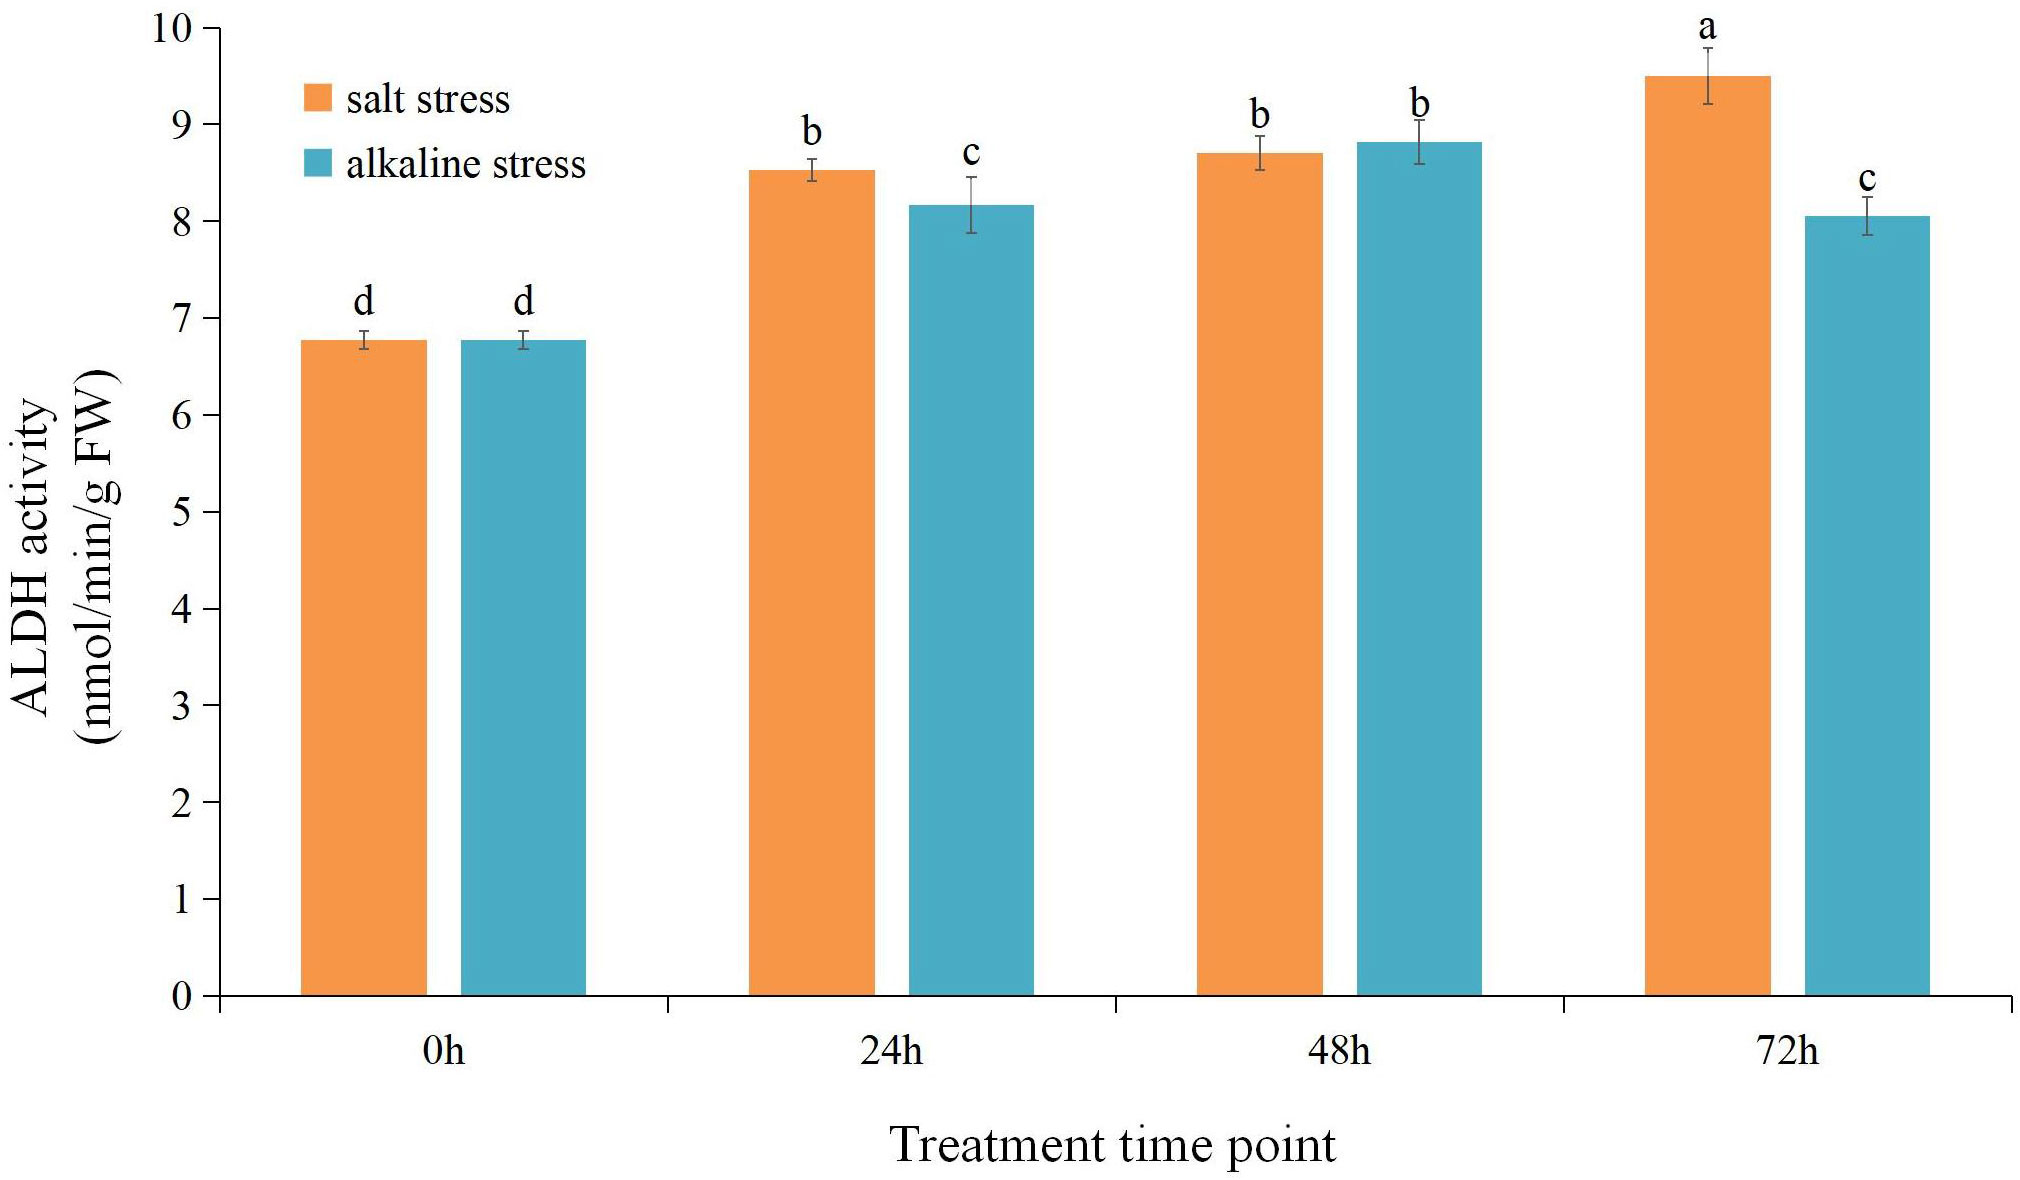
Figure 3 Changes in aldehyde dehydrogenase (ALDH) enzyme activity in common bean roots under neutral and alkaline salt stresses. The orange column shows ALDH enzyme activity under neutral salt stress. The blue column shows ALDH enzyme activity under the alkali salt stress. Different lowercase letters indicate statistically significant differences (p < 0.05) among treatments.
We identified 27 putative ALDH family members from the common bean genome. Analysis of the NCBI Conserved Domain Database and Pfam confirmed the existence of the conserved ALDH domain (PF00171) in candidate proteins. InterPro search and multiple sequence alignment verified the occurrence of the conserved cysteine (PS00070) and glutamic (PS00687) active sites in the majority of the PvALDH proteins (Figure 4; Supplementary Table S2). A total of 14 PvALDH proteins contained both active sites. PvALDH3H1, PvALDH3H2, PvALDH2C2, and PvALDH7B1 contained only the glutamic acid active site (PS00687), whereas PvALDH6B1 and PvALDH12A1 contained only the cysteine active site (PS00070). The remaining seven proteins (PvALDH3F1, PvALDH3I1, PvALDH3J1, PvALDH3J2, PvALDH18B1, PvALDH18B2, and PvALDH18B3) had no active sites (Figure 4; Supplementary Table S2). Moreover, the catalytic glutamate residue was absent in the ALDH6 enzyme, which exhibited coenzyme A-dependent acylating activity instead. Similarly, the ALDH18 enzyme lacked the catalytic glutamate residue and demonstrated Δ-1-pyrroline-5-carboxylate synthetase activity (Brocker et al., 2013). According to the criteria set forth by the ALDH Gene Nomenclature Committee criteria, PvALDH members were classified and annotated, and all the identified PvALDH members were classified into 10 families (ALDH-2, 3, 5, 6, 7, 10, 11, 12, 18, and 22) (Brocker et al., 2013). Among these 10 families, ALDH2 had the highest number at 8 eight members; ALDH6, ALDH7, ALDH12, and ALDH22 had only one member in each family; ALDH3 had six members; ALDH18 had four members; and the remaining families had two members per family (Supplementary Table S2). Further analysis showed that the PvALDH proteins length varied between 347 and 720 amino acids in length, the estimated isoelectric point varied between 5.15 and 9.28, and the molecular weight varied between 23.63 and 78.12 kDa. Based on subcellular localization predictions, most PvALDH proteins were primarily localized in chloroplasts and mitochondria, followed by the cytoplasm and peroxisome (Supplementary Table S2).
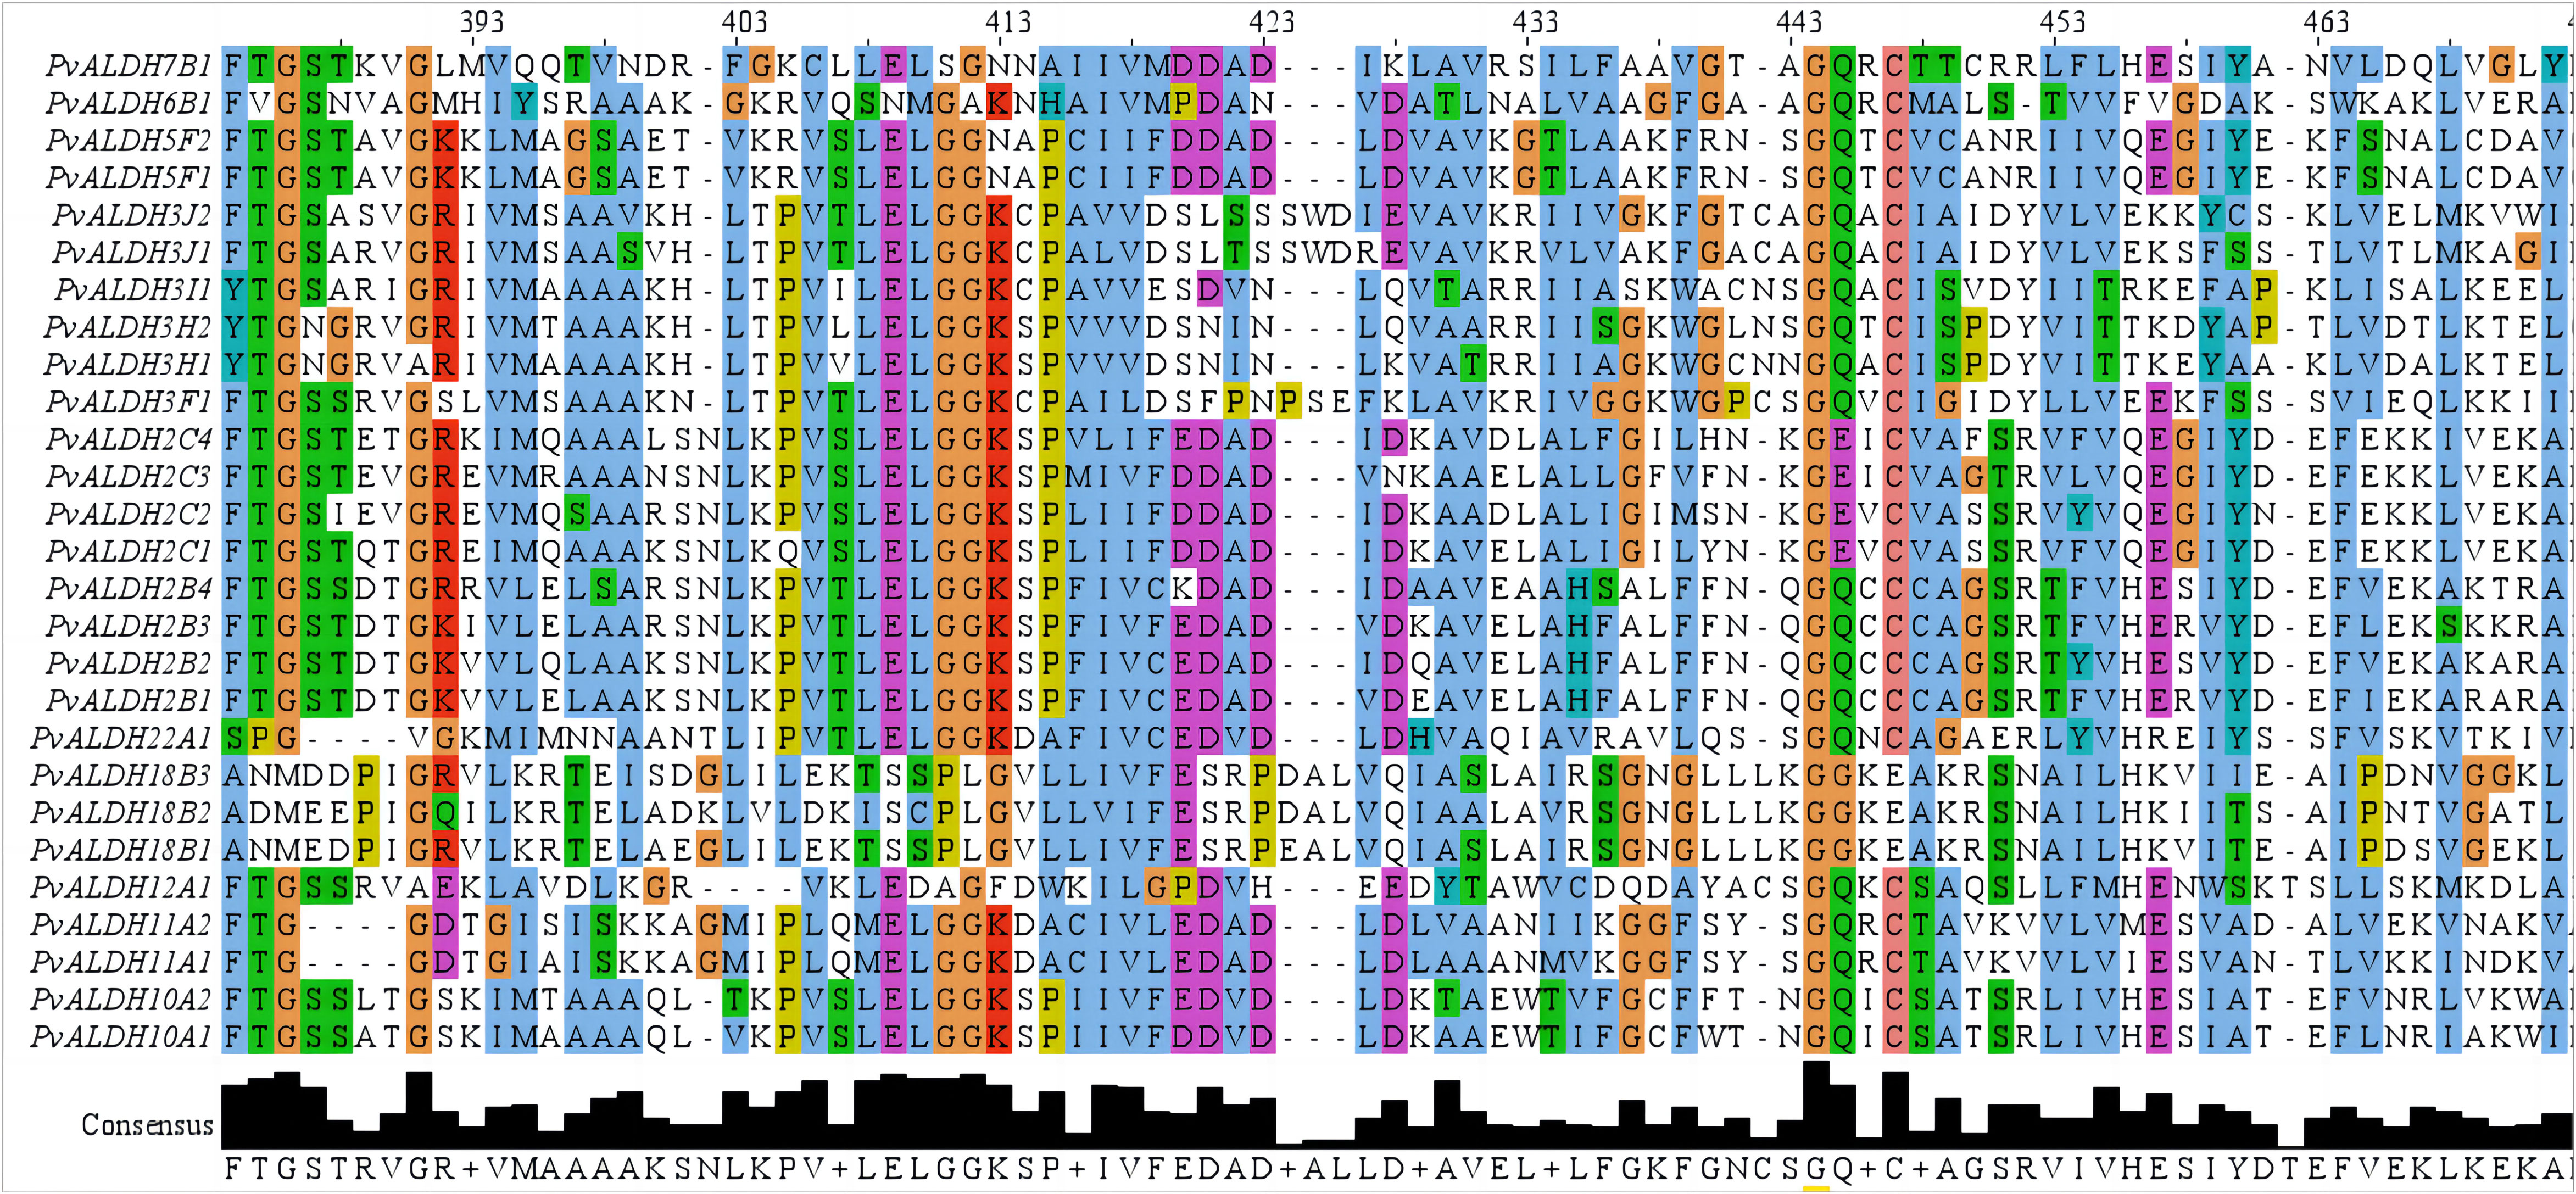
Figure 4 Protein domain alignment analysis of members of the PvALDH family. Editing, visualizing, and analyzing the multi-sequence alignment was carried out with JalView (https://www.jalview.org/).
Nine of the eleven chromosomes in the common bean carried PvALDHs in an uneven distribution. A total of seven ALDHs were localized on chromosome 3, representing the highest count among the chromosomes. This was followed by chromosome 2 with five PvALDHs, chromosomes 1, 4, 5, and 9 with three each, and chromosome 8 with two. By contrast, chromosome 11 only had one ALDH gene and chromosomes 6, 7, and 10 had none (Figure 5).
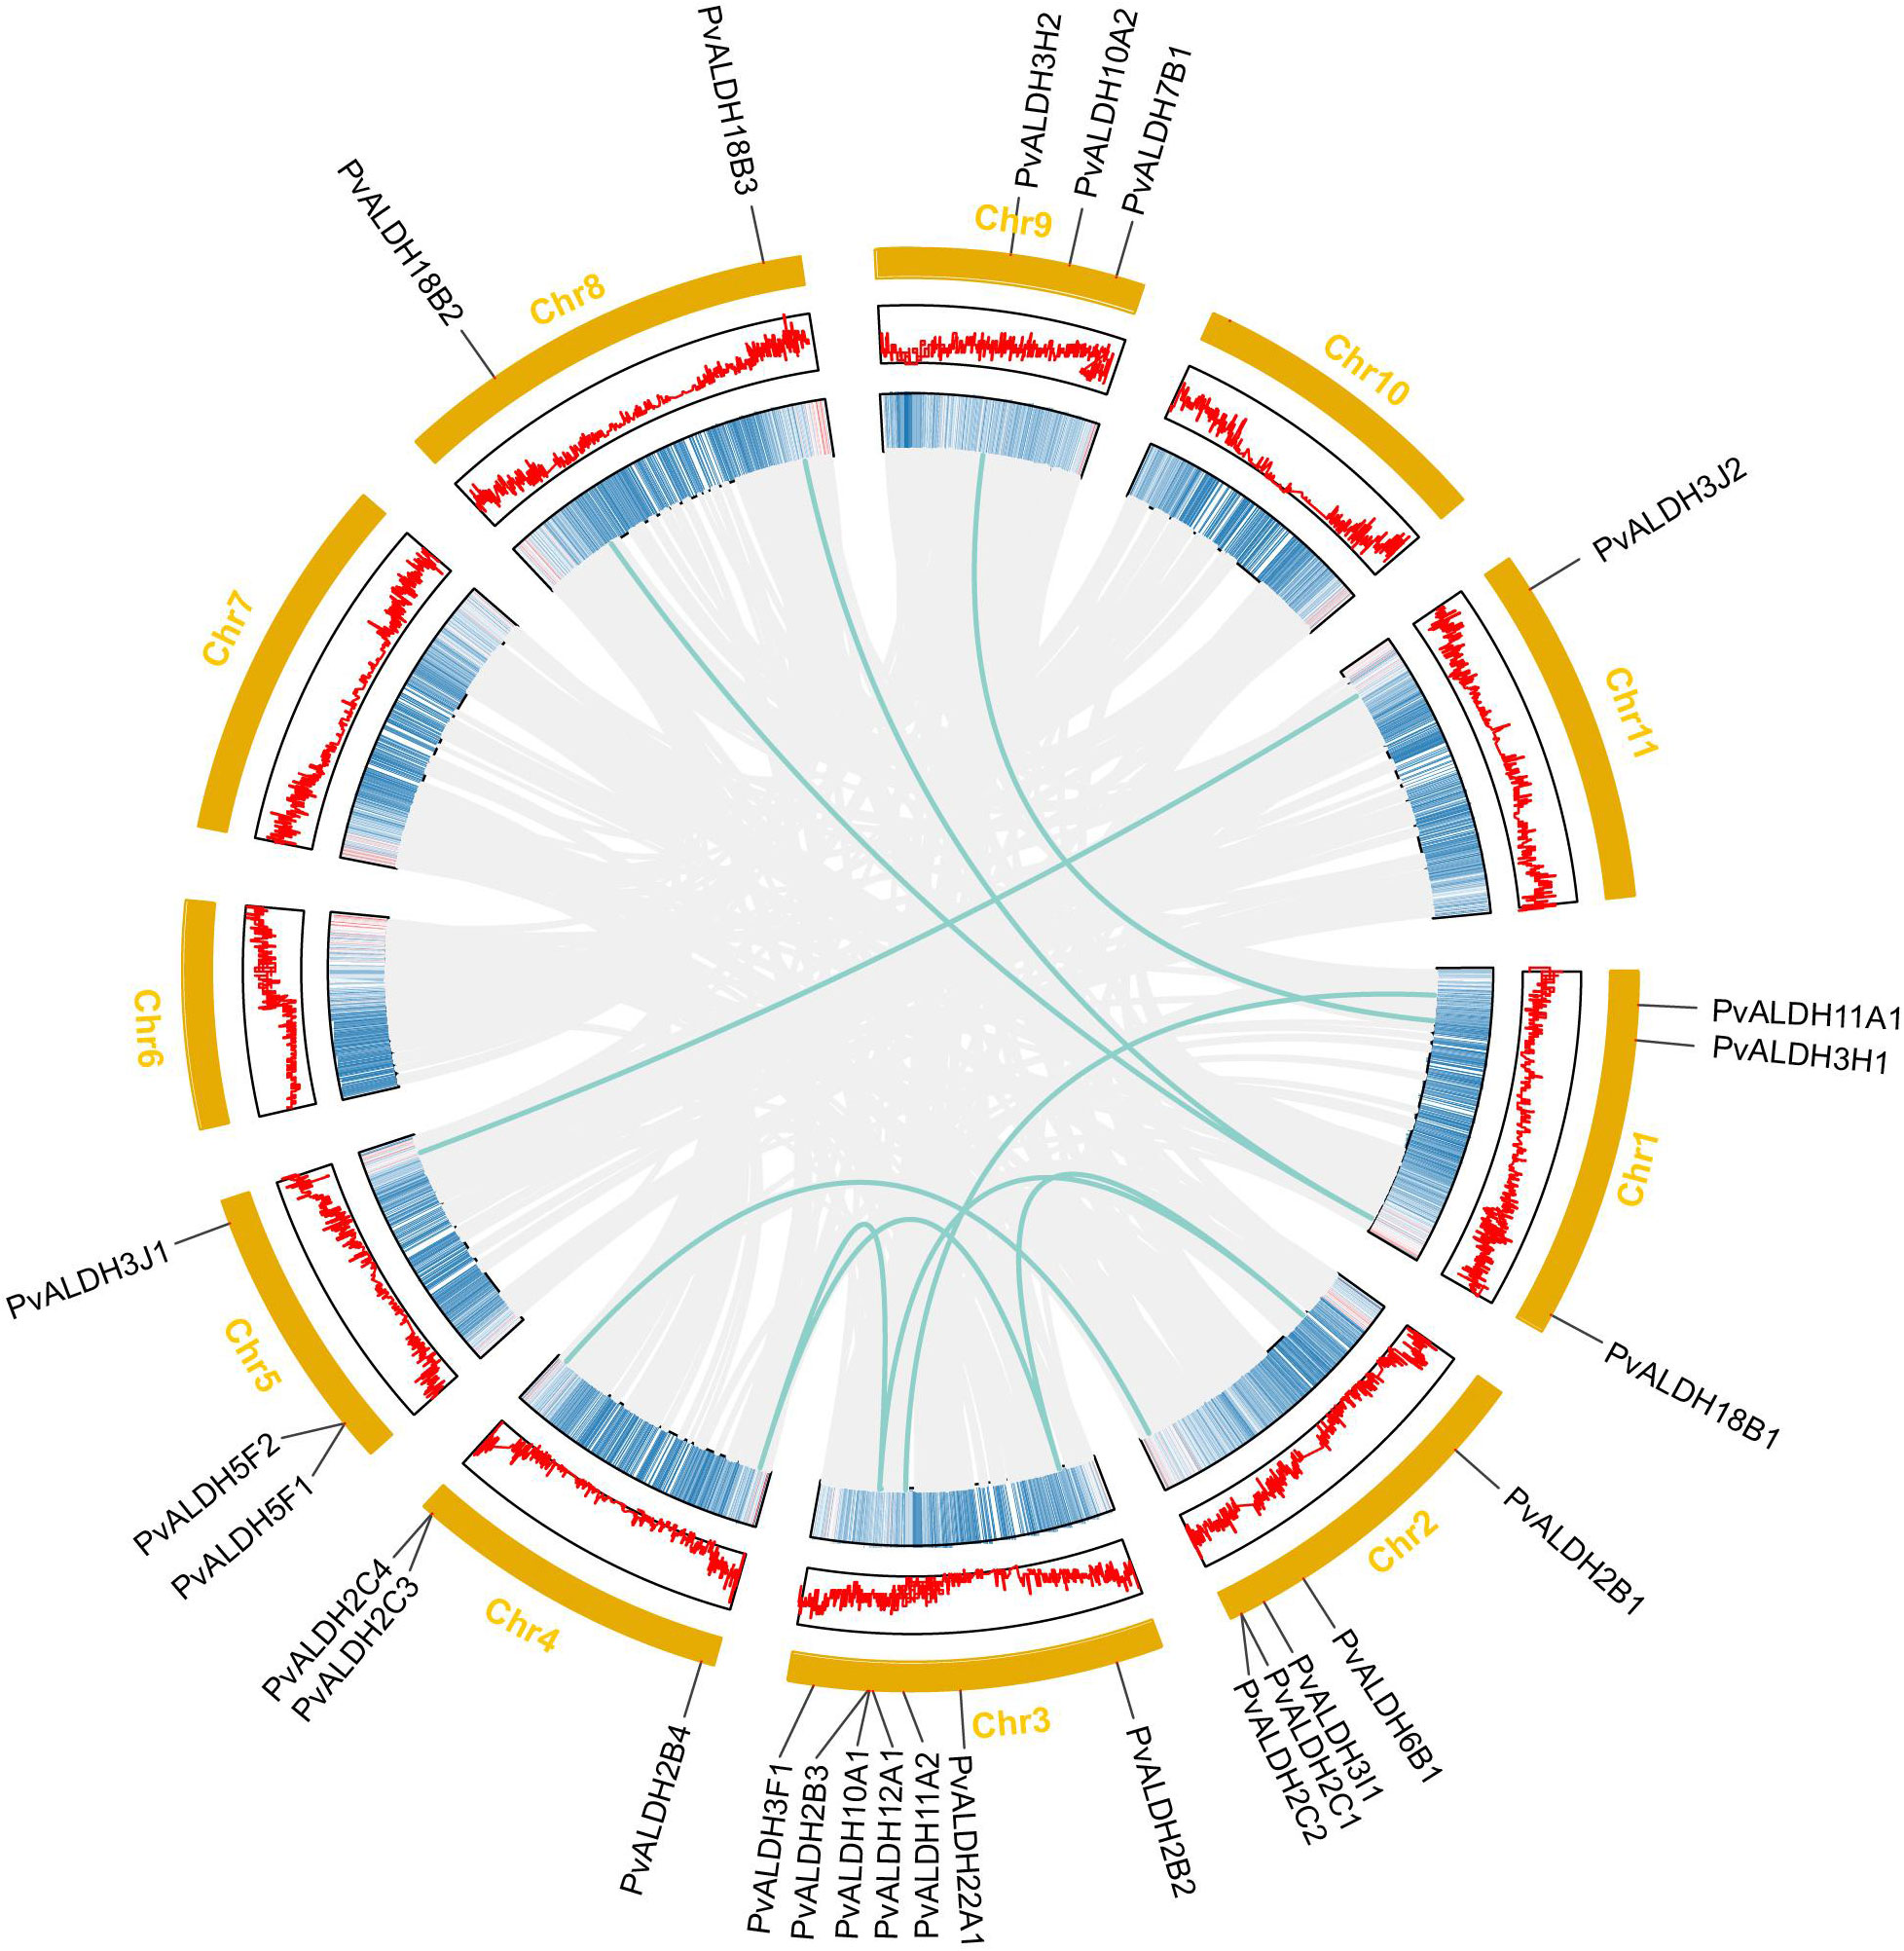
Figure 5 PvALDH gene family chromosome distribution and collinearity analysis. Common bean chromosomes are shown in orange, and PvALDH gene family members and their locations on the chromosome are shown in black. Each chromosome’s gene density is represented by the middle two rings. The green line represents the collinear relationship between PvALDH gene family members. The gray line represents the collinear background.
In the common bean genome, 10 pairs of PvALDH genes were generated through segmental duplications: PvALDH2B1/PvALDH2B2, PvALDH2B1/PvALDH2B3, PvALDH2B2/PvALDH2B4, PvALDH2B3/PvALDH2B4, PvALDH2C1/PvALDH2C3, PvALDH3J1/PvALDH3J2, PvALDH3H1/PvALDH3H2, PvALDH11A1/PvALDH11A, PvALDH18B1/PvALDH18B2, and PvALDH18B1/PvALDH18B3. A pair of tandem duplication genes, PvALDH2C3/PvALDH2C4, were also discovered (Figure 5). Except for PvALDH2B1/PvALDH2B3 and PvALDH2B3/PvALDH2B4 pairs, all the duplicated PvALDH gene pairs exhibited a Ka/Ks value < 0.2. This pattern underscores the influence of purifying selection in shaping their evolutionary trajectory. The rough estimate of the time of divergence for the duplicated genes was as early as 149.35 (Mya) (PvALDH2B1/PvALDH2B3) and as late as 49.86 (Mya) (PvALDH2B1/PvALDH2B2) (Table 1).
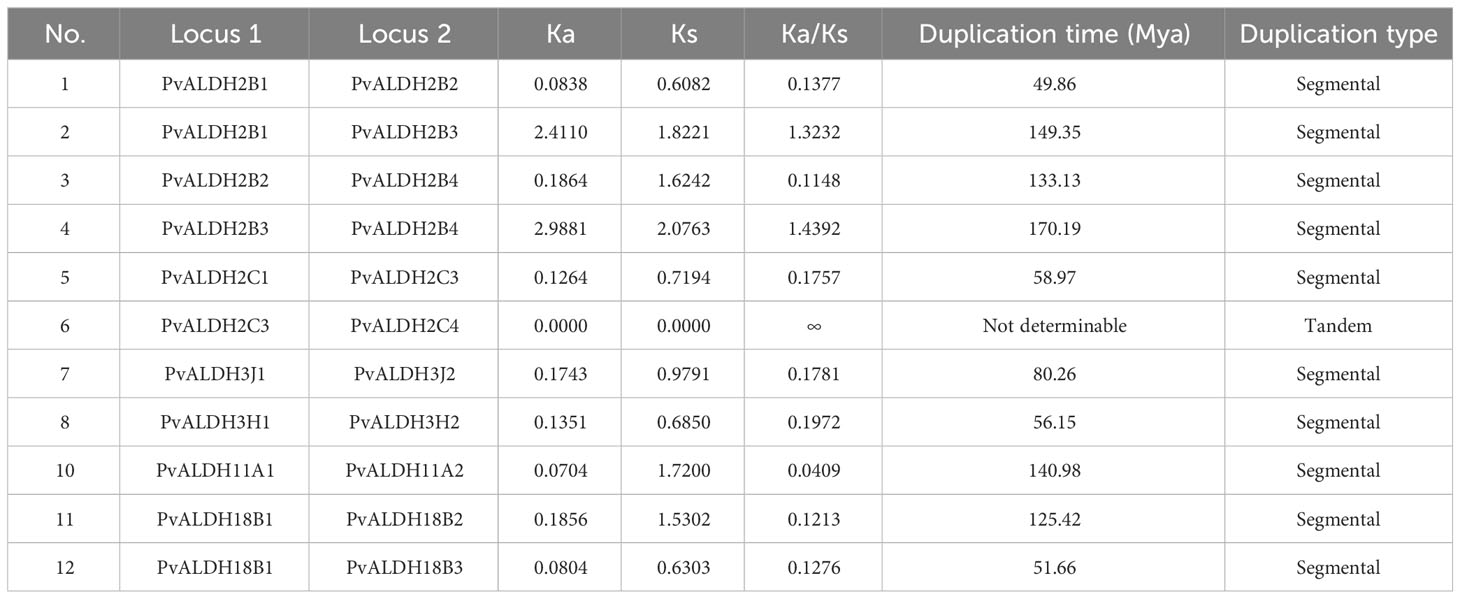
Table 1 Gene duplication analysis of PvALDH genes.
Additionally, a collinearity analysis of ALDH genes in common bean and Arabidopsis thaliana was performed. The results showed that 21 collinear pairs occurred between the two species, and the most collinear members of the PvALDH genes were distributed on chromosome 3. These findings align with those of the collinear gene distribution in Arabidopsis thaliana. (Supplementary Figure S1).
As part of the effort to gain a better understanding of the evolutionary history of PvALDHs, we created a phylogenetic tree based on the protein sequences of ALDH family members from common bean and 17 other species (Figure 6). The 17 species include three monocots (Sorghum bicolor, Oryza sativa, and Zea mays), eight eudicots (Arabidopsis thaliana, Malus domestic, Brassica rapa, Vitis vinifera, Populus trichocarpa, Glycine max, Solanum lycopersicum, and Solanum tuberosum), two mosses (Selaginella moellendorffii and Physcomitrella patens), two algae (Ostreococcus tauri and Chlamydomonas reinhardtii), and two mammals (Mus musculus and Homo sapiens). The findings demonstrated that PvALDH genes were closely involved in eudicot species (e.g., soybean) but not in other species. All ALDH protein members from different species can be divided into 19 families (ALDH-1, 2, 3, 4, 5, 6, 7, 8, 9, 10, 11, 12, 16, 18, 19, 21, 22, 23 and 24). Most protein members from the same family exhibited clustering together, irrespective of their organismal origin or type. The phylogenetic tree also shows that the ALDH2 family has the highest number of members of all studied species, followed by ALDH3, while ALDH-5, 12, and 22 have the lowest number of members. In addition, members of the ALDH-1, 4, 8, 9, and 16 families are found only in animal species. Similarly, members of the ALDH-21, 23, and 24 families occur only in algae and mosses.
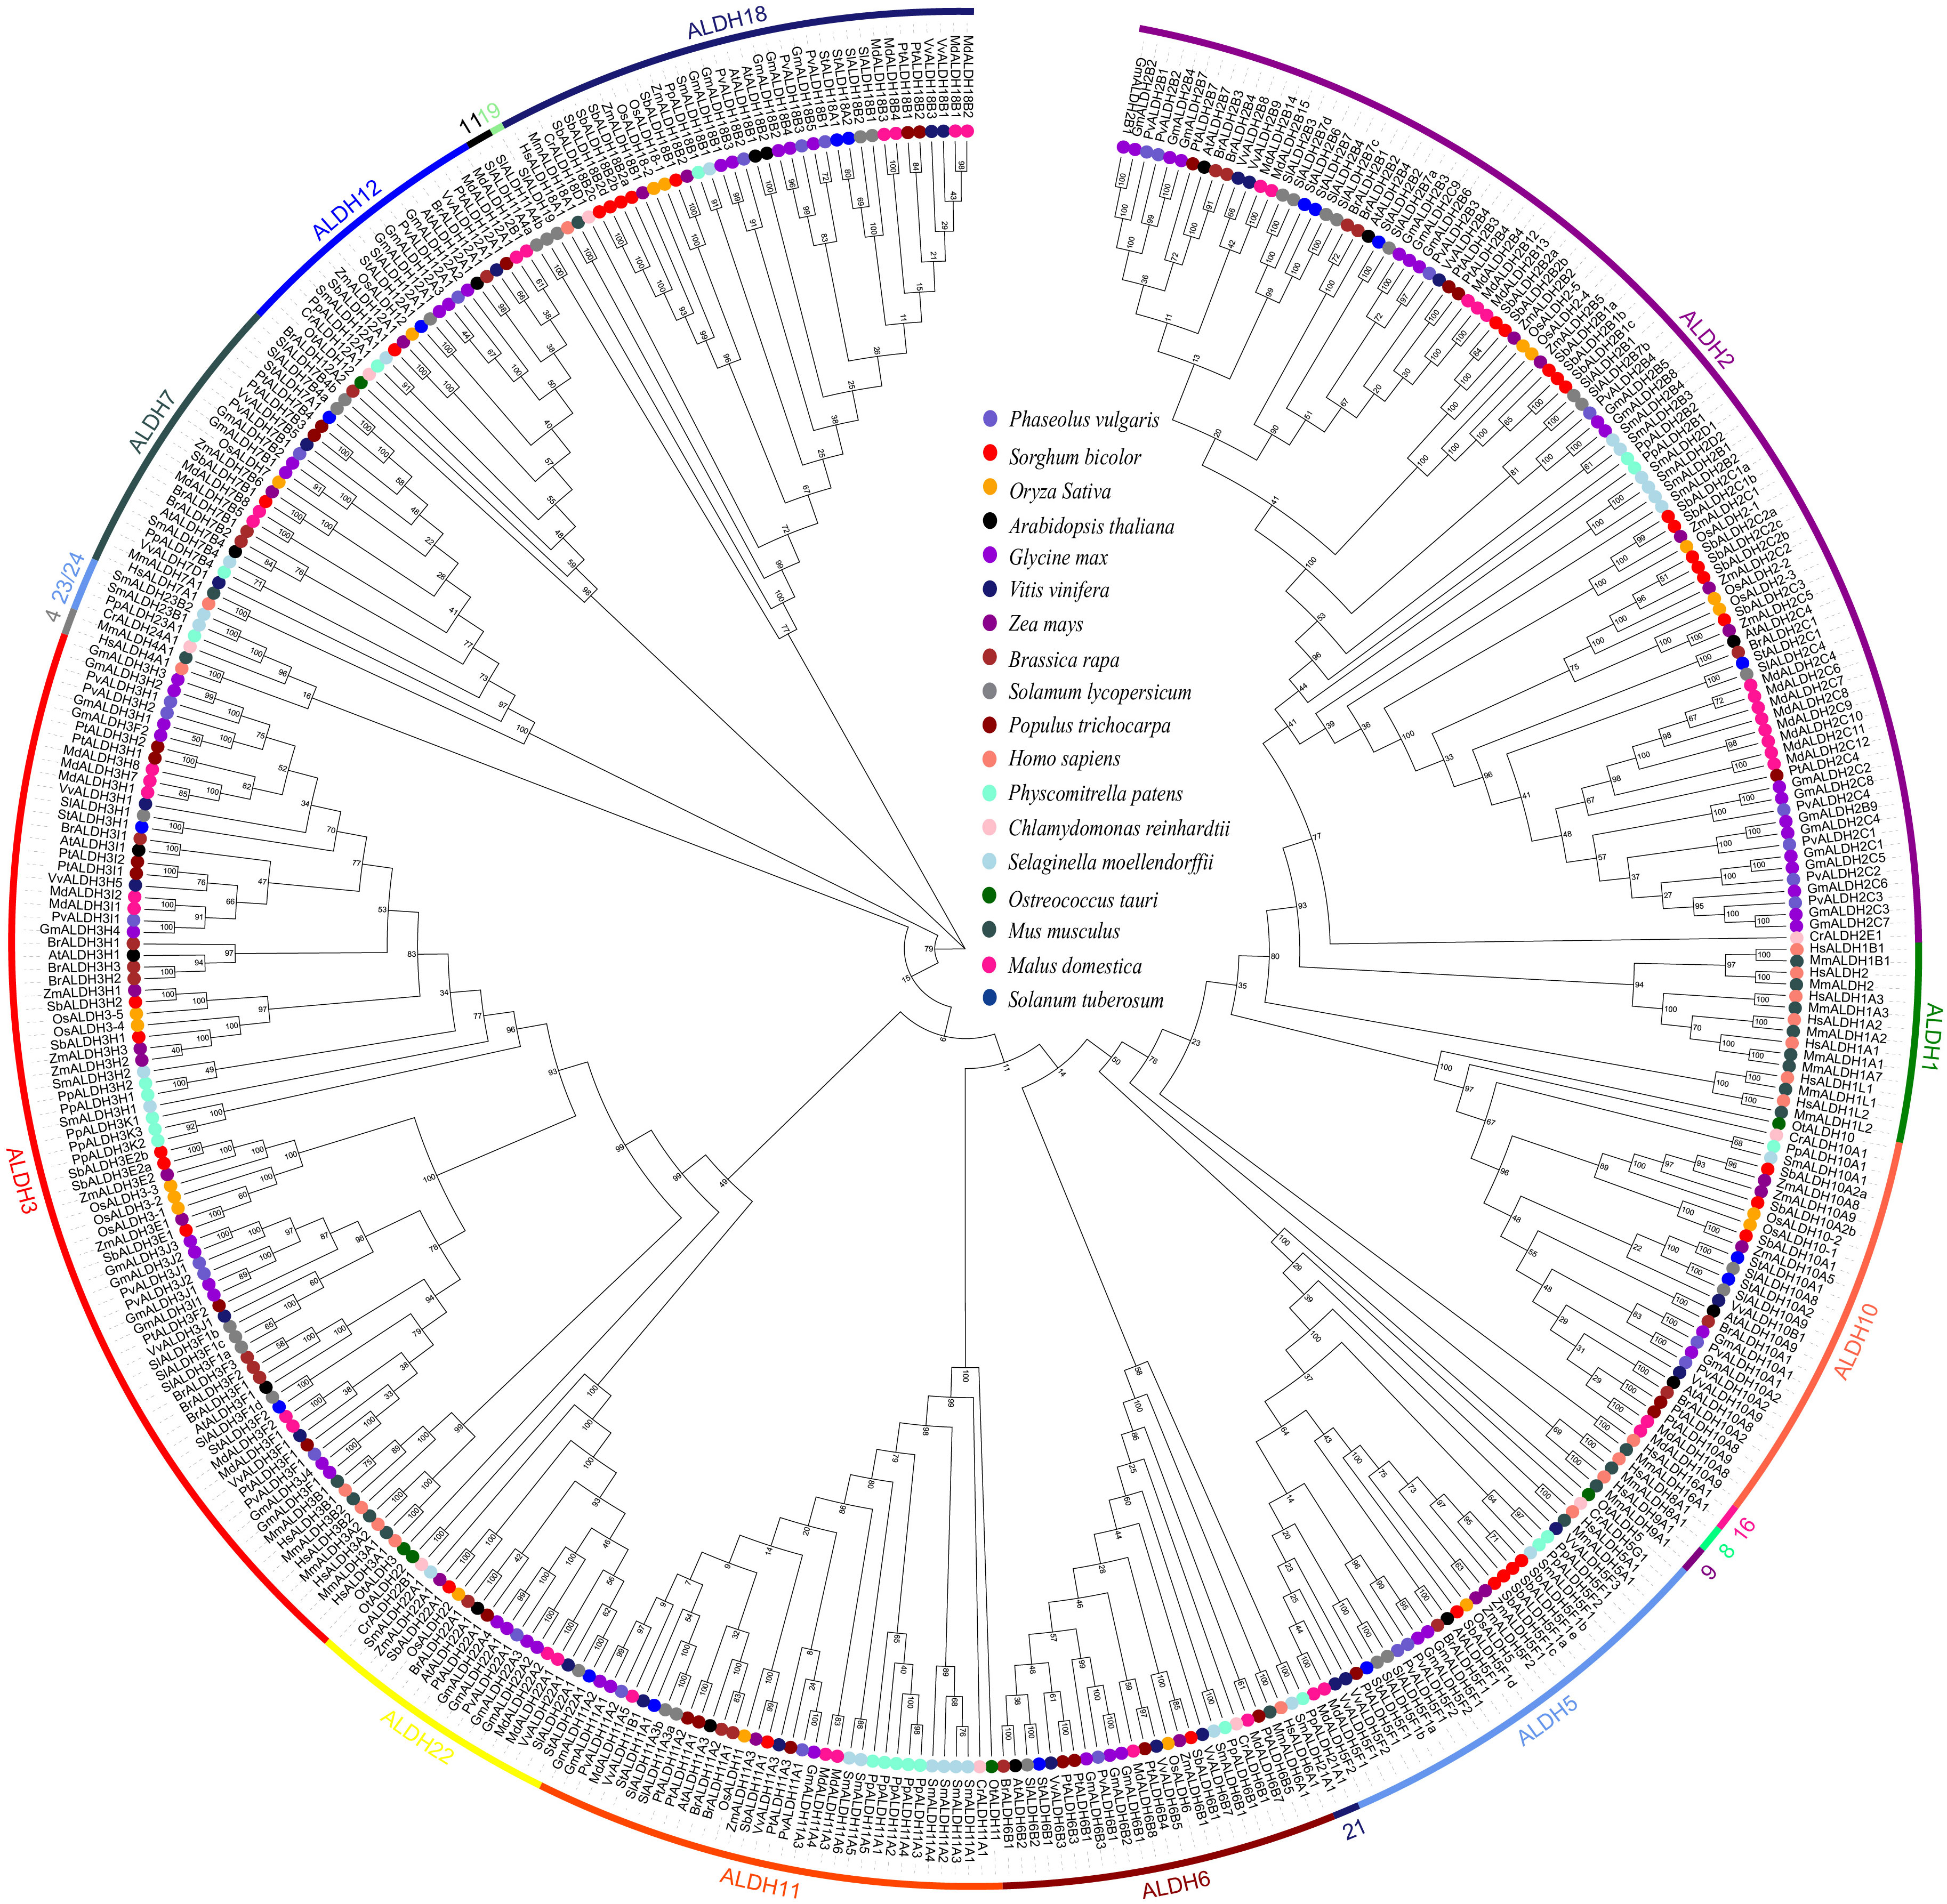
Figure 6 Phylogenetic analysis of the aldehyde dehydrogenase (ALDH) superfamily members. Constructing phylogenetic evolution tree using the neighbor joining (N-j) method with MEGA X. Bootstrap repeats were set to 1000, and different colored circles represent the ALDH proteins of different species in the tree.
The protein sequences of 27 PvALDH proteins were used to construct phylogenetic trees. The data revealed that PvALDH proteins belonging to identical families had been clustered, which is similar to that for the phylogeny formed using ALDH members from 17 various organisms (Figure 7A). To clarify the structural evolution of PvALDH genes, the intron–exon structures of all PvALDHs were investigated (Figure 7B). We found that the number of exons in PvALDHs varied from 8 to 20, and genes within the same family typically had identical intron–exon structures; however, increases or loss of member exons was observed in almost all families. Among the PvALDH gene families, PvALDH18B2 and PvALDH18B1 had the highest number of exons (20), followed by PvALDH6B1 and PvALDH18B3 (19 and 17, respectively), while PvALDH5F2 had the fewest exons (6). By contrast, the number of introns in PvALDHs varied between 5 and 19, with PvALDH18B2 and PvALDH18B1 containing the highest number of introns (19) and PvALDH5F2 containing the fewest introns (5). The structural analysis of the PvALDH genes shows that all the genes, except PvALDH10A1, had upstream/downstream domains. Furthermore, with the help of Pfam, we identified the ALDH conserved domains (PF00171) of 27 PvALDH proteins (Figure 7C). Each PvALDH protein contained conserved ALDH domains, and the protein lengths and domain sizes of the same subfamily were similar. PvALDH22A1 had the largest ALDH domain (467 amino acids), followed by PvALDH6B1 (464 amino acids), while PvALDH18B2 had the smallest domain (263 amino acids) (Figure 7C).
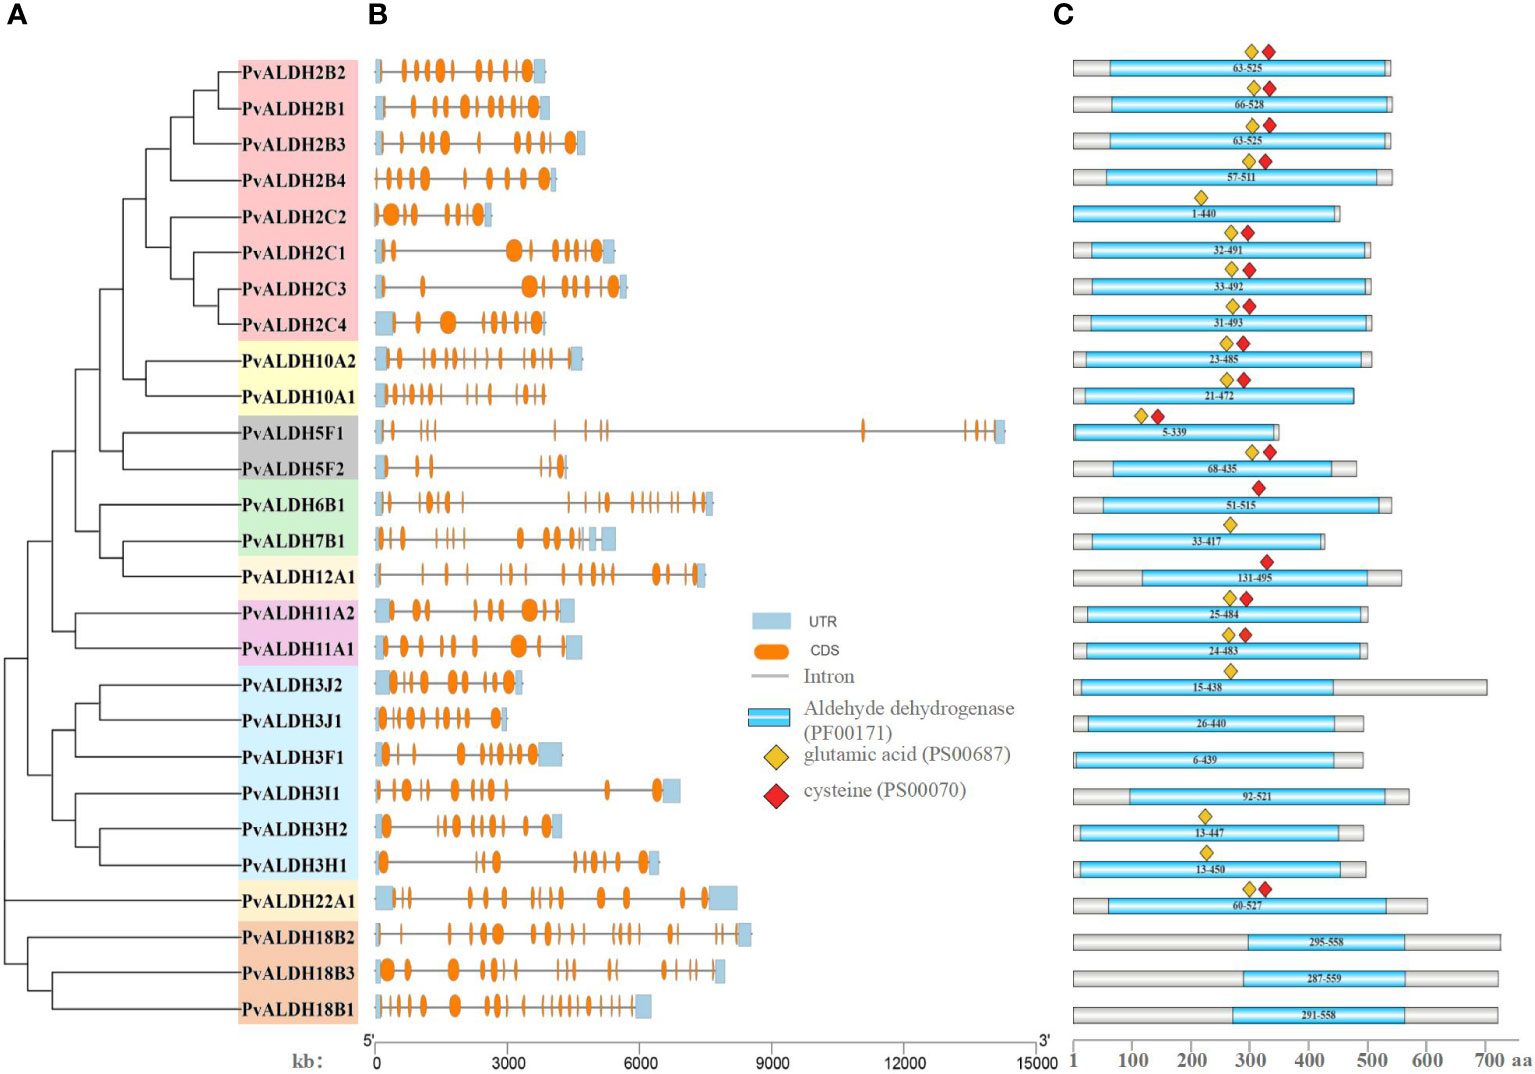
Figure 7 Organizational structure of common bean (aldehyde dehydrogenase) ALDH members. (A) Phylogenetic evolutionary tree of the PvALDH protein family. (B) Exon–intron distributions of the protein family. Blue represents untranslated regions (UTRs), orange represents exons, and blocking black lines represent introns. (C) Distribution of ALDH-conserved domains in the PvALDH proteins. The blue rectangle represents the ALDH structural domain (PF00171); The red diamond represents the active site of glutamic acid (PS00687); the yellow diamond represents the active site of cysteine (PS00070).
The PvALDH protein has been analyzed for 10 conserved motifs, and they were designated as “motif1 to motif10” according to the E-values of the motifs (Supplementary Figure S2; Supplementary Table S3). The results of the analysis indicated that all PvALDH proteins contained at least two conserved motifs, as well as motif5. Therefore, motif5 is highly conserved in PvALDH family members and facilitates the maintenance of the essential functions and structures of PvALDH proteins. The motif analysis also revealed that all the members of the ALDH2 family contained 10 motifs, while the members of the ALDH18 family had the minimum number of motifs (2). Except for individual members, the motif distribution of members within a similar family exhibited similarities, indicating that PvALDH proteins in the same family may have functional similarities. In addition, among all the identified motifs, motif5 was the most common, found at 26 loci, followed by motif1 at 24 loci, whereas motif10 was the least common and found at only 8 loci (Supplementary Table S3).
To better understand the possible regulatory mechanisms of PvALDHs in the common bean under abiotic stress, PlantCARE was used to analyze the 1500-bp sequence upstream of PvALDH family members starting codons (Figure 8). Abiotic-responsive CAEs (n = 8), phytohormone-responsive CAEs (n = 8), development and metabolism-associated CAEs (n = 4), and biotic stress-responsive element (n = 1) were assessed in PvALDHs promoter regions. The results showed that all PvALDHs, except for PvALDH2C1 and PvALDH3I1, encompassed >1 phytohormone response element (e.g., ABRE, CGTCA-motif, ERE, GARE-motif, TGA-element, P-box, AuxRR-core, or TCA-element), which indicates that different phytohormones (e.g., gibberellin, abscisic acid, auxin, salicylic acid, and jasmonic acid) have a certain impact on the expression of levels PvALDHs (Figure 8A). In addition, abiotic/biotic stress-response elements, including LTR, ARE, TC-rich element, MBS, Box 4, MRE, WUN-motif, G-box and I-box, were identified in PvALDHs, while abiotic stress-response elements appeared in all PvALDHs, with the maximum observed for Box 4 (Figure 8B). In general, the promoter of PvALDH12A1 contained the highest number and types of CAEs, while the promoter of PvALDH11A1 contained the least number and types of CAEs.
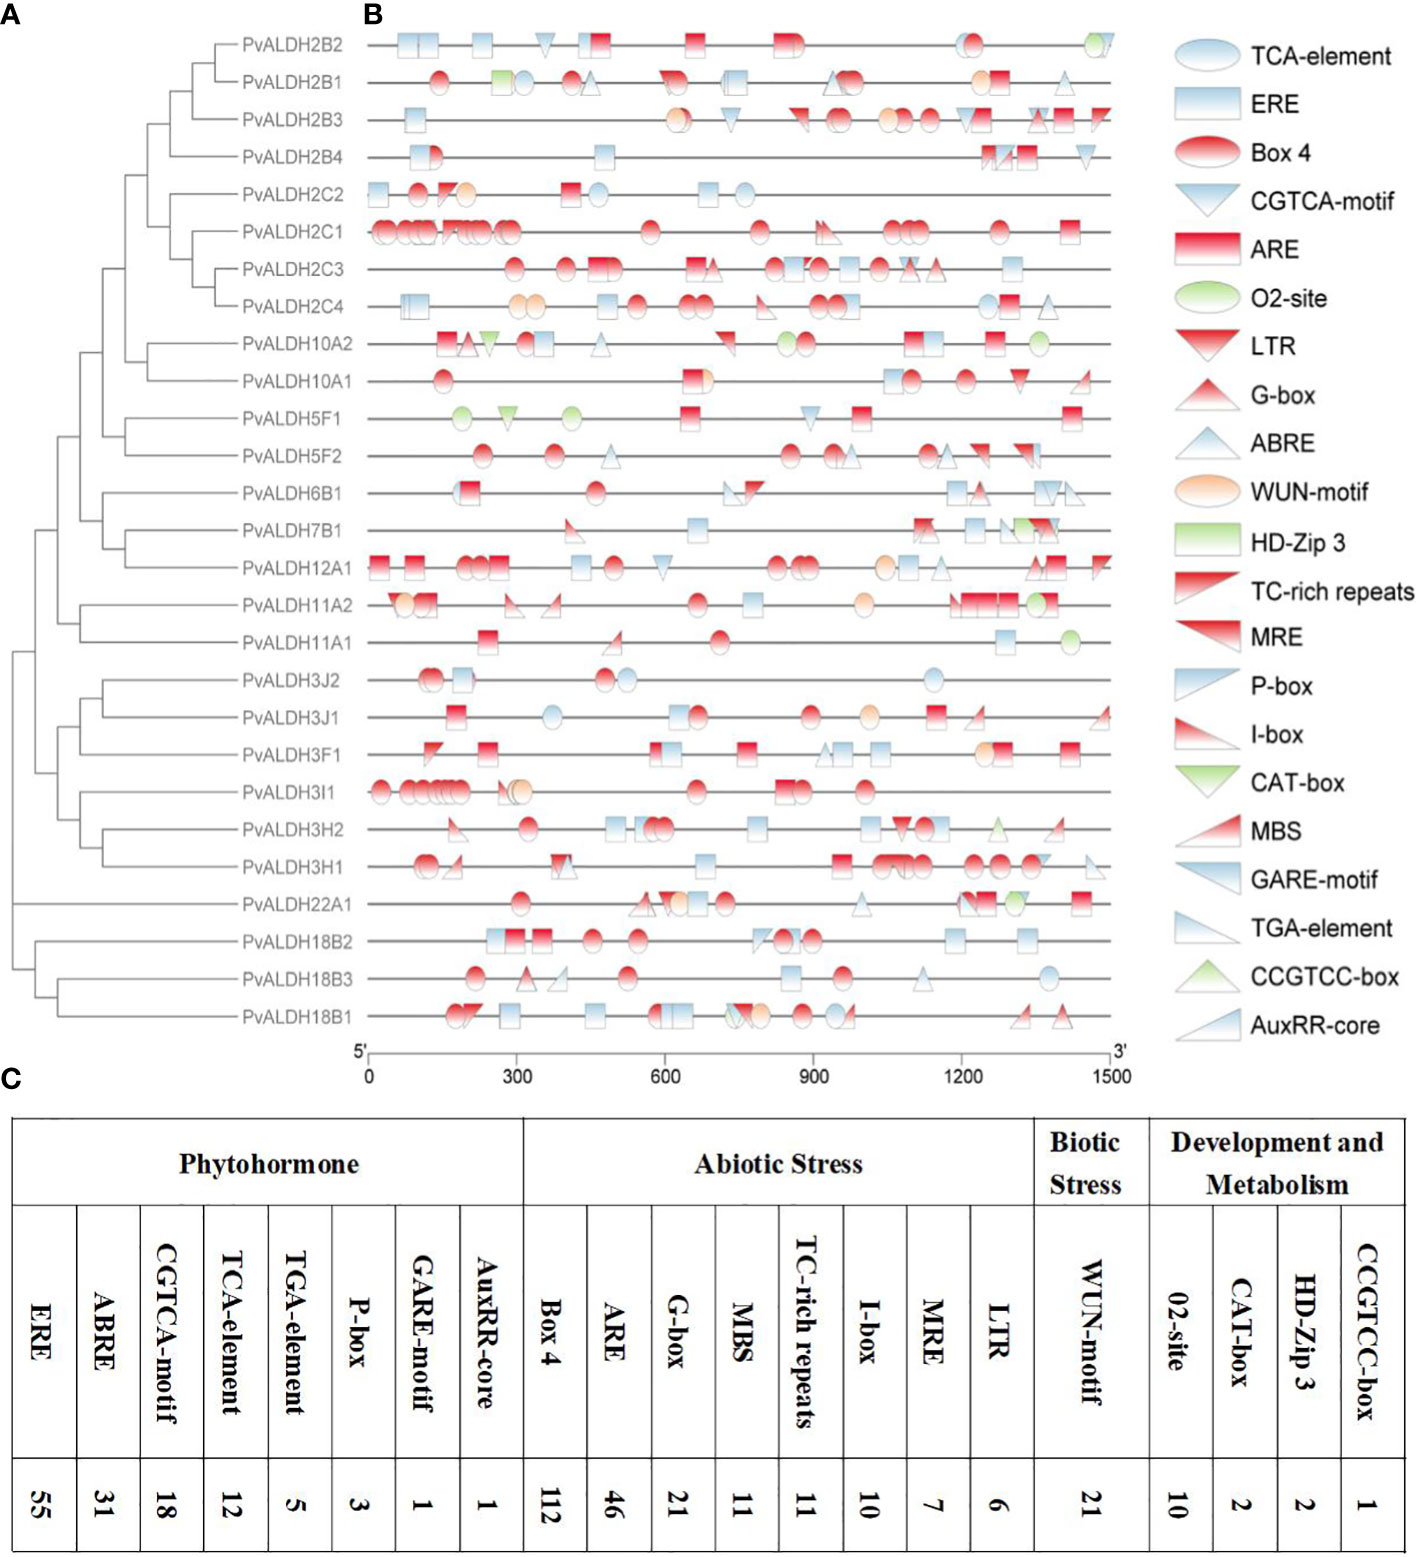
Figure 8 Analysis of CAEs of the PvALDH gene family promoters. (A) Phylogenetic evolutionary tree of the PvALDH protein family. (B) Distribution of promoter cis-acting elements in the PvALDH gene family. (C) Number of different cis-acting elements. Different colors and shapes represent different promoter cis-acting elements, and the same color represents the same type of CAEs. Blue indicates plant hormone-related response elements, red indicates abiotic stress-related response elements, green indicates development- and metabolism-related response elements, and orange indicates biological stress-related response elements.
To clarify the role played by members of the PvALDH family in the growth and development of the common bean, the expression data of family members at various growth stages and tissues of the common bean were obtained from Phytozome, and subsequently retrieval and cluster analyses were performed (Figure 9; Supplementary Table S4). The results showed that all PvALDHs were expressed to varying degrees in common bean plants, with certain PvALDHs exhibiting tissue-specific expression. For instance, PvALDH2B4 was upregulated only in young pods and at a low level in other tissues and organs; PvALDH3H1 was upregulated only in the flowers and at a relatively low level in other tissues and organs; and PvALDH22A1, PvALDH11A2, and PvALDH3H2 were upregulated only in the leaves, young trifoliates, and mature pods, respectively. Some PvALDHs were upregulated in various tissues. For instance, PvALDH2C2 and PvALDH2C3 were upregulated in the nodules and roots, whereas PvALDH7B1, PvALDH10A2, and PvALDH2B1 were upregulated in the flowers and buds. The cluster analysis showed that numerous PvALDH gene family members had high expression in the buds, flowers, and roots. These findings indicate that the expression of PvALDHs in different tissue parts of the common bean is responsible for the gene functions; therefore, the roots, flowers, and buds may be essential tissues and organs for studying the function of PvALDHs.
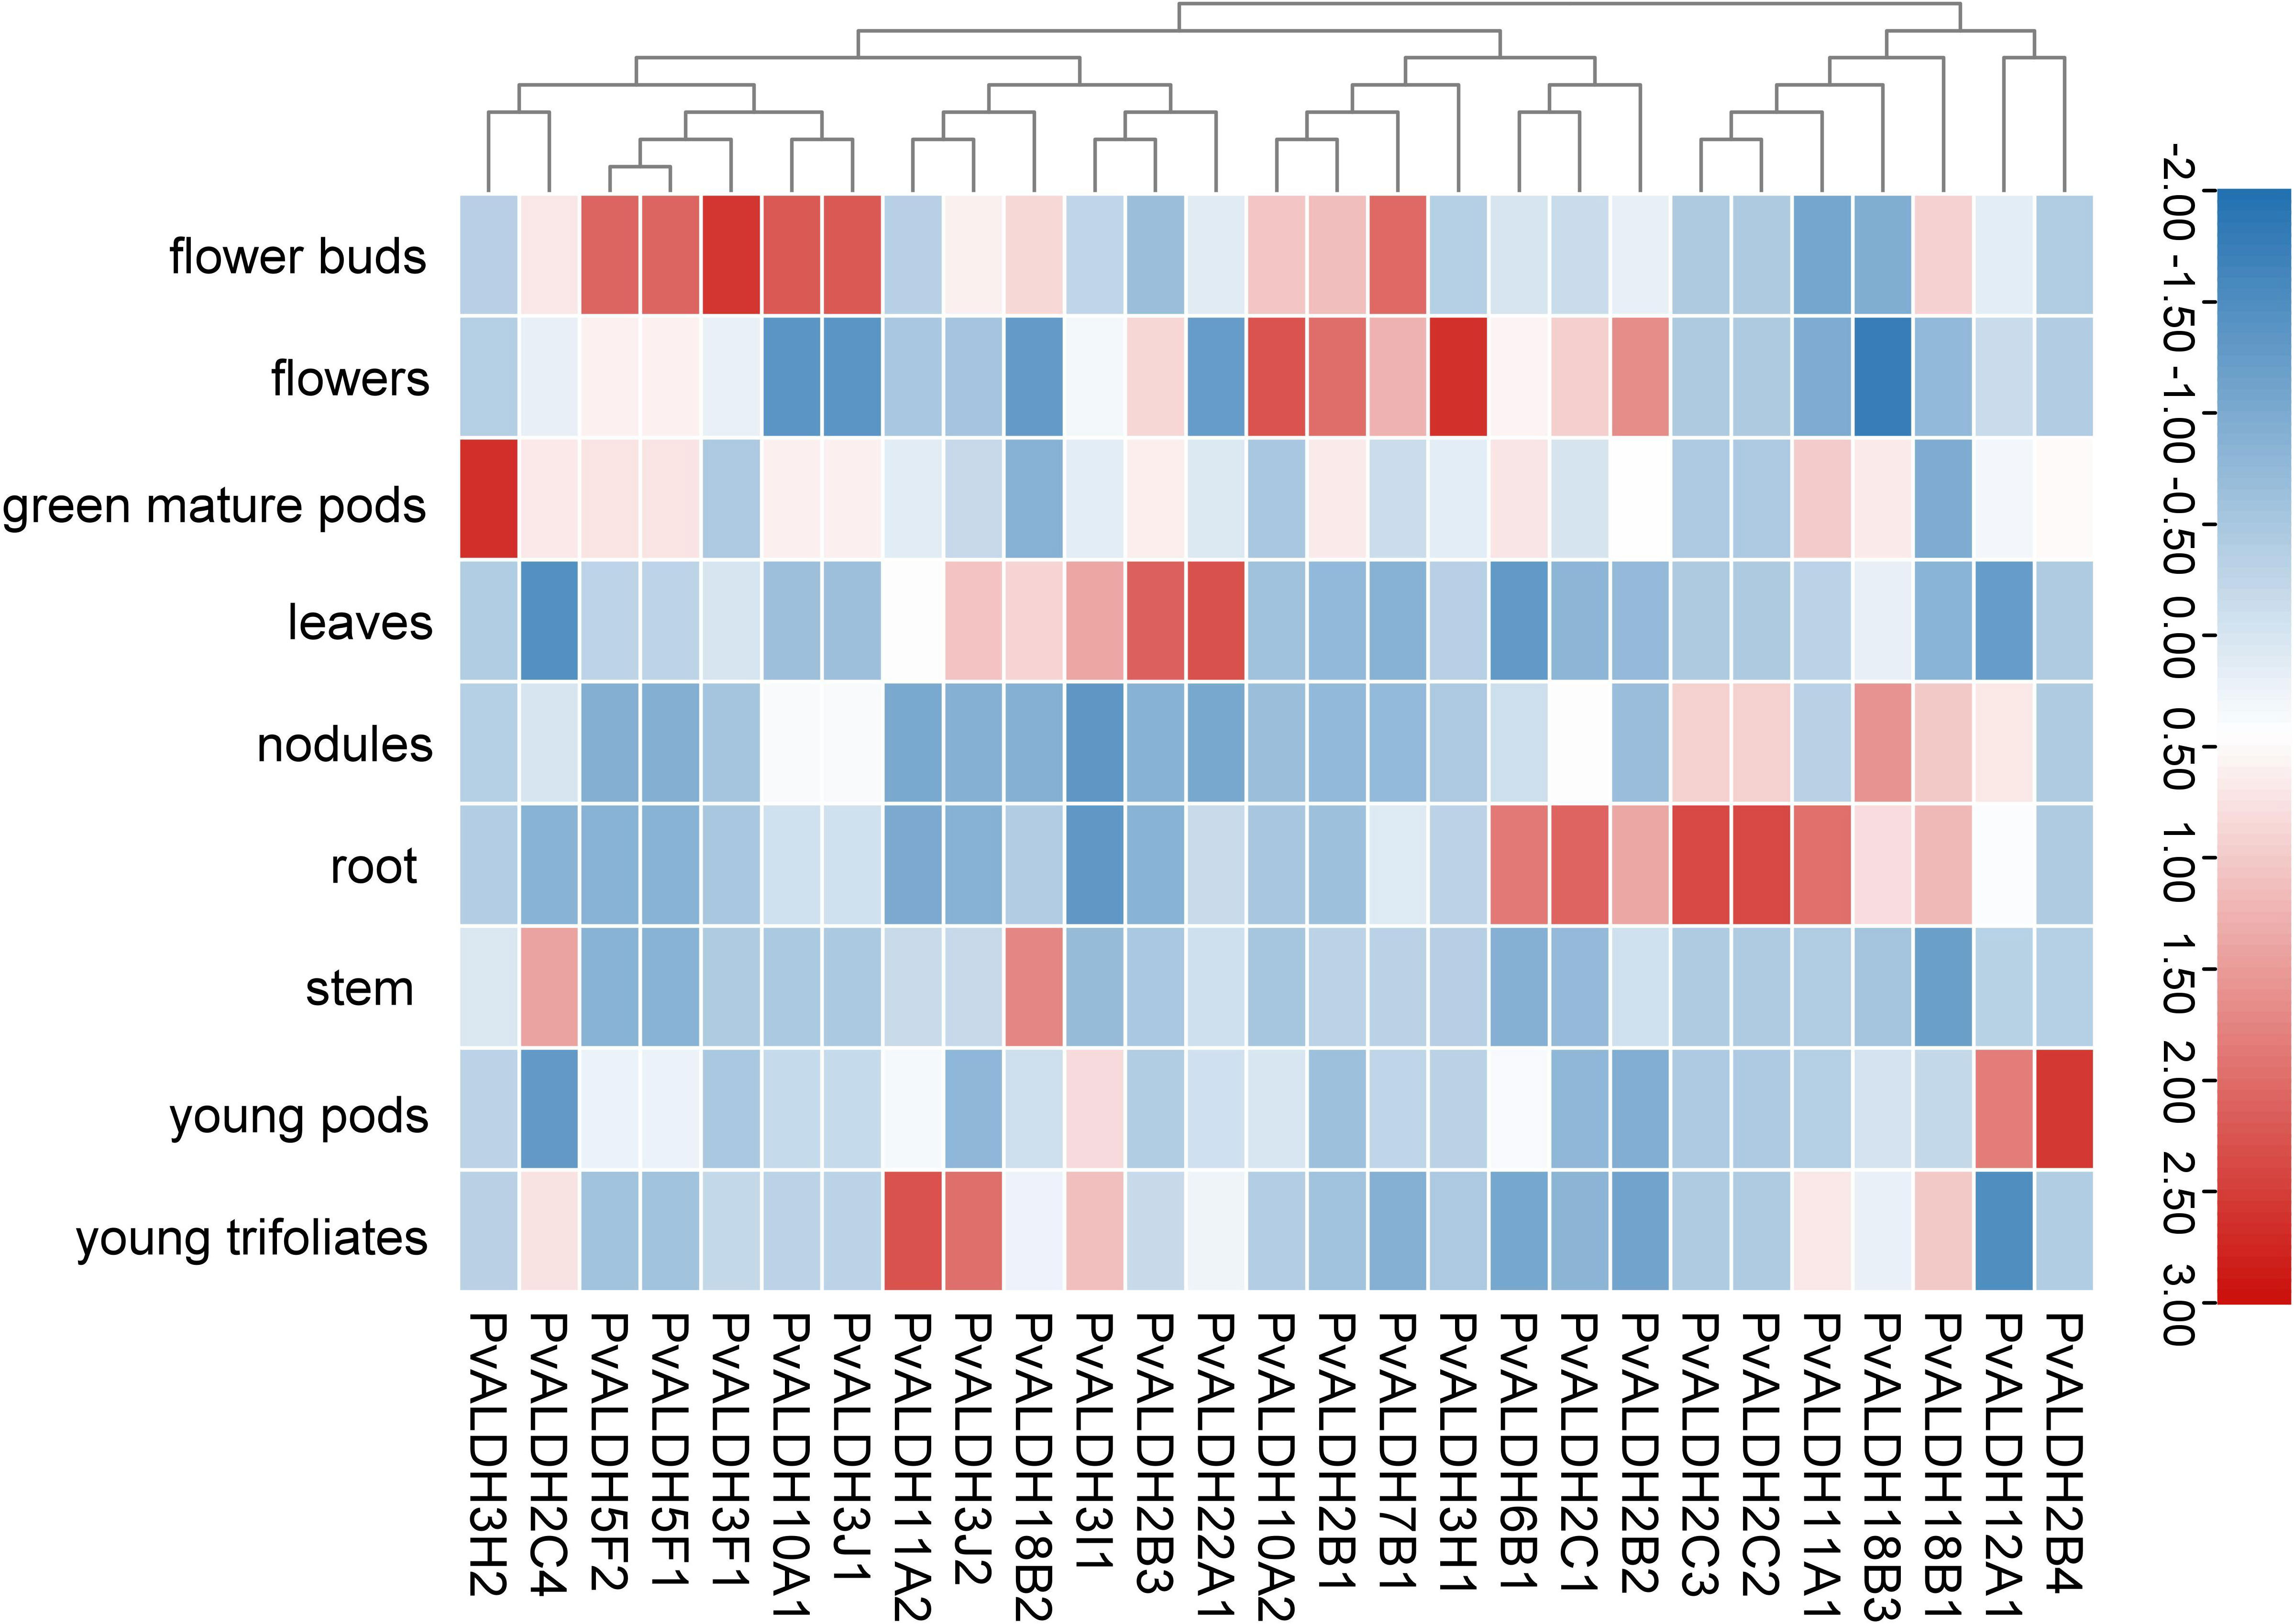
Figure 9 Common bean PvALDH gene expression in different developmental stages and tissues. Expression level is represented by different colors and intensities: deep red is the highest, deep blue is the lowest, and other colors are intermediate layers.
Nine PvALDHs with high expression levels were selected according to their expression patterns during different developmental stages and in different tissues. qRT-PCR was employed to detect the expression of PvALDH in the roots and leaves at various times under NS and AS stresses. Saline–alkali stress resulted in an imbalance in the expression levels of PvALDHs, and under various stress conditions, PvALDHs exhibited different characteristic expressions levels in the leaves and roots. Under NS stress, all other PvALDHs, except for PvALDH6B1, were upregulated in the roots, with PvALDH2C3, PvALDH3H1, PvALDH10A1, and PvALDH10A2 showing a continuous upregulation pattern. However, only PvALDH5F1, PvALDH6B1, PvALDH10A2, and PvALDH22A1 were upregulated in the leaves after exposure to neutral salt stress for 72 h (Figure 10; Supplementary Table S5).
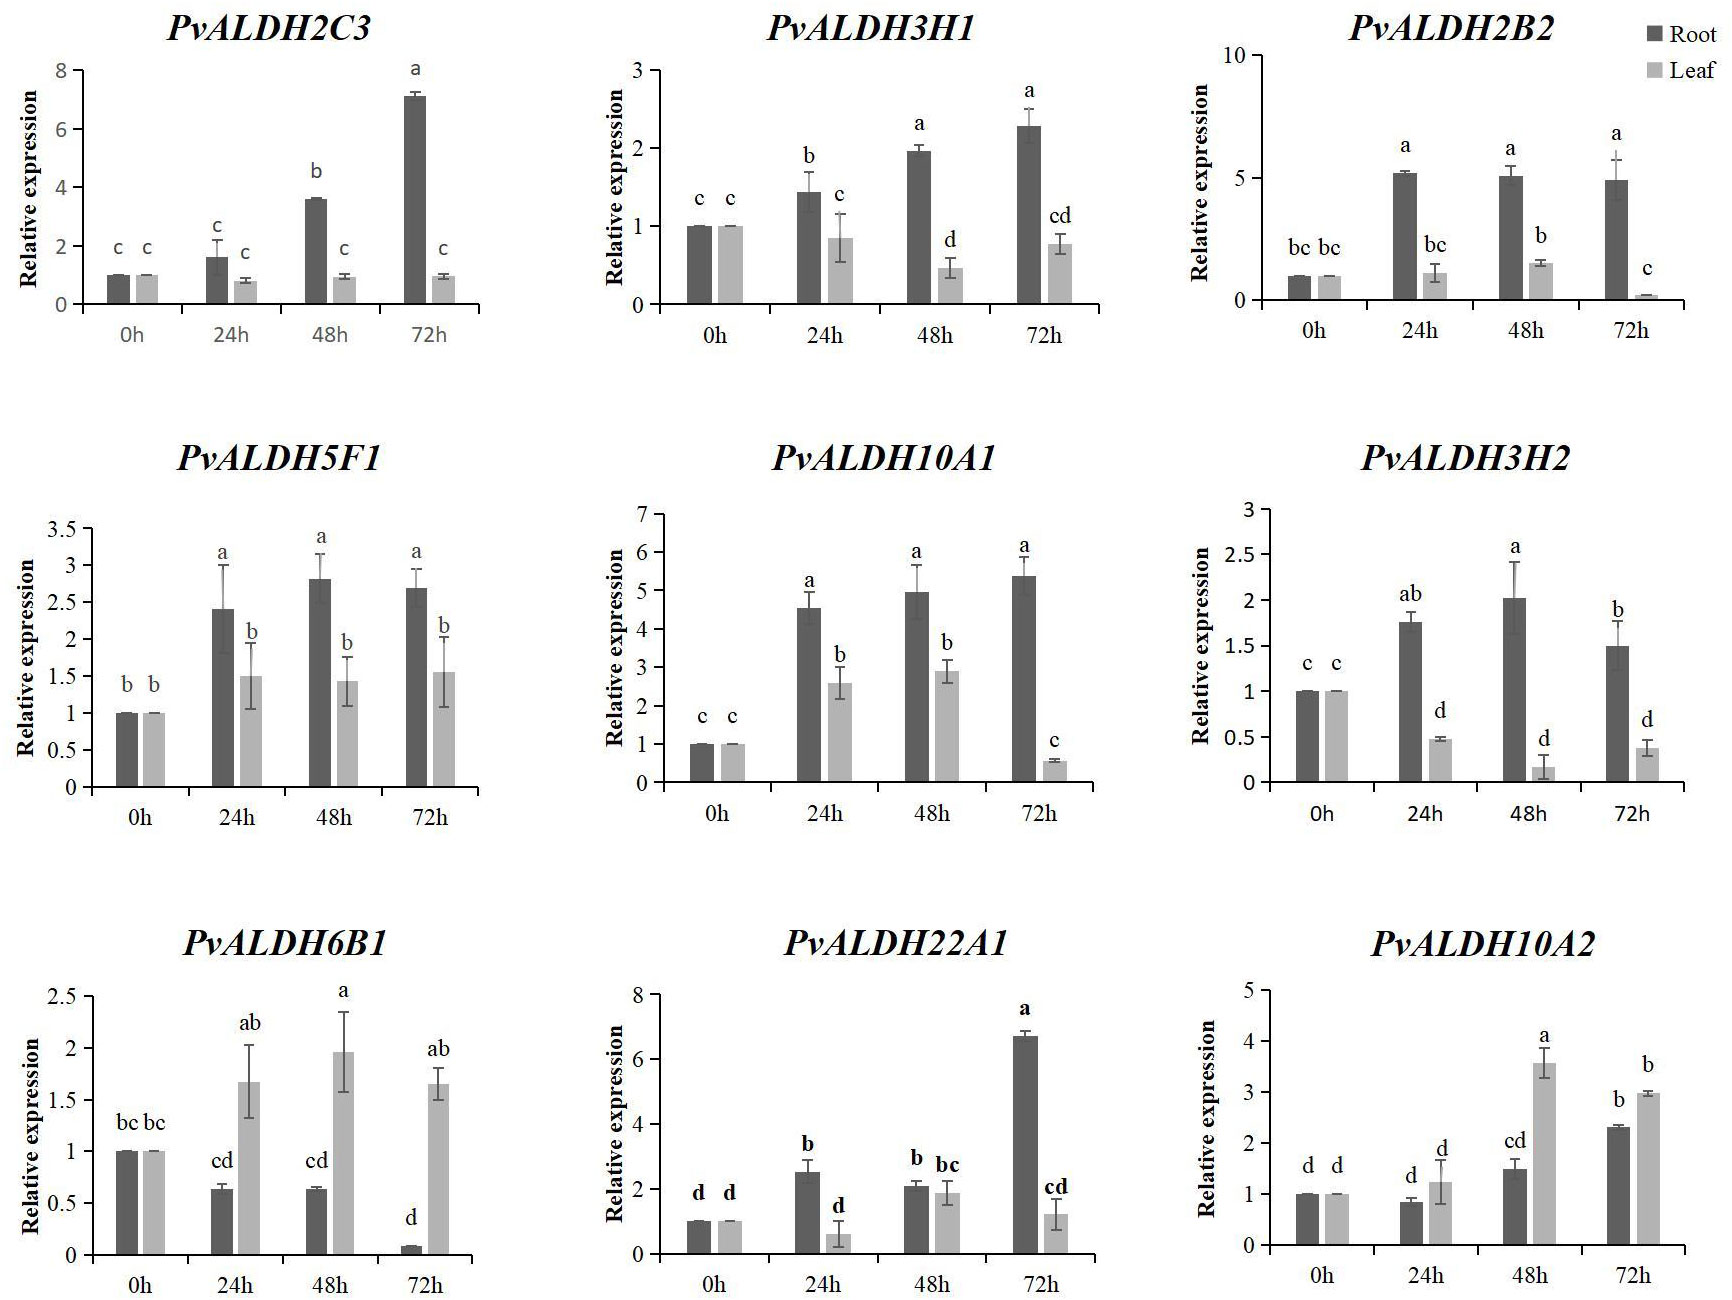
Figure 10 Expression pattern analysis of the PvALDHs under neutral salt stress. Relative expression levels of the PvALDHs at 24, 48, and 72 h were determined using qRT-PCR. The internal control was 0 h, and its relative expression level was 1. All data were normalized. The dark gray column indicates the expression in the root. The light gray column indicates the expression in the leaf. Different letters indicate significant differences in PvALDH expression levels among different tissues after stress treatment at different times (P < 0.05).
After 72 h of AS stress, all nine PvALDHs were upregulated in the roots; however, only PvALDH2C3 continued to be upregulated at all treatment times. Moreover, PvALDH10A1, PvALDH5F1, and PvALDH6B1 were upregulated after 48 h of AS stress. PvALDH3H1, PvALDH2B2, PvALDH10A1, and PvALDH22A1 were significantly upregulated in the leaves after 72 h of stress, whereas PvALDH2C3 and PvALDH3H2 were significantly downregulated (Figure 11; Supplementary Table S5). These results indicate that PvALDH gene family members have different responses and regulatory mechanisms under saline–alkali stress.
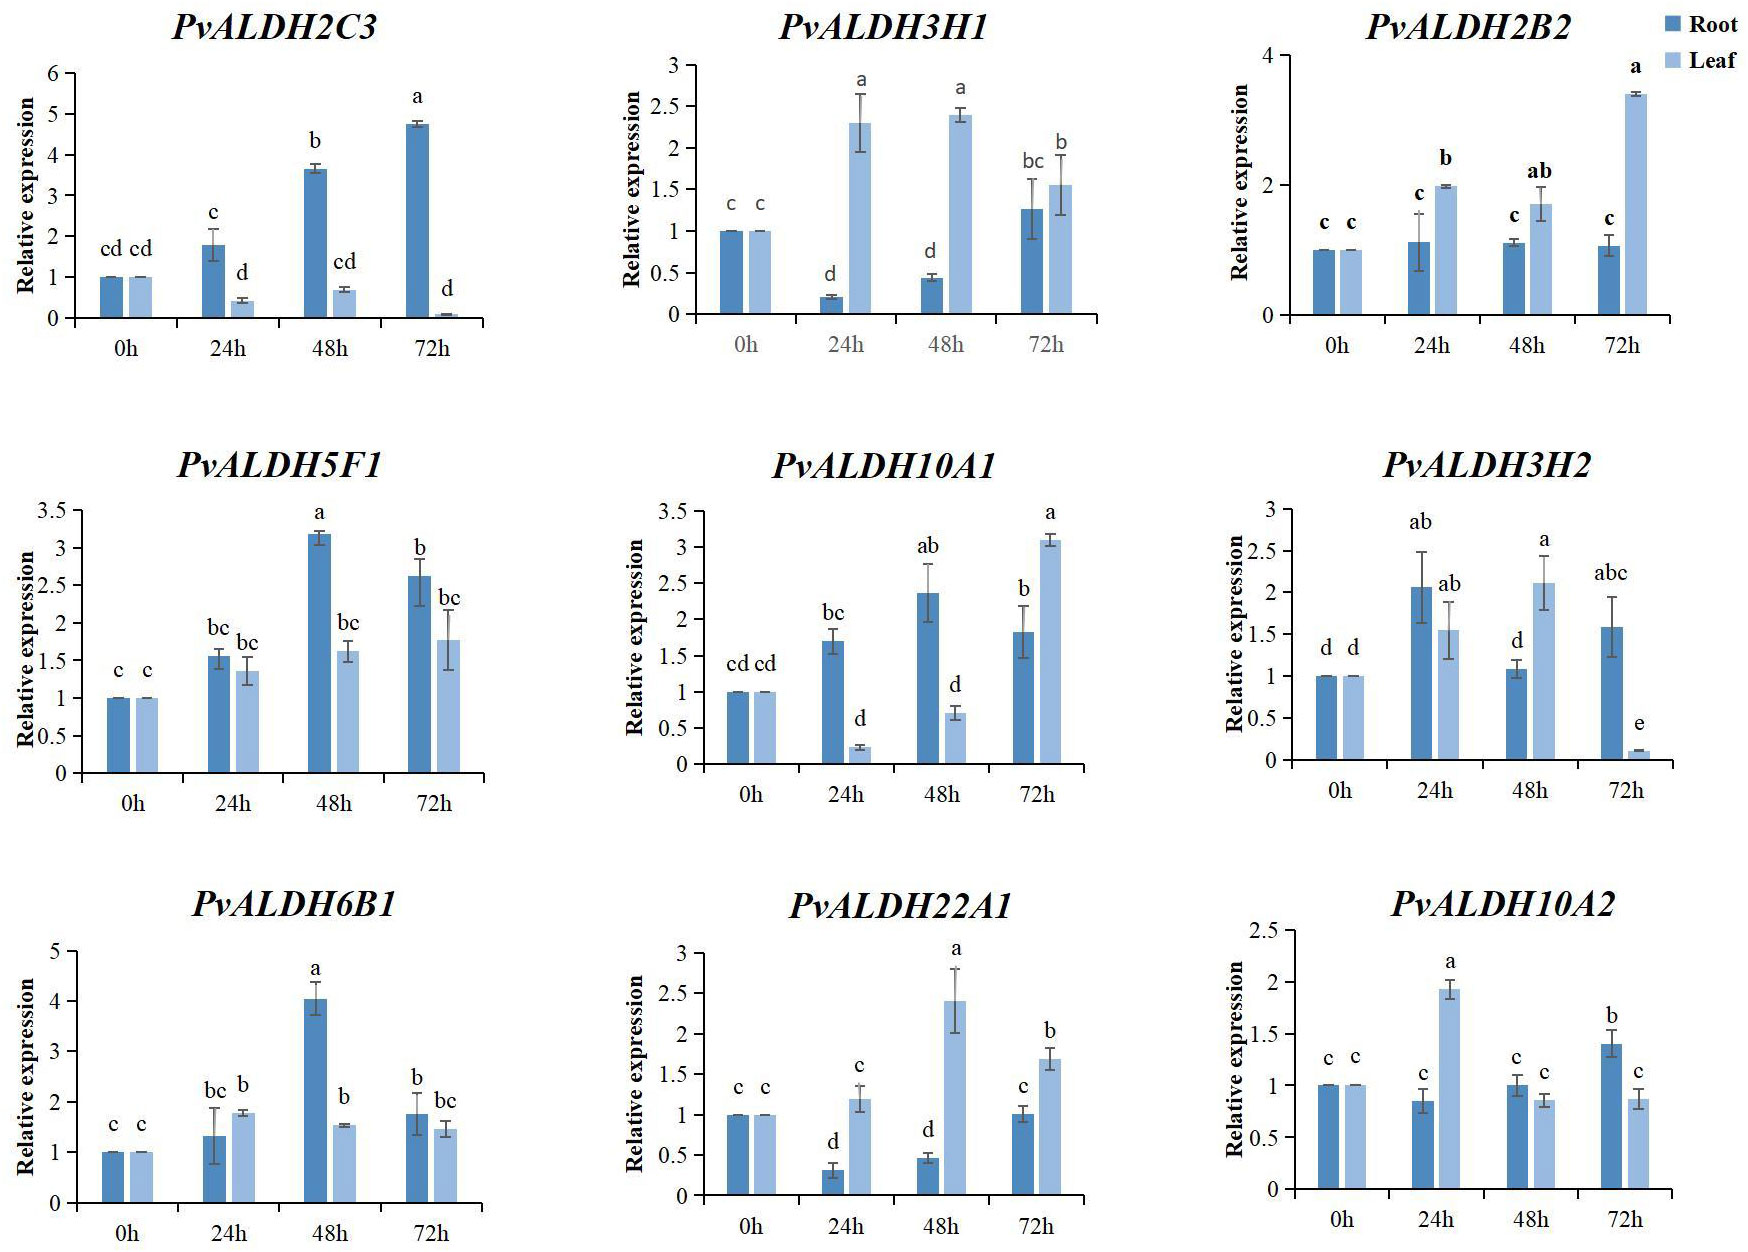
Figure 11 Expression pattern analysis of the PvALDHs under alkaline salt stress. Relative expression levels of the PvALDHs at 24, 48, and 72 h were determined using quantitative real-time polymerase chain reaction. The internal control was 0 h, and its relative expression level was 1. All data were normalized. The dark blue column indicates the expression in the root. The light blue column indicates the expression in the leaf. Different letters indicate significant differences in PvALDH expression levels among different tissues after stress treatment at different times (P < 0.05).
The Self-Optimized Prediction Method with Alignment was employed to forecast varying ratios of extended strands, alpha helices, coils, and beta turns within distinct PvALDH protein structures (Supplementary Table S6). Among the protein secondary structure predictions, the spiral structure accounted for the largest proportion (36.69–49.16%), followed by the random coil (26.99–41.05%), extended strand (13.40–19.13%), and beta-turn structures (4.70–8.92%). Protein glycosylation plays an important role in modifying protein structure and can affect various biological processes, including protein folding, signal transduction, transportation, cell–cell interaction, and immune response (Rudd et al., 1999; Brennan et al., 2011). Glycation analysis and prediction were conducted on the 27 PvALDH proteins, and 15 PvALDH proteins were found to have potential N-glycosylation sites. PvALDH3F1, PvALDH18B1, and PvALDH22A1 were dominant in terms of quantity and exhibited four N-glycosylation sites (Supplementary Table S7). To further understand the structural organization and three-dimensional coordination of ALDH in the common bean, the four saline–alkali stress-responsive proteins PvALDH2B2, PvALDH2C3, PvALDH5F1, and PvALDH10A1 were chosen for homology modeling using the templates of cowpea (Vigna unguiculata; AFDB: A0A0S3R2B5.1.A), peanut (Arachis hypogaea; AFDB: A0A445D2Y8.1.A), common bean (Phaseolus vulgaris; AFDB: V7BT57.1.A) and narrow-leaved lupine (Lupinus angustifolius; AFDB: A0A4P1R3F2.1.A) ALDHs, respectively (Figure 12). MolProbity Ramachandran was then used to plot and verify the accuracy of the generated homologous model (Figure S3). The results revealed that the residues of PvALDH2B2 (Figure 12A), PvALDH2C3 (Figure 12B), PvALDH5F1 (Figure 12C), and PvALDH10A1 (Figure 12D) were placed in favorable regions at 94.4, 97.4, 97.4, and 97.0%, respectively. This result also confirms the accuracy and effectiveness of homology modeling. The diagram generated from homology modeling demonstrated a high degree of structural similarity among the four chosen proteins, particularly regarding shared strands and helices within the Rossmann folding motif (Figure 12). In addition, the analysis of the charge distribution on the selected protein surface showed significant differences in the distribution of positively and negatively charged amino acids on different protein surfaces (Figures 12A–D).
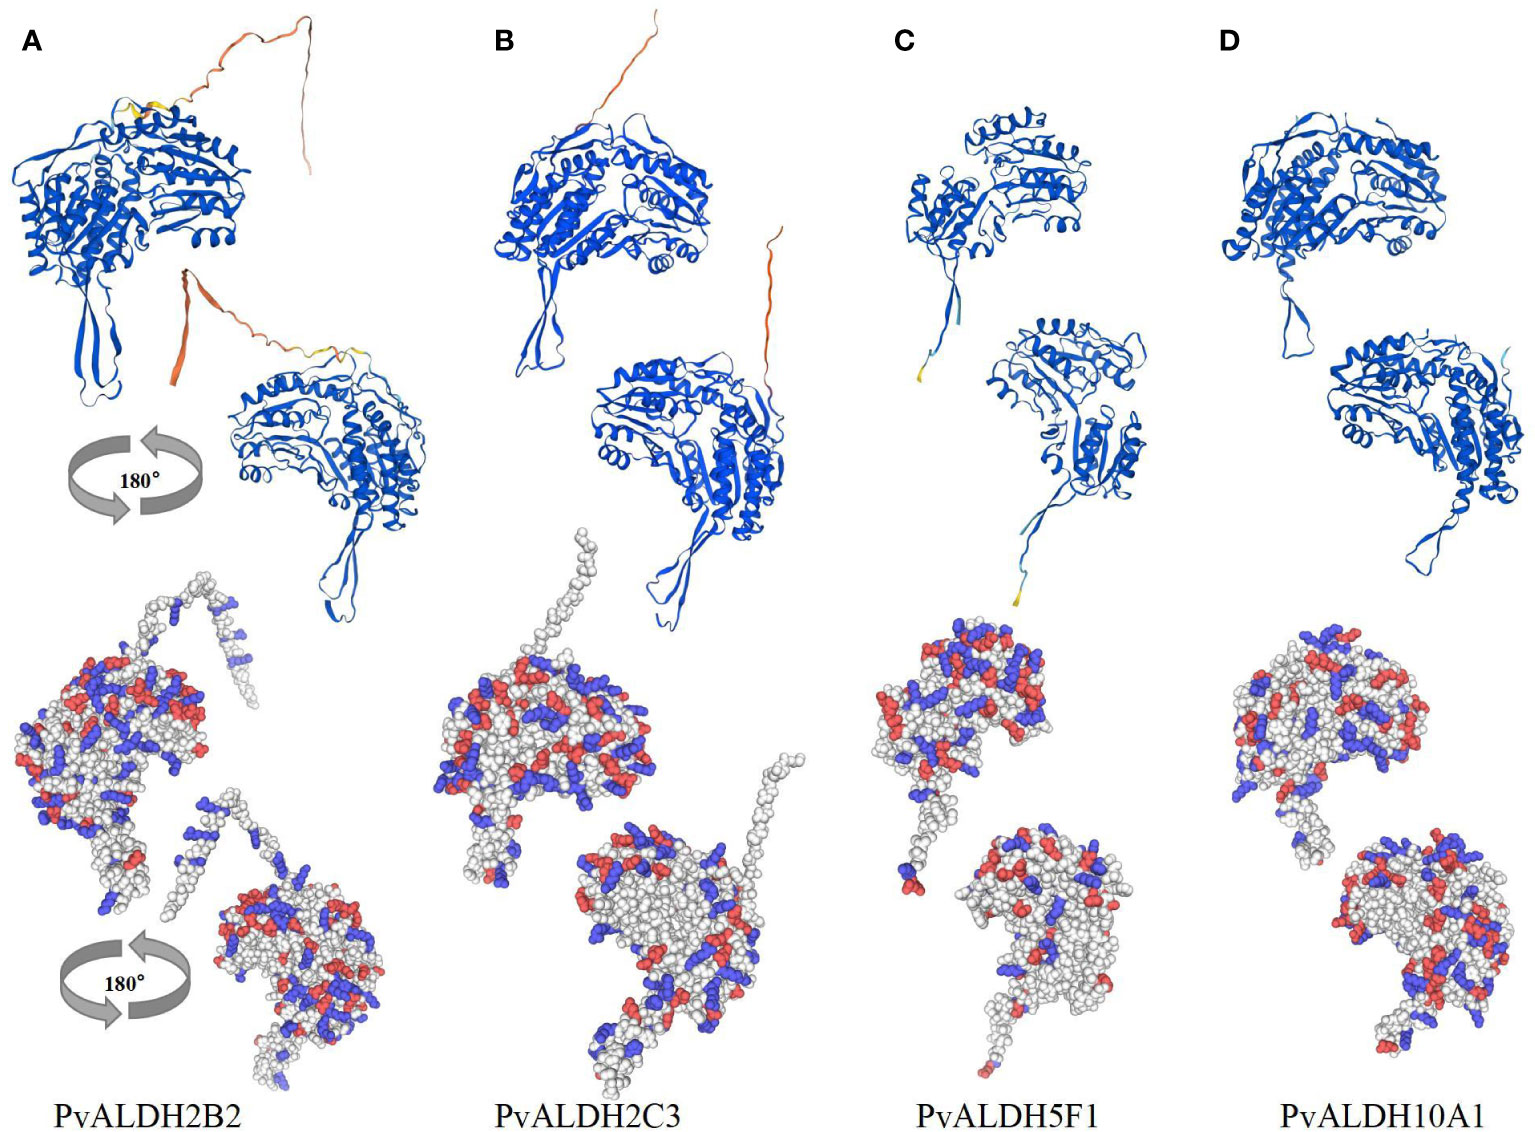
Figure 12 PvALDH protein three-dimensional structure analysis. Four neutral salt and alkaline salt stress-specific proteins, (A) PvALDH2B2, (B) PvALDH2C3, (C) PvALDH5F1, and (D) PvALDH10A1 were selected for homology modeling. By analyzing each protein’s structure, cartoon diagrams were created in two different views (rotated 180°). The surface-charge distribution of the selected proteins was identified, with red and blue denoting negatively and positively charged amino acids, respectively.
Soil salinization is a fundamental abiotic stressor that hinders plant growth, posing a substantial obstacle to the sustainable advancement of the environment and agriculture (Martínez-Cuenca et al., 2013; Guo H. et al., 2020). Salt and alkali stresses can cause adverse effects, such as metabolic disorders, root development inhibition, and photosynthesis performance decline in plants, remarkably decreasing crop yield (Nam et al., 2012; Mo et al., 2020). Approximately 95% of plant biomass accumulation comes from photosynthesis, and inhibition of photosynthesis under stress is one of the key mechanisms that hinder plant growth (Wang et al., 2021). Inhibition of photosynthesis leads to an excess of electrons and energy in the photosynthetic electron transport chain, resulting in a ROS burst and peroxidative damage (Zhang et al., 2020). In this study, compared to those in the control group, the Tr, Ci, Gs, and Pn of common bean leaves were significantly reduced NS–AS stresses (Figures 1D–H). This result is consistent with the response of photosynthesis in Medicago ruthenica seedlings to NS–AS stress (Li et al., 2010). NS–AS stress induces the production of ROS, such as H2O2, O2•-, and •OH in plants, while SOD, CAT, and POD are key protective enzymes to maintain the balance of reactive oxygen species metabolism in the cell, as they can decompose and convert reactive oxygen species into harmless substances (Li et al., 2008). The accumulation of ROS in plant cells can produce oxidative effects on macromolecules, such as cell membranes, nucleic acids, and biological enzymes, disrupting normal physiological processes (Zhao et al., 2019). Under this experimental condition, and compared with those observed in the control treatment group, the levels of O2•-, H2O2, and MDA in the roots and leaves were markedly increased under NS–AS stress (Figures 2A, E, F), indicating that the NS or AS stress treatment caused damage to the cell membranes of common bean plants (Apel and Heribert, 2004). In addition, under NS–AS stress, we observed an increase in the levels of SOD and POD in the leaves; similarly, the levels of SOD, POD, and CAT in the roots were significantly increased. Compared with those under NS stress, the increase in SOD and POD activities under AS stress was more significant (Figures 2B–D). This finding indicates that compared to NS stress, severe oxidative damage cannot be avoided due to the large accumulation of ROS, although AS stress induces higher levels of antioxidant enzyme activity in the common bean. In addition, our findings indicate that AS stress leads to a marked decline in photosynthesis and diminished dry matter accumulation, consequently exerting a more profound inhibitory effect on plant growth, compared with NS stress.
In response to environmental stress hazards, plants produce numerous ROS and toxic compounds, resulting in the accumulation of intracellular aldehydes (Shin et al., 2009; Singh et al., 2013). Lipid peroxidation and respiration induce in the formation of reactive aldehydes, such as MDA and acetaldehyde (Shin et al., 2009). Reactive aldehydes readily form adducts with DNA, RNA, and proteins, leading to impaired cellular homeostasis, enzyme inactivation, DNA damage, and cell death (Nadkarni and Sayre, 1995; Brooks and Theruvathu, 2005; Jacobs and Marnett, 2010). ALDH enzymes use either NAD+ or NADP+ as a cofactor to convert aldehydes to their corresponding carboxylic acids plus NADH or NADPH. Moreover, the ALDH-mediated generation of NADH/NADPH represents a major source of reducing equivalents required for maintaining cellular redox balance (Brocker et al., 2013). In the presence of salt–alkali stress, plants initiate a process where the root system detects the stress signals and progressively conveys them to the above-ground tissues (Fang et al., 2021). The analysis of the change in the trend of ALDH enzyme activity in the common bean root under NS or AS salt stresses showed that with increased stress treatment time, ALDH enzyme activity markedly increased significantly (Figure 3). Moreover, it continued to increase under neutral salt stress. These findings indicate that the ALDH enzyme actively participates in the response and adaptation process of common bean roots to NS and AS stresses. Therefore, this observation further indicates that the ALDH enzyme can effectively transform excess aldehyde in organisms and maintain stable intracellular metabolism. In addition, we found that compared to AS stress, NS stress induced higher ALDHase activity to promote a better response of common beans to the adverse environment. This finding suggests that under AS stress, ALDH enzyme activity may actively participate in the catabolism of toxic aldehydes produced by oxidative damage to the cell membrane induced by ROS accumulation in common bean, reducing the inhibition of enzyme activity and DNA damage by reactive aldehydes and thus alleviating the degree of impaired cellular homeostasis. Therefore, the root may be an important target for studying the functions of the PvALDHs.
Different studies have that identified ALDH family members in a variety of species (Brocker et al., 2013), such as 16 AtALDH members in Arabidopsis thaliana (Hou and Bartels, 2015), 53 AtALDHs members in soybean (Wang et al., 2017), 22 members in maize (Jimenez-Lopez et al., 2010), 20 members in rice (Gao and Han, 2009), 39 members in apples (Li et al., 2013), 29 members in tomatoes (Jimenez-Lopez et al., 2016), 23 members in grapes (Zhang et al., 2012), 19 members in sorghum (Islam et al., 2022), and 22 members in potatoes (Islam et al., 2021). Herein, we discovered 27 PvALDH family members from the common bean (Supplementary Table S2). Compared with that for Arabidopsis (16) and rice (20), the common bean has higher numbers of ALDH family members, although compared with soybean (53), the number is lower, which may be related to the size and evolution of the genomes of the different species (Zhang et al., 2023). Gene duplication constitutes a significant phase in the enlargement of gene clusters, with tandem and segmental duplications emerging as the central mechanisms for this process (Cannon et al., 2004). The position and sequence similarity of PvALDHs on chromosomes were analyzed, and both tandem and fragment duplications were responsible for the expansion of the PvALDH genes, with fragment duplication playing a considerable role (Figure 5; Table 1). These results align with previous reports on rice (Gao and Han, 2009), apples (Li et al., 2013), and grapes (Zhang et al., 2012). In addition, PvALDH2B1, PvALDH2B2, PvALDH2B3, and PvALDH2B4 were collinear with AtALDH2B7 (AT1G23800.1), a gene in Arabidopsis that responds to abscisic acid and drought signals (Depuydt and Vandepoele, 2021). PvALDH10A2 is collinear with AtALDH10A8 (AT1G74920), a gene in Arabidopsis that responds to drought and salt stresses (Missihoun et al., 2011). This finging suggests that PvALDHs have similar functions in common beans and Arabidopsis Thaliana and PvALDHs are crucial in coping with some abiotic stresses in common beans.
An evolutionary relationship analysis was performed to classify the ALDH family members of the common bean (Figure 6), and the PvALDH family members were classified as 10 families (ALDH-2, 3, 5, 6, 7, 10, 11, 12, 18, and 22). Although 14 ALDH families have been discovered in plants, only 10 ALDH families exist in the common bean and other angiosperms, indicating that these 10 families evolved before the differentiation of monocotyledonous and dicotyledonous plants. By contrast, ALDH-19, 21, 23, and 24 were only found in certain plants, and members in the ALDH19 family were only present in tomatoes, indicating that this family played a crucial role in the evolutionary process of this plant (Jimenez-Lopez et al., 2016). Members of the ALDH21 and ALDH23 families were only found in Selaginella moellendorfii and Physcomitrella patens (Chen et al., 2002), while ALDH24 was only found in Chlamydomonas reinhardtii (Wood and Duff, 2009). These results indicate that the ALDH-21, 23, and 24 families may have played a crucial role in the shift from aquatic to terrestrial plants but appear to have become lost during angiosperms evolution. Additional ALDH gene groups were observed in the phylogenetic tree, such as ALDH-1, 4, 8, 9, and 16, which have only been found in mammalian species (such as humans and mice) and have not been found in any plant species.
It may be possible to link changes in exon–intron numbers with gene fragment fusions and rearrangements, indicating that changes to gene structure play a central role in gene family evolution (Xu et al., 2012). This research determined that the structure of PvALDHs in different families showed considerable differences, although the number of exons in PvALDHs within the same subfamily was comparable (Figure 7), indicating that PvALDHs had certain differences among different families. The potential functions of genes can be revealed using a motif analysis of protein sequences because motifs of similar types may exert comparable functions (Bailey et al., 2015; Liu et al., 2021). The motif analyses of PvALDH family members indicated that members of the same subfamily had comparable motifs (Supplementary Figure S2), and these findings are consistent with those reported on soybean (Wang et al., 2017).
Previous reports have suggested that CAEs elements in plant promoters are core factors for transcriptional regulation and play an essential role in modulating the molecular networks of various biological processes, such as abiotic stress responses, phytohormonal responses, and development (Yamaguchi-Shinozaki and Shinozaki, 2005; Ibraheem et al., 2010). The analysis of CAEs in common bean promoters showed that they are related to phytohormones (ERE, ABRE, P-box, GARE-motif, CGTCA-motif, AuxRR-core, TCA-element, TGA-element) and abiotic stress (LTR, ARE, TC-rich element, MBS, Box 4, MRE, I-box, G-box) in PvALDHs, suggesting that the function of PvALDHs may be associated with abiotic stress and phytohormonal responses (Figure 8). Similarly, CAEs such as MBS, LTR, TCA-element P-BOX, and ABRE, have also been found in SbALDHs, StPvALDHs, and GhALDHs (Guo et al., 2017; Islam et al., 2021, 2022). Therefore, MBS, LTR, TCA-element, ARBE, and ARE are common CAEs in ALDH family members and they contribute to certain functions of PvALDHs in the interaction between abiotic stress and phytohormone responses (Zhu et al., 2014).
The expression analysis of PvALDH family members in various developmental stages and tissue parts of the common bean revealed that PvALDHs exhibited high expression levels in the roots (Figure 9), which is similar to the results of the tissue-specific expression analyses of GhALDHs, GmALDHs, and SiALDHs (Dong et al., 2017; Wang et al., 2017). The function of ALDHs has been thoroughly examined in various plants, and the family members are involved in several biosynthetic and catabolic pathways. For example, members of the ALDH2 family are involved in the metabolism of acetaldehyde, whereas ALDH6 family constituents act as methyl-malonyl-semialdehyde-dehydrogenases, facilitating reactions associated with pyrimidine and valine catabolism (Brocker et al., 2013). Apart from their roles in different metabolic and biosynthetic aspects, several ALDHs are responsible for coping with diverse abiotic stresses, including salinity, drought, cold, heat, ABA, and PEG (Huang et al., 2008; Stiti et al., 2011; Chen et al., 2015). According to previous reports, ALDH genes across a wide range of plant or crop species displayed similar fluctuations in expression patterns under varying abiotic stresses. For example, under drought stress, OsALDH2–4 in rice and GmALDH2B2 in soybean are both upregulated (Gao and Han, 2009; Wang et al., 2017). Under salinity, drought, and heat stress, StALDH12A1, StALDH7A1, and StALDH2B6 transcripts (BARI Alu-7) were upregulated in a Bangladeshi potato variety (Islam et al., 2021). In this study, PvALDH2C3, PvALDH5F1, and PvALDH10A1 were significantly upregulated in the roots under NS or AS stresses, while only PvALDH6B1 was significantly downregulated under neutral salt stress (Figures 10, 11). Combined with the prediction of N-glycosylation sites of the PvALDH protein, the aforementioned PvALDHs play crucial roles in the response of the common bean to neutral or alkaline salts or other abiotic stresses.
Compared with NS stress, AS stress induces higher levels of antioxidant enzyme activity in the common beans, however, severe oxidative damage remains inevitable due to the substantial accumulation of ROS. Moreover, photosynthetic performance is markedly impaired, with reduced dry matter accumulation, which substantially inhibits plant growth. The ALDH enzyme in common beans actively responds to NS or AS stresses by inducing the expression of PvALDH genes. Furthermore, a total of 27 ALDH family members were discovered from the common bean reference genome and grouped into 10 families. PvALDHs within a similar subfamily had comparable motifs and gene structures. ALDHs in common bean have expanded based on segmental and tandem duplications, with segmental duplication playing a dominant role. A collinearity analysis indicated that PvALDHs may be necessary for abiotic stress response, and abiotic stress and phytohormone response CAEs are also found in promoter regions. PvALDHs exhibit tissue-specific expression in the different developmental stages and parts of common beans, and the root system is an important target tissue for further studies on PvALDHs. Additionally, the levels of PvALDH2C3, PvALDH5F1, and PvALDH10A1 in common bean root were markedly upregulated, while PvALDH6B1 was markedly downregulated under NS–AS stress, which further indicated that PvALDHs play a regulatory role in plant response to NS–AS stress. This study adds to the theoretical knowledge of ALDHs in common bean and provides a foundation for further investigations of the function of common bean ALDHs in abiotic stress responses.
The datasets presented in this study can be found in online repositories. The names of the repository/repositories and accession number(s) can be found in the article/Supplementary Material.
XW: Writing – original draft, Data curation, Formal Analysis, Investigation, Methodology, Software, Visualization. MW: Data curation, Formal Analysis, Investigation, Methodology, Software, Writing – original draft, Project administration, Resources. SY: Project administration, Writing – original draft, Conceptualization, Funding acquisition, Supervision, Writing – review & editing. LZ: Data curation, Formal Analysis, Investigation, Methodology, Resources, Software, Writing – original draft. XZ: Data curation, Investigation, Methodology, Resources, Writing – original draft. LY: Conceptualization, Funding acquisition, Project administration, Supervision, Writing – review & editing. YZ: Conceptualization, Funding acquisition, Project administration, Supervision, Validation, Writing – original draft.
The author(s) declare financial support was received for the research, authorship, and/or publication of this article. This study was supported by the National Key Research and Development Program of China (Grant number: 2020YFD1001402) and the Postdoctoral Science Foundation Funded General Project of Heilongjiang Province (Grant number: LBH-Z19195).
We are grateful to the National Coarse Cereals Engineering Research Center of China for providing support in carrying out the experiments.
The authors declare that the research was conducted in the absence of any commercial or financial relationships that could be construed as a potential conflict of interest.
All claims expressed in this article are solely those of the authors and do not necessarily represent those of their affiliated organizations, or those of the publisher, the editors and the reviewers. Any product that may be evaluated in this article, or claim that may be made by its manufacturer, is not guaranteed or endorsed by the publisher.
The Supplementary Material for this article can be found online at: https://www.frontiersin.org/articles/10.3389/fpls.2024.1283845/full#supplementary-material
Apel, K., Heribert, H. (2004). Reactive oxygen species: Metabolism, oxidative stress, and signal transduction. Annu. Rev. Plant Biol. 55, 373–399. doi: 10.1146/annurev.arplant.55.031903.141701
Bailey, T. L., Johnson, J., Grant, C. E., Noble, W. S. (2015). The MEME suite. Nucleic Acids Res. 43, W39–W49. doi: 10.1093/nar/gkv416
Beebe, S. E., Rao, I. M., Blair, M. W., Acosta-Gallegos, J. A. (2013). Phenotyping common beans for adaptation to drought. Front. Physiol. 4. doi: 10.3389/fphys.2013.00035
Brennan, A. J., Chia, J., Browne, K. A., Ciccone, A., Ellis, S., Lopez, J. A., et al. (2011). Protection from endogenous perforin: Glycans and the C terminus regulate exocytic trafficking in cytotoxic lymphocytes. Immunity. 34, 879–892. doi: 10.1016/j.immuni.2011.04.007
Brocker, C., Vasiliou, M., Carpenter, S., Carpenter, C., Zhang, Y., Wang, X., et al. (2013). Aldehyde dehydrogenase (ALDH) superfamily in plants: Gene nomenclature and comparative genomics. Planta. 237, 189–210. doi: 10.1007/s00425-012-1749-0
Brooks, P. J., Theruvathu, J. A. (2005). DNA adducts from acetaldehyde: implications for alcohol-related carcinogenesis. Alcohol 35, 187–193. doi: 10.1016/j.alcohol.2005.03.009
Cannon, S. B., Mitra, A., Baumgarten, A., Young, N. D., May, G. (2004). The roles of segmental and tandem gene duplication in the evolution of large gene families in Arabidopsis thaliana. BMC Plant Biol. 4, 10. doi: 10.1186/1471-2229-4-10
Cao, Y., Wang, J., Zhao, S., Fang, Q., Ruan, J., Li, S., et al. (2023). Overexpression of the aldehyde dehydrogenase AhALDH3H1 from Arachis hypogaea in soybean increases saline-alkali stress tolerance. Front. Plant Science. 14. doi: 10.3389/fpls.2023.1165384
Chance, B., Maehly, A. C. (1955). Assay of catalases and peroxidases. Methods Enzymology. 2, 764–775. doi: 10.1016/S0076-6879(55)02300-8
Chen, C., Chen, H., Zhang, Y., Thomas, H. R., Frank, M. H., He, Y., et al. (2020). TBtools: An integrative toolkit developed for interactive analyses of big Biological Data. Mol. Plant 13, 1194–1202. doi: 10.1016/j.molp.2020.06.009
Chen, J., Wei, B., Li, G., Fan, R., Zhong, Y., Wang, X., et al. (2015). TraeALDH7B1-5A, encoding aldehyde dehydrogenase 7 in wheat, confers improved drought tolerance in Arabidopsis. Planta. 242, 137–151. doi: 10.1007/s00425-015-2290-8
Chen, X., Zeng, Q., Wood, A. J. (2002). The stress-responsive Tortula ruralis gene ALDH21A1 describes a novel eukaryotic aldehyde dehydrogenase protein family. J. Plant Physiol. 159, 677–684. doi: 10.1078/0176-1617-0813
Chou, K. C., Shen, H. B. (2010). Plant-mPLoc: A top-down strategy to augment the power for predicting plant protein subcellular localization. PloS One 5, e11335. doi: 10.1371/journal.pone.0011335
Chung, H.-J., Liu, Q., Peter Pauls, K., Fan, M. Z., Yada, R. (2008). In vitro starch digestibility, expected glycemic index and some physicochemical properties of starch and flour from common bean (Phaseolus vulgaris L.) varieties grown in Canada. Food Res. Int. 41, 869–875. doi: 10.1016/j.foodres.2008.03.013
De Azevedo Neto, A. D., Prisco, J. T., Enéas-Filho, J., Medeiros, J. V., Gomes-Filho, E. (2005). Hydrogen peroxide pre-treatment induces salt-stress acclimation in maize plants. J. Plant Physiol. 162, 1114–1122. doi: 10.1016/j.jplph.2005.01.007
Depuydt, T., Vandepoele, K. (2021). Multi-omics network-based functional annotation of unknown Arabidopsis genes. Plant J. 108, 1193–1212. doi: 10.1111/tpj.15507
Dong, Y., Liu, H., Zhang, Y., Hu, J., Feng, J., Li, C., et al. (2017). Comparative genomic study of ALDH gene superfamily in Gossypium: A focus on Gossypium hirsutum under salt stress. PloS One 12, e0176733. doi: 10.1371/journal.pone.0176733
Duc, G., Agrama, H., Bao, S., Berger, J., Bourion, V., De Ron, A. M., et al. (2015). Breeding annual grain legumes for sustainable agriculture: New methods to approach complex traits and target new cultivar ideotypes. Crit. Re. Plant Sci. 34, 381–411. doi: 10.1080/07352689.2014.898469
Elstner, E., Stoffer, C., Heupel, A. (1975). Determination of superoxide free radical ion and hydrogen peroxide as products of photosynthetic oxygen reduction. Z. für Naturforschung C. 30, 53–57. doi: 10.1515/znc-1975-1-211
Fang, S. M., Hou, X., Liang, X. L. (2021). Response mechanisms of plants under saline-alkali stress. Front. Plant Sci. 12. doi: 10.3389/fpls.2021.667458
Finn, R. D., Bateman, A., Clements, J., Coggill, P., Eberhardt, R. Y., Eddy, S. R., et al. (2014). Pfam: The protein families database. Nucleic Acids Res. 42, 222–230. doi: 10.1093/nar/gkt1223
Finn, R. D., Clements, J., Arndt, W., Miller, B. L., Wheeler, T. J., Schreiber, F., et al. (2015). HMMER web server: 2015 update. Nucleic Acids Res. 43, W30–W38. doi: 10.1093/nar/gkv397
Gao, C., Han, B. (2009). Evolutionary and expression study of the aldehyde dehydrogenase (ALDH) gene superfamily in rice (Oryza sativa). Gene. 431, 86–94. doi: 10.1016/j.gene.2008.11.010
García-Ríos, M., Fujita, T., Larosa, P. C., Locy, R. D., Clithero, J. M., Bressan, R. A., et al. (1997). Cloning of a polycistronic cDNA from tomato encoding γ-glutamyl kinase and γ-glutamyl phosphate reductase. Proc. Natl. Acad. Sci. U. S. A. 94, 8249–8254. doi: 10.1073/pnas.94.15.8249
Gautam, R., Meena, R. K., Woch, N., Kirti, P. B. (2020). Ectopic expression of BrALDH7B2 gene encoding an antiquitin from Brassica rapa confers tolerance to abiotic stresses and improves photosynthetic performance under salt stress in tobacco. Environ. Exp. Bot. 180, 104223. doi: 10.1016/j.envexpbot.2020.104223
Giannopolitis, C. N., Ries, S. K. (1977). Superoxide dismutases: I. Occurrence in higher plants. Plant Physiol. 59, 309–314. doi: 10.1104/pp.59.2.309
Guindon, S., Gascuel, O. (2003). A simple, fast, and accurate algorithm to estimate large phylogenies by maximum likelihood. Syst. Biol. 52, 696–704. doi: 10.1080/10635150390235520
Guo, H., Huang, Z., Li, M., Hou, Z. (2020). Growth, ionic homeostasis, and physiological responses of cotton under different salt and alkali stresses. Sci. Rep. 10, 21844. doi: 10.1038/s41598-020-79045-z
Guo, J., Sun, W., Liu, H., Chi, J., Odiba, A. S., Li, G., et al. (2020). Aldehyde dehydrogenase plays crucial roles in response to lower temperature stress in Solanum tuberosum and Nicotiana benthamiana. Plant Sci. 297, 110525. doi: 10.1016/j.plantsci.2020.110525
Guo, X., Wang, Y., Lu, H., Cai, X., Wang, X., Zhou, Z., et al. (2017). Genome-wide characterization and expression analysis of the aldehyde dehydrogenase (ALDH) gene superfamily under abiotic stresses in cotton. Gene. 628, 230–245. doi: 10.1016/j.gene.2017.07.034
Hasan, M. S., Singh, V., Islam, S., Islam, M. S., Ahsan, R., Kaundal, A., et al. (2021). Genome-wide identification and expression profiling of glutathione S-transferase family under multiple abiotic and biotic stresses in Medicago truncatula L. PloS One 16, e0247170. doi: 10.1371/journal.pone.0247170
Havir, E. A., McHale, N. A. (1987). Biochemical and developmental characterization of multiple forms of catalase in tobacco leaves. Plant Physiol. 84, 450–455. doi: 10.1104/pp.84.2.450
Hayat, I., Ahmad, A., Masud, T., Ahmed, A., Bashir, S. (2014). Nutritional and health perspectives of beans (Phaseolus vulgaris L.): An overview. Crit. Rev. Food Sci. Nutr. 54, 580–592. doi: 10.1080/10408398.2011.596639
Hodges, M., DeLong, J. M., Forney, C. F., Prange, P. K. (1999). Improving the thiobarbituric acid-reactive-substances assay for estimating lipid peroxidation in plant tissues containing anthocyanin and other interfering compounds. Planta. 207, 604–611. doi: 10.1007/s004250050524
Hou, Q., Bartels, D. (2015). Comparative study of the aldehyde dehydrogenase (ALDH) gene superfamily in the glycophyte Arabidopsis thaliana and Eutrema halophytes. Ann. Bot. 115, 465–479. doi: 10.1093/aob/mcu152
Huang, W., Ma, X., Wang, Q., Gao, Y., Xue, Y., Niu, X., et al. (2008). Significant improvement of stress tolerance in tobacco plants by overexpressing a stress-responsive aldehyde dehydrogenase gene from maize (Zea mays). Plant Mol. Biol. 68, 451–463. doi: 10.1007/s11103-008-9382-9
Ibraheem, O., Botha, C. E. J., Bradley, G. (2010). In silico analysis of cis-acting regulatory elements in 5′ regulatory regions of sucrose transporter gene families in rice (Oryza sativa japonica) and Arabidopsis thaliana. Comput. Biol. Chem. 34, 268–283. doi: 10.1016/j.compbiolchem.2010.09.003
Islam, M. S., Hasan, M. S., Hasan, M. N., Prodhan, S. H., Islam, T., Ghosh, A. (2021). Genome-wide identification, evolution, and transcript profiling of aldehyde dehydrogenase superfamily in potato during development stages and stress conditions. Sci. Rep. 11, 18284. doi: 10.1038/s41598-021-97691-9
Islam, M. S., Mohtasim, M., Islam, T., Ghosh, A. (2022). Aldehyde dehydrogenase superfamily in sorghum: Genome-wide identification, evolution, and transcript profiling during development stages and stress conditions. BMC Plant Biol. 22, 316. doi: 10.1186/s12870-022-03708-4
Islam, S., Sajib, S. D., Jui, Z. S., Arabia, S., Islam, T., Ghosh, A. (2019). Genome-wide identification of glutathione S-transferase gene family in pepper, its classification, and expression profiling under different anatomical and environmental conditions. Sci. Rep. 9, 9101. doi: 10.1038/s41598-019-45320-x
Jacobs, A. T., Marnett, L. J. (2010). Systems analysis of protein modification and cellular responses induced by electrophile stress. Accounts Chem. Res. 43, 673–683. doi: 10.1021/ar900286y
Jimenez-Lopez, J. C., Gachomo, E. W., Seufferheld, M. J., Kotchoni, S. O. (2010). The maize ALDH protein superfamily: Linking structural features to functional specificities. BMC Struct. Biol. 10, 43. doi: 10.1186/1472-6807-10-43
Jimenez-Lopez, J. C., Lopez-Valverde, F. J., Robles-Bolivar, P., Lima-Cabello, E., Gachomo, E. W., Kotchoni, S. O. (2016). Genome-wide identification and functional classification of tomato (Solanum lycopersicum) aldehyde dehydrogenase (ALDH) gene superfamily. PloS One 11, e0164798. doi: 10.1371/journal.pone.0164798
Kirch, H. H., Schlingensiepen, S., Kotchoni, S., Sunkar, R., Bartels, D. (2005). Detailed expression analysis of selected genes of the aldehyde dehydrogenase (ALDH) gene superfamily in Arabidopsis thaliana. Plant Mol. Biol. 57, 315–332. doi: 10.1007/s11103-004-7796-6
Kotchoni, S. O., Kuhns, C., Ditzer, A., Kirch, H. H., Bartels, D. (2006). Over-expression of different aldehyde dehydrogenase genes in Arabidopsis thaliana confers tolerance to abiotic stress and protects plants against lipid peroxidation and oxidative stress. Plant Cell Environ. 29, 1033–1048. doi: 10.1111/j.1365-3040.2005.01458.x
Krzywinski, M., Schein, J., Birol, I., Connors, J., Gascoyne, R., Horsman, D., et al. (2009). Circos: An information aesthetic for comparative genomics. Genome Res. 19, 1639–1645. doi: 10.1101/gr.092759.109
Kumar, S., Stecher, G., Li, M., Knyaz, C., Tamura, K. (2018). MEGA X: Molecular evolutionary genetics analysis across computing platforms. Mol. Biol. Evol. 35, 1547–1549. doi: 10.1093/molbev/msy096
Li, X., Guo, R., Li, J., Singer, S. D., Zhang, Y., Yin, X., et al. (2013). Genome-wide identification and analysis of the aldehyde dehydrogenase (ALDH) gene superfamily in apple (Malus × domestica Borkh.). Plant Physiol. Biochem. 71, 268–282. doi: 10.1016/j.plaphy.2013.07.017
Li, Q. Y., Niu, H. B., Yin., J., Wang, M. B., Shao H, B., Deng, D. Z., et al. (2008). Protective role of exogenous nitric oxide against oxidative-stress induced by salt stress in barley (Hordeum vulgare). Colloids Surfaces B: Biointerfaces. 65, 220–225. doi: 10.1016/j.colsurfb.2008.04.007
Li, R., Shi, F., Fukuda, K., Yang, Y. (2010). Effects of salt and alkali stresses on germination, growth, photosynthesis and ion accumulation in alfalfa (Medicago sativa L.). Soil Sci. Plant Nutr. 56, 725–733. doi: 10.1111/j.1747-0765.2010.00506.x
Liu, Y., Zeng, Z., Zhang, Y. M., Li, Q., Jiang, X. M., Jiang, Z., et al. (2021). An angiosperm NLR atlas reveals that NLR gene reduction is associated with ecological specialization and signal transduction component deletion. Mol. Plant 14, 2015–2031. doi: 10.1016/j.molp.2021.08.001
Lynch, M., Conery, J. S. (2000). The evolutionary fate and consequences of duplicate genes. Science. 290, 1151–1155. doi: 10.1126/science.290.5494.1151
Marchitti, S. A., Brocker, C., Stagos, D., Vasiliou, V. (2008). Non-P450 aldehyde oxidizing enzymes: The aldehyde dehydrogenase superfamily. Expert Opin. Drug Metab. Toxicol. 4, 697–720. doi: 10.1517/17425255.4.6.697
Martínez-Cuenca, M., Iglesias, D. J., Forner-Giner, M. A., Primo-Millo, E., Legaz, F. (2013). The effect of sodium bicarbonate on plant performance and iron acquisition system of FA-5 (Forner-Alcaide 5) citrus seedlings. Acta Physiol. Plant 35, 2833–2845. doi: 10.1007/s11738-013-1317-7
Missihoun, T. D., Kotchoni, S. O., Bartels, D. (2018). Aldehyde dehydrogenases function in the homeostasis of pyridine nucleotides in Arabidopsis thaliana. Sci. Rep. 8, 2936. doi: 10.1038/s41598-018-21202-6
Missihoun, T. D., Schmitz, J., Klug, R., Kirch, H. H., Bartels, D. (2011). Betaine aldehyde dehydrogenase genes from Arabidopsis with different sub-cellular localization affect stress responses. Planta. 233, 369–382. doi: 10.1007/s00425-010-1297-4
Mo, W., Tang, W., Du, Y., Jing, Y., Bu, Q., Lin, R. (2020). PHYTOCHROME-INTERACTING FACTOR-LIKE14 and SLENDER RICE1 interaction controls seedling growth under salt stress. Plant Physiol. 184, 506–517. doi: 10.1104/pp.20.00024
Nadkarni, D. V., Sayre, L. M. (1995). Structural definition of early lysine and histidine adduction chemistry of 4-hydroxynonenal. Chem. Res. Toxicology. 8, 284–291. doi: 10.1021/tx00044a014
Nam, M. H., Huh, S. M., Kim, K. M., Park, W. J., Seo, J. B., Cho, K., et al. (2012). Comparative proteomic analysis of early salt stress-responsive proteins in roots of SnRK2 transgenic rice. Proteome Sci. 10, 25. doi: 10.1186/1477-5956-10-25
Rudd, P. M., Wormald, M. R., Dwek, R. A. (1999). Glycosylation and the immune aystem. Trends Glycoscience Glycotechnology. 11, 1–21. doi: 10.4052/tigg.11.1
Sartory, D. P., Grobbelaar, J. U. (1984). Extraction of chlorophyll a from freshwater phytoplankton for spectrophotometric analysis. Hydrobiologia. 114, 177–187. doi: 10.1007/BF00031869
Shin, J. H., Kim, S. R., An, G. (2009). Rice aldehyde dehydrogenase7 is needed for seed maturation and viability. Plant Physiol. 149, 905–915. doi: 10.1104/pp.108.130716
Singh, S., Brocker, C., Koppaka, V., Chen, Y., Jackson, B. C., Matsumoto, A., et al. (2013). Aldehyde dehydrogenases in cellular responses to oxidative/electrophilic stress. Free Radic. Biol. Med. 56, 89–101. doi: 10.1016/j.freeradbiomed.2012.11.010
Stiti, N., Missihoun, T. D., Kotchoni, S. O., Kirch, H. H., Bartels, D. (2011). Aldehyde dehydrogenases in Arabidopsis thaliana: Biochemical requirements, metabolic pathways, and functional analysis. Front. Plant Sci. 2. doi: 10.3389/fpls.2011.00065
Suzuki, N., Rivero, R. M., Shulaev, V., Blumwald, E., Mittler, R. (2014). Abiotic and biotic stress combinations. New Phytol. 203, 32–43. doi: 10.1111/nph.12797
Talaat, N. B. (2014). Effective microorganisms enhance the scavenging capacity of the ascorbate-glutathione cycle in common bean (Phaseolus vulgaris L.) plants grown in salty soils. Plant Physiol. Biochem. 80, 136–143. doi: 10.1016/j.plaphy.2014.03.035
Thompson, J. D., Gibson, T. J., Higgins, D. G. (2002). Multiple sequence alignment using ClustalW and ClustalX. Curr. Protoc. Bioinf. 00. doi: 10.1002/0471250953.bi0203s00
Torche, Y., Blair, M., Saida, C. (2018). Biochemical, physiological and phenological genetic analysis in common bean (Phaseolus vulgaris L.) under salt stress. Ann. Agric. Sci. 63, 153–161. doi: 10.1016/j.aoas.2018.10.002
Tylichová, M., Kopecný, D., Moréra, S., Briozzo, P., Lenobel, R., Snégaroff, J., et al. (2010). Structural and functional characterization of plant aminoaldehyde dehydrogenase from Pisum sativum with a broad specificity for natural and synthetic aminoaldehydes. J. Mol. Biol. 396, 870–882. doi: 10.1016/j.jmb.2009.12.015
Vasiliou, V., Pappa, A., Petersen, D. R. (2000). Role of aldehyde dehydrogenases in endogenous and xenobiotic metabolism. Chem. Biol. Interact. 129, 1–19. doi: 10.1016/S0009-2797(00)00211-8
Velikova, V., Yordanov, I., Edreva, A. (2000). Oxidative stress and some antioxidant systems in acid rain-treated bean plants. Plant Science. 151, 59–66. doi: 10.1016/S0168-9452(99)00197-1
Wang, W., Jiang, W., Liu, J., Li, Y., Gai, J., Li, Y. (2017). Genome-wide characterization of the aldehyde dehydrogenase gene superfamily in soybean and its potential role in drought stress response. BMC Genomics 18, 518. doi: 10.1186/s12864-017-3908-y
Wang, Y., Tang, H., Debarry, J. D., Tan, X., Li, J., Wang, X., et al. (2012). MCScanX: A toolkit for detection and evolutionary analysis of gene synteny and collinearity. Nucleic Acids Res. 40, e49. doi: 10.1093/nar/gkr1293
Wang, Y., Wang, J., Guo, D., Zhang, H., Che, Y., Li, Y., et al. (2021). Physiological and comparative transcriptome analysis of leaf response and physiological adaption to saline alkali stress across pH values in alfalfa (Medicago sativa). Plant Physiol. Biochem. 167, 140–152. doi: 10.1016/j.plaphy.2021.07.040
Wen, Y., Wang, X., Xiao, S., Wang, Y. (2012). Ectopic expression of VpALDH2B4, a novel aldehyde dehydrogenase gene from Chinese wild grapevine (Vitis pseudoreticulata), enhances resistance to mildew pathogens and salt stress in Arabidopsis. Planta. 236, 525–539. doi: 10.1007/s00425-012-1624-z
Wood, A. J., Duff, R. J. (2009). The aldehyde dehydrogenase (ALDH) gene superfamily of the moss Physcomitrella patens and the algae Chlamydomonas reinhardtii and Ostreococcus tauri. Bryologist. 112, 1–11. doi: 10.1639/0007-2745-112.1.1
Xu, G., Guo, C., Shan, H., Kong, H. (2012). Divergence of duplicate genes in exon-intron structure. Proc. Natl. Acad. Sci. U. S. A. 109, 1187–1192. doi: 10.1073/pnas.1109047109
Yamaguchi-Shinozaki, K., Shinozaki, K. (2005). Organization of cis-acting regulatory elements in osmotic- and cold-stress-responsive promoters. Trends Plant Sci. 10, 88–94. doi: 10.1016/j.tplants.2004.12.012
Yang, J., An, D., Zhang, P. (2011). Expression profiling of cassava storage roots reveals an active process of glycolysis/gluconeogenesis. J. Integr. Plant Biol. 53, 193–211. doi: 10.1111/j.1744-7909.2010.01018.x
Yoshiba, Y., Kiyosue, T., Nakashima, K., Yamaguchi-Shinozaki, K., Shinozaki, K. (1997). Regulation of levels of proline as an osmolyte in plants under water stress. Plant Cell Physiol. 38, 1095–1102. doi: 10.1093/oxfordjournals.pcp.a029093
Yoshida, A., Rzhetsky, A., Hsu, L. C., Chang, C. J. (1998). Human aldehyde dehydrogenase gene family. Eur. J. Biochem. 251, 549–557. doi: 10.1046/j.1432-1327.1998.2510549.x
Yu, S., Yu, L., Hou, Y., Zhang, Y., Guo, W., Xue, Y. (2019). Contrasting effects of NaCl and NaHCO3 stresses on seed germination, seedling growth, photosynthesis, and osmoregulators of the common bean (Phaseolus vulgaris L.). Agronomy 9, 409. doi: 10.3390/agronomy9080409
Zhang, Q., Geng, J., Du, Y., Zhao, Q., Zhang, W., Fang, Q., et al. (2022). Heat shock transcription factor (Hsf) gene family in common bean (Phaseolus vulgaris): Genome-wide identification, phylogeny, evolutionary expansion and expression analyses at the sprout stage under abiotic stress. BMC Plant Biol. 22, 1–15. doi: 10.1186/s12870-021-03391-x
Zhang, H., Huo, Y., Xu, Z., Guo, K., Wang, Y., Zhang, X, et al. (2020). Physiological and proteomics responses of nitrogen assimilation and glutamine/glutamine family of amino acids metabolism in mulberry (Morus alba L.) leaves to NaCl and NaHCO3 stress. Plant Signaling Behavior. 15, 1798108. doi: 10.1080/15592324.2020.1798108
Zhang, Y., Mao, L., Wang, H., Brocker, C., Yin, X., Vasiliou, V., et al. (2012). Genome-wide identification and analysis of grape aldehyde dehydrogenase (ALDH) gene superfamily. PloS One 7, e32153. doi: 10.1371/journal.pone.0032153
Zhang, X., Zhong, J., Cao, L., Ren, C., Yu, G., Gu, Y., et al. (2023). Genome-wide characterization of aldehyde dehydrogenase gene family members in groundnut (Arachis hypogaea) and the analysis under saline-alkali stress. Front. Plant Sci. 14. doi: 10.3389/fpls.2023.1097001
Zhao, X., Fang, J., Li, S., Gaur, U., Xing, X., Wang, H, et al. (2019). Artemisinin attenuated hydrogen peroxide (H2O2)-induced oxidative injury in SH-SY5Y and hippocampal neurons via the activation of AMPK pathway. Int. J. Mol. Sci. 20, 2680. doi: 10.3390/ijms20112680
Keywords: common bean, aldehyde dehydrogenase, abiotic stress, saline-alkali stress, expression pattern
Citation: Wang X, Wu M, Yu S, Zhai L, Zhu X, Yu L and Zhang Y (2024) Comprehensive analysis of the aldehyde dehydrogenase gene family in Phaseolus vulgaris L. and their response to saline–alkali stress. Front. Plant Sci. 15:1283845. doi: 10.3389/fpls.2024.1283845
Received: 27 August 2023; Accepted: 05 February 2024;
Published: 21 February 2024.
Edited by:
Luisa M. Sandalio, Spanish National Research Council (CSIC), SpainReviewed by:
Nicole Orsi, University of São Paulo, BrazilCopyright © 2024 Wang, Wu, Yu, Zhai, Zhu, Yu and Zhang. This is an open-access article distributed under the terms of the Creative Commons Attribution License (CC BY). The use, distribution or reproduction in other forums is permitted, provided the original author(s) and the copyright owner(s) are credited and that the original publication in this journal is cited, in accordance with accepted academic practice. No use, distribution or reproduction is permitted which does not comply with these terms.
*Correspondence: Song Yu, eXVzb25nQGJ5YXUuZWR1LmNu
Disclaimer: All claims expressed in this article are solely those of the authors and do not necessarily represent those of their affiliated organizations, or those of the publisher, the editors and the reviewers. Any product that may be evaluated in this article or claim that may be made by its manufacturer is not guaranteed or endorsed by the publisher.
Research integrity at Frontiers
Learn more about the work of our research integrity team to safeguard the quality of each article we publish.