
95% of researchers rate our articles as excellent or good
Learn more about the work of our research integrity team to safeguard the quality of each article we publish.
Find out more
ORIGINAL RESEARCH article
Front. Plant Sci. , 29 May 2024
Sec. Plant Abiotic Stress
Volume 15 - 2024 | https://doi.org/10.3389/fpls.2024.1245545
This article is part of the Research Topic Plant Plasticity and Epigenetics View all 7 articles
 Mathilde Petitpas
 Romane LapousMathieu Le DucChristine LariagonJocelyne LemoineChristophe Langrume
 Maria J. Manzanares-Dauleux
 Mélanie Jubault*
The resistance of Arabidopsis thaliana to clubroot, a major disease of Brassicaceae caused by the obligate protist Plasmodiophora brassicae, is controlled in part by epigenetic factors. The detection of some of these epigenetic quantitative trait loci (QTLepi) has been shown to depend on experimental conditions. The aim of the present study was to assess whether and how temperature and/or soil water availability influenced both the detection and the extent of the effect of response QTLepi. The epigenetic recombinant inbred line (epiRIL) population, derived from the cross between ddm1-2 and Col-0 (partially resistant and susceptible to clubroot, respectively), was phenotyped for response to P. brassicae under four abiotic conditions including standard conditions, a 5°C temperature increase, drought, and flooding. The abiotic constraints tested had a significant impact on both the leaf growth of the epiRIL population and the outcome of the epiRIL–pathogen interaction. Linkage analysis led to the detection of a total of 31 QTLepi, 18 of which were specific to one abiotic condition and 13 common to at least two environments. EpiRIL showed significant plasticity under epigenetic control, which appeared to be specific to the traits evaluated and to the abiotic conditions. These results highlight that the environment can affect the epigenetic architecture of plant growth and immune responses and advance our understanding of the epigenetic factors underlying plasticity in response to climate change.
Epigenetics studies the mechanisms involved in the modulation of gene expression without changes in DNA sequence (Waddington, 1959; Holliday, 1987). Transgenerational epigenetics focuses on the epigenetic marks that are not reset during mitotic or meiotic divisions and are therefore transmitted from one generation to the next (Heard and Martienssen, 2014; Quadrana and Colot, 2016). DNA methylation, i.e., the addition of a methyl group to the cytosine of the DNA sequence, is one of the most important epigenetic mechanisms involved in genome stability and modulation of gene expression (reviewed in Zhang et al., 2018). Methylation targets gene promoters, transposable elements, tandem, and interspersed repeats and occurs in three different contexts: symmetric CH and CHG and the rarest asymmetric CHH with H being either A, T, or C (Dowen et al., 2012; Deleris et al., 2016).
In the model species Arabidopsis thaliana, there is growing evidence that transgenerational epimutations, and in particular DNA methylation variations, are involved in the control of complex traits related to developmental processes (Johannes et al., 2009; Cortijo et al., 2014), metabolism (Aller et al., 2018), and response to abiotic (Kooke et al., 2015) and biotic stresses (Furci et al., 2019; Liégard et al., 2019). Indeed, as sessile organisms, plants are exposed to a wide range of pathogens that cause yield losses and threaten global food security (O’Brien et al., 2021). Climate change, especially fluctuations in temperature and water availability, affects both plant development and the response to pathogenic organisms (Barbetti et al., 2012; Bhadra et al., 2022). The extent to which environmental factors affect plants depends on the pathosystem, the intensity of the stress, and the duration of the stress application (for a review, see Desaint et al., 2021, and Velásquez et al., 2018). Furthermore and depending on the pathosystem, it has been shown that the application of an abiotic constraint can lead to improved resistance (Aoun et al., 2017) or increased susceptibility of a plant to a pathogen (Bidzinski et al., 2016). In addition, plants can adapt to environmental changes via phenotypic plasticity, which refers to the ability of one genotype to present different phenotypes under different environmental conditions (Bradshaw, 1965). Studying plastic responses to infection by pathogens would give us a better understanding of how to use (epi)genetic resistance in plant breeding to cope with climate change.
Plasmodiophora brassicae is a protist, soil-borne obligate pathogen and the causal agent of clubroot disease in the Brassicaceae family, which includes important economic crops (oilseed rape, cabbages, etc.) as well as Arabidopsis (Dixon, 2009). P. brassicae disrupts nutrient and water cycles, leading to yield loss and potential plant death (Dixon, 2009). After infection of the root hairs (primary infection) by primary zoospores released during germination of resting spores, secondary zoospores infect the cortical cells (secondary infection) of the root tissues and lead to gall formation through hyperplasia (cell division) and hypertrophy (cell enlargement) (Liu et al., 2020). The genetic architecture of the plant response to clubroot has been described in several Brassicaceae species (Manzanares-Dauleux et al., 2000; Rocherieux et al., 2004; Jubault et al., 2008; Lee et al., 2015), as well as the modulation of the effect of some genetic resistance factors by abiotic constraints such as nitrogen supply (Laperche et al., 2017; Aigu et al., 2018), water availability (Gravot et al., 2016), or soil pH (Gossen et al., 2012). Temperature was also found to significantly influence the outcome of P. brassicae infection (Sharma et al., 2011b, 2011a; Gossen et al., 2012). Interestingly, in Arabidopsis, natural and induced epigenetic quantitative trait loci (QTLepi) have been shown to be involved in the plant response to P. brassicae (Liégard et al., 2019; Gravot et al., 2024), with the detection of some of these QTLepi being dependent on experimental conditions (Liégard et al., 2019).
In the present paper, we further investigated whether and how the epigenetic architecture of the plant response to clubroot depended on temperature and soil water content. To this end, the epigenetic recombinant inbred line (epiRIL) population (Johannes et al., 2009), derived from the cross between the Col-ddm1-2 mutant (partially resistant to clubroot) and Col-0 (susceptible to clubroot) (Johannes et al., 2009; Liégard et al., 2019), was evaluated for clubroot resistance under different abiotic conditions: punctual and moderate temperature increase ( ± 5°C during night and day), water deficit, or excess water. Overall, our study confirmed that epigenetic variations were involved in controlling A. thaliana response to P. brassicae infection and highlighted that the environment can affect the epigenetic architecture of both plant growth and immune responses.
A total of 123 lines from the epiRIL population derived from the cross between the wild-type Colombia Col-0 and the EMS mutant Col-ddm1-2 (Johannes et al., 2009) were provided by Versailles Arabidopsis Stock Center (http://publiclines.versailles.inrae.fr/). The parental line Col-ddm1-2 did not germinate in all tests, which explains the lack of data for this genotype in some of our experiments. In order to validate the inoculation process and the pathotype of the P. brassicae isolate used, the following genotypes were used as part of the differential host set as characterised in Some et al. (1996): Brassica napus ssp. oleifera cv ‘Nevin’ (ECD6), B. napus ssp. rapifera cv ‘Wilhelmsburger’ (ECD10), B. napus ssp. oleifera (Brutor), Brassica oleracea ssp. acephala (C10, C7, and CB151), Brassica rapa ssp. pekiniensis cv ‘Granaat’ (ECD5), and B. napus cv ‘Mendel’.
All pathological tests were carried out using the P. brassicae isolate eH (Fahling et al., 2003), which belongs to the pathotype P1 (Some et al., 1996). The inoculum was prepared at 107 spores/mL as in Manzanares-Dauleux et al. (2000), and 1 mL of the inoculum was applied to the base of the seedlings 10 days post-sowing (stage 1.04; Boyes et al., 2001). The life cycle of P. brassicae in A. thaliana was completed in 21 days post-inoculation with the primary infection lasting 7 days and the secondary infection starting 7 days after infection until the end of the cycle (Liu et al., 2020).
The epiRIL response to clubroot was assessed under four environmental conditions in two growth chambers. The standard growth conditions used in our laboratory for pathological clubroot tests were used as the control environment (denoted STANDARD) with 22°C during the 16 h of light and 19°C during the 8 h of darkness and a volumetric water content (VWC; %) varying from 20% to 50% across the test. For the three other environmental conditions, plants were grown under the same conditions as in STANDARD, except from 7 to 14 days post-inoculation, which corresponds to the beginning of the secondary phase of infection (Liu et al., 2020), where the temperature or the soil water content was modified for 7 days. For the heat condition (denoted HEAT), a temperature increase of 5°C was applied (27°C during the light period and 24°C at night). For the moderate drought condition (denoted DROUGHT), watering was stopped 3 days before the start of the secondary cycle of P. brassicae, resulting in a decrease of the VWC from 30% to less than 10%. For the flooding condition (denoted FLOOD), plants were watered with 6 L of clear water for 7 days leading to water saturation and a VWC above 50%. These abiotic conditions were chosen so that the plant could perceive the stress applied while ensuring that both the plant and the pathogen could continue to grow. Finally, the 5°C temperature increase applied in this study corresponds to the increase predicted in the worst-case climate change scenario (IPCC, 2023).
For each environment, the epiRIL population as well as the parental lines were phenotyped in two biological replicates in a completely randomised block design (with two blocks per replicate, each block consisting of six plants per genotype). For each growth condition, 24 plants per epiRIL were thus phenotyped in response to clubroot infection. For each pathological test, seed germination was synchronised by placing seeds on wet blotting paper in Petri dishes for 2 days at 4°C in the dark. Seeds were sown individually in pots (7 × 7 × 8 cm) containing a soil mix of 54% peat, 40% sand, and 6% clay. The differential host set was repeated four times for each condition. For STANDARD, all four repetitions of the differential host set were placed under the conditions described for STANDARD. For HEAT, DROUGHT, and FLOOD, two repetitions were put in the STANDARD conditions, and the two others were placed in the conditions described for HEAT, DROUGHT, and FLOOD.
In order to distinguish the impact of the abiotic environment from that of the pathogen infection on the plant development, the epiRIL population was also grown under the four environmental conditions STANDARD, HEAT, DROUGHT, and FLOOD but without being inoculated by P. brassicae in two biological replicates in a completely randomised block design (with two blocks per replicate, each block consisting in three plants per genotype). For each growth condition, 12 plants per epiRIL were thus phenotyped without inoculation.
Ten Thermochron iButton Device (DS1922E/DS1921G, Maxim Integrated, San Jose, CA, USA) sensors per growth chamber were used to control the temperature, and six SenseCAP LoRaWAN (EU868Mhz, Seeed Studio, Mansfield, TX, USA) sensors were used for VWC assessment.
The growth of plants infected or not infected by P. brassicae was assessed by measuring the length of the longest leaf of inoculated (Lfi) and non-inoculated plants (Lni). For each condition, measurements were taken 24 days post-sowing for one repetition and 27 days after sowing for the second repetition. These sampling times were considered as part of the design effect and were thus corrected using the linear model described in Section 2.5. dLf was denoted as the difference between Lfni and Lfi to assess the impact of the pathogen on plant growth. Plant response to P. brassicae infection was evaluated 3 weeks post-inoculation (31 days after sowing): plants were dug up and rinsed with clear water, and then the disease index (DI) described in Manzanares-Dauleux et al. (2000) was calculated, with DI = (n1 × 25 + n2 × 50 + n2 × 75 + n3 × 100)/N, where ni is the number of plants in the symptom class i and N the total number of plants assessed. Pictures of the plants were taken, enabling the acquisition of the gall area measure (variable GA) using FIJI (Schindelin et al., 2012). The DI is representative of the impact of clubroot on the root system, while the GA variable gives an indication of the size of the symptoms (gall size). A third disease-related trait (GALA), which expresses root disease symptoms relative to shoot development, was calculated as [GA/(Lfi2)] × 5,000, as defined in Gravot et al. (2011). Phenotypic plasticity, defined as the ability of plants to modulate their phenotype depending on their environment, was estimated by the difference between the value of each trait obtained under the STANDARD condition and that obtained in one of the other abiotic conditions tested (variable called deltaTrait). Thus, six deltaTraits were calculated: deltaLfni, deltaLfi, deltadLf, deltaDI, deltaGA, and deltaGALA. These variables were measured for the following comparisons: standard heat (StdHeat), standard drought (StdDrought), and standard flood (StdFlood).
A linear model was used to determine the effect of the epigenome and the effect of the experimental design for each trait assessed under the four environmental conditions using the following equation (Supplementary Table 1):
where μ is the global mean, EGi is the epigenotype effect of the i line, Rj is the replicate effect, Bk(Rj) is the block effect nested in the replicate effect, and eijk is the residual fitted on a Gaussian distribution. The model was fitted using the function lm of the package stats, using R version 4.2.1 (R Core Team, 2022). For each trait, adjusted average values were computed from the results of Equation 1.
Analyses of variance were performed for each disease-related trait, and broad-sense heritability (h2) was calculated as follows:
where Ge is the estimated epigenetic variance and Gr is the estimated block × repetition effect. Ge and Gr were obtained from the linear model described in Equation 1.
Principal component analysis and clusterisation were achieved using all deltaTraits and were carried out using the R packages FactoMineR (Lê et al., 2008) and Factoextra (Kassambara and Mundt, 2020). All the comparisons between traits or conditions were achieved through the Kruskal–Wallis test unless stated otherwise.
Methylation differences between the different lines were characterised by Colome-Tatche et al. (2012) using MeDIP-Chip and used to define 126 meiotically stable epigenetic markers. These epigenetic markers were then used to construct an epigenetic recombination map for subsequent linkage analysis studies (Colome-Tatche et al., 2012). QTLepi were detected using the R package qtl (Broman et al., 2003) of the R 4.2.1 version (R Core Team, 2022). Single interval mapping (SIM) was first used to identify potential QTLepi with the multiple imputation (imp) method using a step size of 2 cM and a window size of 10 cM. SIM thresholds were evaluated by doing 5,000 permutational tests, and significativity was fixed at α = 0.05. To improve the statistical power of the QTLepi detection, multiple QTL mapping (MQM) (Arends et al., 2010) was achieved with the function stepwise. Logarithm of the odds (LOD) thresholds were calculated with 5,000 permutations using the scantwo function with a significance level of α = 0.05. The likelihood ratio of each trait was obtained using the scantwo function with 5,000 permutations for each trait and each abiotic condition (Supplementary Table 1). When QTLepi were detected, the model was fitted with the fitqtl function to calculate the percentage of variation explained (R2) by each QTLepi. The lodint function was used to calculate the confidence interval of each QTLepi, and the function effectplot was used to estimate the epiallele effect. Finally, the addint function was used to assess putative interactions between detected QTLepi.
To assess whether the QTLepi detected were due only to epigenetic variations and not to genetic variations, the significance of the genetic variants present in the confidence interval of the QTLepi was also tested. Whole-genome sequence data were available for the 123 epiRIL epigenomes (Gilly et al., 2014). GATK HaplotypeCaller 4.0 was used—in joint-genotyping mode—to identify single-nucleotide polymorphisms (SNPs) and indels (<100 bp) among 122 epiRILs. Raw variant calls were then filtered following GATK Best Practice suggestions and additional scripts. TE-Tracker (https://www.genoscope.cns.fr/externe/tetracker) was used to identify transposition events (TEs) exactly as previously described (Gilly et al., 2014; Liégard et al., 2019). In order to evaluate the impact of genetic variants on heritable variation in the response to clubroot, three QTL models were compared as described in Kooke et al. (2015): 1) using epigenetic markers at the QTLepi peak, 2) using genetic DNA variants (SNP, indel, and TE insertion) located in the confidence interval instead of epigenetic markers, and 3) using both epigenetic and genetic variants.
In order to study the impact of the abiotic conditions HEAT, DROUGHT, and FLOOD on the epiRIL population, the length of the longest leaf of non-inoculated plants (Lfni) was measured as a proxy of leaf growth. Col-0 showed a significant reduction of Lfni by 45% in the FLOOD (Kruskal–Wallis test, p = 0.0087) and DROUGHT (p = 0.0012) conditions, while no significant effect was observed for the HEAT condition (Supplementary Figure 1). Data were not available for ddm1-2, as seeds did not germinate. The leaf growth of the epiRIL population was significantly affected by the HEAT, DROUGHT, and FLOOD conditions, resulting in a significant reduction compared to the STANDARD condition. HEAT had a small effect on leaf growth (20% reduction of Lfni, p< 0.001), while DROUGHT and FLOOD had a strong effect (68% and 53% reduction, respectively, p< 0.001) (Figure 1A, Supplementary Tables 2, 3). In addition to the significant variability observed between conditions, leaf growth of the epiRIL population displayed variability within each abiotic condition with coefficients of variation ranging from 12.8% for STANDARD to 18.5% for DROUGHT.
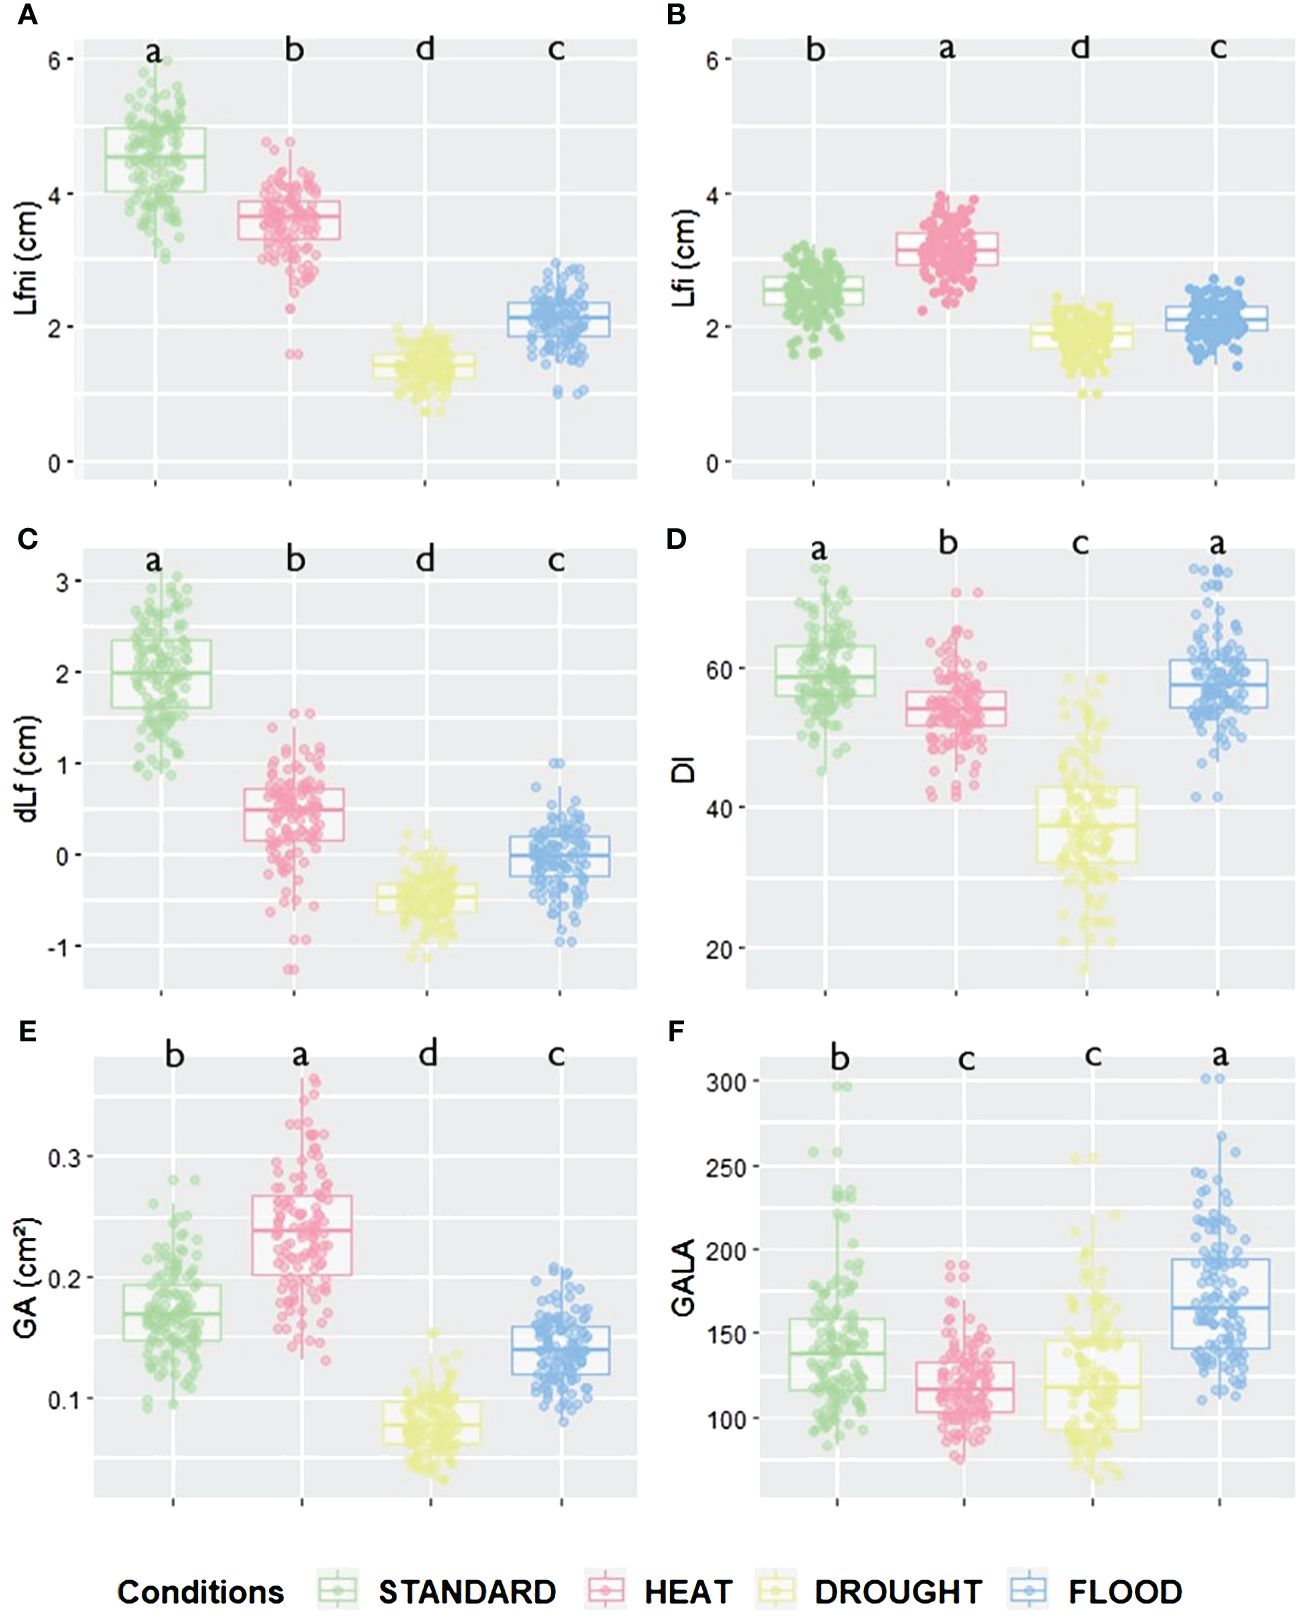
Figure 1 Leaf growth and disease-related trait values according to the different abiotic conditions for (A) Lfni, (B) Lfi, (C) dLf, (D) DI, (E) GA and (F) GALA variables. Green is for STANDARD, pink for HEAT, yellow for DROUGHT, and blue for FLOOD conditions. Significant differences for each trait between conditions are given by different letters obtained by a Kruskal–Wallis test, p-value<0.05.
For the four environments tested, Lfni presented continuous distributions in the epiRIL population (Supplementary Figure 1), suggesting a poly-epigenetic control of this trait, with moderate-to-high broad-sense heritability (0.64 to 0.78, depending on the abiotic conditions; Table 1 calculated according to Equation 2). In total, 13 moderate-effect QTLepi (R2 ranging from 8.09% to 18.40%) controlling leaf growth were detected for all four conditions. Three QTLepi were filtered out, as one genetic variant within the QTLepi interval had a significantly larger effect than the epigenetic marker at the peak of the QTLepi (Supplementary Table 4). Thus, 10 bona fide QTLepi were conserved: two for STANDARD on chromosomes 1 and 2; four for HEAT on chromosomes 1, 3, 4, and 5; two for DROUGHT on chromosomes 1 and 3; and two for FLOOD on chromosomes 1 and 2 (Figure 2, Table 2). Several QTLepi controlling Lfni overlapped and shared most of their confidence interval between conditions. Indeed, four QTLepi overlapped on chromosome 1 for STANDARD, FLOOD, DROUGHT, and HEAT; two QTLepi overlapped on chromosome 2 for STANDARD and FLOOD; and two overlapped on chromosome 3 for HEAT and DROUGHT. The phenotypic variability explained by these overlapping QTLepi (R2) was consistent regardless of the abiotic conditions. Two epigenetic factors controlling Lfni were specific to the HEAT condition: one QTLepi on chromosome 4 and one QTLepi on chromosome 5.
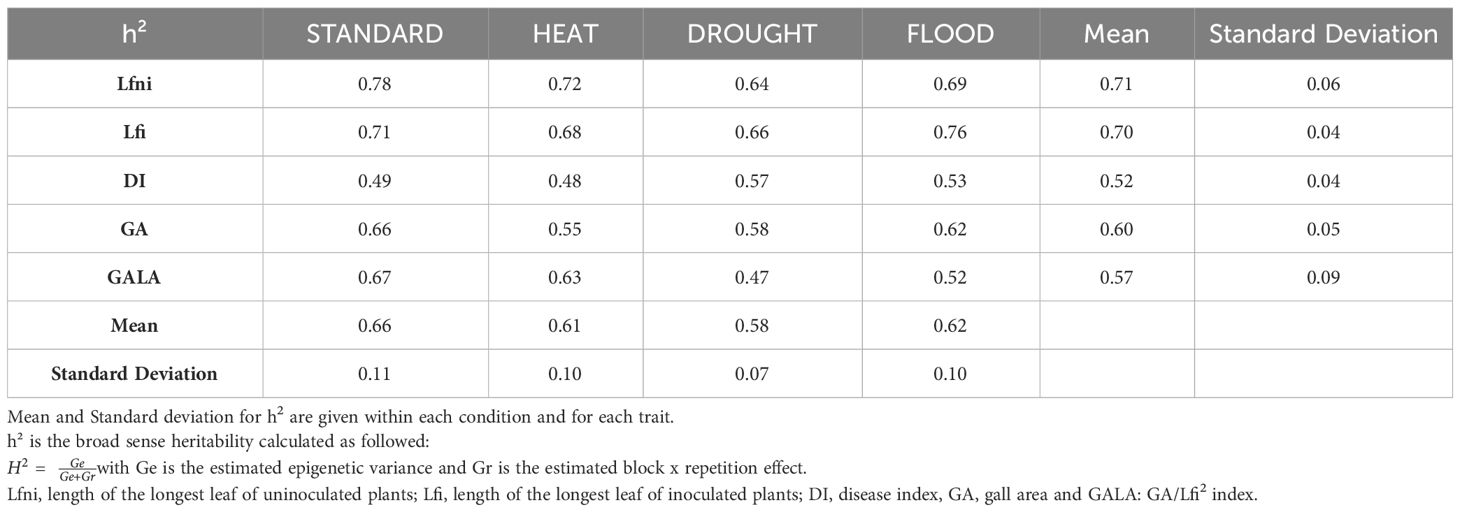
Table 1 Broad-sense heritability (h2) for leaf growth and disease-related traits in the epiRIL population under four abiotic conditions STANDARD, HEAT, DROUGHT, and FLOOD.
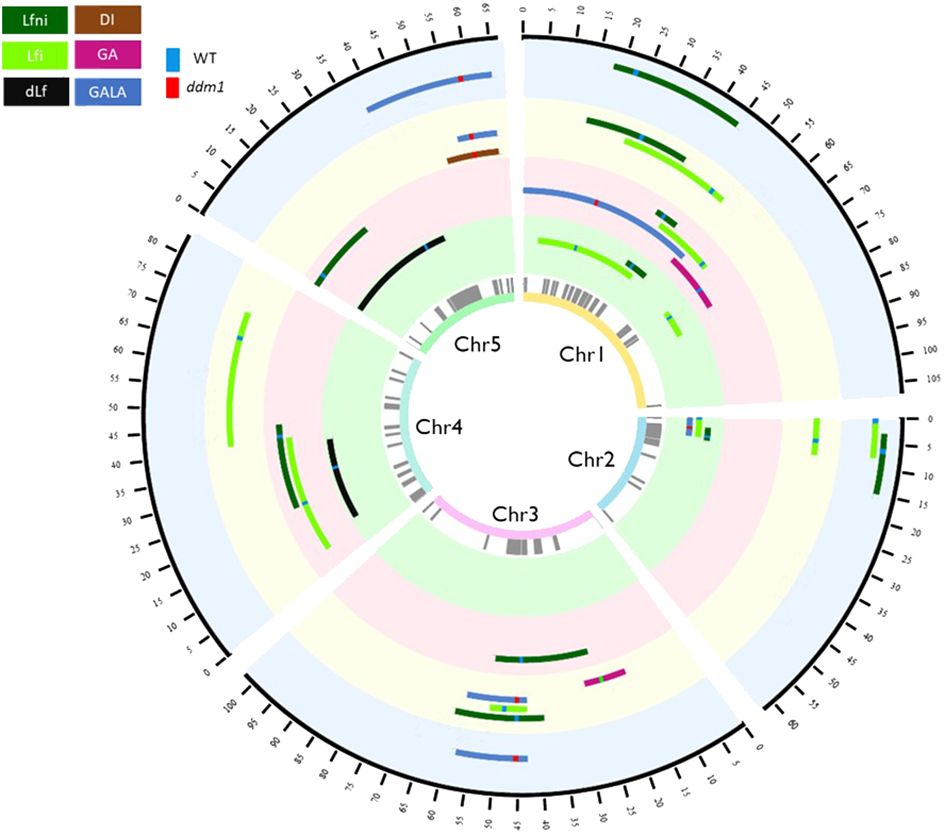
Figure 2 Circos representing the QTLepi detected in the epiRIL population phenotyped for response to clubroot under four abiotic conditions. From the inner to the outer circle are indicated the chromosome number, differentially methylated regions used as epimarkers in grey, QTLepi detected for the STANDARD condition, QTLepi detected for the HEAT condition, QTLepi detected for the DROUGHT condition, and QTLepi detected for the FLOOD condition. The black outer circle represents the position in cM of the epigenetic map. Brown is associated with DI, pink with GA, blue with GALA, light green with Lfi, dark green with Lfni, and black with dLf variables. When methylation derived from the wild-type Col-0 is associated with higher values of the trait, the line at the marker at the peak of QTLepi is green. When hypomethylation derived from the mutant ddm1-2 is associated with higher values, the line at the marker at the peak of QTLepi is red. QTLepi, epigenetic quantitative trait loci; epiRIL, epigenetic recombinant inbred line.
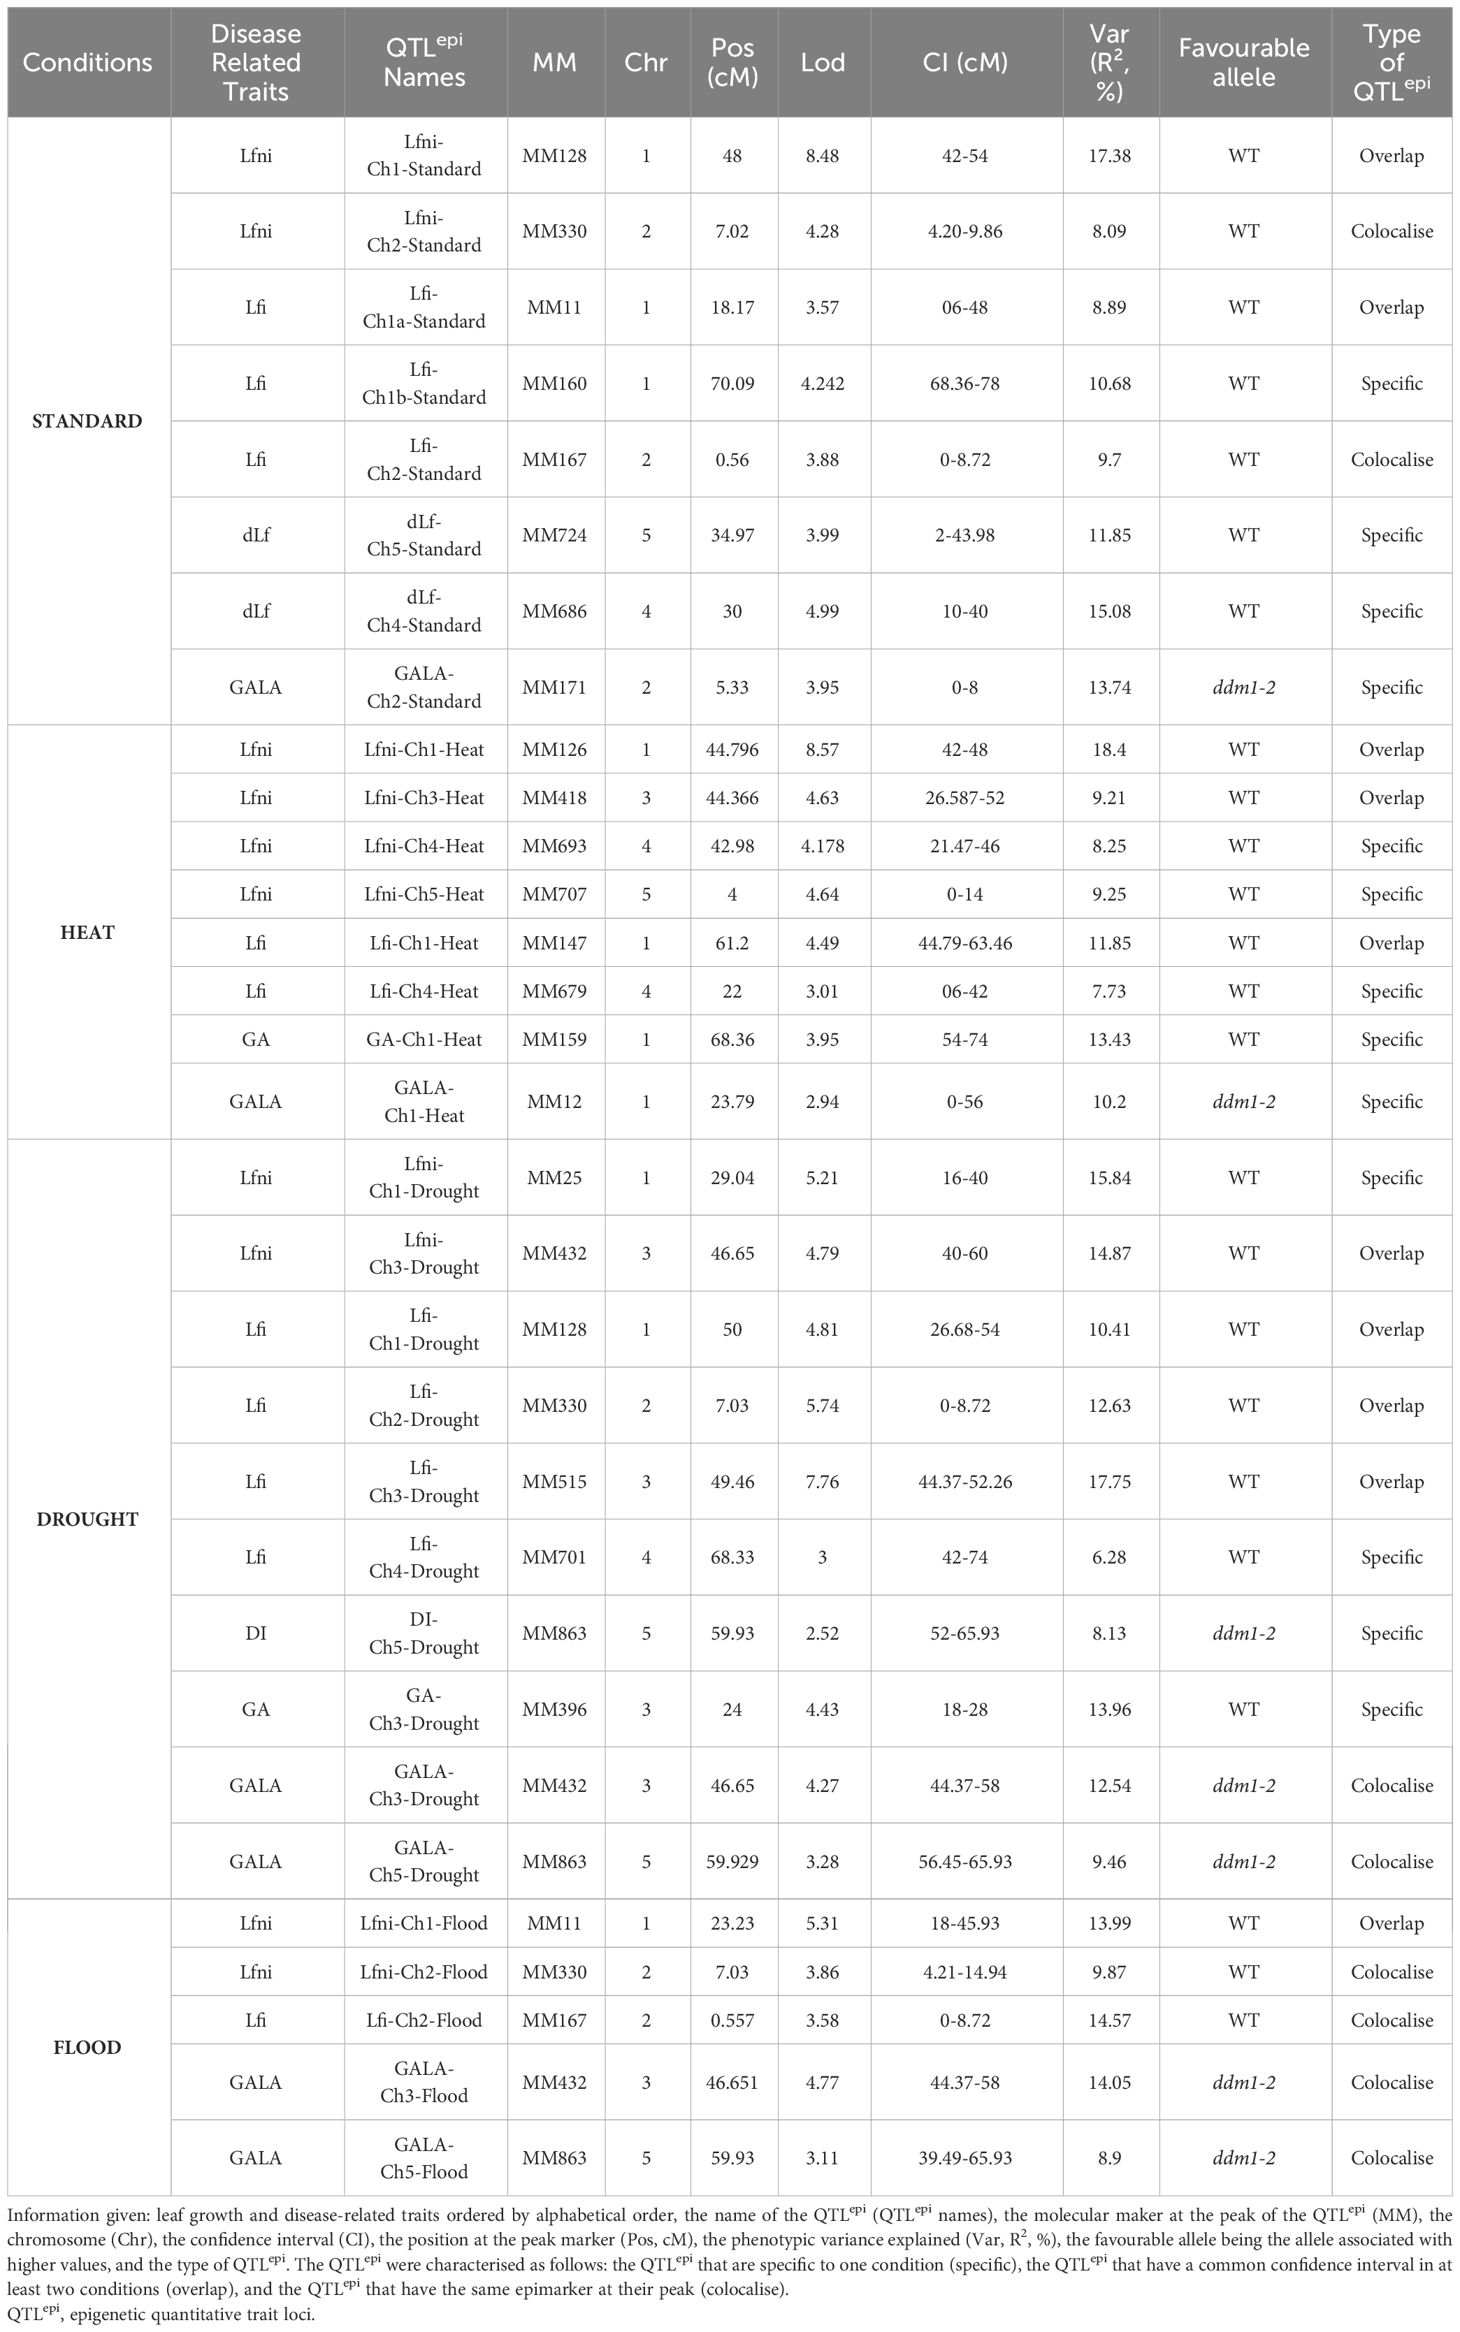
Table 2 Summary table of all the QTLepi detected for STANDARD (green), HEAT (pink), DROUGHT (orange), and FLOOD (blue) conditions.
To fully assess the plant response to clubroot, several traits were measured. As previously conducted on non-inoculated plants, the leaf growth of the inoculated plants was estimated by measuring the length of the longest leaf (Lfi). The effects of P. brassicae on plant leaf growth were assessed by calculating the variable dLf. GA and DI assessing the gall symptom size and the severity of the disease, respectively, allowed the evaluation of clubroot symptoms and root system functionality. As epiRIL showed different leaf growth under STANDARD conditions, and moreover the same epiRIL can show differences between the abiotic conditions, the GALA index, which considers leaf growth (Lfi) as a function of symptom size (GA), was calculated to compare symptoms between epiRIL in the same condition and between epiRIL in the different abiotic conditions. For each experiment, proper inoculation and the pathotype P1 of the eH isolate used were confirmed using the differential host set under the condition STANDARD. The symptoms observed on the differential hosts under HEAT and FLOOD conditions were similar to those observed under the STANDARD condition. Under the DROUGHT condition, the differential host set showed a significant reduction in disease symptoms for all susceptible genotypes, with, for example, a reduction of 32% in disease severity for the susceptible control accession ECD5 (Wilcoxon test, p = 0.0015) (Supplementary Table 5).
The response of Col-0 and ddm1-2 to clubroot was differently influenced by the abiotic factors. While neither FLOOD nor HEAT had a significant impact on the response of Col-0, the DROUGHT condition led to a significant reduction of leaf growth (32% decrease, p = 0.029), symptom severity (33% decrease; Kruskal–Wallis, p = 0.042), and root biomass (56% decrease, p = 0.029) compared to the STANDARD condition. For ddm1-2, leaf growth was positively affected by HEAT (increase for Lfi by 53%, p = 0.029), negatively affected by DROUGHT (Lfi reduced by 26%, p = 0.029), and not impacted by FLOOD; both disease severity and gall size were negatively affected by DROUGHT (reduction of DI by 65%, p = 0.042, and GA by 62%, p = 0.029). Only the HEAT condition resulted in a significant reduction in symptom size standardised by leaf growth, as the GALA index was reduced by 46% (p = 0.029) (Supplementary Figure 1).
The response of the epiRIL population to clubroot was also significantly impacted by abiotic factors. Indeed, compared to the STANDARD condition, the HEAT condition resulted in a significant increase in leaf growth (25% increase in Lfi, p< 0.001) and gall size (39% increase in GA, p< 0.001) and a significant decrease in disease severity and symptom size normalised by leaf growth (DI reduced by 9%, p< 0.001, and GALA reduced by 15%, p< 0.001) (Figure 1; Supplementary Tables 2, 3). The DROUGHT and FLOOD conditions resulted in a significant decrease in leaf growth (26% and 16% reduction in Lfi, respectively, both p< 0.001). DROUGHT led to a significant reduction in disease severity (DI reduced by 36%, p< 0.001), gall size (GA reduced by 54%, p< 0.001), and symptoms size normalised by leaf growth (GALA reduced by 11%, p< 0.001). In the FLOOD condition, galls were significantly smaller (GA reduced by 18%, p< 0.001), but disease severity was not affected, and symptom size standardised by leaf growth increased significantly (GALA increased by 22%, p< 0.001). The disease index variable (DI) did not display much variability across abiotic conditions. In the STANDARD condition, P. brassicae significantly reduced leaf growth, as dLf was equal to an average of 1.98 ± 0.52 cm. For the other conditions, however, the impact of the pathogen on leaf growth was almost negligible, as dLf was equal to an average of 0.42 ± 0.45 cm, −0.47 ± 0.24 cm, and −0.03 ± 0.32 cm for HEAT, DROUGHT, and FLOOD, respectively (Figure 1, Supplementary Tables 2, 3).
Regardless of the conditions, the positive correlation between leaf growth and gall size was maintained (Pearson’s r = 0.6), highlighting that gall development was not independent of leaf growth and that the Lfi and GA traits may be under the control of common epigenetic factors (Supplementary Figure 2). The existence of a positive or negative correlation between variables may depend on abiotic conditions, as illustrated by the correlation between disease index and gall size, which was positive under the DROUGHT conditions (Pearson’s r = 0.39) and negative under the STANDARD conditions (Pearson’s r = −0.29).
For all abiotic conditions, the distributions of disease-related variables were continuous, suggesting a poly-epigenetic control of all traits (Supplementary Figure 1). Broad-sense heritability values ranged from moderate to high (Table 1), indicating that most part of the phenotypic variation observed was explained by the epigenotype. Twenty-three QTLepi were detected for all abiotic conditions and all traits, but two of them were eliminated because the closest genetic variants had a significantly larger effect than the epigenetic markers at the QTLepi peak (Supplementary Table 4). Twenty-one moderate-effect QTLepi were then considered bona fide epigenetic QTL controlling plant response to clubroot in all conditions (Figure 2, Supplementary Table 4). The number of QTLepi detected for each condition was different: six QTLepi were detected for STANDARD, four for HEAT, eight for DROUGHT, and three for FLOOD. Very few QTLepi were detected for the variables dLf (two QTLepi detected under STANDARD condition) and DI (one QTLepi detected in the DROUGHT condition), which is consistent with the low phenotypic variability observed for these two traits in the epiRIL population. Regardless of the abiotic conditions, the epiRIL carrying the hypomethylated allele derived from ddm1-2 showed greater symptoms standardised by leaf growth (higher GALA) and greater disease severity (higher DI) while displaying smaller rosettes (smaller Lfi). With the exception of two QTLepi (Lfi-Ch1b-STANDARD and Lfi-Ch4-DROUGHT), all Lfi QTLepi overlapped (i.e., they shared most of their confidence interval) with QTLepi detected for Lfni. Further details on the QTLepi localisations and confidence intervals are given in Table 2.
Eight QTLepi colocalised (we considered that two QTLs colocalised when they had the same epigenetic marker at the peak of the QTL) and 10 QTLepi overlapped between at least two abiotic conditions (Table 2). Some of the QTLepi detected under the STANDARD condition were also detected in other conditions, in particular for Lfi, in two genomic regions located on chromosomes 1 and 2. Other QTLepi, not detected in STANDARD, were found in at least two abiotic conditions, in particular for GALA, for which four QTLepi colocalised between DROUGHT and FLOOD on chromosomes 3 and 5. Finally, 13 QTLepi were specific to one abiotic condition. For Lfi, one QTLepi on chromosome 1 was specific to STANDARD, two on chromosomes 3 and 4 were specific to DROUGHT, and one on chromosome 4 was specific to HEAT. For GA, two QTLepi were specific to HEAT and DROUGHT on chromosomes 1 and 3. For GALA, two QTLepi were specific to HEAT and STANDARD on chromosomes 1 and 2. For DI, one QTLepi on chromosome 5 was specific to DROUGHT.
We examined in more detail the phenotypic plasticity observed within the epiRIL population between STANDARD and the other three abiotic conditions, that is to say, the ability of an epigenotype to modulate its phenotype as a function of the environment. Plasticity was estimated by the difference between the value of each trait obtained under the STANDARD condition and that obtained under another abiotic condition. For each trait, the correlation between conditions was assessed. For the GALA index, a correlation of 1 was observed between the DROUGHT and FLOOD conditions. For the other traits, the correlation coefficients between the conditions ranged from 0.282 to 0.689 (Supplementary Figure 3).
The two parental lines did not show similar phenotypic plasticity, neither for phenotypic traits nor between abiotic conditions (Supplementary Figure 4). With respect to all deltaTraits, Col-0 and ddm1-2 showed similar plasticity in HEAT conditions (mean of absolute delta = 22 ± 16.89 and 31 ± 18.88 for StdHeat, respectively). Under the DROUGHT condition, both ddm1-2 (mean delta = 39 ± 23.84 for StdDrought) and Col-0 (mean delta = 59 ± 43.33 for StdDrought) showed great phenotypic plasticity except for deltaGALA for which values ranges from 10.8 to 14.4. For FLOOD, Col-0 displayed greater phenotypic plasticity (mean absolute delta = 41 ± 30.74 for StdFlood) than ddm1-2 (mean delta = 18 ± 13.33 for StdFlood). The influence of abiotic factors on the response of the epiRIL population to clubroot was not the same under all conditions (Figure 3; Supplementary Figure 5, Supplementary Table 6). For deltaLfni, deltaLfi, and deltadLf, low phenotypic plasticity was observed when comparing STANDARD and HEAT, whereas high plasticity was found under StdDrought and StdFlood (Figures 3A–C). For deltaDI and deltaGA, phenotypic plasticity was high for StdDrought and low for StdHeat and StdFlood (Figures 3D, E). For deltaGALA, plasticity was low for StdHeat and StdDrought and high for StdFlood (Figure 3F).
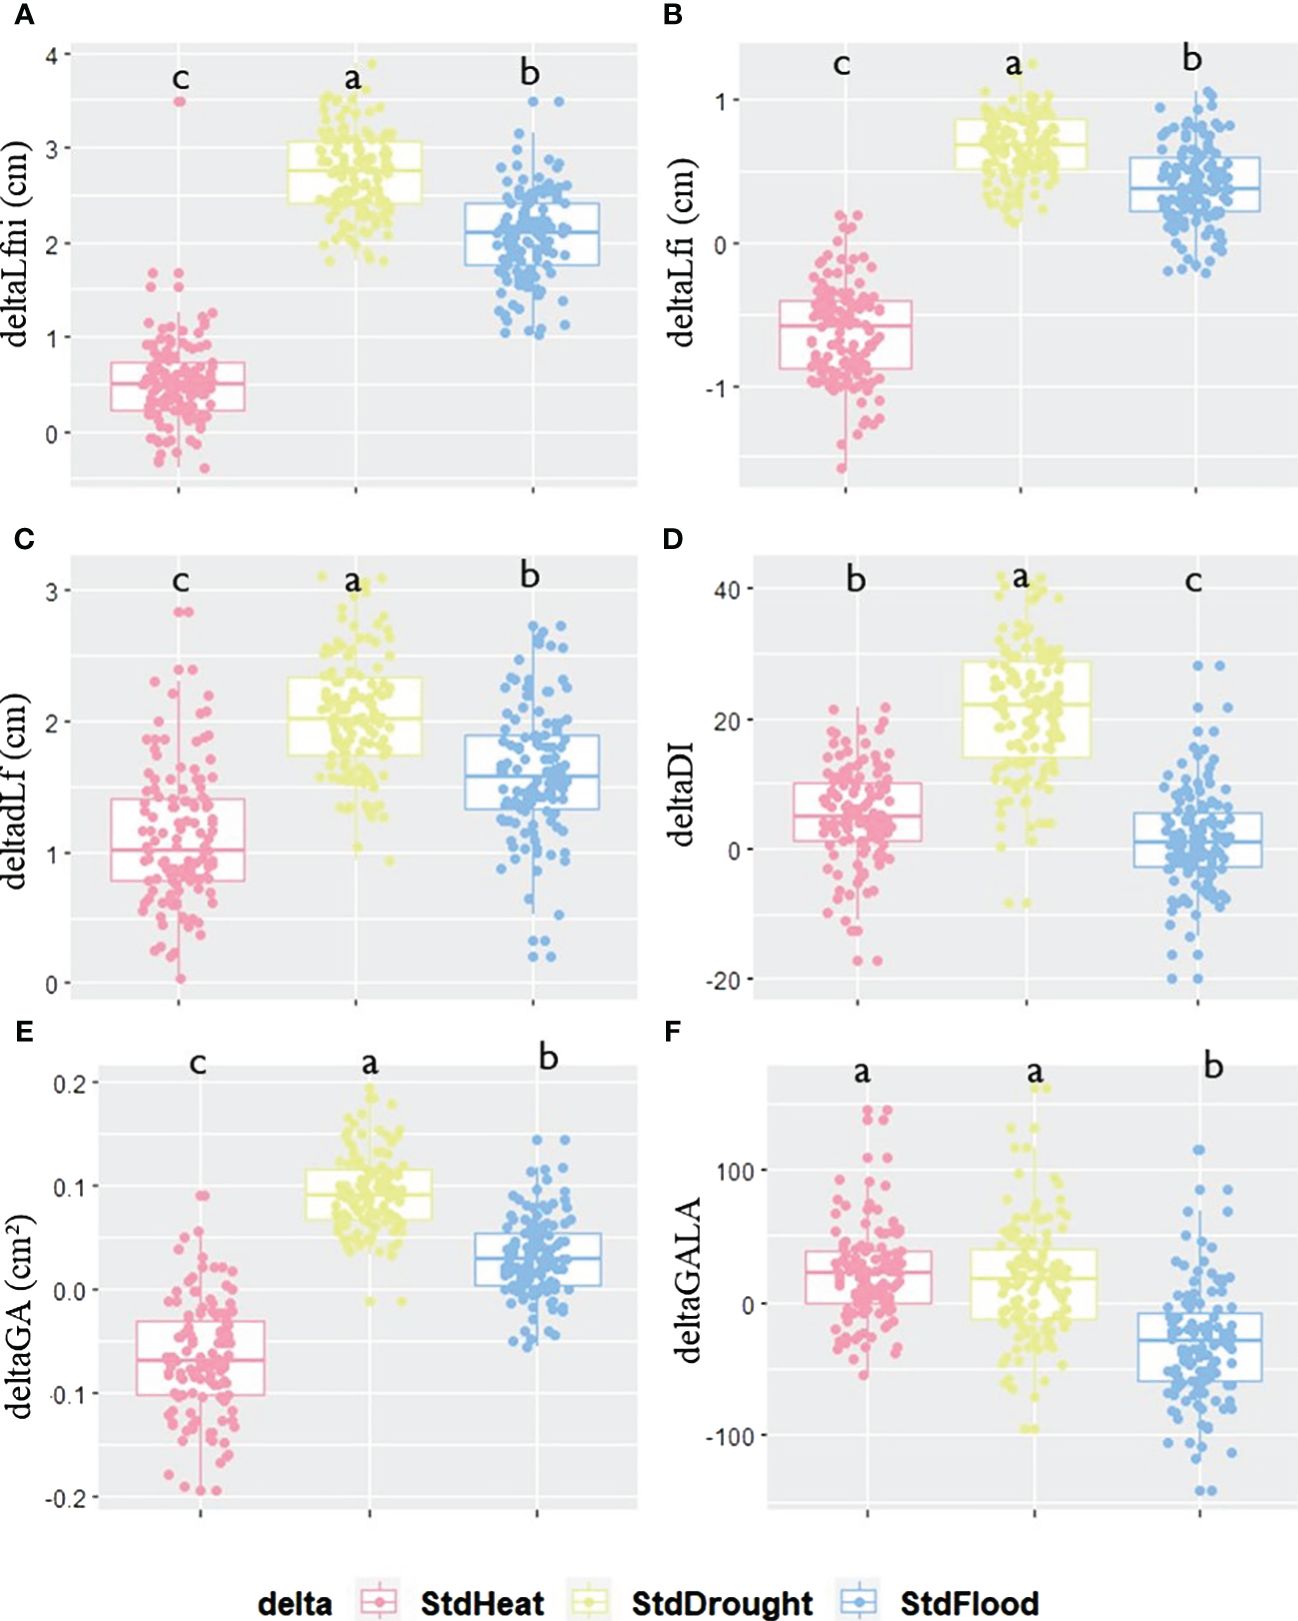
Figure 3 Phenotypic plasticity calculated as the difference between the value of each trait evaluated under STANDARD conditions and that assessed under one of the three other conditions: HEAT, DROUGHT, or FLOOD. Differences between STANDARD and HEAT (pink), STANDARD and DROUGHT (yellow), or STANDARD and FLOOD (blue) for each trait for (A) deltaLfni, (B) deltaLfi, (C) deltadLf, (D) deltaDI, (E) deltaGA, and (F) deltaGALA variables. Significant differences for each deltaTrait between conditions are given by different letters obtained by a Kruskal–Wallis test, p-value<0.05.
In order to find lines that were phenotypically more stable (deltaTraits close to 0) or more plastic (high absolute values of deltaTraits) in their response to P. brassicae regardless of abiotic conditions, principal component analysis (PCA) and K-means clusterisation were achieved using deltaTraits calculated between STANDARD and HEAT, DROUGHT, and FLOOD (Figures 4A, B). To facilitate the analysis and retain epiRIL with extreme phenotypes, the best quality epiRIL on the PCA was retained (square cosine >0.4). For each abiotic trait, the correlation between SdtHeat, StdDrought, and StdFlood was observed (Figure 4A). The first principal component was explained by deltaLfni and deltadLf, while the second principal component was mainly explained by deltaLfi and deltaGA. Ninety-one lines were kept and spread within three clusters (Figure 4B). EpiRIL in the first cluster displayed less plasticity regardless of the trait than the lines in the two other clusters, while lines in the second cluster displayed higher plasticity for GA and Lfi, and lines in the third cluster showed higher plasticity for dLf, Lfni, and GALA.
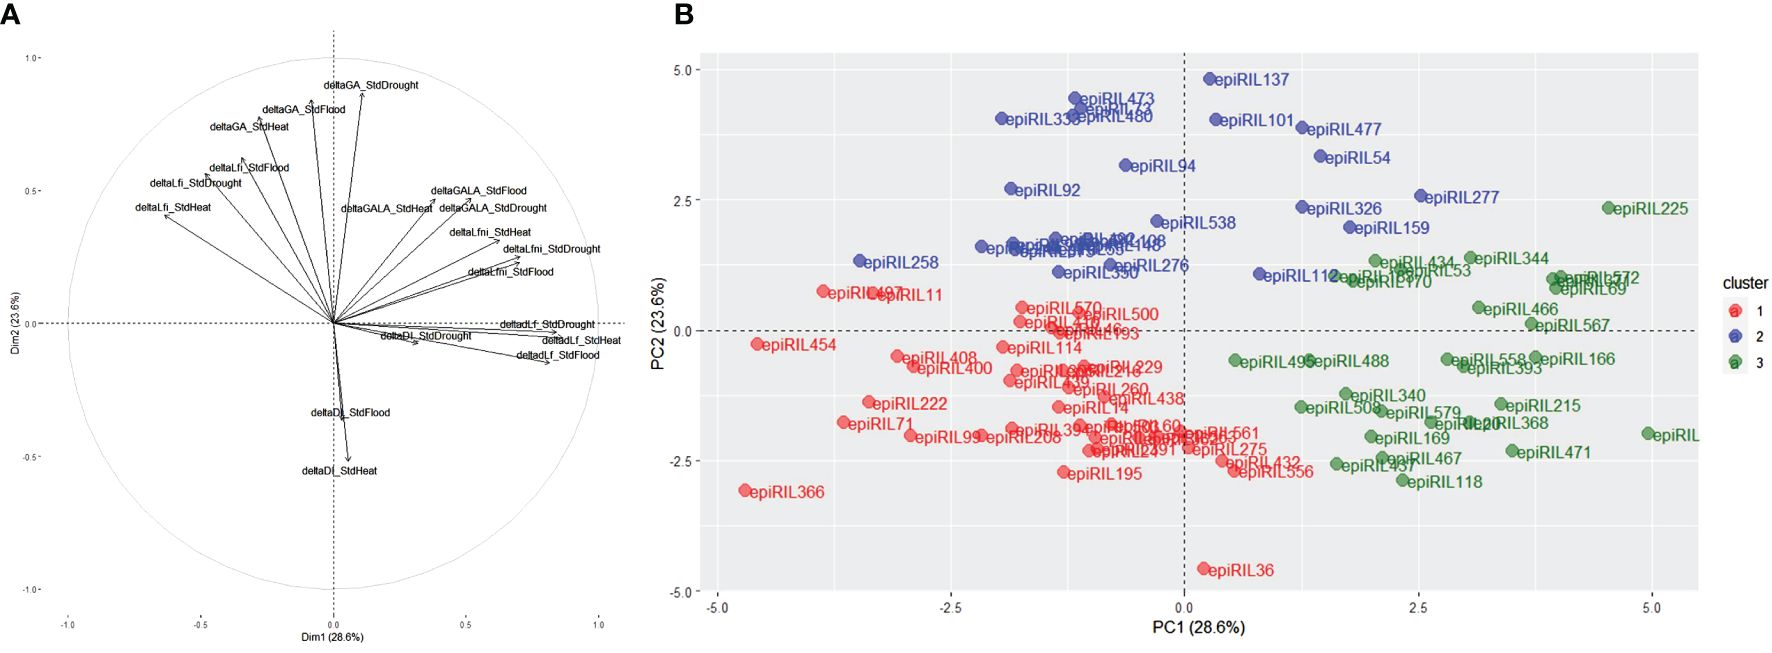
Figure 4 (A) Principal component analysis (PCA) displaying distributions of deltaTraits and (B) k-means clustering based on the PCA carried out for all deltaTraits for all conditions for the epiRIL with a cos2 higher than 0.4. epiRIL, epigenetic recombinant inbred line.
For each deltaTrait, the observed phenotypic plasticity varied moderately between abiotic conditions according to the deltaTraits. For deltaLfni, for example, lines belonging to the first cluster were less plastic for all abiotic conditions. For deltaLfi, lines belonging to the second cluster were less plastic under StdHeat, whereas for StdFlood and SdtDrought, the less plastic lines belonged to the third cluster (Supplementary Figure 6).
The distributions of all deltaTraits were continuous in the epiRIL population (Supplementary Figure 4). Ten moderate-effect QTLepi were found to control phenotypic plasticity (Table 3), and all were bona fide QTLepi (Supplementary Table 7). No QTLepi were detected for StdFlood. One QTLepi was detected for DI plasticity between STANDARD and HEAT and one for Lfi and Lfni plasticity between STANDARD and DROUGHT; three QTLepi were detected for GALA plasticity between STANDARD and HEAT, and four QTLepi were detected for GALA plasticity between STANDARD and DROUGHT. An epistatic interaction was found between two QTLepi controlling GALA plasticity under HEAT on chromosomes 1 and 5 (Table 3). EpiRIL carrying a Col-0 derived hypermethylation allele showed lower deltaGALA and deltaDI for StdHeat while displaying higher deltaLfni, deltaLfi, and deltaGALA for three out of four QTLepi for StdDrought (Supplementary Figure 7). For StdDrought, similar epigenetic control was observed for Lfi, Lfni, deltaLfi, and deltaLfni. Indeed, all QTLepi detected for deltaLfi and deltaLfni overlapped with QTLepi detected previously for Lfni and Lfi. For deltaGALA, four out of seven QTLepi detected overlapped with QTLepi detected for GALA. No QTLepi detected for deltaDI overlapped with QTLepi detected for DI (Supplementary Figure 8). Explained phenotypic variability by the detected QTLepi was similar for Lfni/deltaLfi and Lfi/deltaLfi (R2 Lfi = 16.8 ± 0.8; R2 Lfni = 9.9 ± 0.8; R2 deltaLfi = 9.55; R2 deltaLfni = 17.12) as well as for GALA (R2 = 18.84 ± 2.5) and deltaGALA (15.63 ± 8.1).
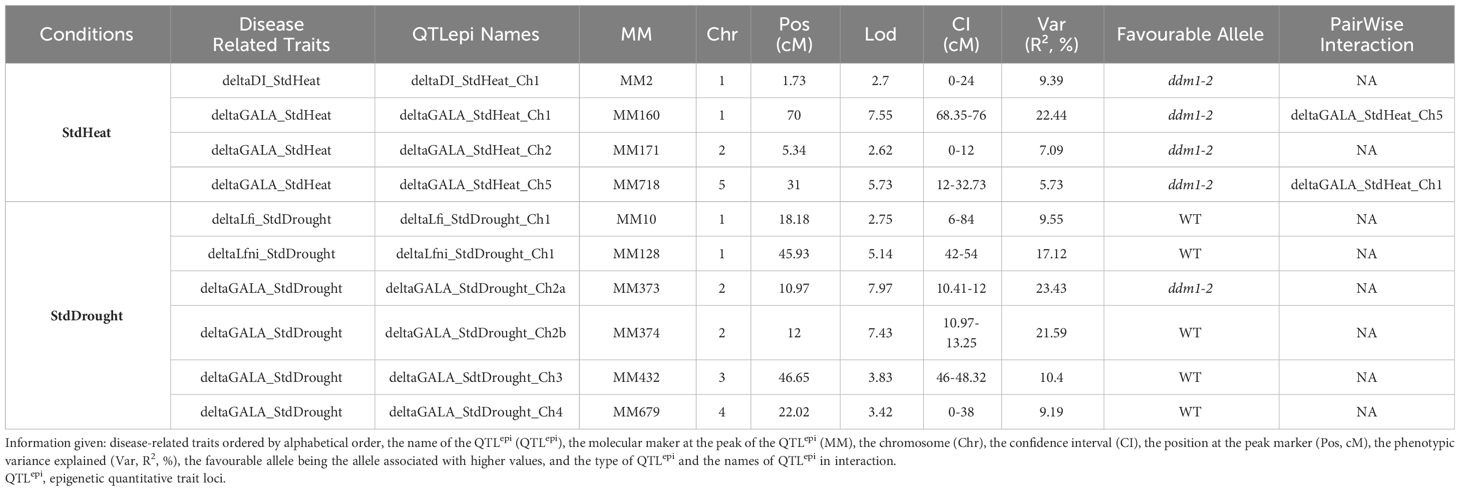
Table 3 Summary table of all the QTLepi detected for deltaDI_StdHeat, deltaGALA_StdHeat, deltaLfi_Drought, deltaLfni_Drought, and deltaGALA_StdDrought variables.
In the present study, we investigated the impact of three abiotic conditions on the response of A. thaliana against the protist P. brassicae and to what extent the epigenetic control of Arabidopsis response to clubroot was impacted by these abiotic conditions. To that aim, the epiRIL population of Johannes et al. (2009) was phenotyped under three abiotic conditions never before studied for this population: a punctual and moderate rise of temperature, a drought, or a flood. These abiotic conditions led to a significant modification in Arabidopsis leaf growth, its response to clubroot, and the epigenetic factors controlling these traits. This work also enabled the identification of QTLepi underlying the plastic response of A. thaliana to clubroot, which depended on the phenotypic traits assessed and the abiotic conditions. This study allowed us to extend our knowledge of the impact of abiotic conditions on the epigenetic factors controlling both plant responses to biotic and abiotic stresses and phenotypic plasticity.
Five to 10 QTLepi per condition and one to 10 QTLepi per trait were identified as involved in A. thaliana response to clubroot under the four different abiotic conditions. This small number of QTLepi can be explained by the lack of phenotypic variability observed for disease-related traits. Indeed, the 123 epiRIL studied were selected by Colome-Tatche et al. (2012) for their contrasted morphological traits and not for their response to pathogens. The small size of the epiRIL population (123 lines), the low number of epigenetic markers available (126 markers), and the bias in the segregation of the Col-0 (73%) and ddm1-2 (27%) epialleles may also have led to a lack of power in the linkage analyses.
Furthermore, the length of the longest leaf in each rosette was the only proxy used to estimate leaf growth; other criteria, such as leaf mass, leaf area, or even photosynthetic ratio per leaf area, were not taken into account. According to Weraduwage et al. (2015), the relationship between leaf area growth and plant growth is not necessarily linear, as it depends on carbon distribution in the plant tissues. This suggested that the use of the Lfni variable cannot reflect alone the complexity of leaf growth. For example, Kooke et al. (2015) evaluated the impact of salt stress on Arabidopsis development using several variables such as relative growth rate (RGR), leaf area at 20 days (LA20), and total plant height (TPH). Despite these limitations, measuring the length of the longest leaf enabled us to detect differences between conditions. The reduction in leaf size between the STANDARD and the other conditions also allowed us to validate that the plants perceived the constraints applied.
The small number of QTLepi detected within our study is coherent with the low number of QTLepi detected by Kooke et al. (2015) using the same epiRIL population tested under saline conditions. For example, LA20 was controlled by five and four QTLepi under control and saline conditions, respectively. Furthermore, the epigenetic markers (MM11 and MM160) at the peak of two of the five QTLepi detected in our study controlling leaf growth (Lfni and Lfi) were also those detected at the peak of the QTLepi in the study of Kooke et al. (2015). This may suggest that plant development was controlled by common epigenetic factors regardless of abiotic conditions. The lines carrying the hypomethylated allele were smaller than the lines carrying the hypermethylated allele for most leaf growth QTLepi, which is consistent with the growth abnormalities observed for the homozygous ddm1-2 mutant (Kakutani et al., 1996).
The abiotic constraints applied were chosen according to the characteristics and needs of both A. thaliana and the pathogen P. brassicae. Only a moderate drought was thus applied, as the zoospores of P. brassicae require high soil moisture to move and properly infect the plants (Aist and Williams, 1971; Iwama et al., 1994). Although the plant displayed reduced leaf growth, no wilting was observed, confirming that the drought applied is a moderate constraint for the plant (Bac-Molenaar et al., 2016). A previous study also demonstrated that soil water content, and more particularly flooding during 14 days, had an impact on both the outcome of the infection and the genetic factors involved in plant response to clubroot (Gravot et al., 2016). We applied a FLOOD constraint of only 7 days in contrast to Gravot et al. (2016), which led to a reduction in leaf growth and an enhanced production of anthocyanins, suggesting a plant response to oxidative stress caused by the water excess (Nakabayashi et al., 2014; Savchenko et al., 2019). Finally, the increase of 5°C for 7 days, which also led to a reduction of leaf growth, corresponds to a warm ambient temperature as described in Sriden and Charoensawan (2022) and is in accordance with the worst-case climate change scenario, which estimates for 2,100 an increase of more than 4°C (IPCC, 2023).
Comparison of the results obtained with literature data is complicated due to the diversity of conditions under which abiotic stresses were exerted in terms of duration, intensity, and time of application as well as the sequential or concomitant application of these stresses. In our study, increasing temperature to 27°C during the day and 24°C at night, for 7 days, led to a significant decrease in leaf growth. A temperature of 28°C had a significant negative effect on the total biomass of Arabidopsis (Jin et al., 2011) with a bigger hypocotyl and reduced developmental time (Hwang et al., 2017; Ibañez et al., 2017). Decreased plant growth, flowering time, and yield are commonly observed for several crops, such as wheat or oilseed rape at 29.5°C (Morrison and Stewart, 2002; Mondal et al., 2013). The DROUGHT and FLOOD conditions also led to a significant decrease in leaf growth in our study. Drought caused a reduction in leaf size in Medicago sativa (Quan et al., 2016), B. napus (Batool et al., 2023), and A. thaliana (Tisné et al., 2013; Bac-Molenaar et al., 2016, p.) as flooding in A. thaliana (Pigliucci, 2002). Concerning the epigenetic architecture controlling response to HEAT, DROUGHT, and FLOOD, we have detected a maximum of 10 moderate-effect QTLepi (R2 between 8% and 20%). A small number of moderate-effect QTLs have also been found to control plant response to water deficit (Tisné et al., 2013), as well as major genes in the control of plant tolerance to flooding (Akman et al., 2017) or drought (MarChadier et al., 2019).
Depending on the sources of resistance and the isolates studied, clubroot resistance in Brassicaceae is controlled by a few major resistance loci (Manzanares-Dauleux et al., 2000; Laperche et al., 2017; Aigu et al., 2018) or a small number of QTL/QTLepi with moderate effects (Rocherieux et al., 2004; Liégard et al., 2019), as in the present study. The epiRIL population was phenotyped for response against Hyaloperonospora arabidopsidis, a downy mildew pathogen of Arabidopsis (Furci et al., 2019), but no QTLepi was detected in common between our two studies, suggesting that the epigenetic factors involved in plant response to biotic stresses are pathogen-specific. It would be interesting to study the epigenetic determinism of the epiRIL response to other isolates of P. brassicae and other pathogens in order to determine the specificity of the detected epigenetic factors and their interest in the control of immunity in Arabidopsis.
For the first time, the impact of three abiotic constraints was studied on plant clubroot response and the underlying epigenetic factors controlling these traits using the epiRIL population. The importance of taking environmental factors into account for studying plant resistance to biotic attacks was highlighted in the 1960s (Walker, 1965), but to date, no trend could be drawn, as the impact of abiotic factors on plant response to pathogens is complex. Indeed, the outcome of the plant–pathogen interaction depends on the plant, the pathogen, as well as the environment, and the duration and the way in which the abiotic constraints are applied (Velásquez et al., 2018; Desaint et al., 2021; Zandalinas and Mittler, 2022). Under combined abiotic constraints, the plant physiological response observed is different than the response observed under one stress (Suzuki et al., 2014). Assessing the impact of combined biotic and abiotic stress is all the more complex as the pathogen can also be impacted by the abiotic stress (Pandey et al., 2015). For instance, the temperature of 27°C that we used in the HEAT condition is above the optimum temperature for the growth of P. brassicae, which is 25°C (Sharma et al., 2011a); similarly, the DROUGHT conditions may have impaired P. brassicae life cycle (infection of the cortex cells by the secondary spores), as both the epiRIL population and the susceptible Brassica ECD5 showed lower susceptibility. This lower susceptibility to clubroot may indeed be explained by a lower infection of plants by P. brassicae due to the poor survival and/or motility of zoospores in a dry environment (Aist and Williams, 1971; Iwama et al., 1994) but also by the obligatory biotrophic nature of P. brassicae, whose development therefore depends on that of its host plant (Rolfe et al., 2016; Schwelm et al., 2016). Depending on the abiotic constraints, their application, and the pathosystem, abiotic constraints can lead to a decrease or an increase in symptoms. Under drought, a decrease in tomato grey mould infection (Achuo et al., 2006) and an increase in the susceptibility of common bean to charcoal rot disease (Mayek-Pérez et al., 2002) were observed. Taken together, these results strongly highlight the importance and complexity of the impact of abiotic factors on plant–pathogen interactions since abiotic factors can impair the development of both plants and pathogens and their interaction.
Epigenetic factors controlling response to clubroot were specific to one or several abiotic conditions. We were able to detect 18 QTLepi common to at least two abiotic conditions and 13 QTLepi specific to the abiotic condition applied, suggesting that the epigenetic architecture controlling response to clubroot includes both QTLepi stable regardless of the abiotic conditions and QTLepi specific to each abiotic condition. We cannot compare these results to the literature because, to our knowledge, no other work has been conducted on the impact of abiotic factors on the epigenetic architecture controlling plant response to biotic stresses. However, in several works dealing with genetic control of resistance, the same genetic factors of resistance were detected under different abiotic conditions. In a previous study, we showed that two resistance QTL to clubroot were systematically detected regardless of the nitrogen supply but had a different effect depending on the nutritional constraint (Laperche et al., 2017). Galiano-Carneiro et al. (2021) reported the stability of genetic factors involved in corn resistance to leaf blight across multi-environmental conditions. On the contrary, in A. thaliana, new QTLs resistant to Ralstonia solanacearum were detected under conditions of increased temperature (Aoun et al., 2017). All QTLepi detected in all conditions in our study displayed similar moderate effects. However, we cannot completely exclude the possibility of modulation of the QTLepi effect by abiotic constraints since the lack of detection power in the epiRIL population could prevent the detection of weak-effect QTLepi. Thus, QTLepi qualified as specific must therefore be taken with caution, and additional work is necessary to evaluate and confirm their specificity. Only single abiotic constraints were assessed in this work, but studying the combined effect of several abiotic stresses or with a different application time on the resistance to a pathogen could allow us to better understand the plant response to real and fluctuating environmental constraints.
The majority of QTLepi were located within the pericentromeric regions of Arabidopsis chromosomes, most likely due to the involvement of DDM1 in maintaining transposable element methylation (Cortijo et al., 2014) in the pericentromeric regions. However, three QTLepi (GALA-Ch5-DROUGH, GALA-Ch5-FLOOD, and DI-Chr5-DROUGHT) were also identified outside these regions. These QTLepi overlapped with Pb-At5.2, a QTL previously detected by Jubault et al. (2008) using a RIL population from the cross Col-0 × Bur-0 and whose effect was modulated by the water irrigation regime (Gravot et al., 2016). Pb-At5.2 QTL fine-mapping led to the identification of two causal NLR genes AT5G47260 and AT5G47280 controlled by a natural epimutation (Gravot et al., 2024). However, because these AT5G47260/AT5G47280 genes are 500 kbp distant from the MM863 epimarker at the peak of the three QTLepi and a large number of genes in the QTLepi confidence interval (more than 900 genes), we could not conclude whether or not it is the same causal gene(s). The QTLepi at the end of chromosome 5 also overlapped with a QTLepi at the epimarker 859 controlling short-chain glucosinolate levels (Aller et al., 2018), even if no candidate gene involved in glucosinolate biosynthesis pathway was found in the QTLepi detected by Aller et al. (2018). Further work is therefore needed to identify the causal genes underlying these QTLepi.
Phenotypic plasticity was assessed as the ability of individual epiRIL to modulate their phenotype according to environmental conditions (Bradshaw, 1965). For each genotype, plasticity was found to be dependent on both the abiotic conditions applied and the traits assessed. Phenotypic plasticity was brought depending on the traits observed by both hyper- and hypomethylated alleles, while previous work on saline stress associated more plasticity with the lines carrying the hypermethylated allele at the epigenetic marker of the QTLepi (Kooke et al., 2015). While the QTLepi controlling developmental plasticity overlapped with the QTLepi detected for the developmental trait (leaf length), the QTLepi controlling the disease-related trait plasticity were different from those controlling the associated phenotypic trait, suggesting that different factors are involved in the control of plasticity and their related traits. In A. thaliana, in a recent study identifying the genetic factors controlling flower-size plasticity at different temperatures, the authors also showed that the genetic control of the plasticity differed from the control of flower size itself (Wiszniewski et al., 2022). The specificity of QTL controlling phenotypic plasticity has also been observed in crops, such as tomato (Diouf et al., 2020; Bineau et al., 2021) and maize (Kusmec et al., 2017). If minimising the interaction between the epigenotype and the environment would assure a stable resistance in several environmental conditions, looking for lines particularly plastic for one condition could also be relevant in plant breeding.
While the control of disease resistance traits by transgenerational epimutations has already been demonstrated (Furci et al., 2019; Liégard et al., 2019; Gravot et al., 2024), our study reported for the first time the modulation by environmental conditions of epigenetic factors underlying partial clubroot resistance in A. thaliana. We have shown an epigenetic control of the phenotypic variability under all constraint conditions. Although further characterisation and validation of the epigenetic factors detected here as involved in clubroot resistance are still required, our work highlights the potential uses of epigenetic diversity to improve biotic stress resistance in the context of climate change (Gahlaut et al., 2020; Dalakouras and Vlachostergios, 2021). The role of heritable DNA methylation in the control of complex traits was already shown in crops of high agronomical interest such as Brassica (Long et al., 2011) or trees like Populus (Lu et al., 2020). The search for epimutations associated with clubroot resistance in Brassica crops could help to better understand the involvement of epigenetic factors in plant immunity. Taken together, all these results open the prospect of using epigenetic factors in plant breeding.
The datasets presented in this study can be found in online repositories. The names of the repository/repositories and accession number(s) can be found below: https://entrepot.recherche.data.gouv.fr/, https://doi.org/10.57745/GSZHJO.
MP, RL, MLD MJ, JL and CLar carried out the experiments and collected the data. MP, RL, ML, JL and CLar carried out the molecular biology work. MP carried out the genetic analyses and the bioinformatics analyses. CLan help with the monitoring of the experiment. MP, MM-D and MJ wrote the article and MP, MM-D and MJ designed and coordinated the study. All authors contributed to the article and approved the submitted version.
The author(s) declare financial support was received for the research, authorship, and/or publication of this article. This research was supported by L’Institut Agro Rennes-Angers, INRAE and Université de Rennes. Mathilde Petitpas was a PhD student co-funded by INRAE BAP department and Brittany Region.
We acknowledge our IGEPP Colleagues for their technical support and the Biological Resource Centers BrACySol and Versailles Arabidopsis Stock Center for providing Brassica and epiRIL seeds, respectively.
The authors declare that the research was conducted in the absence of any commercial or financial relationships that could be construed as a potential conflict of interest.
All claims expressed in this article are solely those of the authors and do not necessarily represent those of their affiliated organizations, or those of the publisher, the editors and the reviewers. Any product that may be evaluated in this article, or claim that may be made by its manufacturer, is not guaranteed or endorsed by the publisher.
The Supplementary Material for this article can be found online at: https://www.frontiersin.org/articles/10.3389/fpls.2024.1245545/full#supplementary-material
Achuo, E. A., Prinsen, E., Hofte, M. (2006). Influence of drought, salt stress and abscisic acid on the resistance of tomato to Botrytis cinerea and Oidium neolycopersici. Plant Pathol. 55, 178–186. doi: 10.1111/j.1365-3059.2006.01340.x
Aigu, Y., Laperche, A., Mendes, J., Lariagon, C., Guichard, S., Gravot, A., et al. (2018). Nitrogen supply exerts a major/minor switch between two QTLs controlling Plasmodiophora brassicae spore content in rapeseed. Plant Pathol. 67, 1574–1581. doi: 10.1111/ppa.12867
Aist, J. R., Williams, P. H. (1971). The cytology and kinetics of cabbage root hair penetration by Plasmodiophora brassicae. Can. J. Bot. 49, 2023–2034. doi: 10.1139/b71-284
Akman, M., Kleine, R., van Tienderen, P. H., Schranz, E. M. (2017). Identification of the submergence tolerance QTL come quick drowning1 (CQD1) in Arabidopsis thaliana. J. Hered 108, 308–317. doi: 10.1093/jhered/esx014
Aller, E. S. T., Jagd, L. M., Kliebenstein, D. J., Burow, M. (2018). Comparison of the relative potential for epigenetic and genetic variation to contribute to trait stability. G3 Genes|Genomes|Genetics 8, 1733–1746. doi: 10.1534/g3.118.200127
Aoun, N., Tauleigne, L., Lonjon, F., Deslandes, L., Vailleau, F., Roux, F., et al. (2017). Quantitative Disease Resistance under Elevated Temperature: Genetic Basis of New Resistance Mechanisms to Ralstonia solanacearum. Front. Plant Sci. 8. doi: 10.3389/fpls.2017.01387
Arends, D., Prins, P., Jansen, R. C., Broman, K. W. (2010). R/qtl: high-throughput multiple QTL mapping: Fig. 1. Bioinformatics 26, 2990–2992. doi: 10.1093/bioinformatics/btq565
Bac-Molenaar, J. A., Granier, C., Keurentjes, J. J. B., Vreugdenhil, D. (2016). Genome-wide association mapping of time-dependent growth responses to moderate drought stress in Arabidopsis. Plant Cell Environ. 39, 88–102. doi: 10.1111/pce.12595
Barbetti, M. J., Banga, S. S., Salisbury, P. A. (2012). Challenges for crop production and management from pathogen biodiversity and diseases under current and future climate scenarios – Case study with oilseed Brassicas. Field Crops Res. 127, 225–240. doi: 10.1016/j.fcr.2011.11.021
Batool, M., El-Badri, A. M., Hassan, M. U., Haiyun, Y., Chunyun, W., Zhenkun, Y., et al. (2023). Drought stress in brassica napus: effects, tolerance mechanisms, and management strategies. J. Plant Growth Regul. 42, 21–45. doi: 10.1007/s00344-021-10542-9
Bhadra, P., Maitra, S., Shankar, T., Hossain, A., Praharaj, S., Aftab, T. (2022). “Climate change impact on plants: Plant responses and adaptations,” in Plant Perspectives to Global Climate Changes (Elsevier), 1–24. doi: 10.1016/B978-0-323-85665-2.00004-2
Bidzinski, P., Ballini, E., Ducasse, A., Michel, C., Zuluaga, P., Genga, A., et al. (2016). Transcriptional basis of drought-induced susceptibility to the rice blast fungus Magnaporthe oryzae. Front. Plant Sci. 7. doi: 10.3389/fpls.2016.01558
Bineau, E., Diouf, I., Carretero, Y., Duboscq, R., Bitton, F., Djari, A., et al. (2021). Genetic diversity of tomato response to heat stress at the QTL and transcriptome levels. Plant J. 107, 1213–1227. doi: 10.1111/tpj.15379
Boyes, D. C., Zayed, A. M., Ascenzi, R., McCaskill, A. J., Hoffman, N. E., Davis, K. R., et al. (2001). Growth Stage–Based Phenotypic Analysis of Arabidopsis: A Model for High Throughput Functional Genomics in Plants, Vol. 12. doi: 10.1105/TPC.010011
Bradshaw, A. D. (1965). “Evolutionary significance of phenotypic plasticity in plants,” in Advances in Genetics (Elsevier), 115–155. doi: 10.1016/S0065-2660(08)60048-6
Broman, K. W., Wu, H., Sen, S., Churchill, G. A. (2003). R/qtl: QTL mapping in experimental crosses. Bioinformatics 19, 889–890. doi: 10.1093/bioinformatics/btg112
Colome-Tatche, M., Cortijo, S., Wardenaar, R., Morgado, L., Lahouze, B., Sarazin, A., et al. (2012). Features of the Arabidopsis recombination landscape resulting from the combined loss of sequence variation and DNA methylation. Proc. Natl. Acad. Sci. 109, 16240–16245. doi: 10.1073/pnas.1212955109
Cortijo, S., Wardenaar, R., Colome-Tatche, M., Gilly, A., Etcheverry, M., Labadie, K., et al. (2014). Mapping the epigenetic basis of complex traits. Science 343, 1145–1148. doi: 10.1126/science.1248127
Dalakouras, A., Vlachostergios, D. (2021). Epigenetic approaches to crop breeding: current status and perspectives. J. Exp. Bot. 72, 5356–5371. doi: 10.1093/jxb/erab227
Deleris, A., Halter, T., Navarro, L. (2016). DNA methylation and demethylation in plant immunity. Annu. Rev. Phytopathol. 54, 579–603. doi: 10.1146/annurev-phyto-080615-100308
Desaint, H., Aoun, N., Deslandes, L., Vailleau, F., Roux, F., Berthomé, R. (2021). Fight hard or die trying: when plants face pathogens under heat stress. New Phytol. 229, 712–734. doi: 10.1111/nph.16965
Diouf, I., Derivot, L., Koussevitzky, S., Carretero, Y., Bitton, F., Moreau, L., et al. (2020). Genetic basis of phenotypic plasticity and genotype × environment interactions in a multi-parental tomato population. J. Exp. Bot. 71, 5365–5376. doi: 10.1093/jxb/eraa265
Dixon, G. R. (2009). The occurrence and economic impact of Plasmodiophora brassicae and Clubroot disease. J. Plant Growth Regul. 28, 194–202. doi: 10.1007/s00344-009-9090-y
Dowen, R. H., Pelizzola, M., Schmitz, R. J., Lister, R., Dowen, J. M., Nery, J. R., et al. (2012). Widespread dynamic DNA methylation in response to biotic stress. Proc. Natl. Acad. Sci. 109, E2183–E2191. doi: 10.1073/pnas.1209329109
Fahling, M., Graf, H., Siemens, J. (2003). Pathotype separation of Plasmodiophora brassicae by the host plant. J. Phytopathol. 151, 425–430. doi: 10.1046/j.1439-0434.2003.00744.x
Furci, L., Jain, R., Stassen, J., Berkowitz, O., Whelan, J., Roquis, D., et al. (2019). Identification and characterisation of hypomethylated DNA loci controlling quantitative resistance in Arabidopsis. eLife 8, e40655. doi: 10.7554/eLife.40655
Gahlaut, V., Zinta, G., Jaiswal, V., Kumar, S. (2020). Quantitative epigenetics: A new avenue for crop improvement. Epigenomes 4, 25. doi: 10.3390/epigenomes4040025
Galiano-Carneiro, A. L., Kessel, B., Presterl, T., Miedaner, T. (2021). Intercontinental trials reveal stable QTL for Northern corn leaf blight resistance in Europe and in Brazil. Theor. Appl. Genet. 134, 63–79. doi: 10.1007/s00122-020-03682-1
Gilly, A., Etcheverry, M., Madoui, M.-A., Guy, J., Quadrana, L., Alberti, A., et al. (2014). TE-Tracker: systematic identification of transposition events through whole-genome resequencing. BMC Bioinf. 15, 377. doi: 10.1186/s12859-014-0377-z
Gossen, B. D., Adhikari, K. K. C., McDonald, M. R. (2012). Effects of temperature on infection and subsequent development of clubroot under controlled conditions: Effects of temperature on clubroot. Plant Pathol. 61, 593–599. doi: 10.1111/j.1365-3059.2011.02536.x
Gravot, A., Grillet, L., Wagner, G., Jubault, M., Lariagon, C., Baron, C., et al. (2011). Genetic and physiological analysis of the relationship between partial resistance to clubroot and tolerance to trehalose in Arabidopsis thaliana. New Phytol. 191, 1083–1094. doi: 10.1111/j.1469-8137.2011.03751.x
Gravot, A., Lemarié, S., Richard, G., Lime, T., Lariagon, C., Manzanares-Dauleux, M. J. (2016). Flooding affects the development of Plasmodiophora brassicae in Arabidopsis roots during the secondary phase of infection. Plant Pathol. 65, 1153–1160. doi: 10.1111/ppa.12487
Gravot, A., Liégard, B., Quadrana, L., Veillet, F., Aigu, Y., Bargain, T., et al. (2024). Two adjacent NLR genes conferring quantitative resistance to clubroot disease in Arabidopsis are regulated by a stably inherited epiallelic variation. Plant Commun., 100824. doi: 10.1016/j.xplc.2024.100824
Heard, E., Martienssen, R. A. (2014). Transgenerational epigenetic inheritance: myths and mechanisms. Cell 157, 95–109. doi: 10.1016/j.cell.2014.02.045
Hwang, G., Zhu, J.-Y., Lee, Y. K., Kim, S., Nguyen, T. T., Kim, J., et al. (2017). PIF4 promotes expression of LNG1 and LNG2 to induce thermomorphogenic growth in Arabidopsis. Front. Plant Sci. 8. doi: 10.3389/fpls.2017.01320
Ibañez, C., Poeschl, Y., Peterson, T., Bellstädt, J., Denk, K., Gogol-Döring, A., et al. (2017). Ambient temperature and genotype differentially affect developmental and phenotypic plasticity in Arabidopsis thaliana. BMC Plant Biol. 17, 114. doi: 10.1186/s12870-017-1068-5
IPCC (2023). “IPCIPCC 2023: summary for policymakers,” in Climate Change 2023: Synthesis Report. A Report of the Intergovernmental Panel on Climate Change. Contribution of Working Groups I, II and III to the Sixth Assessment Report of the Intergovernmental Panel on Climate Change [Core Writing Team, H. Lee and J. Romero (eds.)]. IPCC, Geneva, Switzerland, pp. 1–34. doi: 10.59327/IPCC/AR6-9789291691647.001
Iwama, H., Osozawa, S., Ushiroda, T., Kubota, T. (1994). Analysis of soil water matric potential requirement for infection of turnip with Plasmodiophora brassicae using negative pressure water circulation technique. Soil Sci. Plant Nutr. 40, 293–299. doi: 10.1080/00380768.1994.10413303
Jin, B., Wang, L., Wang, J., Jiang, K.-Z., Wang, Y., Jiang, X.-X., et al. (2011). The effect of experimental warming on leaf functional traits, leaf structure and leaf biochemistry in Arabidopsis thaliana. BMC Plant Biol. 11, 35. doi: 10.1186/1471-2229-11-35
Johannes, F., Porcher, E., Teixeira, F. K., Saliba-Colombani, V., Simon, M., Agier, N., et al. (2009). Assessing the impact of transgenerational epigenetic variation on complex traits. PloS Genet. 5, e1000530. doi: 10.1371/journal.pgen.1000530
Jubault, M., Lariagon, C., Simon, M., Delourme, R., Manzanares-Dauleux, M. J. (2008). Identification of quantitative trait loci controlling partial clubroot resistance in new mapping populations of Arabidopsis thaliana. Theor. Appl. Genet. 117, 191–202. doi: 10.1007/s00122-008-0765-8
Kakutani, T., Jeddeloh, J. A., Flowers, S. K., Munakata, K., Richards, E. J. (1996). Developmental abnormalities and epimutations associated with DNA hypomethylation mutations. Proc. Natl. Acad. Sci. U.S.A. 93, 12406–12411. doi: 10.1073/pnas.93.22.12406
Kassambara, A., Mundt, F. (2020) factoextra: Extract and Visualize the Results of Multivariate Data Analyses. Available online at: https://cran.r-project.org/web/packages/factoextra/index.html (Accessed June 6, 2023).
Kooke, R., Johannes, F., Wardenaar, R., Becker, F., Etcheverry, M., Colot, V., et al. (2015). Epigenetic basis of morphological variation and phenotypic plasticity in Arabidopsis thaliana. Plant Cell 27, 337–348. doi: 10.1105/tpc.114.133025
Kusmec, A., Srinivasan, S., Nettleton, D., Schnable, P. S. (2017). Distinct genetic architectures for phenotype means and plasticities in Zea mays. Nat. Plants 3, 715–723. doi: 10.1038/s41477-017-0007-7
Laperche, A., Aigu, Y., Jubault, M., Ollier, M., Guichard, S., Glory, P., et al. (2017). Clubroot resistance QTL are modulated by nitrogen input in Brassica napus. Theor. Appl. Genet. 130, 669–684. doi: 10.1007/s00122-016-2842-8
Lê, S., Josse, J., Husson, F. (2008). FactoMineR: an R package for multivariate analysis. J. Stat. Soft. 25(1), 1–18. doi: 10.18637/jss.v025.i01
Lee, J., Izzah, N. K., Choi, B.-S., Joh, H. J., Lee, S.-C., Perumal, S., et al. (2015). Genotyping-by-sequencing map permits identification of clubroot resistance QTLs and revision of the reference genome assembly in cabbage ( Brassica oleracea L.). DNA Res., dsv034. doi: 10.1093/dnares/dsv034
Liégard, B., Baillet, V., Etcheverry, M., Joseph, E., Lariagon, C., Lemoine, J., et al. (2019). Quantitative resistance to clubroot infection mediated by transgenerational epigenetic variation in Arabidopsis. New Phytol. 222, 468–479. doi: 10.1111/nph.15579
Liu, L., Qin, L., Zhou, Z., Hendriks, W. G. H. M., Liu, S., Wei, Y. (2020). Refining the life cycle of Plasmodiophora brassicae. Phytopathology® 110, 1704–1712. doi: 10.1094/PHYTO-02-20-0029-R
Long, Y., Xia, W., Li, R., Wang, J., Shao, M., Feng, J., et al. (2011). Epigenetic QTL mapping in Brassica napus. Genetics 189, 1093–1102. doi: 10.1534/genetics.111.131615
Lu, W., Xiao, L., Quan, M., Wang, Q., El-Kassaby, Y. A., Du, Q., et al. (2020). Linkage-linkage disequilibrium dissection of the epigenetic quantitative trait loci (epiQTLs) underlying growth and wood properties in Populus. New Phytol. 225, 1218–1233. doi: 10.1111/nph.16220
Manzanares-Dauleux, M. J., Delourme, R., Baron, F., Thomas, G. (2000). Mapping of one major gene and of QTLs involved in resistance to clubroot in Brassica napus. Theor. Appl. Genet. 101, 885–891. doi: 10.1007/s001220051557
MarChadier, E., Hanemian, M., Tisné, S., Bach, L., Bazakos, C., Gilbault, E., et al. (2019). The complex genetic architecture of shoot growth natural variation in Arabidopsis thaliana. PloS Genet. 15, e1007954. doi: 10.1371/journal.pgen.1007954
Mayek-Pérez, N., GarcÍa-Espinosa, R., López-Castañeda, Cá., Acosta-Gallegos, J. A., Simpson, J. (2002). Water relations, histopathology and growth of common bean (Phaseolus vulgaris L.) during pathogenesis of Macrophomina phaseolina under drought stress. Physiol. Mol. Plant Pathol. 60, 185–195. doi: 10.1006/pmpp.2001.0388
Mondal, S., Singh, R. P., Crossa, J., Huerta-Espino, J., Sharma, I., Chatrath, R., et al. (2013). Earliness in wheat: A key to adaptation under terminal and continual high temperature stress in South Asia. Field Crops Res. 151, 19–26. doi: 10.1016/j.fcr.2013.06.015
Morrison, M. J., Stewart, D. W. (2002). Heat stress during flowering in summer brassica. Crop Sci. 42, 797–803. doi: 10.2135/cropsci2002.7970
Nakabayashi, R., Yonekura-Sakakibara, K., Urano, K., Suzuki, M., Yamada, Y., Nishizawa, T., et al. (2014). Enhancement of oxidative and drought tolerance in Arabidopsis by overaccumulation of antioxidant flavonoids. Plant J. 77, 367–379. doi: 10.1111/tpj.12388
O’Brien, P., Kral-O’Brien, K., Hatfield, J. L. (2021). Agronomic approach to understanding climate change and food security. Agron. J. 113, 4616–4626. doi: 10.1002/agj2.20693
Pandey, P., Ramegowda, V., Senthil-Kumar, M. (2015). Shared and unique responses of plants to multiple individual stresses and stress combinations: physiological and molecular mechanisms. Front. Plant Sci. 6. doi: 10.3389/fpls.2015.00723
Pigliucci, M. (2002). Phenotypic plasticity and integration in response to flooded conditions in natural accessions of Arabidopsis thaliana (L.) Heynh (Brassicaceae). Ann. Bot. 90, 199–207. doi: 10.1093/aob/mcf164
Quadrana, L., Colot, V. (2016). Plant transgenerational epigenetics. Annu. Rev. Genet. 50, 467–491. doi: 10.1146/annurev-genet-120215-035254
Quan, W., Liu, X., Wang, H., Chan, Z. (2016). Comparative physiological and transcriptional analyses of two contrasting drought tolerant alfalfa varieties. Front. Plant Sci. 6. doi: 10.3389/fpls.2015.01256
R Core Team (2022). R: A language and environment for statistical computing (R Foundation for Statistical Computing). Available at: https://www.R-project.org/.
Rocherieux, J., Glory, P., Giboulot, A., Boury, S., Barbeyron, G., Thomas, G., et al. (2004). Isolate-specific and broad-spectrum QTLs are involved in the control of clubroot in Brassica oleracea. Theor. Appl. Genet. 108, 1555–1563. doi: 10.1007/s00122-003-1580-x
Rolfe, S. A., Strelkov, S. E., Links, M. G., Clarke, W. E., Robinson, S. J., Djavaheri, M., et al. (2016). The compact genome of the plant pathogen Plasmodiophora brassicae is adapted to intracellular interactions with host Brassica spp. BMC Genomics 17, 272. doi: 10.1186/s12864-016-2597-2
Savchenko, T., Rolletschek, H., Heinzel, N., Tikhonov, K., Dehesh, K. (2019). Waterlogging tolerance rendered by oxylipin-mediated metabolic reprogramming in Arabidopsis. J. Exp. Bot. 70, 2919–2932. doi: 10.1093/jxb/erz110
Schindelin, J., Arganda-Carreras, I., Frise, E., Kaynig, V., Longair, M., Pietzsch, T., et al. (2012). Fiji: an open-source platform for biological-image analysis. Nat. Methods 9, 676–682. doi: 10.1038/nmeth.2019
Schwelm, A., Dixelius, C., Ludwig-Müller, J. (2016). New kid on the block – the clubroot pathogen genome moves the plasmodiophorids into the genomic era. Eur. J. Plant Pathol. 145, 531–542. doi: 10.1007/s10658-015-0839-9
Sharma, K., Gossen, B. D., McDonald, M. R. (2011a). Effect of temperature on cortical infection by Plasmodiophora brassicae and clubroot severity. Phytopathology® 101, 1424–1432. doi: 10.1094/PHYTO-04-11-0124
Sharma, K., Gossen, B. D., McDonald, M. R. (2011b). Effect of temperature on primary infection by Plasmodiophora brassicae and initiation of clubroot symptoms: Temperature affects primary infection by P. brassicae. Plant Pathol. 60, 830–838. doi: 10.1111/j.1365-3059.2011.02458.x
Some, A., Manzanares, M. J., Laurens, F., Baron, F., Thomas, G., Rouxel, F. (1996). Variation for virulence on Brassica napus L. amongst Plasmodiophora brassicae collections from France and derived single-spore isolates. Plant Pathol. 45, 432–439. doi: 10.1046/j.1365-3059.1996.d01-155.x
Sriden, N., Charoensawan, V. (2022). Large-scale comparative transcriptomic analysis of temperature-responsive genes in Arabidopsis thaliana. Plant Mol. Biol. 110, 425–443. doi: 10.1007/s11103-021-01223-y
Suzuki, N., Rivero, R. M., Shulaev, V., Blumwald, E., Mittler, R. (2014). Abiotic and biotic stress combinations. New Phytol. 203, 32–43. doi: 10.1111/nph.12797
Tisné, S., Serrand, Y., Bach, L., Gilbault, E., Ben Ameur, R., Balasse, H., et al. (2013). Phenoscope: an automated large-scale phenotyping platform offering high spatial homogeneity. Plant J. 74, 534–544. doi: 10.1111/tpj.12131
Velásquez, A. C., Castroverde, C. D. M., He, S. Y. (2018). Plant–pathogen warfare under changing climate conditions. Curr. Biol. 28, R619–R634. doi: 10.1016/j.cub.2018.03.054
Waddington, C. H. (1959). Canalization of development and genetic assimilation of acquired characters. Nature 183, 1654–1655. doi: 10.1038/1831654a0
Walker, J. C. (1965). Use of environmental factors in screening for disease resistance. Annu. Rev. Phytopathol. 3, 197–208. doi: 10.1146/annurev.py.03.090165.001213
Weraduwage, S. M., Chen, J., Anozie, F. C., Morales, A., Weise, S. E., Sharkey, T. D. (2015). The relationship between leaf area growth and biomass accumulation in Arabidopsis thaliana. Front. Plant Sci. 6. doi: 10.3389/fpls.2015.00167
Wiszniewski, A., Uberegui, E., Messer, M., Sultanova, G., Borghi, M., Duarte, G. T., et al. (2022). Temperature-mediated flower size plasticity in Arabidopsis. iScience 25, 105411. doi: 10.1016/j.isci.2022.105411
Zandalinas, S. I., Mittler, R. (2022). Plant responses to multifactorial stress combination. New Phytol. 234, 1161–1167. doi: 10.1111/nph.18087
Keywords: DNA methylation, temperature rise, flood, drought, clubroot, plasticity
Citation: Petitpas M, Lapous R, Le Duc M, Lariagon C, Lemoine J, Langrume C, Manzanares-Dauleux MJ and Jubault M (2024) Environmental conditions modulate the effect of epigenetic factors controlling the response of Arabidopsis thaliana to Plasmodiophora brassicae. Front. Plant Sci. 15:1245545. doi: 10.3389/fpls.2024.1245545
Received: 23 June 2023; Accepted: 26 April 2024;
Published: 29 May 2024.
Edited by:
Muthusamy Ramakrishnan, Nanjing Forestry University, ChinaReviewed by:
Carlos Marcelino Rodriguez Lopez, University of Kentucky, United StatesCopyright © 2024 Petitpas, Lapous, Le Duc, Lariagon, Lemoine, Langrume, Manzanares-Dauleux and Jubault. This is an open-access article distributed under the terms of the Creative Commons Attribution License (CC BY). The use, distribution or reproduction in other forums is permitted, provided the original author(s) and the copyright owner(s) are credited and that the original publication in this journal is cited, in accordance with accepted academic practice. No use, distribution or reproduction is permitted which does not comply with these terms.
*Correspondence: Mélanie Jubault, bWVsYW5pZS5qdWJhdWx0QGFncm9jYW1wdXMtb3Vlc3QuZnI=
Disclaimer: All claims expressed in this article are solely those of the authors and do not necessarily represent those of their affiliated organizations, or those of the publisher, the editors and the reviewers. Any product that may be evaluated in this article or claim that may be made by its manufacturer is not guaranteed or endorsed by the publisher.
Research integrity at Frontiers
Learn more about the work of our research integrity team to safeguard the quality of each article we publish.