 Cheng Jiang1,2,3
 Zhibin Xu1
 Xiaoli Fan1
 Qiang Zhou1Guangsi Ji1,3Simin Liao1,3Yanlin Wang1,3Fang Ma1,3
 Yun Zhao2Tao Wang1,4
 Bo Feng1*
- 1Chengdu Institute of Biology, Chinese Academy of Sciences, Chengdu, China
- 2College of Life Sciences, Sichuan University, Chengdu, China
- 3University of Chinese Academy of Sciences, Beijing, China
- 4The Innovative of Seed Design, Chinese Academy of Sciences, Beijing, China
Grain number per spike (GNS) is a crucial component of grain yield and plays a significant role in improving wheat yield. To identify quantitative trait loci (QTL) associated with GNS, a recombinant inbred line (RIL) population derived from the cross of Zhongkemai 13F10 and Chuanmai 42 was employed to conduct QTL mapping across eight environments. Based on the bulked segregant exome sequencing (BSE-Seq), genomic regions associated with GNS were detected on chromosomes 5A and 6A. According to the constructed genetic maps, two major QTL QGns.cib-5A (LOD = 4.35–8.16, PVE = 8.46–14.43%) and QGns.cib-6A (LOD = 3.82–30.80, PVE = 5.44–12.38%) were detected in five and four environments, respectively. QGns.cib-6A is a QTL cluster for other seven yield-related traits. QGns.cib-5A and QGns.cib-6A were further validated using linked Kompetitive Allele Specific PCR (KASP) markers in different genetic backgrounds. QGns.cib-5A exhibited pleiotropic effects on productive tiller number (PTN), spike length (SL), fertile spikelet number per spike (FSN), and ratio of grain length to grain width (GL/GW) but did not significantly affect thousand grain weight (TGW). Haplotype analysis revealed that QGns.cib-5A and QGns.cib-6A were the targets of artificial selection during wheat improvement. Candidate genes for QGns.cib-5A and QGns.cib-6A were predicted by analyzing gene annotation, spatiotemporal expression patterns, and orthologous and sequence differences. These findings will be valuable for fine mapping and map-based cloning of genes underlying QGns.cib-5A and QGns.cib-6A.
Introduction
Wheat (Triticum aestivum L.) is a vital crop that provides a substantial portion of the world’s food. However, as the world population continues to grow, the demand for food is increasing. Despite the current annual growth rate of wheat production reaching 0.9%, it falls short of the required annual growth rate of approximately 2.4% needed to sustain the world population by 2050 (Ray et al., 2013; Gao, 2021). As a result, enhancing the yield potential has become a fundamental objective in wheat breeding. Grain yield is a complex quantitative trait mainly determined by three factors: spike number per unit area, thousand grain weight (TGW), and grain number per spike (GNS). Therefore, revealing the genetic factors underlying GNS is essential to improve yield potential.
The genetic regulatory pathways governing architecture of the inflorescence play a crucial role in determining GNS in wheat. Generally, spike development can be divided into three main phases: the duration of the flowering transition; initiation, distribution, and termination of spikelet meristem (SM); formation and generation of floret meristem (FM) (Luo et al., 2023). During the flowering transition period, several widely recognized genes involved in flowering time participate in regulating the timing of inflorescence meristem (IM) differentiation and the initiation of spikelet and floret development. During the vernalization-induced flowering process, VERNALIZATION 1 (VRN1) serves as a central regulatory gene, playing a crucial role in maintaining IM activity and controlling SM characteristics. Similar to VRN1, FRUITFULL2 (FUL2) and FRUITFULL3 (FUL3) redundantly facilitate the transition from SAM to IM (Li et al., 2019). The photoperiod gene Photoperiod-1 (Ppd-1) in wheat influences inflorescence structure. Insufficient Ppd-D1 leads to the formation of paired spikelet and an increase in grain count under short sunlight conditions (Boden et al., 2015). VRN3/TaFT1, a homolog of Flowering Locus T (FT) in Arabidopsis and the Heading date 3a (Hd3a) in rice, interacts with the transcription factor TaFDL2 to activate VRN1 (Yan et al., 2006; Li and Dubcovsky, 2008). Additionally, VRN1 and Ppd-1 positively regulate VRN3/TaFT1 and TaFT2, whereas VRN2 is known to act as a transcriptional inhibitor of these genes (Yan et al., 2004; Chen and Dubcovsky, 2012; Shaw et al., 2019). TaFT2 controls the initiation and quantification of spikelets. PHYTOCHROME C (PHYC) acts as an upstream regulatory factor, activating Ppd-1 and VRN3/TaFT1. The TCP transcription factor TEOSINTE BRANCHED 1 (TaTB1) inhibits spike formation (Dixon et al., 2018).
The transition from IM to SM is crucial for establishing the inflorescence structure in Gramineae plants during spikelet initiation, distribution, and termination. Overexpression of wheat AGAMOUS-LIKE6 (TaAGL6) affects the expression of meristem-active genes like FUL2 and TaMADS55, resulting in a significant increase in the number of spikelets and grains per spike (Kong et al., 2021). Wheat FRIZY PANICLE (WFZP), a member of the class II AP2/ERF transcription factor (TF), directly activates VRN1-A and HOMEOBOX4 (TaHOX4)-A. In addition, WFZP also acts as an inhibitor of the spikelet formation gene BARREN STALK1 (TaBA1), exerting a dual effect (Poursarebani et al., 2015; Du et al., 2021; Li et al., 2021). The microRNA156 (miR156)-SPL module is crucial in initiating SM development during wheat spike development. MiR156 regulates SPL family genes, including TaSPL3/17 in wheat. TaSPL3/17 interacts with DWARF53 (TaD53) to regulate the expression of genes TaTB1 and TaBA1, which are involved in the differentiation of spikelet meristem and floral meristem. This interaction ultimately affects wheat spikelet development (Liu et al., 2017). The miR172-AP2 module also plays a critical role in the proper development of spikelets (Debernardi et al., 2017; Zhong et al., 2021). The q/ap2l5 mutant exhibits a significant reduction in spikelet number, which can be attributed to the premature transformation of spikelet meristem into terminal spikelet (Debernardi et al., 2020).
The interactions among MADS, SPL, TCP, and AP2 TFs play an essential role in promoting or maintaining the characteristics of SM and FM, which significantly influence the development of wheat floret. The E-class SEP genes are primarily responsible for regulating the floral organs’ development (Pelaz et al., 2000; Ditta et al., 2004). Upregulation TaVRT2, a MADS-box gene belonging to the SHORT VEGETATIVE PHASE (SVP) branch, causes the downregulation of TaSEP1. As a result, the transformation of spikelet into floret is delayed, resulting in an increased number of basal spikelets (Backhaus et al., 2022). The SQUAMOSA proteins VRN1 and FUL2 function as repressors of the SVP branch MADS box genes, such as TaVRT2, TaSVP1, and TaSVP3. These proteins stimulate the formation of small flowers following the transition to flowering (Li et al., 2019; Li et al., 2021; Liu et al., 2021). Therefore, the downregulation of SQUAMOSA protein for SVP gene expression is essential to promoting SEP gene expression and ensuring normal flower development (Li et al., 2021; Backhaus et al., 2022). Upregulation of the miR156 target gene TaSPL13 leads to an increased production of small flowers and grains per spike in wheat (Li et al., 2020). Q/AP2L5 and AP2L2 redundantly recognize and prevent small flowers from degenerating into glumes through miR172-guided mechanisms (Debernardi et al., 2017; Debernardi et al., 2020).
Like other traits related to yield, GNS is a quantitative trait influenced by both genetic and environmental factors. As a result, researchers have preliminarily focused on mapping quantitative trait loci (QTL) in various genetic or natural populations of wheat. Up to now, numerous QTL associated with GNS have been identified across 21 chromosomes in previous studies (Börner et al., 2002; Peng et al., 2003; Huang et al., 2004; Quarrie et al., 2005; Liu et al., 2006; Kumar et al., 2007; Cuthbert et al., 2008; Wang et al., 2009; McIntyre et al., 2010; Wang et al., 2011; Blanco et al., 2012; Rustgi et al., 2013; Azadi et al., 2014; Gao et al., 2015; Zhang et al., 2016; Roncallo et al., 2017; Guan et al., 2018; Liu et al., 2019; Hu et al., 2020; Mizuno et al., 2021; Qiao et al., 2022; Hu et al., 2023). However, few major QTL have been found that can be detected in multiple environments and validated in different genetic backgrounds, hindering their utilization in breeding programs. Therefore, it is essential to identify and validate the novel QTL/genes associated with GNS.
In the present study, we utilized bulked segregant exome sequencing (BSE-Seq) and linkage analysis to identify QTL that control GNS. The major QTL were subsequently validated in different genetic backgrounds, and potential candidate genes were predicted. Additionally, an analysis of the haplotypes of the major QTL was conducted.
Materials and methods
Plant materials and field trials
Three genetic populations obtained through the single-seed descent method as well as a natural population were employed in this study. They were (1) a recombinant inbred line (RIL) population (13CM, 316 F7 lines) derived from the cross of Zhongkemai 13F10 (ZKM13F10) and Chuanmai 42 (CM42); (2) an F2 population (CZ5782, 184 individuals) derived from the cross of Chuanmai 104 (CM104) and ZM5782; (3) an F2 population (CS352, 126 individuals) derived from the cross of CM104 and SH352; and (4) a natural population containing 321 wheat accessions, including 59 widely grown cultivars during the last two decades and 262 accessions of Chinese wheat mini-core collection (88 modern cultivars, 17 introduced cultivars, and 157 landraces) (Li et al., 2022). The 13CM population was used to construct genetic map and detect QTL; CZ5782 and CS352 were used to validate the target QTL in different genetic backgrounds, and the natural population was used for haplotype analysis.
ZKM13F10 (ZKM138/PW18) is a stable breeding line selected by our lab characterized by high GNS. CM42 (Syncd768/SW3243//Chuan6415) is a core cultivar that has been used as one of the parents to develop more than 50 new cultivars in China. It possesses desirable yield-related traits including high grain weight and wide adaptability. CM104 is a cultivar derived from CM42 and inherits its major elite traits (including high grain weight and long spike). SH352 and ZM5782 are wheat lines to construct populations used for validating the major QTL.
The 13CM population and its parents were cultivated in eight different environments: Shuangliu (103°52′E, 30°34′N) during the 2017–2018, 2018–2019, 2019–2020, and 2020–2021 growing seasons (referred to as E1, E3, E5, and E7, respectively), and Shifang (104°11′E, 31°6′N) during the 2017–2018, 2018–2019, 2019–2020, and 2020–2021 seasons (referred to as E2, E4, E6, and E8, respectively). CZ5782 and CS352 individuals were cultivated in Shifang during the 2021–2022 growing season. Each plot had two rows. The row length and row spacing were 1.2 m and 0.2 m, respectively, and each row sowed 12 seeds. At sowing time, the fertilizer (N: 25%, P2O5: 10%, K2O: 10%) was applied with 450 kg/ha. The local standard practices were applied in field management.
Phenotypic evaluation and statistical analysis
At maturity, eight plants from each line of 13CM, as well as the parents, were randomly selected for phenotypic evaluation. Traits including plant height (PHT), productive tiller number (PTN), spike length (SL), fertile spikelet number (FSN), and GNS were measured manually. The average values of these traits from the eight selected plants in each line were utilized for statistical analysis. Additionally, after air-drying, grain length (GL), grain width (GW), the ratio of GL to GW (GL/GW), and thousand grain weight (TGW) were measured. The spike compactness (SC) was calculated by dividing FSN by SL. GNFS was calculated by dividing GNS by FSN. The detailed method was conducted as described previously (Ji et al., 2021).
Descriptive statistics, Pearson’s correlation analysis, normal distribution, and Student’s t-test were carried out using SPSS v24.0 (SPSS, Chicago, USA). The QTL IciMapping v4.2 software (https://isbreeding.caas.cn/rj/qtllcmapping/) was used to calculate the broad-sense heritability (H2) and the best linear unbiased estimation (BLUE) dataset for each trait. OriginPro v2019 (https://www.originlab.com/) was employed to create the histogram distribution, scatter plot, and box plot. The Pearson’s correlation coefficients were utilized to examine the correlations between GNS and the other traits. Furthermore, by considering the genotypes of the flanking markers, lines harboring different alleles were compared using Student’s t-test, with a significance level set at P < 0.05.
BSE-Seq analysis
The high-quality genomic DNA from 13CM lines and the parents was extracted by a modified hexadecyltrimethylammonium bromide (CTAB) method. Based on the phenotypic data obtained in E1–E6, lines in each environment were rearranged from low to high. To construct extreme mixing pools, 30 lines within each of two tails with stable phenotype in at least four of the six environments were selected. Two pools (GNS-H and GNS-L) were bulked using an equal amount (1 µg) of DNA from the selected 30 individuals. The two pools and the parents were utilized for BSE-Seq analysis performed by Bioacme Biotechnology Co., Ltd. (Wuhan, China).
The raw data from this study have been deposited in the Genome Sequence Archive (Chen et al., 2021) at the National Genomics Data Center (CNCB-NGDC Members and Partners, 2022), which is a part of the China National Center for Bioinformation/Beijing Institute of Genomics, Chinese Academy of Sciences (GSA: CRA008821 for ZKM13F10 and CM42, CAR009113 for GNS-H and GNS-L). These datasets are publicly accessible and can be found at https://ngdc.cncb.ac.cn/gsa. The processing of raw data was performed according to the previously method (Ji et al., 2023). In this study, two methods Euclidean distance (ED) and Δ(SNP-index) were employed to identify SNP and InDel sites between the paired pools. The detailed analytical method was described previously (Yu et al., 2022).
Development of molecular markers
Based on the BSE-Seq data, SNP/InDel in the associated genomic regions between the parents and extreme pools were converted to develop Kompetitive Allele-specific PCR (KASP) markers for genetic map construction. Common primers were designed from Triticae Multi-omics Center (http://202.194.139.32/). FAM and HEX probe sequences were added to the 5’ end of primers. The KASP genotype identification was performed in the QuantStudio™ 3 Real-Time PCR system designed by Thermo Fisher Scientific, with a reaction mixture containing 5 µL 2× main mixture, 0.8 µL primer mixture, 3 µL ddH2O, and 2 µL DNA template (50 ng/mL–100 ng/mL). The conditions and procedures for touchdown PCR was referred to Yu et al. (2022).
Genetic map construction and QTL detection
The genetic map was constructed by JoinMap v4.1, and the QTL was detected by QTL IciMapping v4.2 (Meng et al., 2015). Markers that co-localized with others and had a missing rate more than 20% were discarded. The maximum likelihood mapping algorithm and Kosambi’s mapping function were utilized to establish marker order and calculate marker distance. QTL detection in each environment was conducted using the QTL IciMapping v4.2 software based on the Inclusive Composite Interval Mapping (ICIM) method in the Biparental Population (BIP) module, and the LOD threshold was set as 2.5. The interaction of QTL×environment (QE) was performed using QTL IciMapping v4.2 according to Multi-Environment Trails module (LOD = 2.5, PIN = 0.001, and step = 4 cM). QTL repeatedly identified in at least three environments were treated as stable. Moreover, QTL explaining more than 10% of the phenotypic variation was considered as major. Confidence intervals were estimated by the position ± 1 LOD. QTL with overlapping confidence intervals were considered equivalent and named according to the international genetic naming rules (http://wheat.pw.usda.gov/ggpages/wgc/98/Intro.htm), where ‘cib’ represents ‘Chengdu Institute of Biology’.
Haplotype analysis
Haplotypes at the crucial regions of the major QTL were analyzed based on the resequencing data of 145 landmark cultivars in China (http://wheat.cau.edu.cn/Wheat_SnpHub_Portal/). Subsequently, a natural population comprising 321 wheat accessions was used to conduct haplotype analysis. These accessions were planted in Shifang during the 2022–2023 growing season. The planting and phenotypic evaluation were conducted following the same protocols as the 13CM lines.
Prediction of candidate genes
Based on the mapping results, the physical positions of the flanking markers were converted from IWGSC RefSeq v1.0 to v2.1 using the Triticae Multi-omics Center (Zhu et al., 2021). The annotation and function of the genes located between the flanking markers were analyzed using Uniport (https://www.uniprot.org/). The expression pattern of the candidate genes was obtained from expVIP (http://www.wheat-expression.com/). These expression data were normalized using the ZeroToOne method and further presented in the HeatMap drawn by TBtools (Chen et al., 2020). The orthologues from rice (Oryza sativa L. Japonica group) and Arabidopsis thaliana were identified using Ensembl Plants (https://plants.ensembl.org/Triticum_aestivum/Info/Index). The functional information of these orthologues was obtained from China Rice Data Center (https://www.ricedata.cn/) for rice orthologues and tair (https://www.arabidopsis.org/) for Arabidopsis orthologues. In addition, based on the BSE-Seq data, nonsynonymous SNPs present in the exon regions of genes within the target regions were collected.
Results
Phenotypic performance
The GNS of ZKM13F10 was higher than that of CM42 in most environments. Significant differences in GNS between ZKM13F10 and CM42 were observed in E1, E4, E7 and the BLUE dataset (P < 0.05 or P < 0.01) (Table 1). In the 13CM population, GNS showed extensive and significant variation. Based on the BLUE dataset, the range of GNS variation was 42.86–72.47. The estimated value of H2 of GNS was 0.83, indicating that GNS was mainly controlled by genetic factors. The continuous distribution of GNS across eight environments and the BLUE dataset showed that it is a typical quantitative trait controlled by multiple genes (Supplementary Figure 1 and Table 1). In multiple environments, the significant Pearson correlation of GNS ranged from 0.27 to 0.99 (P < 0.001) (Supplementary Figure 1).
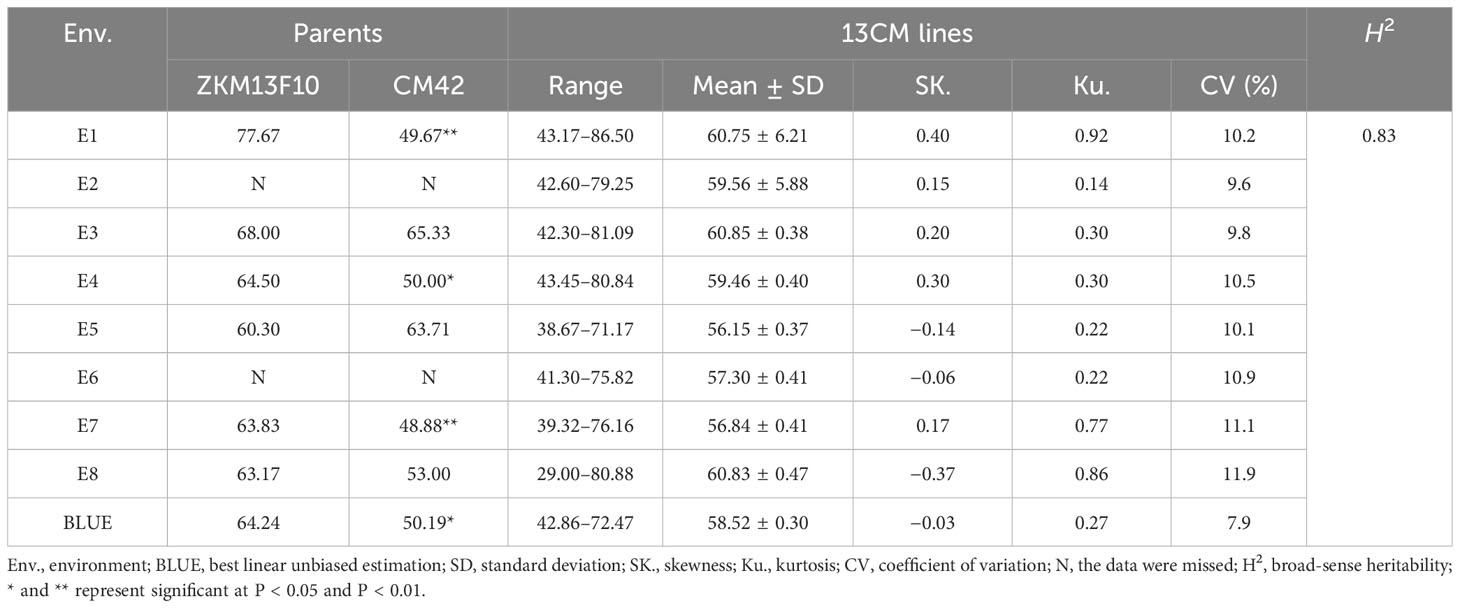
Table 1 Phenotypic variation and heritability (H2) of grain number per spike (GNS) of the parents and 13CM lines in eight environments and the BLUE dataset.
Correlation analysis between GNS and other yield-related traits
The Pearson’s correlation between GNS and other yield-related traits was evaluated using the BLUE dataset (Figure 1). Significant and negative correlations were detected between GNS and GL, GW, GL/GW, TGW, and PHT (P < 0.01 or P < 0.001). Moreover, GNS was significantly (P < 0.001) and positively correlated with FSN, GNFS, and SC. No significant correlation was observed between GNS and PTN (r = −0.069) or SL (r = 0.022). The correlation coefficient between GNS and GNFS was highest (r = 0.83).
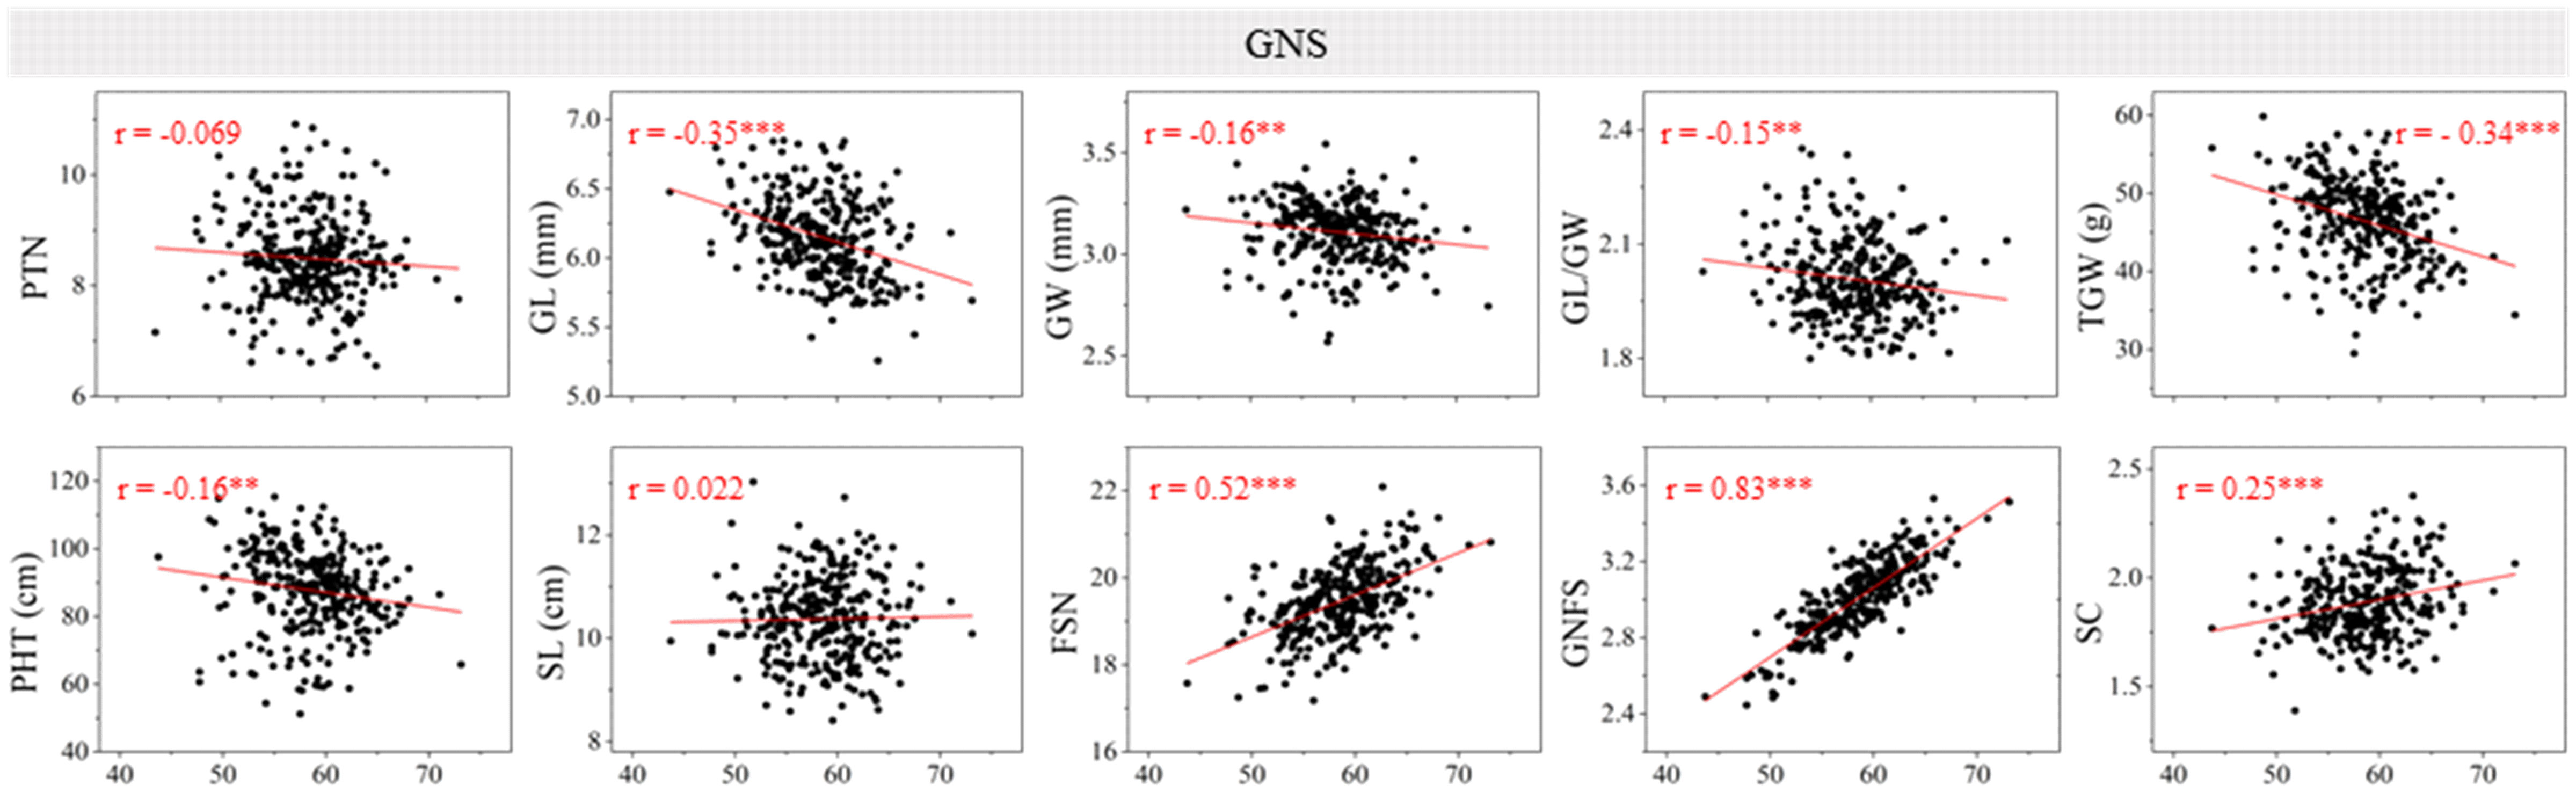
Figure 1 Coefficients of the pairwise Pearson’s correlations between grain number per spike (GNS) and other yield-related traits in the 13CM population. The traits include productive tiller number (PTN), grain length (GL), grain width (GW), GL/GW, thousand grain weight (TGW), plant height (PHT), spike length (SL), fertile spikelet number per spike (FSN), grain number per fertile spikelet (GNFS), and spike compactness (SC) (the coefficient of the pairwise Pearson’s correlations between GNS and FSN, GNFS have been published in Jiang et al., 2023). ** and *** represent significance at P < 0.01 and P < 0.001.
BSE-Seq analyses
Based on the BSE-Seq data from four libraries, genomic regions associated with GNS were detected (Supplementary Table 1). After filtering, the numbers of clean reads in the four libraries were 77,283,512 (ZKM13F10), 91,988,190 (CM42), 119,966,894 (GNS-H), and 171,166,254 (GNS-L), respectively. This result indicates that the data volume is sufficient for the subsequent analysis (Supplementary Table 2). Approximately 99.44% or higher of the captured reads were successfully mapped to the reference genome. The average sequencing depths ranged from 20.03× to 64.96×. Moreover, the coverage ≥5× varied from 60.38% to 78.15% in the four libraries, demonstrating high quality and adequate sequencing depth for BSE-Seq analysis. A total of 5,969,324 SNPs were identified in the dataset, and the number of SNPs per chromosome ranged from 58,929 to 630,245.
The ED and Δ(SNP-index) methods were used to detect genomic regions associated with GNS. Based on these results, genomic regions associated with GNS were detected on chromosomes 5A and 6A by ED and on chromosomes 4B, 5A, and 6A by Δ(SNP-index), respectively (Figure 2 and Supplementary Table 3). Specifically, the overlapping physical intervals detected by both methods were found in the range of 404.14 Mb–440.88 Mb on chromosome 5A and in 265.97 Mb–320.49 Mb on chromosome 6A.
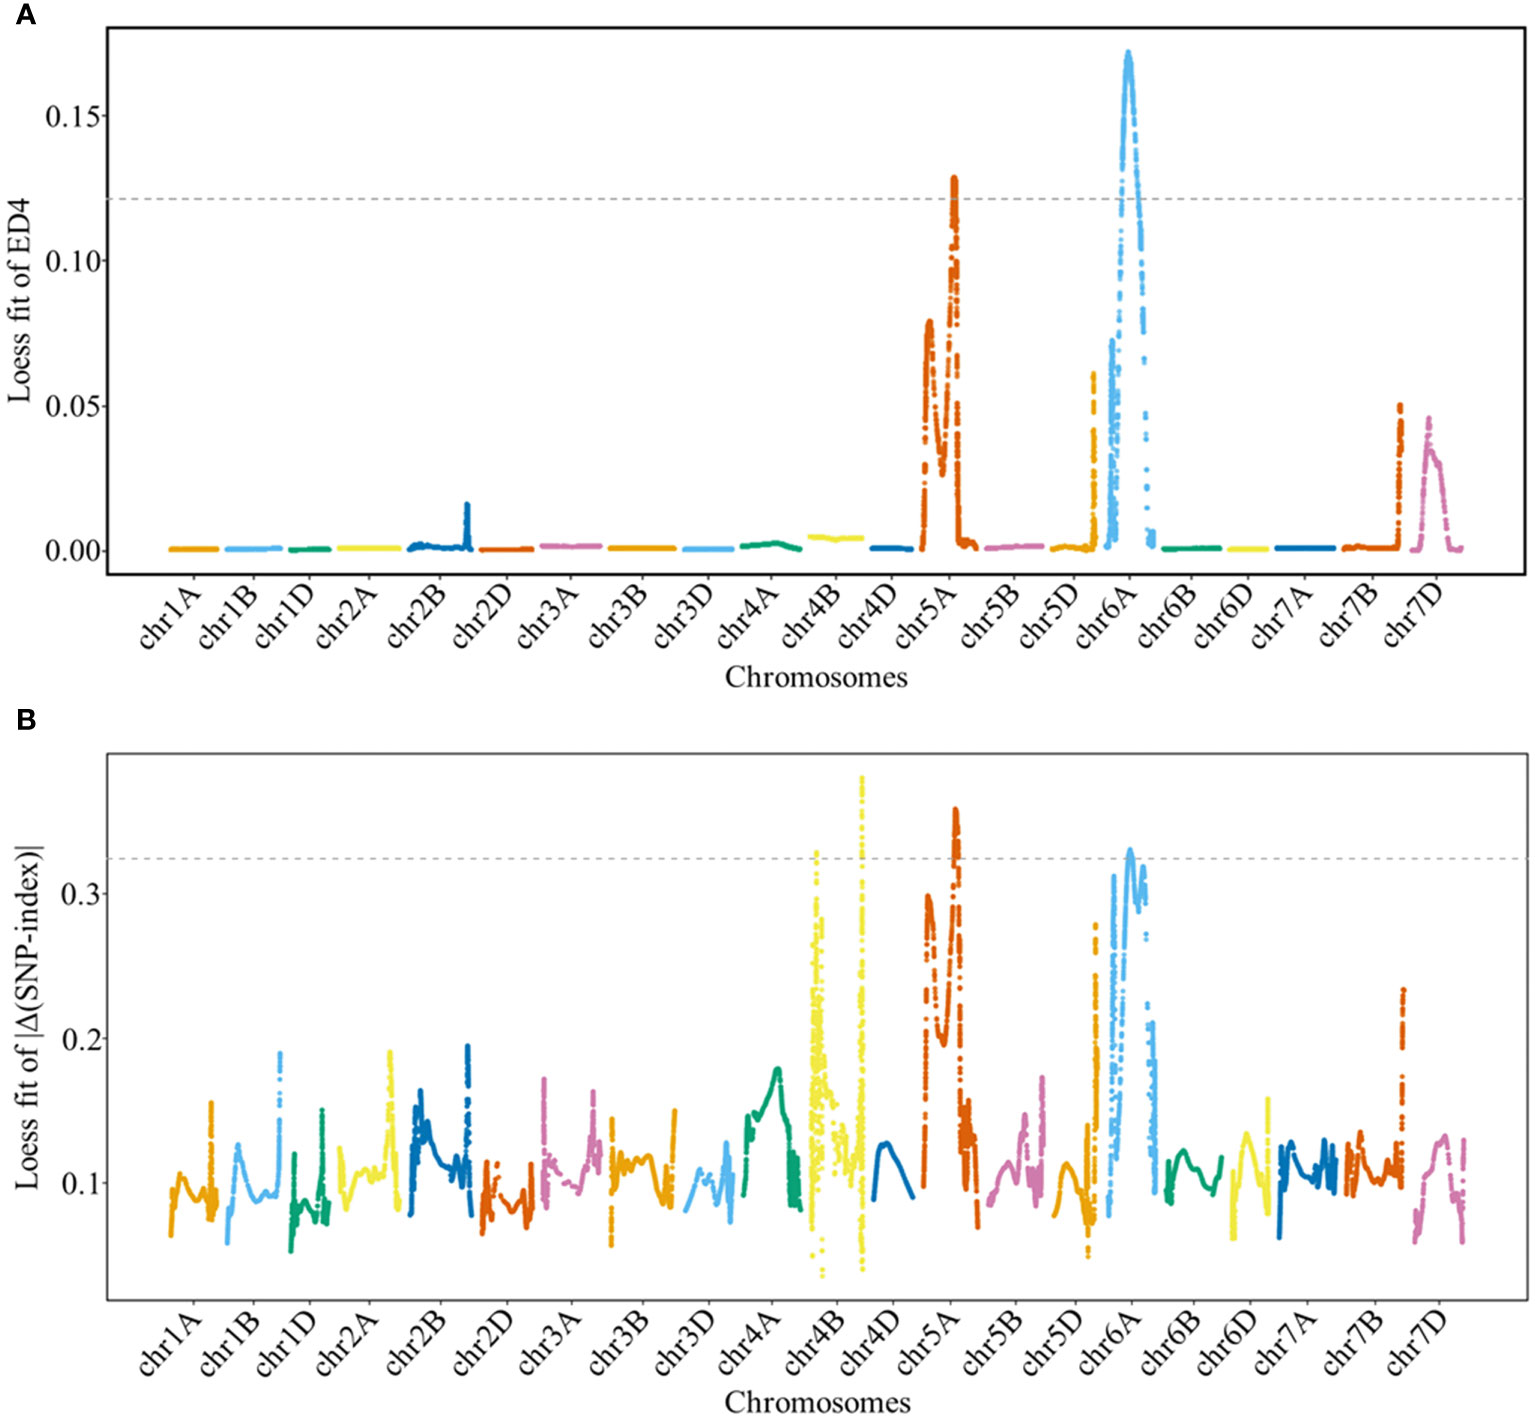
Figure 2 Locally weighted scatterplot smoothing (LOESS) fitting Manhattan plot for grain number per spike (GNS). Panels (A, B) show the LOESS fits of ED4 and |Δ(SNP-index)| for GNS, respectively. The cutoff values for the two methods are indicated by the dotted lines, with threshold values of 0.1214 and 0.3243 for the LOESS fits of ED4 and |Δ(SNP-index)|, respectively.
Genetic map construction and QTL analysis
To confirm the preliminarily detected genomic regions associated with GNS, the polymorphic SNP sites within expanded regions (chr5A: 332.84 Mb–532.48 Mb; chr6A: 80.04 Mb–486.84 Mb) were converted into KASP markers (Supplementary Tables 4, 12). The phenotypic data evaluated in eight environments and the combined analysis (the BLUE dataset was set as an additional environment) were used for QTL mapping.
For chromosome 5A, 19 KASP markers were successfully developed to construct a genetic map with a length of 41.1 cM. According to this map, a major and stable additive QTL QGns.cib-5A was detected in five environments including the BLUE dataset (Figures 3A and 4). It explained 8.46%–14.43% of phenotypic variance, and the LOD values varied from 4.35 to 8.16. The favorable allele of QGns.cib-5A was contributed by ZKM13F10, and this QTL was located in a 2.8-cM genetic interval between the markers KASP12 and KASP13 (Table 2).
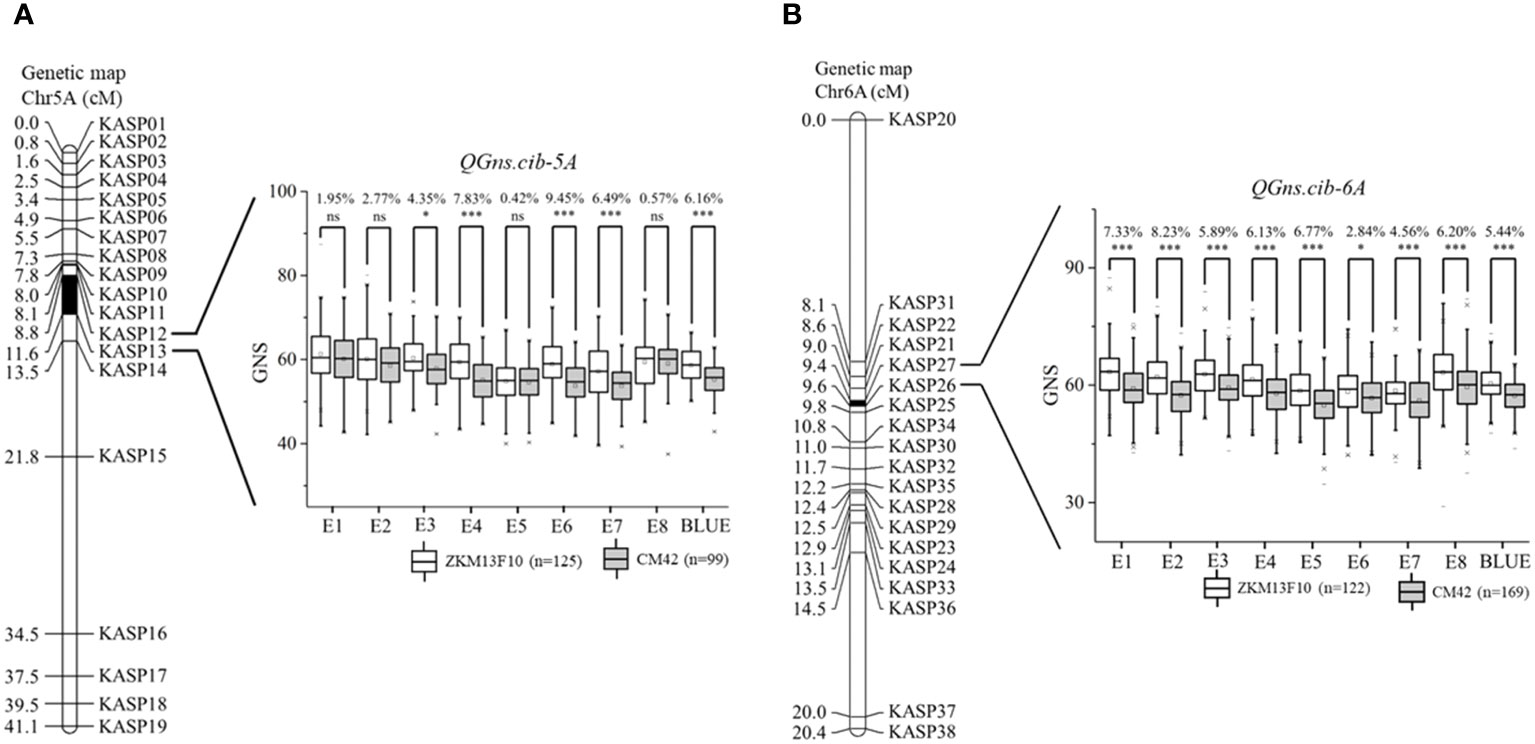
Figure 3 Genetic maps of the major quantitative trait loci (QTL) QGns.cib-5A (A) and QGns.cib-6A (B) and their effects on grain number per spike (GNS). The black area represents the genetic intervals of QGns.cib-5A and QGns.cib-6A. The effects of the major QTL on GNS are shown as box plots, calculated after grouping the 13CM population into two classes based on the KASP marker. ZKM13F10 and CM42 indicate the lines with and without positive alleles of QGns.cib-5A and QGns.cib-6A, respectively. ns, *, and *** represent significance at P > 0.05, P < 0.05, and P < 0.001.
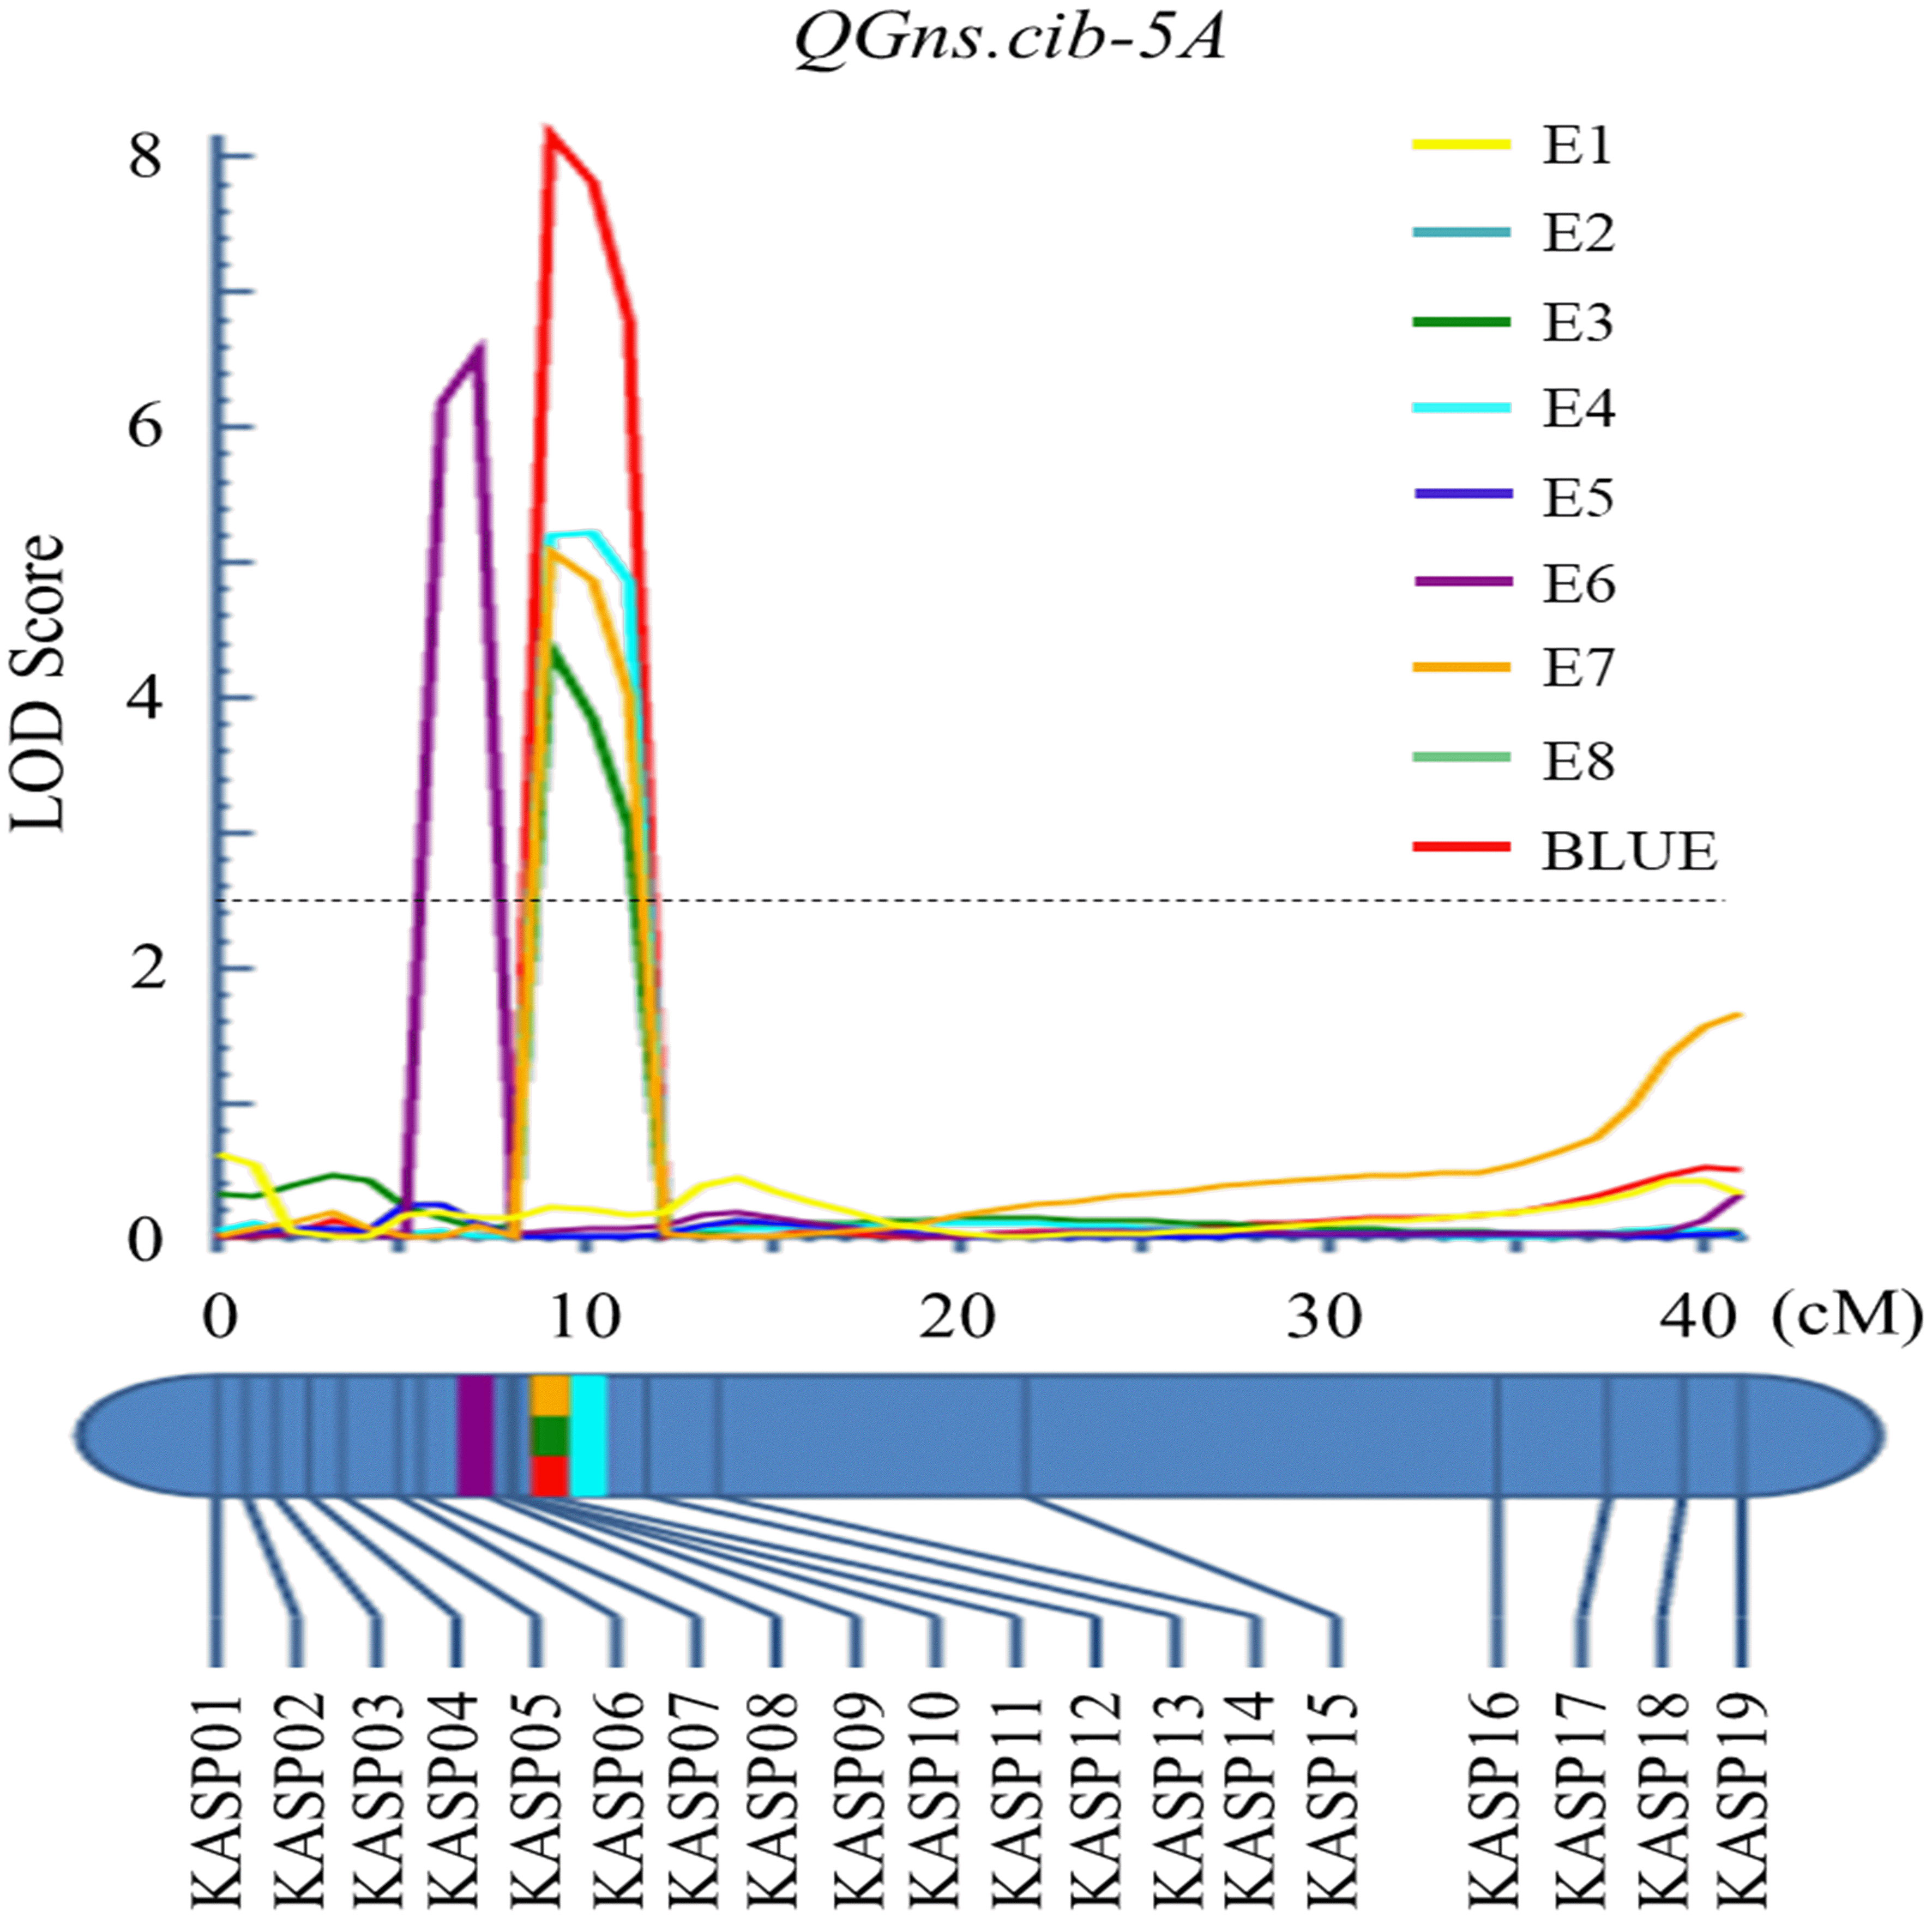
Figure 4 Logarithm of the odds (LOD) profile of QGns.cib-5A in the 13CM population using the inclusive composite interval mapping (ICIM) method.
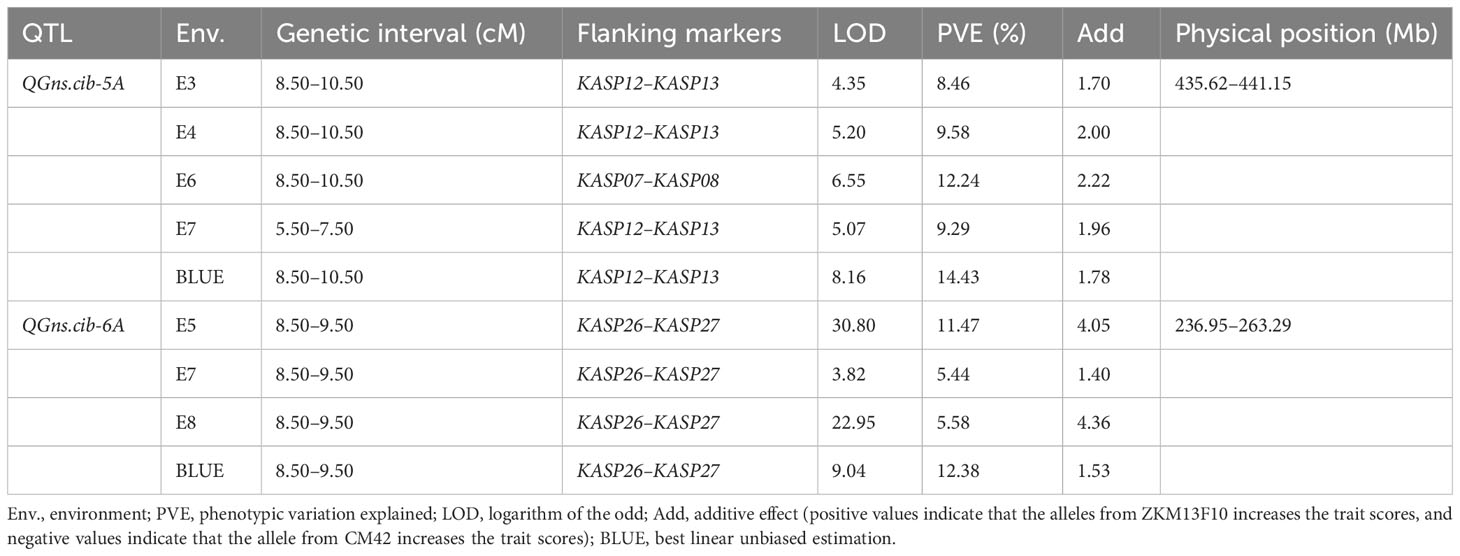
Table 2 Quantitative trait loci (QTL) on chromosomes 5A and 6A for grain number per spike (GNS) identified across multiple environments and the BLUE dataset in the 13CM population.
For chromosome 6A, 19 KASP markers were developed and the genetic map spanned 20.4 cM in length. QGns.cib-6A, a major and stable additive QTL, was identified in E5, E7, E8, and the BLUE dataset (Figures 3B and 5A). It explained 5.44%–12.38% of phenotypic variance with the LOD values ranging from 3.82 to 30.80. The favorable allele of QGns.cib-6A was contributed by ZKM13F10. The QTL was located in a 0.2-cM genetic interval between the markers KASP26 and KASP27 (Table 2).
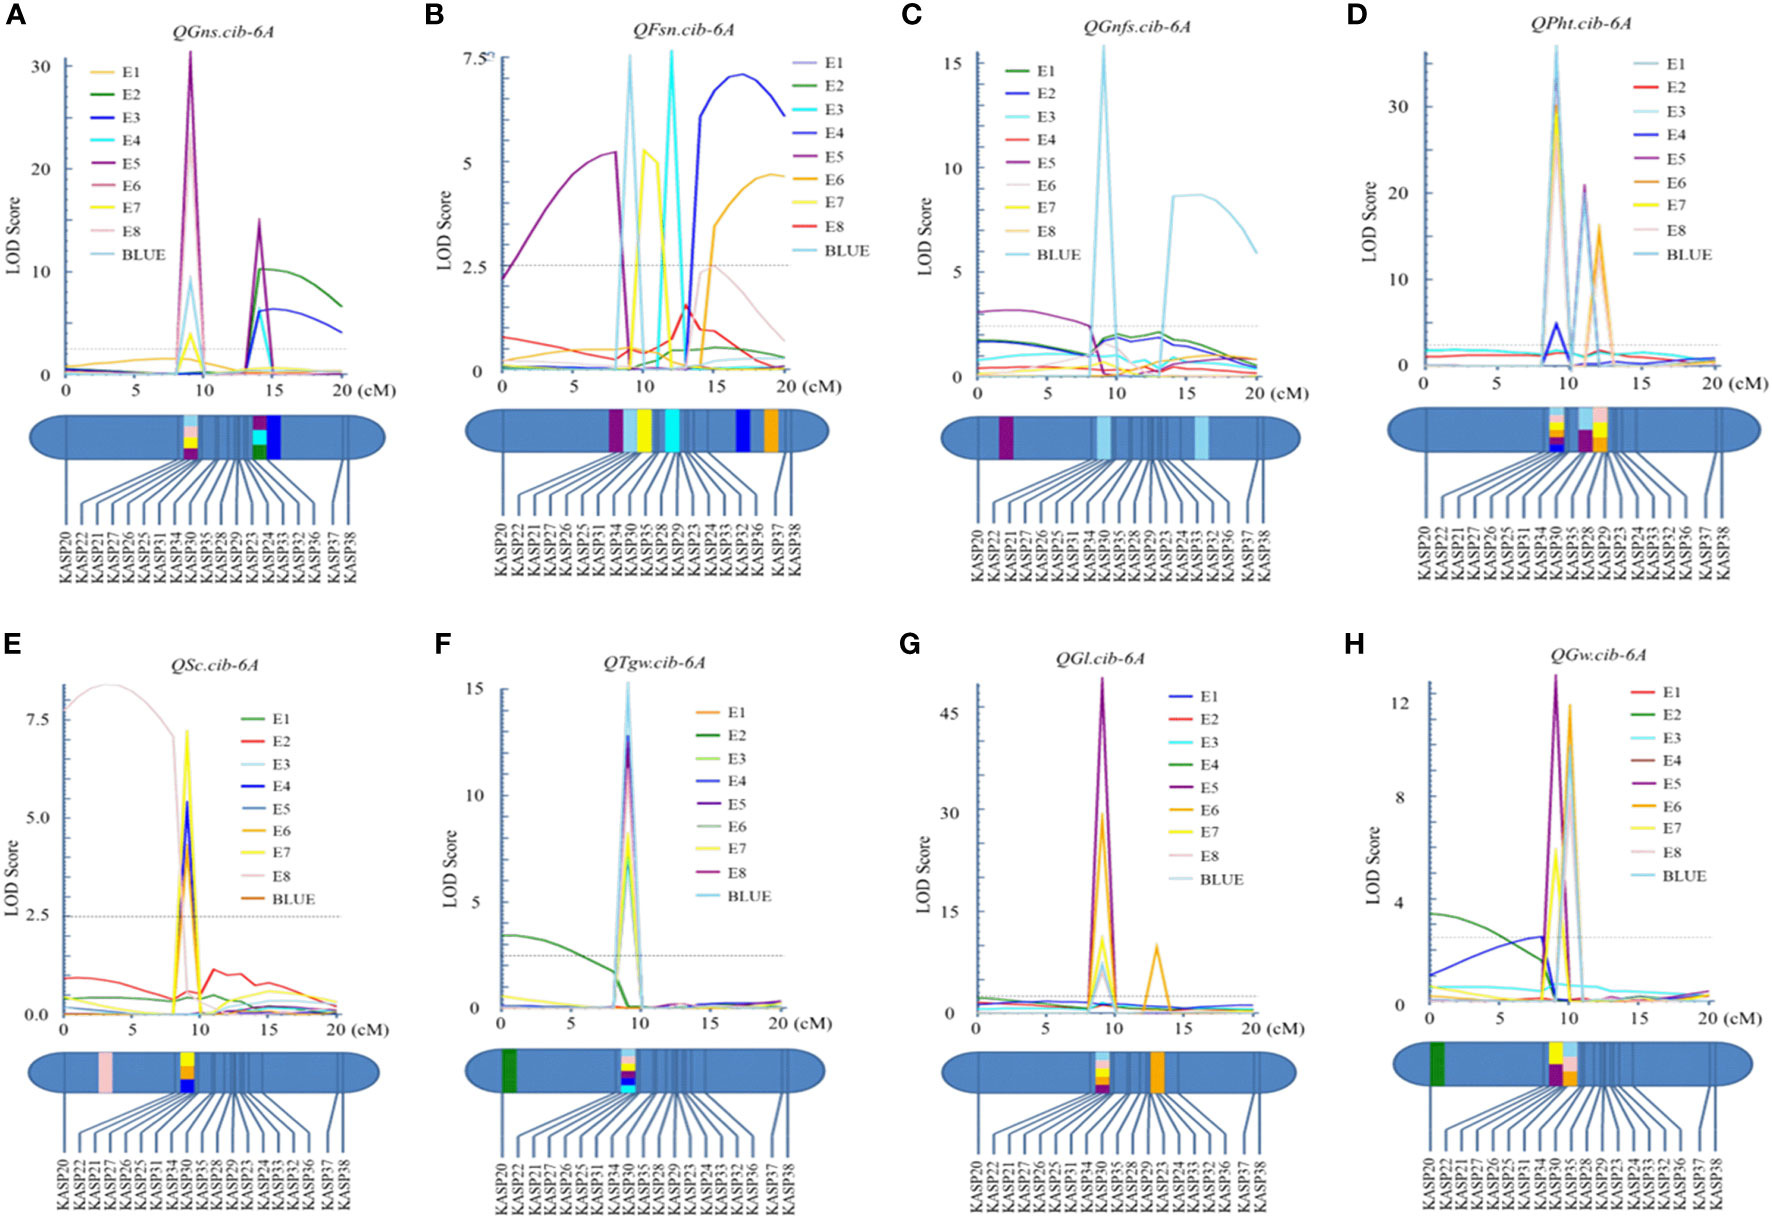
Figure 5 Logarithm of the odds (LOD) profile of QGns.cib-6A (A), QFsn.cib-6A (B), QGnfs.cib-6A (C), QPht.cib-6A (D), QSc.cib-6A (E), QTgw.cib-6A (F), QGl.cib-6A (G), and QGw.cib-6A (H) in the 13CM population using the inclusive composite interval mapping (ICIM) method.
In addition, seven QTL were identified between the markers KASP26 and KASP27 on chromosome 6A (Supplementary Table 5). Three major and stable QTL (QTgw.cib-6A, QGl.cib-6A, and QGw.cib-6A) related to grain size and weight were detected (Figures 5F–H). QTgw.cib-6A was detected in five environments and the BLUE dataset and explained 10.26%–19.94% of phenotypic variance, with the LOD values ranging from 7.20 to 15.02. The QGl.cib-6A (LOD = 6.01–48.38; PVE = 8.68%–14.77%) was detected in four environments and the BLUE dataset. QGw.cib-6A (LOD = 5.70–12.48; PVE = 8.12%–16.74%) was detected in four environments and the BLUE dataset. The favorable alleles of QTgw.cib-6A, QGl.cib-6A, and QGw.cib-6A were all contributed by CM42.
For grain number-related traits, three QTL QFsn.cib-6A, QGnfs.cib-6A, and QSc.cib-6A were also identified (Figures 5B, C, E). QFsn.cib-6A (LOD = 5.22–7.40; PVE = 7.48%–10.34%), a major and stable QTL, was detected in E5, E7, and the BLUE dataset. QSc.cib-6A (LOD = 4.18–7.07; PVE = 6.21%–9.86%), a stable QTL, was identified in E4, E6, and E7. QGnfs.cib-6A (LOD = 3.17–15.55; PVE = 4.69%–4.99%), a minor QTL, was detected in E5 and the BLUE dataset. The favorable allele of QFsn.cib-6A, QGnfs.cib-6A, and QSc.cib-6A was all contributed by ZKM13F10.
Meanwhile, QPht.cib-6A, a stable QTL, was detected in six environments (Figure 5D). It explained 6.62%–8.39% of phenotypic variance with the LOD values ranging from 4.80 to 36.31. The favorable allele of QPht.cib-6A was contributed by CM42.
Based on the mapping result, eight QTL, QGns.cib-6A, QTgw.cib-6A, QGl.cib-6A, QGw.cib-6A, QFsn.cib-6A, QGnfs.cib-6A, QSc.cib-6A, and QPht.cib-6A, were detected in the same interval. Temporarily, we designated this common locus as QClu.cib-6A.
In the QE interaction analysis, a total of 19 QTL were detected, including the nine QTL identified in the single-environment analysis. Except for QGns.cib-5A, QGw.cib-6A, and QPht.cib-6A, the PVE (A) of the remaining six QTL were significantly smaller than that of PVE (AE), indicating that these QTL were not stable across environments (Supplementary Table 6). No epistatic QTL were found in this study (data not shown).
Effects of major QTL on corresponding traits
By analyzing the genotyping results of the flanking markers KASP12 and KASP26, the effects of QGns.cib-5A and QGns.cib-6A on GNS were examined. For QGns.cib-5A, lines with homozygous alleles from ZKM13F10 and CM42 were divided into two groups. Significant differences (P < 0.05 or P < 0.001) in GNS were observed between these groups. QGns.cib-5A was found to significantly increase GNS by 4.35%–9.45% across five environments (E3, E4, E6, E7, and the BLUE dataset) (Figure 3A). For QGns.cib-6A, significant differences (P < 0.001) in GNS were observed between the groups in all environments. QGns.cib-6A significantly increased GNS by 2.84%–8.23% (Figure 3B).
Effects of QClu.cib-6A, a QTL cluster, on other seven yield-related traits except GNS were assessed. For three grain size and weight traits, significant differences (P < 0.01 or P < 0.001) between groups in all or eight environments were detected and QClu.cib-6A significantly increased TGW, GL, and GW by 4.66%–15.92%, 1.55%–4.66%, and 1.70%–6.13%, respectively (Supplementary Figures 2E-G). For three grain number-related traits, significant differences (P < 0.05, P < 0.01, or P < 0.001) between groups were detected in seven or six environments and QClu.cib-6A significantly increased FSN, GNFS, and SC by 2.72%–3.44%, 2.34%–3.76%, and 4.90%–7.12%, respectively (Supplementary Figures 2B–D). Meanwhile, significant differences (P < 0.05 or P < 0.001) on plant height were found between groups in all environments, and QClu.cib-6A significantly increased PHT by 3.82%–11.61% (Supplementary Figure 2A).
Effects of QGns.cib-5A and QGns.cib-6A on other yield-related traits
To detect the effects of QGns.cib-5A and QGns.cib-6A on other yield-related traits, the 13CM lines were divided into two groups based on the marker’s spectra of KASP12 and KASP26, respectively. For QGns.cib-5A, the comparative analysis between the two groups based on the BLUE dataset showed that QGns.cib-5A had significant effects on PTN, FSN, SL, and GL/GW (P < 0.05, P < 0.01, or P < 0.001) (Supplementary Figure 3). Significant differences in PTN and SL were observed between the two groups for QGns.cib-6A (P < 0.001) (Supplementary Figure 4).
Additive effect of QGns.cib-5A and QGns.cib-6A
In the present study, two QTL QGns.cib-5A and QGns.cib-6A for GNS were identified. Subsequently, the additive effects of QGns.cib-5A and QGns.cib-6A on GNS in the 13CM population were analyzed. Compared with lines with unfavorable alleles, lines with a favorable allele of GNS at QGns.cib-5A or QGns.cib-6A significantly increased GNS by 6.16% (P < 0.001) or 5.67% (P < 0.001), respectively. Compared with lines carrying unfavorable alleles, lines with both favorable alleles exhibited a significant increase in GNS by 12.85% (P < 0.001) (Figure 6).
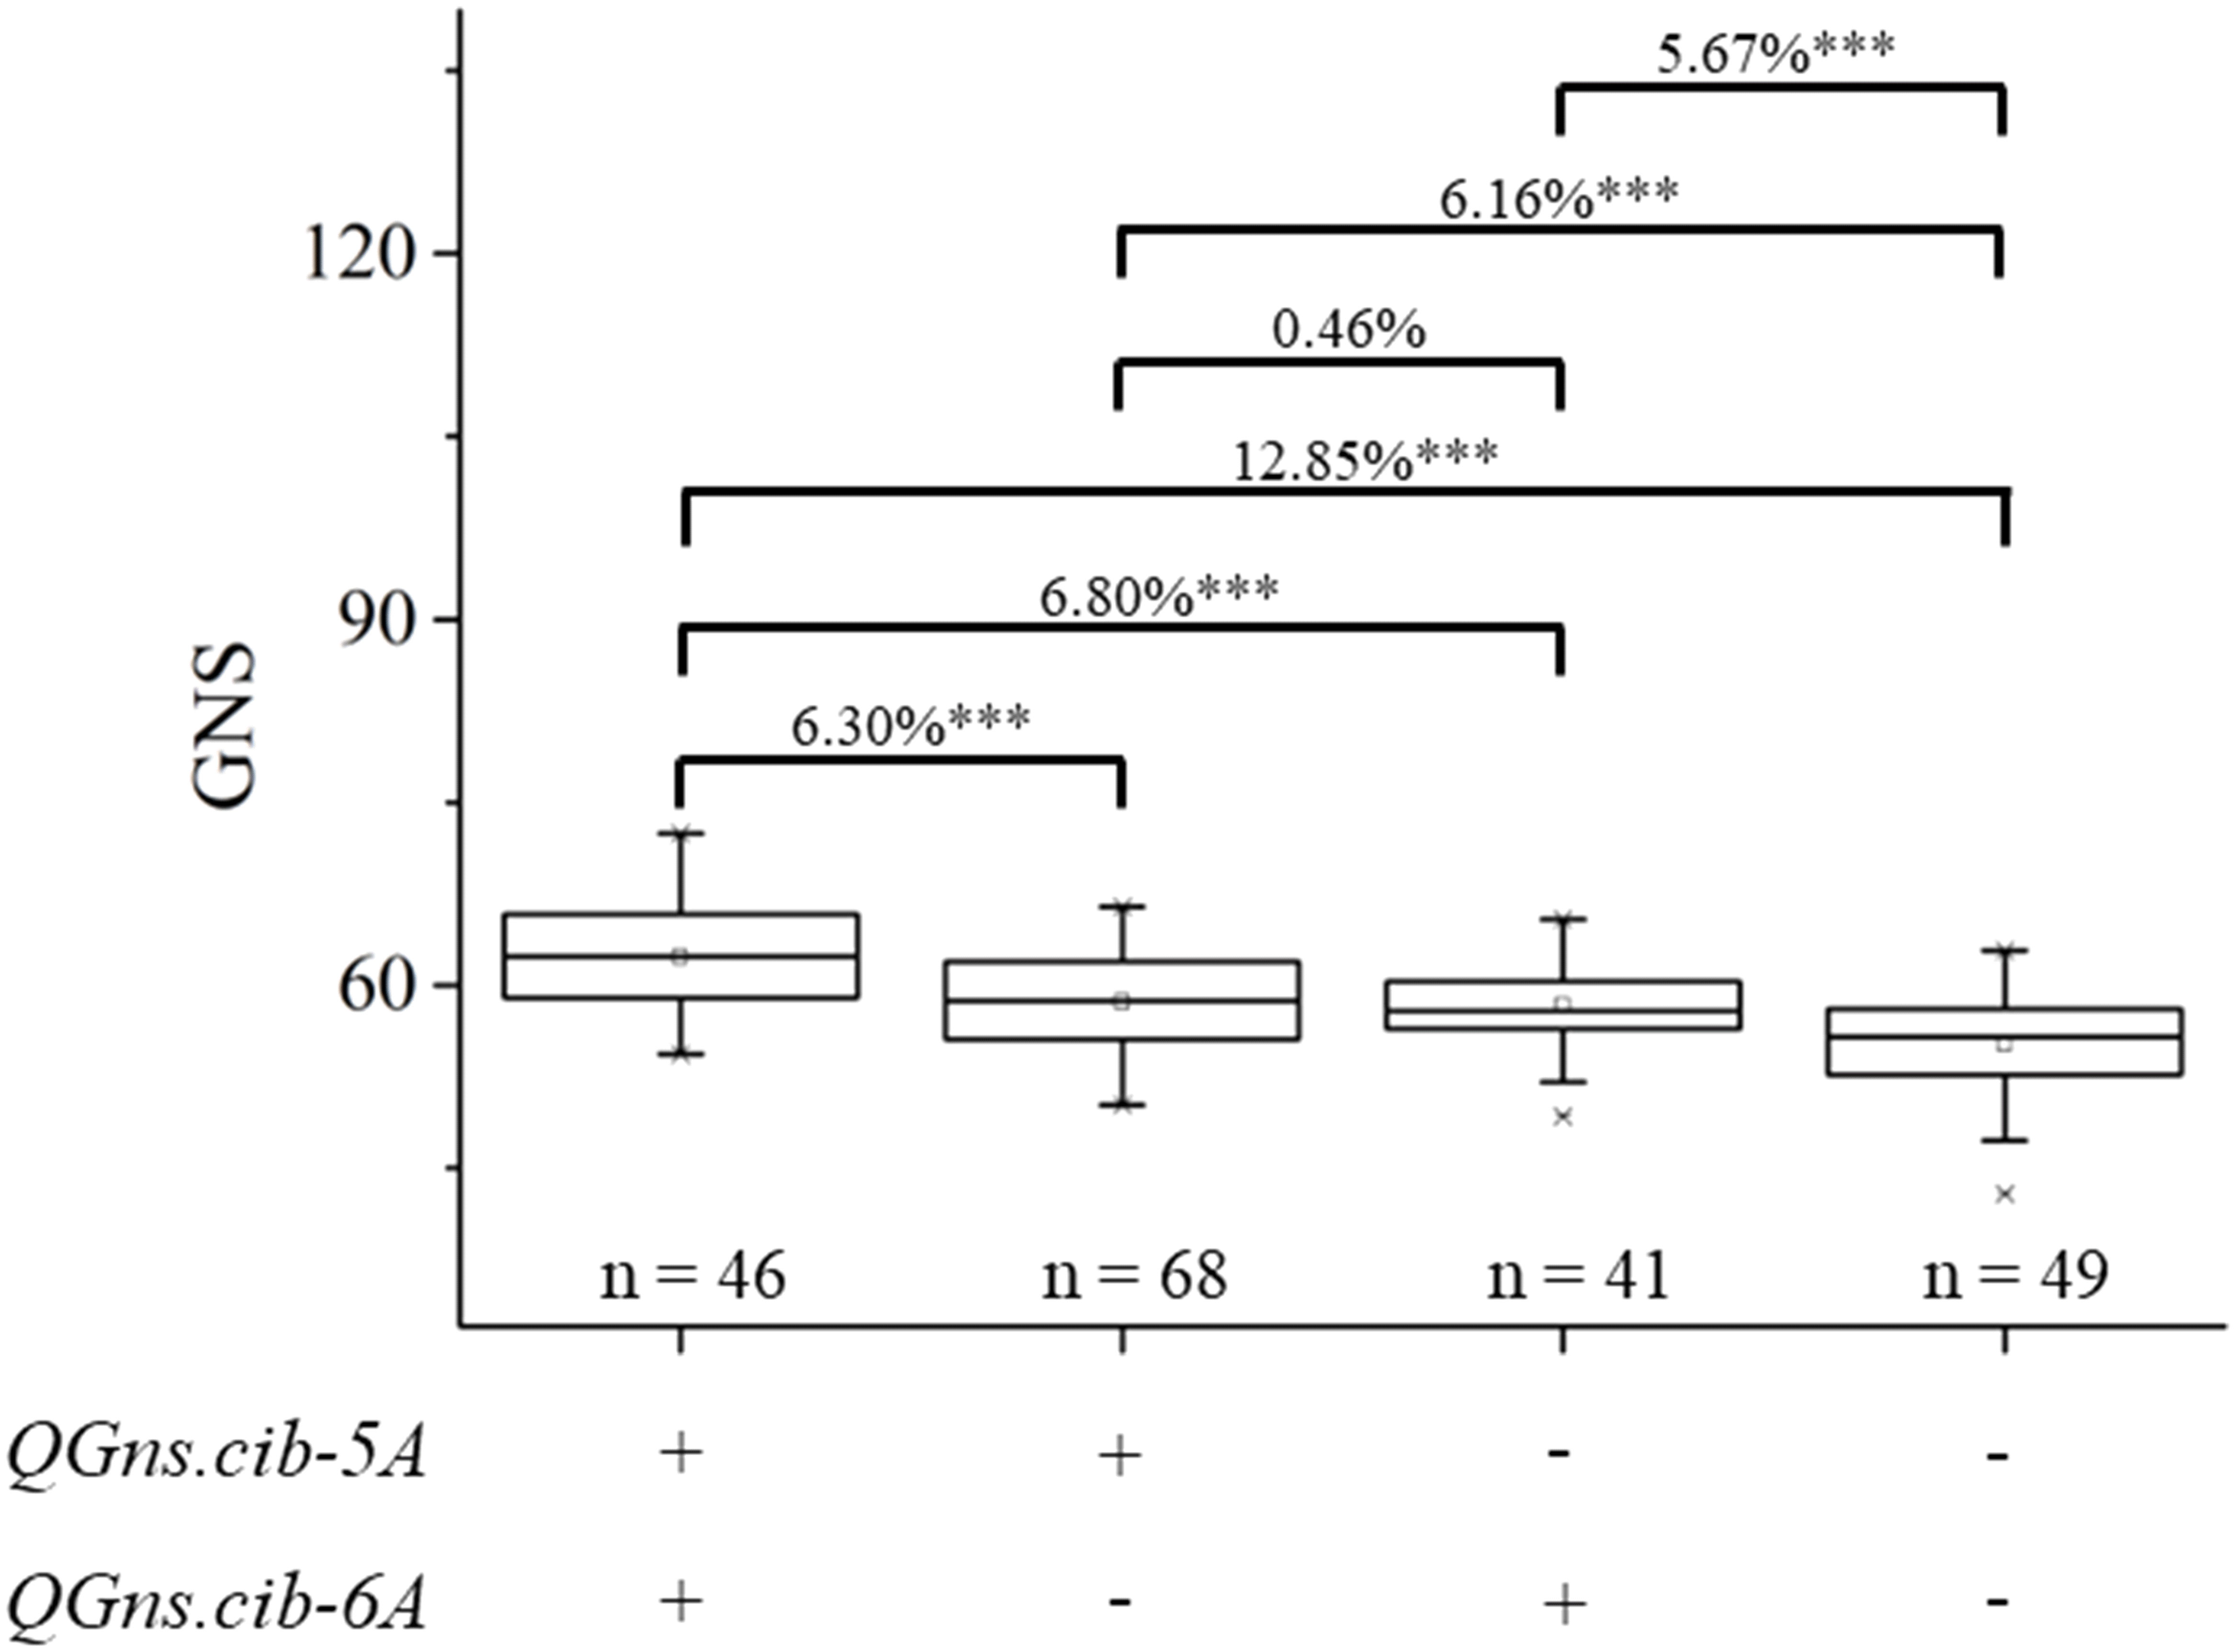
Figure 6 Additive effects of QGns.cib-5A and QGns.cib-6A on grain number per spike (GNS) in the 13CM population. “+” and “–” represent lines with the alleles from ZKM13F10 and CM42 of the target loci, respectively. *** represents significance at P < 0.001.
Validation of QGns.cib-5A and QGns.cib-6A in different genetic backgrounds
Two populations (CZ5782 and CS104) were used to evaluate the effects of QGns.cib-5A and QGns.cib-6A in different genetic backgrounds, respectively. KASP12 (closely linked to QGns.cib-5A) and KASP26 (tightly linked to QGns.cib-6A) were used for genotyping. For KASP12, polymorphism was detected in QGns.cib-5A between CM104 and ZM5782. For KASP26, polymorphism was detected in QGns.cib-6A between CM104 and SH352. According to the genotyping results, the F2 individuals from CZ5782 and CS104 were divided into three groups: individuals with a CM42 homozygous allele, individuals with a non-CM42 homozygous allele, and individuals with heterozygous allele. Significant differences (P < 0.05, P < 0.01, or P < 0.001) in GNS were identified between the groups with different alleles in both populations. Lines with the favorable and homozygous alleles significantly increased GNS by 6.44%–8.42% and 3.72%–8.86% in CZ5782 and CS104 populations, respectively (Figure 7).
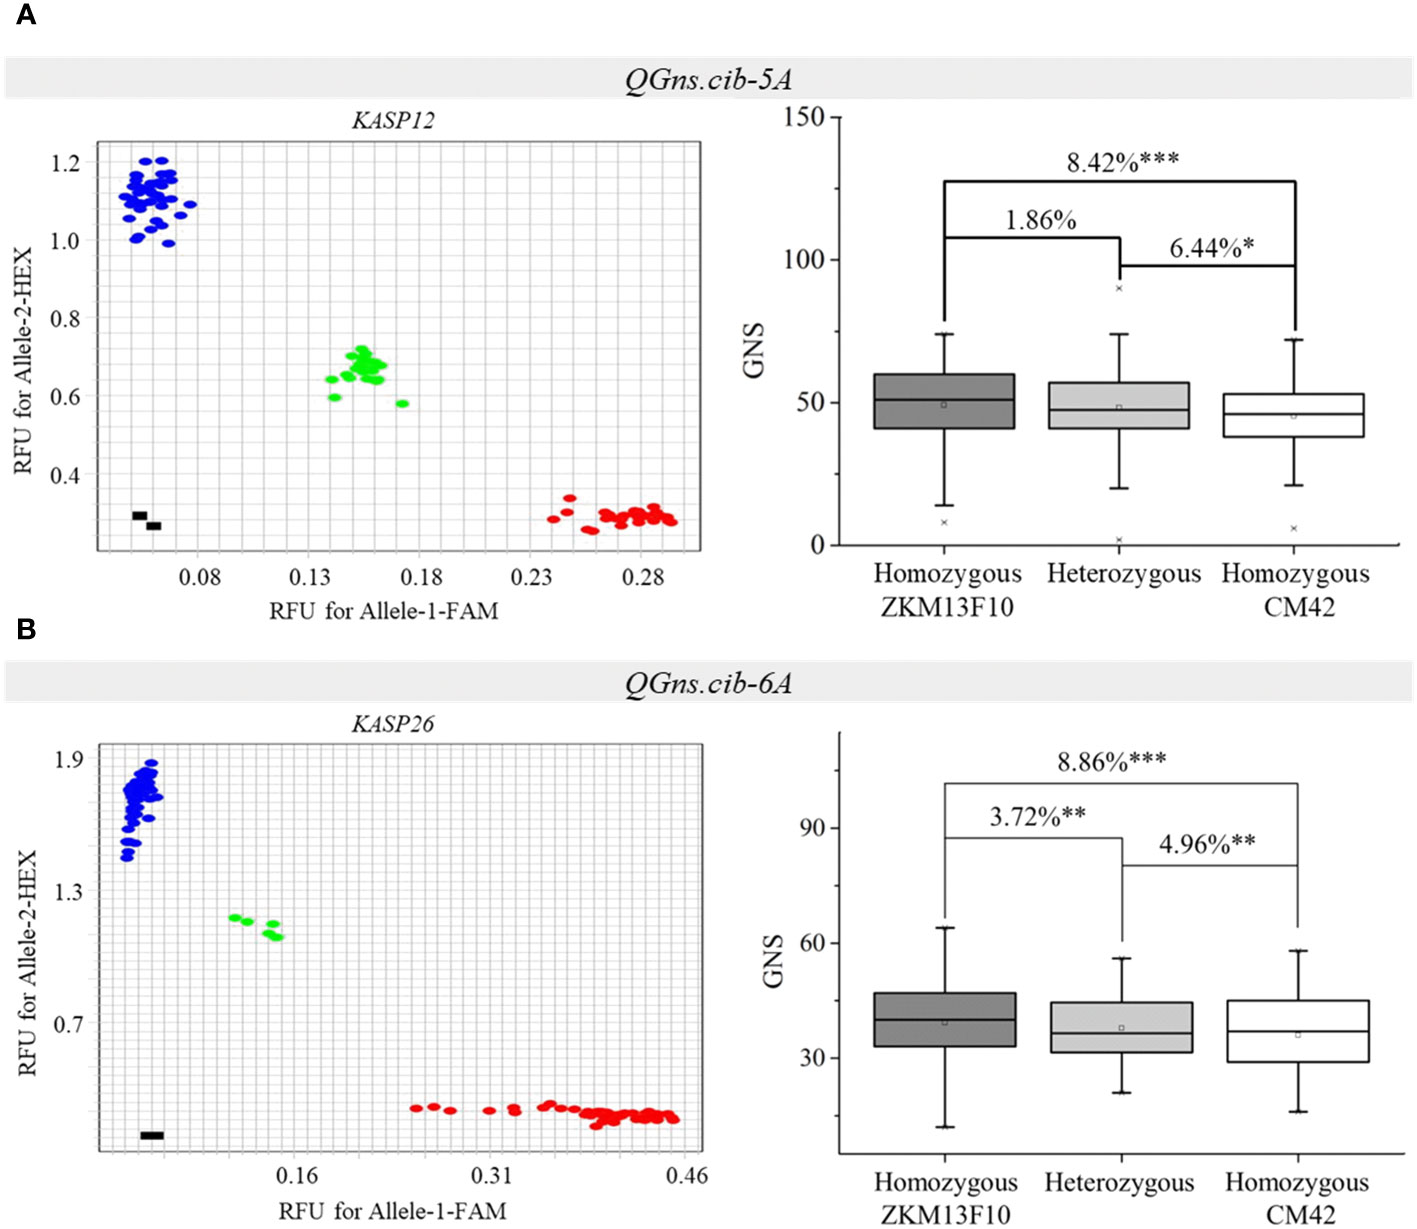
Figure 7 Validation of QGns.cib-5A (A) and QGns.cib-6A (B) in different genetic backgrounds. The fluorescence PCR genotyping results of the Kompetitive Allele-Specific PCR (KASP) markers KASP12 and KASP26 in the CZ5782 and CS352 populations, respectively. The effects of QGns.cib-5A and QGns.cib-6A on grain number per spike (GNS) in the CZ5782 and CS352 populations, respectively. *, **, and *** represent significance at P < 0.05, P < 0.01, and P < 0.001, respectively.
Candidate gene analysis of QGns.cib-5A and QGns.cib-6A
After screening the physical interval of QGns.cib-5A (435.62 Mb–441.15 Mb) using IWGSC RefSeq v2.1, 150 prediction genes including 76 high-confidence prediction genes were obtained (Supplementary Table 7). Spatial expression patterns showed that 26 genes were highly expressed in spike, indicating that they might participate in spike development (Supplementary Figure 5). In addition, according to gene annotation, and homologous gene function in rice and/or Arabidopsis thaliana, TraesCS5A03G0562600 might be related to spike development. According to the BSE-Seq data, two SNPs and an InDel were identified between the two parents of TraesCS5A03G0562600 (Supplementary Table 8).
For QGns.cib-6A, 144 prediction genes (including 35 high-confidence genes) were detected in the physical interval of 236.95 Mb–263.29 Mb using IWGSC RefSeq v2.1 (Supplementary Table 7). Expression patterns suggested that 16 genes were highly expressed in spike, indicating that they might be related to spike development (Supplementary Figure 6). Furthermore, according to the gene annotation and the homologous gene function in rice and/or Arabidopsis thaliana, TraesCS6A03G0487300 and TraesCS6A03G0492700 might participate in spike development. Based on the BSE-Seq data, an InDel and one InDel were found in the upstream and exon of the TraesCS6A03G0487300 and TraesCS6A03G0492700, respectively.
Haplotype analysis of QGns.cib-5A and QGns.cib-6A
According to the high-quality resequencing data of 145 Chinese wheat accessions, the haplotypes in the key regions of QGns.cib-5A and QGns.cib-6A were analyzed. Six and three haplotypes were found in QGns.cib-5A and QGns.cib-6A, respectively (Supplementary Figures 7, 8). For QGns.cib-5A, six KASP markers were successfully developed to differentiate the six haplotypes and used to perform the haplotype analysis in our natural population (321 wheat accessions). As expected, all six haplotypes were detected, namely, haplotype-I, -II, -III, -IV, -V, and -VI (Supplementary Figure 9A and Supplementary Table 11). Based on the association analysis result, GNS of accessions with hap-V (including ZKM13F10) was 12.27% and 2.10% higher than that of accessions with hap-VI (including CM42) in ‘Cultivars’ and ‘Landraces’, respectively (Figure 8A).
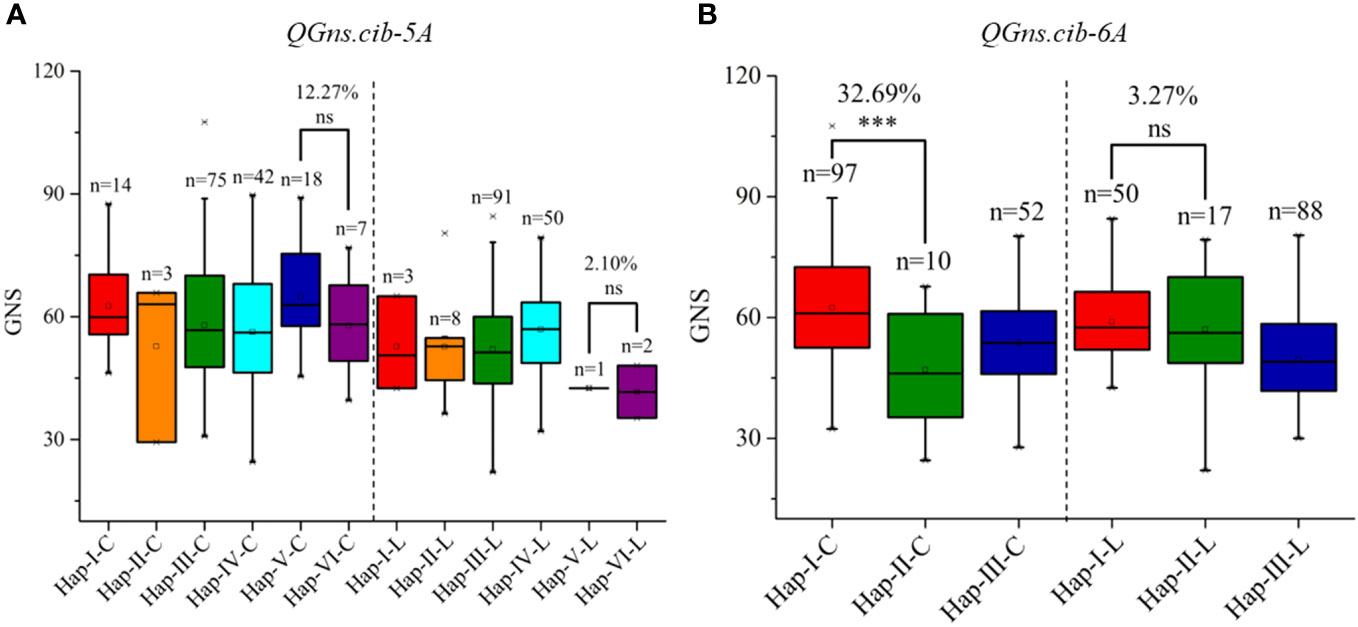
Figure 8 Haplotypes and their distribution frequency of QGns.cib-5A (A) and QGns.cib-6A (B) in 321 wheat accessions. ‘C’ and ‘L’ represent ‘cultivars’ and ‘landraces’, respectively; ns and *** represent significance at P > 0.05 and P < 0.001.
For QGns.cib-6A, three KASP markers were developed to distinguish the three haplotypes and haplotype analysis was carried out in 321 wheat accessions. As expected, three haplotypes (hap-I, -II, and -III) were detected (Supplementary Figure S9B; Supplementary Table 11). According to association analysis, significant difference on GNS was detected between accessions with hap-I (including ZKM13F10) and hap-II (including CM42) in ‘Cultivars’. However, a higher but non-significant difference was detected between the two haplotypes in ‘Landraces’ (Figure 8B).
Discussion
Comparison of the detected QTL to those reported in previous studies
In this study, two major and stable QTL, QGns.cib-5A and QGns.cib-6A, were identified on chromosomes 5A and 6A, respectively, using the BSE-Seq method and linkage analysis. To detect if they overlap with QTL reported in previous studies, we compared their physical intervals based on the CS reference genome (Table 2 and Supplementary Table 9).
For QGns.cib-5A, 14 QTL controlling GNS on chromosome 5A were screened in previous studies. Among them, QGN.perg-5A (462.01 Mb) and an unnamed QTL (tightly linked marker Xgwm186, 472.16 Mb) are located near the physical interval of QGns.cib-5A (435.62 Mb–441.15 Mb) (Liu et al., 2006; Pretini et al., 2021). QGns.cau-5A.2 (439.67 Mb) and an un-named QTL (Xgwm415–Xgwm304, 107.10 Mb–664.99 Mb) were overlapped with QGns.cib-5A (Su et al., 2009; Guan et al., 2018). However, the unnamed QTL (Xgwm415–Xgwm304, 107.10 Mb–664.99 Mb) was identified in a large interval and only detected in two environments. Another unnamed QTL (tightly linked marker Xgwm186, 472.16 Mb) was detected in only one environment, suggesting it was unstable. QGns.cau-5A.2 was detected in six environments and located within the physical interval of QGns.cib-5A, but its PVE value is less than 10%, indicating that it is a minor QTL. QGN.perg-5A is located near QGns.cib-5A and was detected in three environments with a PVE value ranging from 14.6% to 17.5%, suggesting that it is a major and stable QTL. As a result, whether QGns.cib-5A is a novel QTL or allelic to the reported loci remains to be revealed.
For QGns.cib-6A, several cloned genes and QTL around the candidate region associated with GNS have been reported in previous studies (Supplementary Tables 9, 10). TaBT1-6A, located near QGns.cib-6A and associated with grain size, weight, and grain total starch content, was identified (Wang et al., 2019). However, our remapping result showed that TaBT1-6A was not linked to QGns.cib-6A, suggesting that TaBT1-6A is not the candidate gene of QGns.cib-6A. Another gene, TaGW2-6A, is located within the physical interval of QGns.cib-6A and plays pleotropic effects on wheat agronomic traits (Su et al., 2011; Jaiswal et al., 2015). Based on an SNP site (−593 bp, A/G) in the promoter region, a KASP marker TaGW2-6A-593 was employed (Su et al., 2011) (Supplementary Table 12). The remapping results indicated that TaGW2-6A was not linked to QGns.cib-6A, suggesting that TaGW2-6A is not the candidate gene of QGns.cib-6A. Meanwhile, no previously reported QTL for GNS overlapped with QGns.cib-6A (Supplementary Table 9), indicating that it may be a novel QTL.
Relationships between GNS and TGW and pleiotropic effects of QGns.cib-5A and QGns.cib-6A
Generally, a tradeoff between grain number and grain weight is usually detected, which has been a major limitation in further breeding program. In the present study, the significant and negative correlations between GNS and TGW, GL, GW, and GL/GW supports the tradeoff effect. According to statistics, approximately 90% of the identified QTL controlling GNS have a negative and pleiotropic effect on TGW (Yang et al., 2021). As a result, QTL controlling GNS with no effect on TGW is essential for breeding. In this study, QGns.cib-6A showed a significant and negative effect on TGW, indicating a typical tradeoff effect between GNS and TGW (Supplementary Figure 2E). On the other hand, QGns.cib-5A had no significant effect on TGW (Supplementary Figure 3G). This suggests that QGns.cib-5A can increase GNS without reducing TGW and can be utilized in breeding program.
QGns.cib-5A and QGns.cib-6A are the artificial selection loci during wheat improvement
During the long history of wheat domestication and selection, favorable haplotypes have been retained and enriched. However, the limited availability of genomic information has restricted access to haplotype information in wheat. Recently, more resequencing data of wheat materials have become available. For instance, the Wheat SnpHub Portal database has collected 13 resequencing datasets, encompassing 3,253 wheat accessions. This provides us the opportunity to analyze the haplotypes of a specific genomic region.
In the present study, the haplotypes for the crucial regions of QGns.cib-5A and QGns.cib-6A were analyzed using the resequencing data from 145 Chinese landmark cultivars (Hao et al., 2020). Based on the haplotype analysis of 321 wheat accessions, only one (0.65%) and two (1.29%) wheat accessions, respectively, were detected in hap-V (containing ZKM13F10) and hap-VI (containing CM42) in landraces, which suggests they were both rare haplotypes of QGns.cib-5A. In cultivars, the distribution frequency of the two haplotypes increased, with 18 accessions (hap-V, 11.32%) and 7 accessions (hap-VI, 4.40%), respectively. This finding indicates that both haplotypes have been artificially selected and enriched during wheat improvement. For QGns.cib-6A, 50 (32.26%) and 17 (10.97%) wheat accessions were found in hap-I (containing ZKM13F10) and hap-II (containing CM42) in landrace, respectively. Moreover, in cultivar, the distribution frequency of hap-I was doubled (97, 61.01%) whereas hap-II was retained (10, 6.29%). These results suggest that hap-I was enriched. Overall, both QGns.cib-5A and QGns.cib-6A appear to have been the targets of artificial selection in wheat improvement.
Potential candidate genes for QGns.cib-5A and QGns.cib-6A
Within the physical interval of QGns.cib-5A and QGns.cib-6A, 76 and 35 high-confidence prediction genes were detected in the CS reference genome, respectively (Supplementary Table 7). Through spatiotemporal expression patterns, homology analysis, function annotation, and sequence difference analysis, we predicted TraesCS5A03G0562600 as a potential candidate gene for QGns.cib-5A. TraesCS5A03G0562600 is the orthologous gene of AUXIN RESISTANT 4 (AXR4) in Arabidopsis, and it encodes the pseudomolecule protein AUXIN RESPONSE 4 (Supplementary Table 7). In Arabidopsis, AXR4 participates in biological processes of auxin polar transport (Hobbie, 2006). Auxin plays a crucial role in regulating plant growth, including the development of reproductive organs (Lampugnani et al., 2013). The BSE-Seq data revealed that two SNPs exist in the exon region of TraesCS5A03G0562600, which may result in functional change of this gene.
For QGns.cib-6A, we predicted TraesCS6A03G0487300 and TraesCS6A03G0492700 as potential candidate genes. TraesCS6A03G0487300 is the orthologous gene of SPATULA (SPT) in Arabidopsis, encoding the pseudomolecule protein basic helix–loop–helix (bHLH) DNA-binding superfamily (Supplementary Table 7). In Arabidopsis, SPT participates in biological processes of flower development, suggesting it involves in regulating seed number (Pfannebecker et al., 2017). The BSE-Seq data revealed the presence of one SNP in the upstream region and two SNPs in the downstream regions of TraesCS6A03G0487300, potentially resulting in changes in expression levels (Table S8). TraesCS6A03G0492700 is the orthologous gene of OsUBP15 in rice and UBIQUITIN-SPECIFIC PROTEASE 15 (UBP15) in Arabidopsis, and it encodes the pseudomolecule protein ubiquitin carboxyl-terminal hydrolase. OsUBP15 involves in regulating the number of lateral cells in the glume and TGW in rice (Shi et al., 2019). UBP15 participates in biological processes of cell division, flower development, fruit development, leaf development, and protein de-ubiquitination in Arabidopsis (Wu et al., 2022). Meanwhile, according to BSE-Seq data, two InDels were detected between the parents of TraesCS6A03G0492700 (Supplementary Table 8). In summary, TraesCS5A03G0562600 may be the candidate gene for QGns.cib-5A, whereas TraesCS6A03G0487300 and TraesCS6A03G0492700 may be the candidate genes for QGns.cib-6A, and their further investigation through map-based cloning would be valuable.
Data availability statement
The datasets presented in this study can be found in online repositories. The names of the repository/repositories and accession number(s) can be found in the article/Supplementary Material.
Author contributions
CJ: Data curation, Formal Analysis, Investigation, Software, Validation, Writing – original draft. ZX: Data curation, Resources, Writing – review & editing. XF: Methodology, Software, Writing – review & editing. QZ: Data curation, Resources, Writing – review & editing. GJ: Data curation, Resources, Writing – review & editing. SL: Data curation, Software, Writing – review & editing. YW: Software, Visualization, Writing – review & editing. FM: Software, Writing – review & editing. YZ: Project administration, Supervision, Writing – review & editing. TW: Funding acquisition, Project administration, Writing – review & editing. BF: Funding acquisition, Project administration, Supervision, Writing – review & editing.
Funding
The author(s) declare financial support was received for the research, authorship, and/or publication of this article. This work was supported by the Sichuan Science and Technology Program, China (2022ZDZX0016), the West Light Foundation of the Chinese Academy of Sciences (2022XBZG_XBQNXZ_A_001), and the Major Science and Technology Achievement Transformation of Central Universities and Institutes in Sichuan Projects (2022ZHCG0131).
Acknowledgments
We express our gratitude to the Triticeae Multi-omics Center (http://202.194.139.32/) for providing us with an integrated platform of tools and genomic data, which greatly facilitated our research. We also acknowledge the Wheat-SnpHub-Portal (http://wheat.cau.edu.cn/Wheat_SnpHub_Portal/) for providing the genomic variation datasets of wheat, and Bioacme Biotechnology Co., Ltd. (Wuhan, China, http://www.whbioacme.com) for their assistance with the BSE-Seq analysis.
Conflict of interest
The authors declare that the research was conducted in the absence of any commercial or financial relationships that could be construed as a potential conflict of interest.
Publisher’s note
All claims expressed in this article are solely those of the authors and do not necessarily represent those of their affiliated organizations, or those of the publisher, the editors and the reviewers. Any product that may be evaluated in this article, or claim that may be made by its manufacturer, is not guaranteed or endorsed by the publisher.
Supplementary material
The Supplementary Material for this article can be found online at: https://www.frontiersin.org/articles/10.3389/fpls.2023.1305547/full#supplementary-material
References
Azadi, A., Mardi, M., Hervan, E. M., Mohammadi, S. A., Moradi, F., Tabatabaee, M. T., et al. (2014). QTL Mapping of yield and yield components under normal and salt-stress conditions in bread wheat (Triticum aestivum L.). Plant Mol. Biol. Rep. 33, 102–120. doi: 10.1007/s11105-014-0726-0
Backhaus, A. E., Lister, A., Tomkins, M., Adamski, N. M., Simmonds, J., Macaulay, I., et al. (2022). High expression of the MADS-box gene VRT2 increases the number of rudimentary basal spikelets in wheat. Plant Physiol. 189, 1536e1552. doi: 10.1093/plphys/kiac156
Blanco, A., Mangini, G., Giancaspro, A. (2012). Relationships between grain protein content and grain yield components through quantitative trait locus analyses in a recombinant inbred line population derived from two elite durum wheat cultivars. Mol. Breed. 30, 79–92. doi: 10.1007/s11032-011-9600-z
Boden, S. A., Cavanagh, C., Cullis, B. R., Ramm, K., Greenwood, J., Finnegan, E. J., et al. (2015). Ppd-1 is a key regulator of inflorescence architecture and paired spikelet development in wheat. Nat. Plants 1, 14016. doi: 10.1038/nplants.2014.16
Börner, A., Schumann, E., Fürste, A., Cöster, H., Leithold, B., Röder, M., et al. (2002). Mapping of quantitative trait loci determining agronomic important characters in hexaploid wheat (Triticum aestivum L.). Theor. Appl. Genet. 105, 921–936. doi: 10.1007/s00122-002-0994-1
Chen, C. J., Chen, H., Zhang, Y., Thomas, H. R., Frank, M. H., He, Y. H., et al. (2020). TBtools: an integrative toolkit developed for interactive analyses of big biological data. Mol. Plant 13, 1194–1202. doi: 10.1016/j.molp.2020.06.009
Chen, T. T., Chen, X., Zhang, S. S., Zhu, J. W., Tang, B. X., Wang, A. K., et al. (2021). The genome sequence archive family: toward explosive data growth and diverse data types. Genom. Proteom. Bioinf. 19, 578–583. doi: 10.1016/j.gpb.2021.08.001
Chen, A., Dubcovsky, J. (2012). Wheat TILLING mutants show that the vernalization gene VRN1 down-regulates the flowering repressor VRN2 in leaves but is not essential for flowering. PloS Genet. 8, e1003134. doi: 10.1371/journal.pgen.1003134
CNCB-NGDC Members and Partners (2022). Database resources of the national genomics data center, China national center for bioinformation in 2022. Nucleic Acids Res. 50, D27–D38. doi: 10.1093/nar/gkab951
Cuthbert, J. L., Somers, D. J., Brûlé-Babel, A. L. (2008). Molecular mapping of quantitative trait loci for yield and yield components in spring wheat (Triticum aestivum L.). Theor. Appl. Genet. 117, 595–608. doi: 10.1007/s00122-008-0804-5
Debernardi, J. M., Greenwood, J. R., Jean, F. E., Jernstedt, J., Dubcovsky, J. (2020). APETALA 2-like genes AP2L2 and Q specify lemma identity and axillary floral meristem development in wheat. Plant J. 101, 171e187. doi: 10.1111/tpj.14528
Debernardi, J. M., Lin, H., Chuck, G., Faris, J. D., Dubcovsky, J. (2017). microRNA172 plays a crucial role in wheat spike morphogenesis and grain threshability. Development 144, 1966e1975. doi: 10.1242/dev.146399
Ditta, G., Pinyopich, A., Robles, P., Pelaz, S., Yanofsky, M. F. (2004). The SEP4 gene of Arabidopsis thaliana functions in floral organ and meristem identity. Curr. Biol. 14, 1935e1940. doi: 10.1016/j.cub.2004.10.028
Dixon, L. E., Greenwood, J. R., Bencivenga, S., Zhang, P., Cockram, J., Mellers, G., et al. (2018). TEOSINTE BRANCHED1 regulates inflorescence architecture and development in bread wheat (Triticum aestivum). Plant Cell 30, 563e581. doi: 10.1105/tpc.17.00961
Du, D. J., Zhang, D. X., Yuan, J., Feng, M., Li, Z. J., Wang, Z. H., et al. (2021). FRIZZY PANICLE defines a regulatory hub for simultaneously controlling spikelet formation and awn elongation in bread wheat. New Phytol. 231, 814e833. doi: 10.1111/nph.17388
Gao, C. X. (2021). Genome engineering for crop improvement and future agriculture. Cell 184, 1621–1635. doi: 10.1016/j.cell.2021.01.005
Gao, F. M., Wen, W. E., Liu, J. D., Rasheed, A., Yin, G. H., Xia, X. C., et al. (2015). Genome-wide linkage mapping of QTL for yield components, plant height and yield-related physiological traits in the Chinese wheat cross Zhou 8425B/Chinese Spring. Front. Plant Sci. 6. doi: 10.3389/fpls.2015.01099
Guan, P. F., Lu, L. H., Jia, L. J., Kabir, M. R., Zhang, J. B., Lan, T. Y., et al. (2018). Global QTL analysis identifies genomic regions on chromosomes 4A and 4B harboring stable loci for yield-related traits across different environments in wheat (Triticum aestivum L.). Front. Plant Sci. 9. doi: 10.3389/fpls.2018.00529
Hao, C. Y., Jiao, C. Z., Hou, J., Li, T., Liu, H. X., Wang, Y. Q., et al. (2020). Resequencing of 145 landmark cultivars reveals asymmetric sub-genome selection and strong founder genotype effects on wheat breeding in China. Mol. Plant 13, 1733–1751. doi: 10.1016/j.molp.2020.09.001
Hobbie, L. J. (2006). Auxin and cell polarity: the emergence of AXR4. Trends Plant Sci. 11, 517–518. doi: 10.1016/j.tplants.2006.09.003
Hu, W. J., Gao, D. R., Liao, S., Cheng, S. H., Jia, J. Z., Xu, W. G. (2023). Identification of a pleiotropic QTL cluster for Fusarium head blight resistance, spikelet compactness, grain number per spike and thousand-grain weight in common wheat. Crop J. 11, 672–677. doi: 10.1016/j.cj.2022.09.007
Hu, J. M., Wang, X. Q., Zhang, G. X., Jiang, P., Chen, W. Y., Hao, Y. C., et al. (2020). QTL mapping for yield-related traits in wheat based on four RIL populations. Theor. Appl. Genet. 133, 917–933. doi: 10.1007/s00122-019-03515-w
Huang, X. Q., Kempf, H., Ganal, M. W., Röder, M. S. (2004). Advanced backcross QTL analysis in progenies derived from a cross between a German elite winter wheat variety and a synthetic wheat (Triticum aestivumL.). Theor. Appl. Genet. 109, 933–943. doi: 10.1007/s00122-004-1708-7
Jaiswal, V., Gahlaut, V., Mathur, S., Agawai, P., Khandelwal, M. K., Khurana, J. P., et al. (2015). Identification of novel SNP in promoter sequence of TaGW2-6A associated with grain weight and other agronomic traits in wheat (Triticum aestivum L.). PloS One 10, e0129400. doi: 10.1371/journal.pone.0129400
Jiang, C., Xu, Z. B., Fan, X. L., Zhou, Q., Ji, G. S., Chen, L. E., et al. (2023). Identification and validation of quantitative trait loci for fertile spikelet number per spike and grain number per fertile spikelet in bread wheat (Triticum aestivum L.). Theor. Appl. Genet. 136, 69. doi: 10.1007/s00122-023-04297-y
Ji, G. S., Xu, Z. B., Fan, X. L., Zhou, Q., Chen, L. E., Yu, Q., et al. (2023). Identification and validation of major QTL for grain size and weight in bread wheat (Triticum aestivum L.). Crop J. 11, 564–572. doi: 10.1016/j.cj.2022.06.014
Ji, G. S., Xu, Z. B., Fan, X. L., Zhou, Q., Yu, Q., Liu, X. F., et al. (2021). Identification of a major and stable QTL on chromosome 5A confers spike length in wheat (Triticum aestivum L.). Mol. Breed. 41, 56. doi: 10.1007/s11032-021-01249-6
Kong, X. C., Wang, F., Geng, S. F., Guan, J. T., Tao, S., Jia, M. L., et al. (2021). The wheat AGL6-like MADS-box gene is a master regulator for floral organ identity and a target for spikelet meristem development manipulation. Plant Biotechnol. J. 20, 75–88. doi: 10.1111/pbi.13696
Kumar, N., Kulwal, P. L., Balyan, H. S., Gupta, P. K. (2007). QTL mapping for yield and yield contributing traits in two mapping populations of bread wheat. Mol. Breed. 19, 163–177. doi: 10.1007/s11032-006-9056-8
Lampugnani, E. R., Kilinc, A., Smyth, D. R. (2013). Auxin controls petal initiation in Arabidopsis. Development 140, 185–194. doi: 10.1242/dev.084582
Li, C. X., Dubcovsky, J. (2008). Wheat FT protein regulates VRN1 transcription through interactions with FDL2. Plant J. 55, 543e554. doi: 10.1111/j.1365-313X.2008.03526.x
Li, A. L., Hao, C. Y., Wang, Z. Y., Geng, S. F., Jia, M. L., Wang, F., et al. (2022). Wheat breeding history reveals synergistic selection of pleiotropic genomic sites for plant architecture and grain yield. Mol. Plant 15, 504–519. doi: 10.1016/j.molp.2022.01.004
Li, Y. P., Li, L., Zhao, M. C., Guo, L., Guo, X. X., Zhao, D., et al. (2021). Wheat FRIZZY PANICLE activates VERNALIZATION1-A and HOMEOBOX4-A to regulate spike development in wheat. Plant Biotechnol. J. 19, 1141e1154. doi: 10.1111/pbi.13535
Li, C. X., Lin, H. Q., Chen, A., Lau, M., Jernstedt, J., Dubcovsky, J. (2019). Wheat VRN1, FUL2 and FUL3 play critical and redundant roles in spikelet development and spike determinacy. Development 146, dev175398. doi: 10.1242/dev.175398
Li, L., Shi, F., Wang, Y. Q., Yu, X. F., Zhi, J. J., Guan, Y. B., et al. (2020). TaSPL13 regulates inflorescence architecture and development in transgenic wheat (Triticum aestivum L.). Plant Sci. 296, 110516. doi: 10.1016/j.plantsci.2020.110516
Liu, J., Chen, Z. Y., Wang, Z. H., Zhang, Z. H., Xie, X. M., Wang, Z. H., et al. (2021). Ectopic expression of VRT-A2 underlies the origin of Triticum polonicum and Triticum petropavlovskyi with long outer glumes and grains. Mol. Plant 14, 1472e1488. doi: 10.1016/j.molp.2021.05.021
Liu, J., Cheng, X. L., Liu, P., Sun, J. Q. (2017). miR156-Targeted SBP-box transcription factors interact with DWARF53 to regulate TEOSINTE BRANCHED1 and BARREN STALK1 expression in bread wheat. Plant Physiol. 174, 1931e1948. doi: 10.1104/pp.17.00445
Liu, C. Y., Sukumaran, S., Claverie, E., Sansaloni, C., Dreisigacker, S., Reynolds, M. (2019). Genetic dissection of heat and drought stress QTLs in phenology-controlled synthetic-derived recombinant inbred lines in spring wheat. Mol. Breed. 39, 34. doi: 10.1007/s11032-019-0938-y
Liu, S. B., Zhou, R. H., Dong, Y. C., Li, P., Jia, J. Z. (2006). Development, utilization of introgression lines using a synthetic wheat as donor. Theor. Appl. Genet. 112, 1360–1373. doi: 10.1007/s00122-006-0238-x
Luo, X. M., Yang, Y. M., Lin, X. L., Xiao, J. (2023). Deciphering spike architecture formation towards yield improvement in wheat. J. Genet. Genomics. 50, 835–845. doi: 10.1016/j.jgg.2023.02.015
McIntyre, C. L., Mathews, K. L., Rattey, A. (2010). Molecular detection of genomic regions associated with grain yield and yield-related components in an elite bread wheat cross evaluated under irrigated and rainfed conditions. Theor. Appl. Genet. 120, 527–541. doi: 10.1007/s00122-009-1173-4
Meng, L., Li, H. H., Zhang, L. Y., Wang, J. K. (2015). QTL IciMapping: integrated software for genetic linkage map construction and quantitative trait locus mapping in biparental populations. Crop J. 3, 269–283. doi: 10.1016/j.cj.2015.01.001
Mizuno, N., Ishikawa, G., Kojima, H., Tougou, M., Kiribuchi-Otobe, C., Fujita, M., et al. (2021). Genetic mechanisms determining grain number distribution along the spike and their effect on yield components in wheat. Mol. Breed. 41, 62. doi: 10.1007/s11032-021-01255-8
Pelaz, S., Ditta, G. S., Baumann, E., Wisman, E., Yanofsky, M. F. (2000). B and C floral organ identity functions require SEPALLATA MADS-box genes. Nature 405, 200e203. doi: 10.1038/35012103
Peng, J. H., Ronin, Y., Fahima, T., Röder, M. S., Li, Y. C., Nevo, E., et al. (2003). Domestication quantitative trait loci in Triticum dicoccoides, the progenitor of wheat. Proc. Natl. Acad. Sci. U. S. A. 100, 2489–2494. doi: 10.1073/pnas.252763199
Pfannebecker, K. C., Lange, M., Rupp, O., Becker, A. (2017). Seed plant-specific gene lineages involved in carpel development. Mol. Biol. Evol. 34, 925–942. doi: 10.1093/molbev/msw297
Poursarebani, N., Seidensticker, T., Koppolu, R., Trautewig, C., Gawroński, P., Bini, F., et al. (2015). The genetic basis of composite spike form in barley and ‘Miracle-Wheat’. Genetics 201, 155e165. doi: 10.1534/genetics.115.176628
Pretini, N., Vanzetti, L. S., Terrile, I. I., Donaire, G., González, F. G. (2021). Mapping QTL for spike fertility and related traits in two doubled haploid wheat (Triticum aestivum L.) populations. BMC Plant Biol. 21, 353. doi: 10.1186/s12870-021-03061-y
Qiao, L., Li, H. L., Wang, J., Zhao, J., Zheng, X., Wu, B., et al. (2022). Analysis of genetic regions related to field grain number per spike from Chinese wheat founder parent Linfen 5064. Front. Plant Sci. 12. doi: 10.3389/fpls.2021.808136
Quarrie, S. A., Steed, A., Calestani, C. (2005). A high-density genetic map of hexaploid wheat (Triticum aestivum L.) from the cross Chinese Spring × SQ1 and its use to compare QTLs for grain yield across a range of environments. Theor. Appl. Genet. 110, 865–880. doi: 10.1007/s00122-004-1902-7
Ray, D. K., Mueller, N. D., West, P. C., Foley, J. A. (2013). Yield trends are insufficient to double global crop production by 2050. PloS One 8, e66428. doi: 10.1371/journal.pone.0066428
Roncallo, P. F., Alliraju, P. C., Cervigni, G. L., Echenique, V. C. (2017). QTL mapping and analysis of epistatic interactions for grain yield and yield-related traits in Triticum turgidum L. var. durum. Euphytica 213, 277. doi: 10.1007/s10681-017-2058-2
Rustgi, S., Shafqat, M. N., Kumar, N., Baenziger, P. S., Ali, M. L., Dweikat, I., et al. (2013). Genetic dissection of yield and its component traits using high-density composite map of wheat chromosome 3A: bridging gaps between QTLs and underlying genes. PloS One 8, e70526. doi: 10.1371/journal.pone.0070526
Shaw, L. M., Lyu, B., Turner, R., Li, C., Chen, F., Han, X., et al. (2019). FLOWERING LOCUS T2 regulates spike development and fertility in temperate cereals. J. Exp. Bot. 70, 193e204. doi: 10.1093/jxb/ery350
Shi, C. L., Ren, Y. L., Liu, L. L., Wang, F., Zhang, H., Tian, P., et al. (2019). Ubiquitin Specific Protease 15 has an important role in regulating grain width and size in rice. Plant Physiol. 180, 381–391. doi: 10.1104/pp.19.00065
Su, Z., Hao, C., Wang, L., Dong, Y., Zhang, X. (2011). Identification and development of a functional marker of TaGW2 associated with grain weight in bread wheat (Triticum aestivum L). Theor. Appl. Genet. 122, 211–223. doi: 10.1007/s00122-010-1437-z
Su, J. Y., Zheng, Q., Li, H. W., Li, B., Jing, R. L., Tong, Y. P., et al. (2009). Detection of QTLs for phosphorus use efficiency in relation to agronomic performance of wheat grown under phosphorus sufficient and limited conditions. Plant Sci. 176, 824–836. doi: 10.1016/j.plantsci.2009.03.006
Wang, R. X., Hai, L., Zhang, X. Y., You, G. X., Yan, C. S., Xiao, S. H. (2009). QTL mapping for grain filling rate and yield-related traits in RILs of the Chinese winter wheat population Heshangmai × Yu8679. Theor. Appl. Genet. 118, 313–325. doi: 10.1007/s00122-008-0901-5
Wang, Y., Hou, J., Liu, H., Li, T., Wang, K., Hao, C. Y., et al. (2019). TaBT1 affecting starch synthesis and thousand kernel weight underwent strong selection during wheat improvement. J. Exp. Bot. 70, 1497–1511. doi: 10.1093/jxb/erz032
Wang, J. S., Liu, W. H., Wang, H., Li, L., Wu, J., Yang, X., et al. (2011). QTL mapping of yield-related traits in the wheat germplasm 3228. Euphytica 177, 277–292. doi: 10.1007/s10681-010-0267-z
Wu, X. D., Cai, X. B., Zhang, B. W., Wu, S., Wang, R., Li, N., et al. (2022). ERECTA regulates seed size independently of its intracellular domain via MAPK-DA1-UBP15 signaling. Plant Cell 34, 3773–3789. doi: 10.1093/plcell/koac194
Yan, L. L., Fu, D. L., Li, C. X., Blechl, A., Tranquilli, G., Bonafede, M., et al. (2006). The wheat and barley vernalization gene VRN3 is an orthologue of FT. Proc. Natl. Acad. Sci. U. S. A. 103, 19581e19586. doi: 10.1073/pnas.0607142103
Yan, L. L., Helguera, M., Kato, K., Fukuyama, S., Sherman, J., Dubcovsky, J. (2004). Allelic variation at the VRN-1 promoter region in polyploid wheat. Theor. Appl. Genet. 109, 1677e1686. doi: 10.1007/s00122-004-1796-4
Yang, Y., Amo, A., Wei, D., Chai, Y., Zhang, J., Qiao, P., et al. (2021). Large-scale integration of meta-QTL and genome-wide association study discovers the genomic regions and candidate genes for yield and yield-related traits in bread wheat. Theor. Appl. Genet. 134, 3083–3109. doi: 10.1007/s00122-021-03881-4
Yu, Q., Feng, B., Xu, Z. B., Fan, X. L., Zhou, Q., Ji, G. S., et al. (2022). Genetic dissection of three major quantitative trait loci for spike compactness and length in bread wheat (Triticum aestivum L.). Front. Plant Sci. 13. doi: 10.3389/fpls.2022.882655
Zhang, H., Chen, J. S., Li, R. Y., Deng, Z., Zhang, K., Liu, B., et al. (2016). Conditional QTL mapping of three yield components in common wheat (Triticum aestivum L.). Crop J. 4, 220–228. doi: 10.1016/j.cj.2016.01.007
Zhong, J. S., van Esse, G. W., Bi, X. J., Lan, T., Walla, A., Sang, Q., et al. (2021). INTERMEDIUM-M encodes an HvAP2L-H5 ortholog and is required for inflorescence indeterminacy and spikelet determinacy in barley. Proc. Natl. Acad. Sci. U. S. A. 118, e2011779118. doi: 10.1073/pnas.2011779118
Keywords: QTL mapping, BSE-Seq, grain number per spike, haplotype analysis, wheat
Citation: Jiang C, Xu Z, Fan X, Zhou Q, Ji G, Liao S, Wang Y, Ma F, Zhao Y, Wang T and Feng B (2024) Genetic dissection of major QTL for grain number per spike on chromosomes 5A and 6A in bread wheat (Triticum aestivum L.). Front. Plant Sci. 14:1305547. doi: 10.3389/fpls.2023.1305547
Received: 02 October 2023; Accepted: 08 December 2023;
Published: 08 January 2024.
Edited by:
Baohua Wang, Nantong University, ChinaReviewed by:
Jindong Liu, Chinese Academy of Agricultural Sciences, ChinaJian Ma, Sichuan Agricultural University, China
Copyright © 2024 Jiang, Xu, Fan, Zhou, Ji, Liao, Wang, Ma, Zhao, Wang and Feng. This is an open-access article distributed under the terms of the Creative Commons Attribution License (CC BY). The use, distribution or reproduction in other forums is permitted, provided the original author(s) and the copyright owner(s) are credited and that the original publication in this journal is cited, in accordance with accepted academic practice. No use, distribution or reproduction is permitted which does not comply with these terms.
*Correspondence: Bo Feng, ZmVuZ2JvQGNpYi5hYy5jbg==