 Kai-Ling Xu1†
 Zhong-Mou Zhang1,2†
 Wen-Liang Fang1Ya-Dan Wang1*Hong-Yu Jin1*
 Feng Wei1*
 Shuang-Cheng Ma1*
- 1Institute for Control of Chinese Traditional Medicine and Ethnic Medicine, National Institutes for Food and Drug Control, Beijing, China
- 2School of Traditional Chinese Pharmacy, China Pharmaceutical University, Nanjing, China
The genus Tripterygium was of great medicinal value and attracted much attention on the taxonomic study using morphological and molecular methods. In this study, we assembled 12 chloroplast genomes of Tripterygium to reveal interspecific difference and intraspecific variation. The sequence length (156,692–157,061 bp) and structure of Tripterygium were conserved. Comparative analyses presented abundant variable regions for further study. Meanwhile, we determined the ndhB gene under positive selection through adaptive evolution analysis. And the phylogenetic analyses based on 15 chloroplast genomes supported the monophyly of Tripterygium hypoglaucum and the potential sister relationship between Tripterygium wilfordii and Tripterygium regelii. Molecular dating analysis indicated that the divergence time within Tripterygium was approximately 5.99 Ma (95% HPD = 3.11–8.68 Ma). The results in our study provided new insights into the taxonomy, evolution process, and phylogenetic construction of Tripterygium using complete plastid genomes.
1 Introduction
The genus Tripterygium (Celastraceae) comprises three species, Tripterygium wilfordii, Tripterygium hypoglaucum, and Tripterygium regelii, which were widely distributed in central and eastern Asia. As a renowned traditional medicine for treating arthritis, swelling, autoimmune disease, and diabetic nephropathy (Tao et al., 1991; Ge et al., 2013; Wang et al., 2016), it has attracted extensive attention from scholars, especially phytochemists. More than 500 compounds have been isolated and identified, including triptolide, a bioactive diterpene triepoxide that has been studied for decades (Lv et al., 2019; Tong et al., 2021). However, the boundaries of interspecific plant morphology, such as leaf, flower, and samara characteristics, are blurred (Brinker et al., 2007). The root of T. wilfordii and T. hypoglaucum was used as a medicinal part and widely applied in various commercial pharmaceutical preparations; their microscopic and morphological characteristics were difficult to distinguish, leading to potential issues in drug quality control. Differences in chemical composition of these three species have been confirmed by HPLC, RRLC-ESI-MSn, and PCA analyses (Guo et al., 2014; Chen et al., 2017). However, molecular phylogenetic studies using RAPD, 5S rDNA, ITS, or the combination of these DNA regions, presented different perspectives. Some authors considered that T. wilfordii and T. hypoglaucum were potentially conspecific, while T. regelii was recognized as a separate species (Liu et al., 2007; Law et al., 2011; Zhang et al., 2016; Ma et al., 2017). Therefore, it is urgently needed to develop effective methods to study phylogenetic relationships and provide taxonomic clarity of this genus.
With the popularization and cost reduction of next-generation sequencing technology, comparative analyses of complete plastid genomes were increasingly being applied for phylogenetic studies. Chloroplasts, which are mainly found in plant cells, are essential organelles that conduct photosynthesis, carbon fixation, and other fundamental intermediary metabolic reactions (Xiong et al., 2009). The structure of chloroplast genomes was divided into four parts, two copies of inverted repeat (IR) regions, a large single-copy (LSC) region, and a small single-copy (SSC) region (Palmer, 1985; Xu et al., 2023). The chloroplast genome was highly conserved (typically between 120 and 220 kb) and had relatively moderate evolutionary rate, which could provide vital information for the classification and phylogenetic relationship construction among species (Yan et al., 2022).
Currently, the classification and phylogeny studies of Tripterygium are only based on short DNA regions, lacking research based on complete chloroplast genomes, making it difficult to fully resolve the taxonomical controversies of this genus. Therefore, in this study, 12 samples of genus Tripterygium distributed in the main producing areas of China were collected. Comparative analyses using complete chloroplast genomes obtained and annotated in our study were conducted to reveal the interspecific difference and intraspecific variation of Tripterygium genus. And analyses of adaptive evolution, molecular divergence time, and phylogeny were used to study the evolution process and phylogenetic relationships within Tripterygium.
2 Materials and methods
2.1 Plant materials, DNA extraction and sequencing
As T. wilfordii and T. hypoglaucum were usually for clinical use and the classification between them was controversial, fresh leaves of four T. wilfordii and eight T. hypoglaucum were collected, and the detailed location information was shown in Supplementary Table S1. Moreover, a sequence of T. regelii was mined from GenBank for comparative analyses. Total genomic DNA was extracted using TianGen DP 305 Plant Genomic DNA Kit in accordance with the instruction. DNA quality was assessed using a NanoDrop spectrophotometer (Thermo Scientific, Carlsbad, CA, USA) and Agilent 5400 Fragment Analyzer. The DNA samples were then sent to Novogene (Novogene Bioinformatics Technology Co., Ltd., Beijing, China) for library construction. The qualified libraries were pooled and sequenced on Illumina platforms with PE150 strategy. Fastp v.0.23.1 (Chen et al., 2018) was used to control quality and remove sequencing adaptors and low-quality bases. Finally, over 2 G clean data of all samples were prepared for further study.
2.2 Chloroplast genome assembly and annotation
Filtered reads were assembled by SPAdes v3.13.1 genome assembler (Bankevich et al., 2012) with kmer sizes of 35, 55, 77, and 127. The MUMmer program (Kurtz et al., 2004) was used to compare the assembled contigs with the reference genome (MN624264). All chloroplast genomes were reconstructed by reference-based assembly. Annotation was conducted by CPGAVAS2 (Shi et al., 2019) and checked manually. Finally, the chloroplast genomes were plotted by Chloroplot (Zheng et al., 2020). All of the chloroplast genomes and annotations were uploaded to GenBank and assigned the accession numbers OR426549-52 and OR426554-60 (Table 1).
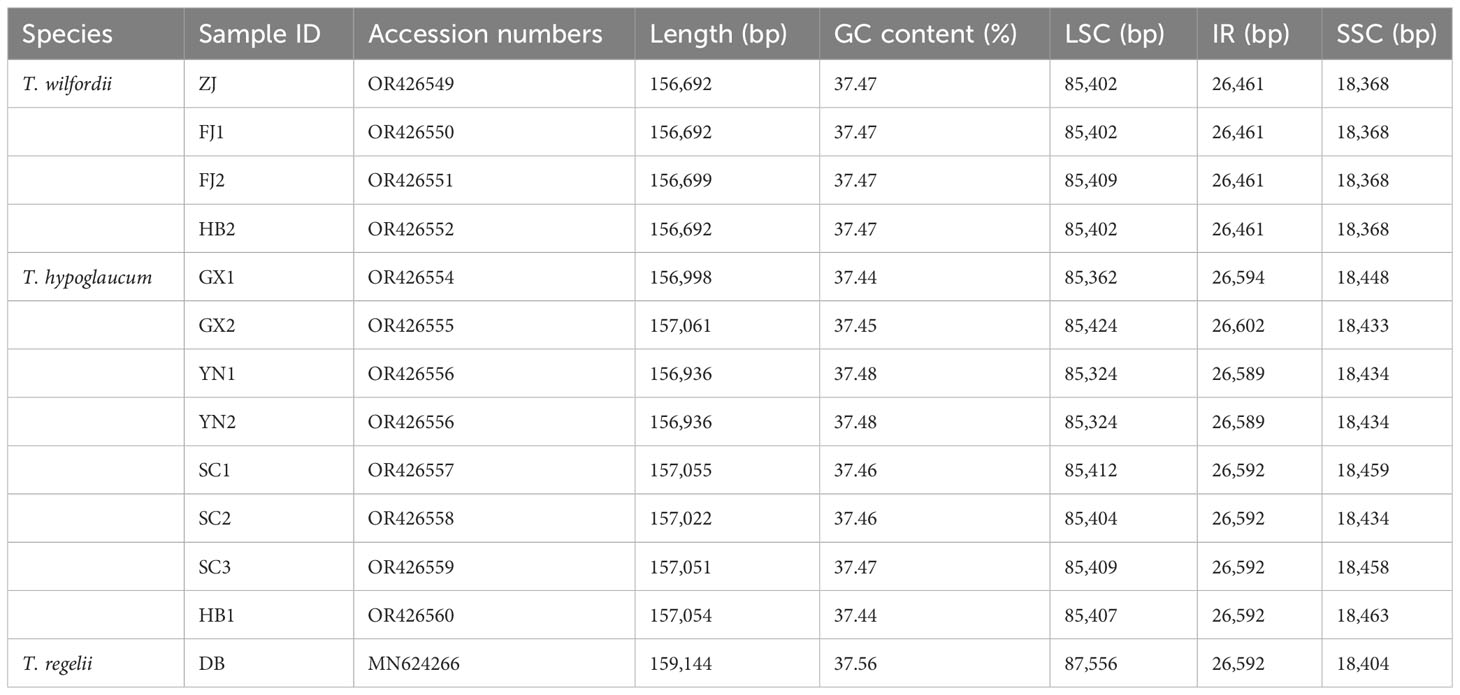
Table 1 Characteristics of complete chloroplast genomes.
2.3 Comparative analyses of genome structure
The boundaries of LSC, SSC, and IR regions in all of the Tripterygium chloroplast genomes were compared by CPJSdraw (Li et al., 2023). The mVISTA (Frazer et al., 2001) was applied to visualize the variations among these genomes in Shuffle-LAGAN mode. The dispersed and palindromic repeats were determined by REPuter (Kurtz et al., 2001) with Hamming distance set to 1 and the minimum repeat size set to 30 bp. Based on the default parameters, the online Tandem Repeats Finder (Benson, 1999) program was applied for tandem repeat calculation, but the minimum alignment score was set to 80. Simple sequence repeats (SSRs) were detected using MISA Perl script (Thiel et al., 2003), the parameter of which was set as thresholds of 10 repeat units for mono-, six repeat units for di-, four repeat units for tri- and tetra-, and three repeat units for penta- and hexanucleotide SSRs.
The evolution rate was analyzed according to the non-synonymous (dN), synonymous (dS), and their ratio (ω = dN/dS) after extracting the common functional protein-coding sequences in Tripterygium (sequences represented by FJ1, YN2, and DB). The positive selection sites were determined by program PAML4.9 (Yang, 2007) with site-specific model implemented in the codeml package and Bayes Empirical Bayes (BEB) analysis. And the parameters were set as previously reported (Fan et al., 2018). Candidate sites for positive selection [p(ω > 1) > 0.95] were selected for two Likelihood ratio tests (M1 vs. M2 and M7 vs. M8).
The nucleotide diversity (Pi) was calculated via the DnaSP (Rozas et al.) program after the clusters of coding and noncoding regions were extracted. And the possible DNA rearrangement among chloroplast genomes was detected by Mauve plugin in GENEIOUS (Darling et al., 2010).
2.4 Phylogenetic analyses
Phylogenetic topology of Tripterygium was reconstructed using Maximum likelihood (ML) and Bayesian inference (BI) methods. Fifteen complete chloroplast genomes were used for the study of phylogenetic relationships, including 13 sequences of genus Tripterygium. Sequences of Celastrus orbiculatus (MW316708) and Celastrus stylosus (MZ508373) were chosen as outgroups to root the tree. All of the chloroplast genomes were aligned by MAFFT v.7.520 (Katoh and Standley, 2013) and trimmed by trimAI v.1.2 (Capella-Gutiérrez et al., 2009) with the option of automated1. ML analyses were performed using IQ-TREE v.1.6.12 (Nguyen et al., 2015) with 10,000 bootstrap replications, in which the best fitting model was selected (Kalyaanamoorthy et al., 2017). BI analyses were conducted by MrBayes 3.2.7 (Ronquist et al., 2012). The best-fit model (GTR+I+G) was selected by Akaike information criterion (AIC) in MrModeltest 2.4 (Guo et al., 2022). And the BI analyses were run for 2,000,000 generations and sampled every 100 generation. The first 25% of trees were discarded as burn-ins. And the program Tracer 1.7.2 (Rambaut et al., 2018) was used to determine the effective sample size (>200). Finally, the obtained trees were visualized via iTOL (Letunic and Bork, 2021).
2.5 Divergence time estimation
BEAST v.1.10.4 (Drummond et al., 2012) was applied to estimate the divergence times with Yule process speciation prior and uncorrelated relaxed clock. The split between Tripterygium and the outgroup C. orbiculatus was constrained to be 27 Ma, and 5.46–11.6 Ma was set for the split within Tripterygium (Ma et al., 2017). MCMC chains were run for 1,000,000,000 generations and sampled every 1,000 generations. Tracer 1.7.2 (Rambaut et al., 2018) was used to evaluate the convergence according to the effective sample size (ESS > 200) with the first 10% discarded as burn-ins. TreeAnnotator v.1.10.1 (Drummond et al., 2012) was used to summarize and annotate the tree with a burn-in of 25%. Finally, the tree was visualized in the program Figtree v.1.4.4 (http://tree.bio.ed.ac.uk/) with 95% highest posterior density (95% HPD).
3 Results
3.1 Structure features of chloroplast genomes in the genus Tripterygium
The length of 12 assembled chloroplast genomes (Figure 1; Table 1) ranged from 156,692 bp (T. wilfordii, ZJ, FJ1, and HB2) to 157,061 bp (T. hypoglaucum, GX2), while the length of T. regelii was 159,144 bp (MN624266). As the plastid genome of T. hypoglaucum collected from Ziwu Town, Yunnan Province, was consistent with the plastid genome collected from Donghua Town, they are collectively named YN. Moreover, the sequence of T. wilfordii sample FJ1 was identical to HB2. All of the assembled chloroplast genomes have a typical quadripartite structure with an LSC region (85,324–87.556 bp), an SSC region (18,368–18,463 bp), and a pair of IR regions (26,461–26,602 bp). In addition, the whole guanine-cytosine (GC) contents ranged from 37.44% to 37.56%. All of the complete Tripterygium genomes contained 112 unique annotated genes, including 78 protein-coding genes, 4 rRNA genes, and 30 tRNA genes (Supplementary Table S2).
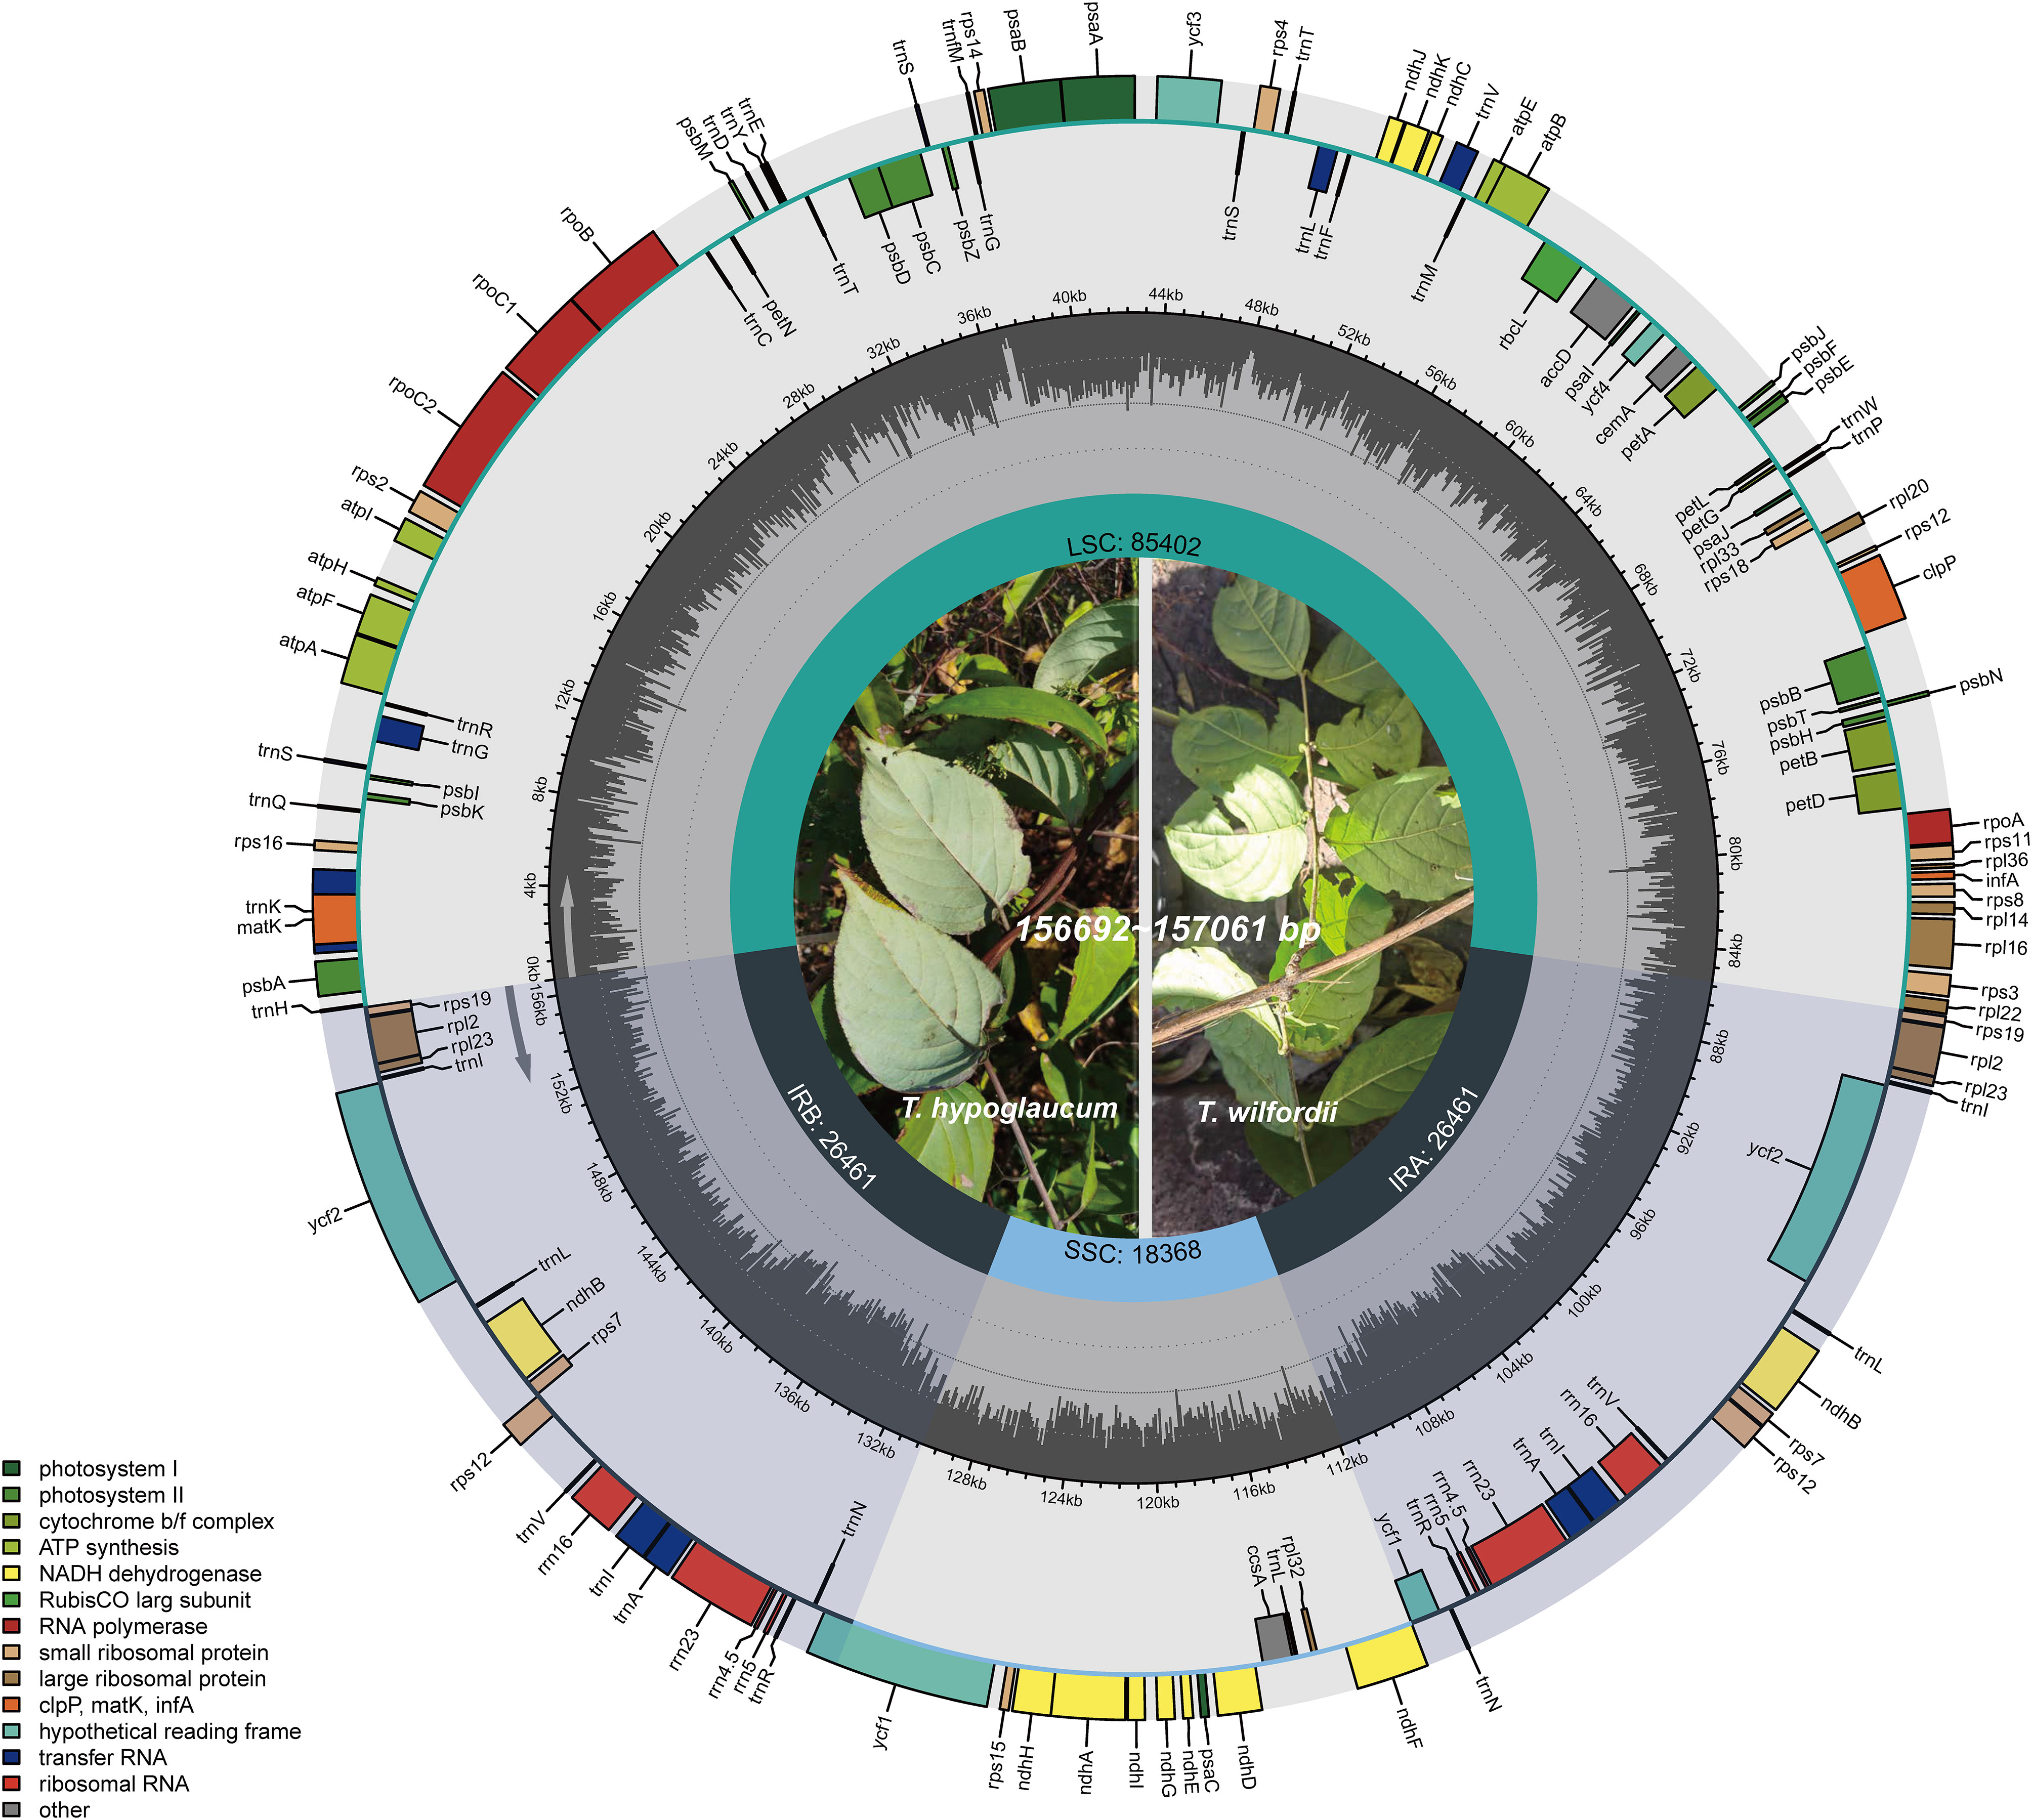
Figure 1 Chloroplast genome gene map of Tripterygium (represented by ZJ).
3.2 Comparative chloroplast genomic analyses of the genus Tripterygium
The IR/SC boundaries of Tripterygium were illustrated and compared to address IR expansion and contraction (Figure 2). As the result showed, the Tripterygium chloroplast genomes were conserved. The boundary of SSC/IRB fell within the ycf1 gene. And the SSC/IRA junctions were located between the pseudogene ycf1 and gene ndhF, while the LSC/IRA junctions were located between the gene rpl22 and rps19. In particular, all of the gene trnH of Tripterygium crossed the LSC and IRB boundary with 66 bp in LSC. It seemed that the variation of SSC/IRA boundary could be categorizable into three classes like the species within this genus. The interval between ndhF and the SSC/IRA boundary was 1 bp in T. wilfordii. However, a 28–40-bp interval in SSC was exhibited in T. hypoglaucum, with the neighboring distributions having the same intervals, such as the samples collected from Yunan (YN) and Sichuan province (SC1–3).
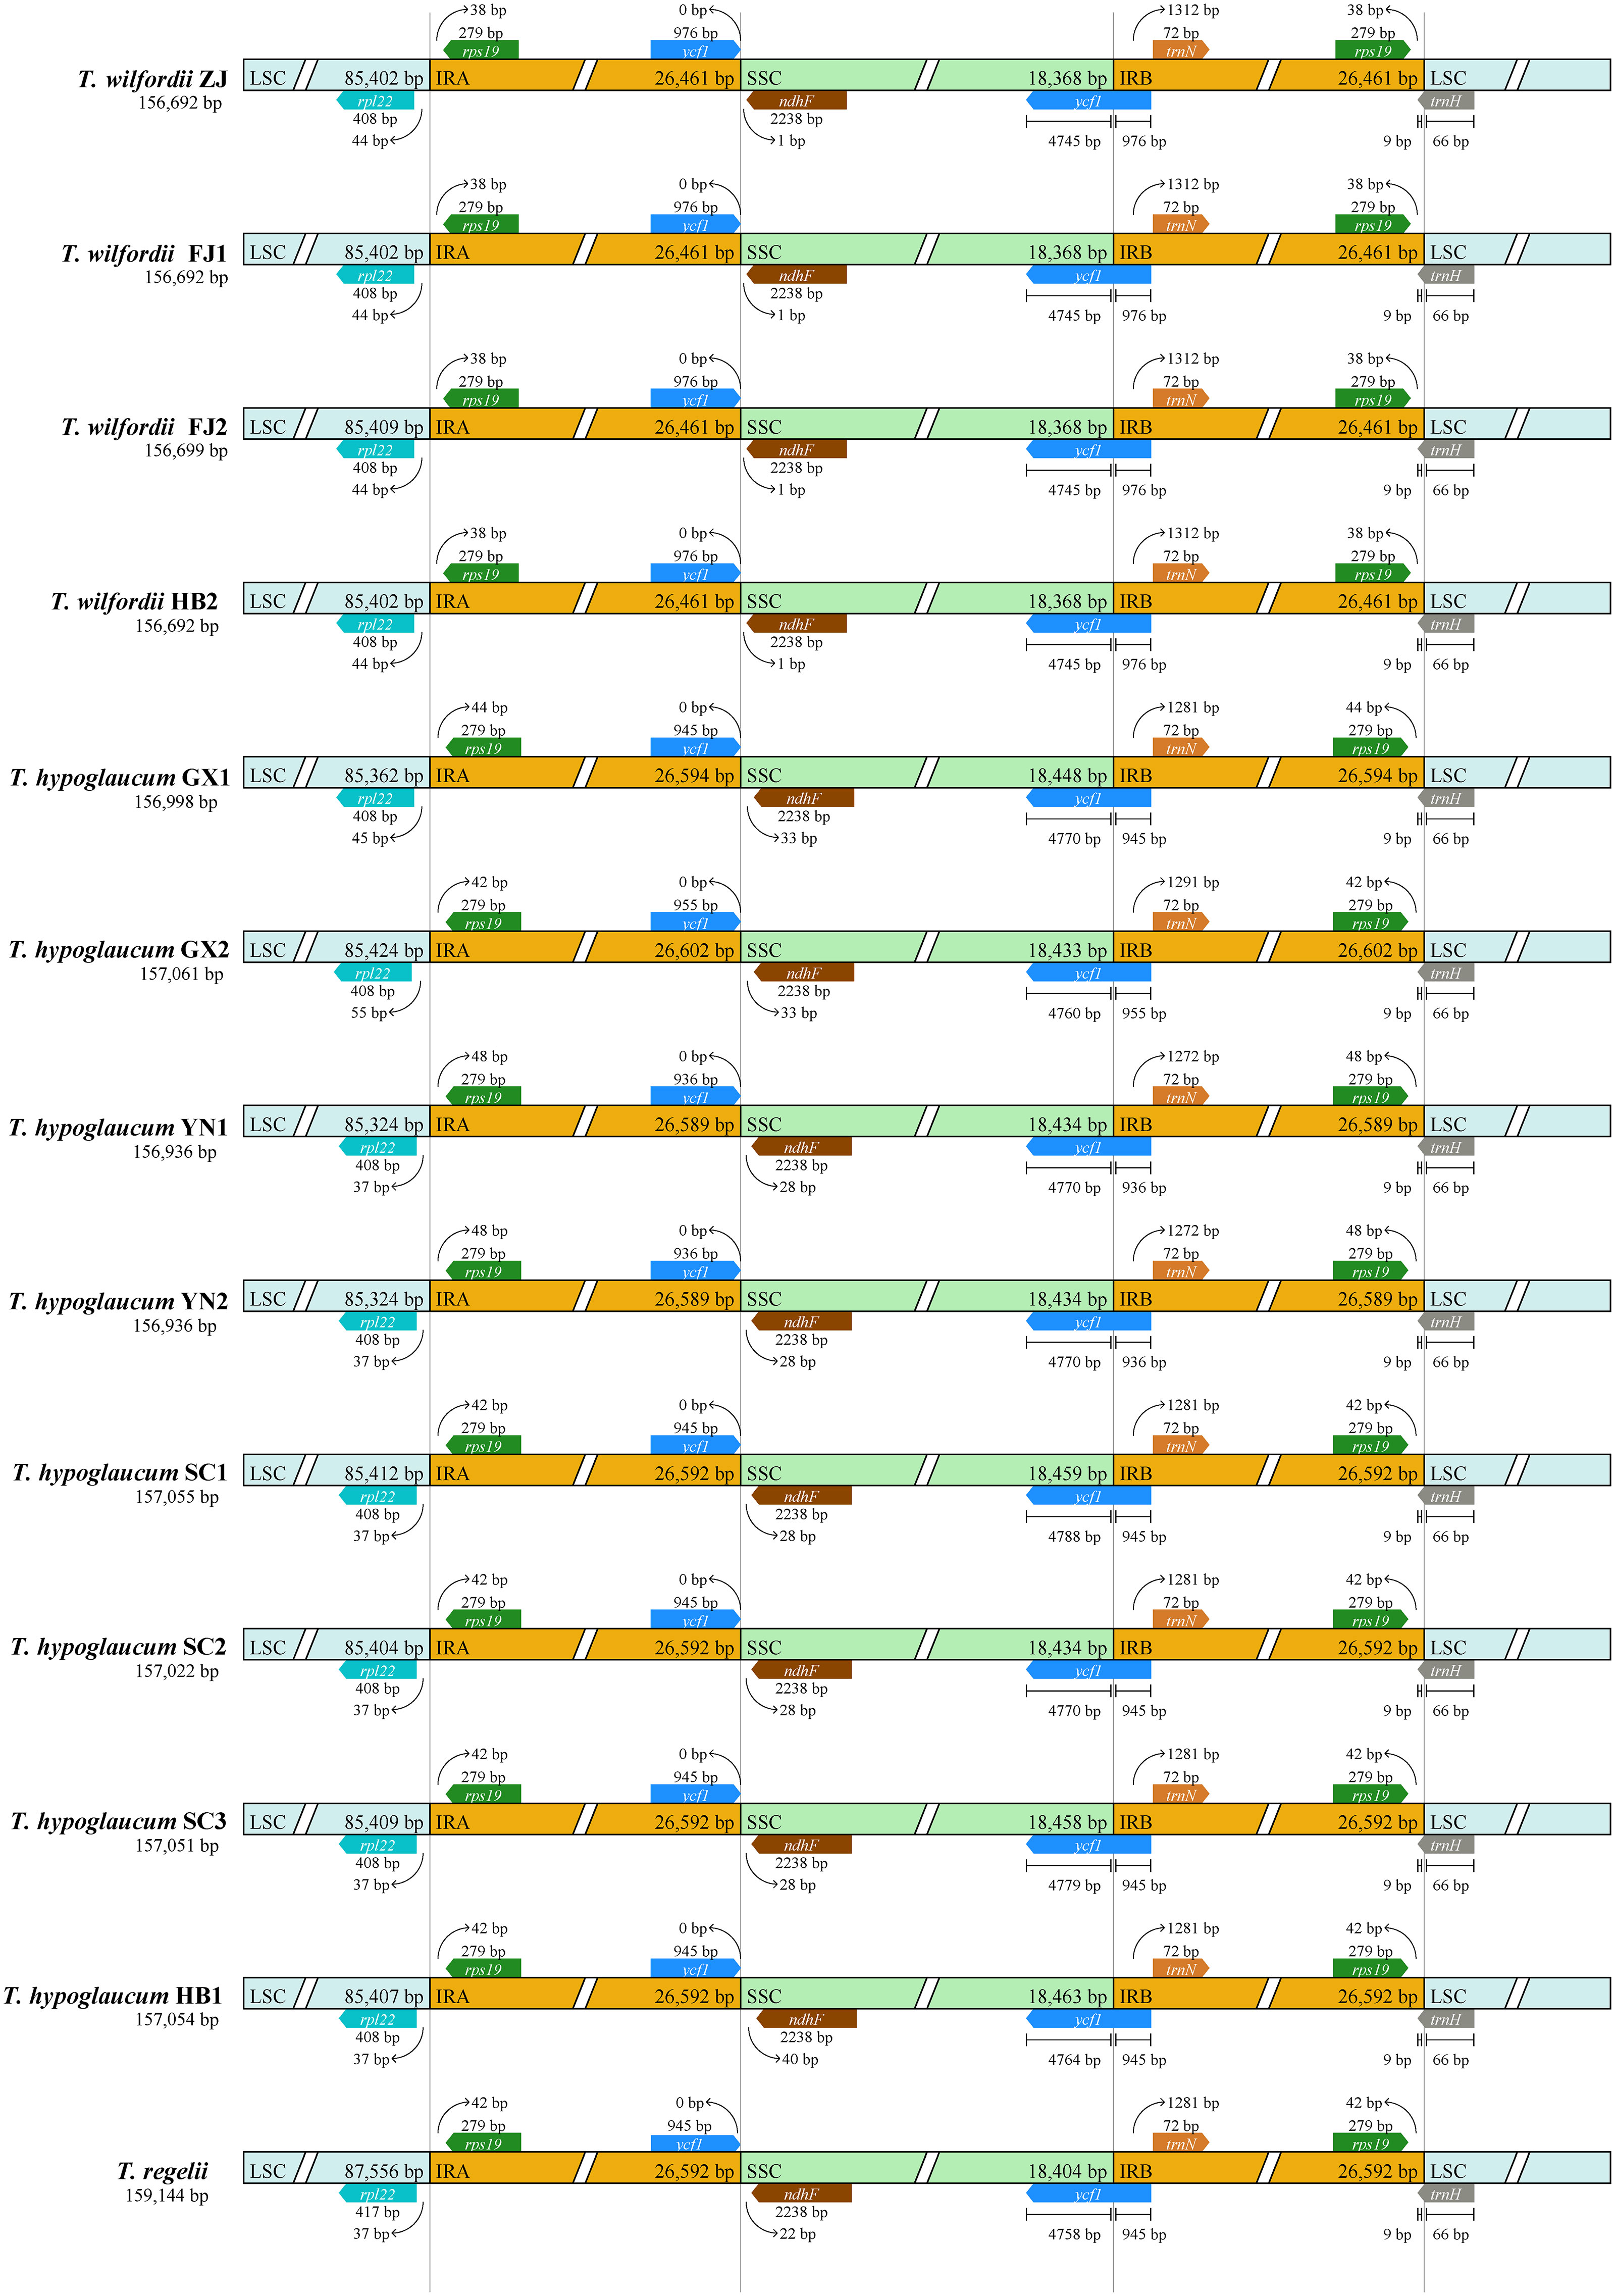
Figure 2 Boundary comparison of LSC, SSC, and IR regions among the Tripterygium chloroplast genomes.
Three kinds of repeat elements, dispersed, palindromic, and tandem repeats, were calculated in this work. Among these types of Tripterygium, the palindromic repeats accounted for the largest proportion, followed by the dispersed repeats, and the tandem repeats accounted for the least (Figure 3A). Meanwhile, the number and distribution of all repeat types in T. wilfordii were the same, with 23 palindromic repeats, 10 dispersed repeats, and 6 tandem repeats, and could be distinguished from T. hypoglaucum and T. regelii. And the repeat motif size of Tripterygium was mainly concentrated in the range of 31–40 bp, followed by 1–30 bp (Figure 3B). In particular, a unique 63-bp repeat unit was present in T. hypoglaucum collected from different regions. Given the high polymorphism of SSRs in the species, they have been widely used for the evolutionary and ecological research and considered as important molecular markers to study intraspecific variation. The total number of SSRs in Tripterygium ranged from 57 to 59. Among these SSRs, the mononucleotide repeats were the most abundant (ranged from 46 to 52), followed by the trinucleotide repeats, the whole of which were 4 in Tripterygium (Figure 3C). Hexanucleotide only occurred in samples YN, SC3, and DB, while dinucleotide occurred in all samples and could be divided into three classes. The number of dinucleotide repeats was 1 in T. wilfordii, 3 in T. hypoglaucum, and 2 in T. regelii, respectively. As Figure 3D showed, A/T repeats were abundant, while G/C repeats only existed in sample SC3. All of the samples had the A/T, AT/AT, AAT/ATT, and ACCGG/CCGGT repeats. In addition, the numbers of AAT/ATT and ACCGG/CCGGT repeats were identical in all chloroplast genomes of Tripterygium, which were 4 and 2, respectively. The divergence of assembled and annotated sequences was compared using the sample ZJ as a reference (Figure 4). It was exhibited that all of the plastid genomes were relatively conserved. Overall, the noncoding regions were more divergent than coding regions. Intergenic spacer regions, such as trnG(UCC)-trnS(GCU), trnC(GCA)-rpoB, trnG(GCC)-psbZ, ndhJ-trnF(GAA), and trnL(UAG)-rpl32, showed relatively high variability according to the results of multiple alignment, which could be studied as a potential molecular marker to distinguish T. wilfordii and T. hypoglaucum because of the significant difference in sequence length. In addition, the nucleotide diversity (Pi) of coding regions and non-coding regions was calculated (Figures 5A, B). In the coding regions, the genes rpl32, ccsA and ycf1 showed the most abundant variation (Pi > 0.003), while in the intergenic spacer regions, psbA-trnH(GUG), trnT(GGU)-trnE(UUC), rpoA-petD, rpl16-rpl14, rps7-ndhB and ndhD-ccsA had higher Pi values (Pi > 0.01). These variable regions mentioned above could be useful to find potential DNA barcodes for Tripterygium species authentication. In addition, no genomic rearrangements have been detected in chloroplast genomes (Supplementary Figure 1).
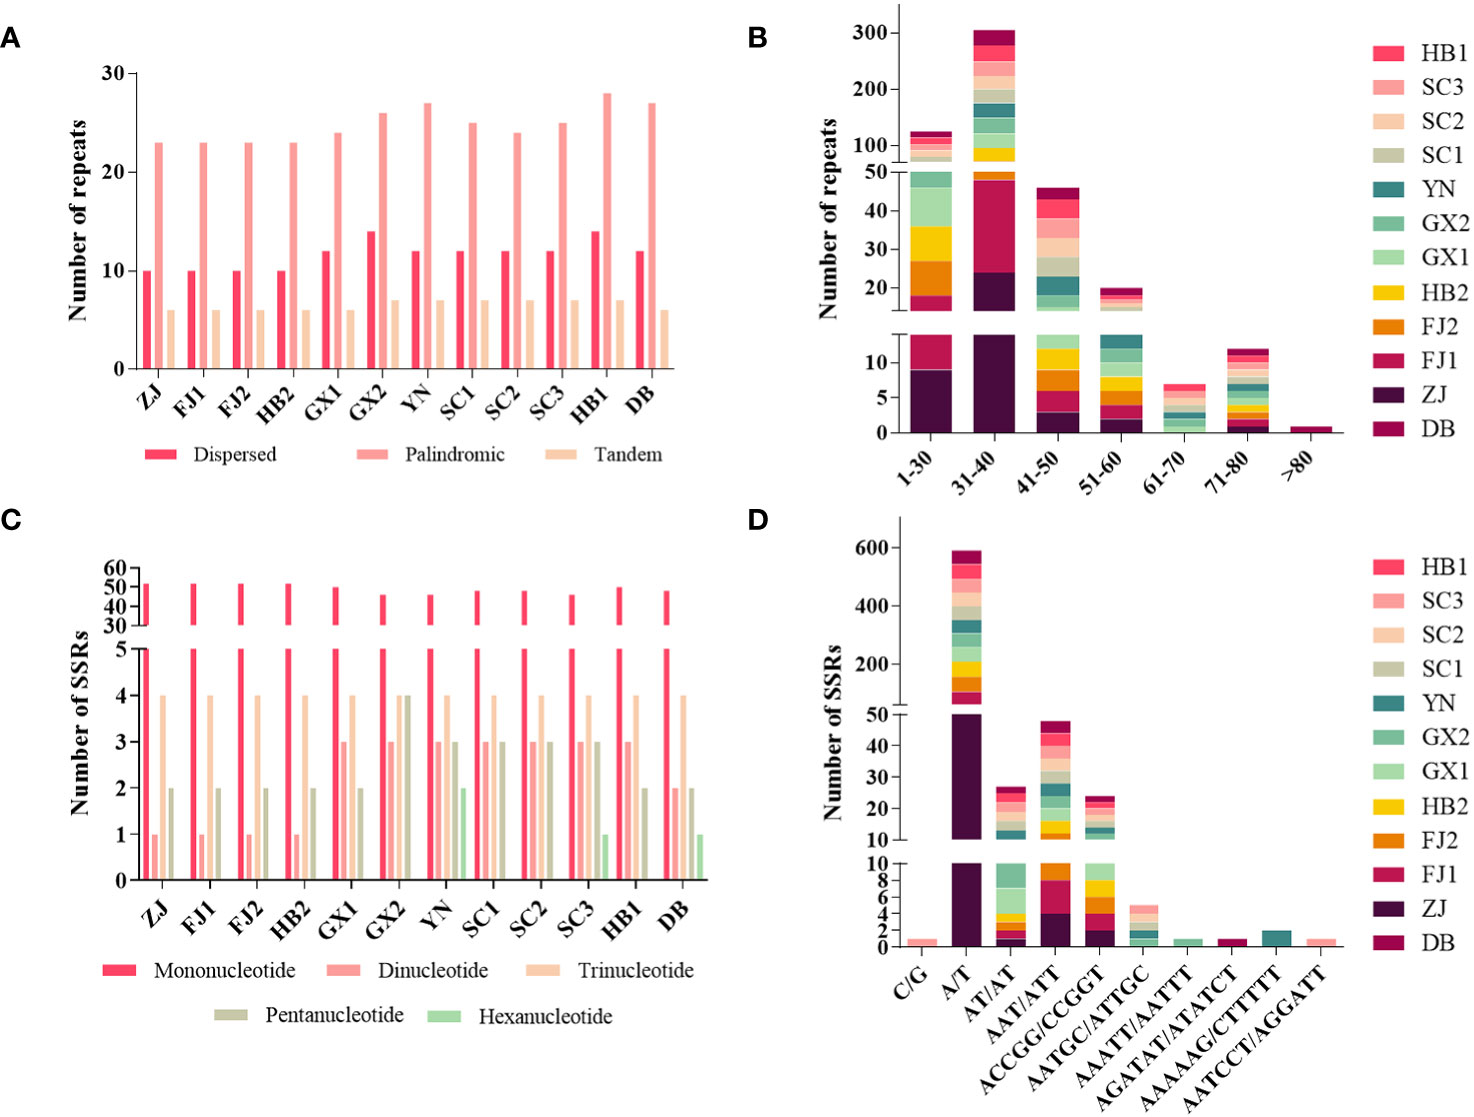
Figure 3 Analyses of repeat elements in Tripterygium: (A) numbers of dispersed, palindromic and tandem repeats; (B) distribution of repeat motifs size; (C) numbers of different repeat SSRs types; (D) numbers of different SSR class types.
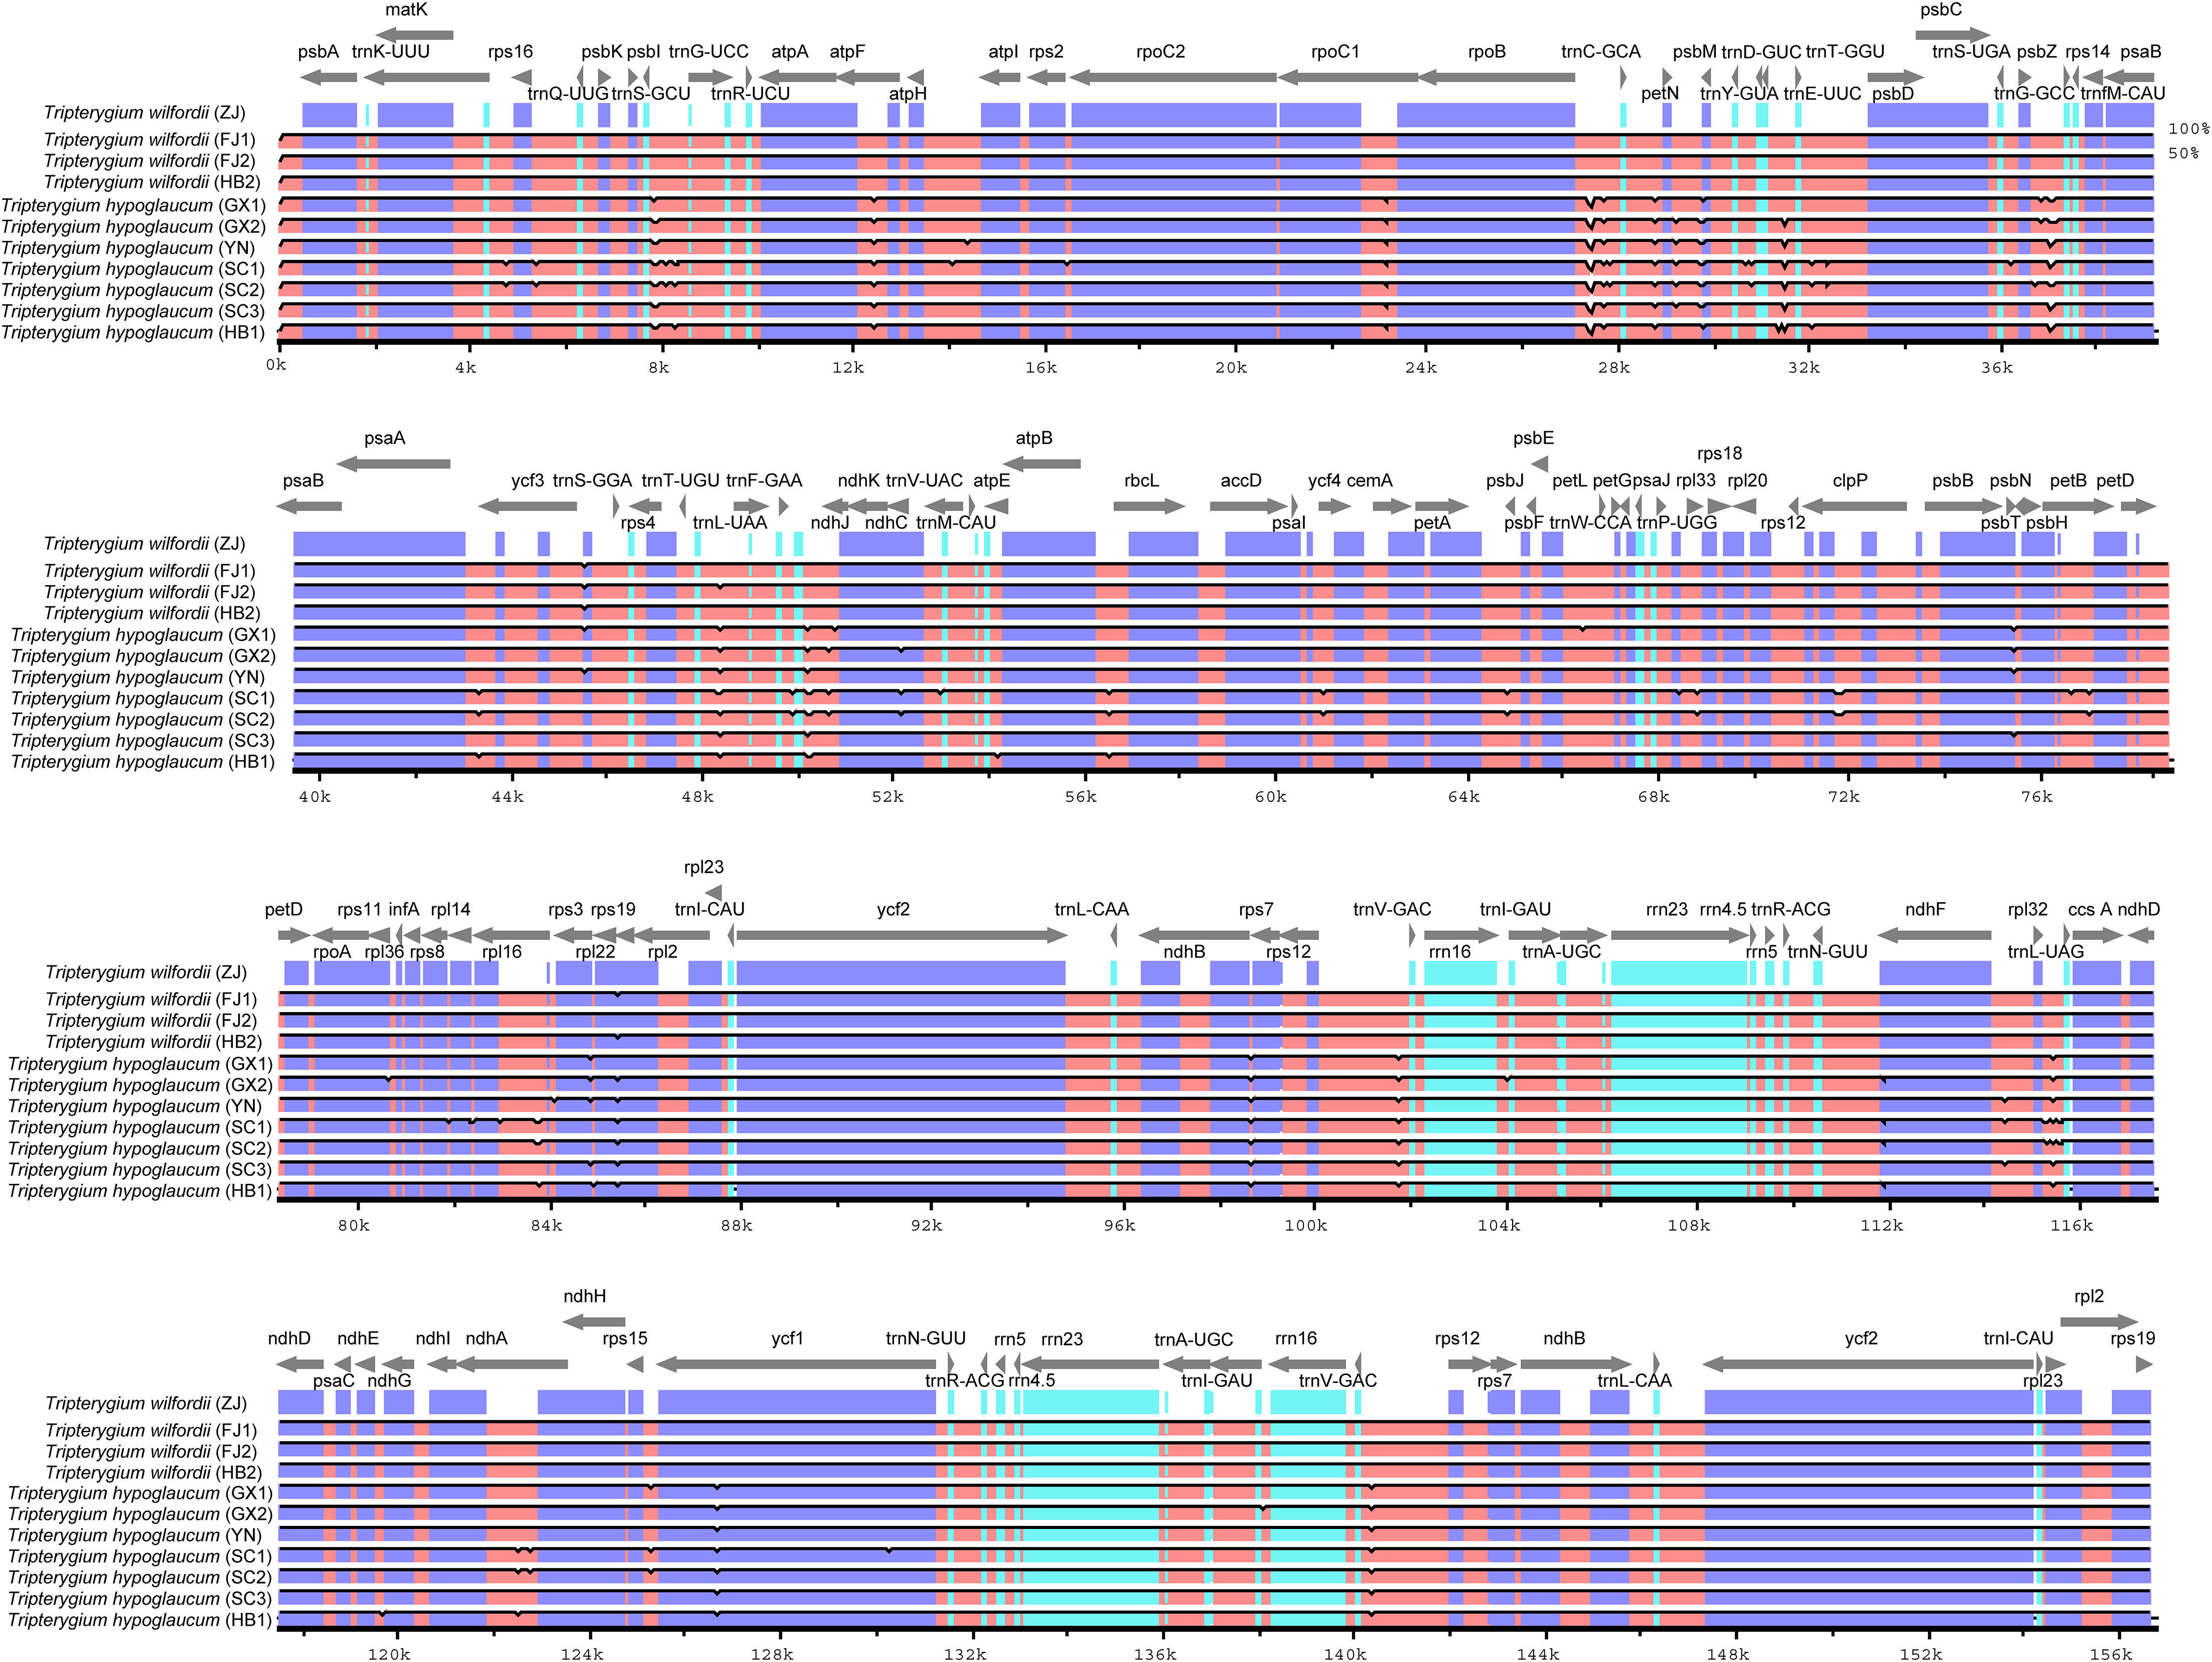
Figure 4 Alignment of the complete chloroplast genomes obtained. Gray arrows above the alignment indicate gene orientation. The right Y-axis indicated similarity in the 50%–100% range. Purple bars represent exons, blue bars represent UTRs, and pink bars represent CNS.
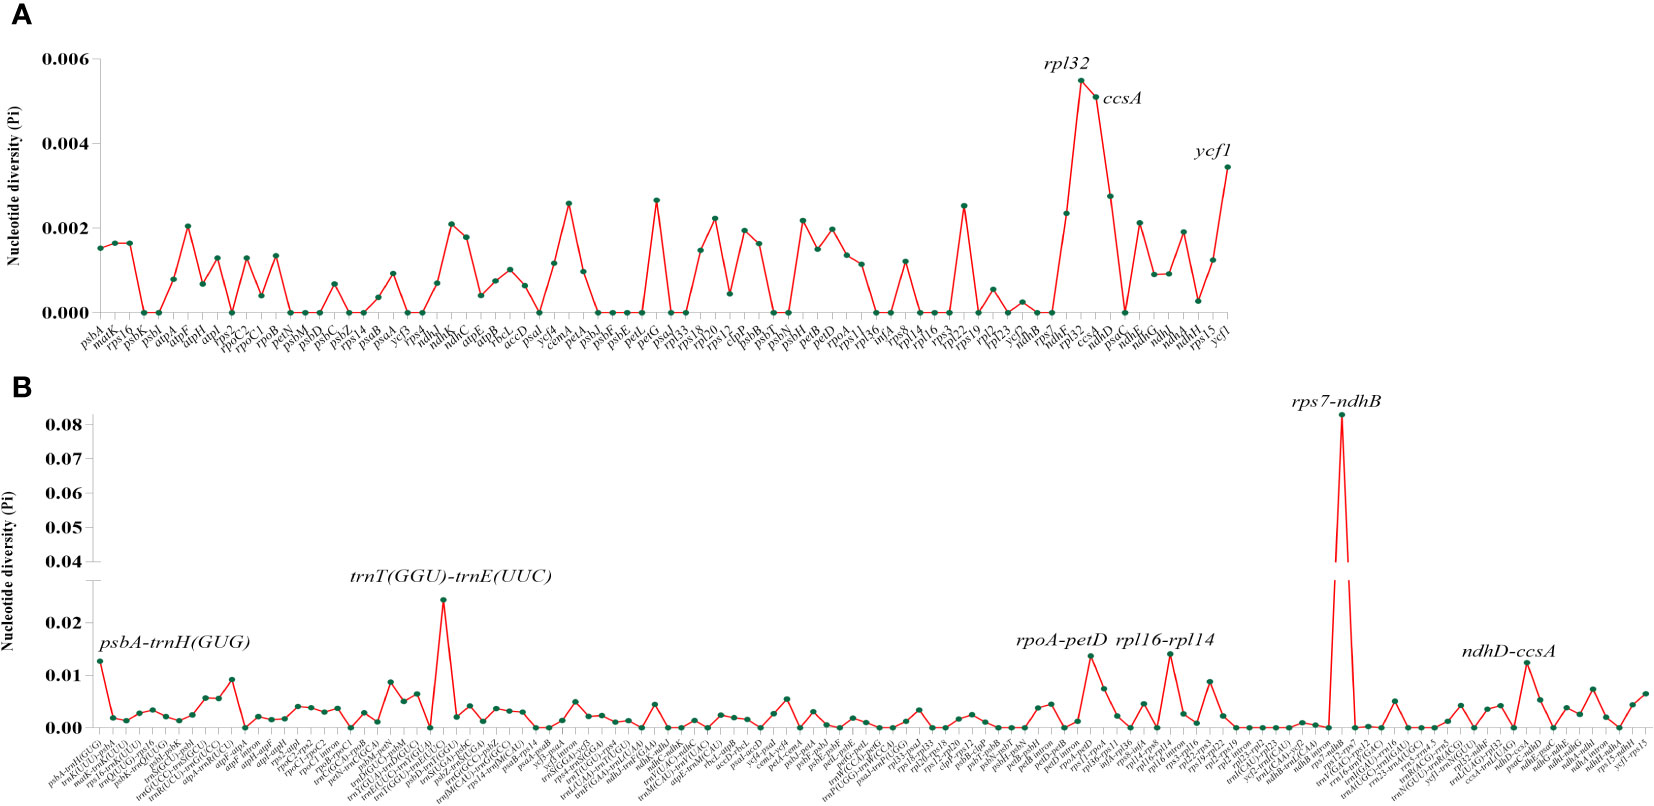
Figure 5 Nucleotide diversity of coding regions (A) and noncoding regions (B).
In this study, 75 protein-coding genes extracted from T. wilfordii (sample FJ1), T. hypoglaucum (sample YN2), and T. regelii (sample DB) were used for the adaptive evolution analysis. Positively selected sites were found in atpA, rpl20, rpoA, ccsA, matK, and ndhB genes (Supplementary Table S3). Meanwhile, there are eight positively selected sites in the ccsA gene under M2 and M8 models, two in the atpA gene, three in matK gene, and one in others. However, two LRTs (M1 vs. M2 and M7 vs. M8) only supported that the ndhB gene (Supplementary Table S4) had the positively selected codon sites (p < 0.05).
3.3 Phylogenetic analyses
The phylogenetic relationship was reconstructed based on 15 plastid genomes, including adjacent genera C. orbiculatus (MW316708) and C. stylosus (MZ508373), which were set as outgroups to root the tree. Among the whole sequences, 154,954 constant sites, with 1,278 parsimony-informative characters were used for alignment. The topologies of the ML and BI trees based on the chloroplast genomes were consistent (Figure 6). Two strongly supported clades (PP/BS = 1/100) were observed, which showed that T. hypoglaucum was monophyletic, whereas T. wilfordii was nested with T. regelii. The subclades of T. wilfordii and T. regelii could be further distinguished because of the strong support (PP/BS = 1/100). This tree confirmed the classification of Tripterygium and indicated that T. wilfordii could be distinguished from T. hypoglaucum.
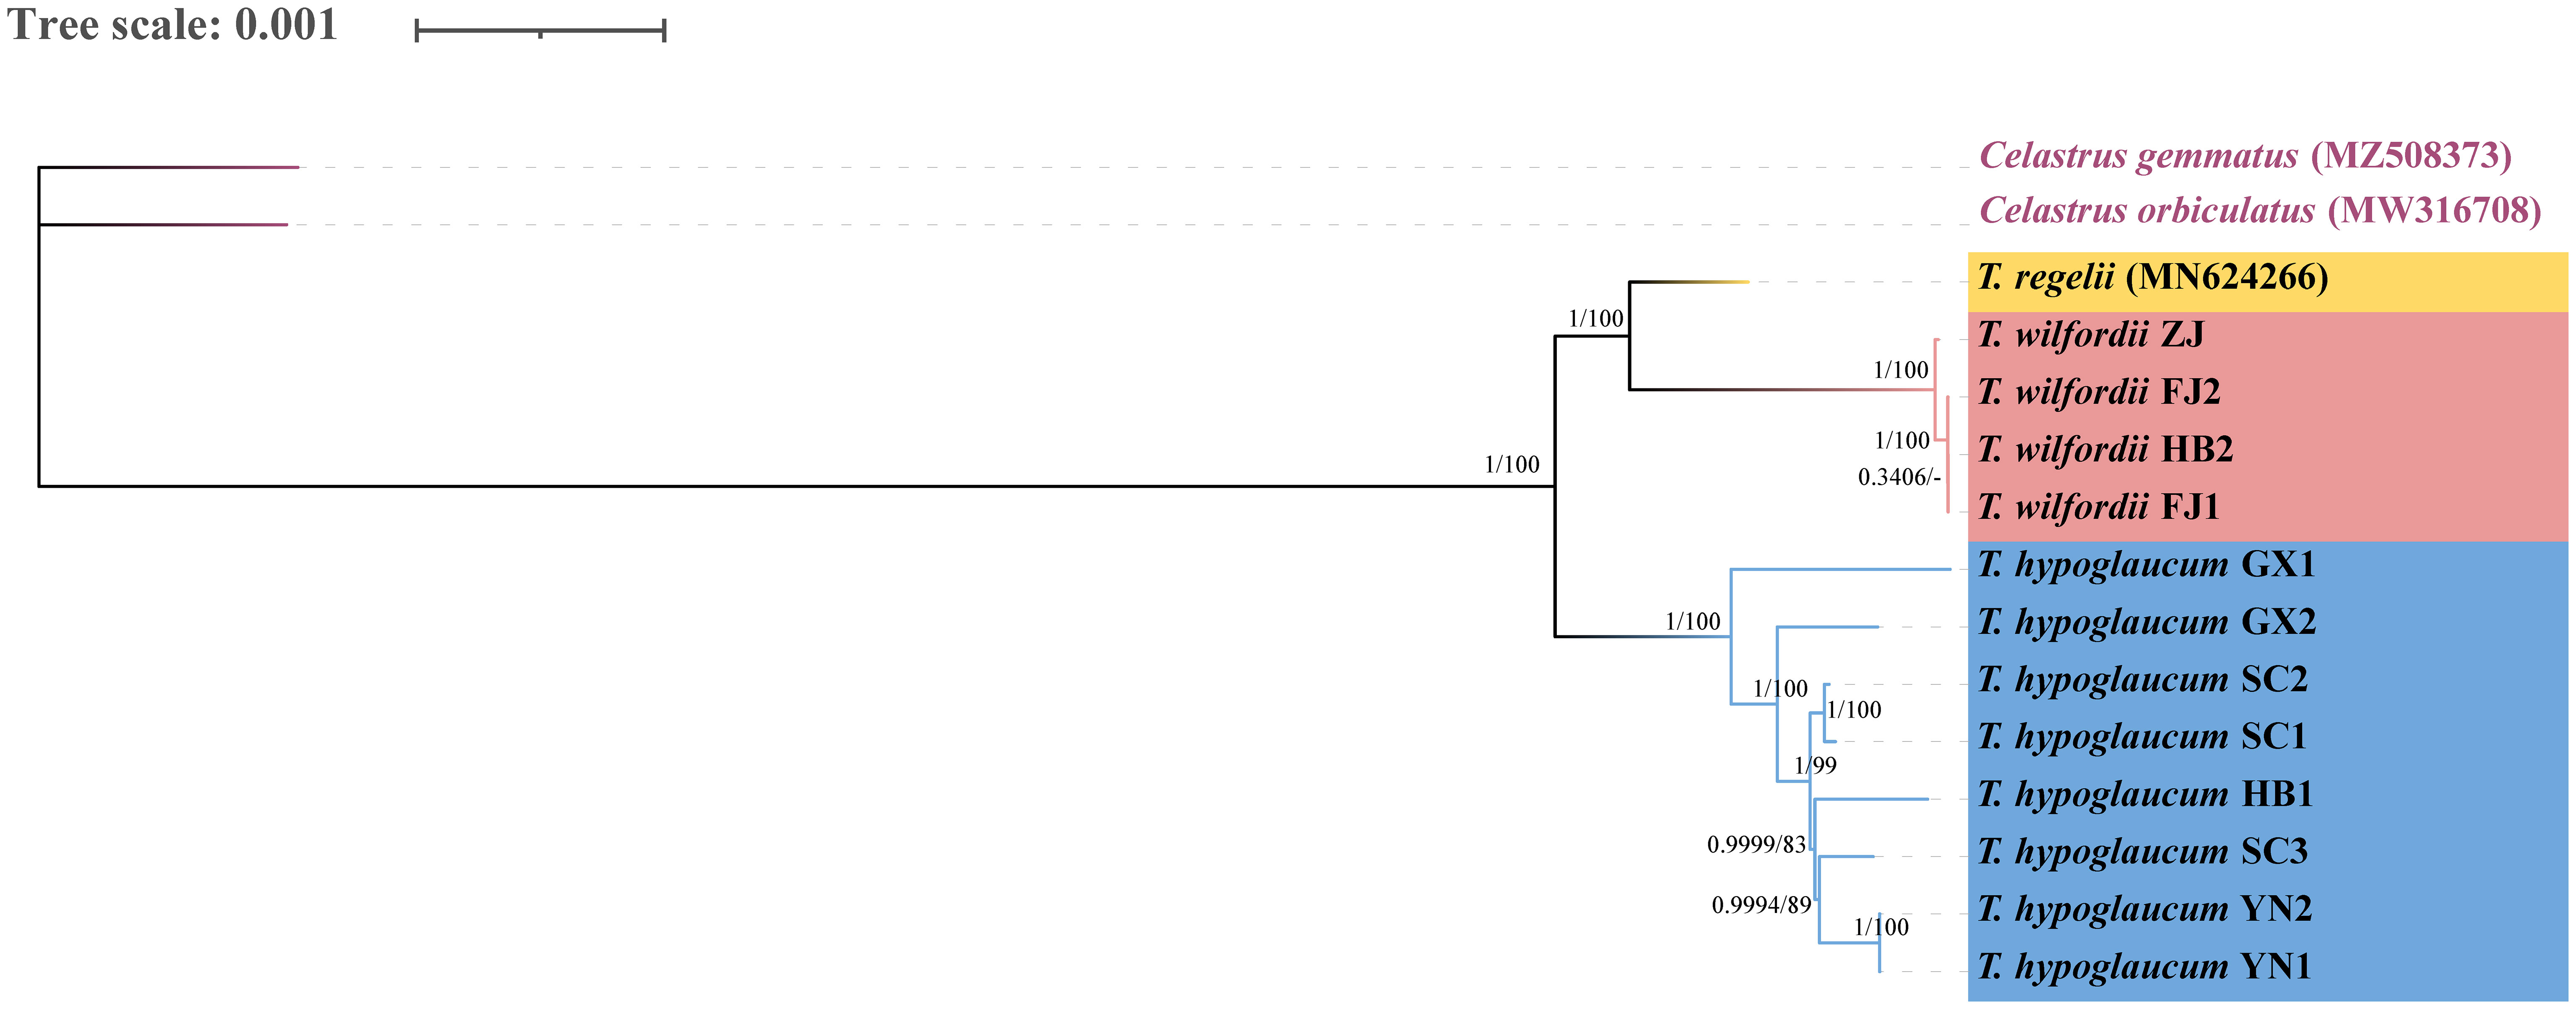
Figure 6 Phylogenetic tree reconstructed based on the complete chloroplast genomes by Bayesian interference (BI) and maximum likelihood (ML). Numbers represent BI posterior probabilities (PP) and ML bootstrap values (BS), respectively.
3.4 Molecular dating
We estimated the divergence time of the genus Tripterygium based on the CDS of protein-coding genes in the complete chloroplast genomes. As the coding sequences (CDSs) extracted from samples YN1 and YN2, as well as FJ1, FJ2, and HB2, were the same, divergence time estimation has not been conducted separately. Finally, the result (Figure 7) showed that the divergence between T. hypoglaucum and the cluster of T. wilfordii and T. regelii was estimated to occur in Miocene (5.99 Ma, 95% HPD = 3.11–8.68 Ma). In addition, the divergence time of T. wilfordii and T. regelii probably originated at 0.17 Ma (in the late Pleistocene, 95% HPD = 0.15–0.24 Ma), later than that of T. hypoglaucum (4.05 Ma, in the Plicocene, 95% HPD = 1.02–6.58 Ma). Interestingly, within T. hypoglaucum, except for the two samples collected from Guangxi province, all others arose at 1.66 Ma (95% HPD = 0.21–5.42 Ma).
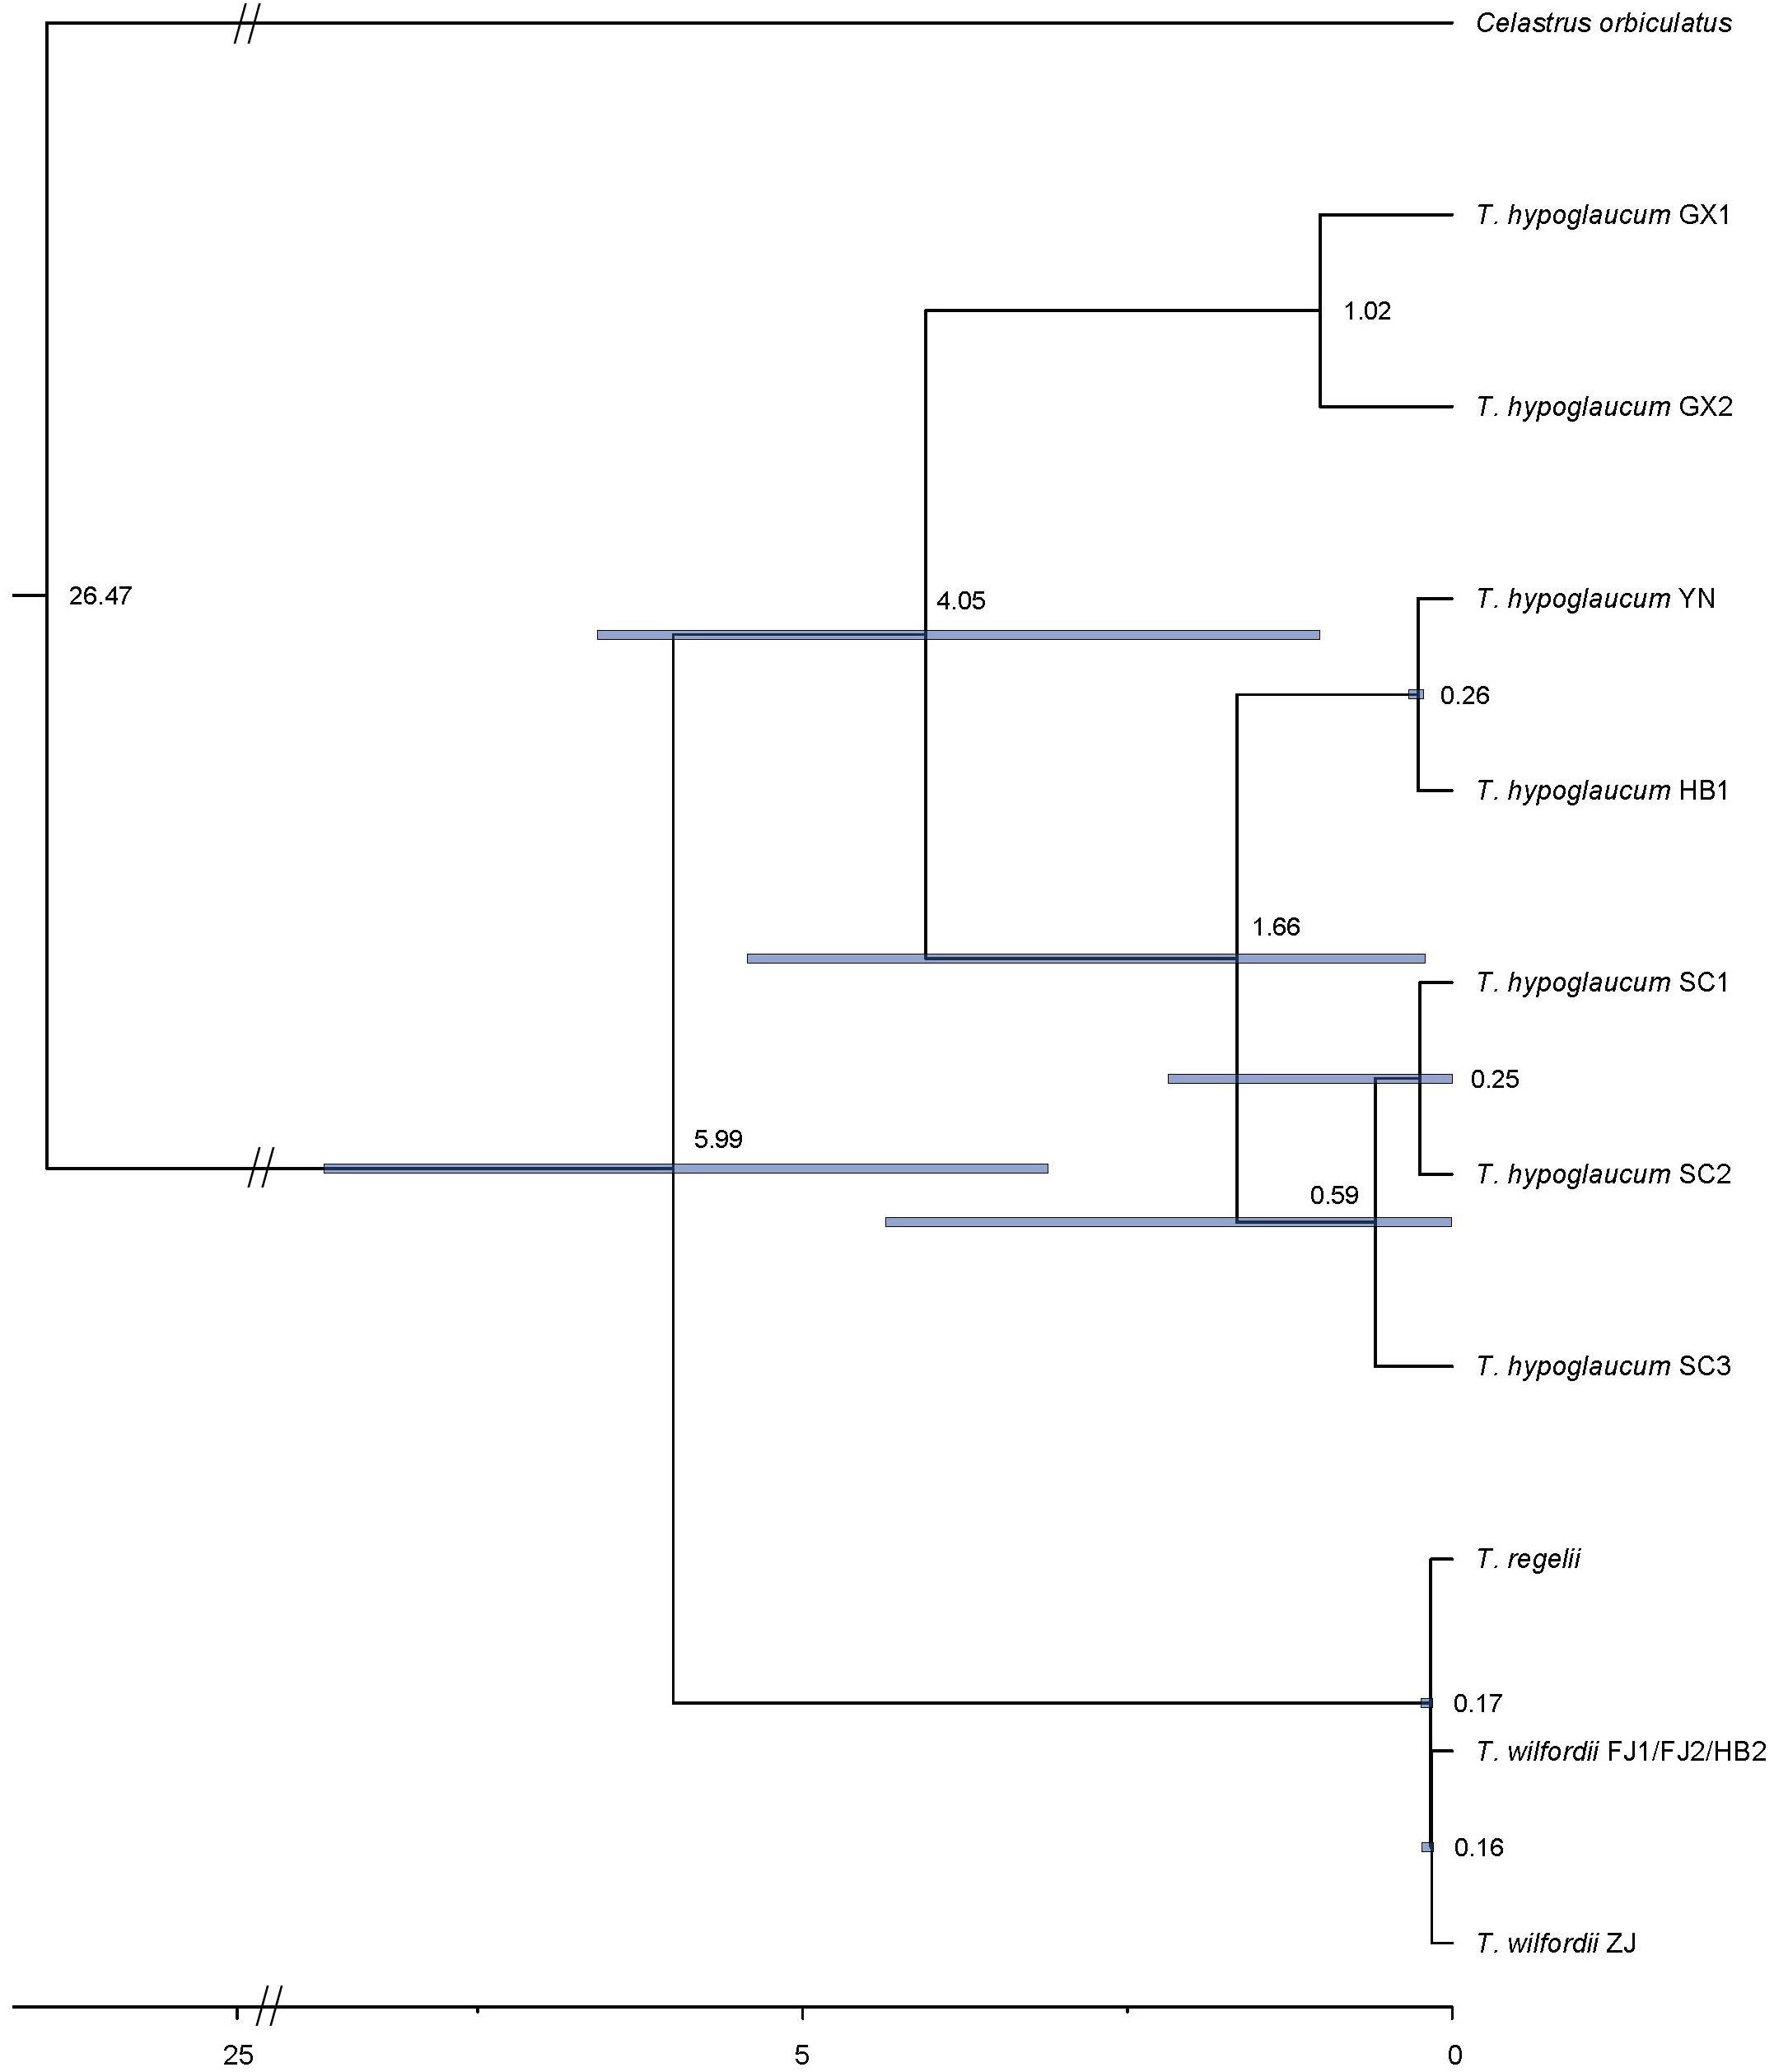
Figure 7 Molecular dating of the genus Tripterygium based on the CDS region in chloroplast genomes.
4 Discussion
The taxonomic studies of the genus Tripterygium have been controversial in recent decades, especially in the distinction between T. wilfordii and T. hypoglaucum. Therefore, we collected T. wilfordii and T. hypoglaucum from several producing regions to study intraspecific and interspecific variation and develop potential DNA barcodes.
4.1 Genomic structural characteristics and the discovery of molecular markers in Tripterygium
According to the structural comparison of the complete chloroplast genome, we found that the sequence length of T. hypoglaucum (156,936–157,061 bp) was longer than that of T. wilfordii (156,692–156,699 bp), and the length of T. regelii (159,144 bp) was longest. The primary reason for the variation in chloroplast genome size was the expansion and contraction of IR regions (Wang et al., 2008). In this study, the IR region of T. hypoglaucum was slightly larger than that of T. wilfordii. It appeared that the interspecific difference in the expansion and contraction of IR regions was not significant. However, we could still observe the presence of some specific features. For example, the length of intervals between the gene ndhF and the IR/SSC boundaries was different between the three species. Two commonalities of Tripterygium were found in the analyses of SSRs. One was that SSRs were primarily distributed in the LSC region, followed by the SSC region, and the least in the IR regions. And most SSRs were identified in the intergenic regions, followed by introns and exons (Supplementary Table S5). The other was that the numbers of AAT/ATT and ACCGG/CCGGT repeats were the same among Tripterygium. And the number of AT/AT repeats was 3 in T. hypoglaucum, 1 in T. wilfordii, and 2 in T. regelii. In addition, 23 palindromic repeats, 10 dispersed repeats, and 6 tandem repeats have been found in all T. wilfordii samples, while a 63-bp repeat existed in all T. hypoglaucum samples. Therefore, the significant differences in the number of repeat elements could be used to develop potential markers to species differentiation in Tripterygium and even to distinguish different sources of T. hypoglaucum.
Moreover, the alignment showed that the length of several intergenic regions varied between T. wilfordii and T. hypoglaucum. And hotspot mutation regions have been studied based on the calculated Pi values. These variable regions were valuable for species identification.
Intraspecific differences were studied as representatives of T. hypoglaucum collected from different provinces. Geographically adjacent samples, such as YN1 and YN2, displayed the same assembled chloroplast genomes. However, significant differences existed in sequences from Sichuan and Guangxi provinces. As Figure 6 showed, GX1 and GX2, both collected from Guilin City, Guangxi Province, were classified into different clades and formed a well-supported. And the AAATT/AATTT repeat was only detected in sample GX2. The same features were found in the samples from Sichuan province, with the characteristic C/G and AATCCT/AGGATT repeats detected in sample SC3. Moreover, the intervals from the gene ndhF to IR/SSC boundary ranged from 28 to 40 bp, and the samples from neighboring Sichuan and Yunan provinces were identical (28 bp).
4.2 Positive selection analysis and divergence time estimation
The evolutionary rate ratio dN/dS, which represents the ratio of nonsynonymous to synonymous substitution rates and was used to identify protein sites that experience purifying selection (dN/dS < 1), evolve neutrally (dN/dS ≈ 1), or positive selection (dN/dS > 1), was the most widely used method to infer selection pressure (Nielsen and Yang, 1998; Spielman and Wilke, 2015). In our present study, the ndhB gene, which was closely related to the land adaptation of photosynthesis (Joeüt et al., 2001; Martín and Sabater, 2010), was identified to undergo positive selection. And the positive selected site in the ndhB gene may play crucial roles in the adaptive evolution of the genus Tripterygium.
Molecular estimates with multiple DNA regions are used for inferring the age of lineages when paleontological data are lacking (Namgung et al., 2021). A previous study (Ma et al., 2017) only used psbA-trnH, rpl32-trnL, and trnL-trnF. However, we estimated the divergence time of Tripterygium using all coding regions of chloroplast genomes, ensuring the accuracy of divergence time estimates. As the result showed, the divergence of Tripterygium was most likely to occur in the late Miocene (5.99 Ma, 95% HPD = 3.11–8.68 Ma), which was consistent with the previous finding (Ma et al., 2017). In addition, T. hypoglaucum arose at approximately 4.05 Ma (95% HPD = 1.02–6.58 Ma), much earlier than T. wilfordii and T. regelii (0.17 Ma, 95% HPD = 0.15–0.24 Ma). It is likely that the Quaternary climatic oscillation could affect the genetic structure and geographical distribution (Ma et al., 2017; Na et al., 2022).
4.3 Conflict in the classification of Tripterygium
The distribution range of Tripterygium was very wide, ranging from the western Hengduan Mountains in southwestern China to the east. The uplift of Qinghai-Tibet Plateau (QTP) and the establishment of Asian monsoon climatic cycle have led to the diversity of species in the Hengduan Mountains (Ding et al., 2020). According to the previous phylogenetic tree (Ma et al., 2017) reconstructed by the combination of ITS2, psbA-trnH, matK, and rbcL, there was only one sample of T. hypoglaucum, collected from Kunming, Yunnan Province, clustered with T. wilfordii into a clade (PP = 0.517). Meanwhile, in another NJ tree (Zhang et al., 2016) based on the ITS2 and psbA-trnH, only one sample of T. hypoglaucum collected from Wugang, Hunan Province, clustered with other samples of T. wilfordii. However, our ML and BI analyses based on the complete chloroplast genomes consistently supported that T. wilfordii could be separated from T. hypoglaucum (BS/PP = 100/1). In addition, as the sample size of T. regelii was limited, it was hard to determine the sister relationship between T. wilfordii and T. regelii. The convergent sequence evolution and incomplete lineage sorting may lead to this divergence (Rokas et al., 2003).
In addition, we also considered whether the distribution of Tripterygium was affected by altitude, as the samples of T. wilfordii we collected were all from low-altitude areas (< 500 m). Therefore, more samples and nuclear genes as well as more robust phylogenetic methods and morphological and geographic evidence should be applied to resolve the taxonomic controversy of Tripterygium in further research.
5 Conclusion
In this study, we assembled 12 chloroplast genomes of Tripterygium and presented the comparison to reveal the interspecific difference and intraspecific variation. The characteristics of IR boundary and repeat elements used for species differentiation were proposed. And variable regions were detected by the analyses of multiple alignment and Pi calculation. One site with positive selection in the ndhB gene was found by adaptive evolution analysis of Tripterygium. And the molecular dating analysis suggested that the split within Tripterygium may be traced back to the late Miocene (5.99 Ma, 95% HPD = 3.11–8.68 Ma). Phylogenetic analyses supported that T. wilfordii and T. hypoglaucum were two distinct species with a high support and resolution, laying the foundation on the further study of controversial taxonomy and evolution process.
Data availability statement
The data presented in the study are deposited in the GenBank repository, accession number OR426549-52 and OR426554-60.
Author contributions
K-LX: Writing – original draft. Z-MZ: Writing – review & editing. W-LF: Writing – review & editing. Y-DW: Writing – review & editing. H-YJ: Writing – review & editing. FW: Writing – review & editing. S-CM: Writing – review & editing, Supervision.
Funding
The author(s) declare financial support was received for the research, authorship, and/or publication of this article. This work was funded by NIFDC Fund for Key Technology Research (1020572284489).
Conflict of interest
The authors declare that the research was conducted in the absence of any commercial or financial relationships that could be construed as a potential conflict of interest.
Publisher’s note
All claims expressed in this article are solely those of the authors and do not necessarily represent those of their affiliated organizations, or those of the publisher, the editors and the reviewers. Any product that may be evaluated in this article, or claim that may be made by its manufacturer, is not guaranteed or endorsed by the publisher.
Supplementary material
The Supplementary Material for this article can be found online at: https://www.frontiersin.org/articles/10.3389/fpls.2023.1288943/full#supplementary-material
References
Bankevich, A., Nurk, S., Antipov, D., Gurevich, A. A., Dvorkin, M., Kulikov, A. S., et al. (2012). SPAdes: a new genome assembly algorithm and its applications to single-cell sequencing. J. Comput. Biol. 19, 455–477. doi: 10.1089/cmb.2012.0021
Benson, G. (1999). Tandem repeats finder: a program to analyze DNA sequences. Nucleic Acids Res. 27, 573–580. doi: 10.1093/nar/27.2.573
Brinker, A. M., Ma, J., Lipsky, P. E., Raskin, I. (2007). Medicinal chemistry and pharmacology of genus Tripterygium (Celastraceae). Phytochemistry 68, 732–766. doi: 10.1016/j.phytochem.2006.11.029
Capella-Gutiérrez, S., Silla-Martínez, J. M., Gabaldón, T. (2009). trimAl: a tool for automated alignment trimming in large-scale phylogenetic analyses. Bioinformatics 25, 1972–1973. doi: 10.1093/bioinformatics/btp348
Chen, S. F., Zhou, Y. Q., Chen, Y. R., Gu, J. (2018). fastp: an ultra-fast all-in-one FASTQ preprocessor. Bioinformatics 34, i884–i890. doi: 10.1093/bioinformatics/bty560
Chen, Y. L., Liu, X., Qu, X. Y., Yao, Y. Y., Li, N., Liang, X. M., et al. (2017). Studies on difference of chemical compositions in plant species of Tripterygium genus. China J. Chin. Mater. Med. 42, 319–325. doi: 10.19540/j.cnki.cjcmm.20161222.011
Darling, A. E., Mau, B., Perna, N. T. (2010). progressiveMauve: multiple genome alignment with gene gain, loss and rearrangement. PloS One 5, e11147. doi: 10.1371/journal.pone.0011147
Ding, W. N., Ree, R. H., Spicer, R. A., Xing, Y. W. (2020). Ancient orogenic and monsoon-driven assembly of the world’s richest temperate alpine flora. Science 369, 578–581. doi: 10.1126/science.abb4484
Drummond, A. J., Suchard, M. A., Xie, D., Rambaut, A. (2012). Bayesian phylogenetics with BEAUti and the BEAST 1.7. Mol. Biol. Evol. 29, 1969–1973. doi: 10.1093/molbev/mss075
Fan, W. B., Wu, Y., Yang, J., Shahzad, K., Li, Z. H. (2018). Comparative chloroplast genomics of dipsacales species: insights into sequence variation, adaptive evolution, and phylogenetic relationships. Front. Plant Sci. 9. doi: 10.3389/fpls.2018.00689
Frazer, K. A., Pachter, L., Poliakov, A., Rubin, E. M., Dubchak, I. (2001). VISTA: computational tools for comparative genomics. Nucleic Acids Res. 32, W273–W279. doi: 10.1093/nar/gkh458
Ge, Y., Xie, H., Li, S., Jin, B., Hou, J., Zhang, H., et al. (2013). Treatment of diabetic nephropathy with Tripterygium wilfordii Hook F extract: a prospective, randomized, controlled clinical trial. J. Transl. Med. 31, 134. doi: 10.1186/1479-5876-11-134
Guo, L., Duan, L., Liu, K., Liu, E. H., Li, P. (2014). Chemical comparison of Tripterygium wilfordii and Tripterygium hypoglaucum based on quantitative analysis and chemometrics methods. J. Pharm. Biomed. Anal. 95, 220–228. doi: 10.1016/j.jpba.2014.03.009
Guo, M., Pang, X., Xu, Y., Jiang, W., Liao, B., Yu, J., et al. (2022). Plastid genome data provide new insights into the phylogeny and evolution of the genus Epimedium. J. Adv. Res. 36, 175–185. doi: 10.1016/j.jare.2021.06.020
Joeüt, T., Cournac, L., Horvath, E. M., Medgyesy, P., Peltier, G. (2001). Increased sensitivity of photosynthesis to antimycin a induced by inactivation of the chloroplast NDHB gene. Evidence for a participation of the NADH-dehydrogenase complex to cyclic electron flow around photosystem I1. Plant Physiol. 125, 1919–1929. doi: 10.1104/pp.125.4.1919
Kalyaanamoorthy, S., Minh, B. Q., Wong, T. K. F., von Haeseler, A., Jermiin, L. S. (2017). ModelFinder: fast model selection for accurate phylogenetic estimates. Nat. Methods 14, 587–589. doi: 10.1038/nmeth.4285
Katoh, K., Standley, D. M. (2013). MAFFT multiple sequence alignment software version 7: improvements in performance and usability. Mol. Biol. Evol. 30, 772–780. doi: 10.1093/molbev/mst010
Kurtz, S., Choudhuri, J. V., Ohlebusch, E., Schleiermacher, C., Stoye, J., Giegerich, R. (2001). REPuter: the manifold applications of repeat analysis on a genomic scale. Nucleic Acids Res. 29, 4633–4642. doi: 10.1093/nar/29.22.4633
Kurtz, S., Phillippy, A., Delcher, A. L., Smoot, M., Shumway, M., Antonescu, C., et al. (2004). Versatile and open software for comparing large genomes. Genome Biol. 5, R12. doi: 10.1186/gb-2004-5-2-r12
Law, S. K., Simmons, M. P., Techen, N., Khan, I. A., He, M. F., Shaw, P. C., et al. (2011). Molecular analyses of the Chinese herb Leigongteng (Tripterygium wilfordii Hook.f.). Phytochemistry 72, 21–26. doi: 10.1016/j.phytochem.2010.10.015
Letunic, I., Bork, P. (2021). Interactive Tree Of Life (iTOL) v5: an online tool for phylogenetic tree display and annotation. Nucleic Acids Res. 49, W293–W296. doi: 10.1093/nar/gkab301
Li, H., Guo, Q., Xu, L., Gao, H., Liu, L., Zhou, X. (2023). CPJSdraw: analysis and visualization of junction sites of chloroplast genomes. PeerJ 11, e15326. doi: 10.7717/peerj.15326
Liu, W. S., Guo, B. L., Huang, W. H., Si, J. P. (2007). RAPD analysis for genetic relationship and diversity of three species of genus Tripterygium. China J. Chin. Mater. Med. 32, 1615–1621. doi: 10.3321/j.issn:1001-5302.2007.16.002
Lv, H., Jiang, L., Zhu, M., Li, Y., Luo, M., Jiang, P., et al. (2019). The genus Tripterygium: A phytochemistry and pharmacological review. Fitoterapia 137, 104190. doi: 10.1016/j.fitote.2019.104190
Ma, B., Hu, T., Li, P., Yuan, Q., Lin, Z., Tu, Y., et al. (2017). Phylogeographic and phylogenetic analysis for Tripterygium species delimitation. Ecol. Evol. 7, 8612–8623. doi: 10.1002/ece3.3344
Martín, M., Sabater, B. (2010). Plastid ndh genes in plant evolution. Plant Physiol. Biochem. 48, 636–645. doi: 10.1016/j.plaphy.2010.04.009
Na, L., Wang, D., Chen, Y. L., Yao, Y. Y., Zhang, X. M., Li, S. R. (2022). Phylogeography of Tripterygium inferred based on ITS2 DNA sequence variation. Zhong Cao Yao 53, 5476–5483. doi: 10.7501/j.issn.0253-2670.2022.17.024
Namgung, J., Do, H. D. K., Kim, C., Choi, H. J., Kim, J. H. (2021). Complete chloroplast genomes shed light on phylogenetic relationships, divergence time, and biogeography of Allioideae (Amaryllidaceae). Sci. Rep. 11, 3262. doi: 10.1038/s41598-021-82692-5
Nguyen, L. T., Schmidt, H. A., von Haeseler, A., Minh, B. Q. (2015). IQ-TREE: a fast and effective stochastic algorithm for estimating maximum-likelihood phylogenies. Mol. Biol. Evol. 32, 268–274. doi: 10.1093/molbev/msu300
Nielsen, R., Yang, Z. (1998). Likelihood models for detecting positively selected amino acid sites and applications to the HIV-1 envelope gene. Genetics 148, 929–936. doi: 10.1093/genetics/148.3.929
Palmer, J. D. (1985). Comparative organization of chloroplast genomes. Annu. Rev. Genet. 19, 325–354. doi: 10.1146/annurev.ge.19.120185.001545
Rambaut, A., Drummond, A. J., Xie, D., Baele, G., Suchard, M. A. (2018). Posterior summarization in Bayesian phylogenetics using Tracer 1.7. Syst. Biol. 67, 901–904. doi: 10.1093/sysbio/syy032
Rokas, A., Williams, B. L., King, N., Carroll, S. B. (2003). Genome-scale approaches to resolving incongruence in molecular phylogenies. Nature 425, 798–804. doi: 10.1038/nature02053
Ronquist, F., Teslenko, M., van der Mark, P., Ayres, D. L., Darling, A., Höhna, S., et al. (2012). MrBayes 3.2: efficient Bayesian phylogenetic inference and model choice across a large model space. Syst. Biol. 61, 539–542. doi: 10.1093/sysbio/sys029
Rozas, J., Ferrer-Mata, A., Sánchez-DelBarrio, J. C., Guirao-Rico, S., Librado, P., Ramos-Onsins, S. E., et al. (2017). DnaSP 6: DNA sequence polymorphism analysis of large data sets. Mol. Biol. Evol. 34, 3299–3302. doi: 10.1093/molbev/msx248
Shi, L., Chen, H., Jiang, M., Wang, L., Wu, X., Huang, L., et al. (2019). CPGAVAS2, an integrated plastome sequence annotator and analyzer. Nucleic Acids Res. 47, W65–W73. doi: 10.1093/nar/gkz345
Spielman, S. J., Wilke, C. O. (2015). The relationship between dN/dS and scaled selection coefficients. Mol. Biol. Evol. 32, 1097–1108. doi: 10.1093/molbev/msv003
Tao, X., Davis, L. S., Lipsky, P. E. (1991). Effect of an extract of the Chinese herbal remedy Tripterygium wilfordii Hook F on human immune responsiveness. Arthritis Rheumatol. 34, 1274–1281. doi: 10.1002/art.1780341011
Thiel, T., Michalek, W., Varshney, R., Graner, A. (2003). Exploiting EST databases for the development and characterization of gene-derived SSR-markers in barley (Hordeum vulgare L.). Theor. Appl. Genet. 106, 411–422. doi: 10.1007/s00122-002-1031-0
Tong, L., Zhao, Q., Datan, E., Lin, G. Q., Minn, I., Pomper, M. G., et al. (2021). Triptolide: reflections on two decades of research and prospects for the future. Nat. Prod. Rep. 38, 843–860. doi: 10.1039/d0np00054j
Wang, R. J., Cheng, C. L., Chang, C. C., Wu, C. L., Su, T. M., Chaw, S. M. (2008). Dynamics and evolution of the inverted repeat-large single copy junctions in the chloroplast genomes of monocots. BMC Evol. Biol. 8, 36. doi: 10.1186/1471-2148-8-36
Wang, Q., Meng, J., Dong, A., Yu, J. Z., Zhang, G. X., Ma, C. G. (2016). The genus Tripterygium: A phytochemistry and pharmacological review. J. Altern. Complement Med. 22, 496–502. doi: 10.1089/acm.2016.0004
Xiong, A. S., Peng, R. H., Zhuang, J., Gao, F., Zhu, B., Fu, X. Y., et al. (2009). Gene duplication, transfer, and evolution in the chloroplast genome. Biotechnol. Adv. 27, 340–347. doi: 10.1016/j.bioteChadv.2009.01.012
Xu, X. M., Wei, Z., Sun, J. Z., Zhao, Q. F., Lu, Y., Wang, Z. L., et al. (2023). Phylogeny of Leontopodium (Asteraceae) in China—with a reference to plastid genome and nuclear ribosomal DNA. Front. Plant Sci. 14. doi: 10.3389/fpls.2023.1163065
Yan, L., Wang, H., Huang, X., Li, Y., Yue, Y., Wang, Z., et al. (2022). Chloroplast genomes of genus Tilia: comparative genomics and molecular evolution. Front. Genet. 13. doi: 10.3389/fgene.2022.925726
Yang, Z. (2007). PAML 4: phylogenetic analysis by maximum likelihood. Mol. Biol. Evol. 24, 1586–1591. doi: 10.1093/molbev/msm088
Zhang, X. M., Li, N., Yao, Y. Y., Liang, X. M., Qu, X. Y., Liu, X., et al. (2016). Identification of species in Tripterygium (Celastraceae) based on DNA barcoding. Biol. Pharm. Bull. 39, 1760–1766. doi: 10.1248/bpb.b15-00956
Keywords: Tripterygium wilfordii, Tripterygium hypoglaucum, chloroplast genome, genome structure, phylogenetic analysis, hypervariable regions
Citation: Xu K-L, Zhang Z-M, Fang W-L, Wang Y-D, Jin H-Y, Wei F and Ma S-C (2024) Comparative analyses of complete chloroplast genomes reveal interspecific difference and intraspecific variation of Tripterygium genus. Front. Plant Sci. 14:1288943. doi: 10.3389/fpls.2023.1288943
Received: 05 September 2023; Accepted: 14 December 2023;
Published: 09 January 2024.
Edited by:
Manjusha Verma, National Bureau of Plant Genetic Resources (ICAR), IndiaReviewed by:
Khurram Shahzad, Chinese Academy of Sciences (CAS), ChinaIbrar Ahmed, Alpha Genomics Private Limited, Pakistan
Copyright © 2024 Xu, Zhang, Fang, Wang, Jin, Wei and Ma. This is an open-access article distributed under the terms of the Creative Commons Attribution License (CC BY). The use, distribution or reproduction in other forums is permitted, provided the original author(s) and the copyright owner(s) are credited and that the original publication in this journal is cited, in accordance with accepted academic practice. No use, distribution or reproduction is permitted which does not comply with these terms.
*Correspondence: Shuang-Cheng Ma, bWFzY0BuaWZkYy5vcmcuY24=; Feng Wei, d2VpZmVuZ0BuaWZkYy5vcmcuY24=; Hong-Yu Jin, amh5dUBuaWZkYy5vcmcuY24=; Ya-Dan Wang, eS5kd2FuZ0AxNjMuY29t
†These authors have contributed equally to this work and share first authorship