 Cassidy R. Million1,2†Saranga Wijeratne3†
 Stephanie Karhoff2,4†
 Bryan J. Cassone2,5
 Leah K. McHale2,6*‡
 Anne E. Dorrance1,2*‡
- 1Department of Plant Pathology, The Ohio State University, Wooster, OH, United States
- 2Center for Soybean Research and Center for Applied Plant Sciences, The Ohio State University, Columbus, OH, United States
- 3Molecular and Cellular Imaging Center, The Ohio State University, Wooster, OH, United States
- 4Translational Plant Sciences Graduate Program, The Ohio State University, Columbus, OH, United States
- 5Department of Biology, Brandon University, Brandon, Manitoba, MB, Canada
- 6Department of Horticulture and Crop Science, The Ohio State University, Columbus, OH, United States
Expression of quantitative disease resistance in many host–pathogen systems is controlled by genes at multiple loci, each contributing a small effect to the overall response. We used a systems genomics approach to study the molecular underpinnings of quantitative disease resistance in the soybean-Phytophthora sojae pathosystem, incorporating expression quantitative trait loci (eQTL) mapping and gene co-expression network analysis to identify the genes putatively regulating transcriptional changes in response to inoculation. These findings were compared to previously mapped phenotypic (phQTL) to identify the molecular mechanisms contributing to the expression of this resistance. A subset of 93 recombinant inbred lines (RILs) from a Conrad × Sloan population were inoculated with P. sojae isolate 1.S.1.1 using the tray-test method; RNA was extracted, sequenced, and the normalized read counts were genetically mapped from tissue collected at the inoculation site 24 h after inoculation from both mock and inoculated samples. In total, more than 100,000 eQTLs were mapped. There was a switch from predominantly cis-eQTLs in the mock treatment to an almost entirely nonoverlapping set of predominantly trans-eQTLs in the inoculated treatment, where greater than 100-fold more eQTLs were mapped relative to mock, indicating vast transcriptional reprogramming due to P. sojae infection occurred. The eQTLs were organized into 36 hotspots, with the four largest hotspots from the inoculated treatment corresponding to more than 70% of the eQTLs, each enriched for genes within plant–pathogen interaction pathways. Genetic regulation of trans-eQTLs in response to the pathogen was predicted to occur through transcription factors and signaling molecules involved in plant–pathogen interactions, plant hormone signal transduction, and MAPK pathways. Network analysis identified three co-expression modules that were correlated with susceptibility to P. sojae and associated with three eQTL hotspots. Among the eQTLs co-localized with phQTLs, two cis-eQTLs with putative functions in the regulation of root architecture or jasmonic acid, as well as the putative master regulators of an eQTL hotspot nearby a phQTL, represent candidates potentially underpinning the molecular control of these phQTLs for resistance.
1 Introduction
Quantitative disease resistance (QDR) is a type of host resistance that generally involves multiple loci acting additively, each with a small to moderate overall effect on limiting disease development (Young, 1996; Poland et al., 2009; St. Clair, 2010; Roux et al., 2014; Niks et al., 2015; French et al., 2016; Corwin and Kliebenstein, 2017; Nelson et al., 2018). Numerous phenotypic quantitative trait loci (phQTL) (Jansen et al., 2009; Acharjee et al., 2018) for disease resistance have been mapped in soybean (Lin et al., 2022) to biotrophic pathogens, such as soybean cyst nematode (SCN: Heterodera glycine) (Wu et al., 2009) and powdery mildew (Microsphaera diffusa) (Jun et al., 2012); hemibiotrophic pathogens Phytophthora sojae (Burnham et al., 2003; Weng et al., 2007; Han et al., 2008; Li et al., 2010; Tucker et al., 2010; Wang et al., 2010; Wu et al., 2011; Nguyen et al., 2012; Wang et al., 2012b; Lee et al., 2013a; Lee et al., 2013b; Lee et al., 2014; Abeysekara et al., 2016; Stasko et al., 2016) and Phialophora gregata (Rincker et al., 2016); and necrotrophic pathogens Sclerotinia sclerotiorum (Kim and Diers, 2000; Arahana et al., 2001; Guo et al., 2008; Vuong et al., 2008; Zhao et al., 2015). However, the causal genes for QDR have only been identified and verified in the SCN soybean pathosystem through genetic mapping, gene silencing, and complementation experiments (Cook et al., 2012; Cook et al., 2014; Bayless et al., 2018). Impediments to the discovery of causal genes for QDR are often attributed to the intricate biology of plant-pathogen interactions (Zhou et al., 2009; Corwin et al., 2016; Corwin and Kliebenstein, 2017; Nelson et al., 2018). Additionally, the methods to functionally evaluate candidate genes underlying specific phQTLs are difficult, as each phQTL has a relatively small effect on the final phenotype, and modification of a single gene often yields inconclusive results (Salvi and Tuberosa, 2005; Poland et al., 2009; Corwin and Kliebenstein, 2017). Receptor-like kinases (RLKs) and nucleotide-binding leucine-rich repeat proteins (NLRs) are recognized as canonical resistance proteins (Niks et al., 2015; French et al., 2016; Pilet-Nayel et al., 2017); however, these proteins, which commonly function in qualitative or R-gene-mediated defense, only account for a small portion of genes involved in QDR to date (Poland et al., 2009; Corwin et al., 2016; Nelson et al., 2018). QDR has been hypothesized to be controlled by proteins with a wide range of functions, and that has, thus far, been born out through functional studies (Poland et al., 2009; St. Clair, 2010; Roux et al., 2014; Niks et al., 2015; French et al., 2016; Corwin and Kliebenstein, 2017). For example, genes with functions more commonly associated with plant development, cell wall reinforcement, RNA processing, and defense compounds were associated with QDR (Poland et al., 2009; Corwin et al., 2016; Corwin and Kliebenstein, 2017; Nelson et al., 2018). This functional diversity of genes involved in QDR makes it difficult to predict causal candidate genes based solely on homology-predicted functions and gene positions relative to phQTL.
Due to the adaptation of P. sojae populations to R-gene-mediated resistance in soybean, QDR is preferred in some growing regions to manage Phytophthora root and stem rot (PRR) (Grau et al., 2004; Dorrance et al., 2009; Schmitthenner, 1985). In this plant-pathogen system, QDR is a partial resistance that allows for some pathogen growth and reproduction and generally consists of several loci, each contributing a minor effect or one major effect locus combined with several minor effect loci (Tooley and Grau, 1982; Mideros et al., 2007; Weng et al., 2007; Han et al., 2008; Li et al., 2010; Tucker et al., 2010; Wu et al., 2011; Nguyen et al., 2012; Wang et al., 2012a; Wang et al., 2012b; Lee et al., 2013a; Lee et al., 2013b; Lee et al., 2014; Abeysekara et al., 2016; Stasko et al., 2016; Scott et al., 2019; de Ronne et al., 2022). Nine different parental combinations have produced numerous phQTLs contributing towards P. sojae quantitative resistance in soybean (Burnham et al., 2003; Weng et al., 2007; Han et al., 2008; Li et al., 2010; Tucker et al., 2010; Wang et al., 2010; Wu et al., 2011; Nguyen et al., 2012; Wang et al., 2012a; Wang et al., 2012b; Lee et al., 2013a; Lee et al., 2013b; Lee et al., 2014; Abeysekara et al., 2016; Stasko et al., 2016). Of these, 60 phQTLs, most of small effect, were mapped in multiple generations of a ‘Conrad’ × ‘Sloan’ recombinant inbred line (RIL) population using different field, greenhouse, and lab screening methodologies to collect the phenotypic data (Burnham et al., 2003; Weng et al., 2007; Han et al., 2008; Li et al., 2010; Wang et al., 2010; Wu et al., 2011; Wang et al., 2012b; Stasko et al., 2016). Each of these phQTLs encompasses large regions of the chromosome, which contain many genes (Wang et al., 2012b; Stasko et al., 2016), making it difficult to identify the causal genes based on position alone.
Few studies have examined the physiological and molecular mechanisms of quantitative resistance in soybean to P. sojae; however, all have concluded that this is a complex trait. Although only a few mechanisms for QDR have been substantiated in plant systems (Nelson et al., 2018), numerous hypotheses have been developed for resistance to P. sojae in soybeans from several previous studies. These hypotheses include plant hormone signal transduction, including auxin acting as a susceptibility factor (Wang et al., 2010; Wang et al., 2012b; Stasko et al., 2020); suberin playing a role in slowing P. sojae hyphal infection in epidermal walls and middle lamellae (Thomas et al., 2007; Ranathunge et al., 2008); and the phenylpropanoid pathway acting as a positive regulator of P. sojae infection by increased content of glyceollin, daidzein, genistein, and salicylic acid (SA) (Abbasi et al., 2001; Mohr and Cahill, 2001; Graham et al., 2003; Lygin et al., 2013; Zhang et al., 2017). Components of the isoflavonoid pathway have been implicated in acting as antioxidants to reduce reactive oxygen species (ROS) and enhance QDR to P. sojae (Xu et al., 2012; Wong et al., 2014; Cheng et al., 2015; Dastmalchi et al., 2017). QDR in P. sojae has also been associated with increased expression of genes coding for pathogenesis-related 1a protein (PR1a), matrix metalloproteinases, basic peroxidases, and β-1,3-endoglucanases (Vega-Sánchez et al., 2005), as well as ubiquitination, plant cell structural modifications, serine-threonine kinase, and basal resistance (Wang et al., 2012b; Karhoff et al., 2022). Recently, a gene annotated as a major latex protein expressed in the roots and associated with biotic stress was implicated in QDR (de Ronne et al., 2022). In addition to these pathways, there are other well-documented pathways involved in plant defense against pathogens, including mitogen-activated protein kinase (MAPK) cascades and plant-pathogen interaction pathways (e.g., pathogen-associated molecular patterns (PAMP) and effector-triggered immunity (ETI) pathways), which may also play a role in QDR (Ausubel, 2005; Glazebrook, 2005; Chisholm et al., 2006; Jones and Dangl, 2006; Boller and Felix, 2009; Dodds and Rathjen, 2010; Gassmann and Bhattacharjee, 2012; Spoel and Dong, 2012; Zipfel, 2014; Cui et al., 2015; Nelson et al., 2018). Taken together, these reports emphasize the complexity of QDR mechanisms and responses to infection. Zhou et al. (2009) showed that by 5 days postinoculation with P. sojae, from tissue collected in front of the advancing lesion, 97% of the genes in the soybean genome responded to infection or genetic variation based on microarray data. Amid this genome-wide transcriptional reprogramming, it is difficult to identify the specific causal mechanisms, pathways, and putative candidate genes. Thus, a more robust approach is needed to elucidate the molecular mechanisms underlying QDR.
Numerous studies in plant-pathogen interactions have utilized a systems genomics approach to identify the molecular mechanisms that are controlled by a complex of genes, pathways, and networks contributing to the overall expression of a phenotype (Jansen and Nap, 2001; Kliebenstein, 2009; Druka et al., 2010; Feltus, 2014). This approach maps both phQTLs and expression (eQTLs) and combines these data with a gene network analysis to identify the specific alleles that control or contribute to the overall expression of resistance during a plant–pathogen interaction (Kliebenstein, 2009; Druka et al., 2010; Feltus, 2014). Using this approach, advancements were made towards understanding the mechanisms of QDR resistance in barley (Hordeum vulgare L.) to Puccinia hordei (Druka et al., 2008; Chen et al., 2010) and in maize (Zea mays L.) to Cercospora zeina (Christie et al., 2017). In the barley-Puccinia hordei system, the total number of candidate genes underlying phQTLs was reduced at four different loci, with the identification of a histidine kinase as a novel resistance gene at one locus (Druka et al., 2008). In a later study, the total number of candidate genes for QDR to Puccinia hordei was reduced to six candidates for barley Rphq11 (Chen et al., 2010). Co-expression of coronatine-insensitive 1 (COI1) and jasmonate responses in maize were correlated with resistance to C. zeina, while pathogen manipulation of the host plant through the diterpenoid biosynthesis pathway was associated with susceptibility (Christie et al., 2017).
Due to the nature of the P. sojae-soybean pathosystem response, in which a small proportion of the total phenotype is contributed by each locus and a large number of loci encompassing numerous genes respond to P. sojae infection, we have taken a systems genomics approach to elucidate the molecular mechanisms of QDR in soybean toward P. sojae. In this study, we aimed to (1) understand the transcriptional reprogramming that occurs earlier in the infection process during the transition from biotrophic to necrotrophic between the well-studied soybean cultivars, Conrad, which has high levels of QDR, and Sloan, which is moderately susceptible; (2) map the genetic control of the differential transcriptional response to inoculation with P. sojae; (3) identify functional enrichment of genes within eQTL hotspots and co-expression modules associated with disease; and (4) identify candidate genes. The emphasis in this study is placed on identifying factors that elicit expression of quantitative resistance and not those expressed during the R-gene (Rps gene) response, which have also been recently studied using a transcriptomic approach (Lin et al., 2014; Hale et al., 2023a).
Three types of analyses were used, including phQTL mapping, eQTL mapping, and weighted gene co-expression analysis (WGCNA). The integration of the three analyses allowed for a greater understanding of the relationships between gene expression and the resulting disease phenotypes. Ultimately, using the expression data of 93 RILs during the early stages of the infection process [24 hours after inoculation (hai)] as the switch from biotrophy to necrotrophy is occurring (Moy et al., 2004), we were able to map more than 100,000 eQTLs, identifying co-regulated gene modules associated with disease and five putative candidate genes for three phQTLs. Putative master regulators were identified for 16 key eQTL hotspots. This study is the first to our knowledge to elucidate the specific candidate genes that may regulate the extensive changes that occur during transcriptional reprogramming due to pathogen infection by utilizing eQTL mapping in inoculated and non-inoculated tissues within the same population.
2 Materials and methods
2.1 Phenotyping and RNA extraction
A subset of 93 F9:11 RILs from the full population of 316 RILs derived from a cross between the cultivars Conrad (resistant) and Sloan (susceptible) were selected randomly for the eQTL study. The parents and RILs were inoculated with P. sojae 1.S.1.1 as previously described (Wang et al., 2012b). Briefly, the roots of 7-day-old plants that were grown for one week in 29.5-ml Styrofoam cups containing vermiculite (Perlite Vermiculite Packing Industries, Inc., North Bloomfield, OH, USA) were washed in tap water. Seedlings were placed on a plastic tray on top of a cotton wicking pad and a polyester cloth. A wound on the main tap root of each plant was made with a scalpel approximately 2.5 cm below the crown and covered with a mycelial slurry of seven-day-old 1.S.1.1 of P. sojae grown on lima bean (Phaseolus lunatus L.) agar. These trays were placed in buckets and kept in a growth chamber at 25°C, 20% relative humidity (RH), on a 14-h light:10-h dark cycle. The experimental design was a randomized incomplete block design with three replications with each block containing 50–100 RILs. There were three trays for each RIL in each block. The first two trays were for RNA isolation where each tray was either inoculated with 1.S.1.1 or mock inoculated with lima bean agar (without P. sojae). No RNA was isolated from the third tray which was inoculated with 1.S.1.1, and the lesion length was measured 7 days after inoculation (dai) from the top of the inoculation site to the leading edge of the lesion margin to ensure that inoculations had been successful. A schematic for the experimental design is shown in Supplementary Figure S1.
All agar was gently removed using a Kimwipe, and a 1-cm section of tissue from the inoculation site was collected 24 hai from the mock and inoculated trays. Tissue from eight to 10 plants from a single RIL was collected, and tissue from all three replicates of each RIL was pooled for RNA extraction for a total of ~24–30 plants per RIL. Tissue was ground in liquid nitrogen, and RNA was extracted using a Qiagen RNeasy Plant Mini Kit (Hilden, Germany) following the manufacturer’s protocols.
RNA was quality and quantity checked using the TapeStation (Agilent Technologies, Santa Clara, CA, USA) and Qubit 2.0 Fluorometer (Invitrogen, Carlsbad, CA, USA), respectively. RNA quality and quantity standards were met for both the mock-inoculated and inoculated treatment for each of the 93 RILs. Sequence data from this study can be found in the NCBI BioProject: PRJNA478334.
2.2 Genotypic and phenotypic data
Phenotypic QTLs have been previously reported in the Conrad × Sloan recombinant inbred population of 316 individuals (Stasko et al., 2016), a subset of which was used for this study. The methods for inoculation, experimental design, and statistical analysis for mapping were described in greater detail (Wang et al., 2010; Wang et al., 2012b; Stasko et al., 2016). To construct a genetic map to carry out both eQTL and phQTL mapping, genotypic data was obtained from Stasko et al. (2016). While included in WGCNA, RIL 12280 was removed from the phQTL and eQTL analyses due to missing genotypic data. The normality of the data was evaluated using the Shapiro–Wilk test and visually assessed by histograms and QQ plots.
To account for environment variation, best linear unbiased predictor (BLUP) values for RILs were extracted from the model by adjusting mean lesion lengths of 92 RILs to the checks (cultivars OX20-8 (Rps1a, no partial resistance), Williams 82 (Rps1k, moderate partial resistance), Conrad (parent, high partial resistance), Sloan (parent, moderately susceptible)) and removing environmental variation in R version 3.5.1 (R Core Team, 2018) with the package -’lme4’ using the lmer function in version 1.1-19 (Bates et al., 2014). The model applied was Yijk = µ + Ri + Tj + G(C)jk + ϵijk where µ = overall mean, Ri = effect of the ith replication, Tj = effect of the jth type of entry, G(C)jk = effect of the kth genotype within the type for RIL only, and ϵijk = experimental error. The RILs in this study represent a subset of all possible genetic combinations and were treated as random (Green and Tukey, 1960). The same principle was applied to the random effect of replication, while the assigned category of type of entry (a category for RILs as well as each of the checks) was treated as fixed. Variance components were estimated using the maximum likelihood method. Composite interval mapping (R/qtl; Broman et al., 2003) was utilized to confirm phQTL peaks that were associated with lesion length BLUP values in the 316 RIL population from Stasko et al. (2016).
2.3 RNA sequencing
For each of the 184 samples consisting of ~24–30 plants per RIL per treatment, 1 µg of total RNA was converted to complementary DNA libraries (Molecular and Cellular Imaging Center, Ohio Agricultural Research and Development Center) and sequenced using Illumina HiSeq paired-end (PE) 100 base-pair reads. The average reads per sample was 3,126,863, ranging from 2,484,193 to 5,087,094 reads per sample. While only a single sample was sequenced for each RIL:treatment combination, the use of a highly inbred RIL population makes it such that each allele is represented approximately 46 times per treatment (50% of 92) and therefore provides replication within the genome-wide analyses. In brief, all reads were quality checked, adapter removed, and quality trimmed using bioinformatics tools FastQC (Andrews, 2010) and BBTools (BBMap; Bushnell, 2014). All reads were mapped to the reference genome (Glycine max Wm82.a2.v1) retrieved from Phytozome1, using CLCBio (CLC Genomics Workbench 9.5.32. Reads mapped to the reference genome were counted using FeatureCounts (Liao et al., 2014). Data were normalized using edgeR (Robinson et al., 2010) using the trimmed mean of the M-values (TMM) normalization.
2.4 iBMQ eQTL mapping
The integrated hierarchical Bayesian model for multivariate eQTL mapping (iBMQ; Imholte et al., 2013) is a multivariate mapping method that implements a multi-loci approach to allow for the identification of complex traits that are being controlled by multiple genes. iBMQ parameters are estimated using a Markov Chain Monte Carlo (MCMC) algorithm that models concurrently all genes and SNPs. The current version of iBMQ executed is available online3. Normalized unfiltered expression data (RNA-seq data) and genotyping data, including SNPs that were identified in the newly conducted linkage map for all RILs, were used as inputs into iBMQ. These data sets were formatted into an ExpressionSet and Snpset using Biobase in Bioconductor 3.7 (Huber et al., 2015). The eQTLs were mapped by using gene expression (e-trait) as a phenotypic trait identifying the SNP association for mock and inoculated treatments and mapped separately with 100,000 iterations with a burn-in of 50,000 to produce a posterior probability of association (PPA). A false discovery rate (FDR) of 10% was used to determine the PPA significance cutoff (Imholte et al., 2013).
Significantly mapped eQTLs were classified as either cis- or trans- using the eqtlClassifier in the iBMQ package. Classification of cis- or trans-eQTLs was determined by physical position; if a SNP was within 5 Mb of the gene it controlled, it was classified as cis-, and if a SNP was farther than 5Mb from the gene controlled, it was classified as trans-. The physical positions of genes and SNPs were determined using the reference genome annotation, Williams 82 v.a2.v14.
The function hotspot finder inside the iBMQ package was used to identify individual markers (SNPs) that are associated with the expression of several genes and indicate eQTL, hotspots as described by Imholte et al. (2013). A SNP was identified as a hotspot if it was associated with >20 genes.
2.5 Gene enrichment
Significant cis- and trans-eQTLs, gene suites at eQTL hotspots, and co-expression modules were subjected to GO enrichment. AgriGO (v2.0; Tian et al., 2017) was used for GO enrichment analysis. Targeted QDR pathway mechanisms were also explored by extracting genes via KEGG (Kanehisa and Goto, 20005) from NCBI BioSystems6. Gene models from the reference soybean genome that met read-mapping thresholds for inclusion in eQTL mapping were used as the reference set for enrichment analyses (Schmutz et al., 2010). Fisher’s exact test (Fisher, 1935) and multitest Hochberg FDR adjustment (Benjamini and Hochberg, 1995) were used to determine significance.
2.6 Weighted gene co-expression analysis
WGCNA was carried out according to Langfelder and Horvath (2008) using modified R-scripts (WGCNA Methods M1). Prior to WGCNA analysis, RNA-sequencing counts from 92 RILs plus the parents of the population were normalized using R Bioconductor package edgeR (Robinson et al., 2010). First trimmed means of M-values (TMM) were used to calculate normalization factors for all sample counts and were subjected to a log2 transformation. Genes were filtered by the threshold of greater than 2 counts per million (cpm) across 50 samples. Ultimately, 27,666 genes were used in the input matrix. Due to sample count bias, a consensus approach was taken. Based on the smallest standard deviation representing susceptible and resistant individuals separately, 30 resistant and 30 susceptible individuals were selected, and the minimum standard deviation was determined (10,000 iterations) and used as a cutoff to select the subsample of 30 resistant and 30 susceptible individuals. The process of subsampling individuals who met the standard deviation cutoff through generating modules was done in 20,000 iterations and generated for 20 network analyses.
To examine the physiological relevance of each module within the network analyses, phenotypic traits were correlated to the module genes’ expression using log expression eigengene values for each module regressed against the lesion length values of the RILs. Consensus networks were constructed independently for the positively and negatively correlated modules and again related to phenotypic traits (WGCNA Methods M2).
To determine the driving factors of co-expression modules, modules that were significantly correlated to PRR disease (p-value ≤ 0.05) were also correlated to inoculated eQTL hotspots, adapting methods from Zhang and Horvath (2005) to integrate SNP-based significance (PPA of eQTL) with network properties (gene significance) of co-expression module (WGCNA Methods M3).
2.7 Co-localization of eQTLs with phQTLs
Co-localization of cis-eQTLs with phQTLs was based on the physical coordinates of the cis-eQTLs gene model being within the flanking marker positions for selected phQTLs reported from the present and previous studies (Table 1). All phQTLs that could not be positioned onto the genome based on marker positions were removed from the data set, for a total of six out of 28 phQTLs. Based on the physical coordinates of markers flanking phQTLs, overlapping phQTLs were consolidated. To determine if the number of co-localized cis-eQTLs and consolidated phQTLs was significantly greater than expected, cis-eQTLs were permuted across all gene models eligible for eQTL analysis. A threshold (α = 0.05) was set based on 1,000 permutations.
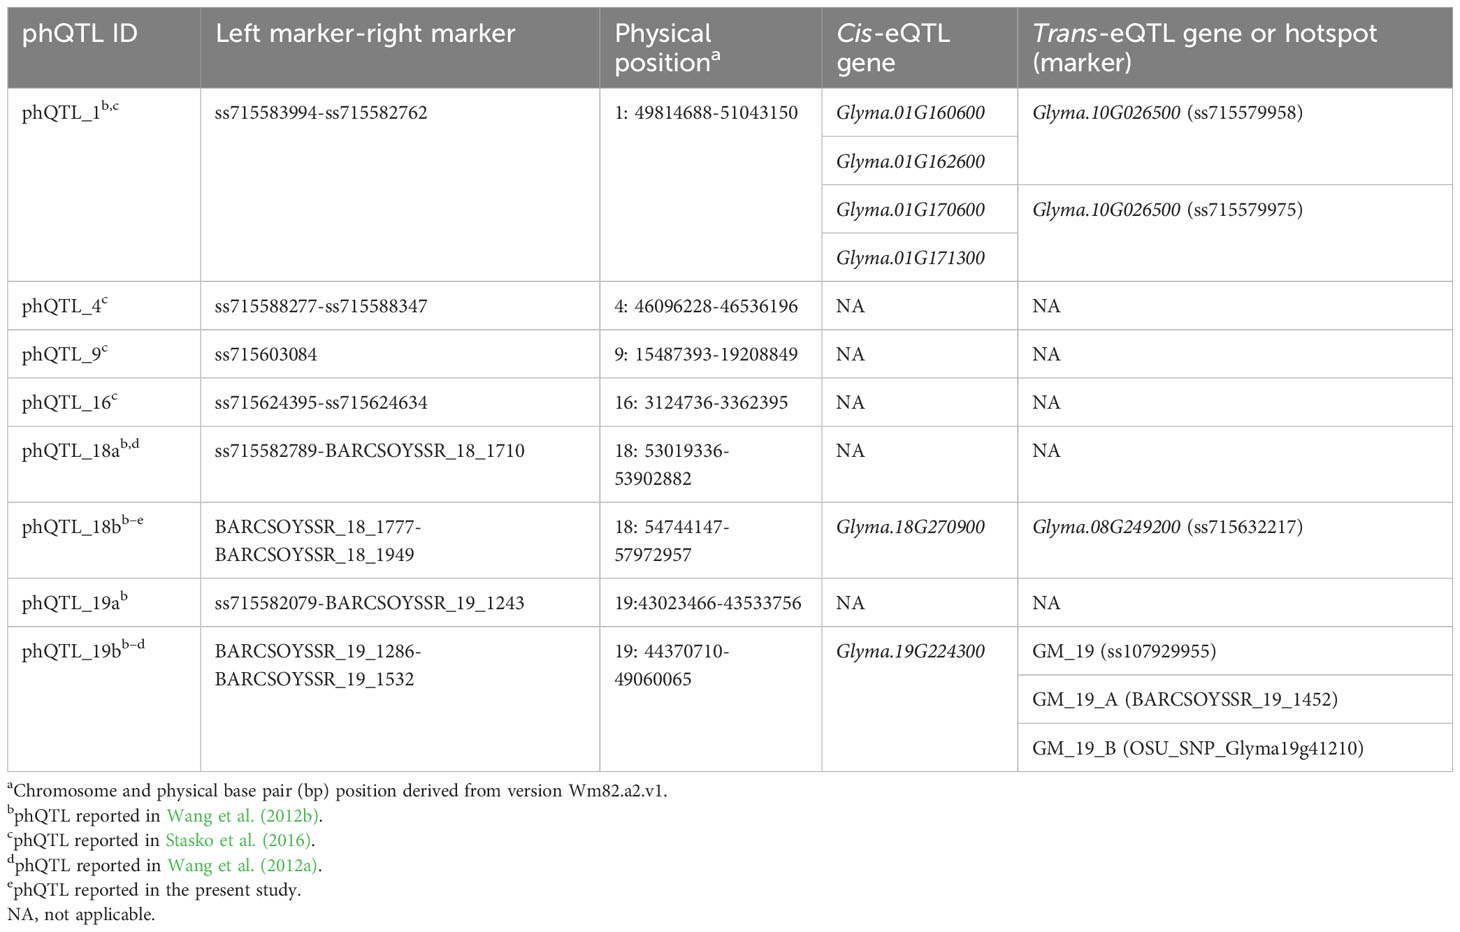
Table 1 Co-localization of cis- and trans-eQTL as well as hotpots with consolidated phenotypic quantitative trait loci (phQTLs) mapped in the sub-population and previous phQTL mapped in multiple generations of the Conrad × Sloan RIL population.
Methods to determine the co-localization of trans-eQTLs with phQTLs were adapted from Christie et al. (2017). Base pair positions of consolidated phQTLs and a window using the average linkage disequilibrium (LD) block size (242 kb) around the marker to which trans-eQTLs mapped were used to determine phQTL/trans-eQTL co-localization. Linkage disequilibrium blocks were determined using the Haploview four-gamete method (Barrett et al., 2005). To determine if the number of co-localized trans-eQTLs and phQTLs was significantly greater than expected, trans-eQTLs were permuted across available markers on the genetic map. A threshold (alpha = 0.05) was set based on 1,000 permutations.
2.8 Identification of putative master regulators
Methods for identifying master regulators for eQTL hotspots were adapted from Wang et al. (2017). Genes within an up- and downstream 242-kb window (average LD block size for this population) of the hotspot SNP that also had cis-eQTLs mapping were identified as initial candidate master regulators. If no genes within the window were associated with cis-eQTLs, genes with no mapping e-traits were considered. From these cis-eQTLs or positional candidates, putative master regulators were selected according to predicted functions of transcription factor (TF) or signaling molecules (SM).
3 Results
3.1 Genetic map reconstruction and quantitative disease resistance to Phytophthora sojae
While phQTLs for QDR have been previously mapped in the F9:11 RIL population derived from a cross between Conrad (resistant) and Sloan (susceptible) (Stasko et al., 2016), in order to ensure that the phQTLs were directly relevant to the expression data collected in this study (Supplementary Figure S2), we mapped phQTLs using data from only the subset of 92 RILs for which RNA-seq, phenotypic data, and previous genotypic data were available (Stasko et al., 2016). A genetic map was constructed consisting of 1,122 markers assembled in 28 linkage groups, with most of the 20 soybean chromosomes represented as a single linkage group and chromosomes 5, 6, 7, 11, 12, 13, 17, and 19 each represented by two linkage groups (Supplementary Table S1). A suggestive phQTL, significant at the chromosome but not genome-wide level, on chromosome 18 and nonsignificant associations with regional peaks but nonsignificant logarithm of the odds (LOD) scores on chromosomes 1, 16, and 19a correspond to phQTLs previously identified in the full RIL population (Supplementary Figure S2; Stasko et al., 2016). In comparison to previous studies, reduced significance is expected due to the smaller subset of RILs.
3.2 Genetic architecture of gene expression in mock and inoculated treatments
To identify the loci contributing to variation in gene expression, eQTLs were mapped under both mock and inoculated conditions. Gene expression levels were interpreted as quantitative traits (e-traits), and the locus or loci for each e-trait were mapped separately for inoculated and mock treatments. A total of 114,197 eQTLs were mapped from e-traits for the inoculated treatment from root samples collected 24 hai from the site of inoculation, representing transcripts from 35,781 unique genes associated with 74 unique loci (Supplementary Table S2). In contrast, the number of eQTLs mapped in the mock treatment was far lower but distributed across more loci, with 794 eQTLs representing 788 unique genes across 234 unique loci. The eQTLs identified in the inoculated treatment were distributed across most chromosomes, the exceptions being chromosomes 9 and 10 (Figure 1A), while eQTLs from the mock treatments were relatively evenly distributed across all chromosomes in the genome (Figure 1B). Interestingly, only two eQTLs were in common between mock and inoculated treatments, including the SNP, ss715580997, associated with e-trait Glyma.02G107800 (putatively coding an uncharacterized protein), and the SNP OSU_SNP_Glyma19g41210, associated with e-trait, Glyma.19G224300 (putatively coding a protein involved in regulation of root development and cell wall).
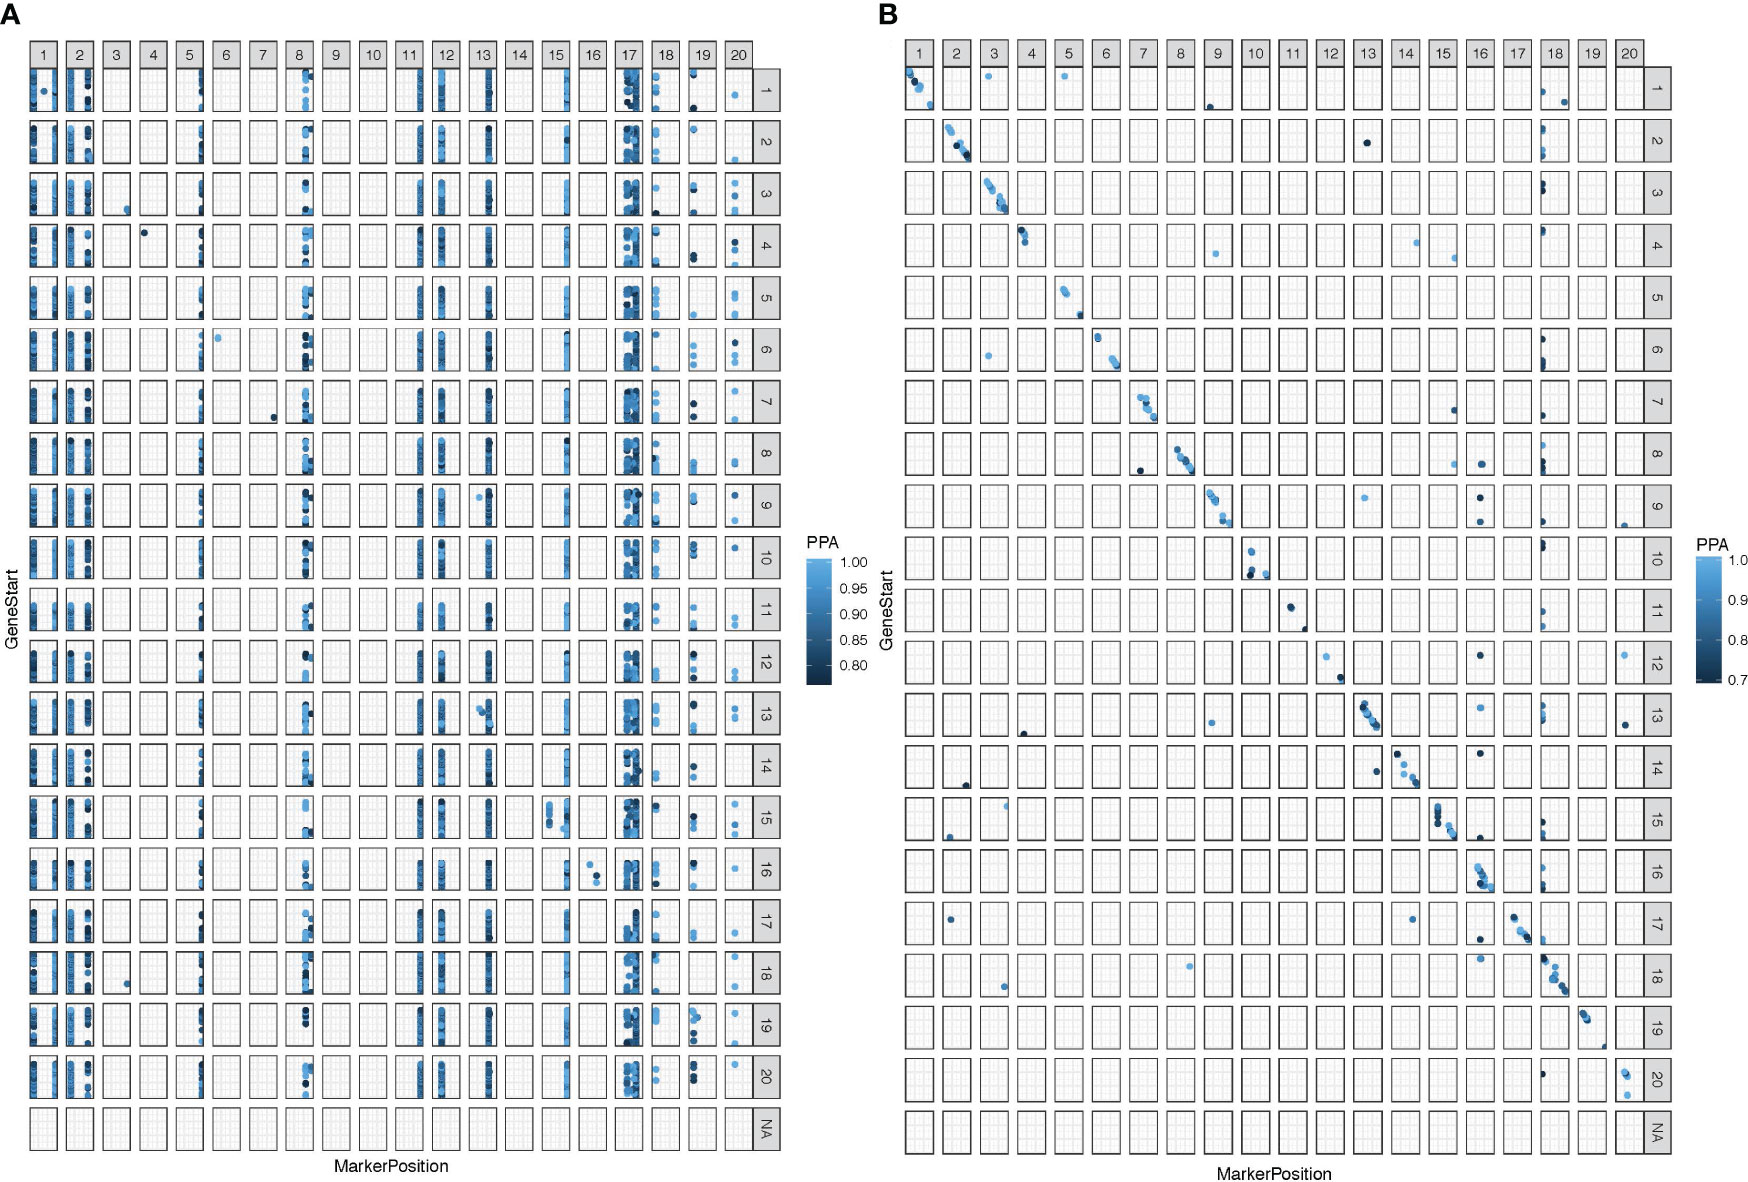
Figure 1 Expression quantitative trait loci (eQTL) were mapped in 92 Conrad × Sloan F9:11 RIL population at false discovery rate (FDR) of 10% with 100,000 iterations. (A) Significantly mapped inoculated treatment eQTL at a significance posterior probabilities of association (PPA) cutoff of 0.786 for the inoculated treatment. (B) Significantly mapped mock treatment eQTL at a significance PPA cutoff of 0.688. Base-pair positions are shown with zero at the bottom of the y-axis and right of the x-axis. Markers in a vertical formation indicate trans-eQTL, and markers in a diagonal formation indicate cis-eQTL. Chromosomes with no data contain nonclassified eQTL due to missing physical location data.
The eQTLs associated with e-traits of nearby genes are considered cis-eQTLs, while eQTLs altering the expression of physically distant genes are classified as trans-eQTLs (Hubner et al., 2005; Kliebenstein, 2009). In the inoculated treatment, the vast majority (111,568; ~98%) of the eQTLs were in the trans configuration (Figure 1A; Supplementary Table S2). In contrast, in the mock treatment, 83% (657) of the eQTLs were in the cis configuration (Figure 1B; Supplementary Table S2).
Key regulatory genes are expected to influence the expression of many genes. Therefore, eQTL hotspots, genomic regions enriched for eQTLs, are likely localized to these key regulatory genes (Kliebenstein, 2009; Tian et al., 2016). Thirty-six hotspots distributed across 12 chromosomes were identified for the inoculated treatment, with seven located on chromosome 17. Of the 36 hotspots in the inoculated treatment, there were two very large hotspots, GM_1 and GM_15, associated with 23,919 and 25,727 e-traits, respectively. For the mock treatment, there were three hotspots located on chromosomes 13, 16, and 18. The mock and inoculated eQTL hotspots did not overlap with each other (Table 2).
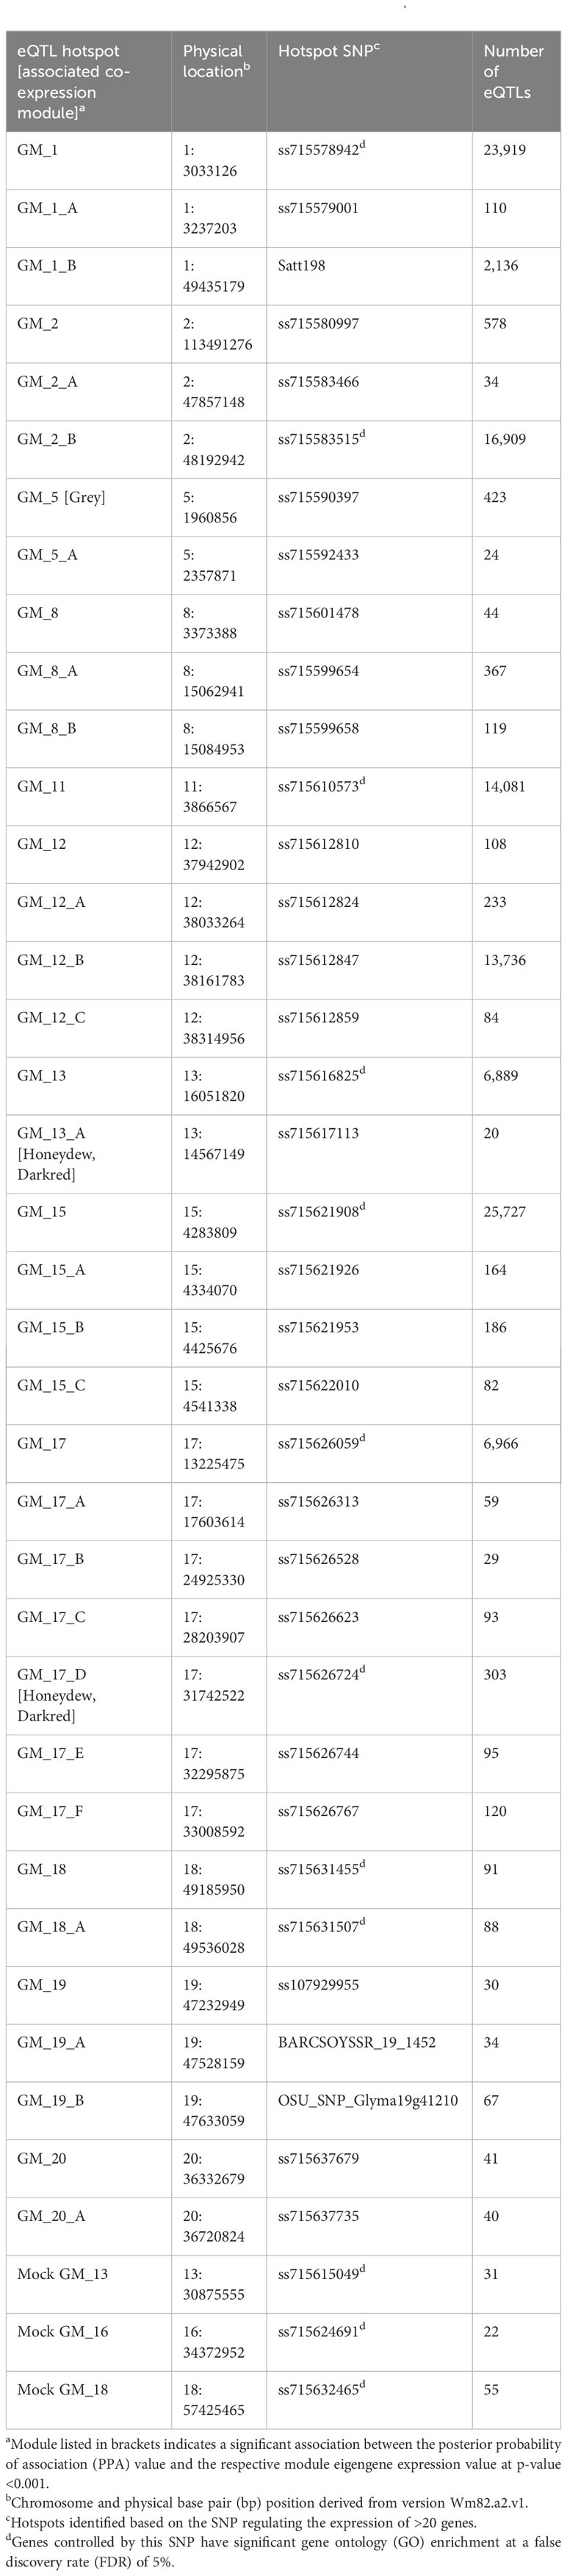
Table 2 Summary of inoculated and mock causal hotspots for number and regulation of expression quantitative trait loci (eQTLs) positively correlated to resistance towards Phytophthora sojae.
3.3 Term enrichment and functional annotations of genes associated with each hotspot
Genes that are co-regulated may be associated with specific coordinated functions or resistance mechanisms. To identify a commonality of functions among e-traits mapping to each eQTL hotspot, GO term enrichment analysis was done. The e-traits associated with 10 of the 36 hotspots for the inoculated treatment were significantly enriched (p-value ≤ 0.05) for biological and/or cellular processes and molecular function terms. We were particularly interested in the enrichment of biological process GO terms, as enrichment of these terms may provide clues to the mechanisms of QDR. The biological process GO terms were significant for the e-traits associated with six of the 36 hotspots (Supplementary Table S3). A total of 16 and 31 biological processes were enriched among e-traits mapping to the large hotspots GM_1 (23,919 e-traits) and GM_15 (25,727 e-traits), respectively. Some of the most significantly enriched biological process terms were “intracellular transport,” “gene expression,” and “cellular processes” (Supplementary Table S3). Similar terms were also found for GM_2_B, GM_11, and GM13 as well as “intracellular signal transduction”. Four additional hotspots (GM_17_D, GM_17_F, GM_18, and GM_18_A) were not enriched for biological process GO terms but were enriched for cellular and molecular function GO terms. Overall, biological process GO term enrichment provided evidence of a functional relationship among e-traits within 10 hotspots and hinted at cell-to-cell signaling and protein modification roles but did not elucidate their involvement in a specific mechanism or pathway for QDR.
GO term enrichment for the e-traits associated with the three mock eQTL hotspots was also identified but revealed very general terms (Supplementary Table S4). While e-traits associated with each of the three mock eQTL hotspots were enriched for GO terms, only e-traits associated with GM_18_M were enriched for biological process terms. These included the terms “regulation of cellular process” and “biological regulation.” Any significant enrichment of GO terms indicates functional relationships among the genes at a hotspot; however, these general terms do little to inform the specific role of the e-traits at these hotspots.
The e-traits associated with each eQTL hotspot were also examined for enrichment of genes predicted to be involved in specific mechanisms of QDR in soybeans by P. sojae. The e-traits for six of 36 hotspots from the inoculated treatment (GM_1, GM_1_B, GM_2_B, GM_11, GM_13, and GM_15) were significantly enriched for genes in the plant–pathogen interaction pathway, and one hotspot (GM_11) was additionally significantly enriched for genes in the isoflavonoid pathway (Table 3). These findings suggest that these six hotspots are most likely regulating genes involved in PAMP-triggered immunity, defense-related gene induction, and/or programmed cell death, implicating leucine-rich repeat (LRR) encoding and other PAMP-triggering genes as likely candidate genes.
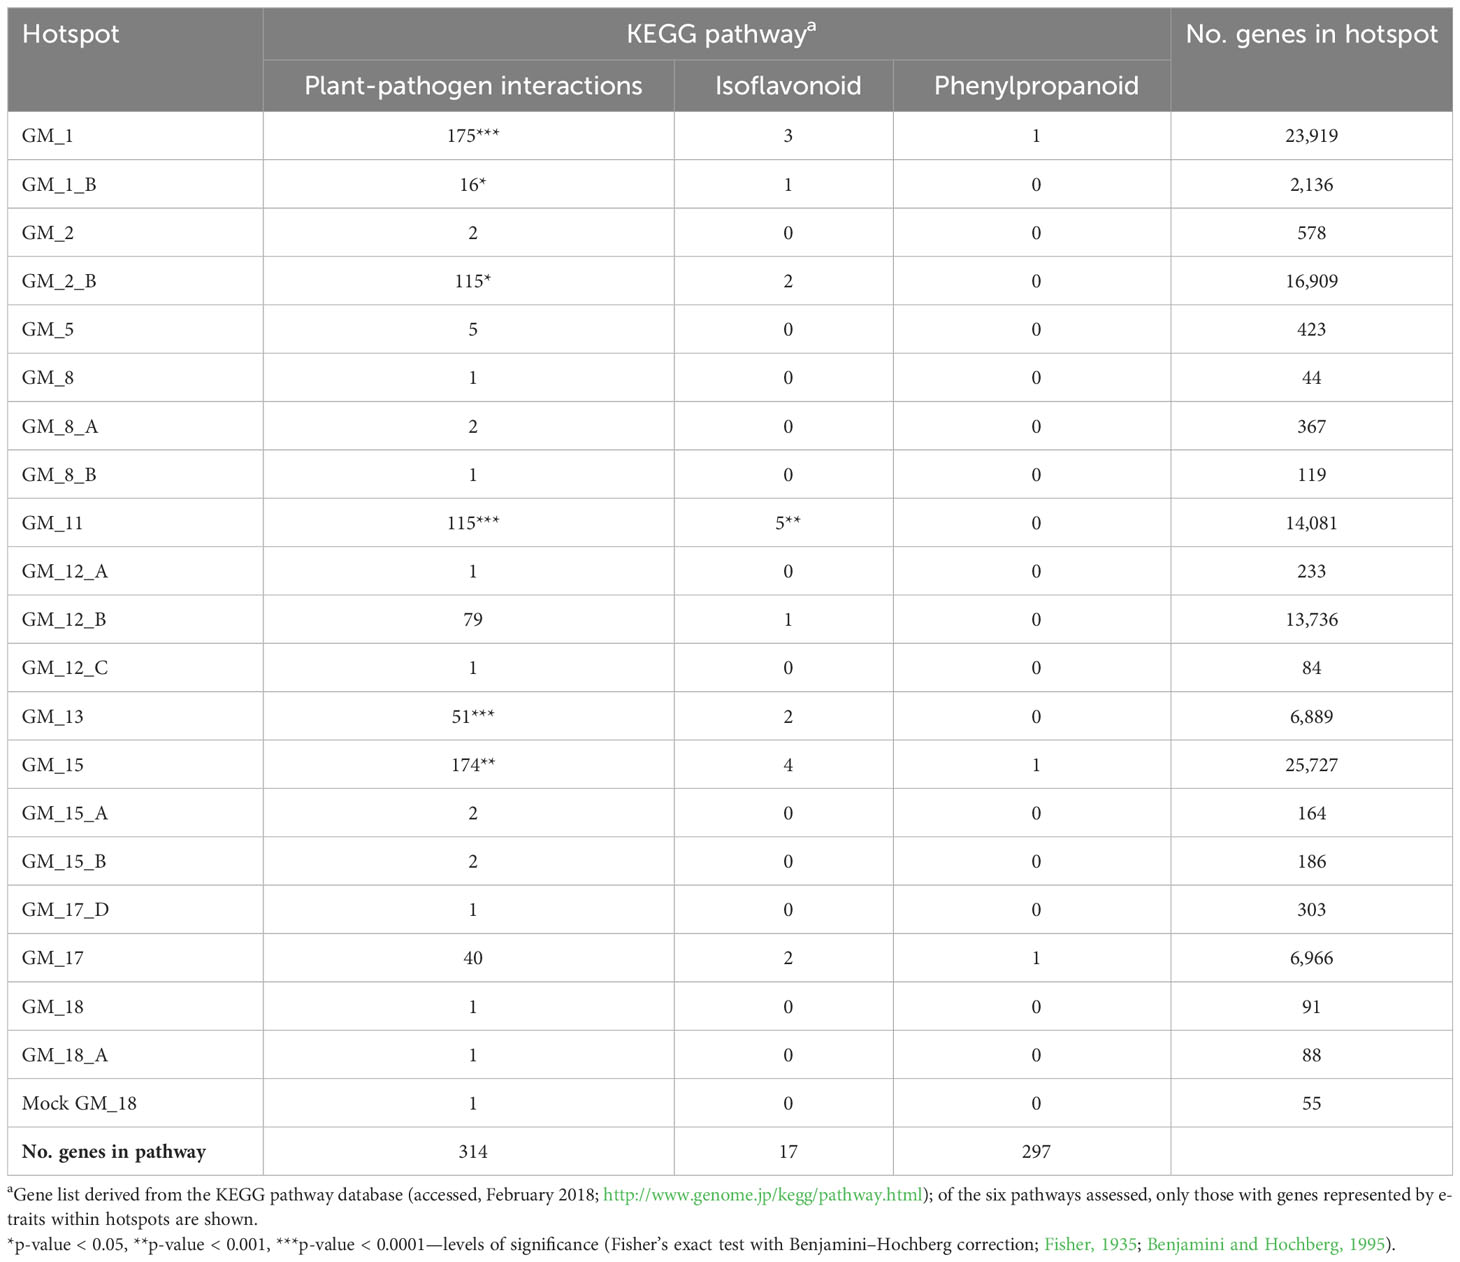
Table 3 Pathway enrichment of expression quantitative trait loci hotspots.
We identified no enrichment for hypothesized resistance mechanisms for e-traits mapping to the three hotspots from the mock treatment nor for the remaining 30 of 36 hotspots from the inoculated treatment. While these findings may indicate a lack of concerted functional relationships among e-traits mapping to these hotspots, it may also be due to a lack of statistical power in the smaller hotspots or that the associated e-traits may be involved in unknown or untested mechanisms of QDR.
3.4 Weighted gene co-expression network analysis in the Conrad × Sloan RIL population
To confirm and further characterize the transcriptional reprogramming that occurs following infection with P. sojae of this RIL population, we constructed expression networks, or weighted gene co-expression networks, determined by pairwise correlation of gene expression profiles (Langfelder and Horvath, 2007). This network analysis resulted in a total of six robustly defined modules (Supplementary Figures S4–S6). Module eigengene expression values from three modules, honeydew1, dark red, and grey, comprised of 20,976, 2,785, and 385 genes, respectively, had significant positive correlations with both BLUP values and lesion length for the PRR disease phenotype (Figure 2), indicating that as the expression of genes within these modules increased, susceptibility to PRR increased.
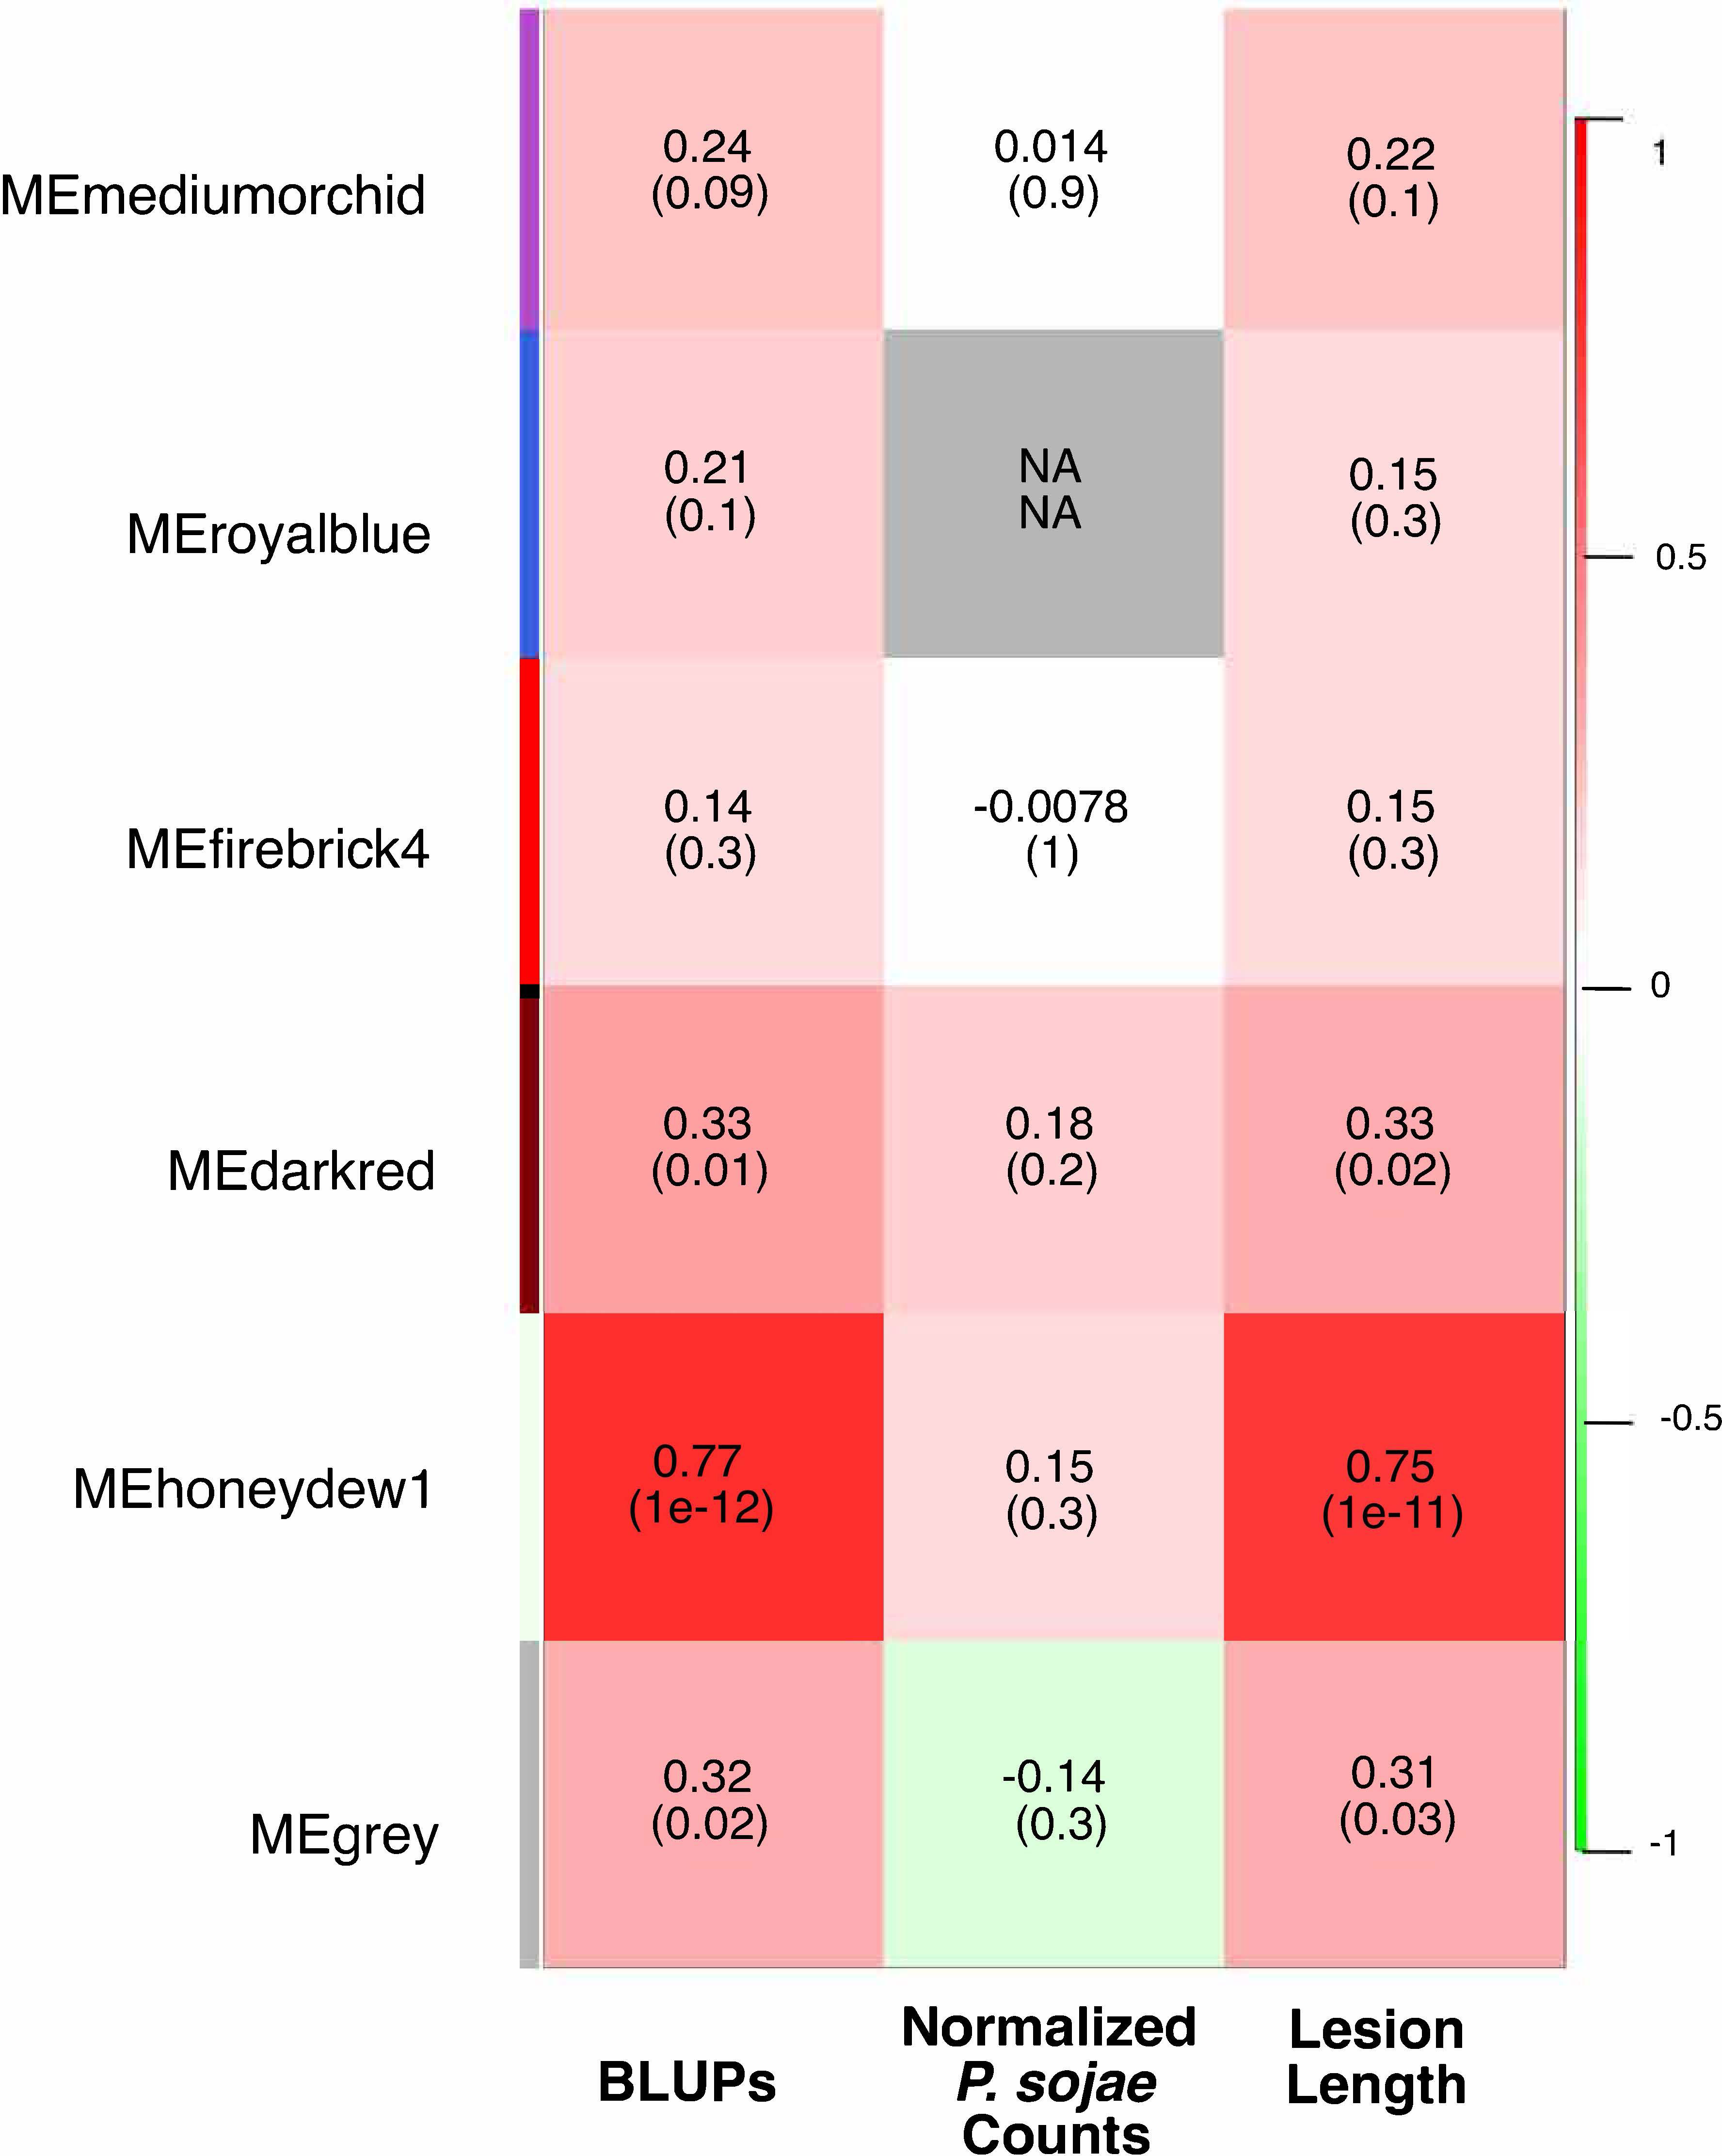
Figure 2 Consensus-weighted gene co-expression network analysis (WGCNA) for positively correlated modules. The best linear unbiased predictors (BLUPs) and lesion length values positively correlated to co-expression modules are in red, and those negatively correlated are in green. The first number represents the correlation coefficient, the number in parenthesis indicates the p-value. N/A indicates no consensus co-expression module was preserved.
3.5 Term enrichment and functional annotations of co-expression modules
Following similar methods as to how we assessed the putative functions of eQTL hotspots, to ascertain the potential roles of the modules in susceptibility to PRR, GO term enrichment and functional annotations were assessed for genes within the honeydew1, dark red, and grey modules. While no significant GO enrichment was observed for the smaller dark red and grey modules, for the honeydew1 module, the most significantly enriched GO terms for biological processes included “translation,” “protein localization,” and “macromolecule localization” (Supplementary Table S5).
Genes within the co-expression modules were also evaluated for gene enrichment within the six known QDR pathways, for which we had previously evaluated e-traits in each hotspot for enrichment. The honeydew1 module was enriched for five of the six evaluated pathways: plant hormone signal transduction, phenylpropanoid biosynthesis, isoflavonoid biosynthesis, MAPK signaling, and plant-pathogen interaction pathways (Table 4). The dark red module was also significantly enriched for plant hormone signal transduction, MAPK signaling, and plant–pathogen interaction pathways. None of the six pathways were significantly enriched in the grey module, possibly due to the relatively smaller size of this module or indicating that there may be other pathways associated with resistance.
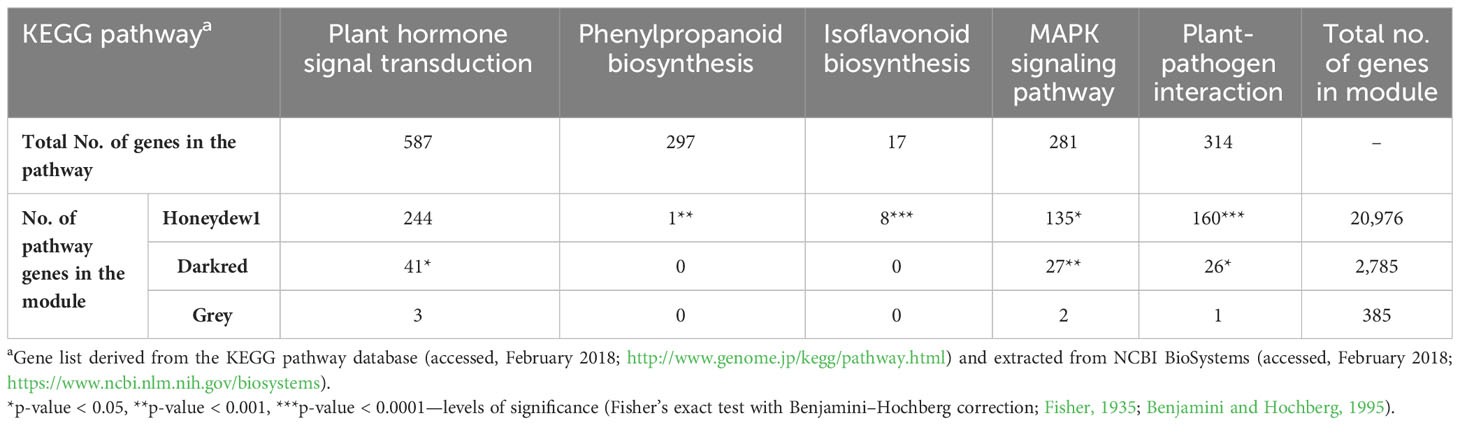
Table 4 Enrichment of genes within KEGG pathways for each co-expression module related to susceptibility.
3.6 Genetic architecture of co-expression modules
We integrated genetic markers associated with inoculated eQTL hotspots and co-expression modules (Zhang and Horvath, 2005) to further investigate the genetic loci influencing the three co-expression modules that were significantly correlated with PRR (honeydew1, dark red, and grey). The expression of each of the three module eigengenes was significantly correlated with the SNP(s) marking one or more of the eQTL hotspots. The correlation of an eQTL hotspot and a co-expression module to the same SNP suggests regulation of both by a common genetic mechanism (Table 2; Supplementary Figures S7A–C). The grey module was significantly correlated to the genetic marker for hotspot GM_5 (423 e-traits). The expression of both the honeydew1 and dark red module eigengenes was significantly correlated to SNPs from hotspots GM_13_A (20 e-traits) and GM_17_D (303 e-traits).
3.7 Co-localization of phQTLs and eQTLs
In order to understand the regulation of QDR by P. sojae, co-localizations of eQTLs or eQTL hotspots with phQTLs were identified. Among all of the 8 phQTLs mapped to unique locations in populations derived from Conrad × Sloan for P. sojae isolate 1.S.1.1 (Wang et al., 2010; Wang et al., 2012a; Stasko et al., 2016; Table 1), three phQTLs, which mapped to chromosomes 1, 18, and 19, co-localized with three hotspots and nine eQTLs (three inoculated trans- and six inoculated cis-eQTLs (Table 1). For both cis- and trans-eQTLs, this is significantly more co-localization than expected by random chance.
Co-localized with phQTL_1 were four cis-eQTLs for Glyma.01G160600, Glyma.01G162600, Glyma.01G170600, and Glyma.01G171300 and two trans-eQTLs, both representing Glyma.10G026500, which had e-traits mapping independently to two markers within this phQTL region (Table 1). The e-traits of genes mapping in cis are towards genes annotated as a vacuolar iron transporter homolog, two-component response regulator ARR2, and an uncharacterized expressed sequence. The predicted protein of Glyma.10G026500, mapping to the two trans-eQTLs, was also uncharacterized. Interestingly, just outside (138 kb) of the average LD block size window (242 kb), which we used to consider co-localization between mapped trans-eQTL and phQTL, is the hotspot GM_1_B.
The e-traits for the paralogs Glyma.18G270900 and Glyma.08g249200 are both co-localized with phQTL_18b in cis and trans, respectively (Table 1). The gene sequences are present in syntenic blocks from the recent duplication within the soybean genome (Schmutz et al., 2010). Both genes are predicted to encode a malectin/receptor-like protein kinase.
Covering 4.7 Mb, phQTL_19b represented the largest genomic size of the phQTL we considered. As such, it co-localized with all three hotspots on chromosome 19 (GM_19, GM_19_A, and GM_19_B). However, these hotspots, all relatively small and possessing between 30 and 67 e-traits, were not enriched for any function or GO annotation, providing little evidence of a coordinated function. However, in addition to co-localization with the three hotspots, phQTL_19b also co-localized with both the mock and inoculated cis-eQTLs for the Glyma.19G224300 e-traits.
3.8 Identification of master regulators controlling the expression of downstream suites of genes
Master regulators control the expression of a suite of downstream genes. To identify master regulators in QDR for P. sojae, we examined the key eQTL hotspots, which we defined as those that were significantly enriched for e-traits, correlated with modules, or co-localized with phQTL. From the 36 total eQTL hotspots, our primary and meta-analyses identified 16 key eQTL hotspots through the significant pathway or GO term enrichment of e-traits within a hotspot (GM_1, GM_1_B, GM_2_B, GM_11, GM_13, GM_15, GM_17, GM_17_D, GM_17_F, GM_18, GM_18_A), by the significant correlation of co-expression modules (GM_5, GM_13_A, GM_17_D), and/or the co-localization with a phQTL for resistance to P. sojae (GM_19, GM_19_A, GM_19_B). To better understand the regulation of these key hotspots, we identified their putative master regulators by integrating genetic position and putative gene function (methods adapted from Wang et al., 2017). We identified genes within the hotspot regions predicted to encode transcription factors or signaling molecules as putative master regulators (Table 5).
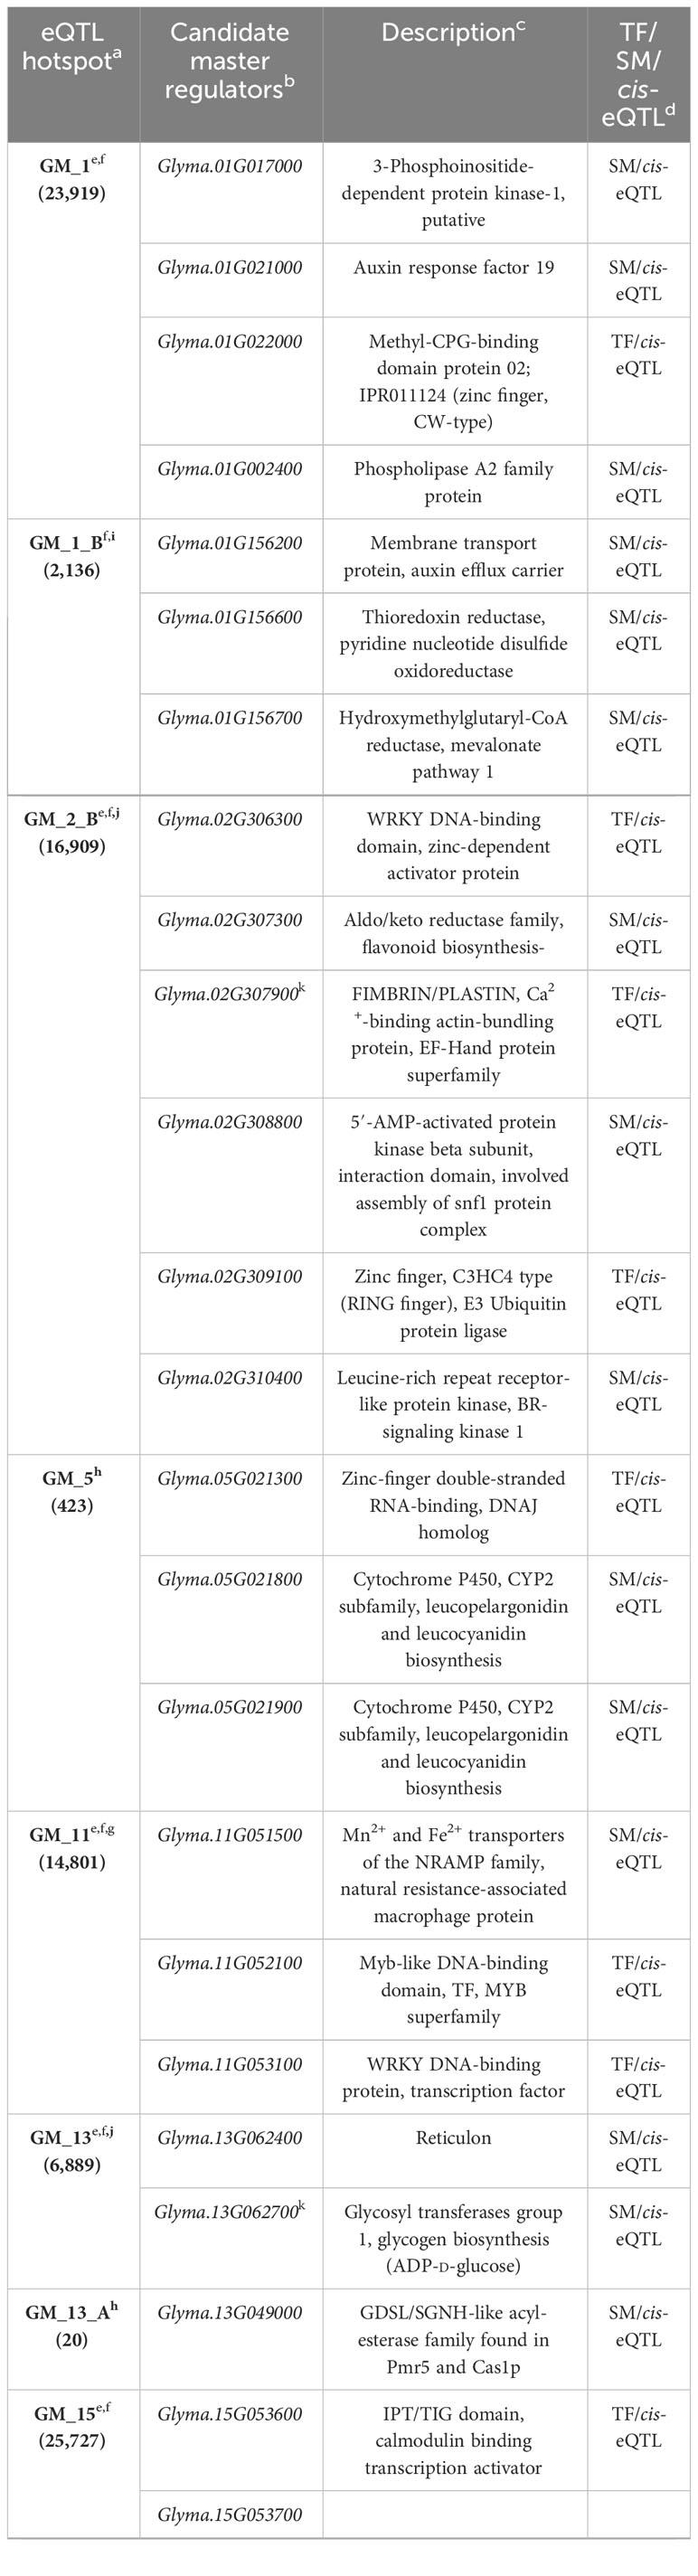
Table 5 Candidate master regulators of key hotspots.
For nine of the 16 hotspots evaluated for master regulators (GM_1, GM_1_B, GM_2_B, GM_5, GM_11, GM_13, GM_13_A, GM_15, GM_17), we identified co-localized cis-eQTLs putatively encoding signal molecules and/or transcription factors (Table 5). To note, numerous hotspots were associated with multiple putative master regulators with genes for cis-eQTLs encoding both signaling molecules and transcription factors. For the four remaining eQTL hotspots (GM_17_D, MD_17_F, GM_18, and GM_18_A), while no genes within the LD window (242 kb) had cis-eQTLs, genes within the LD windows were putatively encoding transcription factors and/or signaling molecules and identified as candidate master regulators of these hotspots. In total, 15 genes putatively encoding transcription factors and 24 genes putatively encoding signaling molecules were identified as candidate master regulators for the 16 key eQTL hotspots (Table 5).
4 Discussion
Many phQTLs have been mapped through several generations in this Conrad × Sloan population (Wang et al., 2010; Wang et al., 2012a; Wang et al., 2012b; Stasko et al., 2016); however, identifying the mechanisms underpinning these phQTLs has, thus far, been unsuccessful. Studies using the resistant parent ‘Conrad’ have identified many putative mechanisms of quantitative resistance, demonstrating the complex nature of QDR and the potential that these mechanisms could be interacting (Vega-Sánchez et al., 2005; Thomas et al., 2007; Ranathunge et al., 2008; Zhou et al., 2009; Wang et al., 2012b). The application of a systems genomics approach in this study has allowed us to disentangle the complex genetic architecture of gene expression related to QDR for P. sojae using multiple approaches, including eQTL mapping, co-expression network analysis, and the co-localizations of phQTLs, eQTLs, and co-expression modules. The approaches taken in this study confirmed hypothesized mechanisms as well as provided evidence to suggest potential novel mechanisms of QDR for this pathosystem.
4.1 Inoculation with P. sojae causes transcriptional reprogramming that occurs in a trans-regulatory manner
Expression QTLs were successfully mapped in both the inoculated and mock treatments; however, there were 144-fold more eQTLs mapped for the inoculated treatment compared to the mock treatment. An average of two eQTLs per gene were mapped in the inoculated treatment, which is consistent with previous eQTL mapping studies (Schadt et al., 2003; Swanson-Wagner et al., 2009; Christie et al., 2017). Yet, in this study, only 794 eQTLs were identified for the mock, the majority of which were cis-eQTL. In stark contrast to the mock-inoculated treatment, nearly all eQTLs identified from the inoculated treatment in this study were trans-eQTLs (98%).
Gene expression has been shown in previous eQTL studies to be controlled by trans- or a combination of both trans- and cis-elements (West et al., 2007; Christie et al., 2017; Sun et al., 2017; Li et al., 2018). However, the number of eQTLs mapped, as well as the proportion of trans- vs. cis-eQTLs, has not followed a specific trend between species and populations (Keurentjes et al., 2007; West et al., 2007; Potokina et al., 2008; Swanson-Wagner et al., 2009; Hammond et al., 2011; Christie et al., 2017). For example, the number of eQTLs varied approximately ninefold between RIL populations in Arabidopsis (Keurentjes et al., 2007; West et al., 2007). While some studies have reported nearly equal ratios of trans- and cis-eQTLs detected in both Arabidopsis and barley (Keurentjes et al., 2007; Potokina et al., 2008), other studies have revealed a predominance of trans-regulation of eQTLs in Arabidopsis (86% and greater trans-eQTLs) (West et al., 2007; Soltis et al., 2020), barley (70% trans-eQTLs) (Druka et al., 2008), Brassica rapa (77% trans-eQTLs) (Hammond et al., 2011), and maize (up to 80% trans-eQTLs) (Swanson-Wagner et al., 2009; Christie et al., 2017). These varying results have been attributed to statistical power to detect trans-eQTLs, the size of the mapping population, the high polymorphism rate among genotypes in the study, and true biological differences between systems and their overall genetic architecture (Kliebenstein, 2009; Soltis et al., 2020). To date, only a few studies have been completed to address these questions of differing detection of eQTL types across plant species and populations (Franceschini et al., 2012; Saha and Battle, 2018).
The majority of plant-based eQTL studies to date have focused on natural genetic variation within breeding populations, different stages of maturation, or specific production or accumulation of compounds, and few have focused on mechanisms of disease resistance. Specifically in soybean, previous eQTL analyses identified predominantly trans-eQTLs for the genetic architecture of immature soybean seed (86.6%, trans-eQTLs) (Bolon et al., 2014) and dissection of isoflavonoid accumulation in soybean seed (60.6%, trans-eQTLs) (Wang et al., 2014).
The large number of trans-eQTLs mapped in this study were primarily associated with only eight eQTL hotspots, indicating massive transcriptional reprogramming resulting from the inoculation of soybean with P. sojae. This confirms several previous studies for quantitative resistance (Zhou et al., 2009; Soltis et al., 2020) and Rps-gene-related responses (Lin et al., 2014; Hale et al., 2023b). The eQTL hotspots identified in this study at 24 hai may represent key regulatory hubs and the control of signaling networks specifically in response to infection by P. sojae. More importantly, none of the 36 hotspots identified from the inoculated treatment overlap with the three hotspots identified from the mock treatment. This suggests that these hotspots in the mock represent either constitutive differences in regulation between Conrad and Sloan or a response specific to the mock treatment at the 24-hai time point. Of the few eQTL studies that have mapped transcriptional responses to disease, only a fraction of these studies compared eQTLs mapped in disease versus non-disease conditions in plant systems. Moscou et al. (2011), using microarrays to assay transcripts in barley following both inoculations with Puccinia graminis and mock inoculation, had findings that differed from this study, with similar numbers of eQTLs mapped in both mock and inoculated samples and the majority classified as cis. Here, the differences in the number of eQTL mapped between treatments, the lack of concordance of the hotspots between the mock and inoculated treatments, the correspondence with phQTLs, and the functional enrichment of genes within hotspots together suggest that the changes in transcription are due to infection by P. sojae through a coordinated transcriptional response of multiple plant defense mechanisms.
4.2 Major eQTL hotspots and co-expression networks elucidated potential QDR mechanisms, including signal integration and defense action via cell wall strengthening
Expression QTL hotspots are a single polymorphism associated with the expression of numerous genes (Neto et al., 2012), and the genetic regions may harbor important regulatory genes. In this study, the four largest hotspots, mapping to chromosomes 1, 2, 11, and 15, accounting for more than 80,000 eQTLs (>70%) from the inoculated treatment, were each enriched for genes within the plant–pathogen interaction (PPI) pathways. Specifically, PPI pathway genes found within the hotspots were predicted to function throughout the pattern-triggered immunity (PTI) pathway. The separation of the PTI and ETI pathways within the context of plant resistance to oomycetes has recently come into question in favor of a three-layer plant immune system (consisting of the recognition, signal integration, and defense-action layers) describing both PTI and ETI for plant-pathogenic oomycete infection (Wang et al., 2019; Naveed et al., 2020). The signal-integration layer represents a complex network of pathway cascades including phosphorylation, ubiquitination, relocation, degradation, stabilization of proteins, transcriptional regulation, and chemical signaling (Wang et al., 2019). The QDR pathway enrichment within these major hotspots, along with the significantly enriched GO terms related to cell-to-cell signaling and protein modification, support the involvement of these hotspots in the signal-integration layer of defense. This aligns with previously implicated defense mechanisms in plant–oomycete interactions and specifically within the P. sojae-soybean pathosystem (Wang et al., 2012b; Wang et al., 2019).
These four eQTL hotspots represent genetic variation for transcriptional reprogramming resulting from inoculation with P. sojae, a phenomenon that has been previously reported (Zhou et al., 2009; Wang et al., 2010). Yet, these hotspots do not localize to the regions of any phQTLs identified in this study or previous studies. Samad-Zamini et al. (2017) had similar findings, where none of the hotspots co-localized with phQTLs during a time-course assay of Fusarium graminearum (FHB) infection of wheat (Triticum aestivum L.). This lack of co-localization may be due to residual genetic variation of e-traits not significantly attributed to phQTL; this variation may involve complex genetic interactions, including epistasis (Li, 2019).
In this study, we also identified a total of 24,146 genes within three co-expression modules that were significantly correlated to the PRR disease resistance response. The SNPs corresponding to two hotspots, GM_13_A and GM_17_D, were also both significantly correlated to the co-expression modules dark red and honeydew1. GM_17_D was enriched for GO terms including “hydrolase activity” and “cell wall structure,” functions that align with the third layer of resistance, defense-action (Wang et al., 2019). Genes involved in the modification of the cell wall and hydrolase activity have been shown to be involved in plant defense responses (Smith et al., 1988; Smith et al., 1990; Walton, 1994; Minic, 2008). Hydrolase expression has been previously associated with quantitative resistance to P. sojae with specific hydrolases suppressed at 48 hai in the resistant parent Conrad and suppressed at 72 hai in the susceptible parent Sloan (Wang et al., 2012b). The GM_17_D hotspot may be involved in the coordinated regulation of these two modules, and importantly, these co-expressed genes may play a role in limiting pathogen penetration into the cell wall in response to pathogen presence. The dark red and honeydew1 co-expression modules, along with the third co-expression module, grey, were also each enriched for genes involved in the plant hormone signal transduction, MAPK signaling pathway, and PPI pathways, providing evidence for coordinated regulation of expression among each of these defense mechanisms.
The honeydew1 module was further described by its additional enrichment of genes from the phenylpropanoid biosynthesis and isoflavonoid pathways. The role of phenylpropanoid and isoflavonoid in the R-gene-mediated response has been well studied (Graham et al., 2007), including the recent identification of a transcription factor that modulates this response (Jahan et al., 2020). However, the specific role of phenylpropanoid and isoflavonoid pathways in QDR has been more elusive. Gene expression in the honeydew1 module is correlated with increased susceptibility, supporting recent evidence in the cross-talk that occurs between the pathways for R-gene-mediated and QDR. Previous studies showed both SA and JA increasing at inoculated roots, with JA further increased in later time points after inoculation (Stasko et al., 2020; Karhoff et al., 2022). This 24-hai time point could be a critical time as the pathogen switches from hemibiotrophy to the necrotrophic phase (Moy et al., 2004). Several genes in the phenylpropanoid pathway have been identified as playing a role in resistance to P. sojae in soybeans. For example, soybean cinnamate 4-hydrolase (GmC4H1; first hydroxylation step of the phenylpropanoid pathway) was induced at 24 hai in the resistant parent Conrad, and greater colonization of P. sojae was measured in GmC4H1-silenced plants (Yan et al., 2019). Recently, in the wheat-Fusarium graminearum system, it was reported that wheat genotypes with greater levels of resistance had a constitutive expression of genes for plant cell wall biogenesis and terpene biosynthesis (Buerstmayr et al., 2021).
4.3 Genetic regulation of trans-eQTLs in response to the pathogen is predicted to occur through TF and signaling molecules involved in PPI, plant hormone signal transduction, and novel mechanisms of resistance
Numerous studies have proposed that cis-acting mechanisms (i.e., transcription factors) can affect the expression of e-traits at trans-eQTL hotspots (Albert and Kruglyak, 2015; Wang et al., 2017). Thus, cis-eQTLs located near regulatory genes have the potential to be master regulators for these e-traits in a given hotspot (Bryois et al., 2014; Albert and Kruglyak, 2015; Yao et al., 2015). We identified candidate master regulators for the key hotspots that had significant GO or pathway enrichment, were correlated to a co-expression module, and/or were co-localized with phQTL. Of these, four putative master regulators were predicted to function in the PPI pathway as LRR-RLKs, or EF-hand motif proteins.
LRR-RLKs were predicted to be encoded by candidate master regulators for GM_2_B, GM_17F, GM_18, and GM_19. These LRR-RLKs are crucial for plant function and adaptation in numerous processes such as growth and development, as well as responses to abiotic and biotic stresses (Chinchilla et al., 2009; De Smet et al., 2009). Among their numerous functions, LRR-RLKs are known to function in all three layers of defense through the perception of microbe-associated molecular patterns resulting in a basal defense (e.g., FLS2), defense signaling (e.g., SIF2), and defense response (e.g., PEPR2) (Gómez-Gómez and Boller, 2000; Becraft, 2002; Shiu et al., 2004; Zipfel et al., 2006; Yamaguchi et al., 2010; Kemmerling et al., 2011; Soyars et al., 2016; Hohmann et al., 2017; Zipfel and Oldroyd, 2017; Yuan et al., 2018; Wang et al., 2019). LRR-RLKs have been identified as candidates for resistance to Phytophthora spp. in numerous studies including this P. sojae-soybean system (Schneider et al., 2016; Stasko et al., 2016; Rolling et al., 2020).
Two EF-hand motif proteins were each identified as candidate master regulators associated with the PPI pathway for hotspots GM_2_B and GM_15, respectively, with GM_2_B being a hotspot enriched for genes within the PPI pathway. Approximately 250 EF-hand motifs have been identified in plants and are involved with Ca2+, which acts as a messenger that regulates responses to external stimuli, development, and hormones, including plant defense and stress response (Poovaiah and Reddy, 1993; Trewavas and Mahlo, 1998; Reddy and Reddy, 2001; Zielinski, 1998). The majority of Ca2+ sensors in soybeans possess the EF-hand motif and have at least one or more hormone- or stress-response-related cis-elements in their promoter region (Zeng et al., 2017). These hormone- or stress-response-related elements have been characterized by functioning in the regulation of abscisic acid (ABA) signaling, auxin response, ethylene response, and phosphate starvation response. Of these signaling and responses potentially regulated by EF-hand motif encoding genes, ABA has been shown to be a negative regulator of R-gene-mediated resistance (Ward et al., 1989; MacDonald and Cahill, 1999), and auxin has been reported to enhance plant susceptibility to P. sojae in soybean (Stasko et al., 2020) and other pathogens (Wang et al., 2007; Domingo et al., 2009; Kidd et al., 2011). Auxin transporters and auxin-induced proteins have been upregulated in susceptible parents in the P. sojae-soybean pathosystem (Wang et al., 2012b). Auxin transport transcripts of GmPIN were higher in expression in the resistant Conrad following inoculation with P. sojae compared to mock, whereas in the susceptible, fewer GmPIN changed in expression levels (Stasko et al., 2020). Additionally, ethylene-responsive genes have also been known to induce resistance in the P. sojae-soybean pathosystem (Sugano et al., 2013; Zhao et al., 2017), as well as play a role in the regulation of pathogenesis-related gene expression (Lorenzo et al., 2003; Pieterse et al., 2009; Rehman and Mahmood, 2015). Taken together, the EF-hand motif-encoding genes are excellent candidate master regulators for GM_2_B and GM_15.
In addition to these candidate master regulators within the PPI pathway and those that overlap phQTLs, several MYB-TFs were identified as candidate master regulators for GM_11 and GM_19, GM_19_A, and GM_19_B. MYB transcription factors are one of the six major TF families functioning in plant defense (Ng et al., 2018), responding to both abiotic and biotic stresses, and functioning in primary and secondary metabolism (Stracke, 2001; Ambawat et al., 2013), including the regulation of the phenylpropanoid pathway (Liu et al., 2015). Additionally, GmMYB29A2 is essential for the R-gene response to P. sojae in soybeans, regulating the accumulation of glyceollin in Williams 82 (Jahan et al., 2020), and MYB transcripts were also detected by capture-seq from a transcriptome data set of the R-gene response in Williams 82 (Hale et al., 2023b). They are known to act as a positive regulator of hypersensitive response in PCD in response to fungal and bacterial pathogens (Vailleau et al., 2002). Thus, these may be putative master regulators involved with the positive regulation of PCD in the soybean-P. sojae pathosystem.
GM_17_D did not have any cis-eQTLs mapping to this hotspot. However, significant differential expression is not a requirement for a master regulator. For example, hunchback (hb), encoding a ZN-finger TF in Drosophila melanogaster, was identified as a candidate master regulator for mitigation of lead exposure, located near a trans-eQTL hotspot, yet the candidate itself had no e-traits mapped (Qu et al., 2018). Here, we note that the zinc finger TF (Glyma.17G200200) is a candidate master regulator of GM_17_D because it is not only physically located near the hotspot but is also within the honeydew1 co-expression network that is correlated with PRR disease.
In addition to the candidate master regulators functioning in known or hypothesized pathways for QDR, we also identified candidate master regulators that putatively influence novel pathways for QDR. These novel pathways for QDR in P. sojae included secondary metabolite biosynthesis, RNA transport, thioredoxin metabolism (GM_1_B), lysine degradation (Glyma_2_B), reticulon (Lee et al., 2011), starch and sucrose metabolism (GM_13), thymine degradation (GM_15), and a number of serine/threonine protein kinases and phosphatases that impact other metabolic pathways. These candidate master regulators of novel QDR pathways include TFs and signaling molecules that potentially regulate the expression of downstream genes related to hotspots. Further studies will be needed to determine if and how these pathways are playing a role in the P. sojae-soybean pathosystem.
4.4 Co-localization of phQTLs with eQTL points to causal candidate genes for QDR
To identify gene expression variation that may be causal to PRR disease resistance, we focused on those eQTLs that co-localized with phQTLs, indicating a strong link between transcriptional phenotype and the genes underpinning the disease resistance phenotype. Specifically, co-localized cis-eQTLs, the genes regulating co-localized trans-eQTLs, or trans-eQTL hotspots may be causal for resistance to PRR.
While none of the four cis-eQTLs co-localized with phQTL_1 have obvious functions in quantitative disease resistance, the hotspot GM_1_B, which neighbors phQTL_1, is enriched for genes functioning in PPI pathways, making regulators of this hotspot viable causal genes for phQTL_1. Three cis-eQTLs were identified as candidate master regulators for this hotspot: Glyma.01G156600, Glyma.01G156200, and Glyma.01G156700. These genes are predicted to encode a thioredoxin reductase, a membrane transport protein, and a hydroxymethylglutaryl-CoA reductase, respectively. The predicted thioredoxin reductase (Glyma.01G156600) is of interest given the role of thioredoxin in disease resistance and potentially QDR to P. sojae, with thioredoxin-encoding genes identified as candidate genes for several quantitative disease resistance loci (QDRL) towards P. sojae (Huang et al., 2016; Stasko et al., 2016). Additionally, a thioredoxin-encoding gene has been shown to be the causal gene for resistance at the Scmv1 phQTL for sugarcane mosaic virus in maize (Liu et al., 2017). The predicted membrane transport protein encoded by Glyma.01G156200 is an auxin efflux carrier. Auxin has been previously described in numerous studies as being involved in susceptibility to plant pathogens (Wang et al., 2007; Domingo et al., 2009; Kidd et al., 2011; Pieterse et al., 2012). Finally, hydroxymethylglutaryl-CoA reductase, predicted to be encoded by Glyma.01G156700, is involved in terpenoid and secondary metabolite biosynthesis (Antolin-Llovera et al., 2011). Thus, these potential master regulators for the Gm_1_B hotspot may represent the causal genetic variation for phQTL_1.
The phQTL_18b was co-localized with two eQTLs controlling the expression of Glyma.18G270900 and Glyma.08g249200 in cis and trans, respectively, each putatively encoding a malectin/receptor-like protein kinase. In Arabidopsis, the homolog of these genes, FERONIA, has been experimentally shown to have multiple functions, including as a modulator of ethylene response (Deslauriers and Larsen, 2010) and in reactive oxygen species (ROS)-mediated root hair development (Duan et al., 2010). ROS is a well-known mediator of stress-induced responses and functions in growth and development (Werner, 2004; Swanson and Gilroy, 2010; Torres, 2010). FERONIA also functions to inhibit jasmonic acid (JA) signaling through phosphorylation of the transcription factor MYC2 in Arabidopsis (Guo et al., 2018). In soybean, a role for JA was proposed in the later stages of infection by P. sojae (Stasko et al., 2020). The JA pathway was suppressed in incompatible R-gene reactions to P. sojae (Lin et al., 2014), and JA accumulation significantly increased in P. sojae-inoculated susceptible lines in contrast to the mock-inoculated and to lines with quantitative resistance alleles (Karhoff et al., 2022).
In addition to co-localization with the three hotspots (GM_19, GM_19_A, and GM_19_B), phQTL_19b co-localized with both the mock and inoculated cis-eQTLs for the Glyma.19G224300 e-traits. This inoculated cis-eQTL is also part of the GM_19_B eQTL hotspot. The e-traits for Glyma.19G224300 represented one of only two pairs of e-QTLs that were found under both mock and inoculated conditions, indicating possible constitutive control of both GM_19_B and of phQTL_19b. Glyma.19G224300 is predicted to encode a germin-like protein (GLP). Among their functions, GLPs can be involved in response to abiotic stress (Barman and Banerjee, 2015). In Arabidopsis, upregulation of the Glyma.19G224300 homolog AT1G09560 results in reduced primary root and enhanced lateral root growth (Ham et al., 2012). Glyma.19G224300 may function in root architecture, providing constitutive quantitative resistance to P. sojae, with the differences in disease resulting from expression changes mapping to GM_19_B.
5 Concluding remarks
This vast transcriptional reprogramming due to pathogen infection compared to the nondisease state had not been previously explored through eQTL methodology using RNA-sequencing data in this host–pathogen system. Ultimately, this study identified gene co-expression modules associated with resistance and susceptibility to P. sojae in this RIL population. Clearly, the transcriptional response to this pathogen is complex, as there were more than 100-fold greater number of eQTLs in the inoculated compared to the mock treatment, as well as a predominance of trans-eQTLs in the inoculated over the mock treatment. Further evidence supporting cell wall structure, auxin response, jasmonic acid signaling, and PPI receptor and signaling genes as mechanisms of resistance are provided, as well as several new potential mechanisms for regulating resistance as well as potential susceptibility factors. Further confirmation of the candidate genes regulating trans-eQTLs and/or acting as the causal variation of phQTLs will need to be explored through functional studies. The development of this large dataset and analyses through co-expression networks, eQTLs, and phQTLs have the potential to be expanded to elucidate more biologically relevant information on P. sojae infection as well as constitutive differences between two cultivars.
Data availability statement
The datasets presented in this study can be found in online repositories. The names of the repository/repositories and accession number(s) can be found below: https://www.ncbi.nlm.nih.gov/, PRJNA478334.
Author contributions
CM: Data curation, Formal analysis, Investigation, Methodology, Visualization, Writing – original draft, Writing – review & editing. SW: Formal analysis, Methodology, Supervision, Writing – review & editing. SK: Formal analysis, Investigation, Writing – original draft, Writing – review & editing. BC: Conceptualization, Funding acquisition, Investigation, Writing – review & editing. LM: Conceptualization, Methodology, Supervision, Writing – original draft, Writing – review & editing. AD: Methodology, Resources, Supervision, Writing – original draft, Writing – review & editing.
Funding
The author(s) declare financial support was received for the research, authorship, and/or publication of this article. Funding for this project was provided by the Ohio Soybean Council (projects Nos. 14-2-18, 17-2-03, 16-R-06, 17-R-03, and 18-R-05); the United Soybean Board (project No. 1720-172-0125); The Ohio State University Center for Applied Plant Sciences and Molecular and Cellular Imaging Center; State and Federal funds appropriated to The Ohio State University, College of Food, Agricultural, and Environmental Sciences; the National Institute of Food and Agriculture, U.S. Department of Agriculture Hatch projects for Development of Disease Management Strategies for Soybean Pathogens in Ohio OHO01303; and the Genetic Analysis of Soybean Added-Value Traits and Soybean Variety Development for Ohio OHO01279.
Acknowledgments
We wish to thank Kelsey Scott, Linda Webber, Krystel Navarro, Deloris Veney, and Gabrielle Hayward-Lara for assistance in inoculation, tissue collection, and RNA extraction of the recombinant inbred lines. We would also like to thank Drs. Anna Stasko and William Rolling for their communication of data derived from previous and ongoing studies and Layne Connolly for editing.
Conflict of interest
The authors declare that the research was conducted in the absence of any commercial or financial relationships that could be construed as a potential conflict of interest.
Publisher’s note
All claims expressed in this article are solely those of the authors and do not necessarily represent those of their affiliated organizations, or those of the publisher, the editors and the reviewers. Any product that may be evaluated in this article, or claim that may be made by its manufacturer, is not guaranteed or endorsed by the publisher.
Supplementary material
The Supplementary Material for this article can be found online at: https://www.frontiersin.org/articles/10.3389/fpls.2023.1277585/full#supplementary-material
Methods M1 | Constructing 20 networks to use as reference networks for input into module consensus analysis R script.
Methods M2 | Creating consensus network from two selected reference modules R script.
Methods M3 | Correlation of hotspots to co-expression modules R script.
References
Abbasi, P. A., Graham, M. Y., Graham, T. L. (2001). Effects of soybean genotype on the glyceollin elicitation competency of cotyledon tissues to Phytophthora sojae glucan elicitors. Physiol. Mol. Plant Pathol. 59, 95–105. doi: 10.1006/pmpp.2001.0342
Abeysekara, N. S., Matthiesen, R. L., Cianzio, S. R., Bhattacharyya, M. K., Robertson, A. E. (2016). Novel sources of partial resistance against Phytophthora sojae in soybean PI 399036. Crop Sci. 56, 2322–2335. doi: 10.2135/cropsci2015.09.0578
Acharjee, A., Chibon, P., Kloosterman, B., America, T., Renaut, J., Maliepaard, C., et al. (2018). Genetical genomics of quality related traits in potato tubers using proteomics. BMC Plant Biol. 18, 20. doi: 10.1186/s12870-018-1229-1
Albert, F. W., Kruglyak, L. (2015). The role of regulatory variation in complex traits and disease. Nat. Rev. Genet. 16, 197–212. doi: 10.1038/nrg3891
Ambawat, S., Sharma, P., Yadav, N. R., Yadav, R. C. (2013). MYB transcription factor genes as regulators for plant responses: an overview. Physiol. Mol. Biol. Plants 19, 307–321. doi: 10.1007/s12298-013-0179-1
Andrews, S. (2010). FastQC: A quality control tool for high throughput sequence data. Available at: http://www.bioinformatics.babraham.ac.uk/projects/fastqc/.
Antolin-Llovera, M., Leivar, P., Arro, M., Ferrer, A., Boronat, A., Campos, N. (2011). Modulation of plant HMG-CoA reductase by protein phosphates 2A positive and negative control at a key node of metabolism. Plant Signal Behav. 8, 1127–1131. doi: 10.4161/psb.6.8.16363
Arahana, V. S., Graef, G. L., Specht, J. E., Steadman., J. R., Eskridge, K. M. (2001). Identification of QTLs for resistance to Sclerotinia sclerotiorum in soybean. Crop. Sci. 41, 180–188. doi: 10.2135/cropsci2001.411180x
Ausubel, F. M. (2005). Are innate immune signaling pathways in plants and animals conserved? Nat. Immunol. 6, 973–979. doi: 10.1038/ni1253
Barman, A. R., Banerjee, J. (2015). Versatility of germin-like proteins in their sequences, expressions, and functions. Funct. Integ. Genomics 15, 533–548. doi: 10.1007/s10142-015-0454-z
Barrett, J. C., Fry, B., Maller, J., Daly, M. J. (2005). Haploview: Analysis and visualization of LD and haplotype maps. Bioinformatics 21, 263–265. doi: 10.1093/bioinformatics/bth457
Bates, D., Maechler, M., Bolker, B., Walker, S. (2014). Fitting linear mixed-effects models using lme4. J. Stat. Software 67, 1–48. doi: 10.48550/arXiv.1406.5823
Bayless, A. M., Zapotocony, R. W., Grunwald, D. J., Amundson, K. K., Diers, B. W., Bent, A. F. (2018). An atypical N-ethylmaleimide sensitive factor enables the viability of nematode-resistant Rhg1 soybeans. Proc. Natl. Acad. Sci. U.S.A. 115, E4512–E4521. doi: 10.1073/pnas.1717070115
Becraft, P. W. (2002). Receptor kinase signaling in plant development. Annu. Rev. Cell Dev. Biol. 18, 163–192. doi: 10.1146/annurev.cellbio.18.012502.083431
Benjamini, Y., Hochberg, Y. (1995). Controlling the false discovery rate: A practical and powerful approach to multiple testing. J. R. Stat. Soc.: Ser. B (Methodological) 57, 289–300. doi: 10.1111/j.2517-6161.1995.tb02031.x
Boller, T., Felix, G. (2009). A renaissance of elicitors: perception of microbe-associated molecular patterns and danger signals by pattern-recognition receptors. Annu. Rev. Plant Biol. 60, 379–406. doi: 10.1146/annurev.arplant.57.032905.105346
Bolon, Y. T., Hyten, D. L., Orf, J. H., Vance, C. P., Muehlbauer, G. J. (2014). eQTL Networks reveal complex genetic architecture in the immature soybean seed. Plant Genome 7, 1–14. doi: 10.3835/plantgenome2013.08.0027
Broman, K. W., Wu, H., Sen, Ś., Churchill, G. A. (2003). R/qtl: QTL mapping in experimental crosses. Bioinformatics 19, 889–890. doi: 10.1093/bioinformatics/btg112
Bryois, J., Buil, A., Evans, D. M., Kemp, J. P., Montgomery, S. B., Conrad, D. F., et al. (2014). Cis and trans effects of human genomic variants on gene expression. PLoS Genet. 10, e1004461. doi: 10.1371/journal.pgen.1004461
Buerstmayr, M., Wagner, C., Nosenko, T., Omony, J., Steiner, B., Nussbaumer, T., et al. (2021). Fusarium head blight resistance in European winter wheat: insights from genome-wide transcriptome analysis. BMC Genomics 22, 1–17. doi: 10.1186/s12864-021-07800-1
Burnham, K. D., Dorrance, A. E., VanToai, T. T., St. Martin, S. K. (2003). Quantitative trait loci for partial resistance to Phytophthora sojae in soybean. Crop Sci. 43, 1610–1617. doi: 10.2135/cropsci2003.1610
Bushnell, B. (2014). BBMap: A fast, accurate, splice-aware aligner (Berkeley, CA: Ernest Orlando Lawrence Berkeley National Laboratory). Available at: https://www.osti.gov/servlets/purl/1241166.
Chen, X., Hackett, C. A., Niks, R. E., Gedley, P., Booth, C., Druka, A., et al. (2010). An eQTL analysis of partial resistance to Puccinia hordei in barley. PLoS One 5, e8598. doi: 10.1371/journal.pone.0008598
Cheng, Q., Li, N., Dong, L., Zhang, D., Fan, S., Jiang, L., et al. (2015). Overexpression of soybean isoflavone reductase (GmIFR) enhances resistance to Phytophthora sojae in soybean. Front. Plant Sci. 6. doi: 10.3389/fpls.2015.01024
Chinchilla, D., Shan, L., He, P., de Vries, S., Kemmerling, B. (2009). One for all: The receptor-associated kinase BAK1. Trends Plant Sci. 14, 535–541. doi: 10.1016/j.tplants.2009.08.002
Chisholm, S. T., Coaker, G., Day, B., Staskawicz, B. J. (2006). Host-microbe interactions: shaping the evolution of the plant immune response. Cell 124, 803–814. doi: 10.1016/j.cell.2006.02.008
Christie, N., Myburg, A. A., Joubert, F., Murrasy, S. L., Carstens, M., Lin, Y. C., et al. (2017). Systems genetics reveals a transcriptional network associated with susceptibility in the maize-grey leaf spot pathosystem. Plant J. 89, 746–763. doi: 10.1111/tpj.13419
Cook, D. E., Bayless, A. M., Wang, K., Guo, X., Song, Q., Jiang, J., et al. (2014). Distinct copy number, coding sequence, and locus methylation patterns underlie Rhg1-mediated soybean resistance to soybean cyst nematode. Plant Physiol. 165, 630–647. doi: 10.1104/pp.114.235952
Cook, D. E., Lee, T. G., Guo, X., Meltio, S., Wang, K., Bayless, A. M., et al. (2012). Copy number variation of multiple genes at Rhg1 mediates nematode resistance in soybean. Science 338, 1206–1209. doi: 10.1126/science.1228746
Corwin, J. A., Copeland, D., Feusier, J., Subedy, A., Eshbaugh, R., Palmer, C., et al. (2016). The quantitative basis of the Arabidopsis innate immune system to endemic pathogens depends on pathogen genetics. PLoS Genet. 12, e1005789. doi: 10.1371/journal.pgen.1005789
Corwin, J. A., Kliebenstein, D. J. (2017). Quantitative resistance: More than just perception of a pathogen. Plant Cell 29, 655–665. doi: 10.1105/tpc.16.00915
Cui, H., Tsuda, K., Parker, J. E. (2015). Effector-triggered immunity: from pathogen perception to robust defense. Annu. Rev. Plant Biol. 66, 487–511. doi: 10.1146/annurev-arplant-050213-040012
Dastmalchi, M., Chapman, P., Yu, J., Austin, R. S., Dhaubhadel, S. (2017). Transcriptomic evidence for the control of soybean root isoflavonoid content by regulation of overlapping phenylpropanoid pathways. BMC Genomics 18, 1–15. doi: 10.1186/s12864-016-3463-y
de Ronne, M., Santhanam, P., Cinget, B., Labbé, C., Lebreton, A., Ye, H., et al. (2022). Mapping of partial resistance to Phytophthora sojae in soybean PIs using whole-genome sequencing reveals a major QTL. Plant Genome 15, e20184. doi: 10.1002/tpg2.20184
Deslauriers, S. D., Larsen, P. B. (2010). FERONIA is a key modulator of brassinosteroid and ethylene responsiveness in Arabidopsis hypocotyls. Mol. Plant 3, 626–640. doi: 10.1093/mp/ssq015
De Smet, I., Voss, U., Jürgens, G., Beeckman, T. (2009). Receptor-like kinases shape the plant. Nat. Cell Biol. 11, 1166–1173. doi: 10.1038/ncb1009-1166
Dodds, P. N., Rathjen, J. P. (2010). Plant immunity: towards an integrated view of plant-pathogen interactions. Nat. Rev. Genet. 11, 539–548. doi: 10.1038/nrg2812
Domingo, C., Andrés, F., Tharreau, D., Iglesias, D. J., Talón, M. (2009). Constitutive expression of OsGH3.1 reduces auxin content and enhances defense response and resistance to a fungal pathogen in rice. Mol. Plant Microbe Interact. 22, 201–210. doi: 10.1094/MPMI-22-2-0201
Dorrance, A. E., Robertson, A. E., Cianzo, S., Giesler, L. J., Grau, C. R., Draper, M. A., et al. (2009). Integrated management strategies for Phytophthora sojae combining host resistance and seed treatments. Plant Dis. 93, 875–882. doi: 10.1094/PDIS-93-9-0875
Druka, A., Potokina, E., Luo, Z., Bonar, N., Druka, I., Zhang, L., et al. (2008). Exploiting regulatory variation to identify genes underlying quantitative resistance to the wheat stem rust pathogen Puccinia graminis f. sp. tritici in barley. Theor. Appl. Genet. 117, 261–272. doi: 10.1007/s00122-008-0771-x
Druka, A., Potokina, E., Luo, Z., Jiang, N., Chen, X., Kearsey, M., et al. (2010). Expression quantitative trait loci analysis in plants. J. Plant Biotechnol. 8, 10–27. doi: 10.1111/j.1467-7652.2009.00460.x
Duan, Q., Kita, D., Li, C., Cheung, A. Y., Wu, H. M. (2010). FERONIA receptor-like kinase regulates RHO GTPase signaling of root hair development. Proc. Natl. Acad. Sci. 107, 17821–17826. doi: 10.1073/pnas.1005366107
Feltus, F. A. (2014). Systems genetics: A paradigm to improve discovery of candidate genes and mechanisms underlying complex traits. Plant Sci. 223, 45–48. doi: 10.1016/j.plantsci.2014.03.003
Fisher, R. A. (1935). The logic of inductive inference. J. R. Stat. Soc. 98, 39–82. doi: 10.2307/2342435
Franceschini, A., Szklarczyk, D., Frankild, S., Kuhn, M., Simonovic, M., Roth, A., et al. (2012). STRING V9.1: Protein-protein interaction networks, with increased coverage and integration. Nucleic Acids Res. 41, D808–D815. doi: 10.1093/nar/gks1094
French, E., Kim, B. S., Iyer-Pascuzzi, A. S. (2016). Mechanisms of quantitative disease resistance in plants. Semin. Cell Dev. Biol. 56, 201–208. doi: 10.1016/j.semcdb.2016.05.015
Gassmann, W., Bhattacharjee, S. (2012). Effector-triggered immunity signaling: from gene-for-gene pathways to protein-protein interaction networks. Mol. Plant Microbe Interact. 25, 862–868. doi: 10.1094/MPMI-01-12-0024-IA
Glazebrook, J. (2005). Contrasting mechanisms of defense against biotrophic and necrotrophic pathogens. Annu. Rev. Phytopathol. 43, 205–227. doi: 10.1146/annurev.phyto.43.040204.135923
Gómez-Gómez, L., Boller, T. (2000). FLS2: An LRR receptor-like kinase involved in the perception of the bacterial elicitor flagellin in Arabidopsis. Mol. Cell 5, 1003–1011. doi: 10.1016/s1097-2765(00)80265-8
Graham, T. L., Graham, M. Y., Subramanian, S., Yu, O. (2007). RNAi silencing of genes for elicitation or biosynthesis of 5-deoxyisoflavonoids suppresses race-specific resistance and hypersensitive cell death in Phytophthora sojae infected tissues. Plant Physiol. 144, 728–740. doi: 10.1104/pp.107.097865
Graham, M. Y., Weidner, J., Wheeler, K., Pelow, M. L., Graham, T. L. (2003). Induced expression of pathogenesis-related protein genes in soybean by wounding and the Phytophthora sojae cell wall glucan elicitor. Mol. Plant Pathol. 63, 141–149. doi: 10.1016/j.pmpp.2003.11.002
Grau, C. R., Dorrance, A. E., Bond, J., Russin, J. S. (2004). “Fungal diseases,” in Soybeans: Improvement, Production, and Uses. Eds. Shibles, R. M., Harper, J. E., Wilson, R. F., Shoemaker, R. C. (Madison, WI: American Society of Agronomy, Inc), 679–763. doi: 10.2134/agronmonogr16.3ed.c14
Green, B. F., Tukey, J. W. (1960). Complex analyses of variance: general problems. Psychometrika 25, 127–152. doi: 10.1007/BF02288577
Guo, H., Nolan, T. M., Song, G., Liu, S., Xie, Z., Chen, J., et al. (2018). FERONIA receptor kinase contributes to plant immunity by suppressing jasmonic acid signaling in Arabidopsis thaliana. Curr. Biol. 28, 3316–3324. doi: 10.1016/j.cub.2018.07.078
Guo, X., Wang, D., Gordon, S. G., Helliwell, E., Smith, T., Berry, S. A., et al. (2008). Genetic mapping of QTLs underlying partial resistance to Sclerotinia sclerotiorum in soybean PI 391589A and PI 391589B. Crop Sci. 48, 1129–1139. doi: 10.2135/cropsci2007.04.0198
Hale, B., Brown, E., Wijeratne, A. (2023a). An updated assessment of the soybean-Phytophthora sojae pathosystem. Plant Pathology. 72, 843–860. doi: 10.1111/ppa.13713
Hale, B., Ratnayake, S., Flory, A., Wijeratne, R., Schmidt, C., Robertson, A. E., et al. (2023b). Gene regulatory network inference in soybean upon infection by Phytophthora sojae. PLoS One 18, e0287590. doi: 10.1371/journal.pone.0287590
Ham, B. K., Li, G., Kang, B. H., Zeng, F., Lucas, W. J. (2012). Overexpression of Arabidopsis plasmodesmata germin-like proteins disrupts root growth and development. Plant Cell 24, 3630–3648. doi: 10.1105/tpc.112.101063
Hammond, J. P., Mayes, S., Bowen, H. C., Chram, N. S., Hayden, R. M., Love, C. G., et al. (2011). Regulatory hotspots are associated with plant gene expression under varying soil phosphorus supply in Brassica rapa. Plant Physiol. 156, 1230–1241. doi: 10.1104/pp.111.175612
Han, Y., Teng, W., Yu, K., Poysa, V., Anderson, T., Qiu, L., et al. (2008). Mapping QTL tolerance to Phytophthora root rot in soybean using microsatellite and RAPD/SCAR derived markers. Euphytica 162, 231–239. doi: 10.1007/s10681-007-9558-4
Hohmann, U., Lau, K., Hothorn, M. (2017). The structural basis of ligand perception and signal activation by receptor kinases. Annu. Rev. Plant Biol. 68, 109–137. doi: 10.1146/annurev-arplant-042916-040957
Huang, J., Guo, N., Li, Y., Sun, J., Hu, G., Zhang, H., et al. (2016). Phenotypic evaluation and genetic dissection of resistance to Phytophthora sojae in the Chinese soybean mini core collection. BMC Genet. 17, 85. doi: 10.1186/s12863-016-0383-4
Huber, W., Carey, V. J., Gentleman, R., Anders, S., Carlson, M., Carvalho, B. S., et al. (2015). Orchestrating high-throughput genomic analysis with Bioconductor. Nat. Methods 12, 115–121. doi: 10.1038/nmeth.3252
Hubner, N., Wallace, C. A., Zimdahl, H., Petretto, E., Schulz, H., Maciver, F., et al. (2005). Integrated transcriptional profiling and linkage analysis for identification of genes underlying disease. Nat. Genet. 37, 243–253. doi: 10.1038/ng1522
Imholte, G. C., Scott-Boyer, M. P., Labbe, A., Deschepper, C. F., Gottardo, R. (2013). iBMQ: R/Bioconductor package for integrated Bayesian modeling of eQTL data. Bioinformatics 29, 2797–2798. doi: 10.1093/bioinformatics/btt485
Jahan, M. A., Harris, B., Lowery, M., Infante, A. M., Percifield, R. J., Kovinich, N. (2020). Glyceollin transcription factor GmMYB29A2 regulates soybean resistance to Phytophthora sojae. Plant Physiol. 183, 530–546. doi: 10.1104/pp.19.01293
Jansen, R. C., Nap, J. P. (2001). Genetical genomics: The added value from segregation. Trends Genet. 17, 388–391. doi: 10.1016/S0168-9525(01)02310-1
Jansen, R. C., Tesson, B. M., Fu, J., Yang, Y., McIntyre, L. M. (2009). Defining gene and QTL networks. Curr. Opin. Plant Biol. 12, 241–246. doi: 10.1016/j.pbi.2009.01.003
Jones, J. D., Dangl, J. L. (2006). The plant immune system. Nature 444, 323–329. doi: 10.1038/nature05286
Jun, T. H., Mian, M. A. R., Kang, S. T., Michel, A. P. (2012). Genetic mapping of the powdery mildew resistance gene in soybean PI 567301B. Theor. Appl. Genet. 125, 1159–1168. doi: 10.1007/s00122-012-1902-y
Kanehisa, M., Goto, S. (2000). KEGG: Kyoto encyclopedia of genes and genomes. Nucleic Acids Res. 28, 27–30. doi: 10.1093/nar/28.1.27
Karhoff, S., Vargas-Garcia, C., Lee, S., Mian, M. A. R., Graham, M. A., Dorrance, A. E., et al. (2022). Identification of candidate genes for a major quantitative disease resistance locus from soybean PI 427105B for resistance to Phytophthora sojae. Front. Plant Sci. 13. doi: 10.3389/fpls.2022.893652
Kemmerling, B., Halter, T., Mazzotta, S., Mosher, S., Nürnberger, T. (2011). A genome-wide survey for Arabidopsis leucine-rich repeat receptor kinases implicated in plant immunity. Front. Plant Sci. 2. doi: 10.3389/fpls.2011.00088
Keurentjes, J. J. B., Fu, J., Terpstra, I. R., Garcia, J. M., van den Ackerveken, G., Snoek, L. B., et al. (2007). Regulatory network construction in Arabidopsis by using genome-wide gene expression quantitative trait loci. Proc. Natl. Acad. Sci. U.S.A. 104, 1708–1713. doi: 10.1073/pnas.0610429104
Kidd, B. N., Kadoo, N. Y., Dombrecht, B., Tekeoglu, M., Gardiner, D. M., Thatcher, L. F., et al. (2011). Auxin signaling and transport promote susceptibility to the root-infecting fungal pathogen Fusarium oxysporum in Arabidopsis. Mol. Plant Microbe Interact. 24, 733–748. doi: 10.1094/MPMI-08-10-0194
Kim, H., Diers, B. (2000). Inheritance of partial resistance to Sclerotinia stem rot in soybean. Crop Sci. 40, 55–61. doi: 10.2135/cropsci2000.40155x
Kliebenstein, D. (2009). Quantitative genomics: Analyzing intraspecific variation using global gene expression polymorphisms or eQTLs. Annu. Rev. Plant Biol. 60, 93–114. doi: 10.1146/annurev.arplant.043008.092114
Langfelder, P., Horvath, S. (2007). Eigengene networks for studying the relationships between co-expression modules. BMC Syst. Biol. 1, 1–17. doi: 10.1186/1752-0509-1-54
Langfelder, P., Horvath, S. (2008). WGCNA: An R package for weighted correlation network analysis. BMC Bioinf. 9, 559. doi: 10.1186/1471-2105-9-559
Lee, H. Y., Bowen, C. H., Popescu, G. V., Kang, H.-G., Kato, N., Ma, S., et al. (2011). Arabidopsis RTNLB1 and RTNLB2 reticulon-like proteins regulate intracellular trafficking and activity of the FLS2 immune receptor. Plant Cell. 9, 3374–3391. doi: 10.1105/tpc.111.089656
Lee, S., Mian, M. A. R., McHale, L. K., Sneller, C. H., Dorrance, A. E. (2013a). Identification of quantitative trait loci conditioning partial resistance to Phytophthora sojae in soybean PI 407861A. Crop Sci. 53, 1022–1031. doi: 10.2135/cropsci2012.10.0578
Lee, S., Mian, M. A. R., McHale, L. K., Wang, H., Wijeratne, A. J., Sneller, et al. (2013b). Novel quantitative trait loci for partial resistance to Phytophthora sojae in soybean PI 398841. Theor. Appl. Genet. 126, 1121–1132. doi: 10.1007/s00122-013-2040-x
Lee, S., Mian, M. A. R., Sneller, C. H., Wang, H., Dorrance, A. E., McHale, L. K. (2014). Joint linkage QTL analyses for partial resistance to Phytophthora sojae in soybean using six nested inbred populations with heterogeneous conditions. Theor. Appl. Genet. 127, 429–444. doi: 10.1007/s00122-013-2229-z
Li, Z. (2019). “Molecular analysis of epistasis affecting complex traits,” in Molecular Dissection of Complex Traits. Ed. Patterson, A. H. (Boca Raton, FL: CRC Press), 119–130. doi: 10.1201/9780429117770-8
Li, X., Han, Y., Teng, W., Zhang, A., Yu, K., Poysa, V., et al. (2010). Pyramided QTL underlying tolerance to Phytophthora root rot in mega-environments from soybean cultivars “Conrad” and “Hefeng 25”. Theor. Appl. Genet. 121, 651–658. doi: 10.1007/s00122-010-1337-2
Li, R., Jeong, K., Davis, J. T., Kim, S., Lee, S., Michelmore, R. W., et al. (2018). Integrated QTL and eQTL mapping provides insights and candidate genes for fatty acid composition, flowering time, and growth traits in a F2 population of a novel synthetic allopolyploid Brassica napus. Front. Plant Sci. 9. doi: 10.3389/fpls.2018.01632
Liao, Y., Smyth, G. K., Shi, W. (2014). featureCounts: An efficient general purpose program for assigning sequence reads to genomic features. Bioinformatics 30, 923–930. doi: 10.1093/bioinformatics/btt656
Lin, F., Chhapekar, S. S., Vieira, C. C., Da Silva, M. P., Rojas, A., Lee, D., et al. (2022). Breeding for disease resistance in soybean: a global perspective. Theor. Appl. Gen. 135 (11), 3773–3872. doi: 10.1007/s00122-022-04101-3
Lin, F., Zhao, M., Baumann, D. D., Ping, J., Sun, L., Liu, Y., et al. (2014). Molecular response to the pathogen Phytophthora sojae among ten soybean near isogenic lines revealed by comparative transcriptomics. BMC Genomics 15, 18. doi: 10.1186/1471-2164-15-18
Liu, Q., Liu, H., Gong, Y., Tao, Y., Jiang, L., Zuo, W., et al. (2017). An atypical thioredoxin imparts early resistance to Sugarcane mosaic virus in maize. Mol. Plant 10, 483–497. doi: 10.1016/j.molp.2017.02.002
Liu, J., Osbourn, A., Ma, P. (2015). MYB transcription factors regulators of phenylpropanoid metabolism in plants. Mol. Plant 8, 689–708. doi: 10.1016/j.molp.2015.03.012
Lorenzo, O., Piqueras, R., Sanchez-Serrano, J. J., Solano, R. (2003). Ethylene response factor 1 integrates signals from ethylene and jasmonate pathways in plant defense. Plant Cell 15, 165–178. doi: 10.1105/tpc.007468
Lygin, A. V., Zernova, O. V., Hill, C. B., Kholina, N. A., Widholm, J. M., Hartman, G. L., et al. (2013). Glyceollin is an important component of soybean plant defense against Phytophthora sojae and Macrophomina phaseolina. Phytopathology 103, 984–994. doi: 10.1094/PHYTO-12-12-0328-R
MacDonald, K. L., Cahill, D. M. (1999). Influence of abscisic acid and the abscisic acid biosynthesis inhibitor, norflurazon, on interactions between Phytophthora sojae and soybean (Glycine max). Eur. J. Plant Pathol. 60, 185–195. doi: 10.1023/A:1008705321113
Mideros, S., Nita, M., Dorrance, A. E. (2007). Characterization of components of partial resistance, Rps2, and root resistance to Phytophthora sojae in soybean. Phytopathology 97, 655–662. doi: 10.1094/PHYTO-97-5-0655
Minic, Z. (2008). Physiological roles of plant glycoside hydrolases. Planta 227, 723–740. doi: 10.1007/s00425-007-0668-y
Mohr, P. G., Cahill, D. M. (2001). Relative roles of glyceollin, lignin and the hypersensitive response and the influence of ABA incompatible and incompatible interactions of soybeans with Phytophthora sojae. Physiol. Mol. Plant Pathol. 58, 31–41. doi: 10.1006/pmpp.2000.0306
Moscou, M. J., Lauter, N., Steffenson, B., Wise, R. P. (2011). Quantitative and qualitative stem rust resistance factors in barley are associated with transcriptional suppression of defense regulons. PLoS Genet. 7, e1002208. doi: 10.1371/journal.pgen.1002208
Moy, P., Qutob, D., Chapman, B. P., Atkinson, I., Gijzen, M. (2004). Patterns of gene expression upon infection of soybean plants by Phytophthora sojae. Mol. Plant Microbe Interact. 17, 1051–1062. doi: 10.1094/MPMI.2004.17.10.1051
Naveed, Z. A., Wei, X., Chen, J., Mubeen, H., Ali, G. S. (2020). The PTI to ETI continuum in Phytophthora-plant interactions. Front. Plant Sci. 11. doi: 10.3389/fpls.2020.593905
Nelson, R., Wiesner-Hanks, T., Wisser, R., Balint-Kurti, P. (2018). Navigating complexity to breed disease-resistant crops. Nat. Rev. Genet. 19, 21–33. doi: 10.1038/nrg.2017.82
Neto, E. C., Keller, M. P., Broman, A. F., Attie, A. D., Jansen, R. C., Broman, K. W., et al. (2012). Quantile-based permutation thresholds for quantitative trait loci hotspots. Genetics 191, 1355–1365. doi: 10.1534/genetics.112.139451
Ng, D. K., Abeysinghe, J. K., Kamali, M. (2018). Regulating the regulators: The control of transcription factors in plant defense signaling. Int. J. Mol. Sci. 19, 3737. doi: 10.3390/ijms19123737
Nguyen, V. T., Vuong, T. D., VanToai, T., Lee, J. D., Wu, X., Rouf Mian, M. A., et al. (2012). Mapping of quantitative trait loci associated with resistance to Phytophthora sojae and flooding tolerance in soybean. Crop Sci. 52, 2481–2493. doi: 10.2135/cropsci2011.09.0466
Niks, R. E., Qi, X. Q., Marcel, T. C. (2015). Quantitative resistance to biotrophic filamentous plant pathogens: concepts, misconceptions, and mechanisms. Annu. Rev. Phytopathol. 53, 445–470. doi: 10.1146/annurev-phyto-080614-115928
Pieterse, C., Leon-Reyes, A., van der Ent, S., Van Wees, S. (2009). Networking by small-molecule hormones in plant immunity. Nat. Chem. Biol. 5, 308–316. doi: 10.1038/nchembio.164
Pieterse, C. M., van der Does, D., Zamioudis, C., Leon-Reyes, A., Van Wees, S. C. (2012). Hormonal modulation of plant immunity. Ann. Rev. Cell Dev. Biol. 28, 489–521. doi: 10.1146/annurev-cellbio-092910-154055
Pilet-Nayel, M. L., Moury, B., Caffier, V., Montarry, J., Kerlan, M. C., Fournet, S., et al. (2017). Quantitative resistance to plant pathogens in pyramiding strategies for durable crop protection. Front. Plant Sci. 8. doi: 10.3389/fpls.2017.01838
Poland, J. A., Balint-Kurti, P. J., Wisser, R. J., Pratt, R. C., Nelson, R. J. (2009). Shades of gray: The world of quantitative disease resistance. Trends Plant Sci. 14, 21–29. doi: 10.1016/j.tplants.2008.10.006
Poovaiah, B. W., Reddy, A. S. (1993). Calcium and signal transduction in plants. CRC Crit. Rev. Plant Sci. 12, 185–211. doi: 10.1080/07352689309701901
Potokina, E., Druka, A., Luo, Z., Wise, R., Waugh, R., Kearsey, M. (2008). Gene expression quantitative trait locus analysis of 16,000 barley genes reveals a complex pattern of genome-wide transcriptional regulation. Plant J. 53, 90–101. doi: 10.1111/j.1365-313X.2007.03315.x
Qu, W., Gurdziel, K., Pique-Regi, R., Ruden, D. M. (2018). Lead modulated trans- and cis- expression quantitative trait loci (eQTLs) in Drosophila melanogaster heads. Front. Genet. 9. doi: 10.3389/fgene.2018.00395
Ranathunge, K., Thomas, R. H., Fang, X., Peterson, C. A., Gijzen, M., Bernards, M. A. (2008). Soybean root suberin and partial resistance to root rot caused by Phytophthora sojae. Phytopathology 98, 1179–1189. doi: 10.1094/PHYTO-98-11-1179
R Core Team. (2018). R: A language and environment for statistical computing (Vienna, Austria: R Foundation for Statistical Computing). Available at: https://www.R-project.org/.
Reddy, A. S. N., Reddy, V. (2001). “Calcium as a messenger in stress signal transduction,” in Handbook of Plant and Crop Physiology. Ed. Pessarakali, M. (Boca Raton, FL: CRC Press), 697–732. doi: 10.1201/9780203908426.ch35
Rehman, S., Mahmood, T. (2015). Functional role of DREB and ERF transcription factors: regulating stress-responsive network in plants. Acta Physiol. Plant 37, 1–14. doi: 10.1007/s11738-015-1929-1
Rincker, K., Hartman, G. L., Diers, B. W. (2016). Fine mapping of resistance genes from five brown stem rot resistance sources in soybean. Plant Genome 9. doi: 10.3835/plantgenome2015.08.0063
Robinson, M. D., McCarthy, D. J., Smyth, G. K. (2010). edgeR: A Bioconductor package for differential expression analysis of digital gene expression data. Bioinformatics 26, 139–140. doi: 10.1093/bioinformatics/btp616
Rolling, W., Lake, R., Dorrance, A. E., McHale, L. K. (2020). Genome-wide association analyses of quantitative disease resistance in diverse sets of soybean [Glycine max (L.) Merr.] plant introductions. PLoS One 15, e0227710. doi: 10.1371/journal.pone.0227710
Roux, F., Voisin, D., Badet, T., Balagué, C., Barlet, X., Huard-Chauveau, C., et al. (2014). Resistance to phytopathogens e tutti quanti: placing plant quantitative disease resistance on the map. Mol. Plant Pathol. 15, 427–432. doi: 10.1111/mpp.12138
Saha, A., Battle, A. (2018). False positives in trans-eQTL and co-expression analyses arising from RNA-sequencing alignment errors. F1000Research 7, 1860. doi: 10.12688/f1000research.17145.2
Salvi, S., Tuberosa, R. (2005). To clone or not to clone plant QTLs: Present and future challenges. Trends Plant Sci. 10, 297–304. doi: 10.1016/j.tplants.2005.04.008
Samad-Zamini, M., Schweiger, W., Nussbaumer, T., Mayer, K. F. X., Buerstmayr, H. (2017). Time-course expression QTL atlas of the global transcriptional response of wheat to Fusarium graminearum. Plant Biotechnol. J. 15, 1453–1464. doi: 10.1111/pbi.12729
Schadt, E. E., Monks, S. A., Drake, T. A., Lusis, A. J., Che, N., Colinayo, V., et al. (2003). Genetics of gene expression surveyed in maize, mouse and man. Nature 422, 297–302. doi: 10.1038/nature01434
Schmitthenner, A. F. (1985). Problems and progress in control of Phytophthora root rot of soybean. Plant Dis. 69, 362–368. doi: 10.1094/PD-69-362
Schmutz, J., Cannon, S. B., Schlueter, J., Ma, J., Mitros, T., Nelson, W., et al. (2010). Genome sequence of the paleopolyploid soybean. Nature 463, 178–183. doi: 10.1038/nature08670
Schneider, R., Rolling, W., Song, Q., Cregan, P., Dorrance, A. E., McHale, L. K. (2016). Genome-wide association mapping of partial resistance to Phytophthora sojae in soybean plant introductions from the Republic of Korea. BMC Genomics 17, 607. doi: 10.1186/s12864-016-2918-5
Scott, K., Balk, C., Veney, D., McHale, L. K., Dorrance, A. E. (2019). Quantitative disease resistance loci towards Phytophthora sojae and three species of Pythium in six soybean nested association mapping populations. Crop Sci. 59, 605–623. doi: 10.2135/cropsci2018.09.0573
Shiu, S. H., Karlowski, W. M., Pan, R., Tzeng, Y. H., Mayer, K. F., Li, W. H. (2004). Comparative analysis of the receptor-like kinase family in Arabidopsis and rice. Plant Cell 16, 1220–1234. doi: 10.1105/tpc.020834
Smith, C. J., Watson, C. F., Morris, P. C., Bird, C. R., Seymour, G. B., Gray, J. E., et al. (1990). Inheritance and effect on ripening of antisense polygalacturonase genes in transgenic tomatoes. Plant Molec. Biol. 14 (3), 369–379. doi: 10.1007/BF00028773
Smith, C. J. S., Watson, C. F., Ray, J., Bird, C. R., Morris, P. C., Schuch, W., et al. (1988). Antisense RNA inhibition of polygalacturonase gene expression in transgenic tomatoes. Nature 334, 724–726. doi: 10.1038/334724a0
Soltis, N. E., Caseys, C., Zhang, W., Corwin, J. A., Atwell, S., Kliebenstein, D. J. (2020). Pathogen genetic control of transcriptome variation in the Arabidopsis thaliana – Bortrytis cinerea pathosystem. Genetics 215, 253–266. doi: 10.1534/genetics.120.303070
Soyars, C. L., James, S. R., Nimchuk, Z. L. (2016). Ready, aim, shoot: Stem cell regulation of the shoot apical meristem. Curr. Opin. Plant Biol. 29, 163–168. doi: 10.1016/j.pbi.2015.12.002
Spoel, S. H., Dong, X. (2012). How do plants achieve immunity? Defence without specialized immune cells. Nat. Rev. Immunol. 12, 89–100. doi: 10.1038/nri3141
Stasko, A. K., Batnini, A., Bolanos-Carriel, C., Lin, J. E., Lin, Y., Blakeslee, J., et al. (2020). Auxin profiling and GmPIN expression in Phytophthora sojae-soybean root interactions. Phytopathology 110, 1988–2002. doi: 10.1094/PHYTO-02-20-0046-R
Stasko, A. K., Wickramasinghe, D., Nauth, B. J., Acharya, B., Ellis, M. L., Taylor, C. G., et al. (2016). High-density mapping of resistance QTL toward Phytophthora sojae, Pythium irregulare, and Fusarium graminearum in the same soybean population. Crop Sci. 56, 2476–2492. doi: 10.2135/cropsci2015.12.0749
St. Clair, D. A. (2010). Quantitative disease resistance and quantitative resistance loci in breeding. Annu. Rev. Phytopathol. 48, 247–268. doi: 10.1146/annurev-phyto-080508-081904
Stracke, R. (2001). The R2R3-MYB gene family in Arabidopsis thaliana. Curr. Opin. Plant Biol. 4, 447–456. doi: 10.1016/S1369-5266(00)00199-0
Sugano, S., Sugimoto, T., Takatsuji, H., Jiang, C. J. (2013). Induction of resistance to Phytophthora sojae in soyabean (Glycine max) by salicylic acid and ethylene. Plant Pathol. 62, 1048–1056. doi: 10.1111/ppa.12011
Sun, Y., Wu, Y., Yang, C., Sun, S., Lin, X., Liu, L., et al. (2017). Segmental allotetraploidy generates extensive homoeologous expression rewiring and phenotypic diversity at the population level in rice. Mol. Ecol. 26, 5451–5466. doi: 10.1111/mec.14297
Swanson, S., Gilroy, S. (2010). ROS in plant development. Physiol. Plant 138 (4), 384–392. doi: 10.1111/j.1399-3054.2009.01313.x
Swanson-Wagner, R. A., DeCook, R., Jia, Y., Bancroft, T., Ji, T., Zhao, X., et al. (2009). Paternal dominance of trans-eQTL influences gene expression patterns in maize hybrids. Science 326, 1118–1120. doi: 10.1126/science.1178294
Thomas, R., Fang, X., Ranathunge, K., Anderson, T. R., Peterson, C. A., Bernards, M. A. (2007). Soybean root suberin: Anatomical distribution, chemical composition, and relationship to partial resistance to Phytophthora sojae. Plant Physiol. 144, 299–311. doi: 10.1104/pp.106.091090
Tian, J., Keller, M. P., Broman, A. T., Kendziorski, C., Yandell, B. S., Attie, A. D., et al. (2016). The dissection of expression quantitative trait locus hotspots. Genetics 202, 1563–1574. doi: 10.1534/genetics.115.183624
Tian, T., Liu, Y., Yan, H., You, Q., Yi, X., Du, Z., et al. (2017). agriGO v2.0: A GO analysis toolkit for the agricultural community 2017 update. Nucleic Acids Res. 45, W122–W129. doi: 10.1093/nar/gkx382
Tooley, P. W., Grau, C. (1982). Identification and quantitative characterization of rate-reducing resistance to Phytophthora megasperma f.sp. glycinea in soybean seedlings. Phytopathology 72, 727–733. doi: 10.1094/Phyto-72-727
Torres, M. A. (2010). ROS in biotic interactions. Physiol. Plant 138 (4), 414–429. doi: 10.1111/j.1399-3054.2009.01326.x
Trewavas, A. J., Mahlo, R. (1998). Ca2+ signaling in plant cells: The big network! Curr. Opin. Plant Biol. 1, 428–433. doi: 10.1016/S1369-5266(98)80268-9
Tucker, D. M., Saghai Maroof, M. A., Mideros, S., Skoneczka, J. A., Nabati, D. A., Buss, G. R., et al. (2010). Mapping quantitative trait loci for partial resistance to Phytophthora sojae in a soybean interspecific cross. Crop Sci. 50, 628–635. doi: 10.2135/cropsci2009.03.0161
Vailleau, F., Daniel, X., Tronchet, M., Montillet, J. L., Triantaphylides, C., Roby, D. (2002). A R2R3-MYB gene, AtMYB30, acts as a positive regulator of the hypersensitive cell death program in plants in response to pathogen attack. Proc. Natl. Acad. Sci. U.S.A. 99, 10179–10184. doi: 10.1073/pnas.152047199
Vega-Sánchez, M., Redinbaugh, M., Costanzo, S., Dorrance, A. E. (2005). Spatial and temporal expression analysis of defense-related genes in soybean cultivars with different levels of partial resistance to Phytophthora sojae. Physio. Mol. Plant Pathol. 66, 175–182. doi: 10.1016/j.pmpp.2005.07.001
Vuong, T. D., Diers, B. W., Hartman, G. L. (2008). Identification of QTL for resistance to Sclerotinia stem rot in soybean plant introduction 194639. Crop Sci. 48, 2209–2214. doi: 10.2135/cropsci2008.01.0019
Walton, J. D. (1994). Deconstructing the cell wall. Plant Physiol. 104, 1113–1118. doi: 10.1104/pp.104.4.1113
Wang, X., Chen, Q., Wu, Y., Lemmon, Z. H., Xu, G., Huang, C., et al. (2017). Genome-wide analysis of transcriptional variability in large maize-teosinte population. Mol. Plant 11, 443–459. doi: 10.1016/j.molp.2017.12.011
Wang, Y., Han, Y., Teng, W., Zhao, X., Li, Y., Wu, L., et al. (2014). Expression quantitative trait loci infer the regulation of isoflavone accumulation in soybean (Glycine max L. Merr.) seed. BMC Genomics 15, 1–11. doi: 10.1186/1471-2164-15-680
Wang, H., St. Martin, S. K., Dorrance, A. E. (2012a). Comparison of phenotypic methods and yield contributions of quantitative trait loci for partial resistance to Phytophthora sojae in soybean. Crop Sci. 52, 1–14. doi: 10.2135/cropsci2011.06.0336
Wang, Y., Tyler, B. M., Wang, Y. (2019). Defense and counter defense during plant-pathogenic oomycete infection. Annu. Rev. Microbiol. 73, 667–696. doi: 10.1146/annurev-micro-020518-120022
Wang, H., Waller, L., Tripathy, S., St. Martin, S. K., Zhou, L., Krampis, K., et al. (2010). Analysis of genes underlying soybean quantitative trait loci conferring partial resistance to Phytophthora sojae. Plant Genome J. 3, 23–40. doi: 10.3835/plantgenome2009.12.0029
Wang, H., Wijeratne, A., Wijeratne, S., Lee, S., Taylor, C. G., St. Martin, S. K., et al. (2012b). Dissection of two soybean QTL conferring partial resistance to Phytophthora sojae through sequence and gene expression analysis. BMC Genomics 13, 428. doi: 10.1186/1471-2164-13-428
Wang, S., Zheng, T., Wang, Y. (2007). Transcription activity hot spot, is it real or an artifact? BMC Proc. 1, S94. doi: 10.1186/1753-6561-1-S1-S94
Ward, E. W. B., Cahill, D. N., Bhattacharyya, M. (1989). Abscisic acid suppression of phenylalanine ammonia lyase activity and mRNA, and resistance of soybeans to Phytophthora megasperma f. sp. glycinea. Plant Physiol. 91, 23–27. doi: 10.1104/pp.91.1.23
Weng, C., Yu, K., Anderson, T. R., Poysa, V. (2007). A quantitative trait locus influencing tolerance to Phytophthora root rot in the soybean cultivar “Conrad”. Euphytica 158, 81–86. doi: 10.1007/s10681-007-9428-0
Werner, E. (2004). GTPases and reactive oxygen species: switches for killing and signaling. J. Cell Sci. 117 (2), 143–153. doi: 10.1242/jcs.00937
West, M. A. L., Kim, K., Kliebenstein, D. J., van Leeuwnen, H., Michelmore, R. W., Doerge, R. W., et al. (2007). Global eQTL mapping reveals the complex genetic architecture of transcript-level variation in Arabidopsis. Genetics 175, 1441–1450. doi: 10.1534/genetics.106.064972
Wong, J., Gao, L., Yang, Y., Zhai, J., Arikit, S., Yu, Y., et al. (2014). Roles of small RNAs in soybean defense against Phytophthora sojae infection. Plant J. 79, 928–940. doi: 10.1111/tpj.12590
Wu, X., Blake, S., Sleper, D. A., Shannon, J. G., Cregan, P., Nguyen, H. T. (2009). QTL, additive and epistatic effects for SCN resistance in PI 437654. Theor. Appl. Genet. 118, 1093–1105. doi: 10.1007/s00122-009-0965-x
Wu, X., Zhou, B., Zhao, J., Guo, N., Zhang, B., Yang, F., et al. (2011). Identification of quantitative trait loci for partial resistance to Phytophthora sojae in soybean. Plant Breed 130, 144–149. doi: 10.1111/j.1439-0523.2010.01799.x
Xu, P., Wu, J., Xue, A., Li, W. B., Chen, W. Y., Wei, L., et al. (2012). Differentially expressed genes of soybean during infection by Phytophthora sojae. J. Integr. Agric. 11, 368–377. doi: 10.1016/S2095-3119(12)60021-5
Yamaguchi, Y., Huffaker, A., Bryan, A. C., Tax, F. E., Ryan, C. A. (2010). PEPR2 is a second receptor for the Pep1 and Pep2 peptides and contributes to defense responses in Arabidopsis. Plant Cell 22, 508–522. doi: 10.1105/tpc.109.068874
Yan, Q., Si, J., Cui, X., Peng, H., Chen, X., Xing, H., et al. (2019). The soybean cinnamate 4-hydroxylase gene GmC4H1 contributed positively to plant defense via increasing lignin content. Plant Growth Regul. 88, 139–149. doi: 10.1007/s10725-019-00494-2
Yao, L., Berman, B. P., Farnham, P. J. (2015). Demystifying the secret mission of enhancers: Linking distal regulatory elements to target genes. Crit. Rev. Biochem. Mol. Biol. 50, 550–573. doi: 10.3109/10409238.2015.1087961
Young, N. D. (1996). QTL mapping and quantitative disease resistance in plants. Annu. Rev. Phytopathol. 34, 479–501. doi: 10.1146/annurev.phyto.34.1.479
Yuan, N., Yuan, S., Li, Z., Zhou, M., Wu, P., Hu, Q., et al. (2018). STRESS INDUCED FACTOR 2, a leucine-rich repeat kinase regulates basal plant pathogen defense. Plant Physiol. 176, 3062–3080. doi: 10.1104/pp.17.01266
Zeng, H., Zhang, Y., Zhang, X., Pi, E., Zhu, Y. (2017). Analysis of EF-hand proteins in soybean genome suggests their potential roles in environmental and nutritional stress signaling. Front. Plant Sci. 8. doi: 10.3389/fpls.2017.00877
Zhang, B., Horvath, S. (2005). A general framework for weighted gene co-expression network analysis. Stat. Appl. Genet. Mol. Biol. 4. doi: 10.2202/1544-6115.1128
Zhang, C., Wang, X., Zhang, F., Dong, L., Wu, J., Cheng, Q., et al. (2017). Phenylalanine ammonia-lyase2.1 contributes to the soybean response towards Phytophthora sojae infection. Sci. Rep. 7, 7242. doi: 10.1038/s41598-017-07832-2
Zhao, Y., Chang, X., Qi, D., Dong, L., Wang, G., Fan, S., et al. (2017). A novel soybean ERF transcription factor, GmERF113, increases resistance to Phytophthora sojae infection in soybean. Front. Plant Sci. 8. doi: 10.3389/fpls.2017.00299
Zhao, X., Han, Y., Li, Y., Lui, D., Sun, M., Zhao, Y., et al. (2015). Loci and candidate gene identification to Sclerotinia sclerotiorum in soybean (Glycine max L. Merr.) via association and linkage maps. Plant J. 82, 245–255. doi: 10.1111/tpj.12810
Zhou, L., Mideros, S. X., Bao, L., Hanlon, R., Arredondo, F. D., Tripathy, S., et al. (2009). Infection and genotype remodel the entire soybean transcriptome. BMC Genomics 10, 49. doi: 10.1186/1471-2164-10-49
Zielinski, R. E. (1998). Calmodulin and calmodulin-binding proteins in plants. Ann. Rev. Physiol. Mol. Biol. 49, 697–725. doi: 10.1146/annurev.arplant.49.1.697
Zipfel, C. (2014). Plant pattern-recognition receptors. Trends Immunol. 35, 345–251. doi: 10.1016/j.it.2014.05.004
Zipfel, C., Kunze, G., Chinchilla, D., Caniard, A., Jones, J. D., Boller, T., et al. (2006). Perception of the bacterial PAMP EF-Tu by the receptor EFR restricts Agrobacterium-mediated transformation. Cell 125, 749–760. doi: 10.1016/j.cell.2006.03.037
Keywords: Glycine max, soybean, Phytophthora sojae, eQTL, systems genomics, master regulators, weighted gene co-expression network analysis
Citation: Million CR, Wijeratne S, Karhoff S, Cassone BJ, McHale LK and Dorrance AE (2023) Molecular mechanisms underpinning quantitative resistance to Phytophthora sojae in Glycine max using a systems genomics approach. Front. Plant Sci. 14:1277585. doi: 10.3389/fpls.2023.1277585
Received: 14 August 2023; Accepted: 16 October 2023;
Published: 07 November 2023.
Edited by:
Laura Medina-Puche, University of Tübingen, GermanyReviewed by:
Brett Hale, Arkansas State University, United StatesJose Sebastian Rufian, Universidad de Málaga, Spain
Copyright © 2023 Million, Wijeratne, Karhoff, Cassone, McHale and Dorrance. This is an open-access article distributed under the terms of the Creative Commons Attribution License (CC BY). The use, distribution or reproduction in other forums is permitted, provided the original author(s) and the copyright owner(s) are credited and that the original publication in this journal is cited, in accordance with accepted academic practice. No use, distribution or reproduction is permitted which does not comply with these terms.
*Correspondence: Leah K. McHale, bWNoYWxlLjIxQG9zdS5lZHU=; Anne E. Dorrance, ZG9ycmFuY2UuMUBvc3UuZWR1
†Present addresses: Cassidy R. Million, Ag Science, Heliae Agriculture, Gilbert, AZ, United States
Saranga Wijeratne, Abigail Wexner Research Institute Nationwide Children’s Hospital, Columbus, OH, United States
Stephanie Karhoff, Department of Extension, The Ohio State University, Ottawa, OH, United States
‡These authors have contributed equally to this work and share senior authorship