 Yuanqi Ma1†
 Hongchun Sun1†
 Yurong Yang1
 Zhao Li1Ping Li2Yuetong Qiao1
 Yongjiang Zhang1
 Ke Zhang1
 Zhiying Bai1Anchang Li1
 Cundong Li1*
 Liantao Liu1*
- 1State Key Laboratory of North China Crop Improvement and Regulation/Key Laboratory of North China Water-saving Agriculture, Ministry of Agriculture and Rural Affairs/Key Laboratory of Crop Growth Regulation of Hebei Province/College of Agronomy, Hebei Agricultural University, Baoding, China
- 2Handan Academy of Agricultural Sciences, Handan, China
Optimal management of nitrogen fertilizer profoundly impacts sustainable development by influencing nitrogen use efficiency (NUE) and seed cotton yield. However, the effect of long-term gradient nitrogen application on the sandy loam soil is unclear. Therefore, we conducted an 8-year field study (2014–2021) using six nitrogen levels: 0 kg/hm2 (N0), 75 kg/hm2 (N1), 150 kg/hm2 (N2), 225 kg/hm2 (N3), 300 kg/hm2 (N4), and 375 kg/hm2 (N5). The experiment showed that 1) Although nitrogen application had insignificantly affected basic soil fertility, the soil total nitrogen (STN) content had decreased by 5.71%–19.67%, 6.67%–16.98%, and 13.64%–21.74% at 0-cm–20-cm, 20-cm–40-cm, and 40-cm–60-cm soil layers, respectively. 2) The reproductive organs of N3 plants showed the highest nitrogen accumulation and dry matter accumulation in both years. Increasing the nitrogen application rate gradually decreased the dry matter allocation ratio to the reproductive organs. 3) The boll number per unit area of N3 was the largest among all treatments in both years. On sandy loam, the most optional nitrogen rate was 190 kg/hm2–270 kg/hm2 for high seed cotton yield with minimal nitrogen loss and reduced soil environment pollution.
1 Introduction
Cotton (Gossypium hirsutum L.) is a significant cash crop in China, accounting for approximately 15% of the global planting area and 25% of output (Dai and Dong, 2014). Global cotton production involves nitrogen (N) application but has a low (30%–35%) nitrogen use efficiency (NUE) despite the currently high lint yield (Guo et al., 2020; Niu et al., 2020). N plays a decisive role in cotton growth and development because cotton demands relatively large amounts of N, which also has relatively sensitive characteristics (Iqbal et al., 2020). Surprisingly, increasing the N application rate has not increased seed cotton yield (SCY) but reduced NUE and increased input costs. This low NUE has increased environmental pollution and greenhouse gas emissions, further exacerbating the environmental burden (Sutton et al., 2011). Therefore, reducing nitrogen application and improving NUE in cotton production are crucial for achieving sustainable and stable yields (Wang et al., 2010; Zhang et al., 2017).
Furthermore, implementing scientific and reasonable tillage and management methods can prevent soil fertility degradation in poor fertilizer-retaining sandy loam soil while maintaining long-term sustainable production (Zheng et al., 2010). Boselli et al. (2020) emphasized that soil management changes soil fertility. Long-term N fertilizer application can increase the soil total nitrogen (STN) (Shiwakoti et al., 2019), nitrate, and ammonium nitrogen contents. Long-term N application experiments in Xinjiang showed that applying N to sandy loam cotton fields can effectively increase the STN, which decreases with increasing soil depth (Kaiyong et al., 2011). Initially, the nitrate nitrogen content in the soil increased, reaching a maximum in the 20-cm–40-cm soil layer, and decreased as the soil layer deepened toward the brown and Udic Haplustalf soil (in the United States Department of Agriculture system) under long-term fertilization conditions (Zhong et al., 2015).
N is crucial for crop yield and the composition factors of yield (Aulakh and Malhi, 2005; Ding et al., 2023), such as physio-ecological characteristics, dry matter (DM) accumulation, nitrogen accumulation, and NUE (Yang et al., 2013; Luo et al., 2018; Snider et al., 2021). Adequate nutrient absorption is a prerequisite for biomass accumulation and increasing SCY. However, nitrogen accumulation in the reproductive organs is crucial for high cotton economic yield (Sepaskhah and Tafteh, 2012; Khan et al., 2017b; Chen et al., 2018b). Reasonable N application effectively improves the chlorophyll content and photosynthetic rate of cotton, promoting plant photosynthesis, increasing DM accumulation, and ultimately increasing crop yield (Zhou et al., 2021). N application is crucial for crop yield, but insufficient or excessive application can negatively impact crop yield (Lin et al., 2009; Zhang et al., 2023).
N application level also significantly affected the yield composition factors (Iqbal et al., 2022). One study showed that the number of bolls per unit area and the weight of a single boll of cotton decreased when the N application rate exceeded 280 kg/hm2 on sandy loam (Li et al., 2019). Different N application rates significantly affect the number of bolls per unit area and the single-boll weight. N application rates exceeding 120 kg/hm2 did not increase the SCY on soil (Munir et al., 2015). Therefore, optimal N application is important for maximum NUE and higher lint yields (Cassman et al., 2002). Another study revealed that reducing N fertilizer application through precision tillage technology can improve wheat yield and NUE (Shah et al., 2022). Similarly, proper N reduction insignificantly affects the tiller number (Ning et al., 2022). The test time is usually 1–2 years compared to the long-term test. Therefore, the influence of the test will differ because of weather, precipitation, and other factors (Grant et al., 2016). Previous studies have demonstrated that long-term fixed N application, specifically, the 14-year fixed fertilization treatment, significantly affects soil N mineralization (Ge et al., 2018). Additionally, there were noticeable variations in the nutrients within the 0-cm–60-cm soil layer after different N application treatments, an effective indicator of the effects of different nitrogen levels on soil fertility (Chen et al., 2018a). A 16-year positioning fertilization research confirmed further that N application significantly affects soil nutrients and that proper N application can improve soil fertility, meet the nutrient requirements of crops, and increase yield (Chu et al., 2007). However, long-term N localization experiments in cotton fields with sandy loam soils are still lacking.
Therefore, we conducted a long-term N localization experiment with five nitrogen application levels over 8 years (from 2014 to 2021) to determine whether long-term N reduction can significantly reduce SCY under sandy loam soil. The study focused on the effects of different N application rates on the soil N spatial content, morphology, NUE, and yield. The aim was to provide a theoretical basis and technical support for an optimal N fertilizer application rate in cotton fields with sandy loam soil.
2 Materials and methods
2.1 Experimental sites
The experiment was conducted at the Weixian Experimental Station of the Agricultural University of Hebei (115.35°E, 37.08°N) from 2014 to 2021. The experimental field had sandy loam soil containing total nitrogen of 0.565 g·kg-1, available phosphorus of 5.82 mg·kg-1, available potassium of 112 mg·kg-1, and organic matter of 7.6 g·kg-1, with a pH of 8.1. We focused on the growth and development traits of cotton from 2020 to 2021. Basic soil fertility is shown in Table 1. Throughout the growing season (April–October), the average temperature and total rainfall were 21.5°C and 469.9 mm (Figure 1A) in 2020 and 21.7°C and 815.1 mm (Figure 1B) in 2021.
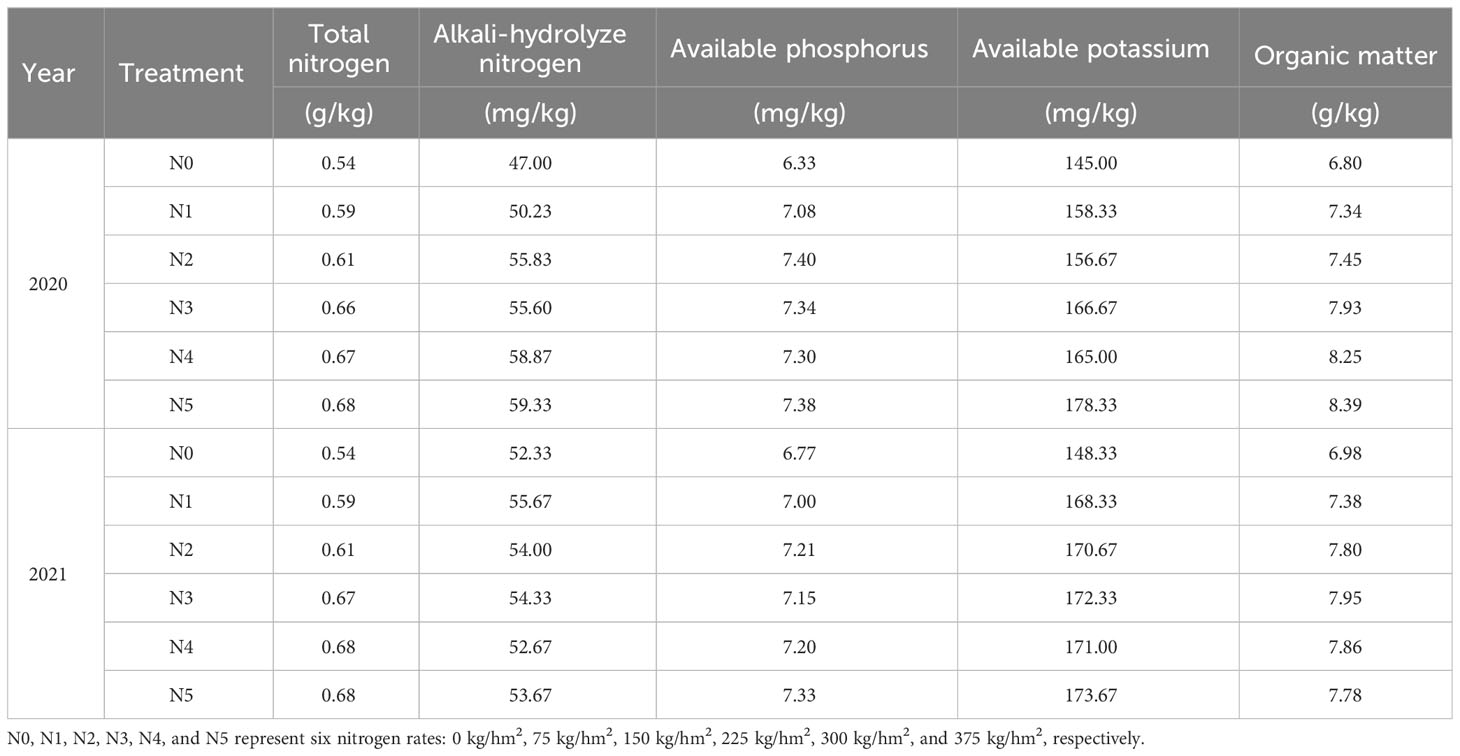
Table 1 Basic soil fertility in 2020 and 2021.
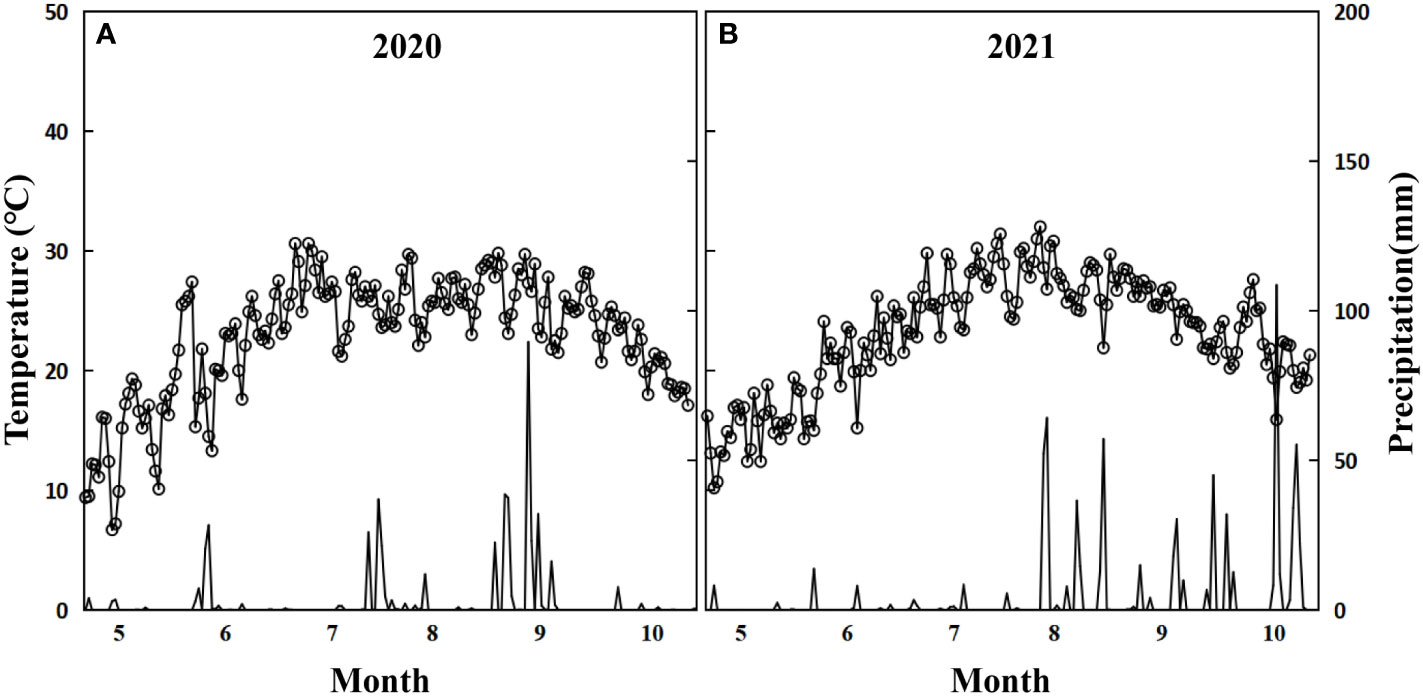
Figure 1 Average daily temperature and precipitation for 2020 (A) and 2021 (B).
2.2 Experimental design
The field experiment was conducted using a randomized complete block design with six nitrogen levels: 0 kg/hm2, 75 kg/hm2, 150 kg/hm2, 225 kg/hm2, 300 kg/hm2, and 375 kg/hm2, represented by N0, N1, N2, N3, N4, and N5, respectively. Urea was the N source in 18 plots of the random blocks with three replications. The basal fertilizers were 105 kg/hm2 of P2O5 and 105 kg/hm2 of K2O, and urea was the N source. Nitrogen fertilizer was applied in two parts: base and topdressing fertilizer. Topdressing was performed at the full flowering stage, and the ratio of nitrogen base fertilizer to topdressing was 6:4.
The cotton cultivar, Jimian No. 863, was sown on 25th April each year at a planting density of 75,000 plants/hm2 (equal row spacing of 76 cm). The area of each plot was 66 m2 and remained unchanged during the experiment. The plants were harvested on 15th October of each year. Other field management measures, such as weeding and pest control, were conducted according to local practices.
2.3 Shoot morphological indicators
Six representative cotton plants were selected from each plot to measure the average of the indicators at the cotton opening stage. The plant height was measured from the first cotyledonary node to the apical bud using a ruler, and the stem diameter was measured from the first cotyledonary node using a Vernier caliper.
2.4 Dry matter accumulation and distribution
DM was determined at 70, 100, and 130 days after sowing (DAS). The three uniform-sized plants were separated into the root, main stem, main stem leaf, leaf branch, leaf branch leaf, leaf branch cotton boll, fruit branch, fruit branch leaf, and fruit branch cotton boll. We adopted the shovel-omics method to obtain the DM weight of the root system (length, 40 cm; width, 30 cm; height, 18 cm) (Shao et al., 2019). The separate plant sections were numbered accordingly, put in paper bags, and dried in the oven at 105°C for 30 min. After drying at 80°C to a constant weight, an electronic balance (OHAUS, NJ, USA) was used to determine the DM weight.
2.5 Soil total nitrogen
At five selected sites in each plot, soil samples were taken from 0-cm–20-cm, 20-cm–40-cm, and 40-cm–60-cm soil layers of each site using a soil drill at four stages (before sowing, bud stage, flower-boll stage, and withdrawal stage) in 2021. The samples were air-dried naturally, ground, sieved through a 60-mesh sieve, and digested with H2SO4-H2O2. STN content was determined using the continuous flow chemical analyzer (Auto Analyzer3, SEAL Analytical, WI, USA).
2.6 Nitrogen content and use efficiency
1) Nitrogen accumulation and distribution in cotton plant organs
At 70, 100, and 130 days, six uniform-sized cotton plants were randomly selected from each plot, and their organs were divided into vegetative and reproductive parts. The plants were decomposed according to the vegetative (root, main stem, main stem leaf, leaf branch, leaf branch leaf, fruit branch, fruit branch leaf) and reproductive (leaf branch cotton boll, fruit branch cotton boll) organs according to the biomass measurements. After all of the parts were dried, crushed, and sieved through a 60-mesh sieve, the DM was digested in H2SO4-H2O2, and total nitrogen content was determined by continuous flow chemical analyzer (Auto Analyzer3, SEAL Analytical, WI, USA) (Jiang et al., 2021).
2) The nitrogen use efficiency determination (Dong et al., 2020)
Agronomic nitrogen use efficiency (aNUE) = [SCY in N-application plots – SCY in N-omission plots (kg)]/The amount of applied N fertilizer (kg).
Nitrogen recovery efficiency (NRE) = (total N uptake of the N-fertilized plots − total N uptake of zero-N plots/The amount of applied N fertilizer.
Physiological nitrogen use efficiency (pNUE) = [SCY in N-application plots – SCY in N-omission plots (kg)]/[N accumulation in N-application plots – N accumulation in N-omission plots (kg)]
Internal nitrogen use efficiency (iNUE) = Lint yield (kg)/N accumulation in a plant (kg)
Partial productivity of nitrogen fertilizer (Pfpn) = SCY in N-application plots (kg)/The amount of applied N fertilizer (kg)
2.7 Cotton yield and component factors
On 15th October, 20 consecutive cotton plants in two rows in the middle of each plot were selected for harvesting to determine SCY. The regression analysis was conducted using 3-year values of SCY (2017–2019). The boll weight and number were determined for 50 randomly sampled bolls per plot during each harvest. Seed cotton was weighed after drying the bolls in the sun for 15 days, and the lint percentage was determined after ginning.
2.8 Statistical analysis
Microsoft Excel 2010 was used to record and organize the data analyzed in SPSS 26.0 (IBM Corp., Armonk, NY, USA) using the two-factor ANOVA test. The mean values of each treatment were compared at a 5% significance level (p ≤ 0.05) by a T-test Least Significant Difference (LSD). Correlation analysis was performed using Origin Pro 2022b (OriginLab, Northampton, MA, USA). All of the results were plotted using GraphPad Prism 8 (GraphPad Software Inc., CA, USA).
3 Results
3.1 Effects of nitrogen application on soil total nitrogen content
Soil depth and N application significantly affected STN contents at each growth stage. The STN content decreased over the growth period and soil depth (Table 2). The STN contents of N0, N1, N2, N3, N4, and N5 in the 20-cm–40-cm and 40-cm–60-cm soil layers decreased by 8.82%–14.30% and 30.43%–36.98%, respectively, compared to the 0-cm–20-cm soil layer. The N in each soil layer was mainly from the accumulation in the previous year, so the difference in the 20-cm–40-cm soil layer was more significant than that in the 0-cm–20-cm soil layer. At 70 DAS, the STN contents of N0, N1, N2, N3, N4, and N5 treatments in the 20-40 and 40-60 cm soil layers decreased by 2.68%–14.81% and 23.78%–33.04%, respectively, compared to the 0-cm–20-cm soil layer. At 100 DAS, the STN contents in the 20-cm–40-cm and 40-cm–60-cm soil layers decreased by 5.65%–13.53% and 20.40%–24.58%, respectively, compared to the 0-cm–20-cm soil layer. However, fertilization at 70 and 130 days decreased the differences between N2 and N3 treatments in the 0-cm–20-cm soil layer and N1 and N2 in the 20-cm–40-cm soil layer. Moreover, increasing the fertilizer application rate increased the STN contents in the two soil layers. As expected, N0 had significantly lower STN contents than other treatments. At 130 DAS, the STN contents of N0, N1, N2, N3, N4, and N5 in the 20-cm–40-cm and 40-cm–60-cm soil layers decreased by 7.40%–22.41% and 25.21%–35.01%, respectively, compared to the 0-cm–20-cm soil layer.
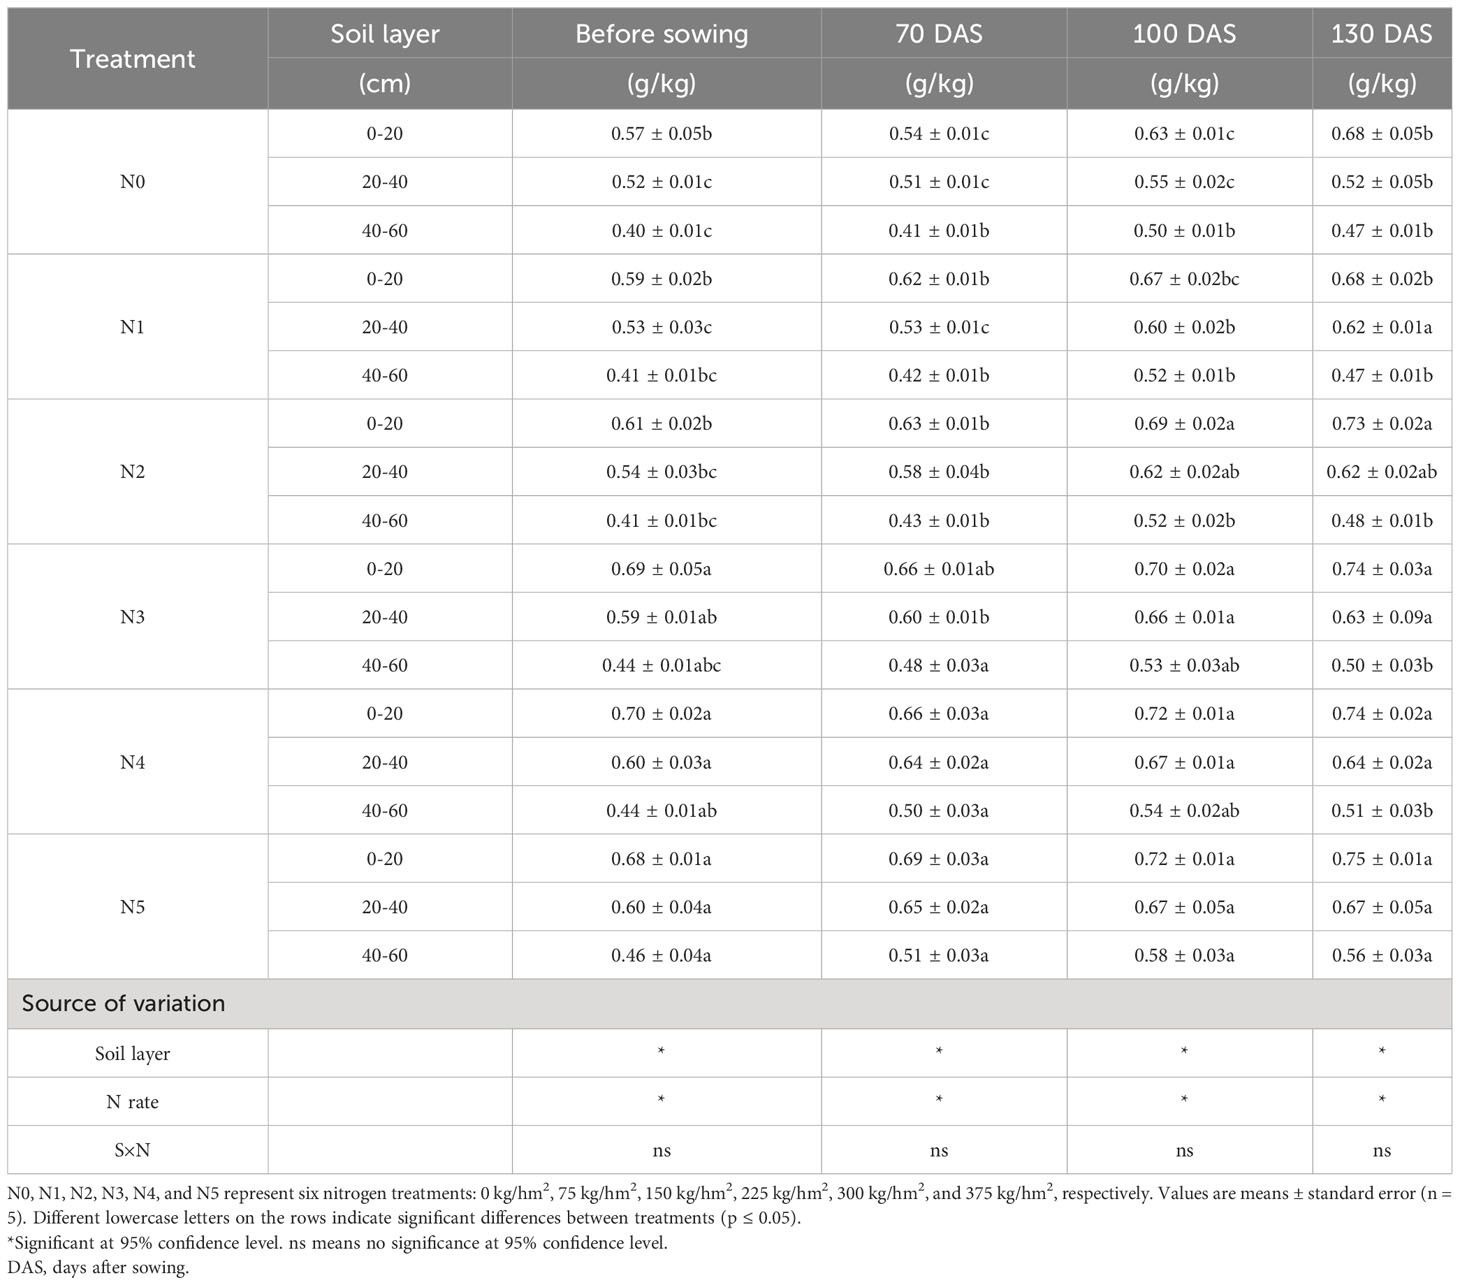
Table 2 Total nitrogen content in the 0-cm–60-cm soil layers before sowing, 70 days after sowing (DAS), 100 DAS, and 130 DAS.
3.2 Effects of nitrogen application on cotton plant morphological characteristics
Different N application rates significantly affected the morphology of cotton plants (Table 3). For instance, increasing the N application level for treatments N1 and N2 increased the plant height by 7.07% and 14.72%, respectively, compared with N0. N3 resulted in the highest stem diameter, which increased by 33.61%, 12.26%, 7.21%, 9.17%, and 14.42% compared to N0, N1, N2, N4, and N5, respectively. Furthermore, the N3 generated the highest number of fruit branches, with 56.25%, 4.17%, 31.58%, 19.05%, and 4.17% increments compared to N0, N1, N2, N4, and N5. However, there was no significant difference in the plant height of the N3 and N5 treatments. The N0 treatment significantly reduced the number of fruit branches compared to N1, N2, N4, and N5.
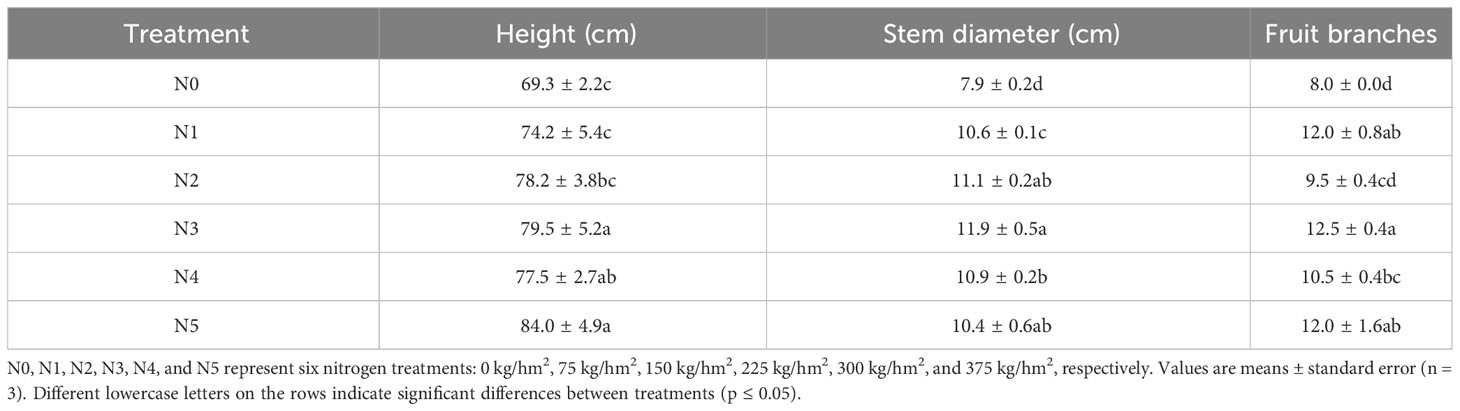
Table 3 Effects of different nitrogen treatments on plant morphological indexes.
3.3 Effects of gradient nitrogen application on nitrogen use efficiency
The year of planting did not significantly affect the NUE. Additionally, N rates significantly affect iNUE, NRE, aNUE, and Pfpn (p ≤ 0.05). The interaction between year and N rate significantly influenced NRE and aNUE (p ≤ 0.05). Compared with 2020, iNUE, NRE, aNUE, pNUE, and Pfpn decreased in 2021 under the same nitrogen application treatment. The NRE decreased significantly with the increase in N application (Table 4). In 2020, increasing the N application rate significantly decreased the aNUE, iNUE, and partial nitrogen productivity (Pfpn). The iNUE of N1–N5 treatments decreased by 3.73%, 13.88%, 18.81%, 17.61%, and 18.81%, respectively, compared to the N0 treatment. Additionally, the NRE of N2–N5 treatments decreased by 10.57%, 25.36%, 44.24%, and 45.09%, respectively, compared with the N1 treatment. The aNUE and pNUE also decreased by 45.22%, 61.26%, 74.39%, and 82.01%, and 38.58%, 49.00%, 53.92%, and 60.32% at N1–N5, respectively, compared with N1. Furthermore, Pfpn decreased by 49.41%, 66.02%, 74.92%, and 80.23% at N1–N5, respectively, compared with N1 (Table 4). The trend was similar in 2021, indicating that higher N application rates decrease iNUE and Pfpn. However, increasing the nitrogen application rate initially increased the aNUE and pNUE before decreasing.
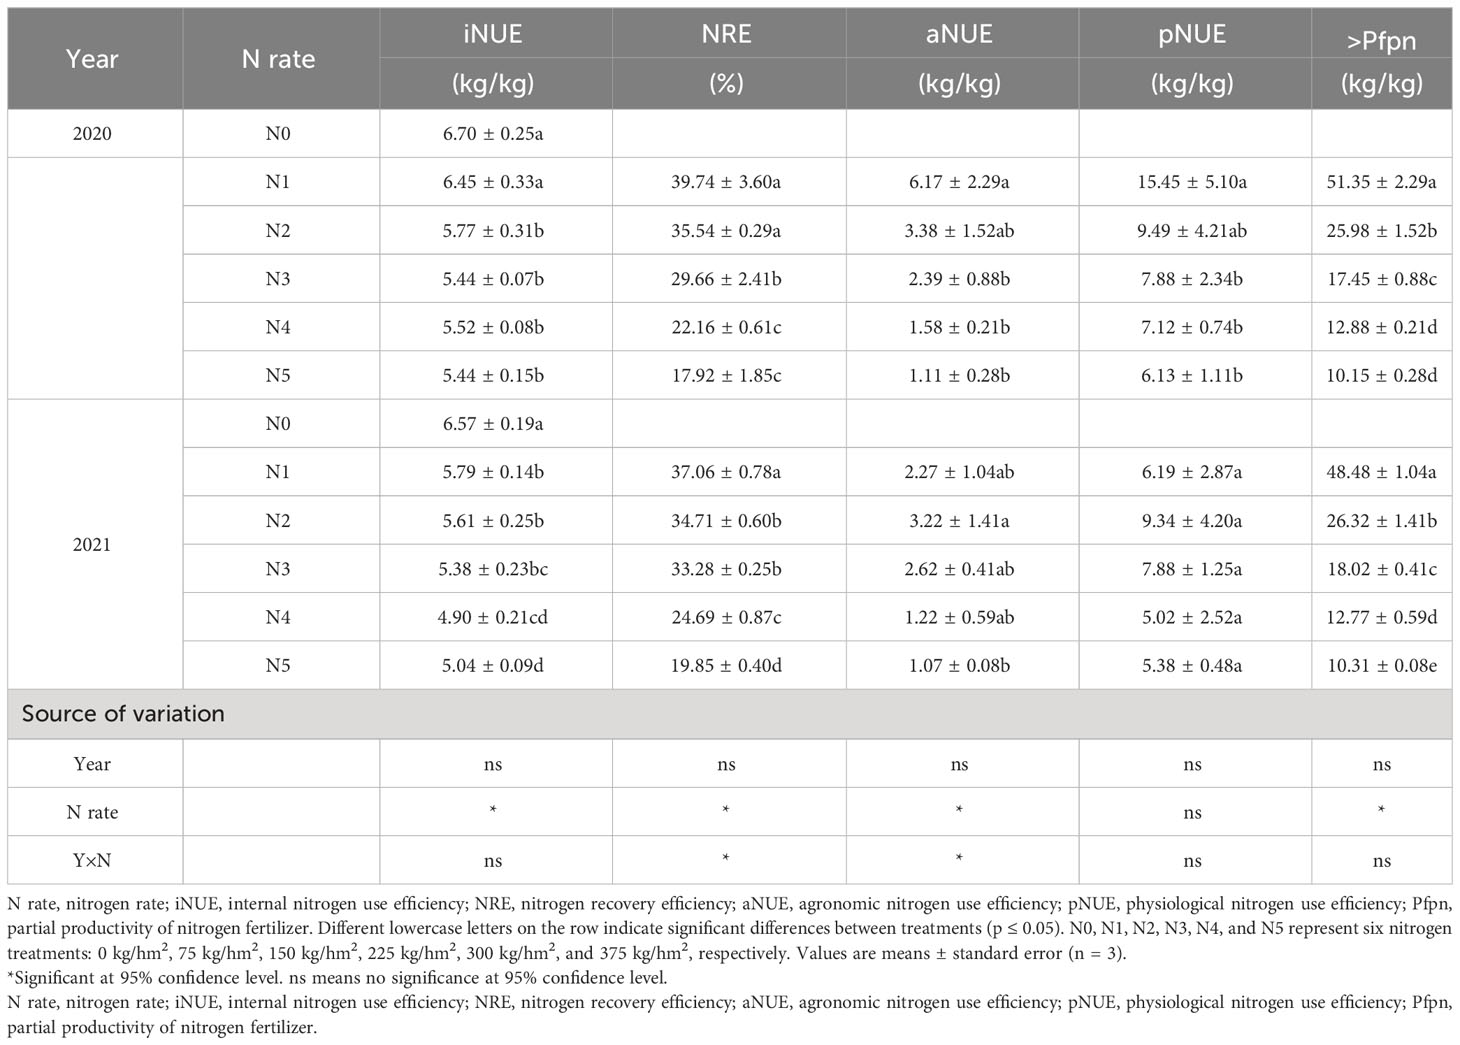
Table 4 Effects of different nitrogen treatments on the nitrogen use efficiency of cotton.
3.4 Effects of nitrogen application on dry matter accumulation, nitrogen accumulation, and yield components of cotton
3.4.1 Dry matter and nitrogen accumulation of the cotton plant
The N rate and year significantly affected DM accumulation, DM accumulation of reproduction organs, nitrogen accumulation, and nitrogen accumulation of reproduction organs (p ≤ 0.05). The interaction of year and N rate significantly influenced DM accumulation, DM accumulation of reproduction organs, and nitrogen accumulation (p ≤ 0.05). Enhancing N application resulted in higher DM and N accumulation in 2021 than those in 2020. Different N application rates significantly affected the total DM accumulation (Table 5). Specifically, N5 and N3 treatments exhibited the highest DM accumulation in 2020 and 2021, increasing by 19.89% and 22.37%, respectively, compared to the N0 treatment. In 2020, N1–N5 treatments increased the DM accumulation of the vegetative organs and reproduction organs by 17.14%–30.81% and 2.92%–9.58%, respectively.
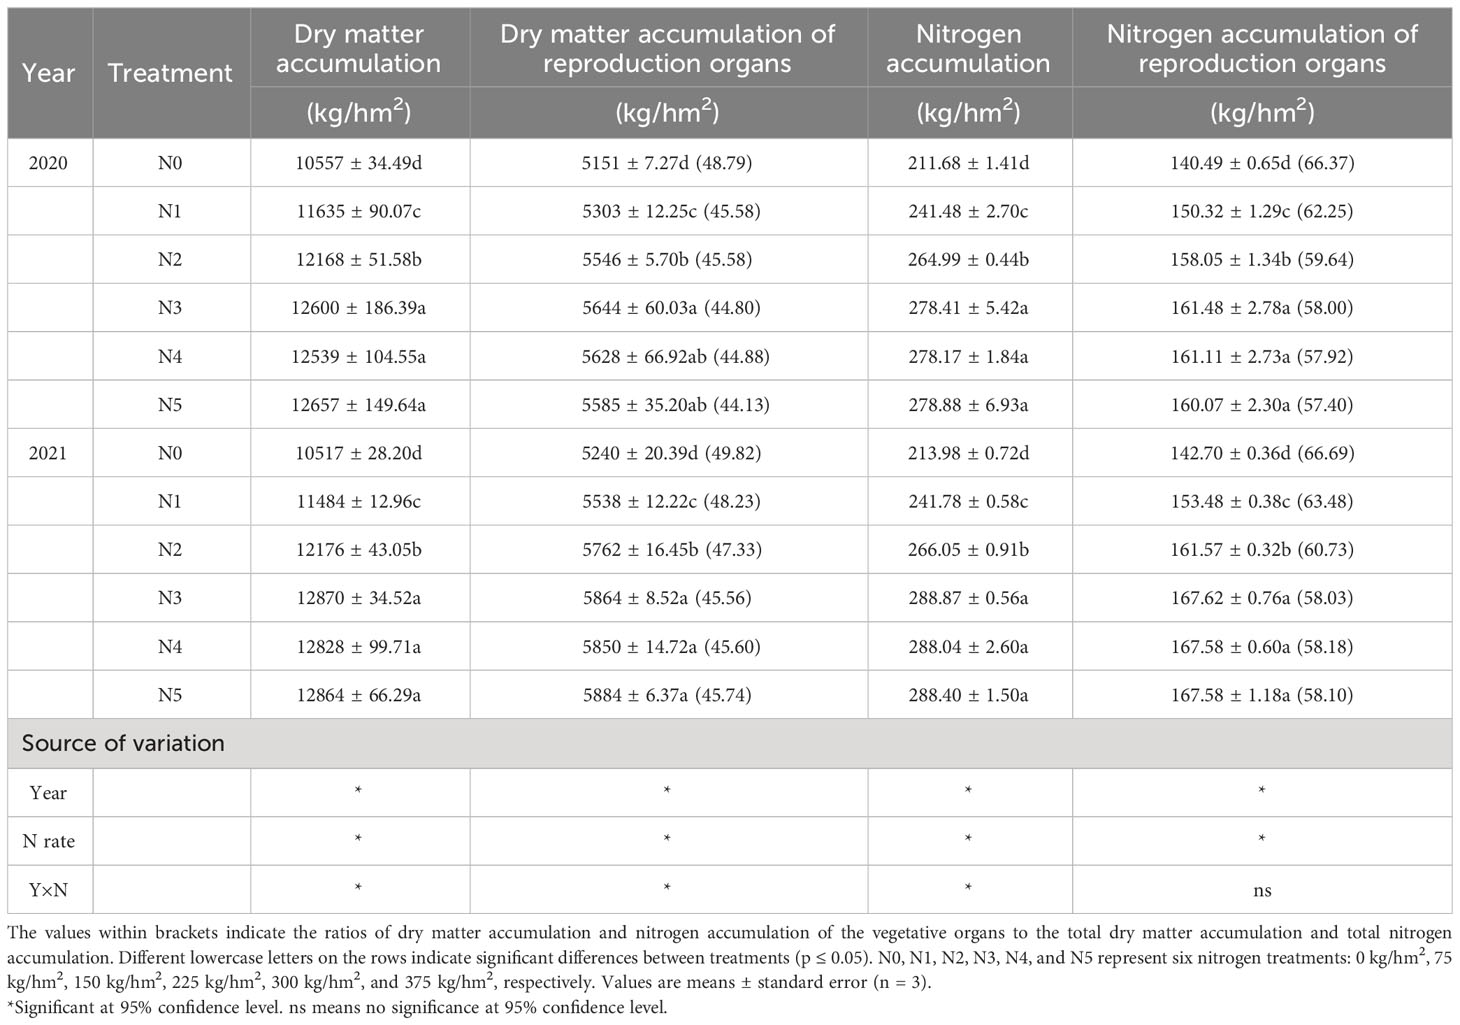
Table 5 Effects of different nitrogen treatments on dry matter accumulation and nitrogen accumulation in cotton plants.
During the opening stage, the N5 treatment generated the maximum DM accumulation in the vegetative organs, although the amount was not significantly different from N3 and N4 treatments. The maximum DM accumulation of reproduction organs was observed under the N3 treatment, although the value was not significantly different from N4 and N5 treatments. In 2021, N1–N5 treatments increased the DM accumulation of vegetative organs and reproduction organs by 12.67%–32.76% and 5.7%–11.01%, respectively, compared to N0. The DM accumulation of vegetative organs peaked under the N3 treatment, although this peak was not significantly different from N4 and N5 treatments. Meanwhile, the reproduction organs reached their maximum (5,884 kg/hm2) under the N5 treatment, which was not significantly different from the N3 and N4 treatments. The DM accumulation of N0 was significantly lower than all of the other treatments.
3.4.2 Yield components
The N rate and year significantly affected the boll number per unit area, boll weight, and lint percentage (p ≤ 0.05). Moreover, the N rate also significantly affected SCY. However, the interaction between N and year had no significant effect on SCY and its constituent factors (p ≤ 0.05). Different N application rates significantly affected the SCY, boll number per unit area, boll weight, and lint percentage (Table 6). Treatment N3 caused the highest SCY over the 2 years. In 2020, the SCY of N0 was significantly lower than the other treatments. The SCY of N1–N5 treatments increased by 13.65%, 14.98%, 15.84%, 14.02%, and 12.28%, respectively, compared to the N0 treatment. In 2021, there was no significant difference between N0 and N1 treatments, but both were significantly lower than the other treatments.
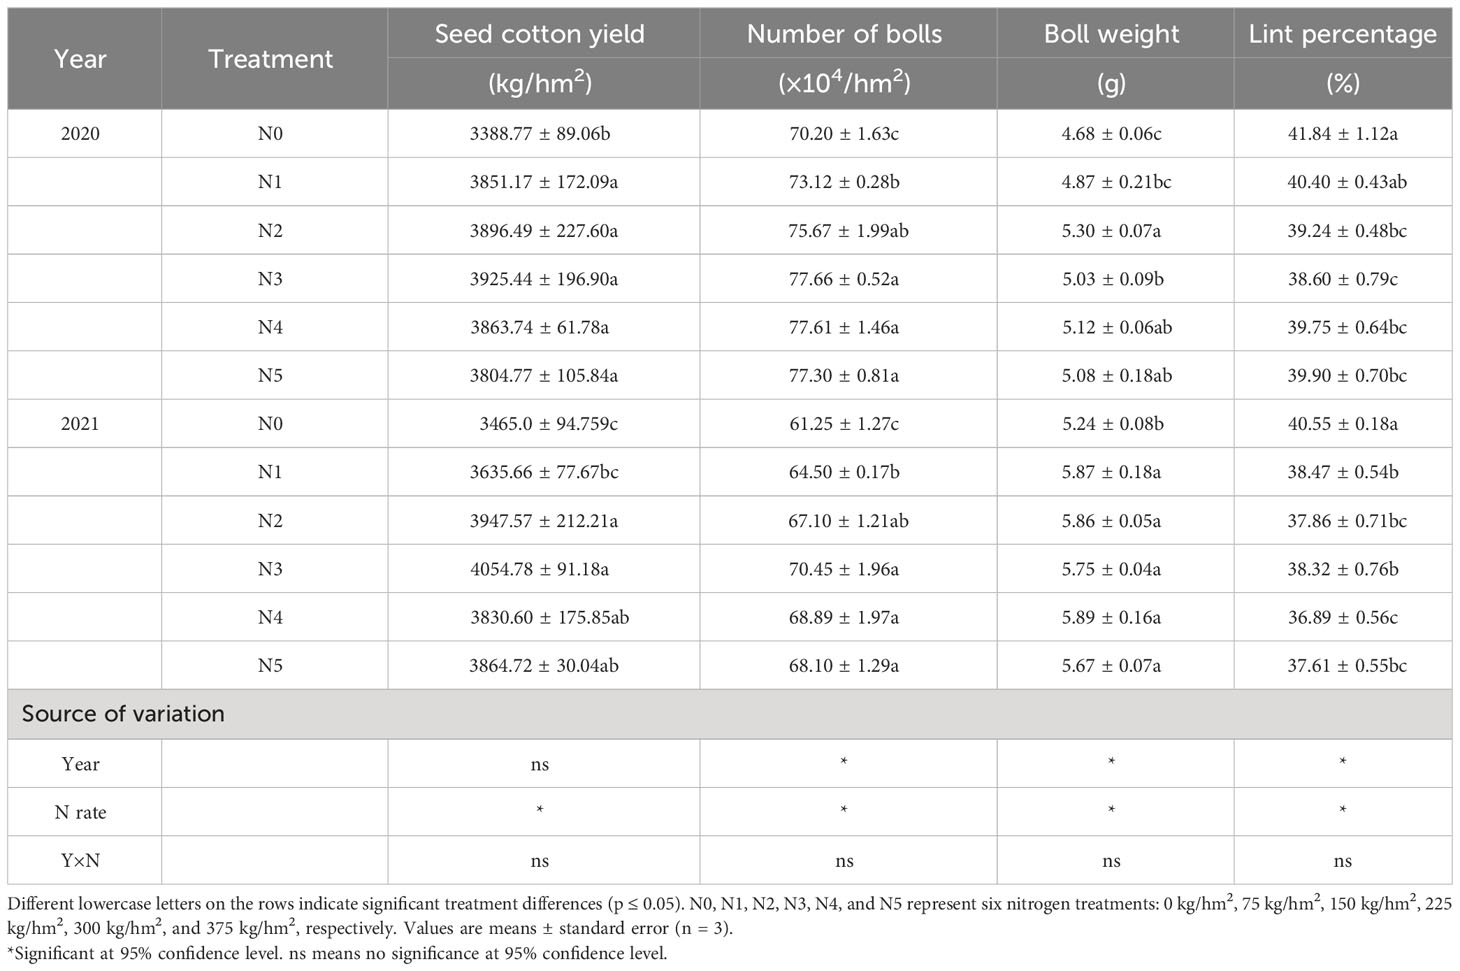
Table 6 Effects of different nitrogen treatments on cotton field yield and its related components.
Increasing the nitrogen application rate from N1 to N5 increased the SCY by 4.92%, 13.92%, 17.02%, 10.55%, and 11.53%, respectively. However, the same increments of N application gradually decreased the DM accumulation of the reproduction organs over the 2 years. In 2020, the proportion of reproduction organs under N1–N5 treatments decreased by 3.21%, 3.21%, 3.99%, 3.91%, and 4.66%, respectively, compared with N0. Similarly, the proportion of reproduction organs under N1–N5 treatment decreased by 1.59%, 2.49%, 4.26%, 4.22%, and 4.08%, respectively, in 2021. There was no significant difference between N3, N4, and N5 treatments (p ≤ 0.05).
The boll number per unit area fluctuated with increasing N application rate. In 2020 and 2021, N3 treatment generated the highest boll number per unit area. Boll number per unit area increased by 14.08%, 25.18%, 31.52%, 31.41%, and 31.75% under N1–N5 treatments in 2020. The boll number per unit area increased with an increasing N application rate (N1–N5), ranging from 12.99% to 34.78% in 2021. However, the boll weight was significantly lower under N0 than the other treatments. In 2020 and 2021, the boll weight increased with each level of N treatment, the highest occurring under N2 treatment in 2020 (13.25%) and N1 treatment in 2021 (12.02%). However, increasing the N application rate significantly decreased the lint percentage.
Different N application rates significantly affected nitrogen accumulation and nitrogen accumulation of the reproduction organs (Figure 2). During the opening stages in 2020 and 2021, treatments N5 and N3 caused the maximum nitrogen accumulation (31.75% and 35%, respectively) compared to N0. In 2020, each N treatment increased nitrogen accumulation of the vegetative organs and reproduction organs by 17.14%–30.81% and 2.92%–9.58%, respectively, compared to N0. At the opening stage, nitrogen accumulation of vegetative organs peaked under the N5 treatment, but that peak was not significantly different from the N3 and N4 treatments (Figure 3). Treatment N3 yielded the highest nitrogen accumulation of the reproduction organs, although the accumulation was not significantly different from N2, N4, and N5 treatments.
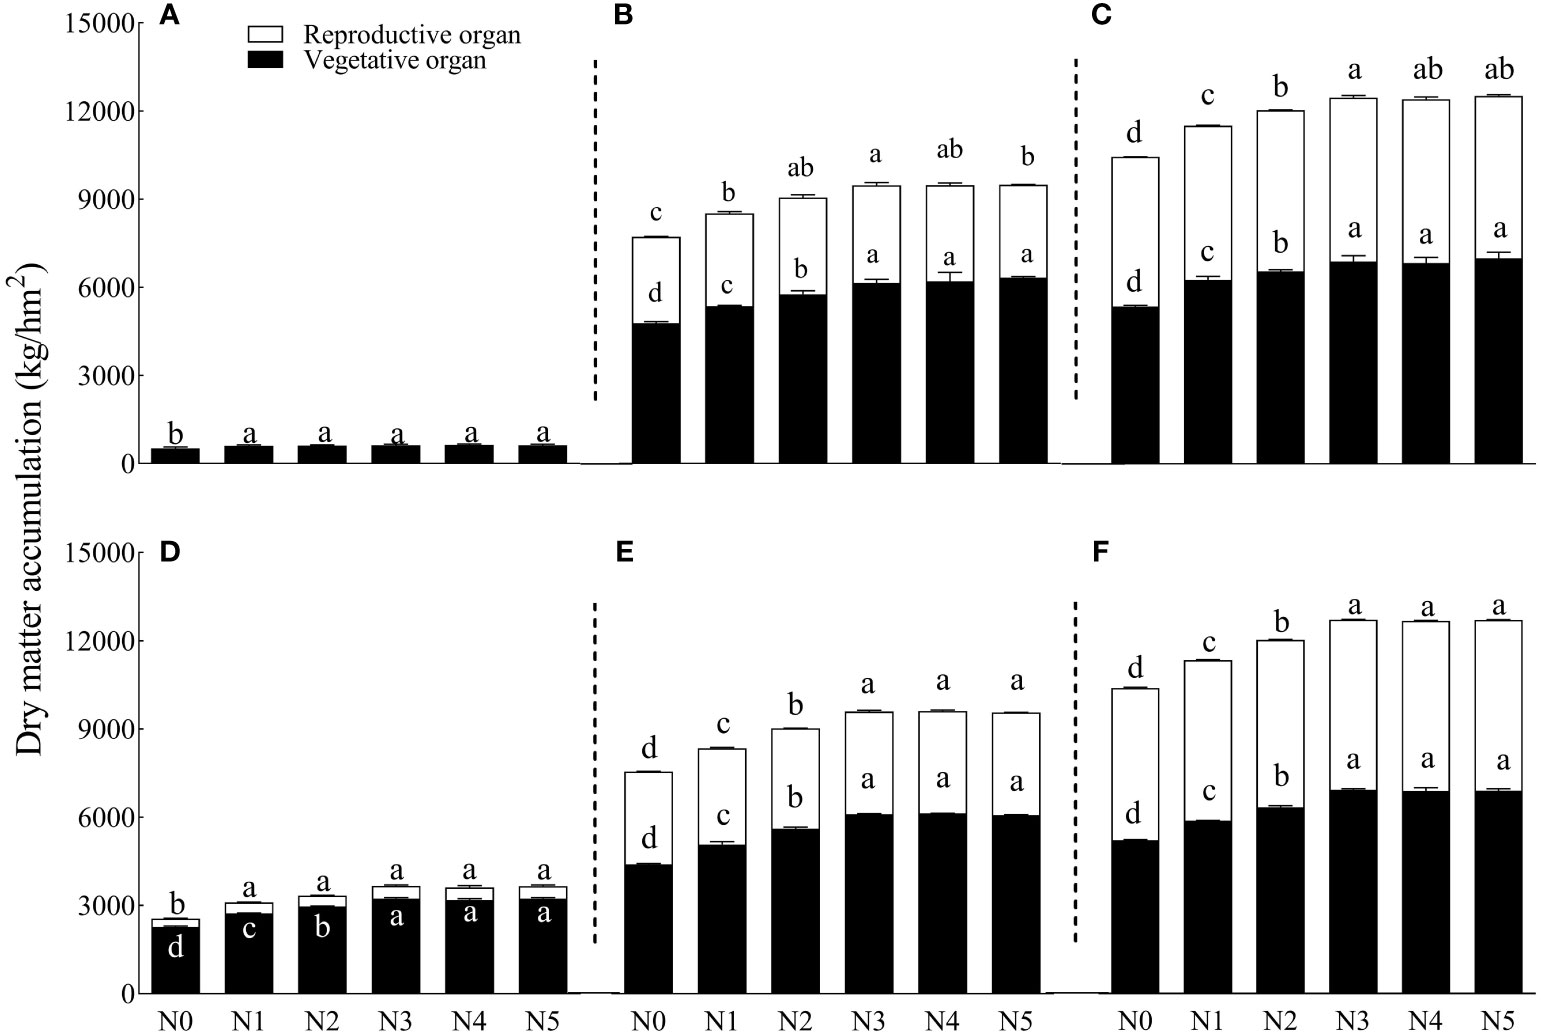
Figure 2 Effects of different nitrogen gradients on dry matter accumulation in vegetative and reproductive organs of cotton at different growth stages. Where 70 DAS, 100 DAS, and 130 DAS are represented by panels (A–C) for 2020 and by panels (D–F) for 2021, respectively. DAS, days after flowering. Different lowercase letters on the row indicate significant differences between treatments (p ≤ 0.05). N0, N1, N2, N3, N4, and N5 represent six nitrogen treatments: 0 kg/hm2, 75 kg/hm2, 150 kg/hm2, 225 kg/hm2, 300 kg/hm2, and 375 kg/hm2, respectively. Error bars are the standard errors of the means. DAS, days after sowing.
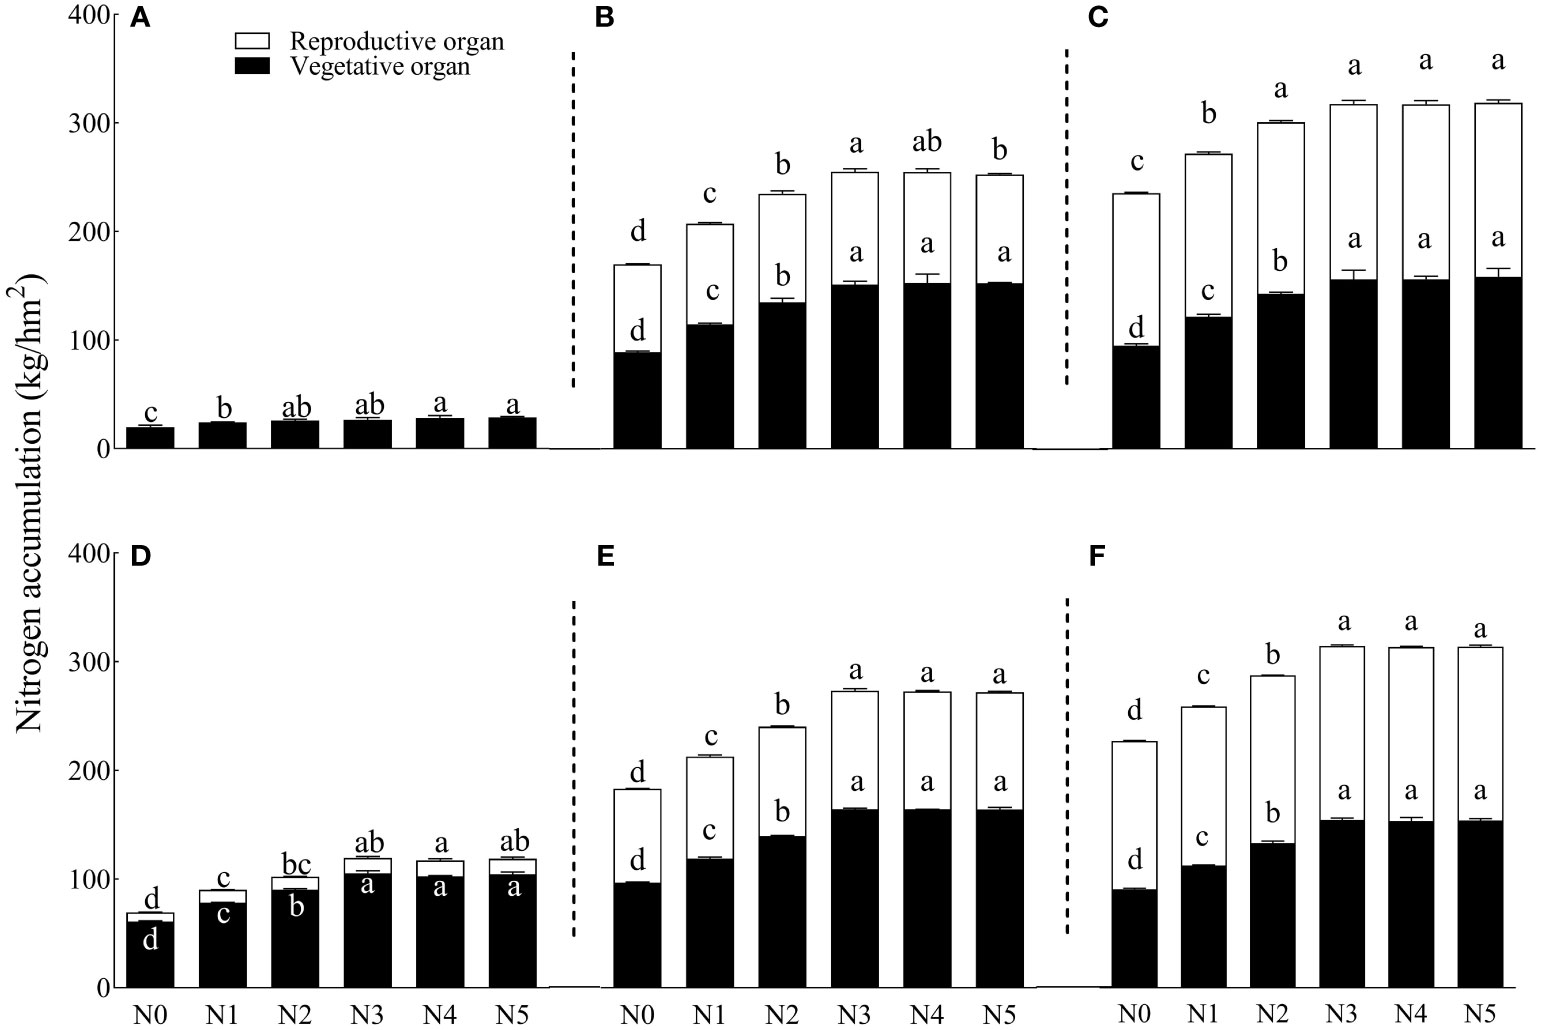
Figure 3 Effects of different nitrogen gradients on nitrogen accumulation in the vegetative and reproductive organs of cotton at different growth stages. Where 70 DAS, 100 DAS, and 130 DAS are represented by panels (A–C) for 2020 and by panels (D–F) for 2021, respectively. DAS, days after flowering. Different lowercase letters on the rows indicate significant treatment differences (p ≤ 0.05). N0, N1, N2, N3, N4, and N5 represent six nitrogen treatments: 0 kg/hm2, 75 kg/hm2, 150 kg/hm2, 225 kg/hm2, 300 kg/hm2, and 375 kg/hm2, respectively. Error bars are the standard errors of the means. DAS, days after sowing.
In 2021, each N treatment increased nitrogen accumulation of vegetative organs and reproduction organs by 12.67%–32.76% and 5.7%–11.01%, respectively, compared to the N0 treatment. Under the N3 treatment, nitrogen accumulation of vegetative organs peaked during the opening stage, but that peak was not significantly different from N4 and N5 treatments. Treatment N5 caused the highest nitrogen accumulation of reproduction organs. Treatment N0 accumulated the least N, significantly lower than the other N treatments.
3.4.3 Unary linear regression analysis of the effects of nitrogen application rate on cotton seed cotton yield
Applying 193.59 kg/hm2, 269.72 kg/hm2, 214.35 kg/hm2, 230.77 kg/hm2, and 309.22 kg/hm2 of N fertilizer caused maximum yields in 2017, 2018, 2019, 2020, and 2021, respectively (Table 7). The test site had sandy loam soil and received heavy rainfall during the 2021 growth period. This heavy rainfall caused soil N loss, increasing the N needed for maximum SCY. Therefore, the recommended N application range for sustainable cotton production in this area is 190 kg/hm2–270 kg/hm2. In rainy years, higher N input is required to ensure optimal yields.
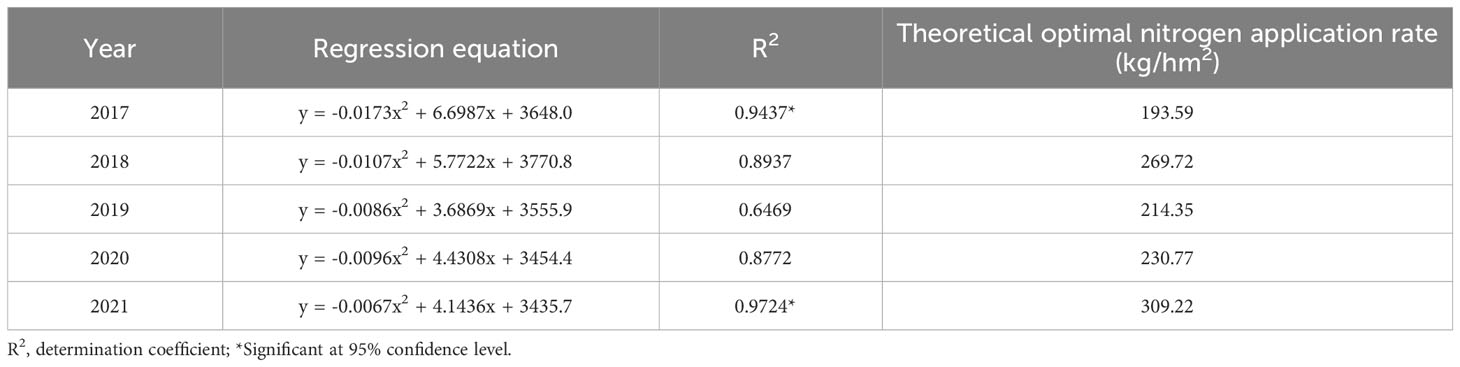
Table 7 Regression analysis of the effect of different nitrogen treatments on cotton seed yield over 5 years.
3.5 Correlation analysis
The STN content in the 0-cm–20-cm and 20-cm–40-cm soil layers significantly positively correlated with DM accumulation, DM accumulation of vegetative organs, DM accumulation of reproduction organs, SCY, and boll number per unit area (Figure 4). However, other indices negatively correlate with Pfpn. A significant positive correlation exists between SCY and the STN content in the 0-cm–20-cm soil layer. The boll number per unit area positively correlates with the STN content in the 0-cm–20-cm soil layer. However, there was a negative correlation between the boll number per unit area and iNUE. The iNUE is significant and negatively correlated with the STN content in the 0-cm–20-cm and 20-cm–40-cm soil layers.
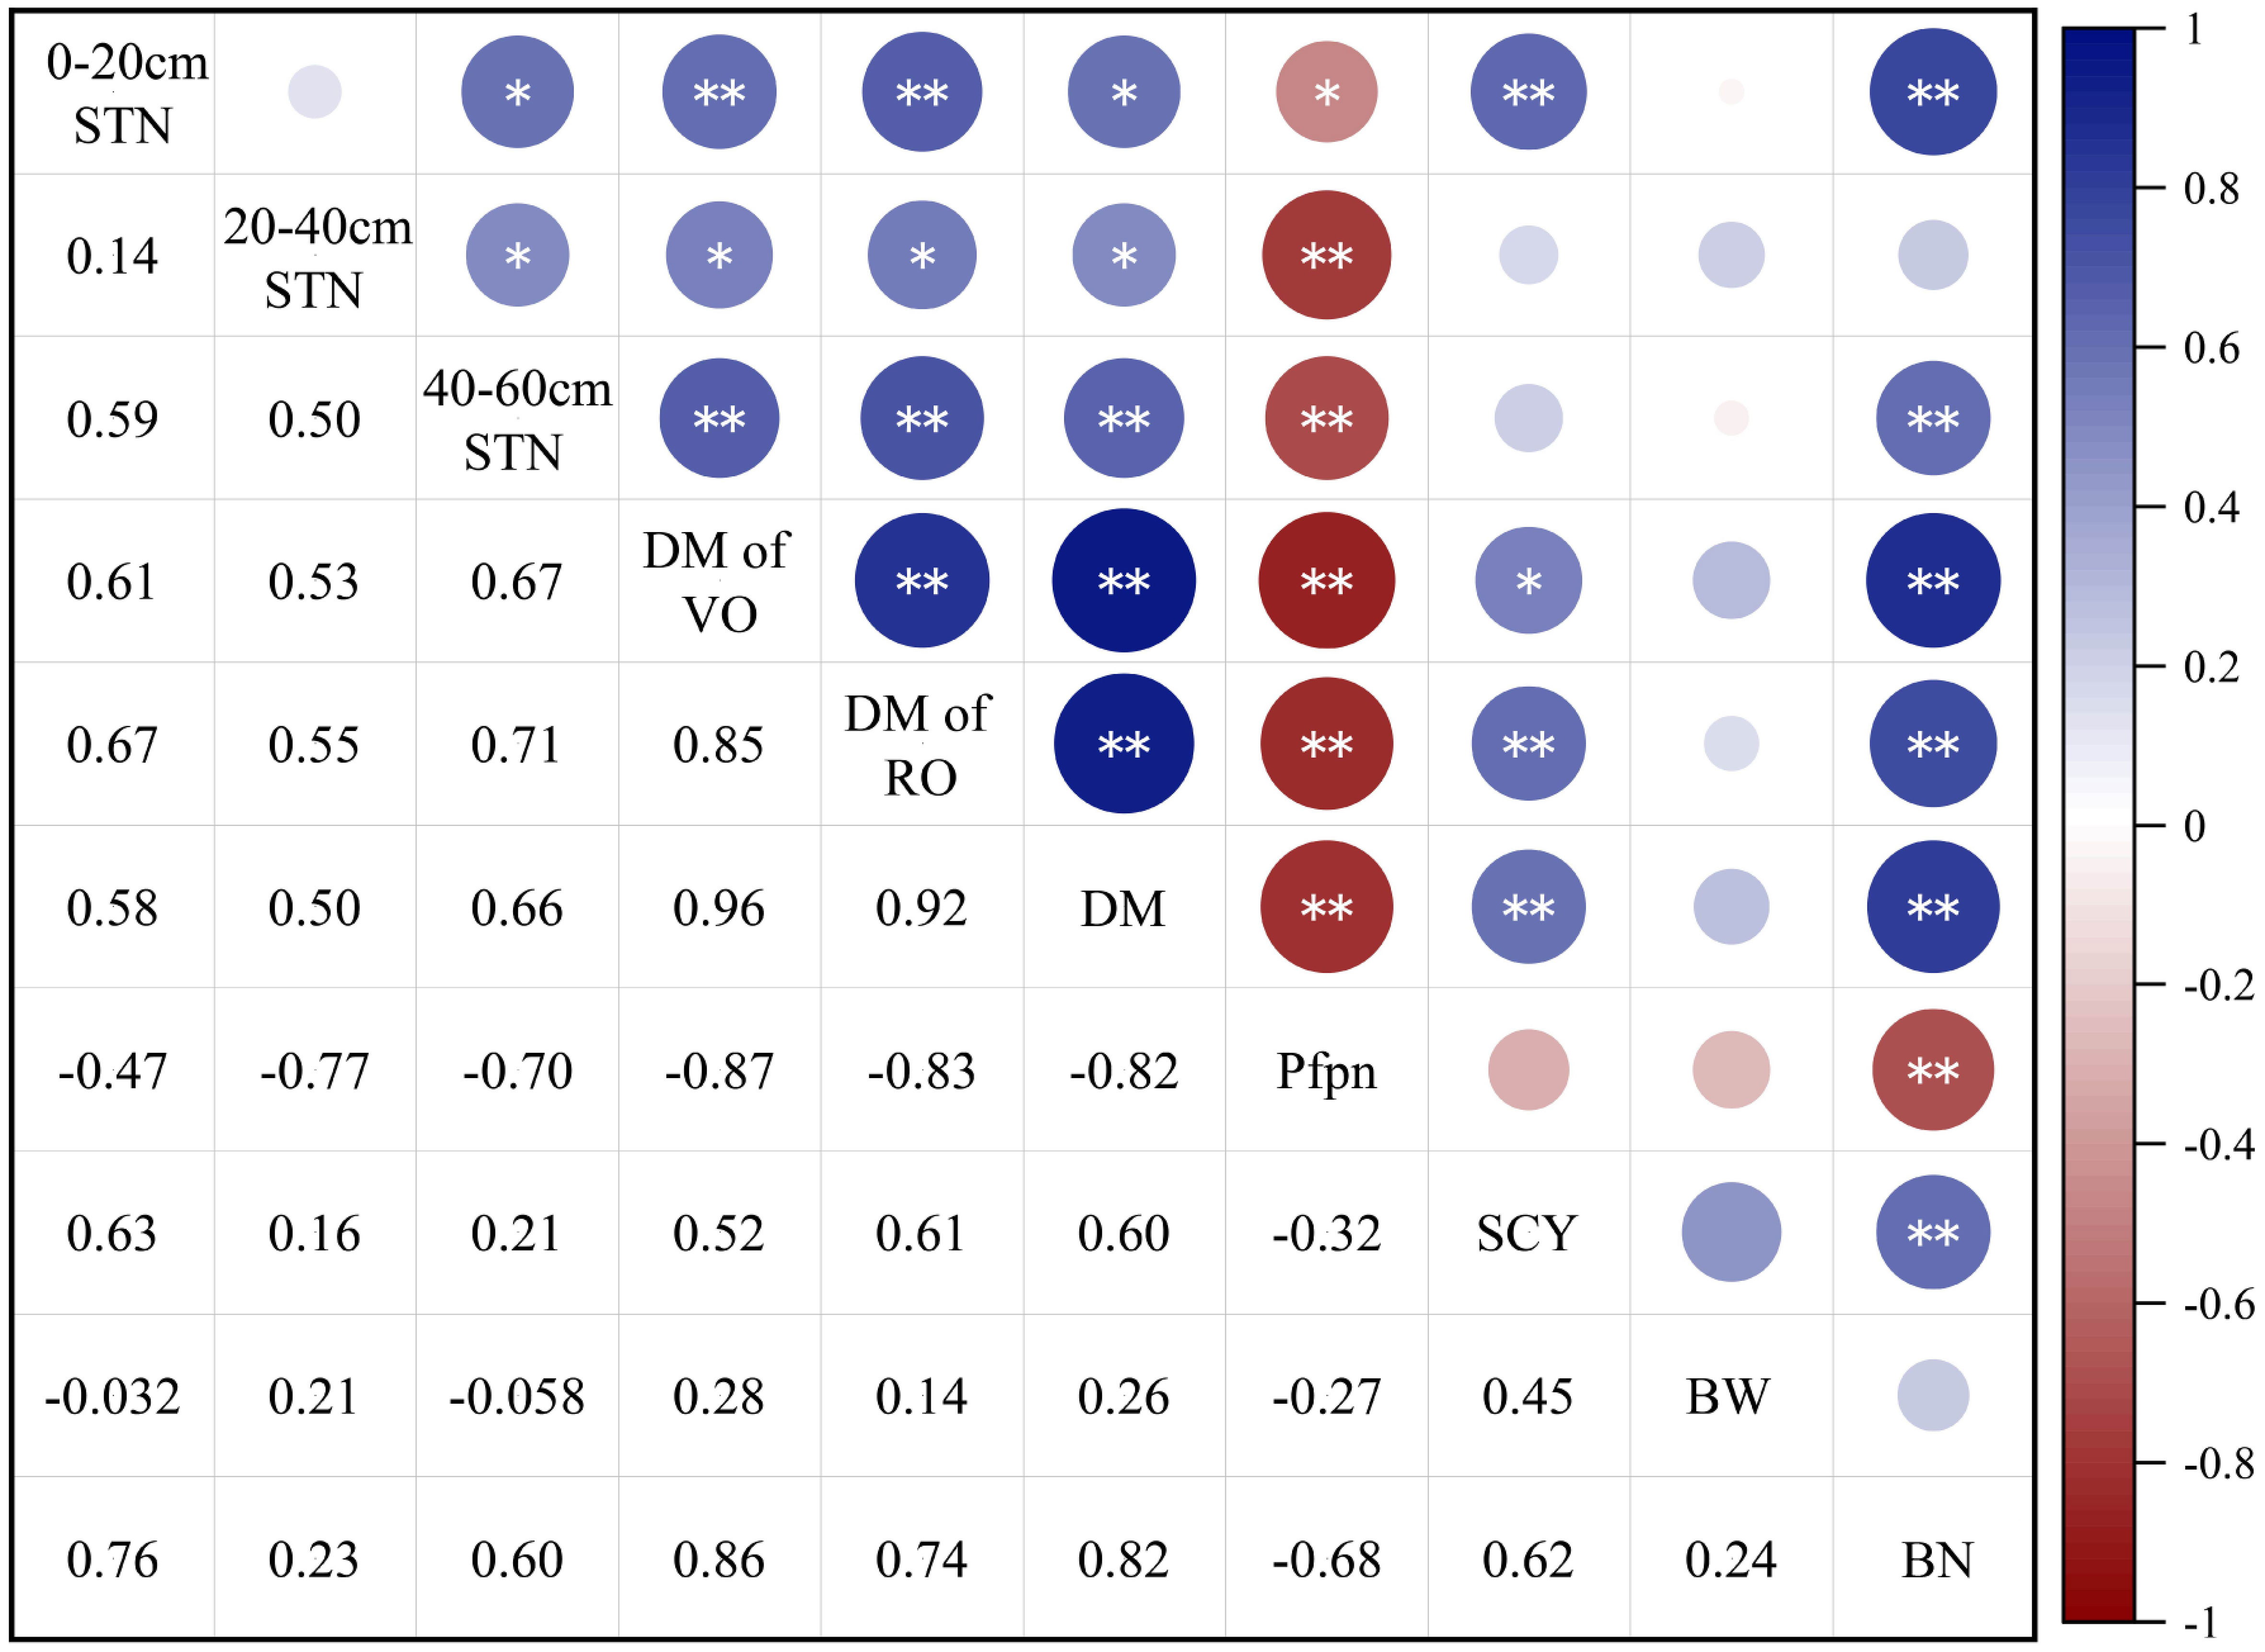
Figure 4 Correlation analysis of cotton growth and nitrogen utilization index under different nitrogen application rates. Numbers 1–10 represent the total nitrogen content in 0-cm–20-cm STN, 20-cm–40-cm STN, 40-cm–60-cm Soil total nitrogen (STN), dry matter of vegetative organs (DM of VO), dry matter of reproductive organs (DM of RO), DM, Pfpn, seed cotton yield (SCY), single boll weight (BW), and boll number per unit area (BN), and boll number per unit area (BN), respectively. *Significant at 95% confidence level. **Highly significant at 99% confidence level.
4 Discussion
4.1 Nitrogen accumulation in cotton fields
Accumulation of STN is long-term; thus, this study examined the effects of multiple years of fixed-point gradient N application on nitrogen accumulation in cotton fields. From 2017 to 2020, N application increased the total nitrogen and alkali-hydrolyzed nitrogen contents in the 0-cm–60-cm soil layers of each treatment. At 130 DAS, the STN content of the 0-cm–60-cm soil layer increased by 0.84% to 22.40% compared to the STN content before sowing. The STN content decreased with increasing soil depth (Table 2). Moreover, the STN content was higher in the 0-cm–40-cm than in the 40-cm–60-cm soil layer. The STN content was significantly lower in the N0 than in the other treatments. In contrast, the total nitrogen content was not significantly different between 225-kg/hm2 and 375-kg/hm2 N application treatments. Nonetheless, the soil nitrogen fertility level of each treatment remained low due to the poor fertilizer-retention characteristic of sandy loam soil. This study suggests that sole long-term N fertilizer application cannot maintain the soil nutrient levels (Su et al., 2006); hence, long-term single N application in loam soil has minimal effects on the STN content (Hai et al., 2010).
Various factors influence the soil environment, including microorganisms, precipitation, nutrient absorption, and crop utilization. The STN content in the 0-cm–20-cm layer significantly differed from the other layer. As the soil depth increased, the STN content of the 40-cm–60-cm soil differed significantly only among individual treatments because N accumulates in the soil profile slowly (Yang et al., 2011b). Moreover, increasing the soil depth decreased the STN content. After 19 years of continuous N application in loam soil, Duan et al. (2016) obtained similar results on the STN content in the 0-cm–40-cm soil layer. However, no significant difference was observed in the STN content beyond a soil depth of 40 cm, consistent with a previous report (Emiru and Gebrekidan, 2013). Moreover, the STN content in the 40-cm–100-cm soil layer significantly increased after 19 years of continuous N application, suggesting that excessive N application can cause the unabsorbed N by plants to enter the deeper soil layers. In contrast, residual N moves deeper into the soil beyond the root system, leading to N loss (Liu et al., 2017). This process occurs gradually and is challenging to detect. Therefore, reasonable N application rates are recommended to ensure optimal crop yield and prevent N loss (Ju et al., 2009).
Low N application rates cause soil N depletion. However, N application rates that exceed the crop demand lead to excess N in the soil or N loss (Fageria and Baligar, 2005). This study showed that the STN content was significantly higher in the eighth year after continuous fixed-point application of 225-kg/hm2–375-kg/hm2 N than in the N0 treatment. The 13-year experiment by Tian et al. (2018) showed that nitrogen accumulation was significantly increased in the 0-cm–20-cm soil layer at 180-kg/hm2 nitrogen application rate compared with long-term no-nitrogen treatment. The 17-year fertilizer trials by Tong et al. (2009) involving eight study sites also showed that long-term rational nitrogen application could increase the STN content in plow layers. Moreover, the experiment by Meng et al. (2005) also demonstrated that long-term fixed point quantitative nitrogen application could significantly increase STN content at 150-kg/hm2 nitrogen application rate. These results are similar to the long-term results of Aula et al. (2016) on sandy loam soil, proving that increasing the N application rate increases STN content.
4.2 Dry matter and nitrogen accumulation and utilization by cotton plants
Nitrogen is among the most important elements affecting plant growth (Dubey et al., 2021). Insufficient or excessive N application hinders DM accumulation in cotton (Boquet and Breitenbeck, 2000). This study showed that DM accumulated most with 225 kg/hm2 of N application in 2020 and 2021, improving the plant height, stem diameter, and fruit branch number. The DM decreased with the decreased or increased N application. Very low nitrogen levels probably caused nitrogen deficiency in cotton, and plants were unable to grow normally, thus affecting plant DM accumulation and growth and development of reproductive organs. However, higher levels caused excessive vegetative growth, inconducive for the growth and development of cotton bolls in the later period, hence, low DM. Therefore, non-optimal N application rates do not increase DM accumulation but decrease DM accumulation in cotton plants (Yang et al., 2011a). Wang et al. (2021) showed similar results, that ≤200 kg/hm2 of N decreased the DM accumulation of all organs.
Increasing the N application rate increased N accumulation (Geng et al., 2015; Wang et al., 2022). This study revealed a positive relationship between N and DM accumulation and distribution during different growth stages of cotton. DM accumulation of reproduction organs, nitrogen accumulation, and nitrogen accumulation of reproduction organs were higher in 2021 than those in 2020. This is due to the difference in DM accumulation and nitrogen accumulation caused by different precipitation in the 2 years. The precipitation difference between seasons led to different DM accumulation and nitrogen accumulation and the difference in reproduction organs growth under the same N application (Mullins and Burmester, 1990). This study also showed that cotton plants that received little or no N fertilizer for an extended period exhibited weak growth and insufficient nutrients, weakening the reproductive growth. The reproduction organs are the primary nitrogen-distributing organs in the flower-boll and withdrawal stages, accounting for >50% of the distribution. Therefore, plants that did not receive N fertilizer for a year accumulated significantly lower N than N-fertilized plants. Therefore, appropriately increasing the N application rate can effectively improve the total DM accumulation in cotton plants and the reproduction organs, resulting in a higher cotton yield. However, excessive N application can inhibit the transport of photosynthetic products to the reproduction organs, negatively impacting the accumulation of nutrient elements in cotton plants and hindering plant growth and N absorption (Fritschi et al., 2003). The early growth stage is characterized by vigorous vegetative growth, but the period from flowering to flopping is crucial for DM accumulation. During this flowering to opening stage, cotton plants have a high nutrient demand, and reproductive growth is more crucial than vegetative growth (Chen et al., 2010). Thus, reproductive organs become the primary DM accumulation distribution organs. Similarly, this experiment demonstrated that cotton plants treated with 300 kg/hm2 of N accumulated more DM accumulation, with higher DM accumulation allocations to the reproduction organs. Increasing the N application rate to 450 kg/hm2 caused the largest DM accumulation, but a low proportion was distributed to the reproduction organs, unbalancing the source–sink relationship (Ma et al., 2013). Hence, a lack of N suppresses cotton growth and development, and excessive N also inhibits the reproductive growth of cotton (Leghari et al., 2016).
N application level impacted the NUE of cotton fields by decreasing NUE with increasing N application levels. Increasing the N application rate increased the recovery rate and internal utilization rate and significantly decreased the partial productivity of N (Zhang et al., 2012). Additionally, higher N application rates decreased the aNUE and pNUE in 2020. In 2021, aNUE and pNUE increased to the maximum (150 kg/hm2) and then decreased with increasing N application rate. This difference might have been due to the difference in precipitation, which caused N nitrification and ammonia volatilization, thus reducing NUE in 2021 compared with that in 2020. Studies have shown that crops absorb only 25%–50% of the applied N, indicating relatively low NUE (Chien et al., 2016). Relevant research showed that excessive N fertilization leads to low NUE and economic losses. However, optimizing the amount of nitrogen increased the soil nutrient content, soil catalase, urease, acid phosphatase, and invertase activities, generating a coarse soil texture (Malhi et al., 2010; Chen et al., 2021). Therefore, optimizing the N application rates based on regional production conditions, yield, and N absorption and utilization is crucial for reducing soil pollution, maintaining crop yield, improving NUE, and sustainable farmland development (Stamatiadis et al., 2016).
4.3 Yield components
Adequate nitrogen fertilizer application is an important prerequisite for good yield formation (Khan et al., 2017a). The experiment demonstrated that prolonged periods of no N application or low application rates significantly reduced cotton yield. The SCY and yield components were the lowest at 0-kg/hm2 N application rate. Appropriate N application enhanced SCY. However, excessive N application over an extended period did not continually increase the SCY, resulting in fertilizer wastage. Increasing the N application rate initially increased the boll number per unit area of cotton. The number of bolls per unit area reached the maximum under the 225-kg/hm2 nitrogen rate in 2020 and 2021. Other nitrogen rates decreased the same because no or low nitrogen application treatment implies insufficient nitrogen supply for the development of reproductive organs. In contrast, excessive nitrogen application promotes vegetative growth, inconducive for high yield and other yield-constituent factors. Additionally, increasing the N application rate decreased the lint fraction, suggesting that lack of or reduced N application rates reduce cotton yield and yield components. The results of this study are consistent with previous research (Devkota et al., 2013; Zonta et al., 2016; Li et al., 2017)
Multiple factors, including climate, soil, and cultivated varieties, determine the appropriate N application rate for cotton (Constable and Bange, 2015). For instance, 0 kg/hm2–360 kg/hm2 of N application increases the SCY (Min et al., 2014). In loam tidal soils, 360 kg/hm2 of N fertilization caused the highest SCY (with an STN content of 4 over 3-year experimentation) (Pengcheng et al., 2015). Furthermore, applying 225 kg/hm2–300 kg/hm2 of N to medium- and superior-fertility soil increased yield, but 375 kg/hm2 decreased yield (Li et al., 2010). Meanwhile, Xue et al. (2006) showed that 360 kg/hm2 achieved an optimal yield in the Anyang experiment site characterized by low STN content and 240 kg/hm2 in the high-fertility Nanjing site with clay soil. A regression analysis of the 5-year experimental results established that 190 kg/hm2 and 270 kg/hm2 are the optimal N application rates for sustainable cotton production in these regions.
5 Conclusions
The results of the 2-year field experiment based on the 6-year long-term positioning experiment showed that N application greatly affected the N content in sandy loam cotton fields. The STN content decreased, and the difference between the soil layers weakened with increasing soil depth (0 cm–20 cm, 40 cm–60 cm, 40 cm–60 cm). The STN content did not significantly increase at 300-kg/hm2 and 375-kg/hm2 N application rates. Additionally, the N absorption by cotton plants increased with increased N application. However, it decreased the NUE in cotton fields. When the N application rate exceeded 225 kg/hm2, the DM accumulation and nitrogen accumulation declined. Planting without N fertilizer or insufficient N application weakens the reproductive growth of cotton plants and greatly reduces the boll number per unit area and boll weight. Therefore, the suitable range of nitrogen fertilization for cotton in the sandy loam soil of the Yellow River Basin is 190 kg/hm2–270 kg/hm2. This study provides a basis for rational N application in cotton fields under sandy loam soil in the Yellow River Basin, providing theoretical support for NUE and improving ecological environments in cotton fields.
Data availability statement
The raw data supporting the conclusions of this article will be made available by the authors, without undue reservation.
Author contributions
YM: Data curation, Formal Analysis, Investigation, Methodology, Writing – original draft. HS: Writing – original draft, Data curation, Formal Analysis, Investigation. YY: Writing – original draft, Software, Data curation, Investigation, Methodology. ZL: Data curation, Investigation, Methodology, Writing – original draft. PL: Data curation, Investigation, Writing – original draft. YQ: Data curation, Formal Analysis, Investigation, Methodology, Writing – original draft. YZ: Data curation, Investigation, Writing – original draft. KZ: Methodology, Writing – original draft. ZB: Methodology, Writing – original draft. AL: Formal Analysis, Writing – original draft. CL: Conceptualization, Funding acquisition, Validation, Writing – review & editing. LL: Conceptualization, Funding acquisition, Validation, Writing – review & editing.
Funding
The author(s) declare financial support was received for the research, authorship, and/or publication of this article. This study was supported by grants from the National Natural Science Foundation of China (No. 32272220 and 32172120), the Natural Science Foundation of Hebei Province (No. C2021204140) and the Modern System of Agricultural Technology in Hebei Province (No. HBCT2023070207).
Conflict of interest
The authors declare that the research was conducted in the absence of any commercial or financial relationships that could be construed as a potential conflict of interest.
Publisher’s note
All claims expressed in this article are solely those of the authors and do not necessarily represent those of their affiliated organizations, or those of the publisher, the editors and the reviewers. Any product that may be evaluated in this article, or claim that may be made by its manufacturer, is not guaranteed or endorsed by the publisher.
References
Aula, L., Macnack, N., Omara, P., Mullock, J., Raun, W. (2016). Effect of fertilizer nitrogen (N) on soil organic carbon, total N, and soil pH in long-term continuous winter wheat (Triticum aestivum L.). Commun. Soil Sci. Plant Anal. 47 (7), 863–874. doi: 10.1080/00103624.2016.1147047
Aulakh, M. S., Malhi, S. S. (2005). Interactions of nitrogen with other nutrients and water: Effect on crop yield and quality, nutrient use efficiency, carbon sequestration, and environmental pollution. Adv. Agron. 86, 341–409. doi: 10.1016/S0065-2113(05)86007-9
Boquet, D. J., Breitenbeck, G. A. (2000). Nitrogen rate effect on partitioning of nitrogen and dry matter by cotton. Crop Sci. 40 (6), 1685–1693. doi: 10.2135/cropsci2000.4061685x
Boselli, R., Fiorini, A., Santelli, S., Ardenti, F., Capra, F., Maris, S. C., et al. (2020). Cover crops during transition to no-till maintain yield and enhance soil fertility in intensive agro-ecosystems. Field Crops Res. 255, 107871. doi: 10.1016/j.fcr.2020.107871
Cassman, K. G., Dobermann, A., Walters, D. T. (2002). Agroecosystems, nitrogen-use efficiency, and nitrogen management. AMBIO: A J. Hum. Environ. 31 (2), 132–140. doi: 10.1579/0044-7447-31.2.132
Chen, W., Hou, Z., Wu, L., Liang, Y., Wei, C. (2010). Effects of salinity and nitrogen on cotton growth in arid environment. Plant Soil 326, 61–73. doi: 10.1007/s11104-008-9881-0
Chen, J., Liu, L., Wang, Z., Sun, H., Zhang, Y., Lu, Z., et al. (2018a). Determining the effects of nitrogen rate on cotton root growth and distribution with soil cores and minirhizotrons. PloS One 13 (5), e0197284. doi: 10.1371/journal.pone.0197284
Chen, Z., Tao, X., Khan, A., Tan, D. K., Luo, H. (2018b). Biomass accumulation, photosynthetic traits and root development of cotton as affected by irrigation and nitrogen-fertilization. Front. Plant Sci. 9. doi: 10.3389/fpls.2018.00173
Chen, L., Xie, H., Wang, G., Yuan, L., Qian, X., Wang, W., et al. (2021). Reducing environmental risk by improving crop management practices at high crop yield levels. Field Crops Res. 265, 108123. doi: 10.1016/j.fcr.2021.108123
Chien, S. H., Teixeira, L. A., Cantarella, H., Rehm, G. W., Grant, C. A., Gearhart, M. M. (2016). Agronomic effectiveness of granular nitrogen/phosphorus fertilizers containing elemental sulfur with and without ammonium sulfate: A review. Agron. J. 108 (3), 1203–1213. doi: 10.2134/agronj2015.0276
Chu, H., Lin, X., Fujii, T., Morimoto, S., Yagi, K., Hu, J., et al. (2007). Soil microbial biomass, dehydrogenase activity, bacterial community structure in response to long-term fertilizer management. Soil Biol. Biochem. 39 (11), 2971–2976. doi: 10.1016/j.soilbio.2007.05.031
Constable, G. A., Bange, M. P. (2015). The yield potential of cotton (Gossypium hirsutum L.). Field Crops Res. 182, 98–106. doi: 10.1016/j.fcr.2015.07.017
Dai, J., Dong, H. (2014). Intensive cotton farming technologies in China: Achievements, challenges and countermeasures. Field Crops Res. 155, 99–110. doi: 10.1016/j.fcr.2013.09.017
Devkota, M., Martius, C., Lamers, J., Sayre, K., Devkota, K., Vlek, P. L. (2013). Tillage and nitrogen fertilization effects on yield and nitrogen use efficiency of irrigated cotton. Soil Tillage Res. 134, 72–82. doi: 10.1016/j.still.2013.07.009
Ding, M.-Q., Yang, S.-S., Ding, J., Zhang, Z.-R., Zhao, Y.-L., Dai, W., et al. (2023). Gut Microbiome Associating with Carbon and Nitrogen Metabolism during Biodegradation of Polyethene in Tenebrio larvae with Crop Residues as Co-Diets. Environ. Sci. Technol. 57 (8), 3031–3041. doi: 10.1021/acs.est.2c05009
Dong, X., Ying, Z., Chen, Z.-f., Chao, H., Lei, H., Shi, Q., et al. (2020). Yield characteristics of japonica/indica hybrids rice in the middle and lower reaches of the Yangtze River in China. J. Integr. Agric. 19 (10), 2394–2406. doi: 10.1016/S2095-3119(19)62872-8
Duan, Y., Xu, M., Gao, S., Liu, H., Huang, S., Wang, B. (2016). Long-term incorporation of manure with chemical fertilizers reduced total nitrogen loss in rain-fed cropping systems. Sci. Rep. 6 (1), 33611. doi: 10.1038/srep33611
Dubey, R. S., Srivastava, R. K., Pessarakli, M. (2021). “Physiological mechanisms of nitrogen absorption and assimilation in plants under stressful conditions,” in Handbook of plant and crop physiology (New York: CRC Press), 579–616.
Emiru, N., Gebrekidan, H. (2013). Effect of land use changes and soil depth on soil organic matter, total nitrogen and available phosphorus contents of soils in Senbat Watershed, Western Ethiopia. ARPN J. Agric. Biol. Sci. 8 (3), 206–212.
Fageria, N. K., Baligar, V. (2005). Enhancing nitrogen use efficiency in crop plants. Adv. Agron. 88, 97–185. doi: 10.1016/S0065-2113(05)88004-6
Fritschi, F. B., Roberts, B. A., Travis, R. L., Rains, D. W., Hutmacher, R. B. (2003). Response of irrigated Acala and Pima cotton to nitrogen fertilization: Growth, dry matter partitioning, and yield. Agron. J. 95 (1), 133–146. doi: 10.2134/agronj2003.1330a
Ge, S., Zhu, Z., Jiang, Y. (2018). Long-term impact of fertilization on soil pH and fertility in an apple production system. J. Soil Sci. Plant Nutr. 18 (1), 282–293. doi: 10.4067/S0718-95162018005001002
Geng, J., Ma, Q., Zhang, M., Li, C., Liu, Z., Lyu, X., et al. (2015). Synchronized relationships between nitrogen release of controlled release nitrogen fertilizers and nitrogen requirements of cotton. Field Crops Res. 184, 9–16. doi: 10.1016/j.fcr.2015.09.001
Grant, C. A., O’Donovan, J. T., Blackshaw, R. E., Harker, K. N., Johnson, E. N., Gan, Y., et al. (2016). Residual effects of preceding crops and nitrogen fertilizer on yield and crop and soil N dynamics of spring wheat and canola in varying environments on the Canadian prairies. Field Crops Res. 192, 86–102. doi: 10.1016/j.fcr.2016.04.019
Guo, Y., Chen, Y., Searchinger, T. D., Zhou, M., Pan, D., Yang, J., et al. (2020). Air quality, nitrogen use efficiency and food security in China are improved by cost-effective agricultural nitrogen management. Nat. Food 1 (10), 648–658. doi: 10.1038/s43016-020-00162-z
Hai, L., Li, X. G., Li, F. M., Suo, D. R., Guggenberger, G. (2010). Long-term fertilization and manuring effects on physically-separated soil organic matter pools under a wheat–wheat–maize cropping system in an arid region of China. Soil Biol. Biochem. 42 (2), 253–259. doi: 10.1016/j.soilbio.2009.10.023
Iqbal, A., Dong, Q., Wang, X., Gui, H., Zhang, H., Zhang, X., et al. (2020). Variations in nitrogen metabolism are closely linked with nitrogen uptake and utilization efficiency in cotton genotypes under various nitrogen supplies. Plants 9 (2), 250. doi: 10.3390/plants9020250
Iqbal, A., Raza, H., Zaman, M., Khan, R., Adnan, M., Khan, A., et al. (2022). Impact of nitrogen, zinc and humic acid application on wheat growth, morphological traits, yield and yield components. J. Soil Plant Environ. 1 (1), 50–71. doi: 10.56946/jspae.v1i1.11
Jiang, B., Jianlin, S., Minghong, S. U. N. (2021). Soil phosphorus availability and rice phosphorus uptake in paddy fields under various agronomic practices. Pedosphere 31 (1), 103–115. doi: 10.1016/S1002-0160(20)60053-4
Ju, X.-T., Xing, G.-X., Chen, X.-P., Zhang, S.-L., Zhang, L.-J., Liu, X.-J., et al. (2009). Reducing environmental risk by improving N management in intensive Chinese agricultural systems. Proc. Natl. Acad. Sci. 106 (9), 3041–3046. doi: 10.1073/pnas.081341710
Kaiyong, W., Hua, F., Ranab, T., Hanjrac, M. A., Bo, D., Huan, L., et al. (2011). Changes in soil carbon and nitrogen under long-term cotton plantations in China. J. Agric. Sci. 149 (4), 497–505. doi: 10.1017/S0021859611000049
Khan, A., Tan, D. K. Y., Munsif, F., Afridi, M. Z., Shah, F., Wei, F., et al. (2017a). Nitrogen nutrition in cotton and control strategies for greenhouse gas emissions: a review. Environ. Sci. pollut. Res. 24 (30), 23471–23487. doi: 10.1007/s11356-017-0131-y
Khan, A., Wang, L., Ali, S., Tung, S. A., Hafeez, A., Yang, G. (2017b). Optimal planting density and sowing date can improve cotton yield by maintaining reproductive organ biomass and enhancing potassium uptake. Field Crops Res. 214, 164–174. doi: 10.1016/j.fcr.2017.09.016
Leghari, S. J., Wahocho, N. A., Laghari, G. M., HafeezLaghari, A., MustafaBhabhan, G., HussainTalpur, K., et al. (2016). Role of nitrogen for plant growth and development: a review. Adv. Environ. Biol. 10, 209+.
Li, P., Dong, H., Zheng, C., Sun, M., Liu, A., Wang, G., et al. (2017). Optimizing nitrogen application rate and plant density for improving cotton yield and nitrogen use efficiency in the North China Plain. PloS One 12 (10), e0185550. doi: 10.1371/journal.pone.0185550
Li, L., Fang, W., Ma, Z., Xie, D., Zhang, D. (2010). Effects of nitrogen fertilization on uptake and utilization of NPK and yield and quality of hybrid cotton. Plant Nutr. Fertilizer Sci. 16 (3), 663–667.
Li, X., Liu, H., He, X., Gong, P., Lin, E. (2019). Water–nitrogen coupling and multi-objective optimization of cotton under mulched drip irrigation in arid northwest China. Agronomy 9 (12), 894. doi: 10.3390/agronomy9120894
Lin, X.-q., Zhu, D.-f., Chen, H.-z., Zhang, Y.-p. (2009). Effects of plant density and nitrogen application rate on grain yield and nitrogen uptake of super hybrid rice. Rice Sci. 16 (2), 138–142. doi: 10.1016/S1672-6308(08)60070-0
Liu, Z., Chen, Z., Ma, P., Meng, Y., Zhou, J. (2017). Effects of tillage, mulching and N management on yield, water productivity, N uptake and residual soil nitrate in a long-term wheat-summer maize cropping system. Field Crops Res. 213, 154–164. doi: 10.1016/j.fcr.2017.08.006
Luo, Z., Liu, H., Li, W., Zhao, Q., Dai, J., Tian, L., et al. (2018). Effects of reduced nitrogen rate on cotton yield and nitrogen use efficiency as mediated by application mode or plant density. Field Crops Res. 218, 150–157. doi: 10.1016/j.fcr.2018.01.003
Ma, Z., Yan, G., Liu, G. (2013). Effects of nitrogen application rates on main physiological characteristics of leaves, dry matter accumulation and yield of cotton cultivated in the Yellow River bottomlands. J. Plant Nutr. Fertilizer 19 (4), 849–857. doi: 10.11674/zwyf.2015.0109
Malhi, S., Soon, Y., Grant, C., Lemke, R., Lupwayi, N. (2010). Influence of controlled-release urea on seed yield and N concentration, and N use efficiency of small grain crops grown on Dark Gray Luvisols. Can. J. Soil Sci. 90 (2), 363–372. doi: 10.4141/CJSS09102
Meng, L., Ding, W., Cai, Z. (2005). Long-term application of organic manure and nitrogen fertilizer on N2O emissions, soil quality and crop production in a sandy loam soil. Soil Biol. Biochem. 37 (11), 2037–2045. doi: 10.1016/j.soilbio.2005.03.007
Min, W., Hou, Z., Ma, L., Zhang, W., Ru, S., Ye, J. (2014). Effects of water salinity and N application rate on water-and N-use efficiency of cotton under drip irrigation. J. Arid land 6, 454–467. doi: 10.1007/s40333-013-0250-3
Mullins, G. L., Burmester, C. H. (1990). Dry matter, nitrogen, phosphorus, and potassium accumulation by four cotton varieties. Agron. J. 82 (4), 729–736. doi: 10.2134/agronj1990.00021962008200040017x
Munir, M., Tahir, M., Saleem, M., Yaseen, M. (2015). Growth, yield and earliness response of cotton to row spacing and nitrogen management. JAPS: J. Anim. Plant Sci. 25 (3), 729–738.
Ning, C., Liu, R., Kuang, X., Chen, H., Tian, J., Cai, K. (2022). Nitrogen fertilizer reduction combined with biochar application maintain the yield and nitrogen supply of rice but improve the nitrogen use efficiency. Agronomy 12 (12), 3039. doi: 10.3390/agronomy12123039
Niu, J., Gui, H., Iqbal, A., Zhang, H., Dong, Q., Pang, N., et al. (2020). N-use efficiency and yield of cotton (G. hirsutumn L.) are improved through the combination of N-fertilizer reduction and N-efficient cultivar. Agronomy 11 (1), 55. doi: 10.3390/agronomy11010055
Pengcheng, L., Helin, D., Aizhong, L., Jingran, L., Ruyi, L., Miao, S., et al. (2015). Effects of nitrogen application rates on physiological characteristics of functional leaves, nitrogen use efficiency and yield of cotton. J. Plant Nutr. Fertilizers 21 (1), 81–91. doi: 10.11674/zwyf.2015.0109
Sepaskhah, A. R., Tafteh, A. (2012). Yield and nitrogen leaching in rapeseed field under different nitrogen rates and water saving irrigation. Agric. Water Manage. 112, 55–62. doi: 10.1016/j.agwat.2012.06.005
Shah, A. N., Javed, T., Singhal, R. K., Shabbir, R., Wang, D., Hussain, S., et al. (2022). Nitrogen use efficiency in cotton: Challenges and opportunities against environmental constraints. Front. Plant Sci. 13. doi: 10.3389/fpls.2022.970339
Shao, H., Shi, D., Shi, W., Ban, X., Chen, Y., Ren, W., et al. (2019). Genotypic difference in the plasticity of root system architecture of field-grown maize in response to plant density. Plant Soil 439 (1), 201–217. doi: 10.1007/s11104-019-03964-8
Shiwakoti, S., Zheljazkov, V. D., Gollany, H. T., Kleber, M., Xing, B. (2019). Macronutrients in soil and wheat as affected by a long-term tillage and nitrogen fertilization in winter wheat–fallow rotation. Agronomy 9 (4), 178. doi: 10.3390/agronomy9040178
Snider, J., Harris, G., Roberts, P., Meeks, C., Chastain, D., Bange, M., et al. (2021). Cotton physiological and agronomic response to nitrogen application rate. Field Crops Res. 270, 108194. doi: 10.1016/j.fcr.2021.108194
Stamatiadis, S., Tsadilas, C., Samaras, V., Schepers, J. S., Eskridge, K. (2016). Nitrogen uptake and N-use efficiency of Mediterranean cotton under varied deficit irrigation and N fertilization. Eur. J. Agron. 73, 144–151. doi: 10.1016/j.eja.2015.11.013
Su, Y.-Z., Wang, F., Suo, D.-R., Zhang, Z.-H., Du, M.-W. (2006). Long-term effect of fertilizer and manure application on soil-carbon sequestration and soil fertility under the wheat–wheat–maize cropping system in northwest China. Nutrient Cycling Agroecosystems 75, 285–295. doi: 10.1007/s10705-006-9034-x
Sutton, M. A., Howard, C. M., Erisman, J. W., Bealey, W. J., Billen, G., Bleeker, A., et al. (2011). The challenge to integrate nitrogen science and policies: the European Nitrogen Assessment approach. The European Nitrogen Assessment: Sources, Effects and Policy Perspectives, Cambridge: Cambridge University Press 82–96. doi: 10.1017/CBO9780511976988.008
Tian, X., Li, C., Zhang, M., Li, T., Lu, Y., Liu, L. (2018). Controlled release urea improved crop yields and mitigated nitrate leaching under cotton-garlic intercropping system in a 4-year field trial. Soil Tillage Res. 175, 158–167. doi: 10.1016/j.still.2017.08.015
Tong, C., Xiao, H., Tang, G., Wang, H., Huang, T., Xia, H., et al. (2009). Long-term fertilizer effects on organic carbon and total nitrogen and coupling relationships of C and N in paddy soils in subtropical China. Soil Tillage Res. 106 (1), 8–14. doi: 10.1016/j.still.2009.09.003
Wang, Q., Li, F., Zhao, L., Zhang, E., Shi, S., Zhao, W., et al. (2010). Effects of irrigation and nitrogen application rates on nitrate nitrogen distribution and fertilizer nitrogen loss, wheat yield and nitrogen uptake on a recently reclaimed sandy farmland. Plant Soil 337, 325–339. doi: 10.1007/s11104-010-0530-z
Wang, T., Wang, Z., Zhang, J., Ma, K. (2022). An optimum combination of irrigation amount, irrigation water salinity and nitrogen application rate can improve cotton (for fiber) nitrogen uptake and final yield. Ind. Crops Products 187, 115386. doi: 10.1016/j.indcrop.2022.115386
Wang, H., Wu, L., Wang, X., Zhang, S., Cheng, M., Feng, H., et al. (2021). Optimization of water and fertilizer management improves yield, water, nitrogen, phosphorus and potassium uptake and use efficiency of cotton under drip fertigation. Agric. Water Manage. 245, 106662. doi: 10.1016/j.agwat.2020.106662
Xue, X., Wang, J., Guo, W., Chen, B., You, J., Zhou, Z. (2006). Effect of nitrogen applied levels on the dynamics of biomass, nitrogen accumulation and nitrogen fertilization recovery rate of cotton after initial flowering. Acta Ecologica Sin. 26 (11), 3631–3640. doi: 10.1016/S1872-2032(06)60050-4
Yang, G.-z., Chu, K.-y., Tang, H.-y., Nie, Y.-c., Zhang, X.-l. (2013). Fertilizer 15N accumulation, recovery and distribution in cotton plant as affected by N rate and split. J. Integr. Agric. 12 (6), 999–1007. doi: 10.1016/S2095-3119(13)60477-3
Yang, G., Tang, H., Nie, Y., Zhang, X. (2011a). Responses of cotton growth, yield, and biomass to nitrogen split application ratio. Eur. J. Agron. 35 (3), 164–170. doi: 10.1016/j.eja.2011.06.001
Yang, S.-M., Wang, P., Suo, D.-R., Malhi, S., Chen, Y., Guo, Y.-J., et al. (2011b). Short-term irrigation level effects on residual nitrate in soil profile and N balance from long-term manure and fertilizer applications in the arid areas of Northwest China. Commun. Soil Sci. Plant Anal. 42 (7), 790–802. doi: 10.1080/00103624.2011.552661
Zhang, X., Bol, R., Rahn, C., Xiao, G., Meng, F., Wu, W. (2017). Agricultural sustainable intensification improved nitrogen use efficiency and maintained high crop yield during 1980–2014 in Northern China. Sci. Total Environ. 596-597, 61–68. doi: 10.1016/j.scitotenv.2017.04.064
Zhang, D., Li, W., Xin, C., Tang, W., Eneji, A. E., Dong, H. (2012). Lint yield and nitrogen use efficiency of field-grown cotton vary with soil salinity and nitrogen application rate. Field Crops Res. 138, 63–70. doi: 10.1016/j.fcr.2012.09.013
Zhang, T., Song, B., Han, G., Zhao, H., Hu, Q., Zhao, Y., et al. (2023). Effects of coastal wetland reclamation on soil organic carbon, total nitrogen, and total phosphorus in China: A meta-analysis. Land Degradation Dev. 34 (11), 3340–3349. doi: 10.1002/ldr.4687
Zheng, J.-g., Chi, Z.-z., Jiang, X.-l., Tang, Y.-l., Zhang, H. (2010). Experiences and research perspectives on sustainable development of rice-wheat cropping systems in the Chengdu Plain, China. Agric. Sci. China 9 (9), 1317–1325. doi: 10.1016/S1671-2927(09)60249-2
Zhong, Y., Yan, W., Shangguan, Z. (2015). Soil carbon and nitrogen fractions in the soil profile and their response to long-term nitrogen fertilization in a wheat field. Catena 135, 38–46. doi: 10.1016/j.catena.2015.06.018
Zhou, C., Jia, B., Wang, S., Huang, Y., Wang, Y., Han, K., et al. (2021). Effects of nitrogen fertilizer applications on photosynthetic production and yield of japonica rice. Int. J. Plant Production 15 (4), 599–613. doi: 10.1007/s42106-021-00156-2
Keywords: cotton, long-term nitrogen application, yellow river region, yield, nitrogen use efficiency
Citation: Ma Y, Sun H, Yang Y, Li Z, Li P, Qiao Y, Zhang Y, Zhang K, Bai Z, Li A, Li C and Liu L (2023) Long-term nitrogen fertilizer management for enhancing use efficiency and sustainable cotton (Gossypium hirsutum L.). Front. Plant Sci. 14:1271846. doi: 10.3389/fpls.2023.1271846
Received: 03 August 2023; Accepted: 24 August 2023;
Published: 18 September 2023.
Edited by:
Anoop Kumar Srivastava, Indian Council of Agricultural Research (ICAR), IndiaReviewed by:
Angamuthu Manikandan, Indian Council of Agricultural Research (ICAR), IndiaIzhar Ali, Guangxi University Nanning, China
Copyright © 2023 Ma, Sun, Yang, Li, Li, Qiao, Zhang, Zhang, Bai, Li, Li and Liu. This is an open-access article distributed under the terms of the Creative Commons Attribution License (CC BY). The use, distribution or reproduction in other forums is permitted, provided the original author(s) and the copyright owner(s) are credited and that the original publication in this journal is cited, in accordance with accepted academic practice. No use, distribution or reproduction is permitted which does not comply with these terms.
*Correspondence: Liantao Liu, bGl1bHRAaGViYXUuZWR1LmNu; Cundong Li, YXVobGNkQDE2My5jb20=
†These authors have contributed equally to this work and share first authorship