- 1School of Water Conservancy and Hydropower, Hebei University of Engineering, Handan, China
- 2Jiangsu Provincial Flood Control and Drought Relief Center, Nanjing, China
- 3College of Water Resources and Architectural Engineering, Northwest A&F University, Yangling, China
- 4School of Agro-Grassland Science, Nanjing Agricultural University, Nanjing, China
Introduction: Soil phosphorus (P) deficiency limits plant growth and productivity in grassland ecosystems and may moderate the growth-promoting effects of “carbon dioxide (CO2) fertilization effect”.
Methods: To evaluate the interactive effects of these two factors on the growth and physiology for annual ryegrass (Lolium multiflorum Lam.), plants were grown in controlled growth chambers with a range of P supply (0.004, 0.012, 0.02, 0.06, 0.1 and 0.5 mM) under two levels of CO2 (400 and 800 μmol mol-1, respectively).
Results: Elevated [CO2] dramatically increased the aboveground biomass and net photosynthetic rates of annual ryegrass by 14.5% and 25.3% under sufficient P supply (0.5 mM), respectively, whereas decreased the belowground biomass and net photosynthetic rates under lower P supply of P0.004, P0.02, and P0.06. Two-way ANOVA results showed that CO2 × P (p < 0.001) significantly affected stomatal traits, leaf photosynthesis and biomass. The stimulation of growth and photosynthesis by elevated CO2 concentration (e[CO2]) was reduced or highly suppressed, indicating that the sensitivity of annual ryegrass to P deficiency was enhanced under e[CO2].
Discussion: These results indicated that P limitation may offset the positive effects of e[CO2] on plant growth by altering stomatal traits, leaf photochemical processes and biochemical composition in annual ryegrass.
Introduction
Global atmospheric carbon dioxide concentration ([CO2]) has dramatically been accelerated with an average growth rate of about 1.6 μmol mol-1 from 280 μmol mol-1 to 400 μmol mol-1 in recent past five decades (IPCC, 2013). Meanwhile, many climate models have also predicted that the atmospheric [CO2] would go up to 800 μmol mol-1 by the end of this century (IPCC, 2013). It has been well demonstrated that e[CO2] stimulated plant growth (Suter et al., 2002; Ainsworth, 2008; Wang and Taub, 2010; Yu et al., 2012b) through the “CO2 fertilization effect” by affecting physiological and biochemical processes (Taub and Wang, 2008; Yu et al., 2012a; Arndal et al., 2014) such as photosynthesis (Leakey et al., 2006; Leakey et al., 2009; Zhang et al., 2010; Zheng et al., 2018) and respiration (Crous et al., 2011; Tan et al., 2013), especially for the C3 plants (Lee et al., 2001; Ainsworth and Rogers, 2007; Zheng et al., 2019). Nevertheless, plants in response to e[CO2] varied with nutrient availability, and the CO2 fertilization effect generally declined in parallel with the decreases of nutrient availability (Menge and Field, 2007; McCarthy et al., 2010; Norby et al., 2010; Lenka and Lal, 2012; Pandey et al., 2015; Zhang et al., 2017). Thereby, the CO2 fertilization effect on plant growth might be mitigated or even counteracted by the limitation of nutrient availability due to the higher nutrient demand of plants with rising atmospheric CO2 (Lenka and Lal, 2012; Pandey et al., 2014; Jin et al., 2015; Ellsworth et al., 2017). For instance, Lewis et al. (2010) analyzed the data from Populus deltoides and pointed out that increasing CO2 nearly doubled the total biomass under 0.5 mM P supply, while it increased by only 7% under the heaviest P deficiency (0.004 mM). Overall, elevated [CO2] and nutrient availability may have confounding impacts on plant growth and biomass allocation, and thus investigating the potential processes by which nutrient supply regulate the CO2 fertilization effect on plant growth is critical to predicting the impacts of future climate change on the net primary productivity (NPP) of terrestrial ecosystems, particularly in the natural ecosystems such as forests and grasslands, which are limited by nutrient availability (Kimball et al., 2002; Sakurai et al., 2014; Deng et al., 2017).
Phosphorus (P) is an extremely critical nutrient for sustaining plant growth, development and reproduction (Chiera et al., 2002; Nord and Lynch, 2009; Peñuelas et al., 2013; Jin et al., 2015; Zhan et al., 2017). Because P plays a vital role not only in diverse biochemical processes, such as cell and lipid metabolism (Vance et al., 2003), but also serves as an essential source of energy for numerous biological functions (Almeida et al.,1999; Abel et al., 2002; Lambers et al., 2006). However, soil P deficiency is common in terrestrial ecosystems and is also most likely to become worse under future climate change, where rising [CO2] may increase the required amount of P for sustaining plant growth (Elser et al., 2007; Richardson et al., 2009). Meanwhile, soil P availability is becoming lower as global reserves deplete (Fay et al., 2015; Jin et al., 2015). The diminishing P availability may gradually become a major limiting nutrient on plant growth in managed and natural ecosystems under elevated [CO2] (Vance et al., 2003; Lewis et al., 2010; Lenka and Lal, 2012; Singh et al., 2013a). While most of previous studies investigating the effects of nutrient supply on plant responses to elevated [CO2] have focused primarily on nitrogen (N) limitation for leaf photosynthesis (Hungate et al., 2003; Lewis et al., 2004; Ainsworth and Long, 2005; Reich et al., 2006; Xu et al., 2013), P availability in response to elevated [CO2] is likely to be particularly important (Jin et al., 2015).
It is well demonstrated that P supply regulates the plant response to e[CO2] and is intrinsically triggered by leaf photosynthesis (Duchein et al., 1993; Norisada et al., 2006; Singh et al., 2013b; Sinhg and Reddy, 2014), which is highly related to the changes in stomatal diffusion processes as well as the biochemical and photochemical processes under higher [CO2] (Jacob and Lawlor, 1991; Singh et al., 2013b). Previous research have established that the responses of leaf photosynthesis to e[CO2] may be affected by low P availability through decreasing stomatal conductance (Kirschbaum and Tompkins, 1990; Singh et al., 2013a). Moreover, low P limitation may also affect the biochemical and photochemical processes of leaf photosynthesis in response to elevated [CO2] by the regeneration of triose-phosphate utilization (TPU) during ribulose bisphosphate (RuBP) regeneration (Rogers et al., 1993; Wissuwa et al., 2005; Pandey et al., 2015). Meanwhile, soil P deficiency may lower the activity of Calvin cycle enzymes, thus directly limit photosynthetic capacity under rising [CO2] (Palma et al., 2000). Additionally, the photosynthetic responses to elevated [CO2] can also be affected by low soil P supply through limiting plant growth and biomass allocation between source and sink tissues (Fredeen et al., 1989; Pandey et al., 2015). Understanding the potential mechanisms that low P availability affects photosynthetic responses to rising [CO2] is critical for assessing the impacts of elevated [CO2] on the structure and function of terrestrial ecosystems limited by low P supply under future climate change scenarios.
Grasslands hold a significant position within terrestrial ecosystems, as their responses to elevated [CO2] play a pivotal role in the global carbon-water cycling (Coleman et al., 1993; Steffen and Canadell, 2005). The plant coverage and net primary production of grasslands are usually limited by soil P availability under elevated [CO2] (Elser et al., 2007; Fay et al., 2015; Ceulemans et al., 2017). Annual ryegrass (Lolium multiflorum Lam.) is one of the most important principal forages with considerable ecological and economic significances due to high yield and quality in temperate grasslands and pastures (Li et al., 2007; Wang et al., 2013; Castanheira et al., 2014). In these contexts, low soil P supply may be a major factor limiting the CO2 fertilization effect on plant growth and leaf photosynthesis of annual ryegrass under future climate change (Byrne et al., 2011; Xu, 2015; Zheng et al., 2018). Nevertheless, most of previous studies regarding the plant responses to elevated [CO2] and P supply are primarily focused on trees (Lewis et al., 2010; Duan et al., 2019) and crops (Wissuwa et al., 2005). Thus, it is necessary to quantify whether P supply will affect grass growth and photosynthesis through altering the physiological and biochemical processes under enriched [CO2]. Consequently, it is unclear whether grasses response to rising [CO2] vary with P supply, even few studies have examined the responses of plant growth and leaf photosynthesis to elevated [CO2] in grass species with P deficiency (Edwards et al., 2006). Understanding the underlying mechanisms and processes of low soil P availability on plant growth and biomass allocation of annual ryegrass with changes in stomatal traits, leaf photosynthesis and plant biochemistry under elevated [CO2] may have important significance on projecting the net primary productivity (NPP) and guiding the formulation of adaptation policies for grasslands.
The aims of this study are to: (1) examine the combined effects of e[CO2] and soil P deficiency on the annual ryegrass growth and biomass allocation.; (2) investigate the potential processes that low P availability affecting photosynthetic responses to elevated [CO2] in annual ryegrass; (3) explore the underling mechanisms that soil P deficiency regulating CO2 fertilization effect on annual ryegrass growth with changes in stomatal traits, leaf photosynthesis and biochemistry.
Materials and methods
Growth chamber experiments
A golf hole cutter was utilized to eliminate the effect of errors in initial aboveground and belowground biomass (10 cm diameter × 20 cm long). Annual ryegrass was transplanted in the experimental farm at Hebei University of Engineering, Handan City, Hebei Province, China. Then, the collected grasses were transplanted into pots (10 cm diameter × 100 cm long) filled with fritted clay and moved to artificial climate chambers (Model BDP-2000, Ningbo Prandt Instrument Co., Ltd, China). We trimmed grasses every 30 days to a 5-cm canopy height during the 90 days experimental treatments to keep grass plants in good growth condition (Yu et al., 2012b).
Eight artificial climate chambers were utilized to automatically monitor and control CO2, four of which were set as modern CO2 (a[CO2]; 400 μmol mol-1) and the remaining four were set as elevated CO2 (e[CO2]; 800 μmol mol-1). The environmental settings for all eight environmental growth chambers were at 25/20°Cday/night temperature, 800 μmol m-2 s-1 PAR canopy light intensity, 65% relative humidity, and a 12-h photoperiod of 7:00-19:00. To minimize confounding effects of environmental variation between two chambers, we changed the [CO2] of each growth chamber every 7 days, and then relocated the CO2 treated annual ryegrass plants to the growth chambers with corresponding [CO2] during the whole experiment. In each artificial climate chamber, six randomly selected pots of annual ryegrass plants were watered to through-flow twice a week with half-strength Hoagland’s solution modified to generate six P concentration treatments of 0.004, 0.012, 0.02, 0.06, 0.1-, and 0.5-mM P as KH2PO4, respectively. To ensure that all grasses have the same amount of potassium kalium (K) in the nutrient solution at each watering, we add an additional moderate amount of KCL to supplement the K in the half-strength Hoagland’s solution. Four artificial climate chambers with a[CO2] or e[CO2] are biological replications (n = 4).
Measuring stomatal density, morphological traits and distribution pattern of stomata
To characterize the maximum stomatal pore size of annual ryegrass, we selected recently expanded leaves for sampling stomatal imprints from the middle section on the abaxial surface using colorless nail varnish in artificial climate chambers on the 30th, 60th, and 90th days after CO2 treatment and P treatments (Zheng et al., 2013; Xu, 2015). We observed and photographed the collected imprints using the method of Zheng et al. (2013) and measured the stomatal aperture length (SAL), stomatal aperture width (SAW), stomatal aperture circumference (SAC) and stomatal aperture area (SAA) using the Image J quantification software (NH, Bethesda, MD). Stomata on each surface were counted and combined for calculating stomatal density (SD) (Ceulemans et al., 1995) and the stomatal aperture shape index (SASI) was also calculated as . The morphological traits of stomata were visualized and photographed with a scanning electron microscopy (FEI Corp, USA). We randomly selected four images (a magnification of 100) from each treatment to estimate the stomatal spatial distribution pattern. The selected images were digitized with a GIS software (ArcGIS 10.0; ESRI Inc., Redlands, CA). In this study, the center of each stoma was treated as a single point. Then the point pattern analysis was conducted with the Ripley’s K-function (Ripley, 1976). Comprehensive guidelines for the analysis of stomatal spatial distribution pattern can be found in Xu (2015) and Zheng et al. (2020).
Measuring leaf gas exchange
A portable LI-6400 photosynthesis system (Li-Cor Inc., Lincoln, NE, USA) was utilized to determine the net photosynthetic rate (Pn), stomatal conductance (Gs) and transpiration rate (Tr) on recently expanded leaves on the 30th, 60th, 90th days after CO2 treatment and P treatments. All measurements were performed in the standard cuvette chamber (2 cm × 3 cm) with the CO2 concentration of 400 μmol mol-1, the saturating light at 1000 μmol photons m-2 s-1, the leaf-to-air vapor pressure deficit (VPD) of 1.5 KPa and the temperature of 20°C. The intrinsic water use efficiency (WUE) was calculated as Pn/Tr.
Measuring plant biomass and analyzing tissue carbon, nitrogen and phosphorus contents
The aboveground and belowground biomass were harvested using the physical cutting at the end of the 90-day experiment and oven-dried the separated tissues at 80°C to a constant weight. Finally, the data of biomass were weighed using an electronic scale. The aboveground and belowground portions were grinded to fine powder using a ball mill (MM2, Fa. Retsch, Haan, Germany). The tissue phosphorus (P), carbon (C), and nitrogen (N) contents of shoots and roots were determined using an elemental analyzer (Vario Max CN; Elemnetar Corp., Germany). All the biochemical analyses were repeated four times (n = 4).
Statistical analysis
Two-way analysis of variance (ANOVA) was utilized to test the interactive effects of P concentration and [CO2] on plant biomass, stomatal traits, and leaf gas exchange as well as the contents of P, C, and N among different treatments (p < 0.05). Additionally, a three-way analysis of variance (ANOVA) was also used to estimate the interactive effects of [CO2] × P × plant tissues on P, C, N contents (p < 0.05). Furthermore, we used linear and non-linear regressions to analyze the relationship between biomass and other variables (p < 0.05). All statistical analyses were conducted using the SPSS 20.0 software (Chicago, IL, USA).
Results
Effects of P supply and [CO2] on the plant biomass of annual ryegrass
Our results showed that the total plant biomass, aboveground biomass, belowground biomass and below/above biomass ratio of annual ryegrass were substantially changed by P supply (all p < 0.001), while e[CO2] only remarkably affected the aboveground biomass (p = 0.014) and belowground biomass (p = 0.024; Figure 1). Specifically, e[CO2] marginally decreased the total plant biomass by 6.6% at P0.004 (p < 0.05), but the total plant biomass under the P concentrations of 0.02 Mm (P0.02) and 0.06 mM (P0.06) was obviously increased by 7.1% (p < 0.05) and 10.4% (p < 0.01) (Figure 1A). Moreover, elevated [CO2] dramatically increased the aboveground biomass by 14.5% (p < 0.001) under the highest P concentration of 0.5 mM (P0.5) (Figure 1B). By contrast, rising [CO2] decreased the belowground biomass by 13.7% (p < 0.01), 9.2% (p < 0.05), and 11.1% (p < 0.05) under the P concentrations of 0.004 mM (P0.004), 0.012 mM (P0.012), and 0.5 mM (P0.5) (Figure 1C). Similar to the changes in belowground biomass, elevated [CO2] also changed the allocation of plant biomass between belowground and aboveground (below/above biomass ratio) with decreasing the below/above biomass ratio by 11.9%, 11.4%, and 18.5% at P0.004 (p < 0.05), P0.012 (p < 0.01), and P0.5 (p < 0.05), while the below/above biomass ratio of annual ryegrass at P0.006 was substantially enhanced by 31.5% under elevated [CO2] (p < 0.001; Figure 1D). Moreover, our one-way ANOWA results revealed that the total biomass (p < 0.001), aboveground biomass (p < 0.001), belowground biomass (p < 0.001), and the ratio of below/above biomass (p < 0.001) were significantly changed by the P deficiency, while e[CO2] only marginally effected the aboveground biomass (p = 0.014) and belowground biomass (p = 0.024) of annual ryegrass (Figure 1). Additionally, the remarkably interactive effects of P and [CO2] were found on the total plant biomass, aboveground biomass, belowground biomass, and below/above biomass ratio of annual ryegrass (Figure 1).
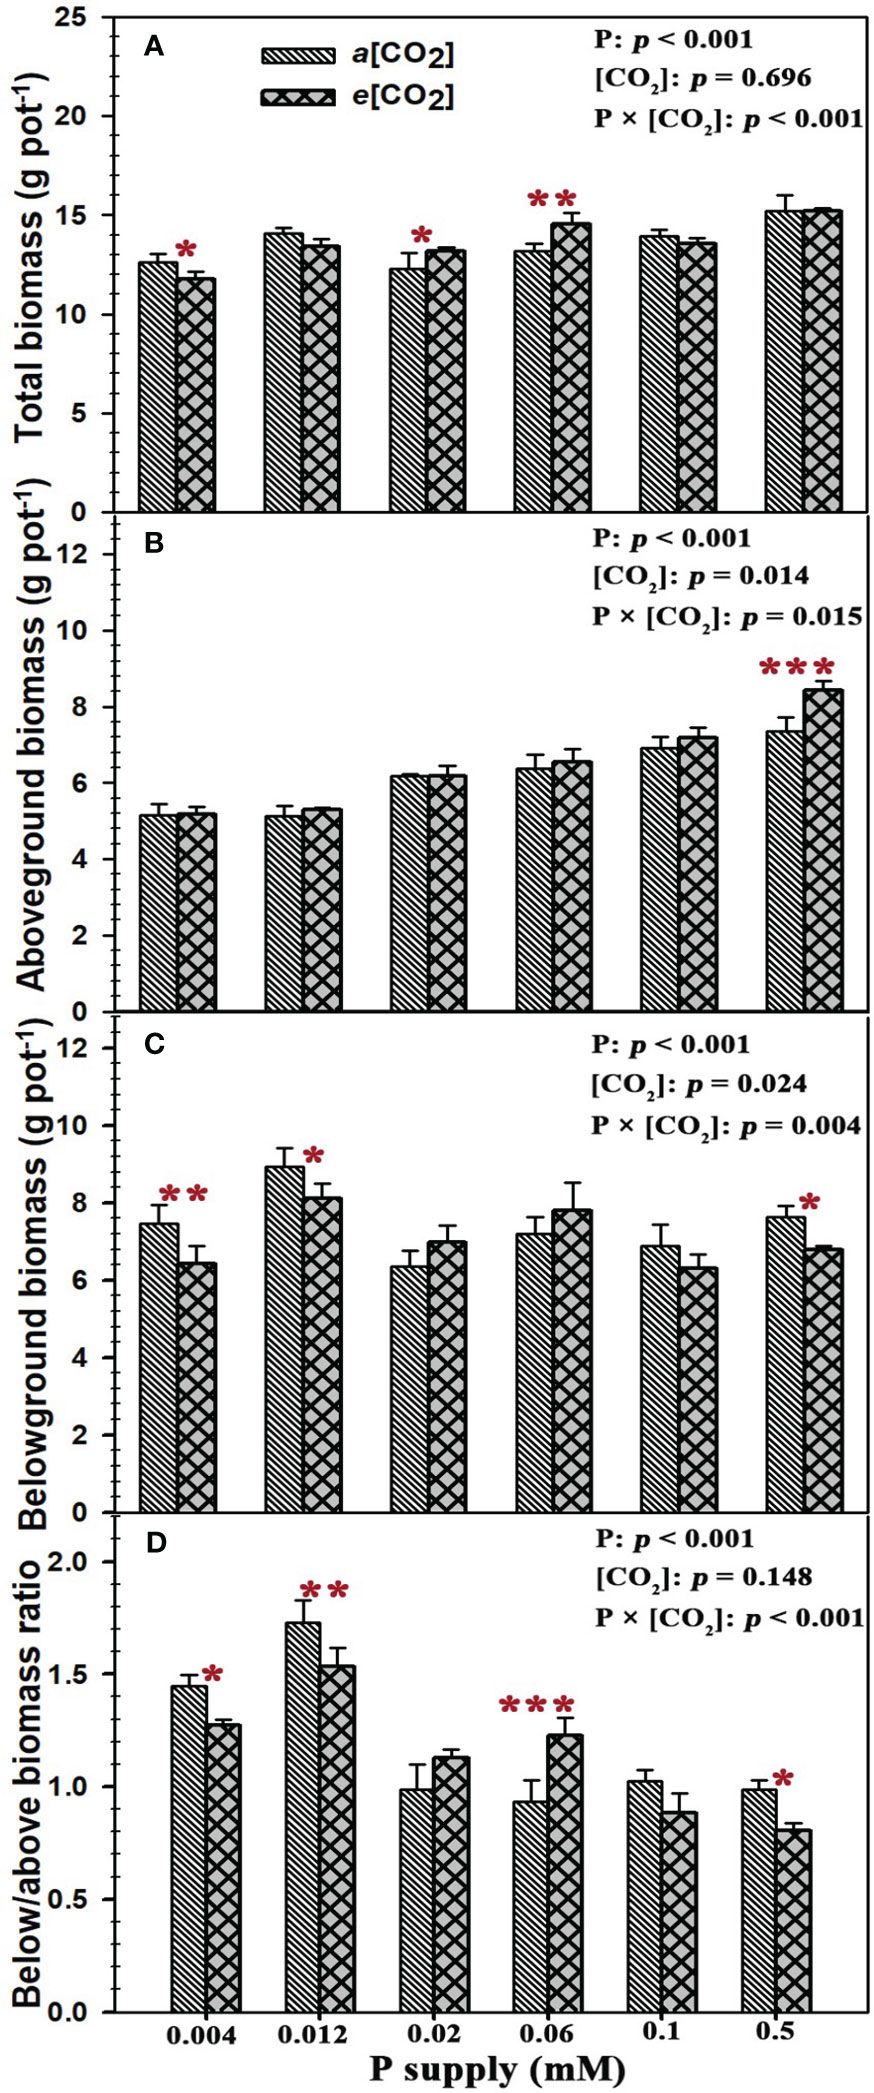
Figure 1 Effects of elevated [CO2] on plant biomass and its allocation of annual ryegrass under P deficits. Note that the grey bars represent ambient CO2 concentration (Ca) and the black bars represent elevated CO2 concentration (Ce). The symbols *, **, and *** indicate that the significant differences between Ca and Ce under the same P treatment. The part labels are mean that ANOVA p-values for P and [CO2] and interactive effects of [CO2] and P on annual ryegrass biomass.
Effects of P supply and [CO2] on leaf gas exchange of annual ryegrass
Sufficient P supply (P0.5) had a strong CO2 fertilization effect on the net photosynthetic rates of annual ryegrass, as evidenced by the 25.3% increase of net photosynthetic rates (p < 0.001) (Figure 2A). By contrast, the net photosynthesis rates of annual ryegrass at lower P supply of P0.004, P0.02, and P0.06 were significantly decreased by 13.6% (p < 0.01), 19.8% (p < 0.001) and 16.9% (p < 0.001) under elevated [CO2]. Meanwhile, elevated [CO2] substantially reduced the stomatal conductance by 54.2% (p < 0.001), 56.0% (p < 0.001), 39.6% (p < 0.01), 47.3% (p < 0.01), and 36.7% (p < 0.05) at the P treatments of P0.012, P0.02, P0.06, P0.1, and P0.5 except for the stomatal conductance under the P supply of P0.004 (Figure 2B). However, elevated [CO2] only increased the leaf transpiration rate at P0.06 by 14.1% (p < 0.01), and barely affected the leaf transpiration rates under other P treatments (Figure 2C). Consequently, e[CO2] dramatically reduced the water use efficiency of annual ryegrass by 13.1% (p < 0.05), 13.5% (p < 0.01), and 27.1% (p < 0.001) under lower P treatments of P0.004, P0.02 and P0.06 (Figure 2D), whereas the water use efficiency at higher P treatments of P0.1 and P0.5 was significantly enhanced by 22.3% (p < 0.001) and 24.8% (p < 0.001; Figure 2D). Moreover, the significantly interactive effects of P supply and e[CO2] were also found on the net photosynthetic rates (p < 0.001), stomatal conductance (p = 0.043), transpiration rates (p = 0.032) and water use efficiency (p < 0.001) of annual ryegrass (Figure 2).
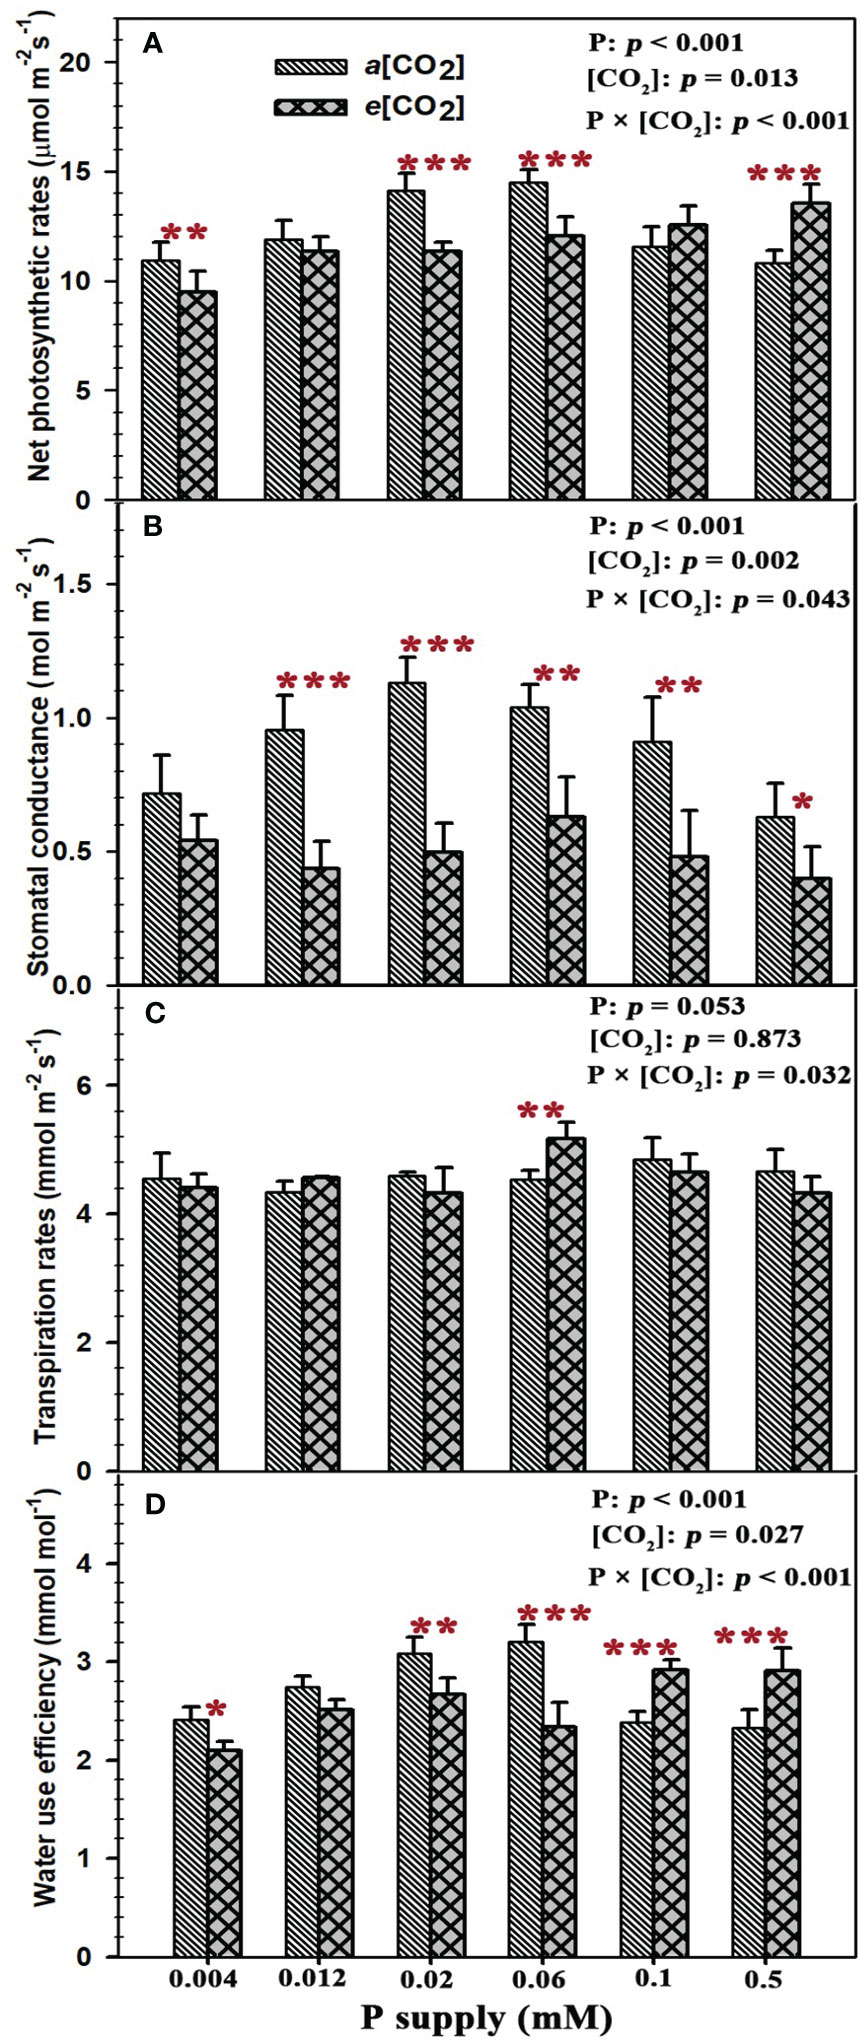
Figure 2 Effects of elevated [CO2] on leaf gas exchange of annual ryegrass under P deficits. Note that the grey bars represent ambient CO2 concentration (Ca) and the black bars represent elevated CO2 concentration (Ce). The symbols *, **, and *** indicate that the significant differences between Ca and Ce under the same P treatment. The part labels are mean that ANOVA p-values for P and [CO2] and interactive effects of [CO2] and P on leaf exchange of annual ryegrass.
Effects of P supply and [CO2] on the morphological traits of individual stoma and the spatial distribution pattern of stomata on annual ryegrass leaves
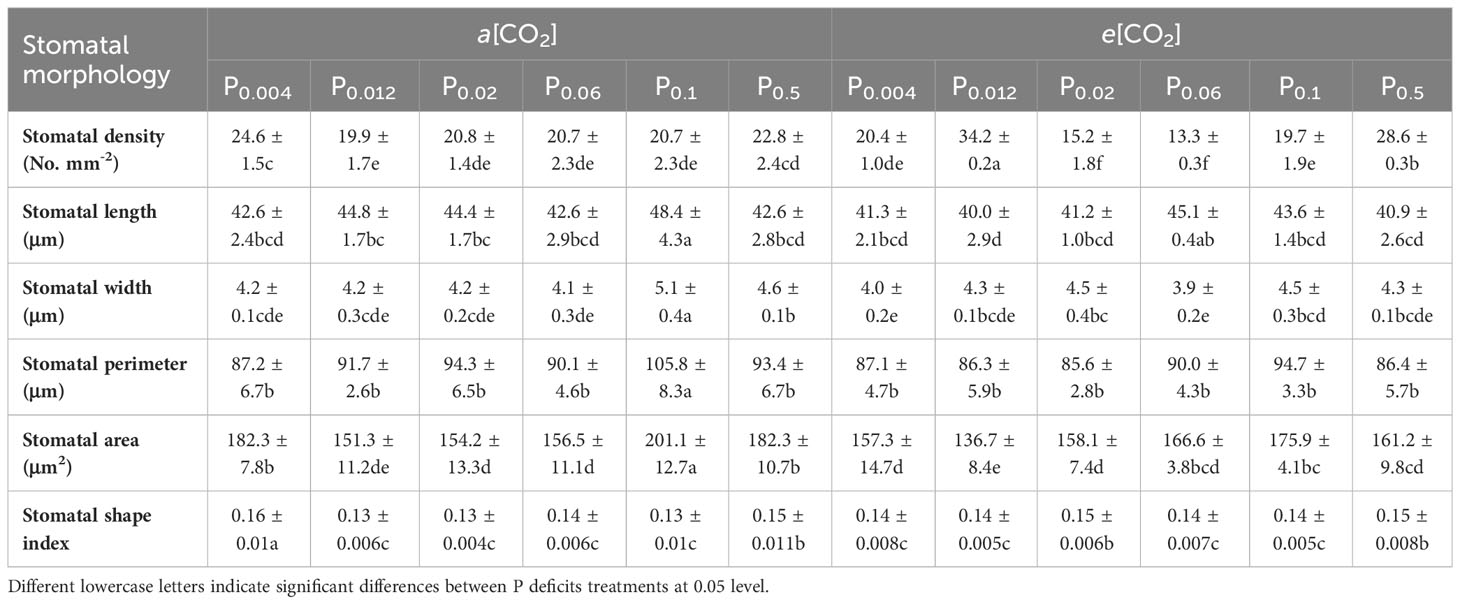
Elevated [CO2] substantially affected the stomatal density (SD) of annual ryegrass regardless of P supply (Table 1). Specifically, e[CO2] dramatically increased the SD by 72.3%, 34.8% and 25.6% under P0.012, P0.1, and P0.5, whereas obviously decreased the SD by 17.1%, 27.1%, and 35.5%, respectively, at the P supply of P0.004, P0.02, and P0.06 (all p < 0.05; Table 1; Figure 3). Moreover, elevated [CO2] dramatically decreased the stomatal area (SA) by 13.7%, 12.5% and 11.5% at P0.004, P0.1, and P0.5 (all p < 0.05), which may be due to the smaller stomatal length and width (Table 1; Figure 4), and the minimum and maximum values of the stomatal area were occurred at P0.012 and P0.1, respectively (Table 1; Figure 4). Our two-way ANOVA results showed that the SD of annual ryegrass was substantial changed by [CO2] or P supply (Table 2). Additionally, [CO2] × P supply also significantly affected the SD, SAL, SAW, SAA, and SAA (all p < 0.05), but barely changed the SAC (Table 2).
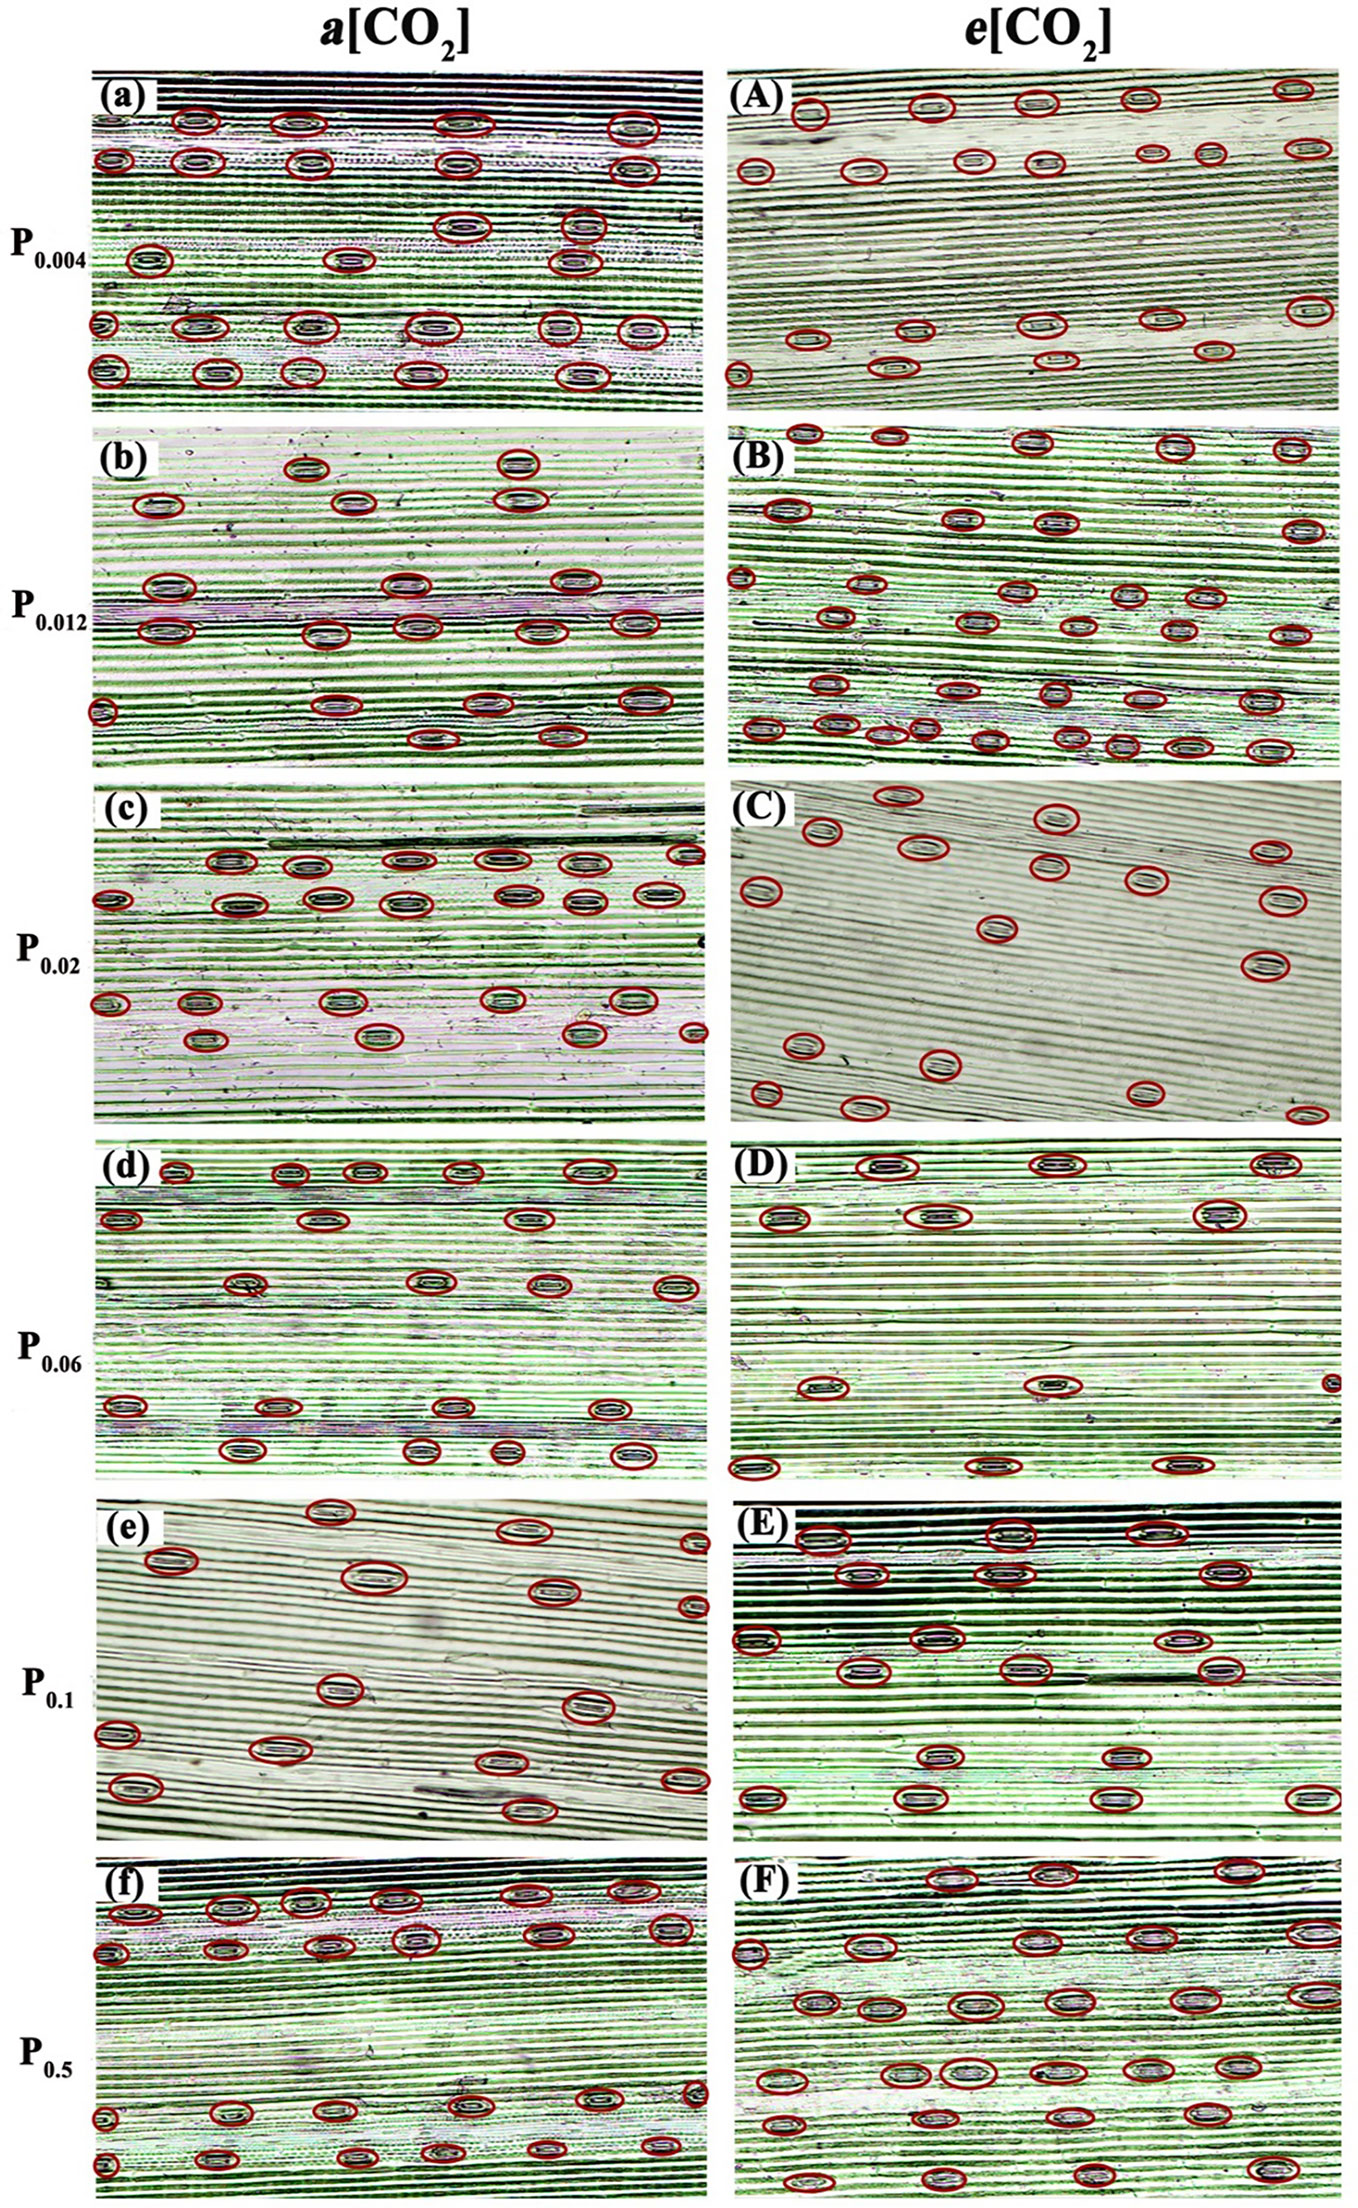
Figure 3 Observation on stomatal density of annual ryegrass under light microscopy. The P supply are 0.004 (a), 0.012 (b), 0.02 (c), 0.06 (d), 0.1 (e), and 0.5 (f) mM under ambient CO2, respectively;the P supply are 0.004 (A), 0.012 (B), 0.02 (C), 0.06 (D), 0.1 (E), and 0.5 (F) mM under elevated [CO2], respectively.
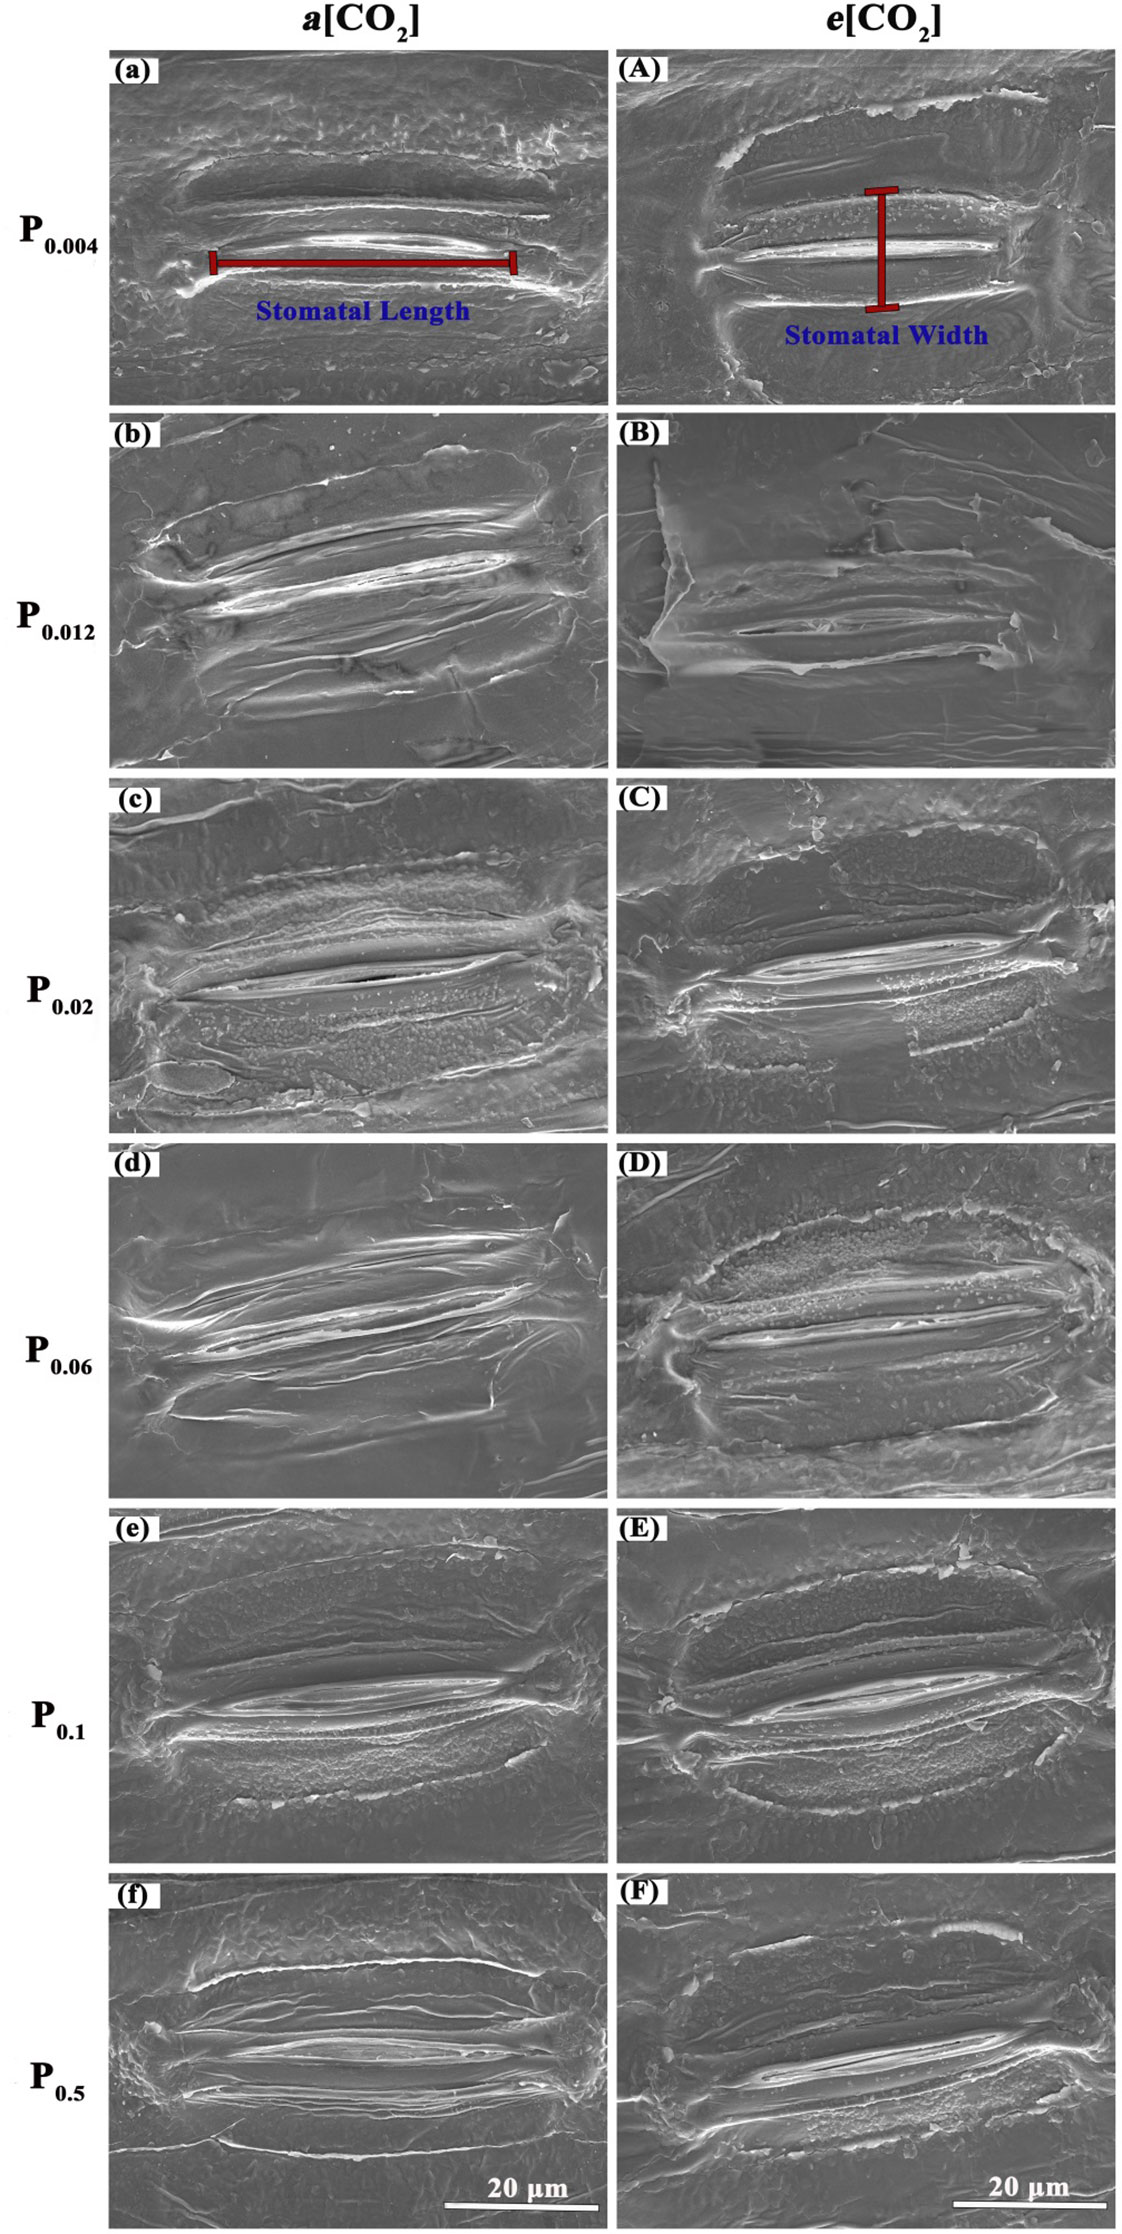
Figure 4 Micrographs of stomatal morphology photographed with Scanning Electrical Microscopy (SEM). The P supply are 0.004 (a), 0.012 (b), 0.02 (c), 0.06 (d), 0.1 (e), and 0.5 (f) mM under ambient CO2, respectively;the P supply are 0.004 (A), 0.012 (B), 0.02 (C), 0.06 (D), 0.1 (E), and 0.5 (F) mM under elevated [CO2], respectively.

Table 2 ANOVA p-values for the effects of P and CO2 and interactive effects of P and [CO2] on the stomatal morphology of annual ryegrass.
The spatial distribution pattern of annual ryegrass was also changed by P supply and e[CO2] (Figure 5). In general, the spatial pattern of stomata distributed on leaves of annual ryegrass followed a regular pattern at small scales (<150 µm) and a random distribution at larger scales (>200 µm) regardless of [CO2] and P supply (Figure 5). Interestingly, the most regular pattern both at the scale of c. 110 μm regardless of the [CO2] concentration was observed in the current study, as evidenced by the average minimum Lhat(d) values of -9.24 under a[CO2] and -8.00 under e[CO2] (Figure 5). Moreover, e[CO2] produced more regular spatial patterns of stomata at small scales when annual ryegrass was subjected to three higher P supply of P0.06, P0.1, and P0.5, due to the lower Lhat(d) values at the same spatial scales (Figure 5). Meanwhile, elevated [CO2] also increased the range scale of regular pattern of stomata (Figure 5).
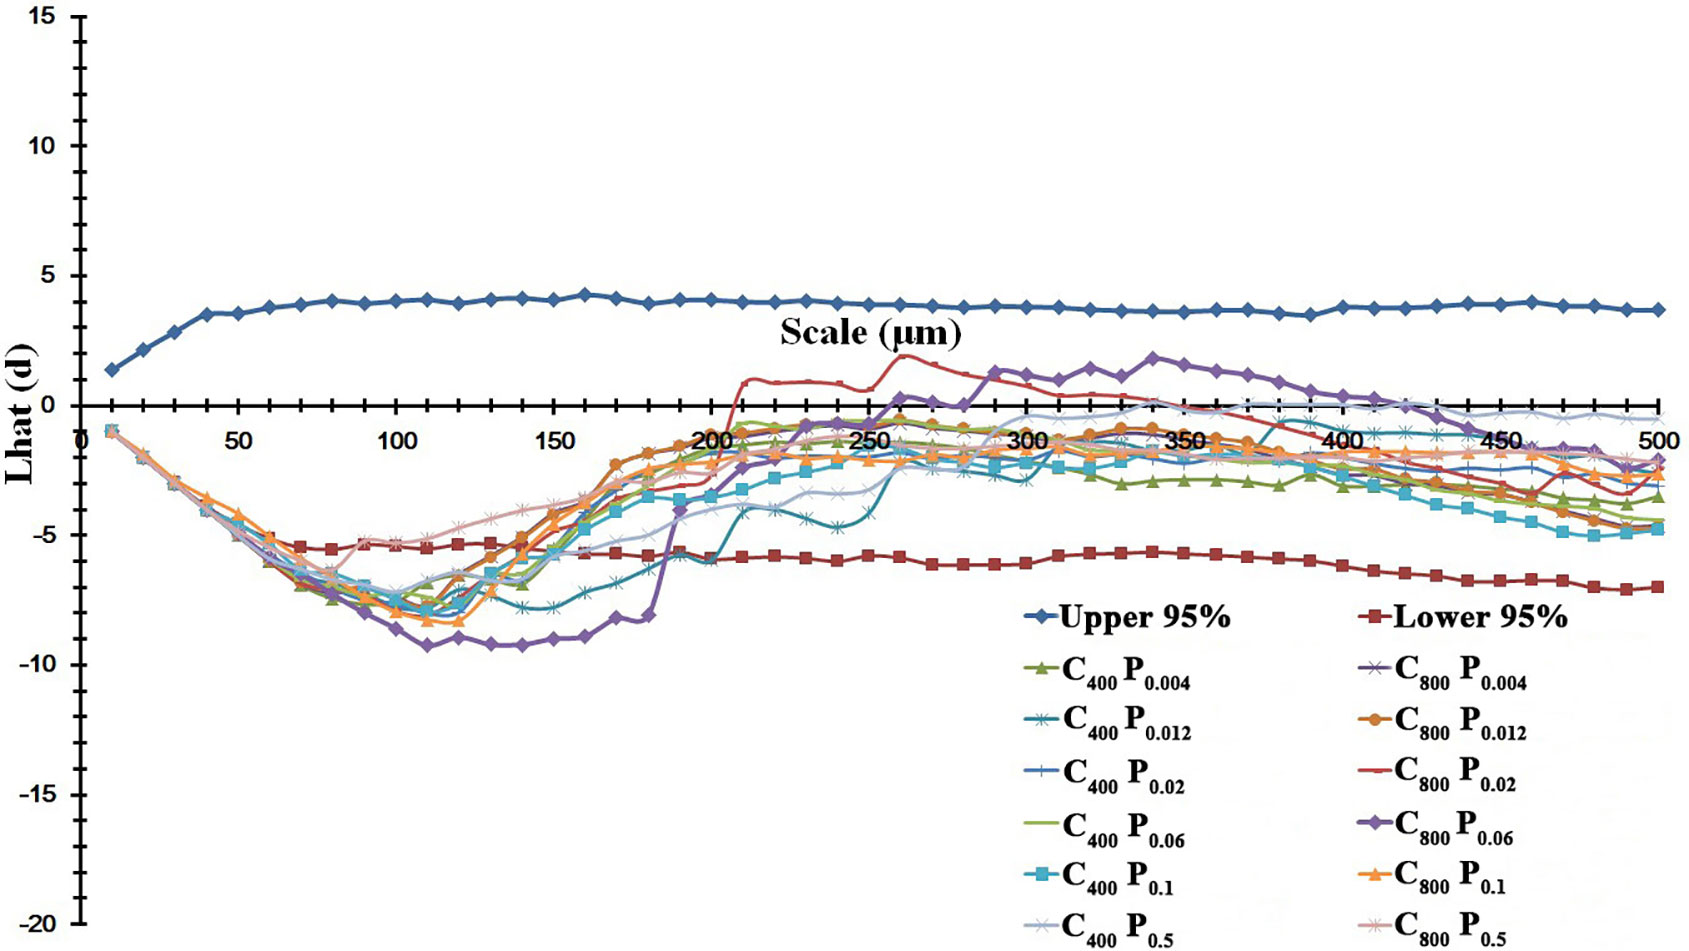
Figure 5 Effects of elevated [CO2] on the spatial distribution pattern of stomata under P deficits. Note: that the more regular distribution pattern of stomata featured with a lower Lhat(d) value. The upper and lower 95% boundaries were obtained by Monte Carlo simulation of 1000 replicates.
Effects of P supply and [CO2] on tissue phosphorus (P), carbon (C), and nitrogen (N) contents of annual ryegrass
Elevated [CO2] generally reduced phosphorus contents in both shoots and roots of annual ryegrass (Table 3). Specifically, elevated [CO2] significantly decreased the phosphorus in shoots by 33.9%, 15.2%, 18.9% and 12.7% under P0.012, P0.06, P0.1 and P0.5 (all p < 0.05; Table 3). However, e[CO2] only obviously reduced the phosphorus content in roots by 19.9% under P0.06 (p < 0.05; Table 3). In addition, e[CO2] significantly decreased shoots N by 25.8% and 20.6% under P0.004 and P0.06 (both p < 0.05; Table 3), but increased shoots N by 19.1% under P0.5 (p < 0.05; Table 3). Consequently, the C/N ratio in shoot was enhanced by 29.2% and 25.0% under P0.004 (p < 0.05) and P0.06 (p < 0.05; Table 3) but lowered by 17.9% under P0.5 (p<0.05; Table 3). Additionally, the shoot C (p > 0.05), root C (p > 0.05), N (p > 0.05) and C/N ratio in roots (p > 0.05) were barely changed by e[CO2] regardless of P supply (Table 3).
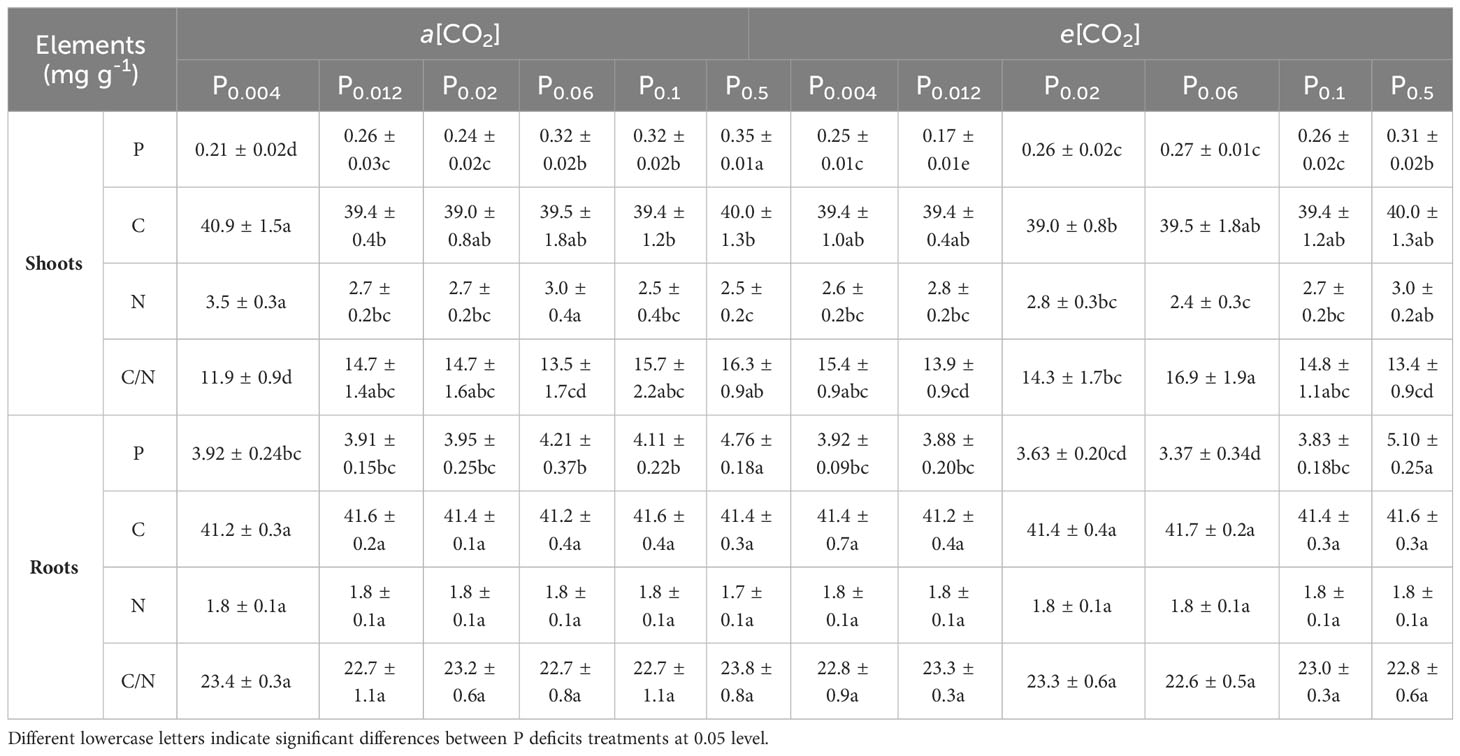
Table 3 Effects of elevated [CO2] on the tissue phosphorus (P), carbon (C), and nitrogen (N) contents of annual ryegrass under P deficits.
The tissue P contents were substantially affected by [CO2] (p < 0.05) or P supply (p < 0.001) from the results of three-way ANOVA (Table 4). However, we found statistical differences in the contents of phosphorus (p < 0.001), C (p < 0.001) and N (p < 0.001) as well as the C/N ratio (p < 0.001) between tissues (shoot and root) of annual ryegrass (Table 4). Moreover, there were obviously interactive effects of [CO2] × P supply on the tissue N (p < 0.001) and P contents (p < 0.05) as well as the C/N ratio (p < 0.001; Table 4), whereas P supply × tissue only changed the phosphorus content of annual ryegrass (p < 0.001; Table 4). In addition, our results also showed that [CO2] × P supply × tissue significantly changed the contents of N, P and the C/N ratio of annual ryegrass (all p < 0.05; Table 4).

Table 4 ANOVA p-values for the effects of P and CO2 and interactive effects of P and [CO2] on the phosphorus, carbon, and nitrogen contents in tissues of annual ryegrass.
Relationships of plant biomass among photosynthesis as well as shoot P and N contents
The aboveground (R2 = 0.80, p = 0.017; Figure 6D) and total biomass (R2 = 0.86, p = 0.008; Figure 6F) demonstrated a linear increase with the elevation of leaf photosynthesis at e[CO2]. However, no linear or parabolic relationships were found between leaf photosynthesis and aboveground biomass (R2 = 0.13, p = 0.815; Figure 6A), as well as total biomass at a[CO2] (R2 = 0.31, p = 0.252; Figure 6C). Similarly, we found linear relationships of shoot phosphorus content between aboveground (R2 = 0.73, p = 0.031; Figure 7A) and total biomass (R2 = 0.59, p = 0.076; Figure 7C) at a[CO2], as well as aboveground (R2 = 0.64, p = 0.055; Figure 7D) and total biomass (R2 = 0.89, p = 0.005; Figure 7F) at e[CO2]. Nevertheless, there is no obvious correlation between belowground biomass and leaf photosynthesis (Figure 6), shoot phosphorus content (Figure 7), or shoot nitrogen content (Figure 8) regardless of CO2 concentration. Moreover, we also found parabolic relationship of shoot nitrogen content with leaf photosynthesis, irrespective of CO2 concentration (Figure 9).
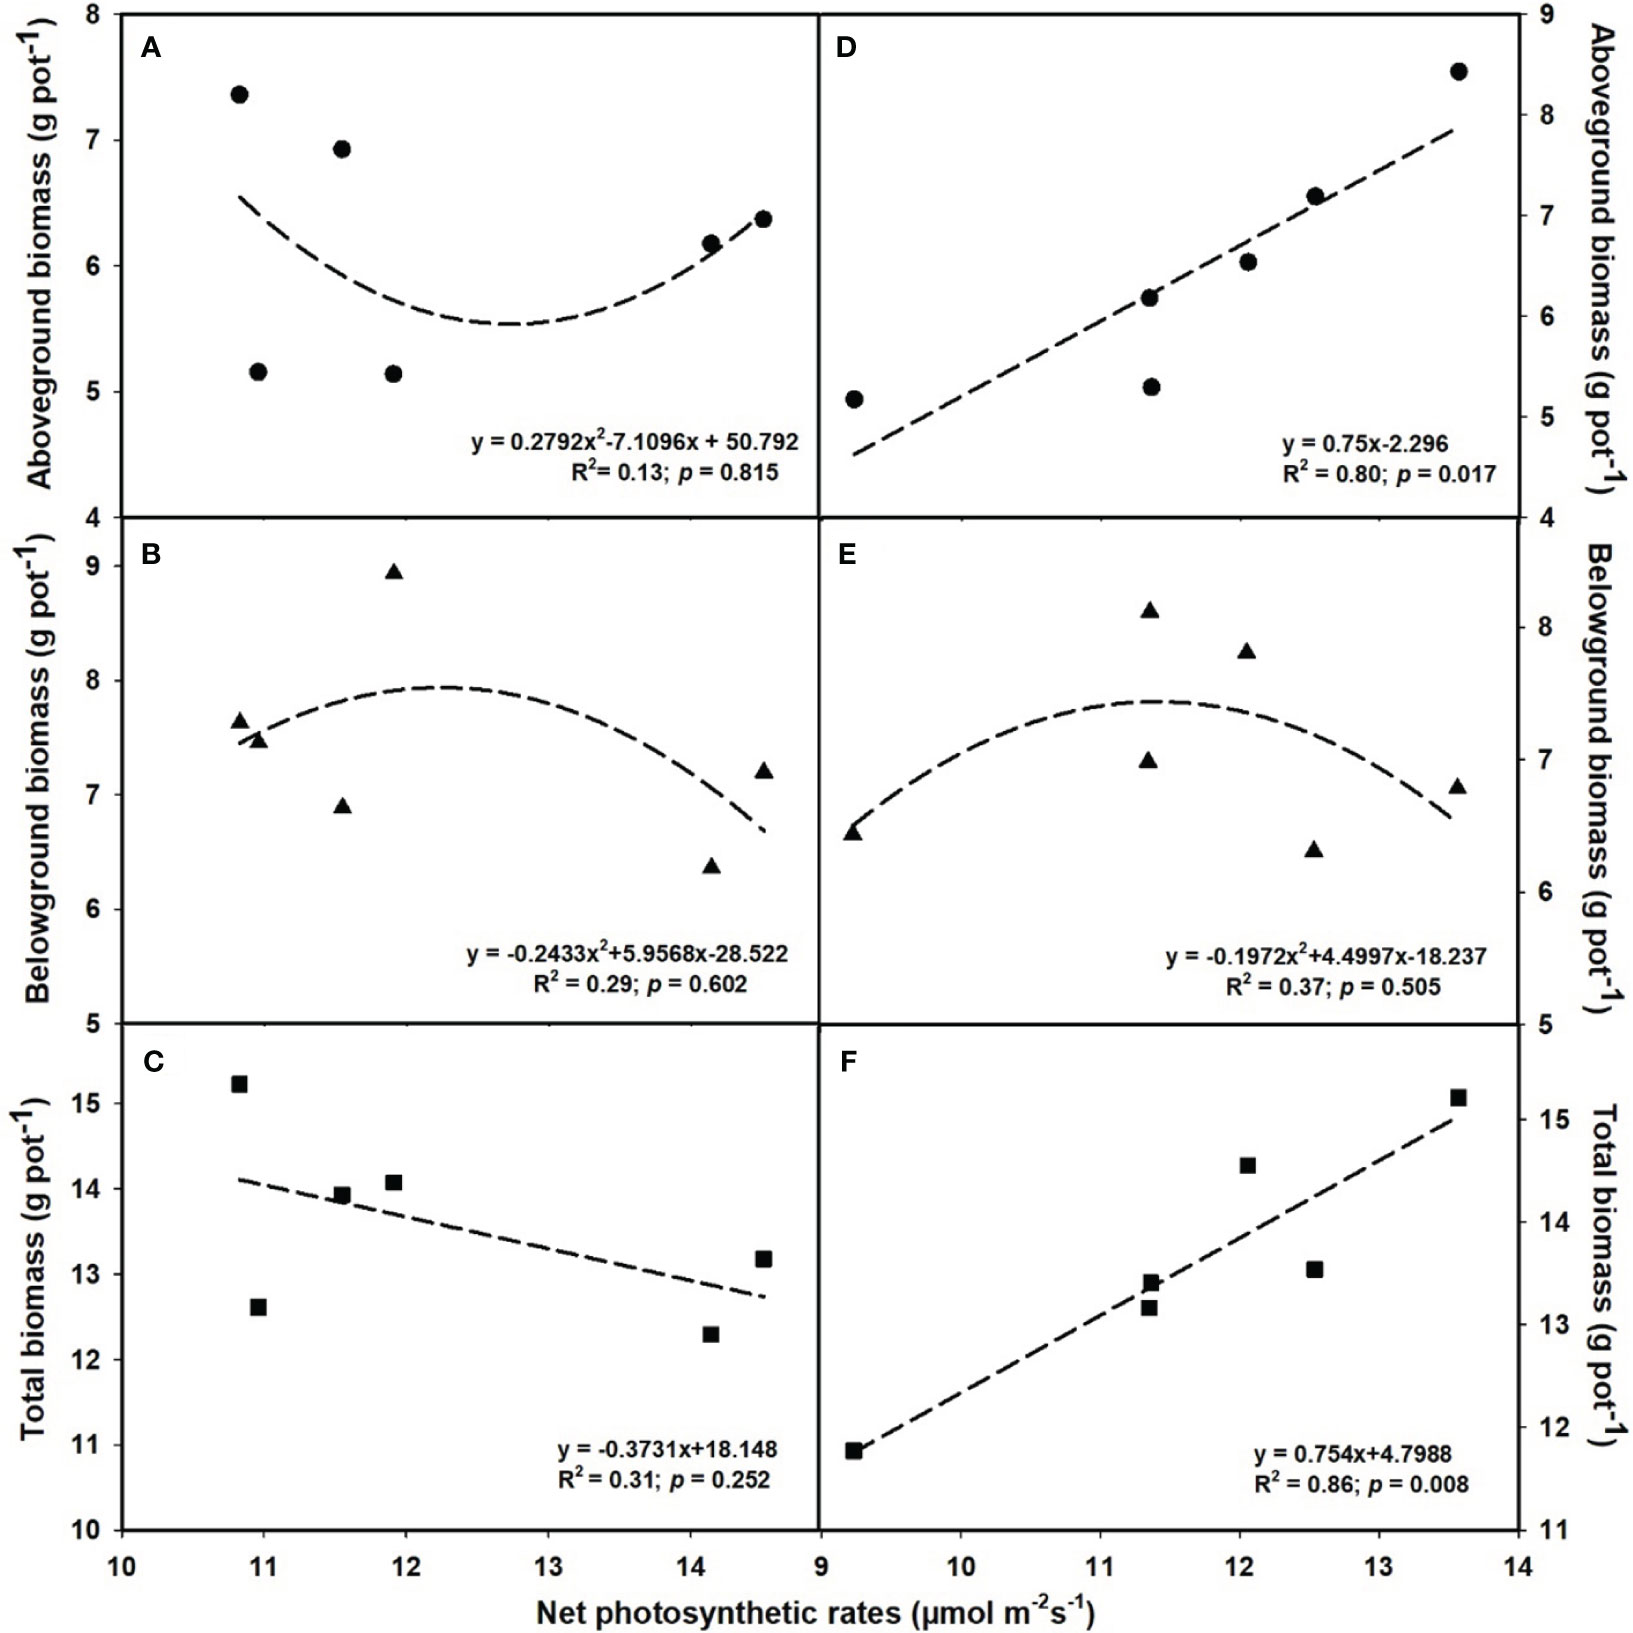
Figure 6 The relationships between net photosynthetic rates and aboveground biomass (A, D), belowground biomass (B, E), and total biomass (C, F). Values are means ± SD (n = 4). The circle symbols represent aboveground biomass, the triangle symbols represent belowground biomass, and the square symbols represent total biomass.
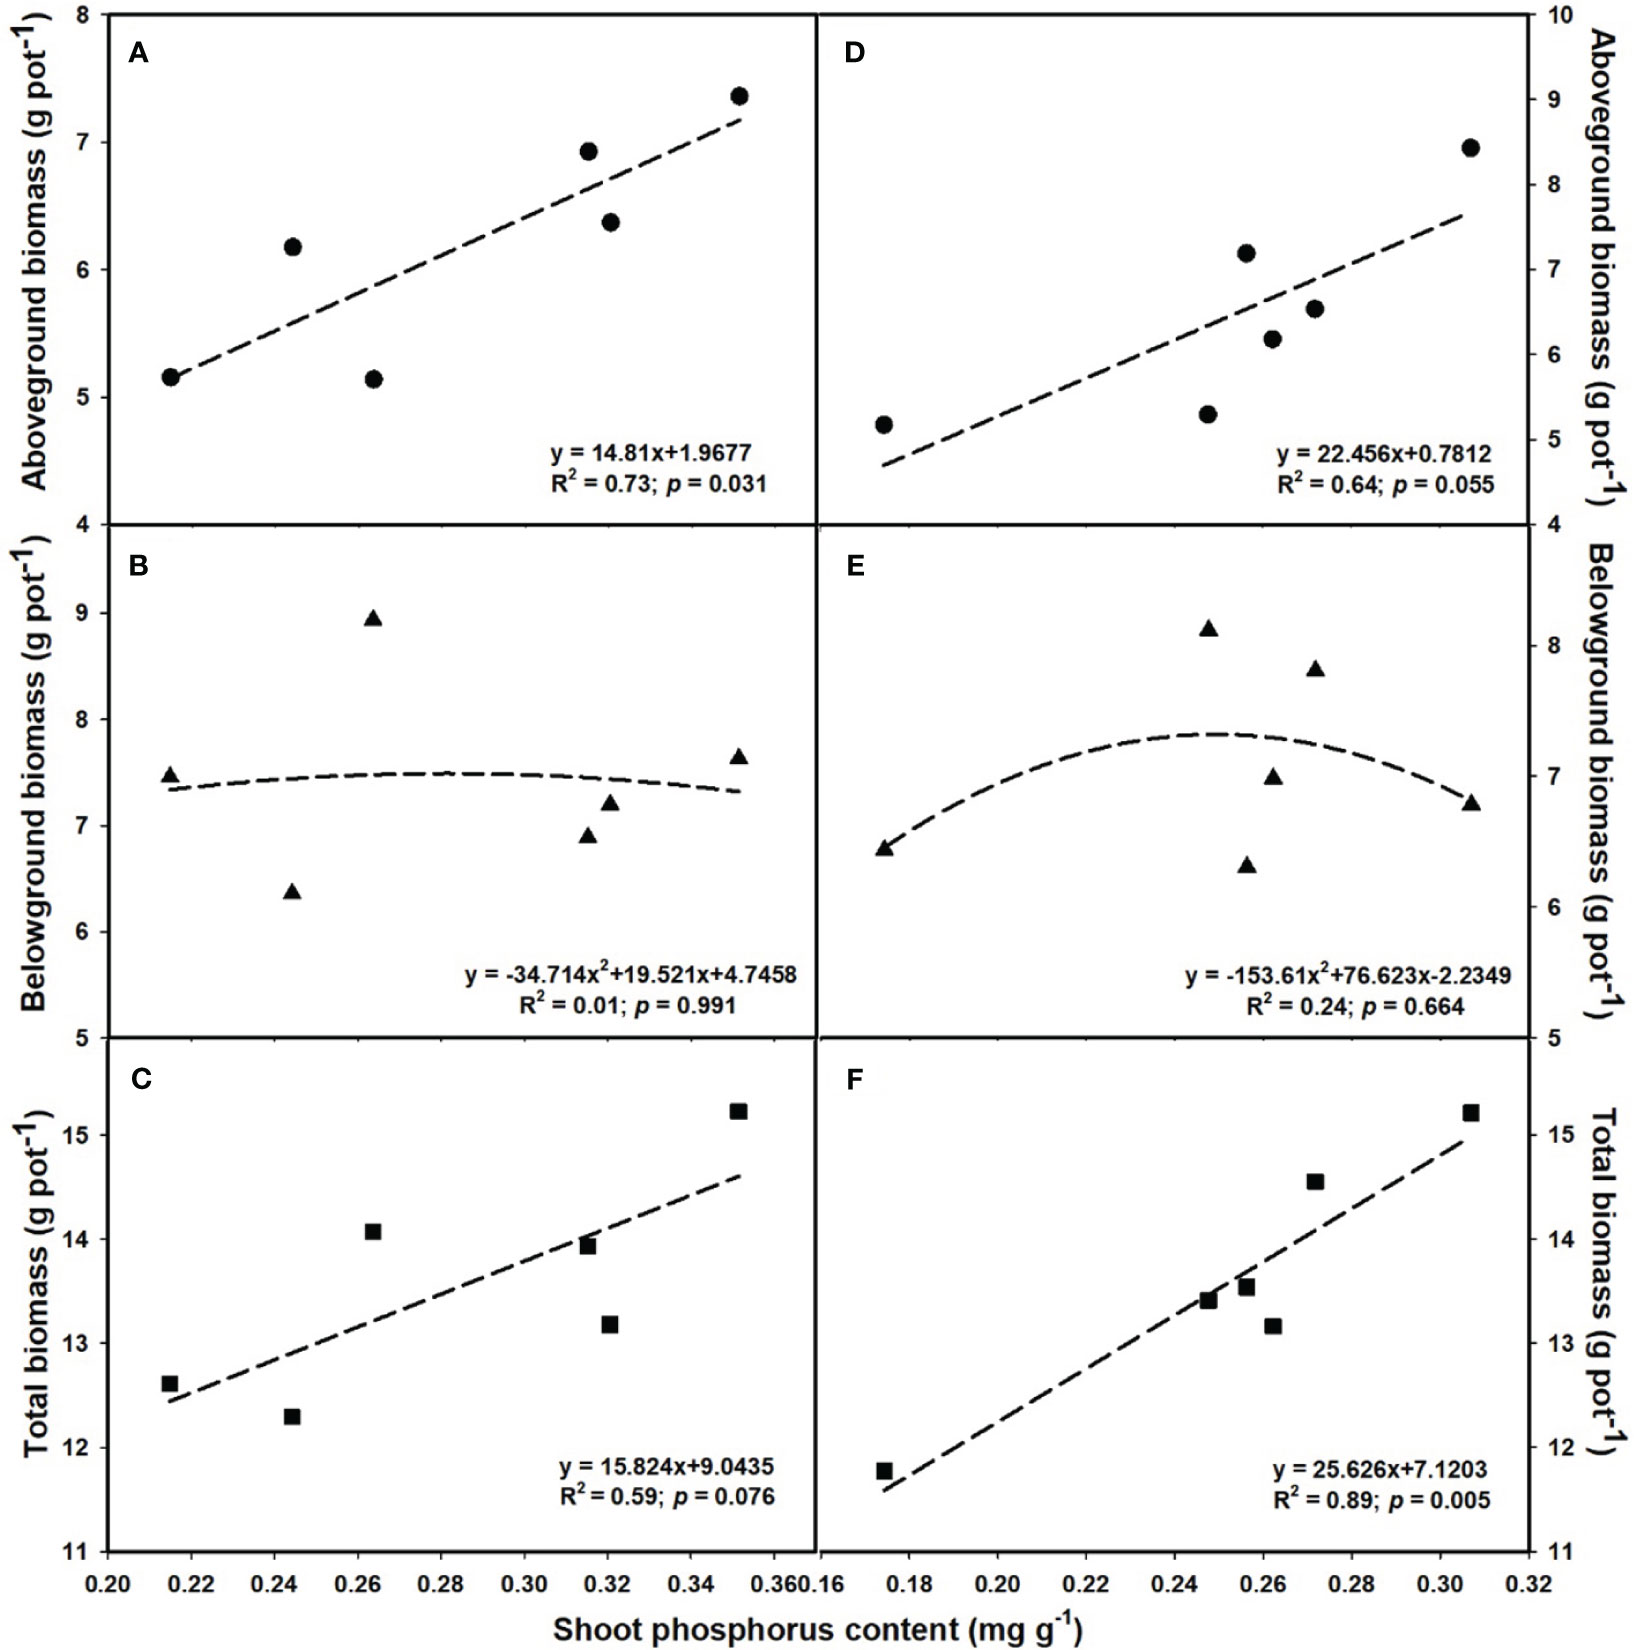
Figure 7 The relationships between leaf phosphorus content and aboveground biomass (A, D), belowground biomass (B, E), and total biomass (C, F). Values are means ± SD (n = 4). The circle symbols represent aboveground biomass, the triangle symbols represent belowground biomass, and the square symbols represent total biomass.
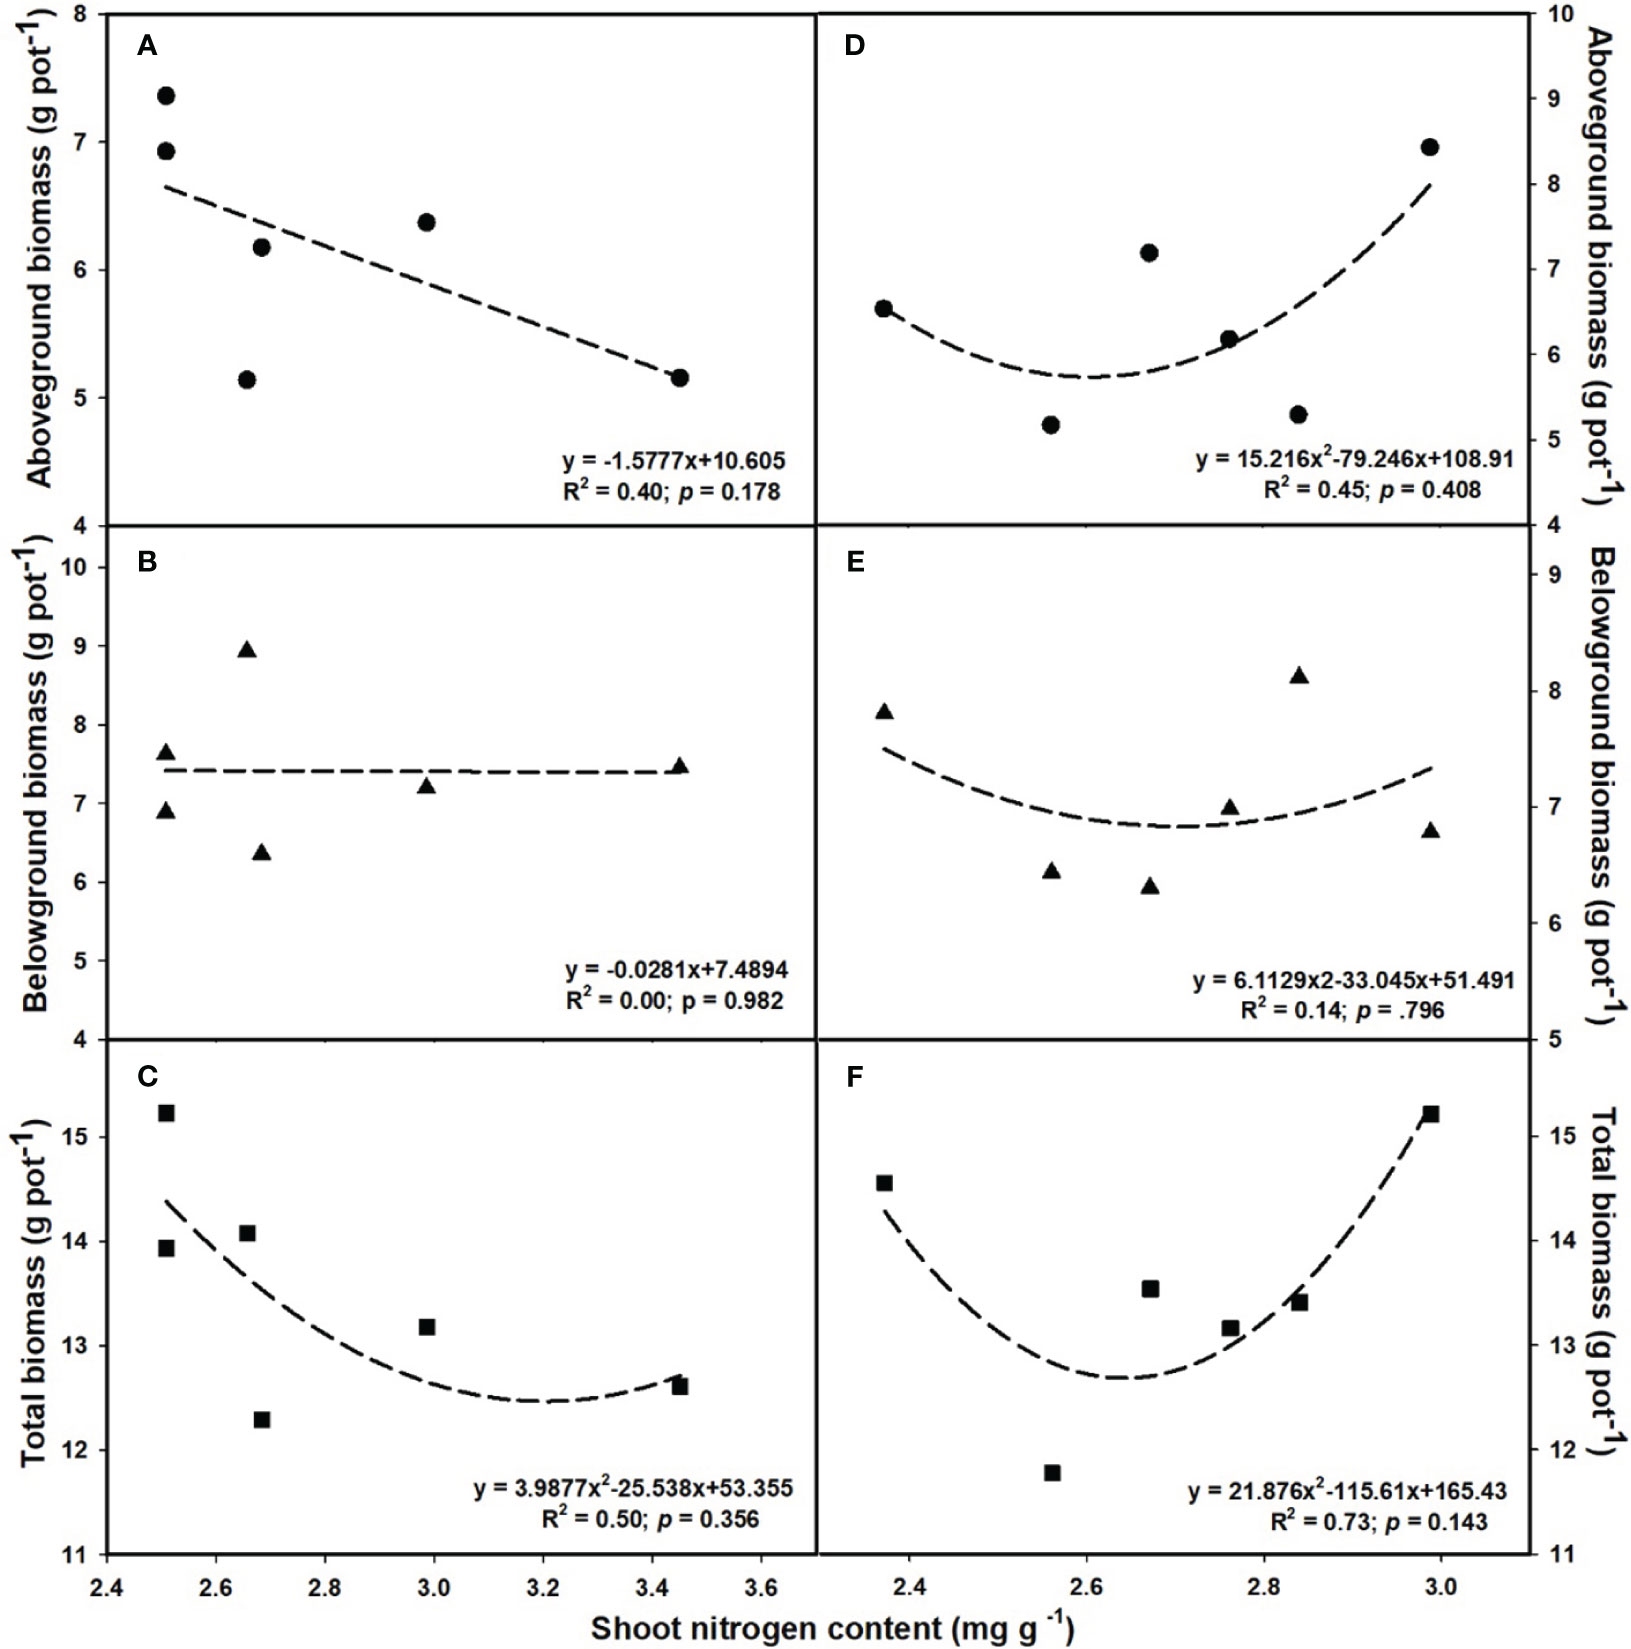
Figure 8 The relationships between leaf nitrogen content and aboveground biomass (A, D), belowground biomass (B, E), and total biomass (C, F). Values are means ± SD (n = 4). The circle symbols represent aboveground biomass, the triangle symbols represent belowground biomass, and the square symbols represent total biomass.
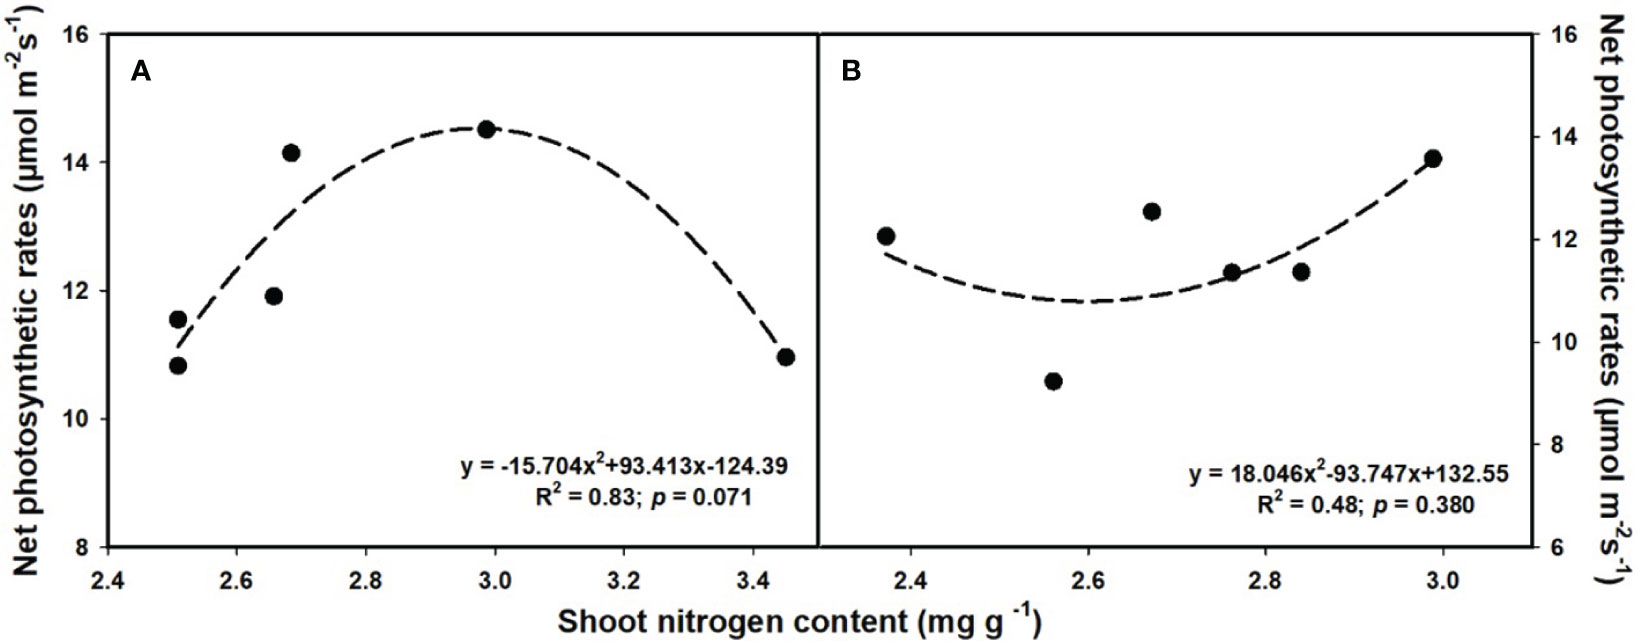
Figure 9 The relationships between leaf nitrogen content and net photosynthetic rates under ambiant (A) and elevated [CO2] (B).
Discussion
P deficit lowers the CO2 fertilization effect on the growth of annual ryegrass
Previous studies have established that since the current atmospheric [CO2] is suboptimal for the Rubisco enzyme involved in leaf photosynthesis (Ainsworth and Rogers, 2007; Pandey et al., 2015). As a result, the “CO2 fertilization effect” would benefit crops, given the enriched atmospheric [CO2], leading to plant growth and crop yield (Sakurai et al., 2014; Xu, 2015). For example, a study on winter wheat indicated that increasing [CO2] had a maximum boost of more than 50% on its biomass (Butterly et al., 2015). However, it should be noted that most of these studies focused on the effects of e[CO2] on plant growth and physiological processes were conducted under sufficient nutrition supplies (Li et al., 2007). Therefore, this CO2 fertilization effect is likely to be required more essential nutrients for sustaining plant growth (Plénet et al., 2000; Lee et al., 2011; Menge et al., 2012; Pandey et al., 2015; Zheng et al., 2017). Increasing CO2 from 400 to 800 μmol mol-1 only substantially enhanced the aboveground biomass of annual ryegrass by 14.5% at P0.5, indicating that e[CO2] indeed boosts the plant growth of annual ryegrass with sufficient P supply. However, the aboveground biomass of annual ryegrass subjected to P deficiency was barely affected by elevated CO2 and total biomass even obviously decreased by 6.6% at P0.004, which suggested that soil P deficiency down regulated the favorable impacts of CO2 fertilization effect on annual ryegrass. Moreover, we also found that the belowground biomass was substantially increased under P deficiency, indicating that plants may preferentially distribute more biomass to the roots for nutrient uptake when subjected to P limitation, which is consistent with the conclusions from previous studies that P deficiency may favor root growth more than shoot growth, and thus result in a higher below/above biomass ratio (Péret et al., 2011; Pandey et al., 2015). Additionally, the pronounced interactive effect of CO2 concentration and P supply on the aboveground, belowground and the total biomass of annual ryegrass was evident in two-way ANOVA results. The total biomass and aboveground biomass also increased with the increase of P supply, suggesting that the positive CO2 fertilization effect on the growth of annual ryegrass was triggered by P supply and the stimulation of biomass accumulation by CO2 depends on the P status.
The CO2 fertilization effect on leaf gas exchange under P deficiency
It is well known that CO2 is one of the key reactants needed by plants to engage in the biochemical process of photosynthesis, and elevated CO2 stimulates leaf photosynthesis (Kimball et al., 2002). However, several lines of evidence suggest that the increased photosynthesis associated with e[CO2] may be diminished during prolonged exposure, particularly in plants limited by nutrient availability (Lauer et al., 1989; Campbell and Sage, 2006; Reich et al., 2006; Pandey et al., 2015). In this study, e[CO2] substantially enhanced the net photosynthetic rate at P0.1 and P0.5 was observed, whereas the net photosynthetic rate of annual ryegrass subjected to P deficit was barely affected or even obviously decreased by elevated CO2 concentration, indicating that the stimulating effect of e[CO2] on the photosynthetic response of plants is weakened as the P concentration decreased. This result may be explained by the fact that high CO2 improves uptake efficiency in the presence of adequate P supply (Nilsson et al., 2010; Jin et al., 2011; Pandey et al., 2015). Moreover, Duchein et al. (1993) found in a research on clover (Trifolium subterraneum L.) that e[CO2] obviously increased its net photosynthetic rate under a P concentration supply of 2 mM, while it was inhibited when subjected to P limitation, which was similar to our study. In addition, we found that the highest P supply (0.5 mM) further enhanced the photosynthetic rate under e[CO2], as evidenced by the higher increase of net photosynthetic rate at P0.5 than that of plants treated with P0.1, indicating that plants will probably demand ultra-optimal levels of P supply if they want to benefit from the general trend of increasing atmospheric CO2 concentration in the future. Moreover, the aboveground biomass of annual ryegrass was barely affected by e[CO2] when the P supply was lower, although the net photosynthetic rates were higher under P deficit. This suggested that the CO2 fertilization effect is more pronounced in stimulating the growth of annual ryegrass under sufficient P supply. Additionally, the obvious decrease in the net photosynthetic rate at elevated CO2, compared to ambient CO2, under the lowest P supply (0.004 mM) likely indicates the crucial role of stomatal limitation on photosynthesis. Furthermore, one of the most consistent responses of plants to elevated atmospheric CO2 is a decrease in stomatal conductance (Fleisher et al., 2012; Singh and Reddy, 2014; Zheng et al., 2019; Zheng et al., 2020). This aligned with our results, as we observed a remarkable decline in stomatal conductance with increasing CO2 regardless of P supply. However, other nutrient studies have reported that reduced stomatal conductance under lower P supply did not seem to be the major reason for the limitation of photosynthesis (Jin et al., 2011; Singh et al., 2013a). From the above discussion, reduced photosynthesis may be a mechanism by which crops cope with soil phosphorus limitation, which may largely contribute to lower biomass.
Stomatal diffusion and tissue composition partially explain the decreasing benefit of e[CO2] to annual ryegrass under P deficiency
It has been reported that plant stomata normally exhibit a variety of short-term behavioral and long-term morphological reactions to CO2 (Zheng et al., 2013; Xu, 2015), soil moisture (Sun et al., 2014), thus stomatal regulation is a potential mechanism for adaptation to the external environment during plant growth. In addition to CO2 concentrations and soil moisture conditions, Sekiya and Yano (2008) also pointed out that phosphorus supply level can modulate the rate of stomatal production in plant epidermal cells, subsequentially influenced the SD. Our results have further confirmed that stomatal traits of annual ryegrass varied with the P supply and atmospheric CO2 concentration. Our results showed that lower P supply reduced the stomatal width and stomatal area, suggesting that annual ryegrass improved their adaptability to different P situations through regulating their stomatal opening. We found that the response of annual ryegrass stomatal density under e[CO2] depended on P concentration, i.e., stomatal density increased at higher P concentrations and decreased at lower P supply. This CO2-induced decrease of stomatal density under lower P supply may explain the downregulation of leaf photosynthesis, since the SD partially determines the efficiency of CO2 diffusion from the atmosphere to the mesophyll tissues (Jin et al., 2011). However, observations from previous studies regarding the influence of elevated CO2 concentration on SD differed (Ryle and Stanley, 1992; Woodward et al., 2002; Marchi et al., 2004). Regarding this inconsistency, Gray et al. (2000) pointed out that interspecific differences may play a role. However, it should be noted that, as revealed in this study, we cannot deny the strongly interactive effects between environmental variables. Furthermore, it has been well demonstrated that stomatal distribution patterns can affect the net photosynthetic rate and transpiration rate (Soares et al., 2008; Zheng et al., 2013). In the current research, we found that e[CO2] made the spatial distribution pattern of stomata more regular under sufficient P supply, while the opposite was true when annual ryegrass was subjected to P deficiency. This may partially explain why increasing CO2 in this study did not enhance or even lowered the net photosynthetic rate under a lower P supply. This is because the spatial distribution of the stomata on the blade surface affects the diffusion distance of carbon dioxide between the stomata (Zheng et al., 2013; Xu, 2015), which means that the more regular the spatial distribution of the stomata, the more efficient the blade is in terms of gas exchange. Overall, these results implied that P supply partially decided the response of the stomatal distribution pattern to e[CO2].
It is now well established from a variety of studies that P limitation and e[CO2] are likely to alter the distribution patterns of tissue constituents as well (Taub and Wang, 2008; Singh et al., 2013a). However, previous studies on leaf P concentration have had contradictory results (Fangmeier et al., 1999; Lewis et al., 2010). For instance, Lewis et al. (2010) reported that leaf P content of Populus deltoides was reduced by 22.2-48.6% with increasing the CO2 concentration from 350 to 700 μmol mol-1. While Fangmeier et al. (1999) found that e[CO2] did not significantly lower the P concentration in the leaves of wheat. These inconsistencies suggested that the potential complexity of the effects of e[CO2] on P nutrition. In the current study, we found that the biomass - net photosynthetic rates relationship followed a similar linear or bell-shaped curve like the biomass-shoot P content relationship at the e[CO2] (Figures 6 and 7). It shows that e[CO2] did not enhance the net photosynthetic rate at a lower P supply, possibly owing to the decrease in leaf P content. Additionally, other studies also suggest that the decrease in nitrogen content in leaves may also be attributed to the decrease in photosynthesis, as the leaf N content is tightly correlated with the content of Rubisco enzymes (Zheng et al., 2019). Moreover, the P content in shoots dramatically decreased under P limitation, but the differences in roots under 0.001 mM - 0.1 mM P supply were mostly insignificant, indicating that shoots may be more sensitive to P limitation than roots.
Conclusion
We found that the growth enhancement effects of elevated CO2 were trivial under the range of P treatments, as amply demonstrated by the reduction in leaf photosynthesis and plant biomass when annual ryegrass was subjected to P limitation. Consequently, P deficiency shifted biomass partitioning by decreasing aboveground production and increasing the root fraction of total biomass. The negative impacts of P limitation on the growth processes of plants benefiting from the effects of CO2 fertilization can also be ascribed to the changes in the characteristics of individual stomatal morphology and the stomatal spatial distribution pattern, as well as the changes in tissue composition of annual ryegrass. Nevertheless, the increasing sensitivity of annual ryegrass growth to P supply with increasing [CO2] indicates that annual ryegrass will increase its requirements for P to support an aggressive growth response to future atmospheric conditions. Therefore, the role of annual ryegrass in grassland ecosystem responses to future climate change may be incrementally influenced by P supply.
Data availability statement
The original contributions presented in the study are included in the article/supplementary material. Further inquiries can be directed to the corresponding author.
Author contributions
FL: Writing – original draft. CH: Writing – original draft. ZC: Formal Analysis, Writing – original draft. CM: Data curation, Writing – original draft. JY: Data curation, Formal Analysis, Writing – review & editing. LL: Formal Analysis, Writing – review & editing. YZ: Data curation, Writing – review & editing. LH: Conceptualization, Writing – review & editing.
Funding
The author(s) declare financial support was received for the research, authorship, and/or publication of this article. This research was partially supported by the National Natural Science Foundation of China (32071608), the Natural Science Foundation of Hebei Province (E2021402031 and E2023402086), the Central Guidance on Local Science and Technology Development Funding of Hebei Province (226Z6401G), and the Handan Science and Technology Research and Development Program (19422011008-47).
Conflict of interest
The authors declare that the research was conducted in the absence of any commercial or financial relationships that could be construed as a potential conflict of interest.
The reviewer LY declared a shared affiliation with the author(s) ZC to the handling editor at the time of review.
Publisher’s note
All claims expressed in this article are solely those of the authors and do not necessarily represent those of their affiliated organizations, or those of the publisher, the editors and the reviewers. Any product that may be evaluated in this article, or claim that may be made by its manufacturer, is not guaranteed or endorsed by the publisher.
References
Abel, S., Ticconi, C. A., Delatorre, C. A. (2002). Phosphate sensing in higher plants. Physiol. Plantarum. 115, 1–8. doi: 10.1034/j.1399-3054.2002.1150101.x
Ainsworth, E. A. (2008). Rice production in a changing climate: a meta-analysis of responses to elevated carbon dioxide and elevated ozone concentration. Glob. Change Biol. 14, 1642–1650. doi: 10.1111/j.1365-2486.2008.01594.x
Ainsworth, E. A., Long, S. P. (2005). What have we learned from 15 years of free-air CO2 enrichment (FACE)? A meta-analytic review of the responses of photosynthesis, canopy properties and plant production to rising CO2. New Phytol. 165, 351–372. doi: 10.1111/J.1469-8137.2004.01224.X
Ainsworth, E. A., Rogers, A. (2007). The response of photosynthesis and stomatal conductance to rising (CO2): mechanisms and environmental interactions. Plant Cell. Environ. 30, 258–270. doi: 10.1111/j.1365-3040.2007.01641.x
Almeida, J. P. F., Lüscher, A., Frehner, M., Oberson, A., Nösberger, J. (1999). Partitioning of P and the activity of root acid phosphatase in white clover (Trifolium repens L.) are modified by increased atmospheric CO2 and P fertilization. Plant Soil. 210, 159–166. doi: 10.1023/A:1004625801141
Arndal, M. F., Schmidt, I. K., Kongstad, J., Beier, C., Michelsen, A. (2014). Root growth and N dynamics in response to multi-year experimental warming, summer drought and elevated CO2 in a mixed heath land-grass ecosystem. Funct. Plant Biol. 41, 1–10. doi: 10.1071/FP13117
Butterly, C. R., Armstrong, R., Chen, D. L., Tang, C. X. (2015). Carbon and nitrogen partitioning of wheat and field pea grown with two nitrogen levels under elevated CO2. Plant Soil. 391, 367–382. doi: 10.1007/s11104-015-2441-5
Byrne, S. L., Foito, A., Hedley, P. E., Morris, J. A., Stewart, D., Barth, S. (2011). Early response mechanisms of perennial ryegrass (Lolium perenne) to phosphorus deficiency. Ann. Bot. 107, 243–254. doi: 10.1093/aob/mcq234
Campbell, C. D., Sage, R. E. (2006). Interactions between the effects of atmospheric CO2 content and P nutrition on photosynthesis in white lupin (Lupinus albus L.). Plant Cell. Environ. 29, 844–853. doi: 10.1111/j.1365-3040.2005.01464.x
Castanheira, N., Dourado, A. C., Alves, P. I., Cortés-Pallero, A. M., Delgado-Rodríguez, A. I., Prazeres, Â., et al. (2014). Annual ryegrass-associated bacteria with potential for plant growth promotion. Microbiol. Res. 169, 768–779. doi: 10.1016/j.micres.2013.12.010
Ceulemans, R., Praet, L. V., Jiang, X. N. (1995). Effects of CO2 enrichment, leaf position and clone on stomatal index and epidermal cell density in polar (Populus). New Phytol. 131, 99–107. doi: 10.1111/J.1469-8137.1995.TB03059.X
Ceulemans, T., Bodé, S., Bollyn, J., Harpole, S., Coorevits, K., Peeters, G., et al. (2017). Phosphorus resource partitioning shapes phosphorus acquisition and plant species abundance in grasslands. Nat. Plants. 3, 16224. doi: 10.1038/nplants.2016.224
Chiera, J., Thomas, J., Rufty, T. (2002). Leaf initiation and development in soybean under phosphorus stress. J. Exp. Bot. 53, 473–481. doi: 10.1093/jexbot/53.368.473
Coleman, J. S., McConnaughay, K. D. M., Bazzaz, F. A. (1993). Elevated CO2 and plant nitrogen-use: is reduced tissue nitrogen concentration size-dependent? Oecologia. 93, 195–200. doi: 10.1007/BF00317671
Crous, K. Y., Zaragoz-Castells, J., Löw, M., Ellsworth, D. S., Tissue, D. T., Tjoelker, M. G., et al. (2011). Seasonal acclimation of leaf respiration in Eucalyptus saligna trees: Impacts of elevated atmospheric CO2 and summer drought. Glob. Change Biol. 17, 1560–1576. doi: 10.1111/j.1365-2486.2010.02325.x
Deng, Q., Hui, D., Dennis, S., Reddy, K. C. (2017). Responses of terrestrial ecosystem phosphorus cycling to nitrogen addition: a meta-analysis. Glob. Ecol. Biogeogr. 26, 713–728. doi: 10.1111/geb.12576
Duan, H. L., Ontedhu, J., Milham, P., Lewis, J. D., Tissue, D. T. (2019). Effects of elevated carbon dioxide and elevated temperature on morphological, physiological and anatomical responses of Eucalyptus tereticornis along a soil phosphorus gradient. Three Physiol. 39 (11), 1821–1837. doi: 10.1093/treephys/tpz094
Duchein, M. C., Bonicel, A., Betsche, T. (1993). Photosynthetic net CO2 uptake and leaf phosphate concentrations in CO2 enriched clover (Trifolium subterraneum L.) at three levels of phosphate nutrition. J. Exp. Bot. 44, 17–22. doi: 10.1093/jxb/44.1.17
Edwards, E. J., McCaffery, S., Evans, J. R. (2006). Phosphorus availability and elevated CO2 affect biological nitrogen fixation and nutrient fluxes in a clover-dominated sward. New Phytol. 169, 157–167. doi: 10.1111/J.1469-8137.2005.01568.X
Ellsworth, D. S., Anderson, I. C., Crous, K. Y., Cooke, J., Drake, J. E., Gherlenda, A. N., et al. (2017). Elevated CO2 does not increase eucalypt forest productivity on a low-phosphorus soil. Nat. Clim. Change. 7, 279–282. doi: 10.1038/nclimate3235
Elser, J. J., Bracken, M. E. S., Cleland, E. E., Gruner, D. S., Harpole, W. S., Hillebrand, H., et al. (2007). Global analysis of nitrogen and phosphorus limitation of primary producers in freshwater, marine and terrestrial ecosystems. Ecol. Letters. 10, 1135–1142. doi: 10.1111/j.1461-0248.2007.01113.x
Fangmeier, A., Temmerman, L. D., Mortensen, L., Kemp, K., Burke, J., Mitchell, R., et al. (1999). Effects on nutrients and on grain quality in spring wheat crops grown under elevated CO2 concentrations and stress conditions in the European, multiple-site experiment ‘ESPACE-wheat’. Eur. J. Agron. 10, 215–229. doi: 10.1016/S1161-0301(99)00012-X
Fay, P. A., Prober, S. M., Harpole, W. S., Knops, J. M. H., Bakker, J. D., Borer, E. T., et al. (2015). Grassland productivity limited by multiple nutrients. Nat. Plants. 1, 15080. doi: 10.1038/nplants.2015.80
Fleisher, D. H., Wang, Q., Timlin, D. J., Chun, J. A., Reddy, V. R. (2012). Response of potato gas exchange and productivity to phosphorus deficiency and carbon dioxide enrichment. Crop Sci. 52, 1803–1815. doi: 10.2135/cropsci2011.09.0526
Fredeen, A. L., Rao, I. M., Terry, N. (1989). Influence of phosphorus nutrition on growth and carbon partitioning in Glycine max. Plant Physiol. 89, 225–230. doi: 10.1104/PP.89.1.225
Gray, J. E., Holroyd, G. H., Lee, V. D. F. M., Bahrami, A. R., Sijmons, P. C., Woodward, F. I., et al. (2000). The HIC signaling pathway links CO2 perception to stomatal development. Nature. 408, 713–716. doi: 10.1038/35047071
Hungate, B. A., Dukes, J. S., Shaw, M. R., Luo, Y. Q., Field, C. B. (2003). Nitrogen and climate change. Science. 302, 1512–1513. doi: 10.1126/science.1091390
IPCC (2013). Climate change: the physical science basis, contribution of working group I to the fifth assessment report of the intergovernmental panel on climate change (United Kingdom/New York, NY, USA: Cambridge University Press, Cambridge).
Jacob, J., Lawlor, D. (1991). Stomatal and mesophyll limitations of photosynthesis in phosphate deficient sunflower, maize and wheat plants. J. Exp. Bot. 42, 1003–1011. doi: 10.1093/jxb/42.8.1003
Jin, S. H., Huang, J. Q., Li, X. Q., Zheng, B. S., Wu, J. S., Wang, Z. J., et al. (2011). Effects of potassium supply on limitations of photosynthesis by mesophyll diffusion conductance in Carya cathayensis. Tree Physiol. 31, 1142–1151. doi: 10.1093/treephys/tpr095
Jin, J., Tang, C. X., Sale, P. (2015). Impact of elevated carbon dioxide on the phosphorus nutrition of plants: a review. Ann. Bot. 116, 987–999. doi: 10.1093/aob/mcv088
Jin, B., Wang, L., Wang, J., Jiang, K. Z., Wang, Y., Jiang, X. X., et al. (2011). The effect of artificial warming on leaf functional traits, leaf structure and leaf biochemistry in Arabidopsis thaliana. BMC Plant Biol. 11, 35. doi: 10.1186/1471-2229-11-35
Kimball, B. A., Kobayashi, K., Bindi, M. (2002). Responses of agricultural crops to free-air CO2 enrichment. Adv. Agron. 77, 293–368. doi: 10.1016/S0065-2113(02)77017-X
Kirschbaum, M. U. F., Tompkins, D. (1990). Photosynthetic responses to phosphorus nutrition in Eucalyptus grandis seedlings. Aust. J. Plant Physiol. 17, 527–535. doi: 10.1071/pp9900527
Lambers, H., Shane, M. W., Cramer, M. D., Pearse, S. J., Veneklaas, E. J. (2006). Root structure and functioning for efficient acquisition of phosphorus: matching morphological and physiological traits. Ann. Bot-London. 98, 693–713. doi: 10.1093/aob/mcl114
Lauer, M. J., Pallardy, S. G., Blevins, D. G., Randall, D. D. (1989). Whole leaf carbon exchange characteristics of phosphate deficient soybeans (Glycine max L.). Plant Physiol. 91, 848–854. doi: 10.1104/PP.91.3.848
Leakey, A. D. B., Ainsworth, E. A., Bernacchi, C. J., Rogers, A., Long, S. P., Ort, D. R., et al. (2009). Elevated CO2 effects on plant carbon, nitrogen, and water relations: six important lessons from FACE. J. Exp. Bot. 60, 2859–2876.
Leakey, A. D. B., Uribelarrea, M., Ainsworth, E. A., Naidu, S. L., Rogers, A., Ort, D. R., et al. (2006). Photosynthesis, productivity, and yield of maize are not affected by open-air elevation of CO2 concentration in the absence of drought. Plant Physiol. 140, 779–790. doi: 10.1104/pp.105.073957
Lee, J. S. (2011). Combined effect of elevated CO2 and temperature on the growth and phenology of two annual C3 and C4 weedy species. Agr. Ecosyst. Environ. 140, 484–191. doi: 10.1016/j.agee.2011.01.013
Lee, T. D., Tjoelker, M. G., Ellsworth, D. S. (2001). Leaf gas exchange responses of 13 prairie grassland species to elevated CO2 and increased nitrogen supply. New Phytol. 150, 405–418. doi: 10.2307/1353746
Lenka, N. K., Lal, R. (2012). Soil-related constraints to the carbon dioxide fertilization effect. Crit. Rev. Plant Sci. 31, 342–357. doi: 10.1080/07352689.2012.674461
Lewis, J. D., Lucash, M., Olszyk, D. M., Tingey, D. T. (2004). Relationships between needle nitrogen concentration and photosynthetic responses of Douglas-fir seedlings to elevated carbon dioxide and temperature. New Phytol. 162, 355–364. doi: 10.1111/j.1469-8137.2004.01036.x
Lewis, J. D., Ward, J. K., Tissue, D. T. (2010). Phosphorus supply drives nonlinear responses of cottonwood (Populus deltoides) to increases in CO2 concentration from glacial to future concentrations. New Phytol. 187, 438–448. doi: 10.1111/j.1469-8137.2010.03307.x
Li, J., Zhou, J. M., Duan, Z. Q., Du, C. W., Wang, H. Y. (2007). Effect of CO2 enrichment on the growth and nutrient uptake of tomato seedlings. Pedosphere. 17, 343–351. doi: 10.1016/S1002-0160(07)60041-1
Marchi, S., Tognetti, R., Vaccari, F. P., Lanini, M., Kaligaric, M., Miglietta, F., et al. (2004). Physiological and morphological responses of grassland species to elevated atmospheric CO2 concentrations in FACE-systems and natural CO2 springs. Funct. Plant Biol. 31, 181–194. doi: 10.1071/FP03140
McCarthy, H. R., Oren, R., Johnsen, K. H., Gallet-Budynek, A., Pritchard, S. G., Cook, C. W., et al. (2010). Re-assessment of plant carbon dynamics at the Duke free-air CO2 enrichment site: interactions of atmospheric [CO2] with nitrogen and water availability over stand development. New Phytol. 185, 514–528. doi: 10.1111/j.1469-8137.2009.03078.x
Menge, D. N. L., Field, C. B. (2007). Simulated global changes alter phosphorus demand in annual grassland. Glob Change Biol. 13, 2582–2591. doi: 10.1111/j.1365-2486.2007.01456.x
Menge, D. N. L., Hedin, L. O., Pacala, S. W. (2012). Nitrogen and phosphorus limitation over long-term ecosystem development in terrestrial ecosystems. PloS One 7, 1–17. doi: 10.1371/journal.pone.0042045
Nilsson, L., Muller, R., Nielsen, T. H. (2010). Dissecting the plant transcriptome and the regulatory responses to phosphate deprivation. Physiol. Plant 139, 129–143. doi: 10.1111/j.1399-3054.2010.01356.x
Norby, R. J., Warren, J. M., Iversen, C. M., Medlyn, B. E., McMurtrie, R. E. (2010). CO2 enhancement of forest productivity constrained by limited nitrogen availability. Proc. Natl. Acad. Sci. U. S. A. 107, 19368–19373. doi: 10.1073/pnas.1006463107
Nord, E. A., Lynch, J. P. (2009). Plant phenology: a critical controller of soil resource acquisition. J. Exp. Bot. 60, 1927–1937. doi: 10.1093/jxb/erp018
Norisada, M., Motoshige, T., Kojima, K., Tange, T. (2006). Effects of phosphate supply and elevated CO2 on root acid phosphatase activity in Pinus densiflora seedlings. J. Plant Nutr. Soil Sci. 169, 274–279. doi: 10.1002/jpln.200520558
Palma, D. A., Blumwald, E., Plaxton, W. C. (2000). Upregulation of vascular H(+)-translocating pyrophosphatase by phosphate starvation of Brassica napus (rapeseed) suspension cell cultures. FEBS Lett. 486, 155–158. doi: 10.1016/S0014-5793(00)02266-3
Pandey, R., Dubey, K. K., Ahmad, A., Nilofar, R., Verma, R., Jain, V., et al. (2014). Elevated CO2 improves growth and phosphorus utilization efficiency in cereal species under sub-optimal phosphorus supply. J. Plant Nutr. 38, 1196–1217. doi: 10.1080/01904167.2014.983116
Pandey, R., Zinta, G., AbdElgawad, H., Ahmad, A., Jain, V., Janssens, I. A. (2015). Physiological and molecular alterations in plants exposed to high CO2 under phosphorus stress. Biotechnol. Adv. 33, 303–316. doi: 10.1016/j.bioteChadv.2015.03.011
Peñuelas, J., Poulter, B., Sardans, J., Ciais, P., Velde, M. A. D., Bopp, L., et al. (2013). Human-induced nitrogen-phosphorus imbalances alter natural and managed ecosystems across the globe. Nat. Commun. 4, 2934. doi: 10.1038/ncomms3934
Péret, B., Clement, M., Nussaume, L., Desnos, T. (2011). Root developmental adaptation to phosphate starvation: better safe than sorry. Trends Plant Sci. 16, 442–450. doi: 10.1016/j.tplants.2011.05.006
Plénet, D., Etchebest, S., Mollier, A., Pellerin, S. (2000). Growth analysis of maize field crops under phosphorus deficiency. Plant Soil. 223, 117–130. doi: 10.1023/A:1004877111238
Reich, P. B., Hobbie, S. E., Lee, T., Ellsworth, D. S., West, J. B., Tilman, D., et al. (2006). Nitrogen limitation constrains sustainability of ecosystem response to CO2. Nature. 440, 922–925. doi: 10.1038/nature04486
Richardson, A. E., Hocking, P. J., Simpson, R. J., George, T. S. (2009). Plant mechanisms to optimise access to soil phosphorus. Crop Pasture Sci. 60, 124–143. doi: 10.1071/CP07125
Ripley, B. D. (1976). The second-order analysis of stationary point processes. Appl. Probab. 13, 255–266. doi: 10.1017/S0021900200094328
Rogers, G. S., Payne, L., Milham, P., Conroy, J. (1993). Nitrogen and phosphorus requirements of cotton and wheat under changing atmospheric CO2 concentrations. Plant Soil. 155, 155–156, 231-234. doi: 10.1007/BF00025026
Ryle, G. J. A., Stanley, J. (1992). Effects of elevated CO2 on stomatal size and distribution in perennial ryegrass. Ann. Bot. 69, 563–565. doi: 10.1093/oxfordjournals.aob.a088387
Sakurai, G., Lizumi, T., Nishimon, M., Yokozawa, M. (2014). How much as the increase in atmospheric CO2 directly affected past soybean production. Sci. Rep. 4, 4978. doi: 10.1038/srep04978
Sekiya, N., Yano, K. (2008). Stomatal density of cowpea correlates with carbon isotope discrimination in different phosphorus, water and CO2 environments. New Phytol. 179, 799–807. doi: 10.1111/j.1469-8137.2008.02518.x
Singh, S. K., Badgujar, G., Reddy, V. R., Fleisher, D. H., Bunce, J. A. (2013b). Carbon dioxide diffusion across stomata and mesophyll and photo-biochemical processes as affected by growth CO2 and phosphorus nutrition in cotton. J. Plant Physiol. 170, 801–813. doi: 10.1016/j.jplph.2013.01.001
Singh, S. K., Badgujar, G., Reddy, V. R., Fleisher, D. H., Timlin, D. J. (2013a). Effect of phosphorus nutrition on growth and physiology of cotton under ambient and elevated carbon dioxide. J. Agro. Crop Sci. 199, 436–448. doi: 10.1111/jac.12033
Singh, S. K., Reddy, V. R. (2014). Combined effects of phosphorus nutrition and elevated carbon dioxide concentration on chlorophyll fluorescence, photosynthesis, and nutrient efficiency of cotton. J. Plant Nutr. Soil Sci. 177, 892–902. doi: 10.1002/jpln.201400117
Soares, A. S., Driscoll, S. P., Olmos, E., Harbinson, J., Arrabaca, M. C., Foyer, C. H. (2008). Adaxial/abaxial specification in the regulation of photosynthesis and stomatal opening with respect to light orientation and growth with CO2 enrichment in the C4 species Paspalum dilatatum. New Phytol. 177, 186–198. doi: 10.1111/j.1469-8137.2007.02218.x
Steffen, W. L., Canadell, J. G. (2005). Carbon dioxide fertilization and climate change policy. Department of Environment and Heritage (AGO: Australian Greenhouse Office).
Sun, Y. Q., Yan, F., Cui, X. Y., Liu, F. L. (2014). Plasticity in stomatal size and density of potato leaves under different irrigation and phosphorus regimes. J. Plant Physiol. 171, 1248–1255. doi: 10.1016/j.jplph.2014.06.002
Suter, D., Frehner, M., Fischer, B. U. (2002). Elevated CO2 increases carbon allocation to the roots of Lolium perenne under free-air CO2 enhancement but not in a controlled environment. New Phytol. 154, 65–75. doi: 10.1046/j.1469-8137.2002.00368.x
Tan, K., Zhou, G. S., Ren, S. X. (2013). Responses of leaf dark respiration of winter wheat to changes in CO2 concentration and temperature. Chin. Sci. Bull. 58, 1795–1800. doi: 10.1007/s11434-012-5605-1
Taub, D. R., Wang, X. (2008). Why are nitrogen concentrations in plant tissue lower under elevated CO2? A critical examination of the hypotheses. J. Integr. Plant Biol. 50, 1365–1374. doi: 10.1111/j.1744-7909.2008.00754.x
Vance, C. P., Uhde-Stone, C., Allan, D. L. (2003). Phosphorus acquisition and use: critical adaptations by plants for securing a nonrenewable resource. New Phytol. 15, 423–447. doi: 10.1046/J.1469-8137.2003.00695.X
Wang, S. R., Li, H. S., Lin, C. X. (2013). Physiological, biochemical and growth responses of Italian ryegrass to butachlor exposure. Pestic. Biochem. Physiol. 106, 21–27. doi: 10.1016/j.pestbp.2013.03.007
Wang, X., Taub, D. R. (2010). Interactive effects of elevated carbon dioxide and environmental stress on root mass fraction in plants: a meta-analytical synthesis using Pair wise techniques. Oecologia. 163, 1–11. doi: 10.1007/s00442-010-1572-x
Wissuwa, M., Gamat, G., Ismail, A. M. (2005). Is root growth under phosphorus deficiency affected by source or sink limitations? J. Exp. Bot. 56, 1943–1950. doi: 10.1093/jxb/eri189
Woodward, F. I., Lake, J. A., Quick, W. P. (2002). Stomatal development and CO2: ecological consequences. New Phytol. 153, 477–484. doi: 10.1046/j.0028-646X.2001.00338.x
Xu, M. (2015). The optimal atmospheric CO2 concentration for the growth of winter wheat (Triticum aestivum). J. Plant Physiol. 184, 89–97. doi: 10.1016/j.jplph.2015.07.003
Xu, M. Y., He, Z. L., Deng, Y., Wu, L. Y., Nostrand, J. D. V., Hobbie, S. E., et al. (2013). Elevated CO2 influences microbial carbon and nitrogen cycling. BMC Microbiol. 13, 124. doi: 10.1186/1471-2180-13-124
Yu, J., Chen, L., Xu, M., Huang, B. R. (2012b). Effects of elevated CO2 on physiological responses of tall fescue to elevated temperature, drought stress, and the combined stress. Crop Sci. 52, 1848–1858. doi: 10.2135/cropsci2012.01.0030
Yu, J., Du, H., Xu, M. (2012a). Metabolic responses to heat stress under elevated atmospheric CO2 concentration in a cool-season grass species. J. Am. Soc Hortic. Sci. 137, 221–228. doi: 10.21273/JASHS.137.4.221
Zhan, S., Wang, Y., Zhu, Z., Li, W., Bai, Y. (2017). Nitrogen enrichment alters plant N: P stoichiometry and intensifies phosphorus limitation in a steppe ecosystem. Environ. Exp. Bot. 134, 21–32. doi: 10.1016/j.envexpbot.2016.10.014
Zhang, Z., Lu, S., Wang, W., Lepo, J. E., Guan, C., Ismail, A. M., et al. (2017). Effect of elevated atmospheric CO2 on nitrogen distribution and N utilization efficiency in winter rape (Brassica napus L.). Pak. J. Bot. 49, 1307–1315. doi: 10.1016/j.aquaculture.2005.05.014
Zhang, L., Yang, Y., Zhan, X. (2010). Responses of a dominant temperate grass plant (Leymus chinensis) to elevated carbon dioxide and nitrogen addition in China. J. Environ. Qual. 39, 251–259. doi: 10.2134/jeq2009.0109
Zheng, Y. P., He, C. L., Guo, L. L., Cheng, D. J., Li, F., Peng, Z. P., et al. (2020). Soil water status triggers CO2 fertilization effect on the growth of winter wheat (Triticum aestivum). Agr. For. Meteorol. 291, 108097. doi: 10.1016/j.agrformet.2020.108097
Zheng, Y. P., Li, R. Q., Hao, L. H., Cheng, D. J., Wu, H. X., Li, F., et al. (2017). Growth, physiological, and biochemical responses of three grass species to elevated carbon dioxide concentrations. Pak. J. Bot. 49. doi: 10.3389/fpls.2015.00321
Zheng, Y. P., Li, F., Hao, L. H., Sheday, A. A., Guo, L. L., Ma, C., et al. (2018). The optimal CO2 concentrations for the growth of three perennial grass species. BMC Plant Biol. 18, 27. doi: 10.1186/s12870-018-1243-3
Zheng, Y. P., Li, F., Hao, L. H., Yu, J. J., Guo, L. L., Zhou, H. R., et al. (2019). Elevated CO2 concentration induces photosynthetic down-regulation with changes in leaf structure, non-structural carbohydrates and nitrogen content of soybean. BMC Plant Biol. 19, 255. doi: 10.1186/s12870-019-1788-9
Keywords: elevated CO2 concentration, P limitation, stomatal traits, leaf photosynthesis, biochemical
Citation: Li F, He C, Chang Z, Ma C, Yu J, Liu L, Zhang Y and Hao L (2023) Effects of elevated carbon dioxide on plant growth and leaf photosynthesis of annual ryegrass along a phosphorus deficiency gradient. Front. Plant Sci. 14:1271262. doi: 10.3389/fpls.2023.1271262
Received: 02 August 2023; Accepted: 06 November 2023;
Published: 27 November 2023.
Edited by:
Qingpeng Yang, Chinese Academy of Sciences (CAS), ChinaReviewed by:
Liuyang Yu, Northwest A & F University, ChinaPengfei Wu, Fujian Agriculture and Forestry University, China
Fengxia Zhao, Shanxi Normal University, China
Copyright © 2023 Li, He, Chang, Ma, Yu, Liu, Zhang and Hao. This is an open-access article distributed under the terms of the Creative Commons Attribution License (CC BY). The use, distribution or reproduction in other forums is permitted, provided the original author(s) and the copyright owner(s) are credited and that the original publication in this journal is cited, in accordance with accepted academic practice. No use, distribution or reproduction is permitted which does not comply with these terms.
*Correspondence: Lihua Hao, aGFvbGlodWFfMDAwQHNpbmEuY29t; Yunxin Zhang, enl4MTQzMTVAMTYzLmNvbQ==
†These authors have contributed equally to this work
 Fei Li
 Chunlin He2†
 Jingjin Yu
 Lihua Hao