Abstract
Soybean (Glycine max) productivity is significantly reduced by drought stress. Breeders are aiming to improve soybean grain yields both under well-watered (WW) and drought-stressed (DS) conditions, however, little is known about the genetic architecture of yield-related traits. Here, a panel of 188 soybean germplasm was used in a genome wide association study (GWAS) to identify single nucleotide polymorphism (SNP) markers linked to yield-related traits including pod number per plant (PN), biomass per plant (BM) and seed weight per plant (SW). The SLAF-seq genotyping was conducted on the population and three phenotype traits were examined in WW and DS conditions in four environments. Based on best linear unbiased prediction (BLUP) data and individual environmental analyses, 39 SNPs were significantly associated with three soybean traits under two conditions, which were tagged to 26 genomic regions by linkage disequilibrium (LD) analysis. Of these, six QTLs qPN-WW19.1, qPN-DS8.8, qBM-WW1, qBM-DS17.4, qSW-WW4 and qSW-DS8 were identified controlling PN, BM and SW of soybean. There were larger proportions of favorable haplotypes for locus qPN-WW19.1 and qSW-WW4 rather than qBM-WW1, qBM-DS17.4, qPN-DS8.8 and qSW-DS8 in both landraces and improved cultivars. In addition, several putative candidate genes such as Glyma.19G211300, Glyma.17G057100 and Glyma.04G124800, encoding E3 ubiquitin-protein ligase BAH1, WRKY transcription factor 11 and protein zinc induced facilitator-like 1, respectively, were predicted. We propose that the further exploration of these locus will facilitate accelerating breeding for high-yield soybean cultivars.
1 Introduction
Soybean (Glycine max) is known as the main source of plant oil and protein in the world (Cerezini et al., 2016). However, the sustainability of soybean production is threatened by persistent droughts with the climatic changes (Chen et al., 2016). Field and greenhouse experiments have shown significant reduction of 24-50% in soybean grain yield by drought stress (Frederick et al., 2001). Reduction of grain yield is maximal while water deficiency happens during flowering and podding stage, which is due to decreases in pod number per plant (PN), biomass per plant (BM) and seed weight per plant (SW) in soybean. Due to carbohydrate deprivation, drought-induced lower photosynthetic capacity increased pod abortion and decreased dry matter production after anthesis (Liu et al., 2004). Thus, Breeding for new soybean cultivars with high SW as well as PN and BM both under well-watered and drought-stressed conditions is therefore an important strategy for addressing this imminent threat to food security.
Selecting genotypes with better genetic gains in soybean can improve the efficiency of cultivar development programs based on genomic information of these yield-related traits (Yoosefzadeh Najafabadi, 2021). The traditional QTL linkage mapping of pod number per plant (PN) (Sun et al., 2022), biomass per plant (BM) (Yang, 2021), and seed weight per plant (SW) (Hacisalihoglu et al., 2018) in soybean, has made some progress, but there are certain limitations, such as the limited allelic variation in biparental segregation populations, time consumption for mapping population construction, and limited mapping resolution (Sehgal et al., 2016). In contrast to linkage mapping, GWAS exploits ancestral recombination events in a population, thus providing higher allelic diversity at the loci, resulting in a better association between the marker and the target trait (Kaler et al., 2020).
The application of GWAS to complex quantitative traits of model organisms and crops has increased over the past few years (Atwell et al., 2010; Chen et al., 2014). In soybean, GWAS has successfully identified many high-precision loci associated with yield-related traits. For example, twenty significant SNPs associated with PN have been identified from 211 germplasm by GWAS, and three stable QTL regions were on chromosomes 4, 18 and 20 (Bhat et al., 2022). Wang et al. (2023) used a diverse panel, including 121 wild soybeans, 207 landraces, and 231 improved cultivars to perform GWAS on BM and identified ten important loci, encompassing 47 putative candidate genes. Ayalew et al. (2022) evaluated a germplasm population composed of 541 genotypes and detected 19 QTLs associated with SW by GWAS, of which two stable QTLs on chromosomes 9 and 17 were consistently detected in at least three environments. A large number yield-related loci have been identified, but the genetic basis for production formation regulation has not been fully understood as the complexity of its genetic mechanism, especially under DS conditions.
In this study, we evaluated 188 diverse soybean genotypes under WW and DS conditions across four environments for three yield-related traits, including PN, BM and SW. Furthermore, we used the GWAS approach to analyze genetic loci and key candidate genes related to these traits under WW and DS conditions, which could provide theoretical support for improved yield performance under WW and DS conditions.
2 Materials and methods
2.1 Plant materials and growth conditions
There are 188 diverse genotypes of soybean used in the current GWAS study; which include 95 and 48 genotypes originating from Northeast soybean ecological region and Huanghuaihai region in China, respectively, and 45 genotypes from the United States, Korean, Japan, Russia, etc (Table 1). Of thses, 49 germplasm were landrace, and 139 were improved cultivars. These soybean germplasm were evaluated under WW and DS conditions by both field trials and pot-culture experiments.
Table 1
| Geographical source | Landrace | Improved cultivar | Total | |
|---|---|---|---|---|
| Northeast, China | Heilongjiang | 9 | 21 | 30 |
| Jilin | 13 | 15 | 28 | |
| Liaoning | 9 | 25 | 34 | |
| InnerMongolia | 1 | 5 | 6 | |
| Huang-Huai-Hai, China | Beijing | 0 | 8 | 8 |
| Hebei | 8 | 6 | 14 | |
| Shandong | 2 | 3 | 5 | |
| Shanxi | 3 | 4 | 7 | |
| Henan | 1 | 3 | 4 | |
| Anhui | 0 | 1 | 1 | |
| Jiangsu | 3 | 3 | 6 | |
| Other country | Korea | 0 | 2 | 2 |
| Japan | 0 | 3 | 3 | |
| Russia | 0 | 2 | 2 | |
| France | 0 | 2 | 2 | |
| Italy | 0 | 1 | 1 | |
| Switzerland | 0 | 1 | 1 | |
| Ukraine | 0 | 1 | 1 | |
| US | 0 | 33 | 33 | |
| Total | 49 | 139 | 188 | |
Geographical source of 188 soybean germplasm in this study.
Field trials were conducted at Fuxin (121.73788E, 42.13649N) in Liaoning Province, China, in 2018 and 2019 cropping seasons (hereafter referred as FX2018 and FX2019). The climate of this site is a typical semi-arid continental climate with an annual temperature and rainfall of 7.7°C and 450-550 mm, respectively. Three replicates were performed under WW and DS conditions in a randomized block design. Each plot consisted of two rows, 0.6 m apart that were 2 m in length, and the planting density was 165,000 plants per ha. The water supply of WW condition was delivered by drip irrigation, while that of DS treatment was delivered by natural precipitation.
The pot-culture experiments were conducted under open field conditions at Liaoning Academy of Agricultural Sciences, Shenyang (123.56265E, 41.83179N), Liaoning Province, China, in 2020 and 2021 cropping seasons (hereafter referred as SY2020 and SY2021). Soybean seeds were planted in plastic pots (30 cm × 30 cm × 25 cm) with 16.0 kg soil. In a randomized block design, three replications (pots) contained three plants each. The DS treatment was carried out throughout the flowering and podding periods of soybean. Soil moisture content was maintained at 80% of the field’s capacity to hold water under WW conditions, whereas it was 60% under water stress conditions. We measured the soil water content every three days and replenished it as needed.
2.2 Phenotypic evaluations and descriptive statistics
Data of three yield-related traits were collected at maturity (R8). In field trials (FX2018 and FX2019), a random sample of 10 plants from each plot were used to determine the yield-related traits, including pod number per plant (PN), biomass per plant (BM) and seed weight per plant (SW). In pot-culture experiments (SY2020 and SY2021), three plants of each pot were used to measure the above traits.
Phenotypic values under WW and DS conditions in the FX2018, FX2019, SY2020 and SY2021 environments were used for analysis. An ANOVA table was used to calculate each trait’s broad-sense heritability (Zhao et al., 2020). The best linear unbiased prediction (BLUP) for each phenotypic value across all environments was calculated using the lmer function in the R package lme4 (http://www.R-project.org/) to reduce environmental variation (Bates et al., 2012). R version 3.5.1 was used to determine Pearson’s correlation coefficients (r) for WW and DS conditions separately.
2.3 Genotyping of soybean germplasm
Using a modified CTAB method, DNA from leaves of about 60 d after germination was extracted (Saghai Maroof et al., 1984). SLAF-seq technology (Sun et al., 2013) was used to generate molecular markers in 188 soybean germplasm samples. Our restriction enzymes of choice were RsaI and HaeIII (NEB, Ipswich, MA, United States) (http://phytozome.jgi.doe.gov/pz/portal.html). Adenine was added to the 3’ end of the digested fragments, and the Dual-index was used to distinguish raw sequencing data from digested fragments (Kozich et al., 2013). We obtained SLAF tags by digestion of each soybean germplasm, fragment ligation, PCR amplification, and selection of target fragments for SLAF libraries (Sun et al., 2013). Following quality certification, SLAF-seq using the Illumina HiSeqTM 2500 platform (Illumina, Inc., San Diego, CA, United States) was performed. SLAF libraries were evaluated by comparison them with rice (Oryza sativa L. ssp. japonica cv. Nipponbare) libraries (http://rice.plantbiology.msu.edu/), which were constructed and sequenced using the same procedures.
In order to ensure the quality of the bioinformatics analysis, a standard protocol was followed in the grouping and genotyping of SLAF-seq data. We compared the filtered sequencing reads with the reference genome using the BWA software (http://bio-bwa.sourceforge.net/) (Li, 2013). In order to classify SLAF makers into polymorphic, non-polymorphic, and repetitive categories, allele frequencies and gene sequence differences were taken into account. SLAF tags were used to identify polymorphic SNP loci mostly using GATK (McKenna et al., 2010). In addition, to ensure the reliability of SNPs identified using GATK, SAMtools also was used to detect SNPs with reference to Li et al. (2009). SNPs that are reliable for further analysis have been identified by both GATK and SAMtools. SNPs with minor allele frequencies (MAF) > 0.05 and marker integrity frequencies > 80% (Zhou et al., 2017) were selected for further analysis.
2.4 Population structure, clustering and linkage disequilibrium analysis
Admixture software was used to generate admixture ratios for K values 1-10 by analyzing population structure 1000 times. Using the valley value of cross-validation error rates, the optimal number of subgroups was determined according to cluster results (Fu and Perry, 2020). Taxonomic and evolutionary relationships between 188 genotypes were assessed using 67,929 SNP markers through phylogenetic analyses. On the basis of the distance matrix, the distance between the materials was calculated using SNP markers from the population. The phylogenetic tree was then constructed using Tree Best (v1.9.2) using the neighbor-joining (NJ) method (Vilella et al., 2009). PopLDdecay software (Zhang et al., 2019) was used to analyze LD for SNPs within a 1 Mb window.
2.5 Genome-wide association studies
A general linear model (GLM) was used for each SNP and trait to test for association between them using TASSEL 5.0. The GLM is based on P + Q matrices, where P is the phenotype matrix and Q is the population structure matrix. The statistical model for the GLM is: y = Xb + e. In this case, y is the data of individual environment or adjusted BLUPs for each trait, X is the known design matrix, b is the fixed effects vector, and e is the random residues vector. A 1000-permutation test was run for the GLM analyses. The Bonferroni-corrected threshold for the p-value was 0.05/67 929 (p=α/n, α=0.05). For simplicity, p<7.36E-07 was used as the threshold value. Manhattan plots were used to visualize significant markers, and quantile-quantile (Q-Q) plots to show important p-value distributions (expected versus observed p-values on a -log10).
2.6 Candidate gene analysis
Based on the GWAS results, pairwise linkage disequilibrium measures were calculated between SNPs in the genomic regions containing significant SNPs. A QTL interval was defined as one where the squared allele frequency correlation between markers was higher than 0.4. We scanned the genome regions in Soybase (www.soybase.org) to identify genes underlying QTLs of interest.
3 Results
3.1 Phenotypic traits evaluation
Three yield-related traits of 188 diverse soybean germplasm was determined under WW and DS conditions in four environments (FX2018, FX2019, SY2020 and SY2021) and the BLUP data for these traits was calculated. The PN, BM and SW under WW and DS conditions exhibited normal distribution, which was basically the same in the four environments as well as the BLUP data (Figure 1). Under WW and DS conditions, as expected, there was significant positive correlations among these yield-related traits. Table 2 shows that PN, BM, and SW had extensive phenotypic variation in soybean germplasm across all four environments. By using BLUP data, the variation ranges of PN, BM and SW under WW condition (hereafter referred as PN-WW, BM-WW and SW-WW) were 21.12-134.52, 22.90-93.08 g, and 2.67-41.08 g, respectively, while those under DS condition (hereafter referred as PN-DS, BM-DS and SW-DS) were 8.66-92.89, 10.93-81.97 g, and 1.18-31.00 g, respectively. The analysis of variance revealed highly significant differences in genotype, environment, and genotype-environment interactions for three yield-related traits. Apart from SW-DS, the effect of environment was larger than that of genotype for these traits. It appears that these yield-related traits are quantitative traits controlled by multiple genes and easily influenced by environment. The heritability of PN, BM and SW under WW condition was 88%, 86%, and 76%, respectively, while that under DS condition was 88%, 95%, and 85%, respectively.
Figure 1
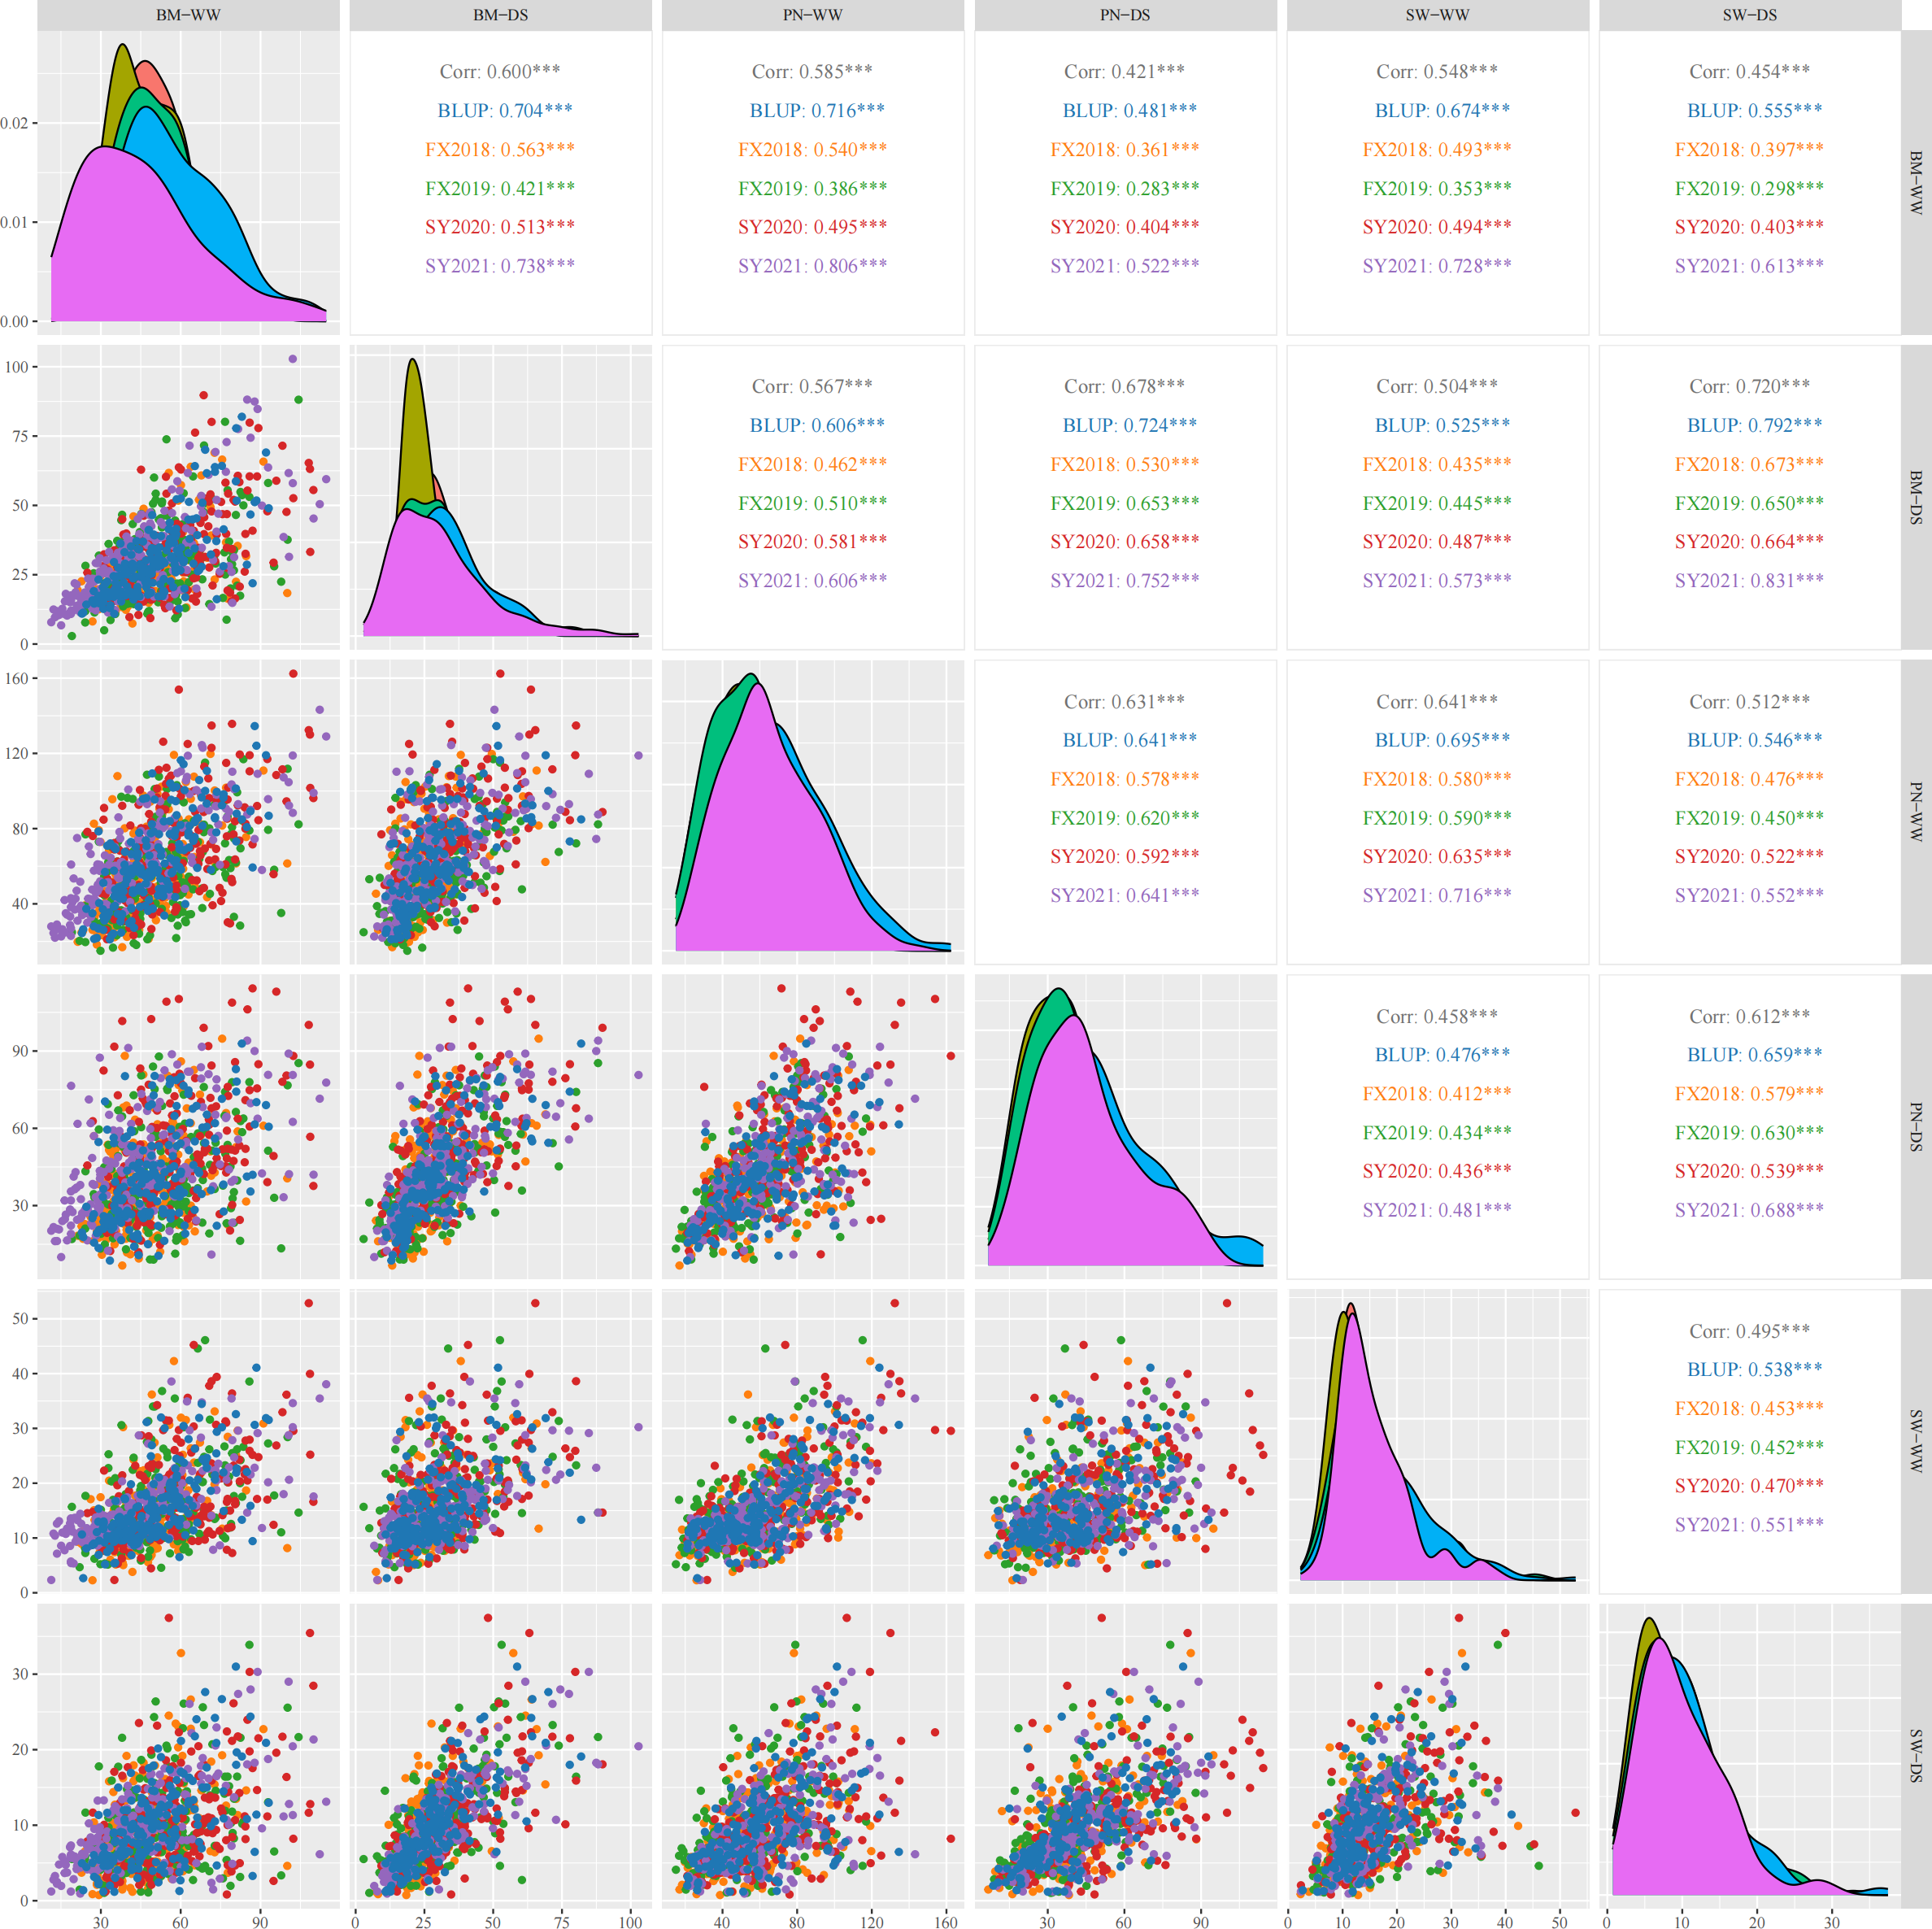
Pearson’s correlation coefficients describing associations of three yield-related traits evaluated under well-watered (WW) and drought-stressed (DS) conditions in four environments and best linear unbiased prediction (BLUP) data. PN, pod number per plant; BM, biomass per plant; SW, seed weight per plant. The diagonal line illustrates the distribution of six trait-treatments. The scatter plot is displayed below the diagonal line. Above the diagonal line are the correlation coefficient and significant deference. *** represents significant difference at p<0.001.
Table 2
| Environment | PN (/plant) | BM (g/plant) | SW (g/plant) | ||||
|---|---|---|---|---|---|---|---|
| WW | DS | WW | DS | WW | DS | ||
| FX2018 | Mean | 57.54 | 38.29 | 47.90 | 25.59 | 14.04 | 9.07 |
| Std | 23.14 | 17.39 | 15.06 | 10.90 | 6.69 | 5.45 | |
| CV(%) | 40.21 | 45.41 | 31.44 | 42.60 | 47.63 | 60.06 | |
| Min | 16.95 | 6.74 | 18.55 | 6.51 | 2.28 | 0.76 | |
| Max | 119.72 | 94.80 | 113.06 | 75.18 | 42.29 | 32.79 | |
| H2 | 0.95 | 0.98 | 0.90 | 0.95 | 0.98 | 0.97 | |
| FX2019 | Mean | 56.35 | 39.32 | 52.93 | 29.75 | 16.23 | 9.87 |
| Std | 22.65 | 17.51 | 17.44 | 14.59 | 7.61 | 5.87 | |
| CV(%) | 40.19 | 44.54 | 32.95 | 49.05 | 46.87 | 59.47 | |
| Min | 15.05 | 9.03 | 17.84 | 2.48 | 4.57 | 1.04 | |
| Max | 116.91 | 87.87 | 109.52 | 96.05 | 46.10 | 33.88 | |
| H2 | 0.95 | 0.96 | 0.90 | 0.97 | 0.95 | 0.96 | |
| SY2020 | Mean | 70.69 | 50.68 | 58.42 | 33.79 | 17.68 | 10.70 |
| Std | 27.81 | 22.79 | 19.24 | 15.97 | 8.34 | 6.24 | |
| CV(%) | 39.34 | 44.96 | 32.94 | 47.26 | 47.19 | 58.32 | |
| Min | 21.17 | 11.09 | 22.70 | 8.36 | 2.34 | 0.83 | |
| Max | 162.39 | 114.31 | 119.76 | 98.71 | 52.86 | 37.45 | |
| H2 | 0.96 | 0.96 | 0.91 | 0.97 | 0.97 | 0.97 | |
| SY2021 | Mean | 65.48 | 45.64 | 45.79 | 31.06 | 15.71 | 10.02 |
| Std | 24.73 | 19.67 | 23.25 | 17.53 | 6.61 | 5.64 | |
| CV(%) | 37.77 | 43.09 | 50.78 | 56.43 | 42.07 | 56.27 | |
| Min | 22.00 | 10.03 | 9.43 | 6.62 | 2.34 | 0.95 | |
| Max | 143.20 | 94.05 | 127.29 | 106.95 | 38.57 | 30.29 | |
| H2 | 0.95 | 0.95 | 0.96 | 0.97 | 0.95 | 0.97 | |
| BLUP | Mean | 62.31 | 41.48 | 50.58 | 29.65 | 15.43 | 9.93 |
| Std | 23.71 | 17.94 | 14.93 | 13.16 | 6.61 | 5.49 | |
| CV(%) | 38.06 | 43.24 | 29.52 | 44.39 | 42.84 | 55.33 | |
| Min | 21.12 | 8.66 | 22.90 | 10.93 | 2.67 | 1.18 | |
| Max | 134.52 | 92.89 | 93.08 | 81.97 | 41.08 | 31.00 | |
| H2 | 0.88 | 0.88 | 0.86 | 0.95 | 0.76 | 0.85 | |
| F value | G | 228.24*** | 294.50*** | 104.63*** | 306.06*** | 258.93*** | 338.82*** |
| E | 874.98*** | 1327.10*** | 659.85*** | 914.71*** | 614.78*** | 236.91*** | |
| G × E | 5.82*** | 7.91*** | 16.43*** | 17.67*** | 18.05*** | 13.17*** | |
Descriptive statistics and variance parameters estimated for three traits studied on 188 soybean germplasms under well-watered (WW) and drought-stressed (DS) conditions in four environments and BLUP data.
BLUP, best linear unbiased prediction; PN, pod number per plant; BM, biomass per plant; SW, seed weight per plant; G, genotype; E, environment; G×E genotype×environment; H2, broad-sense heritability. *** represents significant difference at p<0.001.
3.2 Population structure and linkage disequilibrium
Seven subgroups were identified based on the cross-validation error rate and K-values for the 188 genotypes in the Admixture analysis (Figures 2A, B). Further analysis of genetic differentiation was conducted using NJ-based clustering for samples from Northeast and Huang-Huai-Hai regions in China as well as other countries (Figure 2C). According to the phylogenetic tree, there are seven main clusters; each of these groups corresponded to a major subgroup of the Admixture analysis, which supports dividing the population into seven major groups. Further marker-trait association mapping was performed using the Q matrix at K=7. In addition, 188 soybean accessions were assessed for genome-wide LD using a subset of high-quality markers. At a threshold of r2 = 0.3, the average decay distance of LD was 178.7 kb for all 188 soybean accessions (Figure 2D).
Figure 2
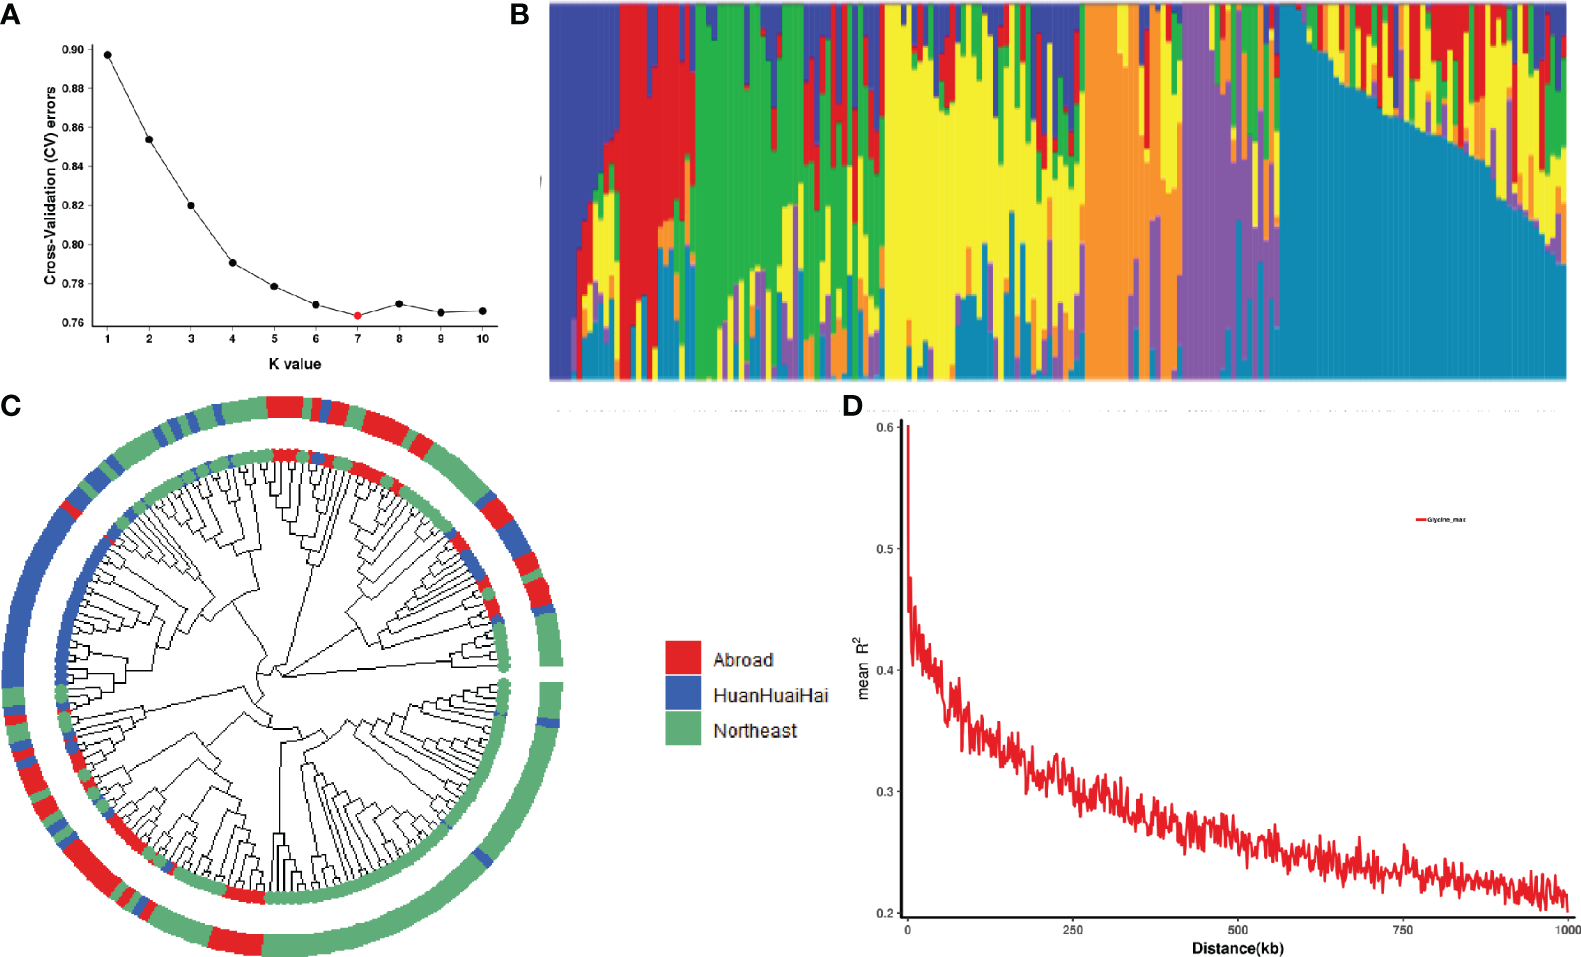
Population structure and linkage disequilibrium (LD) analysis of 188 soybean germplasm. (A) Cross validation error rate for 188 samples based on clustering from 1 to 10; X-axis is K-value 1-10, Y-axis is cross-validation error rate. (B) Colors represent separate groups in clustering analysis when there are seven subgroups. (C) Phylogenetic tree of 188 soybean germplasm. Red represents the soybean germplasm from Northeast region, China; Blue represents the soybean germplasm from Huanghuaihai region, China; Green represents the soybean germplasm from other countries. (D) A plot of genome-wide LD decay for all 188 soybean germplasm. R2 indicates the squared allele frequency correlation between each pair of SNP markers. On the X-axis is the distance between each pair of markers.
3.3 GWAS identified significant SNPs associated with yield-related traits
Using a threshold of 7.36E-07, 122 SNPs were significantly associated with PN-WW, BM-WW, SW-WW, PN-DS, BM-DS and SW-DS in the individual environment, which included 40 SNPs in FX2018, 13 SNPs in FX2019, 41 SNPs in SY2020, and 28 SNPs in SY2021 (Supplementary Table S1). By using the BLUP data, a total of 41 SNPs were significantly associated with these traits, as evidenced by the Manhattan and quantile-quantile plots (Q-Q) (Figure 3). For the PN, six significant SNP loci were detected on chromosome 4 and 19 under WW condition, and 12 significant SNP loci were detected on chromosome 8 under DS condition (Figure 3A), which explained about 11-18% of the phenotypic variation (Supplementary Table S1). For the BM, eight significant SNP loci were detected on chromosome 1, 3, 8 and 15 under WW condition, and seven significant SNP loci were detected on chromosome 17 and 18 under DS condition (Figure 3B), which explained about 11-16% of the phenotypic variation (Supplementary Table S1). For the SW, five significant SNP loci were detected on chromosome 1, 4 and 20 under WW condition, and three significant SNP loci were detected on chromosome 8 under DS condition (Figure 3C), which explained about 13-17% of the phenotypic variation (Supplementary Table S1).
Figure 3
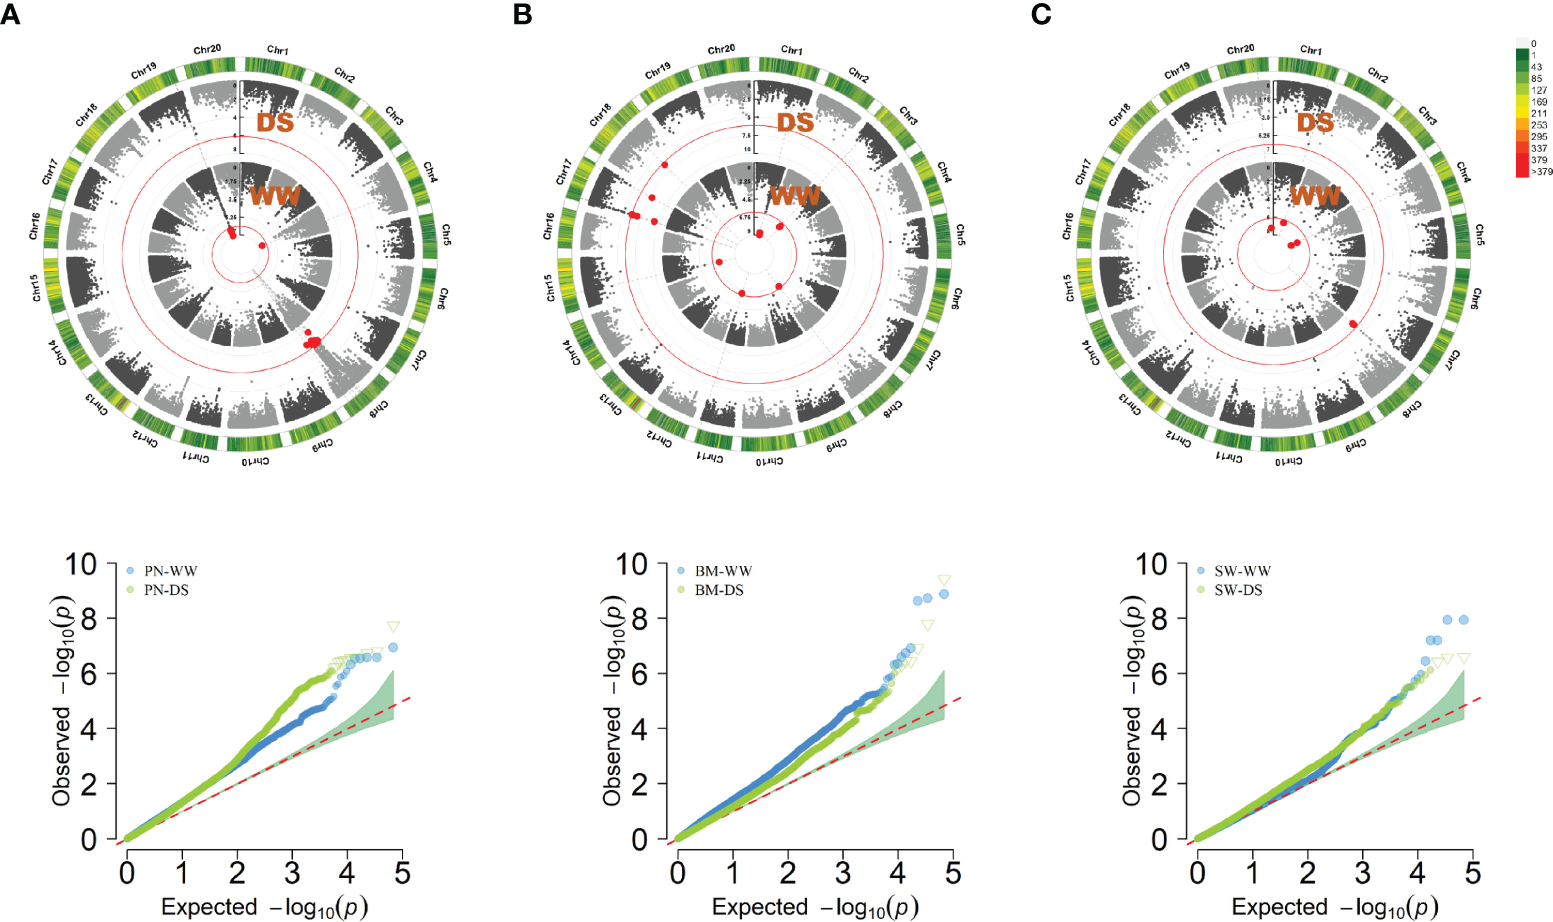
Circular manhattan plot and QQ plot for the best linear unbiased prediction (BLUP) values of pod number per plant (PN) (A), biomass per plant (BM) (B), and seed weight per plant (SW) (C), under well-watered (WW) and drought-stressed (DS) conditions, respectively. The p-values at the significance thresholds of 7.36E-07.
3.4 Haplotype analysis in landraces and improved cultivars
In total, 39 significant SNPs were detected simultaneously in the BLUP model and in at least one environment (Supplementary Table S1), which were further used to limit QTL intervals related to the target trait. In the genomic regions of these significant SNPs, the LD blocks were determined. Only 26 QTLs were identified for all 39 significant SNPs, distributed on chromosomes 1, 3, 4, 8, 15, 17, 18, 19, and 20 (Table 2). Of these, six QTL qPN-WW19.1, qPN-DS8.8, qBM-WW1, qBM-DS17.4, qSW-WW4 and qSW-DS8 had at least three significant SNP loci with significant genetic correlation and close genetic relationship. During subsequent haplotype analysis, two or three distinct haplotypes for each QTL were revealed.
QTL qPN-WW19.1 and qPN-DS8.8 that controlled the PN under WW and DS conditions, were detected in approximate interval of 245-kb and 495-kb on chromosome 19 and 8, respectively (Figure 4). For qPN-WW19.1, 91% of landraces and 81% of improved cultivars possessed Hap2, which had greater PN than Hap1 under WW condition.
Figure 4
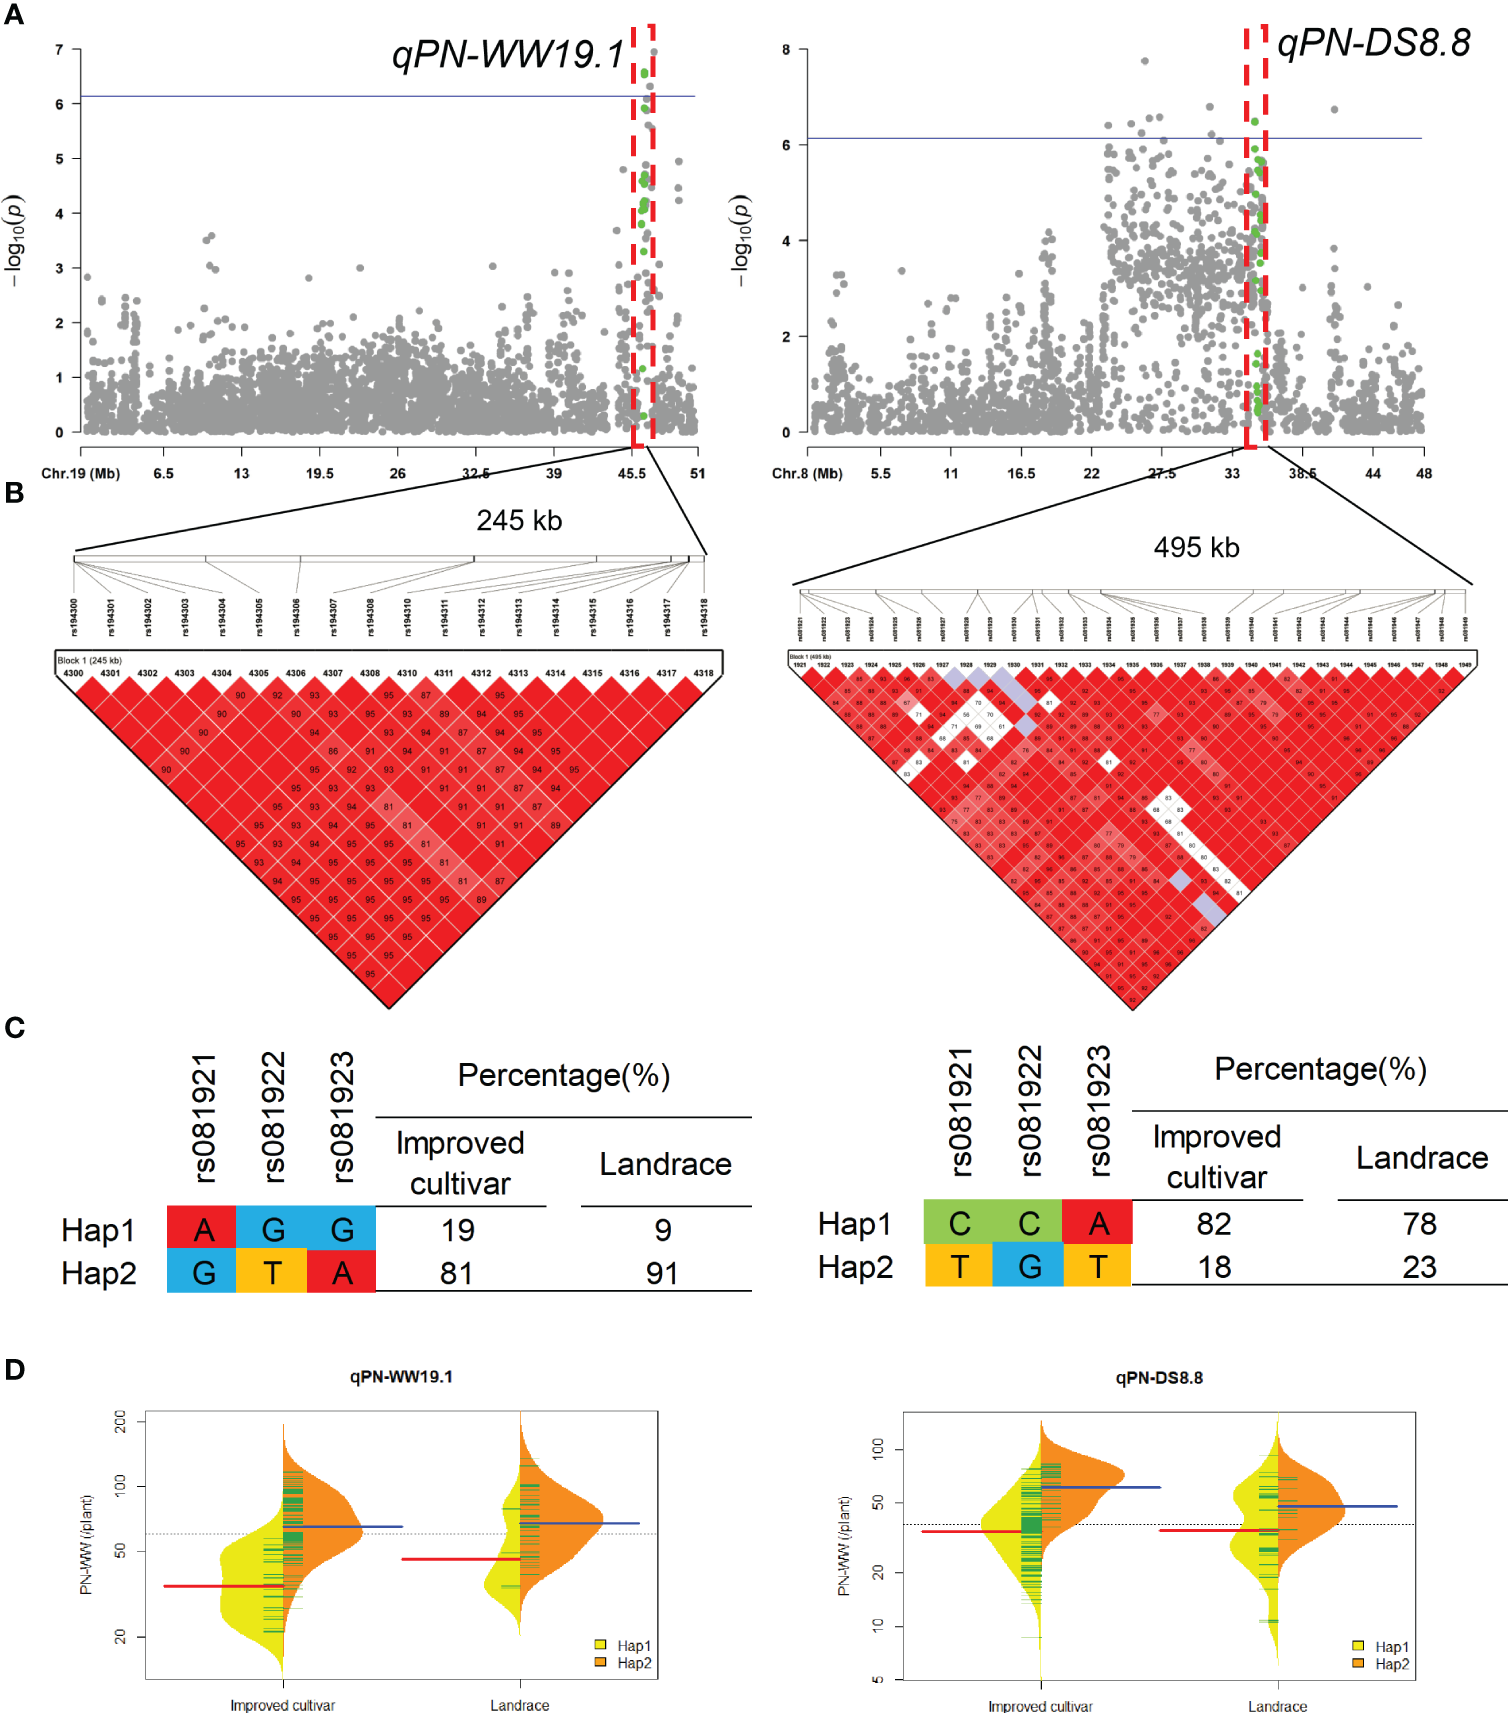
Genome-wide association study results for pod number per plant (PN) under well-watered (WW) and drought-stressed (DS) conditions and the analysis of the QTLs qPN-WW19.1 and qPN-DS8.8. (A) Manhattan plots for PN under WW and DS conditions. Using the horizontal line as a threshold, the arrows indicate the location of the main peaks. (B) Locations of four SNP loci on chromosomes 19 and 8 and their LD based on paired R2 values. (C) 188 soybean germplasm were genotyped by significant SNPs to detect haplotypes. (D) Haplotype differences in PN.
Two QTL qBM-WW1 and qBM-DS17.4 that controlled the BM under WW and DS conditions, were detected in approximate 184-kb interval on chromosomes 1 and 28-kb interval on chromosomes 17, respectively (Figure 5). For qBM-WW1, only 28% of landraces and 31% of improved cultivars were included Hap2, which had larger BM than Hap1 under WW condition. For qBM-DS17.4, only 6% of landraces and 10% of improved cultivars were included Hap3, which had larger BM than Hap1 and Hap2 under DS condition.
Figure 5
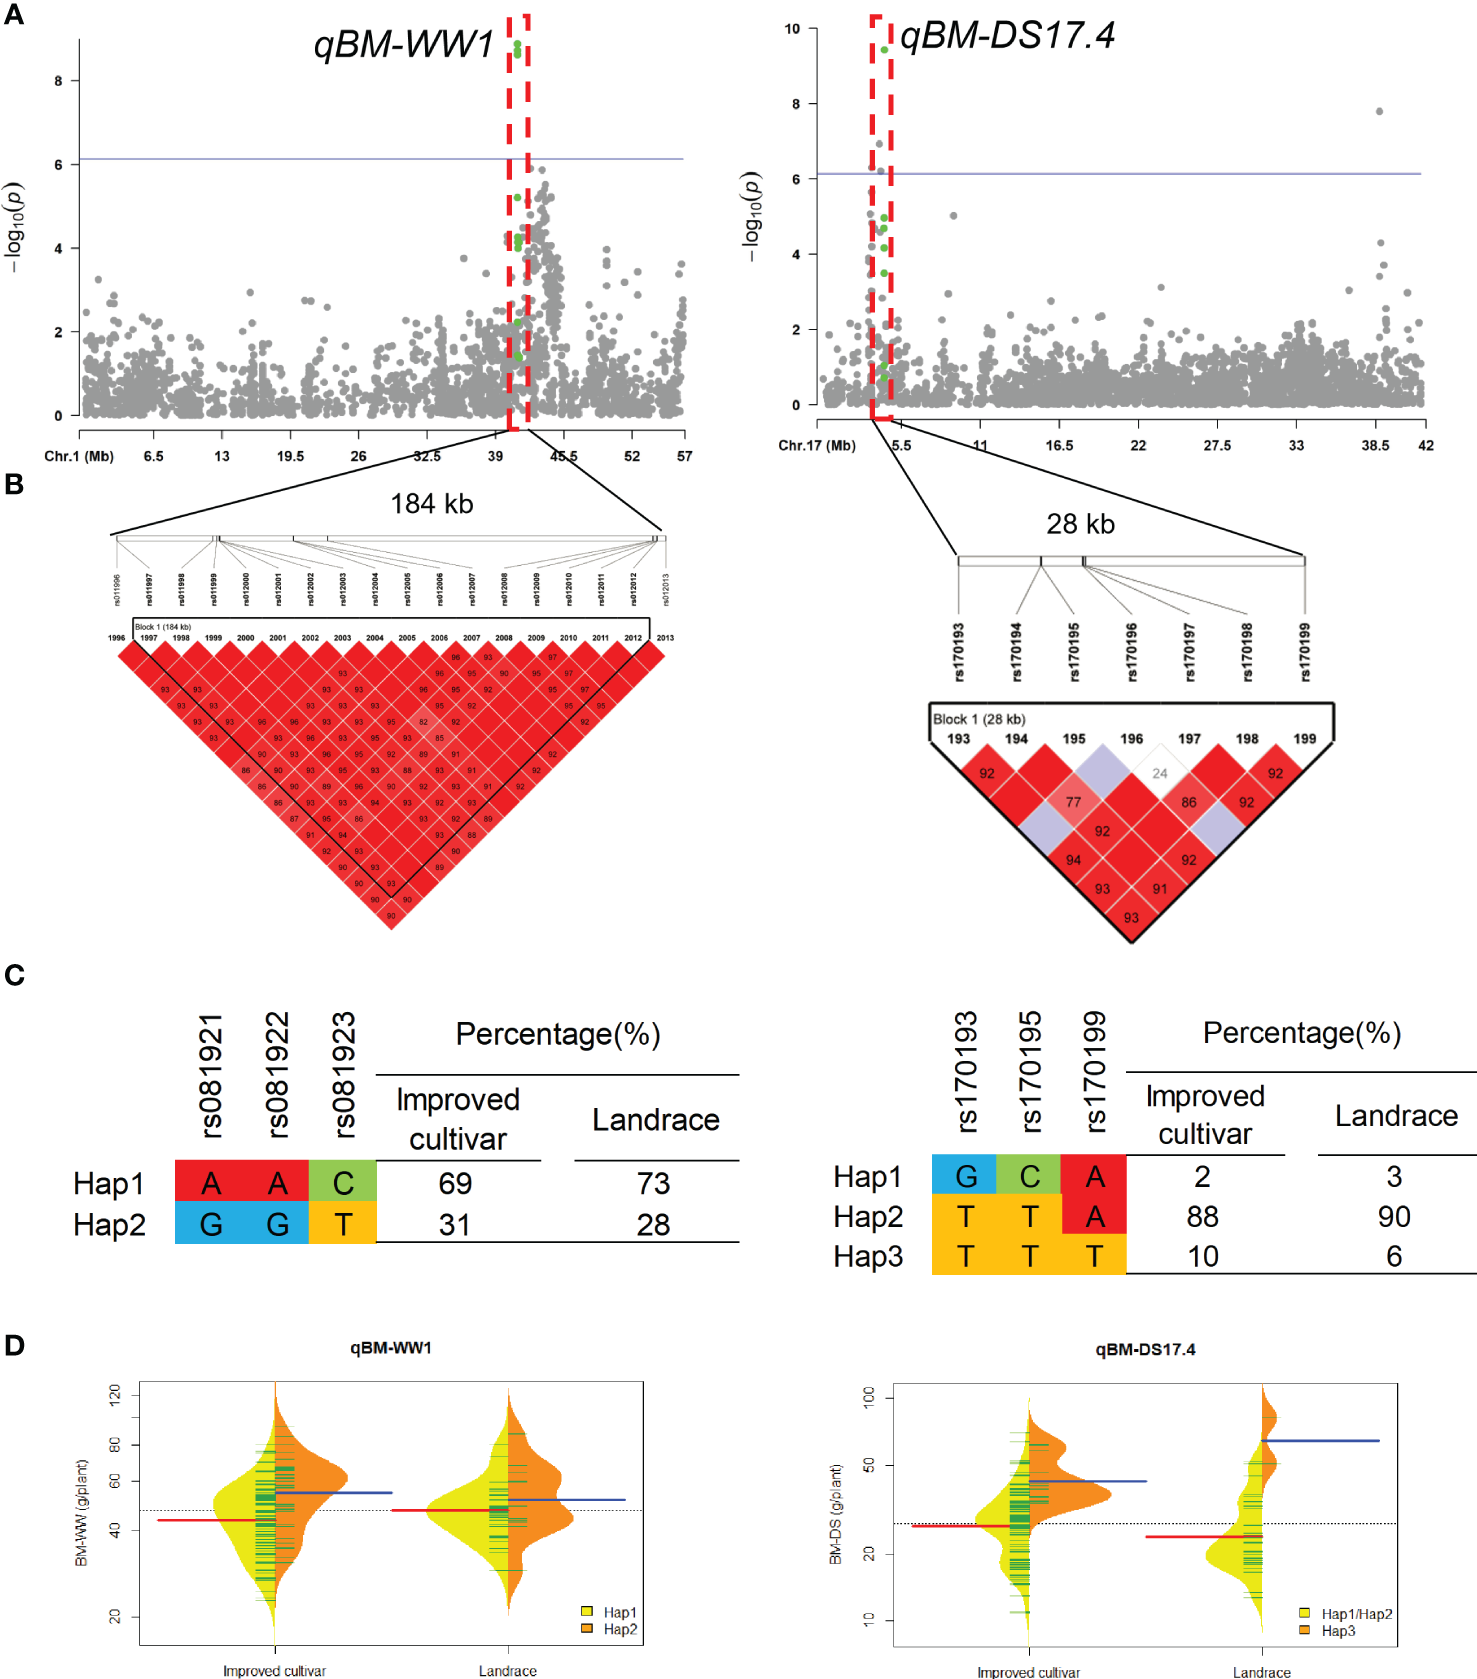
Genome-wide association study results for biomass per plant (BM) under well-watered (WW) and drought-stressed (DS) conditions and the analysis of the QTLs qBM-WW1 and qBM-DS17.4. (A) Manhattan plots for BM under WW and DS conditions. Using the horizontal line as a threshold, the arrows indicate the location of the main peaks. (B) Locations of four SNP loci on chromosomes 1 and 17 and their LD based on paired R2 values. (C) 188 soybean germplasm were genotyped by significant SNPs to detect haplotypes. (D) Haplotype differences in BM.
Two QTL qSW-WW4 and qSW-DS8 that controlled the SW under WW and DS conditons, were detected in approximate 212-kb interval on chromosomes 4 and 12-kb interval on chromosomes 8, respectively (Figure 6). For qSW-WW4, 93% of landraces and 96% of improved cultivars were included Hap2 and Hap3, which had higher SW than Hap1 under WW condition. For qSW-DS8, 3% of landraces and 13% of improved cultivars were included Hap2, which had higher SW than Hap1 under DS condition.
Figure 6
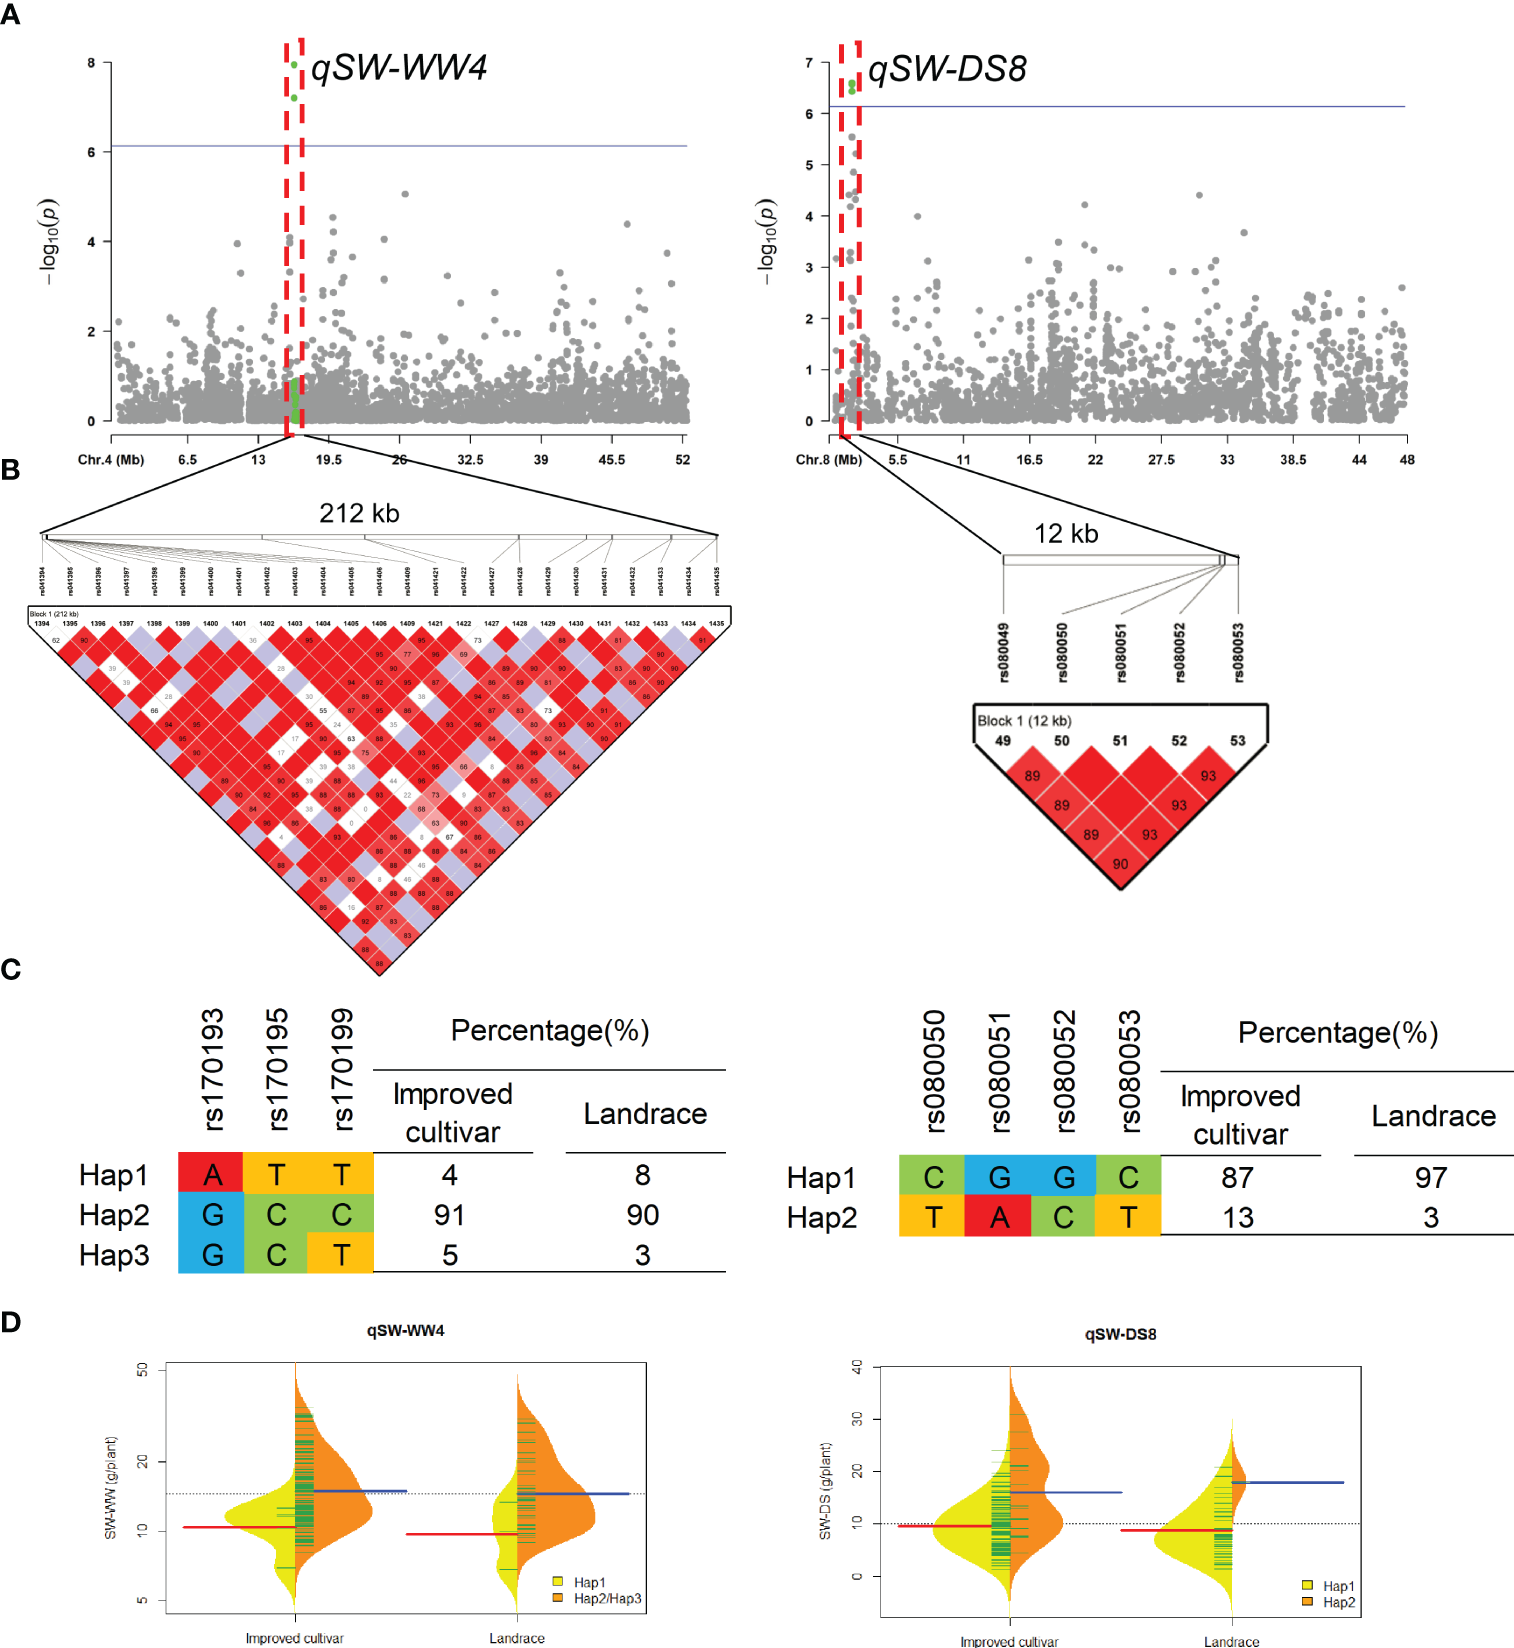
Genome-wide association study results for seed weight per plant (SW) under well-watered (WW) and drought-stressed (DS) conditions and the analysis of the QTLs qSW-WW4 and qSW-DS8. (A) Manhattan plots for SW under WW and DS conditions. Using the horizontal line as a threshold, the arrows indicate the location of the main peaks. (B) Locations of four SNP loci on chromosomes 4 and 8 and their LD based on paired R2 values. (C) 188 soybean germplasm were genotyped by significant SNPs to detect haplotypes. (D) Haplotype differences in SW.
3.5 Candidate gene analysis in QTL regions
Using the Glycine max reference genome database (https://www.soybase.org/), we searched for genes associated with yield-related traits and drought tolerance in QTL regions detected under WW and DS conditions, respectively (Table 3). In QTL regions of qSW-WW1, qPN-DS8.3 and qPN-DS8.5, no gene has been found. A total of 208 genes were identified in the 23 remaining QTL regions, and the number of genes varied from 1 to 37 in each QTL region. In this analysis, the number of candidate genes was reduced to 22 genes using annotations based on functional annotations.
Table 3
| Trait | QTL name | Significant SNP | Chr | QTL position | No. of genes |
Candidate gene ID |
Gene annotation |
|---|---|---|---|---|---|---|---|
| PN-WW | qPN-WW4 | rs042851 | 4 | 32575507-32592587 | 0 | NA | NA |
| qPN-WW19.1 | rs194311,rs194316,rs194317 | 19 | 46284103-46530081 | 37 | Glyma.19G210900 | E3 ubiquitin-protein ligase BAH1 | |
| qPN-WW19.2 | rs194339 | 19 | 46792316-47006486 | 25 | Glyma.19G217000 | WRKY transcription factor 35 | |
| qPN-WW19.3 | rs194352 | 19 | 47278155-47341447 | 9 | Glyma.19G221600 | Polygalacturonase | |
| BM-WW | qBM-WW1 | rs012000,rs012001,rs012002 | 1 | 41066040-41250284 | 5 | Glyma.01G119500 | AMP deaminase |
| qBM-WW3 | rs030672,rs030673 | 3 | 6246003-6246085 | 1 | Glyma.03G048500 | Disease resistance protein | |
| qBM-WW15 | rs151122 | 15 | 17027720-17203787 | 9 | Glyma.15G178700 | Eukaryotic translation initiation factor 3 | |
| SW-WW | qSW-WW1 | rs012795 | 1 | 51274755 | NA | NA | |
| qSW-WW4 | rs041398,rs041399,rs041401 | 4 | 16307361-16520021 | 8 | Glyma.04G124800 | Protein ZINC INDUCED FACILITATOR-LIKE 1 | |
| qSW-WW20 | rs202237 | 20 | 37043984-37047052 | 1 | Glyma.20G129100 | Protein TIC 21 | |
| PN-DS | qPN-DS8.1 | rs081307 | 8 | 23302580-23778598 | 17 | Glyma.08G258800 | Aspartic proteinase-like protein 2 |
| qPN-DS8.2 | rs081390 | 8 | 24998891-25197286 | 3 | Glyma.08G261200 | Homocysteine S-methyltransferase 1 | |
| qPN-DS8.3 | rs081420 | 8 | 25808374-26012431 | 0 | NA | NA | |
| qPN-DS8.4 | rs081438 | 8 | 26079563-26228773 | 1 | Glyma.08G261700 | NA | |
| qPN-DS8.5 | rs081461,rs081462 | 8 | 26498358-26498365 | 0 | NA | NA | |
| qPN-DS8.6 | rs081509 | 8 | 27277729-27586943 | 1 | Glyma.08G262500 | U-box domain-containing protein 14 | |
| qPN-DS8.7 | rs081715,rs081722 | 8 | 30932153-31426811 | 3 | Glyma.08G265200 | Calcium-binding protein CML21 | |
| qPN-DS8.8 | rs081921,rs081922,rs081923 | 8 | 34768849-35264470 | 12 | Glyma.08G269800 | Floral homeotic protein APETALA 1 | |
| qPN-DS8.9 | rs082209 | 8 | 40748092-40990195 | 18 | Glyma.08G293300 | Transcription factor MYB1R1 | |
| BM-DS | qBM-DS17.1 | rs170162 | 17 | 3412747-3466772 | 1 | Glyma.17G045900 | Embryogenesis-associated protein EMB8 |
| qBM-DS17.2 | rs170177 | 17 | 3870840-4016954 | 19 | Glyma.17G052200 | UBP1-associated proteins 1C | |
| qBM-DS17.3 | rs170185 | 17 | 4029241-4068527 | 7 | Glyma.17G053500 | Casein kinase 1-like protein 1 | |
| qBM-DS17.4 | rs170193,rs170195,rs170199 | 17 | 4294571-4322918 | 20 | Glyma.17G057100 | WRKY transcription factor 11 | |
| qBM-DS17.5 | rs173557 | 17 | 38770868-38770949 | 1 | Glyma.17G232500 | RNA-binding protein 1 | |
| qBM-DS18 | rs184014,rs184015 | 18 | 37970702-38400499 | 8 | Glyma.18G164100 | 1-aminocyclopropane-1-carboxylate oxidase homolog 12 | |
| SW-DS | qSW-DS8 | rs080050,rs080051,rs080052,rs080053 | 8 | 1692570-1704747 | 2 | Glyma.08G020900 | Ethylene-responsive transcription factor CRF2 |
List of candidate genes located within the identified QTLs.
Under WW condition, there were three, three, and two candidate genes for PN, BM, and SW, respectively. A total of eight candidate genes were found to be involved in nucleotide transport and metabolism, transcription, carbohydrate transport and metabolism, and cell wall biogenesis. For three important QTL qPN-WW19.1, qBM-WW1 and qSW-WW4, the putative candidate genes were Glyma.19G211300, Glyma.01G119500 and Glyma.04G124800, which encoding E3 ubiquitin-protein ligase BAH1, AMP deaminase, and Protein Zinc induced facilitator-like 1, respectively.
In this study, due to their lack of detection under control conditions, the QTLs found under DS conditions were considered drought-responsive. Under DS condition, a total of seven, six and one candidate genes for PN, BM, and SW, respectively, obtained as putative ones for drought responsive in soybean. These 14 candidate genes were involved in transcription, signal transduction mechanisms, secondary metabolites biosynthesis, transport and catabolism, amino acid transport and metabolism, and cell cycle control. For three important QTL qPN-DS8.8, qBM-DS17.4 and qSW-DS8, the putative candidate genes were Glyma.08G269800, Glyma.17G057100 and Glyma.08G020900, which encoding floral homeotic protein APETALA 1, WRKY transcription factor 11, and ethylene-responsive transcription factor CRF2, respectively.
4 Discussion
Three yield-related traits of 188 soybean germplasm were analyzed under WW and DS conditions in four environments by the GWAS approach. We investigated the genetic basis of phenotypic differences in soybean yield traits, which can serve as a reference for improving soybean molecular breeding under normal as well as drought conditions.
4.1 Yield-related traits analysis
Several complex molecular, physiological, and morphological factors control the reduction in grain yield and yield-related traits under drought stress (Mohammadi, 2014; Kadam et al., 2018). During this experiment, the water deficit was adequate to assess the genotypes’ ability to cope with drought, since there was a strong reduction in productivity as well as variations in PN, BM and SW range among accessions. For GWAS analysis, we used BLUP values from four environments to eliminate environmental and locational differences. Both random genetic effects and fixed environments were considered simultaneously in BLUP. It is possible to improve the accuracy of BLUP value prediction by predicting values in different environments and among individuals with different genotypes (Piepho et al., 2008). There has been extensive use of this method in QTL mapping, genome-wide association analyses, and the selection of crops based on genome sequences (Wang et al., 2016). Using the BLUP data, large phenotypic variations for the PN, BM and SW can be observed in all the tested materials, especially under DS condition. For all traits scored under WW condition, heritability estimates ranged from 0.76 to 0.88, whereas under DS condition, heritability estimates ranged from 0.85 to 0.95, indicating that these three traits are highly heritable. Therefore, these traits can be used by soybean breeders in selection programs to improve yield and drought tolerance.
4.2 GWAS analysis and gene prediction of key QTLs
By population structure analysis, all the tested materials were divided into seven categories, indicating some variation within the populations. Similar results were found in phylogenetic analyses, suggesting that these analyses can help prevent false positives in GWAS (Eltaher et al., 2018). LD decayed to half the r2 (0.30) at 178.7 kb, and LD contained a number of significant SNPs, suggesting that GWAS can be used to identify significant markers-trait associations (Schwarz et al., 2015). In the Q-Q diagram analysis results, most points were on the diagonal for all traits, which explains the population structure well (Paterne et al., 2021).
We identified 39 significantly SNPs associated with three traits under WW and DS conditions by BLUP data and individual environmental analyses. For these traits, no overlapping SNPs were observed between WW and DS conditions, which indicates the difficulty of improving soybean yield-related traits simultaneously under different evaluation conditions. Based on the LD analysis, only 26 genomic regions was chosen as the QTL regions with an average of 176-kb intervals.
Six QTL regions containing at least three significant SNP loci with significant LD tend to co-inherit, which can be useful for further genetic validation as well as marker-assisted selection. Among these QTLs, three were consistent with previously reported soybean QTLs. For example, within the previous reported QTL interval (Chr19:386234-49312675) controlling PN (Zhang J. et al., 2015), the present QTL qPN-WW19.1 associated PN under WW condition was detected in SY2020, FX2021 and BLUP data. Moreover, one SNP loci (Chr19:46340503) significantly associate with plant height in soybean was previously reported by Fang et al. (2017), which was also located within the interval of qPN-WW19.1 (Chr19: 46284103-46530081). Within the QTL interval of qPN-WW19.1, a gene Glyma.19G211300, encoding E3 ubiquitin-protein ligase BAH1, was predicted here as the putative candidate gene. Members of the protein family E3 ubiquitin-protein ligases play a significant role in the ubiquitin-proteasome pathway to affect yield (Ge et al., 2016; Lv et al., 2022), such as GW2 in rice (Choi et al., 2018), ZmGW2 in maize (Kong et al., 2014), and TaGW2 in wheat (Lv et al., 2022).
The QTL qBM-DS17.4 associated BM under DS condition was detected in FX2018, SY2020, FX2021 and BLUP data, which located within the previous reported QTL interval (Chr17:5891979-4629130) controlling shoot dry weight in soybean (Liang et al., 2010). Within the QTL interval of qBM-DS17.4, a gene Glyma.17G057100, encoding WRKY transcription factor 11, was predicted here as the putative candidate gene. WRKY transcription factors participate in various physiological and developmental processes (Rushton et al., 2010), such as seed development (Lagacã and Matton, 2004), seed dormancy and germination (Zentella et al., 2007), senescence (Silke and Imre, 2002), and development (Johnson et al., 2002). Plant hormones, including abscisic acid (Zhang L. et al., 2015), jasmonic acid (Shimono et al., 2007) and gibberellin (Zhang L. et al., 2015), are signaled by WRKY proteins, according to recent findings. WRKY transcription factors have been demonstrated to confer drought tolerance in wheat (Gao et al., 2018; El-Esawi et al., 2019) and soybean (Zhou et al., 2008; Shi et al., 2018).
The QTL qSW-WW4 associated SW under WW condition was detected in FX2018, SY2020 and BLUP data, which located within the previous reported QTL interval (Chr17:12310119-32617784) that evaluated for the SW for a population grown in a low phosphorus environment (Liang et al., 2010). Within the QTL interval of qBM-DS17.4, a gene Glyma.04G124800, encoding Protein Zinc induced facilitator-like 1, was predicted here as the putative candidate gene. Due to their specialized role in phytosiderophores efflux and auxin homeostasis, a subset of the zinc-induced facilitators are also proven to impart tolerance to micronutrient deficiencies. In the case of Zn deficiency, crop yield is affected (Krithika and Balachandar, 2016), while Fe deficiency can impair several vital functions, such as photosynthesis and respiration (Marschner, 1995). ZIFL genes contributes to mobilization of Zn2+ in rhizospheric regions and mobilization of Fe there by secreting phytosiderophores (Haydon and Cobbett, 2007; Meena et al., 2021)
QTL are considered validated if they are detected in a different background as it is a true association across many genotypes. In this study, all QTLs detected except the validated ones can be considered novel locus that should be tested in another population. For example, within the QTL interval of qSW-DS8, a gene Glyma.08G020900, encoding ethylene-responsive transcription factor CRF2, was predicted here as the putative candidate gene. In many species, members of the AP2/ERF superfamily regulate flower and seed development, and thus play a critical role in regulating seed weight and further controlling seed yield (Jiang et al., 2020). A subfamily of ERF proteins called cytokinin response factors (CRFs) contributes to plant growth, development, nitrogen uptake, and stress resistance (Zong et al., 2021). Recently, the gene GmCRF4a in soybean has been reported to regulate plant height and auxin biosynthesis, which would facilitate future molecular breeding practice to improve soybean architecture (Xu et al., 2022).
4.3 Favorable haplotypes for soybean breeding
Using the base types of SNP markers and distributions of alleles associated with a trait, some haplotypes were identified, and favorable haplotypes were identified based on their phenotypic values using t-tests. The cultivars with favorable haplotypes in qPN-WW19.1, qBM-WW1 and qSW-WW4 usually had greater PN, BM and SW, respectively, under WW condition, while those in qBM-DS17.4, qPN-DS8.8 and qSW-DS8 also had more desirable phenotypes, respectively, under DS condition. During soybean breeding, these important QTLs had been subjected to various levels of selection, resulting in different proportions of favorable haplotypes for each locus.
It has been well documented that the development of soybean breeding has led to a change in agronomic traits. Linear increases in PN and SW accounted for most of the historical yield improvement (Morrison et al., 2000; Cui and Yu, 2005; Jin et al., 2010). In this study, we found larger proportions of favorable haplotypes for locus qPN-WW19.1 and qSW-WW4 in both landraces and improved cultivars, suggesting the selection for these favorable haplotypes by breeders played an important role during historical yield improvement. In this study, about 59.04% of the population, including improved cultivar ‘Liaodou69’ (32.60 g/plant), ‘Liaodou32’ (31.92 g/plant), ‘Liaodou36’ (31.54 g/plant), ‘Liaodou14’ (30.49 g/plant), ‘Zhonghuang35’ (30.03 g/plant), and ‘Tiefeng31’ (28.04 g/plant) carried both superior haplotypes for locus qPN-WW19.1 and qSW-WW4 and produced greater yields under WW condition, suggesting that these QTLs had aggregated by soybean breeding. Although the historical yield improvement was primarily driven by higher BM (Balboa et al., 2018), we found less proportions of favorable haplotypes for qBM-WW1, especially in landraces. Moreover, the proportions of favorable haplotypes for locus qBM-DS17.4, qPN-DS8.8 and qSW-DS8 were only 23%, 6% and 3% in landraces, respectively, even though in improved cultivars those were 18%, 10% and 13%, respectively. It may be due to the belief that crop improvement has reduced their ability to cope with future challenges, such as drought (Byrne et al., 2018; Swarup et al., 2020). Our results implied that these QTLs qBM-DS17.4, qPN-DS8.8 and qSW-DS8 had not experienced strong selection during drought tolerant soybean breeding but had potential for increasing soybean drought tolerance.
5 Conclusion
In this study, we genotyped 188 soybean germplasm using SLAF-seq technology and evaluated their yield-related traits under WW and DS conditions. By using BLUP data and individual environmental analyses in GWAS, a total of 39 SNPs were significantly associated with three traits under two conditions, which were tagged to 26 genomic regions by linkage disequilibrium (LD) analysis. Six locus could play a key role in determining PN, BM and SW of soybean. The favorable haplotypes for locus qPN-WW19.1 and qSW-WW4 had experienced strong selection during historical yield improvement, while those for qBM-WW1, qBM-DS17.4, qPN-DS8.8 and qSW-DS8 had not been fully utilized, especially for drought tolerant soybean breeding. It was believed that the superior haplotypes for these loci should be integrated to improve yield-related traits. As a result of this study, a better understanding of the genetic architecture driving high yields will be gained and the foundation for marker-assisted breeding will be laid in soybean.
Statements
Data availability statement
The datasets presented in this study can be found in online repositories. The names of the repository/repositories and accession number(s) can be found below: NCBI SRA database accession number PRJNA1014913.
Author contributions
SL: Data curation, Funding acquisition, Investigation, Project administration, Writing- original draft, Writing- review & editing. YC: Investigation, Formal analysis, Writing- review & editing. CW: Investigation, Methodology, Writing- review & editing. CY: Investigation, Data curation, Writing- review & editing. XS: Investigation, Methodology, Writing- review & editing. LZ: Data curation, Investigation, Writing- review & editing. WW: Project administration, Writing- review & editing. SS: Project administration, Writing- review & editing.
Funding
The authors declare financial support was received for the research, authorship, and/or publication of this article. The study was supported by the National Natural Science Foundation of China (32101795 and 32301782), Liaoning provincial Major Special Project of Agricultural Science and Technology (2022JH1/10200002 and 2021JH1/10400038), Key Research and Development Plan of Liaoning Science and Technology Department (2021JH2/1020027), and Shenyang Seed Industry Innovation Project (22-318-2-12).
Acknowledgments
We also acknowledge Dr. Mingzhu Zhao, Institute of Crop Research, Liaoning Academy of Agricultural Sciences, for comments improving the manuscript.
Conflict of interest
The authors declare that the research was conducted in the absence of any commercial or financial relationships that could be construed as a potential conflict of interest.
Publisher’s note
All claims expressed in this article are solely those of the authors and do not necessarily represent those of their affiliated organizations, or those of the publisher, the editors and the reviewers. Any product that may be evaluated in this article, or claim that may be made by its manufacturer, is not guaranteed or endorsed by the publisher.
Supplementary material
The Supplementary Material for this article can be found online at: https://www.frontiersin.org/articles/10.3389/fpls.2023.1265574/full#supplementary-material
References
1
Atwell S. Huang Y. S. Vilhjalmsson B. J. Willems G. Horton M. Li Y. et al . (2010). Genome-wide association study of 107 phenotypes in Arabidopsis thaliana inbred lines. Nature465, 627–631. doi: 10.1038/nature08800
2
Ayalew H. Schapaugh W. Vuong T. Nguyen H. T. (2022). Genome-wide association analysis identified consistent QTL for seed yield in a soybean diversity panel tested across multiple environments. Plant Genome15, e20268. doi: 10.1002/tpg2.20268
3
Bates D. Maechler M. Bolker B. (2012) lme4: linear mixed-effects models using S4 classes (R package version 0.999999-0). Available at: http://cran.r-project.org/web/packages/lme4/index.html.
4
Bhat J. A. Adeboye K. A. Ganie S. A. Barmukh R. Hu D. Varshney R. K. et al . (2022). Genome-wide association study, haplotype analysis, and genomic prediction reveal the genetic basis of yield-related traits in soybean (Glycine max L.). Front. Genet.13. doi: 10.3389/fgene.2022.953833
5
Byrne P. F. Volk G. M. Gardner C. Gore M. A. Simon P. W. Smith S. (2018). Sustaining the future of plant breeding: the critical role of the USDA-ARS National Plant Germplasm System. Crop Sci.58, 451–468. doi: 10.2135/cropsci2017.05.0303
6
Cerezini P. Kuwano B. H. dos Santos M. B. Terassi F. Hungria M. Nogueira M. A. (2016). Strategies to promote early nodulation in soybean under drought. Field Crops Res.196, 160–167. doi: 10.1016/j.fcr.2016.06.017
7
Chen W. Gao Y. Q. Xie W. B. Gong L. Lu K. Wang W. S. et al . (2014). Genome-wide association analyses provide genetic and biochemical insights into natural variation in rice metabolism. Nat. Genet.46, 714–721. doi: 10.1038/ng.3007
8
Chen W. Yao Q. Patil G. B. Agarwal G. Deshmukh R. K. Lin L. et al . (2016). Identification and comparative analysis of differential gene expression in soybean leaf tissue under drought and flooding stress revealed by RNA-Seq. Front. Plant Sci.7, 1044. doi: 10.3389/fpls.2016.01044
9
Choi B. S. Kim Y. J. Markkandan K. Koo Y. J. Song J. T. Seo H. S. (2018). GW2 functions as an E3 ubiquitin ligase for rice expansin-like 1. Int. J. Mol. Sci.19 (7), 1904. doi: 10.3390/ijms19071904
10
Cui S. Y. Yu D. Y. (2005). Estimates of relative contribution of biomass, harvest index and yield components to soybean yield improvements in China. Plant Breed.124, 473–476. doi: 10.1111/j.1439-0523.2005.01112.x
11
El-Esawi M. A. Al-Ghamdi A. A. Ali H. M. Ahmad M. (2019). Overexpression of AtWRKY30 transcription factor enhances heat and drought stress tolerance in wheat (Triticum aestivum L.). Genes10, 163. doi: 10.3390/genes10020163
12
Eltaher S. Sallam A. Belamkar V. Emara H. A. Nower A. A. Salem K. F. et al . (2018). Genetic diversity and population structure of F3: 6 Nebraska winter wheat genotypes using genotyping-by-sequencing. Front. Genet.9, 76. doi: 10.3389/fgene.2018.00076
13
Fang C. Ma Y. Wu S. Liu Z. Wang Z. Yang R. et al . (2017). Genome-wide association studies dissect the genetic networks underlying agronomical traits in soybean. Genome Biol.18, 161. doi: 10.1186/s13059-017-1289-9
14
Frederick J. R. Camp C. R. Bauer P. J. (2001). Drought-stress effects on branch and mainstem seed yield and yield components of determinate soybean. Crop Sci.41, 759–763. doi: 10.2135/cropsci2001.413759x
15
Fu W. Perry P. O. (2020). Estimating the number of clusters using cross-validation. J. Comput. Graph. Stat.29, 162–173. doi: 10.1080/10618600.2019.1647846
16
Gao H. Wang Y. Xu P. Zhang Z. (2018). Overexpression of a WRKY transcription factor TaWRKY2 enhances drought stress tolerance in transgenic wheat. Front. Plant Sci.9, 997. doi: 10.3389/fpls.2018.00997
17
Ge L. Yu J. Wang H. Luth D. Bai G. Wang K. et al . (2016). Increasing seed size and quality by manipulating BIG SEEDS1 in legume species. Proc. Natl. Acad. Sci.113 (44), 12414–12419. doi: 10.1073/pnas.1611763113
18
Hacisalihoglu G. Burton A. L. Gustin J. L. Eker S. Asikli S. Heybet E. H. et al . (2018). Quantitative trait loci associated with soybean seed weight and composition under different phosphorus levels. J. Integr. Plant Biol.60, 232–241. doi: 10.1111/jipb.12612
19
Haydon M. J. Cobbett C. S. (2007). A novel major facilitator superfamily protein at the tonoplast influences zinc tolerance and accumulation in Arabidopsis. Plant Physiol.143, 1705–1719. doi: 10.1104/pp.106.092015
20
Jiang W. Zhang X. Song X. Yang J. Pang Y. (2020). Genome-wide identification and characterization of APETALA2/ethylene-responsive element binding factor superfamily genes in soybean seed development. Front. Plant Sci.11, 566647. doi: 10.3389/fpls.2020.566647
21
Jin J. Liu X. Wang G. Mi L. Shen Z. Chen X. et al . (2010). Agronomic and physiological contributions to the yield improvement of soybean cultivars released from 1950 to 2006 in Northeast China. Field Crops Res.115, 116–123. doi: 10.1016/j.fcr.2009.10.016
22
Johnson C. S. Kolevski B. Smyth D. R. (2002). Transparent TESTA glabra2, a trichome and seed coat development gene of Arabidopsis, encodes a WRKY transcription factor. Plant Cell14, 1359–1375. doi: 10.1105/tpc.001404
23
Kadam N. N. Struik P. C. Rebolledo M. C. Yin X. Jagadish S. K. (2018). Genome-wide association reveals novel genomic loci controlling rice grain yield and its component traits under water-deficit stress during the reproductive stage. J. Exp. Bot.69, 4017–4032. doi: 10.1093/jxb/ery186
24
Kaler A. S. Gillman J. D. Beissinger T. Purcell L. C. (2020). Comparing different statistical models and multiple testing corrections for association mapping in soybean and maize. Front. Plant Sci.10, 1794. doi: 10.3389/fpls.2019.01794
25
Kong M. Li C. Sun Q. Lu M. Wang W. Pan J. et al . (2014). Isolation and expression analysis of the E3 ubiquitin ligase encoding gene ZmGW2-1 in maize. J. Anhui Agric. Univ.41 (6), 1004–1011. doi: 10.13610/j.cnki.1672-352x.20141029.009
26
Kozich J. J. Westcott S. L. Baxter N. T. Highlander S. K. Schloss P. D. (2013). Development of a dual-index sequencing strategy and curation pipeline for analyzing amplicon sequence data on the MiSeq Illumina sequencing platform. Appl. Environ. Microbiol.79, 5112–5120. doi: 10.1128/AEM.01043-13
27
Krithika S. Balachandar D. (2016). Expression of zinc transporter genes in rice as influenced by zinc-solubilizing enterobacter cloacae strain ZSB14. Front. Plant Sci.7, 446. doi: 10.3389/fpls.2016.00446
28
Lagacã M. Matton D. P. (2004). Characterization of a WRKY transcription factor expressed in late torpedo-stage embryos of Solanum chacoense. Planta219, 185–189. doi: 10.1007/s00425-004-1253-2
29
Li H. (2013). Aligning sequence reads, clone sequences and assembly contigs with BWA-MEM. arXiv preprint arXiv, 1–3. doi: 10.48550/arXiv.1303.3997
30
Li H. Handsaker B. Wysoker A. Fennell T. Ruan J. Homer N. et al . (2009). The sequence alignment/map format and SAMtools. Bioinformatics25, 2078–2079. doi: 10.1093/bioinformatics/btp352
31
Liang Q. Cheng X. Mei M. Yan X. Liao H. (2010). QTL analysis of root traits as related to phosphorus efficiency in soybean. Ann. Bot.106, 223–234. doi: 10.1093/aob/mcq097
32
Liu F. Jensen C. R. Andersen M. N. (2004). Drought stress effect on carbohydrate concentration in soybean leaves and pods during early reproductive development: its implication in altering pod set. Field Crops Res.86, 1–13. doi: 10.1016/S0378-4290(03)00165-5
33
Lv Q. Li L. Meng Y. Sun H. Chen L. Wang B. et al . (2022). Wheat E3 ubiquitin ligase TaGW2-6A degrades TaAGPS to affect seed size. Plant Sci.320, 111274. doi: 10.1016/j.plantsci.2022.111274
34
Marschner H. (1995). “9—Functions of mineral nutrients: micronutrients,” in Mineral nutrition of higher plants, 2nd ed. Ed. MarschnerH. (London, UK: Academic Press), 313–404.
35
McKenna A. Hanna M. Banks E. Sivachenko A. Cibulskis K. Kernytsky A. et al . (2010). The genome analysis toolkit: a MapReduce framework for analyzing next-generation DNA sequencing data. Genome Res.20, 1297–1303. doi: 10.1101/gr.107524.110
36
Meena V. Sharma S. Kaur G. Singh B. Pandey A. K. (2021). Diverse functions of plant zinc-induced facilitator-like transporter for their emerging roles in crop trait enhancement. Plants11, 102. doi: 10.3390/plants11010102
37
Mohammadi R. Haghparast R. Sadeghzadeh B. Ahmadi H. Solimani K. Amri A. (2014). Adaptation patterns and yield stability of durum wheat landraces to highland cold rainfed areas of Iran. Crop Sci.54, 944–954. doi: 10.2135/cropsci2013.05.0343
38
Morrison M. J. Voldeng H. D. Cober E. R. (2000). Agronomic changes from 58 years of genetic improvement of short-season soybean cultivars in Canada. Agron. J.92, 780–784. doi: 10.2134/agronj2000.924780x
39
Paterne A. A. Norman P. E. Asiedu R. Asfaw A. (2021). Identification of quantitative trait nucleotides and candidate genes for tuber yield and mosaic virus tolerance in an elite population of white Guinea yam (Dioscorea rotundata) using genome-wide association scan. BMC Plant Biol.21, 552. doi: 10.1186/s12870-021-03314-w
40
Piepho H. P. Möhring J. Melchinger A. E. Büchse A. (2008). BLUP for phenotypic selection in plant breeding and variety testing. Euphytica161, 209–228. doi: 10.1007/s10681-007-9449-8
41
Rushton P. J. Somssich I. E. Ringler P. Shen Q. J. (2010). WRKY transcription factors. Plant Signal. Behav.15, 247–258. doi: 10.1016/j.tplants.2010.02.006
42
Saghai Maroof M. A. Soliman K. M. Jorgensen R. A. Allard R. W. (1984). Ribosomal DNA spacer-length polymorphisms in barley: Mendelian inheritance, chromosomal location, and population dynamics. Proc. Natl. Acad. Sci. U. S. A.81, 8014–8018. doi: 10.1073/pnas.81.24.8014
43
Schwarz N. Armbruster U. Iven T. Brückle L. Melzer M. Feussner I. et al . (2015). Tissue-specific accumulation and regulation of zeaxanthin epoxidase in arabidopsis reflect the multiple functions of the enzyme in plastids. Plant Cell Physiol.56, 346–357. doi: 10.1093/pcp/pcu167
44
Sehgal D. Singh R. Rajpal V. R. (2016). “Quantitative trait loci mapping in plants: Concepts and approaches,” in Molecular breeding for sustainable crop improvement, vol. 2 . Eds. RajpalV. R.RaoS. R.RainaS. N. (Cham, Switzerland: Springer International Publishing), 31–59.
45
Shi W. Y. Du Y. T. Ma J. Min D. H. Jin L. G. Chen J. et al . (2018). The WRKY transcription factor GmWRKY12 confers drought and salt tolerance in soybean. Int. J. Mol. Sci.19, 4087. doi: 10.3390/ijms19124087
46
Shimono M. Sugano S. Nakayama A. Jiang C. J. Ono K. Toki S. et al . (2007). Rice WRKY45 plays a crucial role in benzothiadiazole-inducible blast resistance. Plant Cell19, 2064–2076. doi: 10.1105/tpc.106.046250
47
Silke R. Imre E. S. (2002). Targets of AtWRKY6 regulation during plant senescence and pathogen defense. Genes Dev.16, 1139–1149. doi: 10.1101/gad.222702
48
Sun X. W. Liu D. Y. Zhang X. F. Li W. B. Liu H. Hong W. G. et al . (2013). SLAF-seq: An efficient method of large-scale de novo SNP discovery and genotyping using high-throughput sequencing. PLoS One8, e58700. doi: 10.1371/journal.pone.0058700
49
Sun X. Sun X. Pan X. Zhang H. Wang Y. Ren H. et al . (2022). Identification and fine mapping of a quantitative trait locus controlling the total flower and pod numbers in soybean. Agronomy12, 790. doi: 10.3390/agronomy12040790
50
Swarup S. Cargill E. J. Crosby K. Flagel L. Kniskern J. glenn K. C. (2020). Genetic diversity is indispensable for plant breeding to improve crops. Crop Sci.61, 839–852. doi: 10.1002/csc2.20377
51
Vilella A. J. Severin J. Ureta-Vidal A. Heng L. Durbin R. Birney E. (2009). Ensem-blCompara GeneTrees: Complete, duplication-aware phylogenetic trees in vertebrates. Genome Res.19, 327–335. doi: 10.1101/gr.073585.107
52
Wang C. L. Zhang Q. Jiang L. Qian R. Ding X. D. Zhao Y. F. (2016). Comparative study of estimation methods for genomic breeding values. Sci. Bull.61, 353–356. doi: 10.1007/s11434-016-1014-1
53
Wang X. Zhou S. Wang J. Lin W. Yao X. Su J. et al . (2023). Genome-wide association study for biomass accumulation traits in soybean. Mol. Breed.43, 33. doi: 10.1007/s11032-023-01380-6
54
Xu Z. Wang R. Kong K. Begum N. Almakas A. Liu J. et al . (2022). An APETALA2/ethylene responsive factor transcription factor GmCRF4a regulates plant height and auxin biosynthesis in soybean. Front. Plant Sci.13, 983650. doi: 10.3389/fpls.2022.983650
55
Yang Y. (2021). Fine mapping and candidate gene identification of a soybean seed protein and oil qtl from a wild soybean accession and linkage analysis for whole plant biomass, carbon, nitrogen, and seed composition using a RIL mapping population (Columbia, MO, United States: Doctoral dissertation, University of Missouri-Columbia).
56
Yoosefzadeh Najafabadi M. (2021). Using advanced proximal sensing and genotyping tools combined with bigdata analysis methods to improve soybean yield (Guelph, ON, Canada: University of Guelph).
57
Zentella R. Zhang Z. Park M. Thomas S. Endo A. Murase K. et al . (2007). Global analysis of della direct targets in early gibberellin signaling in Arabidopsis. Plant Cell19, 3037–3057. doi: 10.1105/tpc.107.054999
58
Zhang C. Dong S. S. Xu J. Y. He W. M. Yang T. L. (2019). PopLDdecay: A fast and effective tool for linkage disequilibrium decay analysis based on variant call format files. Bioinformatics35, 1786–1788. doi: 10.1093/bioinformatics/bty875
59
Zhang L. Gu L. Ringler P. Smith S. Rushton P. J. Shen Q. J. (2015). Three WRKY transcription factors additively repress abscisic acid and gibberellin signaling in aleurone cells. Int. J. Exp. Plant Biol.236, 214–222. doi: 10.1016/j.plantsci.2015.04.014
60
Zhang J. Song Q. Cregan P. B. Nelson R. L. Wang X. Wu J. et al . (2015). Genome-wide association study for flowering time, maturity dates and plant height in early maturing soybean (Glycine max) germplasm. BMC Genomics16, 1–11. doi: 10.1186/s12864-015-1441-4
61
Zhao M. Ma Z. Wang L. Tang Z. Mao T. Liang C. et al . (2020). SNP-based QTL mapping for panicle traits in the japonica super rice cultivar Liaoxing 1. Crop J.8, 769–780. doi: 10.1016/j.cj.2020.07.002
62
Zhou Q. Y. Tian A. G. Zou H. F. Xie Z. M. Lei G. Huang J. et al . (2008). Soybean WRKY-type transcription factor genes, GmWRKY13, GmWRKY21, and GmWRKY54, confer differential tolerance to abiotic stresses in transgenic Arabidopsis plants. Plant Biotechnol. J.6, 486–503. doi: 10.1111/j.1467-7652.2008.00336.x
63
Zhou Q. Zhou C. Zheng W. Mason A. S. Fan S. Wu C. et al . (2017). Genome-Wide SNP markers based on SLAF-Seq uncover breeding traces in rapeseed (Brassica napus L.). Front. Plant Sci.8, 648. doi: 10.3389/fpls.2017.00648
64
Zong Y. Hao Z. Tu Z. Shen Y. Zhang C. Wen S. et al . (2021). Genome-wide survey and identification of AP2/ERF genes involved in shoot and leaf development in Liriodendron chinense. BMC Genomics22, 807. doi: 10.1186/s12864-021-08119-7
Summary
Keywords
drought stress, favorable haplotypes, GWAS, soybean (Glycine max), yield-related traits
Citation
Li S, Cao Y, Wang C, Yan C, Sun X, Zhang L, Wang W and Song S (2023) Genome-wide association mapping for yield-related traits in soybean (Glycine max) under well-watered and drought-stressed conditions. Front. Plant Sci. 14:1265574. doi: 10.3389/fpls.2023.1265574
Received
23 July 2023
Accepted
18 September 2023
Published
09 October 2023
Volume
14 - 2023
Edited by
Ting Peng, Henan Agricultural University, China
Reviewed by
Hongjian Zheng, Shanghai Academy of Agricultural Sciences, China; Toi J. Tsilo, Agricultural Research Council of South Africa (ARC-SA), South Africa
Updates
Copyright
© 2023 Li, Cao, Wang, Yan, Sun, Zhang, Wang and Song.
This is an open-access article distributed under the terms of the Creative Commons Attribution License (CC BY). The use, distribution or reproduction in other forums is permitted, provided the original author(s) and the copyright owner(s) are credited and that the original publication in this journal is cited, in accordance with accepted academic practice. No use, distribution or reproduction is permitted which does not comply with these terms.
*Correspondence: Wenbin Wang, lnsoybean@163.com; Shuhong Song, songshuhong2017@163.com
Disclaimer
All claims expressed in this article are solely those of the authors and do not necessarily represent those of their affiliated organizations, or those of the publisher, the editors and the reviewers. Any product that may be evaluated in this article or claim that may be made by its manufacturer is not guaranteed or endorsed by the publisher.