95% of researchers rate our articles as excellent or good
Learn more about the work of our research integrity team to safeguard the quality of each article we publish.
Find out more
ERRATUM article
Front. Plant Sci. , 17 July 2023
Sec. Functional and Applied Plant Genomics
Volume 14 - 2023 | https://doi.org/10.3389/fpls.2023.1254738
This article is part of the Research Topic Genetics, Genomics and Breeding of Plant Architecture, Biomass, Grain Quality and Grain Yield Traits in Rice and Wheat View all 15 articles
This article is an erratum on:
Meta-QTL and haplo-pheno analysis reveal superior haplotype combinations associated with low grain chalkiness under high temperature in rice
By Kumari A, Sharma D, Sharma P, Sahil, Wang C, Verma V, Patil A, Imran M, Singh MP, Kumar K, Paritosh K, Caragea D, Kapoor S, Chandel G, Grover A, Jagadish SVK, Katiyar-Agarwal S and Agarwal M (2023). Front. Plant Sci. 14:1133115. doi: 10.3389/fpls.2023.1133115
Due to a production error, Figure 1 was a repeat of Figure 7 in the published article.
The corrected Figures appear below.

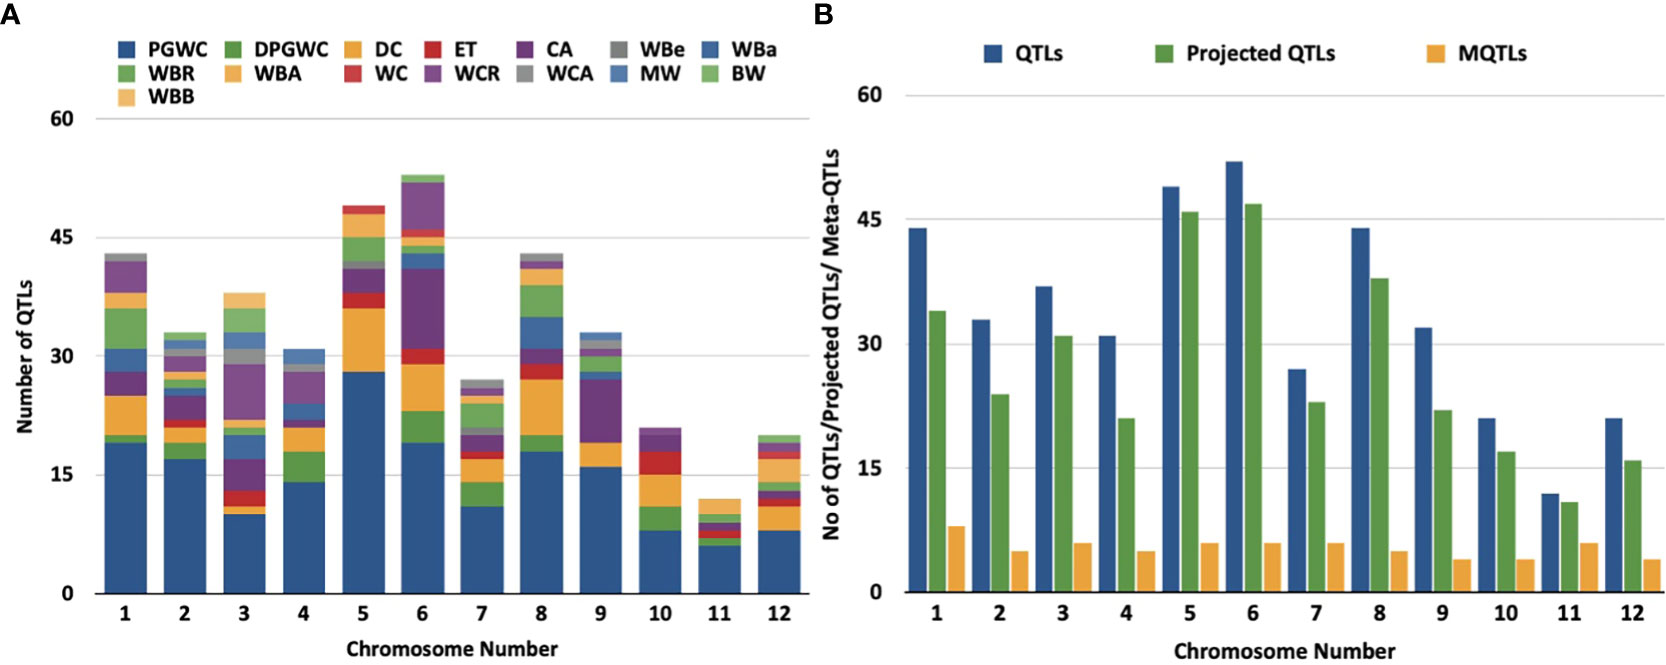
Figure 1 Distribution of QTLs and meta-QTLs associated with rice grain chalk on different chmmosomes of rice, (A) Trait-wise distribution of initial QTLs used for the meta-QTL analysis, (PGWC, Percentage Grain with Chalkiness; DPGWC, Degree of Percentage Grain with Chalkiness; DC, Degree of Endosperm Chalkiness; ET, Endosperm Transparency; CA, Chalkiness Area; WBe, White Belly; WBa, White Back; WBR,; WBA, White Back Area; WC, White core; WCR, White core rate; WCA, Whlte core area; MW,Mi1ky white; BW, Basal White; WBB, White Back and Basal). (B) The distribution of QTLs, projected QTLs and meta-QTLs on twelve rice chromosomes.

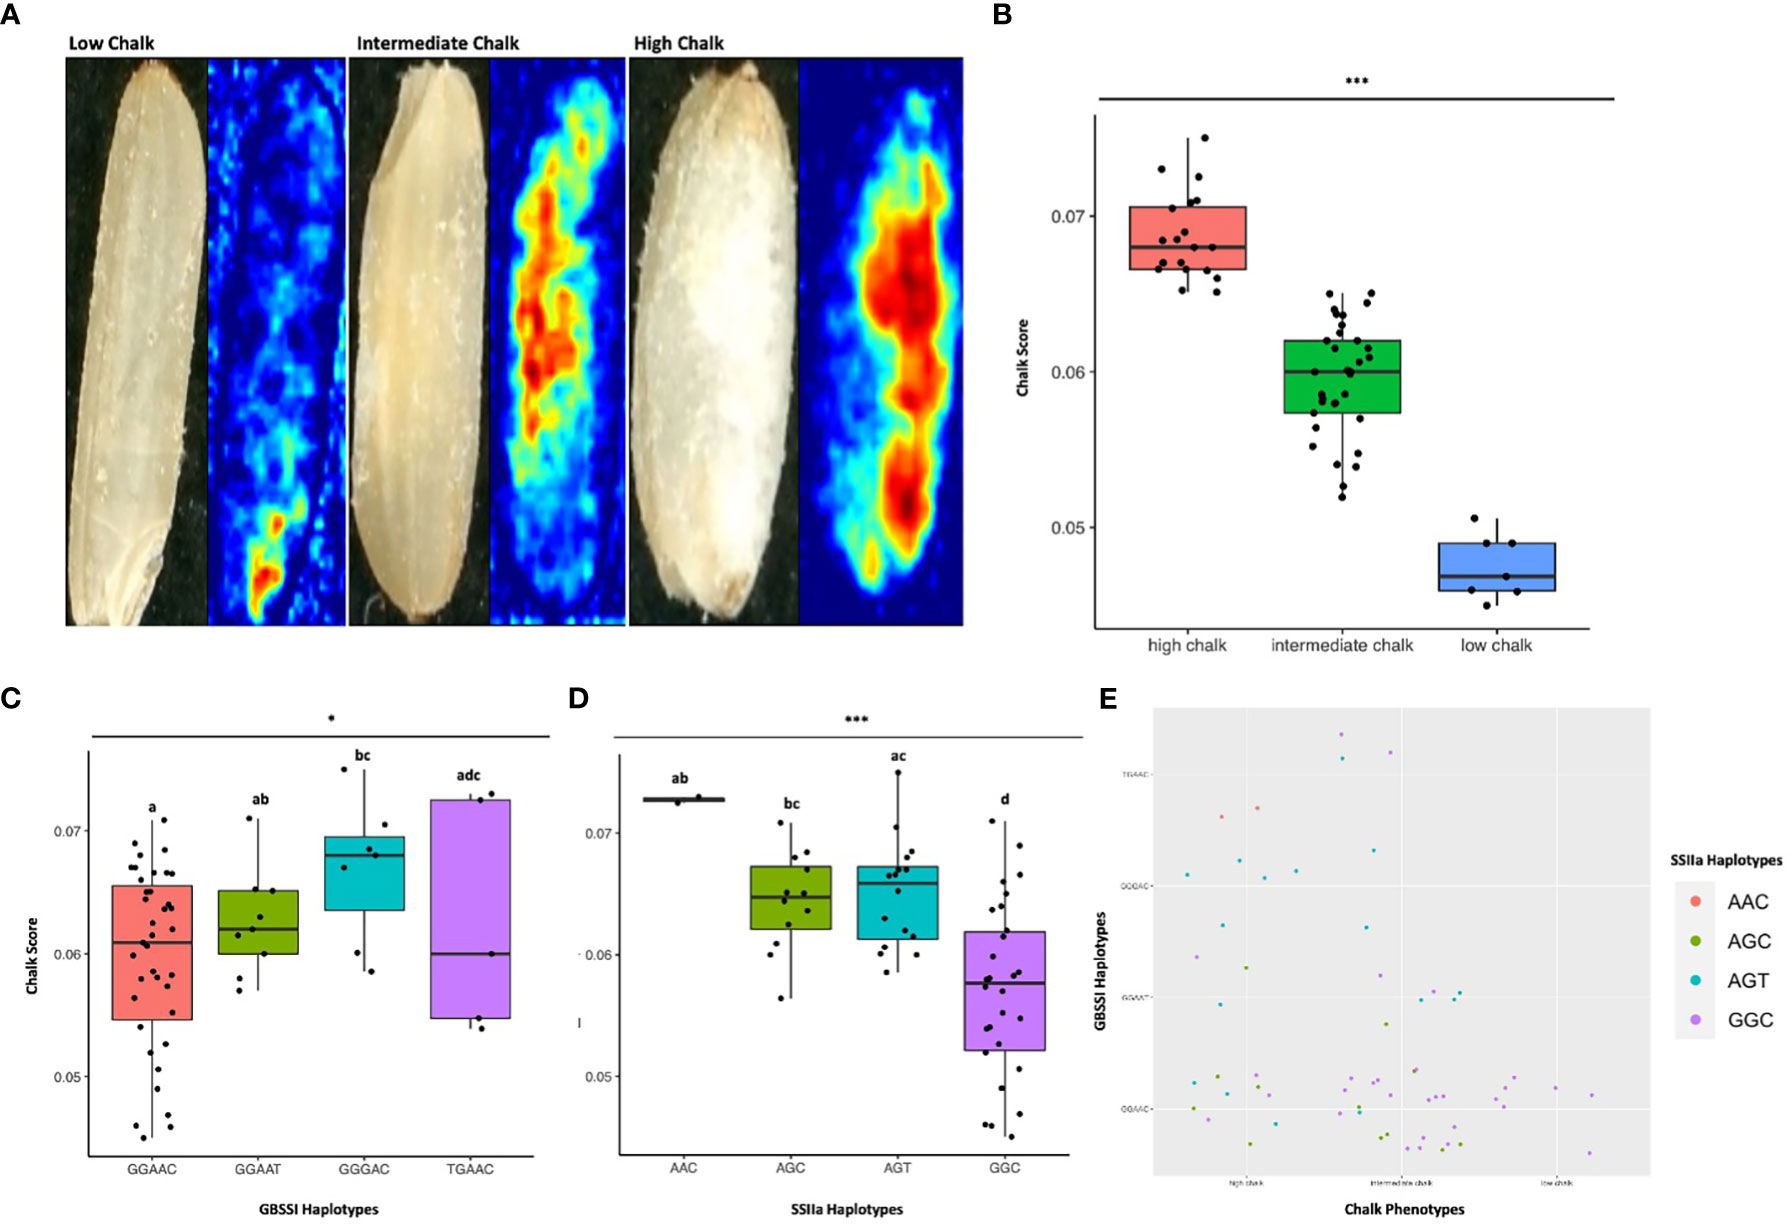
Figure 7 Haplo-pheno analysis of Granule Bound Starch Synthase I and Starch Synthase Il a, (A) Rice seed scans and their corresponding heat maps highlighting the chalky area (red) in less chalk, intermediate chalk and high chalk seed types. (B) Box plot depicting the chalky score of 60 rice genotypes (grown in two crop seasons) categorized as high, intermediate and low chalk (C) Box plot of the chalk score data categorized according to the GBSS I haplotypes. (D) Box plot of the chalk score data categorized according to the SSIIa haplotypes. (E) Comparison of the haplotypic combination of GBSS I and SSIIa. One-way ANOVA was conducted for determining the statistical significance of haplotype means. Chalk score data designated with the same alphabet are not significantly different at p ≤ 0.1(.) or p ≤ 0.05 (*) or p ≤ 0.001 (***) as per Turkey Post hoc test for Honest Significance Difference (HSD) analysis.
The publisher apologizes for this mistake.
The original version of this article has been updated.
Keywords: starch metabolism, grain chalkiness, meta-QTL analysis, haplotype, haplo-pheno analysis, granule bound starch synthase I, starch synthase IIa
Citation: Frontiers Production Office (2023) Erratum: Meta-QTL and haplo-pheno analysis reveal superior haplotype combinations associated with low grain chalkiness under high temperature in rice. Front. Plant Sci. 14:1254738. doi: 10.3389/fpls.2023.1254738
Received: 07 July 2023; Accepted: 07 July 2023;
Published: 17 July 2023.
Approved by:
Frontiers Editorial Office, Frontiers Media SA, SwitzerlandCopyright © 2023 Frontiers Production Office. This is an open-access article distributed under the terms of the Creative Commons Attribution License (CC BY). The use, distribution or reproduction in other forums is permitted, provided the original author(s) and the copyright owner(s) are credited and that the original publication in this journal is cited, in accordance with accepted academic practice. No use, distribution or reproduction is permitted which does not comply with these terms.
*Correspondence: Frontiers Production Office, cHJvZHVjdGlvbi5vZmZpY2VAZnJvbnRpZXJzaW4ub3Jn
Disclaimer: All claims expressed in this article are solely those of the authors and do not necessarily represent those of their affiliated organizations, or those of the publisher, the editors and the reviewers. Any product that may be evaluated in this article or claim that may be made by its manufacturer is not guaranteed or endorsed by the publisher.
Research integrity at Frontiers

Learn more about the work of our research integrity team to safeguard the quality of each article we publish.