 Pasquale Tripodi1*
 Massimiliano Beretta2
 Damien Peltier3Ilias Kalfas4Christos Vasilikiotis5Anthony Laidet6Gael Briand6Charlotte Aichholz7Tizian Zollinger8
 Rob van Treuren9
 Davide Scaglione10
 Sandra Goritschnig11*
- 1Council for Agricultural Research and Economics (CREA), Research Centre for Vegetable and Ornamental Crops, Pontecagnano Faiano, SA, Italy
- 2ISI Sementi SpA, Fidenza (PR), Italy
- 3Limagrain - Vilmorin-Mikado, La Ménitré, France
- 4American Farm School, Thessaloniki, Greece
- 5Perrotis College, American Farm School, Thessaloniki, Greece
- 6Gautier Semences Route d’Avignon 13630, Eyragues, France
- 7Sativa Rheinau AG, Rheinau, Switzerland
- 8Zollinger Conseilles Sarl, Les Evouettes, Switzerland
- 9Centre for Genetic Resources, the Netherlands (CGN), Wageningen University and Research, Wageningen, Netherlands
- 10IGA Technology Services Srl, Udine, Italy
- 11European Cooperative Programme for Plant Genetic Resources (ECPGR) Secretariat c/o Alliance of Bioversity International and CIAT, Rome, Italy
Single primer enrichment technology (SPET) is a novel high-throughput genotyping method based on short-read sequencing of specific genomic regions harboring polymorphisms. SPET provides an efficient and reproducible method for genotyping target loci, overcoming the limits associated with other reduced representation library sequencing methods that are based on a random sampling of genomic loci. The possibility to sequence regions surrounding a target SNP allows the discovery of thousands of closely linked, novel SNPs. In this work, we report the design and application of the first SPET panel in lettuce, consisting of 41,547 probes spanning the whole genome and designed to target both coding (~96%) and intergenic (~4%) regions. A total of 81,531 SNPs were surveyed in 160 lettuce accessions originating from a total of 10 countries in Europe, America, and Asia and representing 10 horticultural types. Model ancestry population structure clearly separated the cultivated accessions (Lactuca sativa) from accessions of its presumed wild progenitor (L. serriola), revealing a total of six genetic subgroups that reflected a differentiation based on cultivar typology. Phylogenetic relationships and principal component analysis revealed a clustering of butterhead types and a general differentiation between germplasm originating from Western and Eastern Europe. To determine the potentiality of SPET for gene discovery, we performed genome-wide association analysis for main agricultural traits in L. sativa using six models (GLM naive, MLM, MLMM, CMLM, FarmCPU, and BLINK) to compare their strength and power for association detection. Robust associations were detected for seed color on chromosome 7 at 50 Mbp. Colocalization of association signals was found for outer leaf color and leaf anthocyanin content on chromosome 9 at 152 Mbp and on chromosome 5 at 86 Mbp. The association for bolting time was detected with the GLM, BLINK, and FarmCPU models on chromosome 7 at 164 Mbp. Associations were detected in chromosomal regions previously reported to harbor candidate genes for these traits, thus confirming the effectiveness of SPET for GWAS. Our findings illustrated the strength of SPET for discovering thousands of variable sites toward the dissection of the genomic diversity of germplasm collections, thus allowing a better characterization of lettuce collections.
1 Introduction
Recent years witnessed astonishing advancements in the development of cutting-edge technologies for next-generation sequencing (NGS), opening new frontiers for investigating the genomic diversity of crops (Van Treuren and van Hintum, 2014; Onda and Mochida, 2016). The availability of reference genome sequences and the progress in the field of bioinformatics made it possible to implement high-throughput genotyping methods capable of massively detecting single-nucleotide polymorphisms (SNPs). Being highly abundant across the genome and given their biallelic nature (Wendt and Novroski, 2019), SNPs offer the opportunity to be processed in automated pipelines providing a high resolution in the analysis of population structure and genetic ancestry, enabling furthermore a high-density scan of variants underlying complex traits. Different techniques for the identification of polymorphisms either in specific sites or randomly have therefore been developed. Among these, arrays based on customized oligonucleotide (allele-specific) probes hybridized on solid supports (Tripodi, 2022) offer an efficient technology combining a robust allele calling rate with lower investments in terms of library preparation and downstream bioinformatic analyses. However, arrays are affected by ascertainment bias due to the non-arbitrary sampling of polymorphisms and to the low representativeness of samples used to design the SNP panel leading to the exclusion of rare alleles (You et al., 2018). Furthermore, they are not flexible in terms of upgrades, requiring significant costs to increase the throughput.
The possibility to curtail the complexity of genomes and apply NGS, increasing read depth in determined genomic regions, enabled the development of reduced-representation library based-methods (RRL) (Van Tassell et al., 2008). Among these, genotyping by sequencing (GBS) and restriction site-associated DNA sequencing (RAD-seq) have been the most attractive and affordable options for genome-wide SNP discovery and genotyping (Poland and Rife, 2012; Pante et al., 2015). These methods rely on the use of endonucleases to produce short restriction fragments that, after various steps including adaptor ligation, size selection, and amplification, are sequenced providing the frame for SNP discovery (Deschamps et al., 2012; Kim et al., 2016a; Kim et al., 2016b). Despite the potentialities for developing numerous SNPs in comparison to other genotyping methods (e.g., microsatellites and arrays) and the advantage of a minor ascertainment bias, the main drawback of both GBS and RAD-seq is the uneven distribution of endonuclease cutter sites in the genome (Peterson et al., 2014). The untargeted detection reduces the possibility to identify polymorphisms within functionally relevant chromosomal regions. Indeed, single genes, gene families, promoters and enhancers, gene clusters, and non-coding genes are the genomic fractions that probably contain polymorphisms that are causative of, or tightly associated with, phenotypic variability.
To enable a more targeted approach on functional diversity, NuGEN Inc. (San Carlos, CA, USA) developed single primer enrichment technology (SPET, Patent US9650628B2) (Amorese et al., 2013), a novel customized and cost-effective technology based on Allegro Targeted Genotyping (Lovci et al., 2018). SPET offers the possibility to perform targeted genotyping of known polymorphisms and to discover new random polymorphic loci, thus combining the benefits of both arrays and RRLs (Scaglione et al., 2019). The technology relies on the previous identification of the sites to be sequenced holding the polymorphisms. Based on information gathered from reference genomes or transcriptomes, the target sites are selected, and short DNA probes of ~40 bases long are designed in the adjacent regions. In addition to sequencing of target sites, the probes enable the detection of closely linked novel polymorphisms within the area surrounding the target. Because it uses single primers, the panel design is straightforward, thus enabling a high capability of multiplexing. The tailored design allows SPET to have superior reproducibility and transferability when compared to the other RRL genotyping methods. In plants, SPET has been applied in maize (Zea mays L.), black poplar (Populus nigra L.) (Scaglione et al., 2019), oil palm (Elaeis guineensis Jacq.) (Herrero et al., 2020), cultivated and wild species of tomato and eggplant (Solanum spp.) (Barchi et al., 2019), and peach (Prunus armeniaca L.) (Baccichet et al., 2022), showing the power of this method for genotyping germplasm collections and crossing populations. Applications included population structure analyses, phylogenetic investigations, high-density linkage map development, and association mapping analysis.
Cultivated lettuce (Lactuca sativa L.) is a commercially important crop belonging to the Compositae (Asteraceae), one of the largest angiosperm families comprising over 1,800 genera and 24,000 species (WFO Plant List, 2023). It is considered a main leafy vegetable, widely appreciated by consumers for the content of fibers and the low-calorie intake (Kim et al., 2016). It also represents a good source of vitamin C, iron, folate, and different health-beneficial bioactive compounds (Kim et al., 2016). Its production in 2020 was estimated to be 27.6 million tons on an area of 1.2 million hectares (FAOSTAT, 2023). The genus Lactuca comprises approximately 100 species, of which L. sativa and its wild progenitor L. serriola, both part of the primary gene pool, represent over 90% of the accessions held in genebanks (van Treuren et al., 2012). Cultivated accessions can be classified into diverse horticultural types based on the morphological characteristics of leaves and stems (Simko, 2009). Lettuce germplasm diversity has been explored using different molecular tools including microsatellites (Simko, 2009; Rauscher and Simko, 2013), anonymous and targeted PCR-based markers (van Treuren and van Hintum, 2009), arrays (Stoffel and van Leeuwen, 2012), and RRLs (Seki et al., 2020; Park et al., 2021; Park et al., 2022) to study genetic relationships within and among horticultural types. In the past few years, several genomic resources have been released including the first draft of the lettuce genome (cv. Salinas) (Reyes-Chin-Wo et al., 2017) and the resequencing of 445 accessions including cultivated lettuce and 12 wild Lactuca species (Wei et al., 2021), providing a useful source for assessing and exploiting germplasm diversity through novel marker discovery. The possibility to implement both genomic and phenotypic information in genome-wide association studies (GWAS) paves the way to dissect the genetic basis of complex traits. GWAS enable the identification of genomic regions underlying the variation of traits exploiting the ancient recombination events occurring in unrelated individuals (Huang and Han, 2014). The rapid advances of NGS technologies and computational pipelines make GWAS a powerful approach for candidate gene detection in crops. In lettuce, GWAS using different genotyping platforms for SNP discovery investigated agronomic traits (Kwon et al., 2013), resistances (Lu et al., 2014), and quality-related traits (Sthapit Kandel et al., 2020; Park et al., 2021).
In the present work, we describe the development of the first SPET panel in lettuce and its application for analyzing genomic diversity and population structure. A heterogeneous collection of 160 accessions of L. sativa and L. serriola was used as a proof of concept to validate the SPET assay. We further investigated the potentiality of SPET for candidate gene identification through GWAS in four main lettuce horticultural traits. The obtained results showed the strength of SPET for lettuce genomics.
2 Materials and methods
2.1 Plant material
Plant materials consisted of 155 accessions of L. sativa and 5 of the closely related wild species L. serriola, which were part of the germplasm panel established in the frame of the ECPGR European Evaluation (EVA) Lettuce Network (ECPGR, 2023). Plant materials originated from the germplasm collections of four institutions: the Institute for Plant Genetic Resources “K.Malkov” (Sadovo, Plovdiv district, Bulgaria), the Centre for Genetic Resources, the Netherlands (CGN, Wageningen, Netherlands), the Unité de Génétique et Amélioration des Fruits et Légumes, Plant Biology and Breeding, INRAe (GAFL, Avignon, Montfavet Cedex, France), and the Nordic Genetic Resource Center (Nordgen, Alnarp, Sweden). Genotypes encompassed cultivars, breeding materials, and landraces originating from a total of 10 different countries in Europe, America, and Asia. Different horticultural types were represented (Figure 1), including Butterhead (54), Iceberg (46), Cos or Romaine (17), Batavia or Summer/French Crisp (11), Crisp (10), Loose leaf (9), Oak leaf (4), Latin (3), and Lollo (1), as well as wild L. serriola (5) (also known as prickly lettuce). A detailed list with all available information on the assayed accessions is provided in Supplementary Table 1.
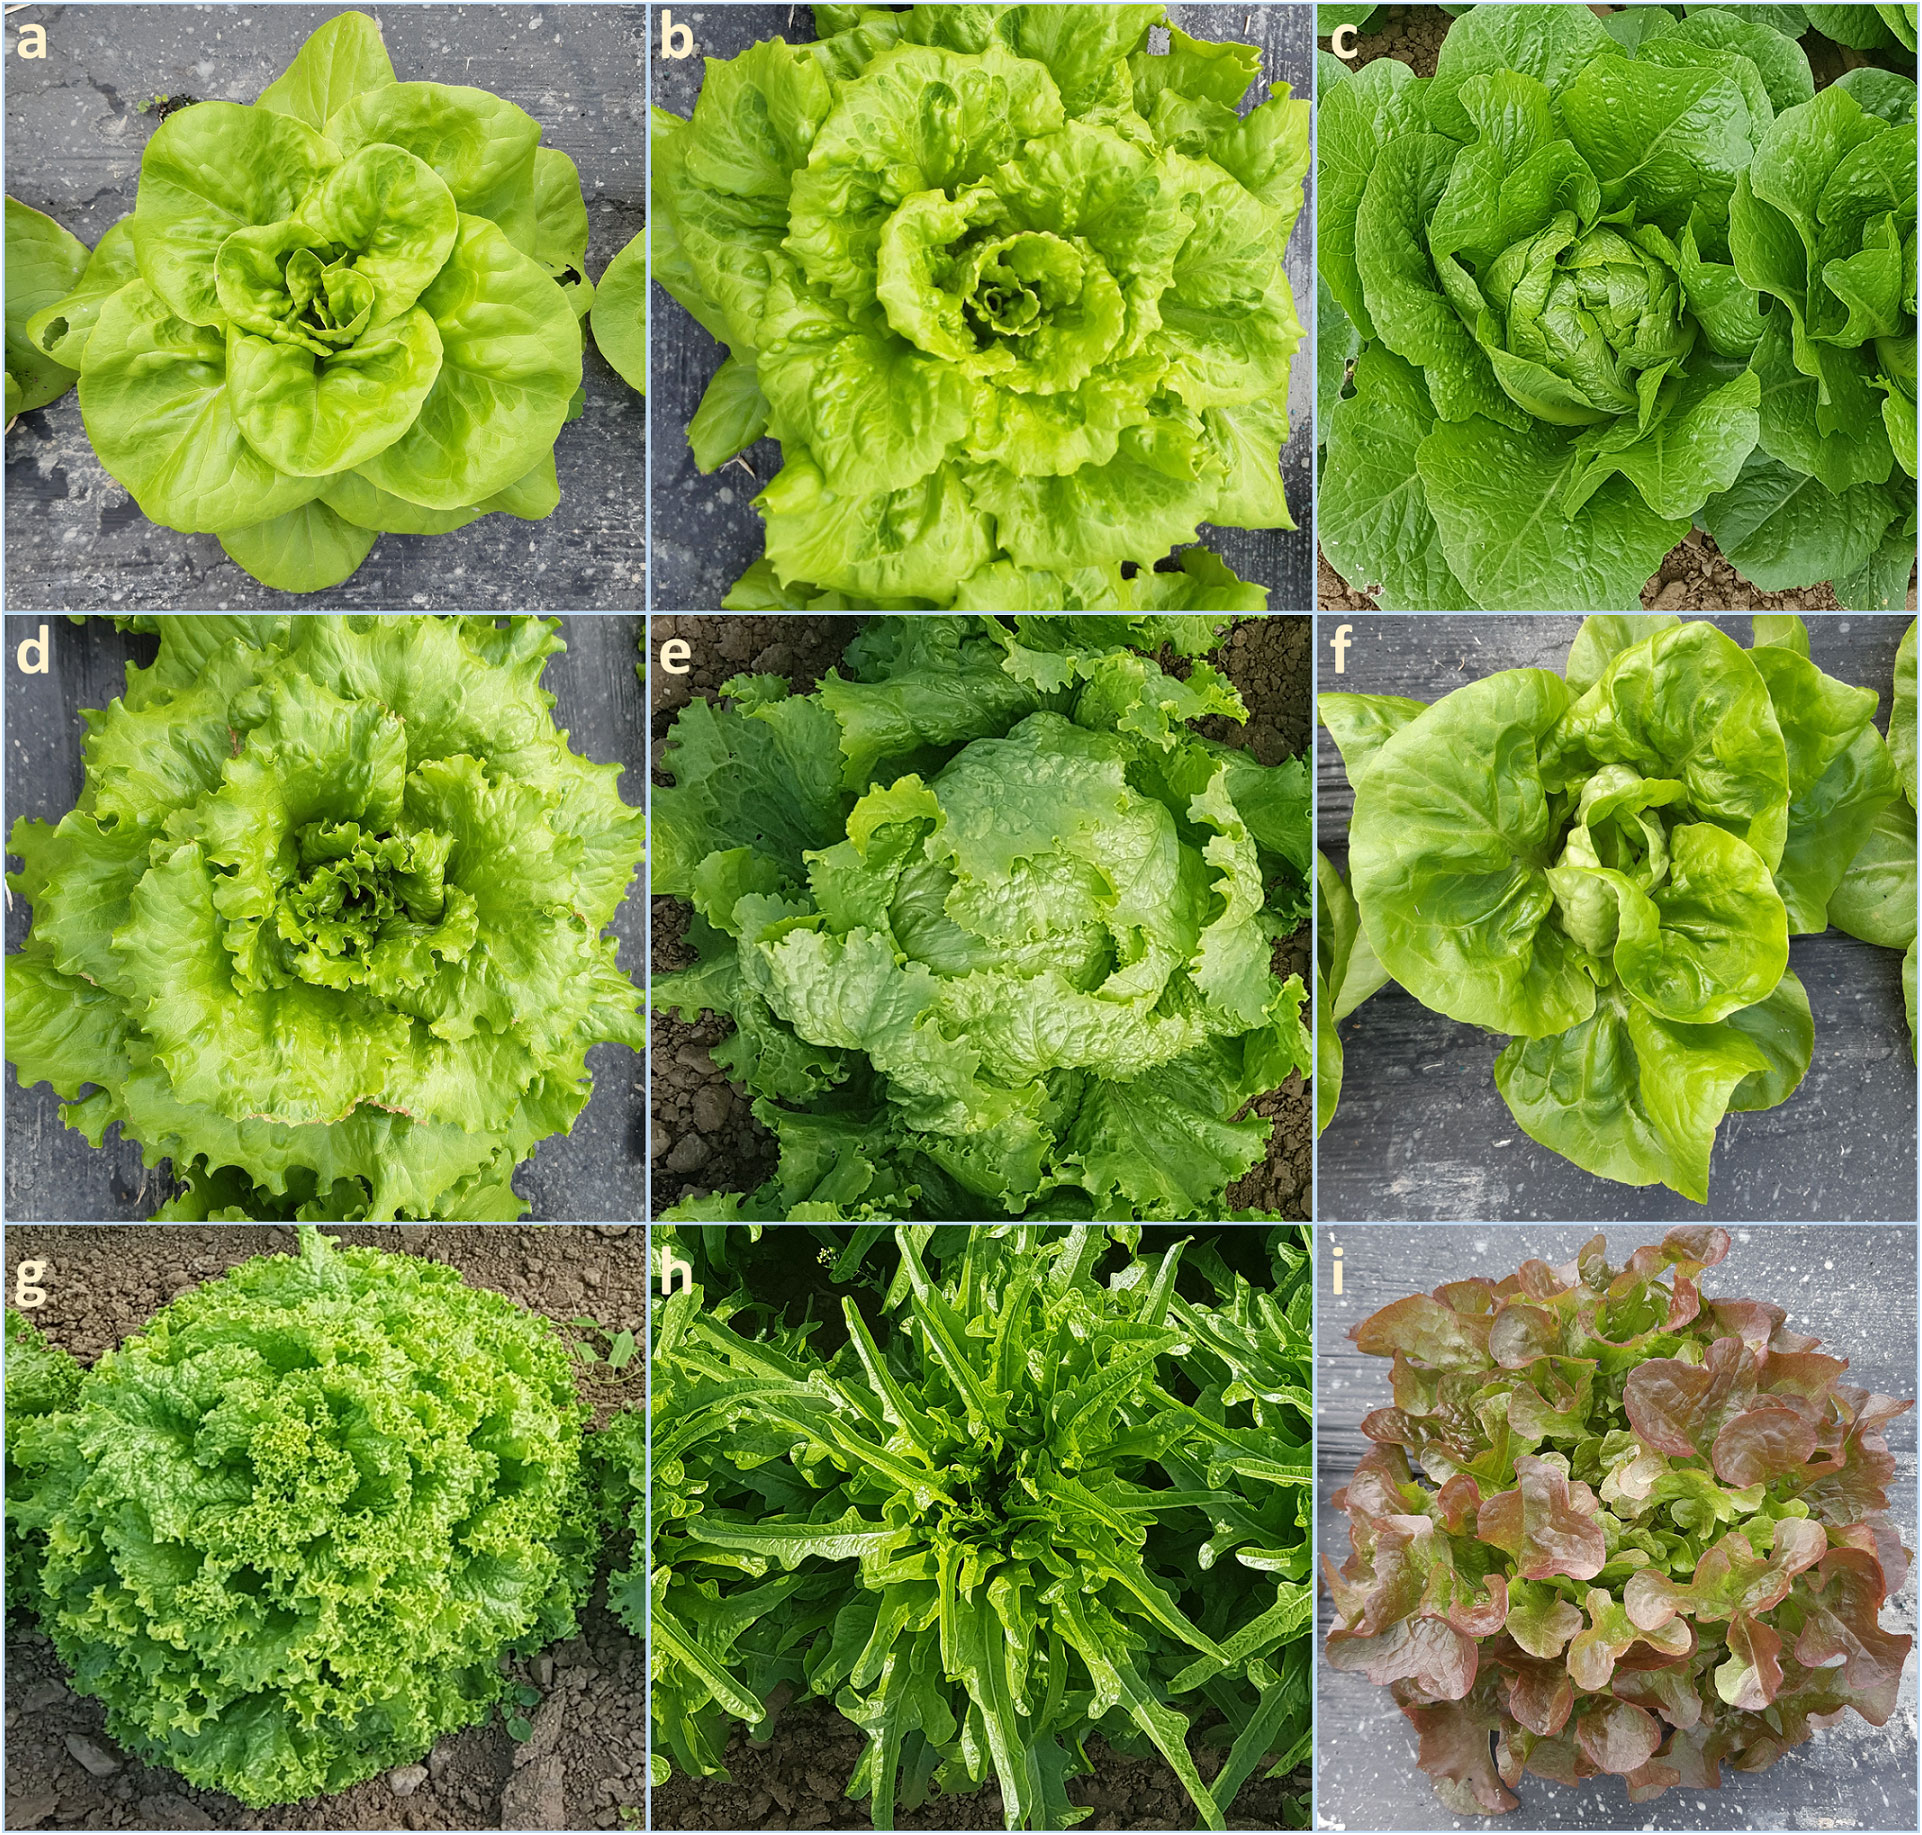
Figure 1 Lactuca sativa horticultural types considered in this study. (A) EVA_Lsa_00156, Butterhead; (B) EVA_Lsa_00166, Batavia; (C) EVA_Lsa_00094, Cos; (D) EVA_Lsa_00150, Crisp; (E) EVA_Lsa_00114, Iceberg; (F) EVA_Lsa_00184, Latin; (G) EVA_Lsa_00196, Lollo; (H) EVA_Lsa_00206, Loose leaf; (I) EVA_Lsa_00174, Oak Leaf. Photos provided by Charlotte Aichholz and Tizian Zollinger.
2.2 Single primer enrichment technology panel design
For probe design, a dataset including whole-genome resequencing data of 131 L. sativa accessions (Wei et al., 2021) was considered (Supplementary Table 2). Raw sequence data were retrieved from the FTP site of the China National Gene Bank Sequence Archive (CNSA) repository (Guo et al., 2020). Variants (SNP and INDEL separately) were selected by filtering those present in the dataset with a minimum allele count of 3 (i.e., one homozygous accession and one heterozygous or three heterozygous accessions). The lettuce reference genome (L. sativa cv Salinas V8) and its annotation were retrieved from https://lgr.genomecenter.ucdavis.edu/Home.php and all gene coordinates were extended by 5,000 bp upstream and 1,000 bp downstream. All selected genomic variants were intersected with these gene coordinates and labeled as gene-space variants. A panel of 50k target sites was then built by imposing a minimum distance of 3,000 bp for variants on the gene-space and a minimum distance of 200,000 bp in the intergenic regions. After two rounds of design, a final panel of 41,547 targets were successfully identified by unique probes. Each probe consisted of a 40-bp sequence. SNP calling was enabled 460 bp downstream of the probe.
2.3 DNA extraction, library preparation, and sequencing
Genomic DNA was isolated from young leaves of a single individual per accession using a NucleoSpin Plant II Mini kit (Macherey-Nagel GmbH & Co. KG., Düren, Germany. DNA concentration was measured using the Qubit 2.0 Fluorometer (Thermo Fisher Scientific, Waltham, MA, USA). Libraries were prepared using the “Allegro Targeted Genotyping” protocol from NuGEN Technologies (San Carlos, CA), using 10 ng/μl of DNA as input and following the manufacturer’s instructions. Libraries were quantified using the Qubit 2.0 Fluorometer, and their size was checked using the High-Sensitivity DNA assay from Bioanalyzer (Agilent technologies, Santa Clara, CA) or the High-Sensitivity DNA assay from Caliper LabChip GX (Caliper Life Sciences, Alameda CA). Libraries were quantified through qPCR using the CFX96 Touch Real-Time PCR Detection System (Bio-Rad Laboratories, Hercules, CA) and sequenced on the Illumina NovaSeq 6000 (Illumina, San Carlos, CA).
2.4 Sequence analysis and SNP detection
Demultiplexing of raw sequencing data and base calling (BCL files into FASTQ files) were performed with the Illumina bcl2fastq2 Conversion Software v2.20 (Illumina, San Carlos, CA). Read quality check and adapter trimming were carried out using ERNE v1.4.6 (Del Fabbro et al., 2013) and Cutadapt (Martin, 2011), both with default parameters. Alignment to the reference genome L. sativa cv Salinas V8 (Reyes-Chin-Wo et al., 2017) was done using the Burrows–Wheeler Aligner BWA-MEM v0.7.17 (Li and Durbin, 2009) with default parameters and selection of uniquely aligned reads (i.e., reads with a mapping quality >10). SNP calling was obtained using gatk-4.0 (DePristo et al., 2011) following the software best practices for germline short variant discovery. SNP calling was limited to the regions (460 bp) that were previously defined as downstream of each enrichment probe.
All analyses were implemented in GATK Best Practices v4.1.2.0 (Van der Auwera and O'Connor, 2020) and included the following steps: (i) per-sample variants calling on target regions using HaplotypeCaller with default parameters to create a GVCFs file for each sample; (ii) GVCFs consolidation across multiple samples using GenomicsDBImport with default parameters and target intervals in order to improve scalability and speed for further joint genotyping; (iii) joint genotyping using GenotypeGVCFs with default parameters to produce a set of joint-called variants; (iv) Selection of SNPs using SelectVariants and quality filtering of SNPs using VariantFiltration (filter expression used: QD< 2.0 || MQ< 40.0 || MQRankSum< −12.5). A 1,911,467 biallelic SNPs matrix was obtained. The extra filtration of the VCF was performed with bcftools by setting all data points with fewer than five reads in coverage to a missing data genotype (./.) and retaining only records where a minimum of 96 samples reported a coverage above 10 reads. In total, 835,426 SNPs were obtained. For downstream analysis, 81,531 SNP sites were retained with minor allele count = 3, max missing 0.5, minQ = 30, and minor allele frequency = 5%. VCFtools version 0.1.17 (Danecek et al., 2011) was used. Pattern of nucleotide diversity (p) was estimated in non-overlapping sliding windows with a size of 1 kbp in VCFtools. Functional annotation of the identified variants associated genes was performed using SnpEff (version 3.1) (Cingolani, 2022).
2.5 Genomic diversity analysis
Genetic diversity summary of the SNP matrix was performed by the Geno Summary tool implemented in Tassel v5.2.15 (Bradbury et al., 2007). Considering the biallelic nature of SNPs, expected heterozygosity according to Hardy–Weinberg equilibrium (H) was calculated according to the formula
where p and q each represent the frequency of the different alleles for each SNP.
The polymorphic information content (PIC) was calculated according to the formula (Shete et al., 2000)
Population structure was determined using the model-based ancestry estimation obtained with ADMIXTURE software (Alexander et al., 2015) with K ranging from 1 to 15. One thousand bootstrap replicates were run to estimate parameter standard errors. Tenfold cross-validation (CV) procedure with five iterations was performed, and CV scores were used to determine the best K value. Individuals were considered to belong to a specific K population if its membership coefficient (qi) was ≥0.5, whereas the genotypes with qi lower than 0.5 at each assigned K were considered as admixed. A neighbor-joining phylogenetic tree was built using the Jones–Taylor–Thornton (JTT) model with 1,000 bootstraps. Analyses were conducted in MEGA X software (Kumar et al., 2018). Principal component analysis (PCA) was performed in Tassel v5.2.15 and the biplot was drawn using the ggplot2 R package (Wickham, 2016).
2.6 Phenotypic evaluation
The phenotypic traits were surveyed across five locations (Eyragues, Avignon, France; La Ménitré, France; Les Evouettes, Port-Valais, Switzerland; Rheinau, Switzerland; and Thessaloniki, Greece) during the 2020–2022 spring seasons. Plants were grown in a randomized block design with three replicates. Field trials were conducted using the standard agricultural practices for the local area of cultivation. Four traits were assayed including (i) seed color (1 = white/cream, 2 = yellow, 3 = brown, 4 = black), (ii) outer leaf color before bolting stage (1 = yellow green, 2 = green, 3 = gray green, 4 = blue green, 5 = red green), (iii) leaf anthocyanin content before bolting stage (0 = absent, 3 = weak, 5 = medium, 7 = strong), and (iv) bolting time (number of days from sowing to bolting).
2.7 Genome-wide association analysis
Genome-wide association analysis was performed in 155 L. sativa genotypes. Six models were used including the general linear model (GLM) (Loley et al., 2013), the mixed linear model (MLM) (Zhang et al., 2010), the multi-locus mixed linear model (MLMM) (Segura et al., 2012), the compressed mixed linear model (CMLM) with population parameters previously defined (P3D) (Zhang et al. in 2010), the fixed and random model circulating probability unification model (FarmCPU) (Liu et al., 2016), and the Bayesian-information and Linkage-disequilibrium Iteratively Nested Keyway model (BLINK) (Huang et al., 2019). All models included the population structure as a covariate. The kinship was estimated using the identity by state (IBS) for accounting relationships among individuals. Phenotypic data from independent experiments were implemented. The significance threshold for marker–trait association was determined after Bonferroni multiple test correction with genome-wide α = 0.05. Considering 81,531 SNPs, the marker was considered significant when the p-value was less than 6.212 (−log10P = 6.133 × 10⁻⁷). GLM and CMLM were computed in Tassel v 5.2.82 (Bradbury et al., 2007). MLM, MLMM, FarmCPU, and BLINK were calculated with the GAPIT R package (Wang and Zhang, 2021). Manhattan and quantile–quantile (Q–Q) plots for GWAS results were produced using the R package CMplot. The chromosomal location of the genome-wide significantly associated SNPs was displayed using PhenoGram (https://ritchielab.org/software/phenogram). Significant association signals were checked for their physical position on the L. sativa (cv. Salinas) V8 genome. The information about predicted genes was downloaded from the Lettuce genome browser v8.0 (https://phytozome-next.jgi.doe.gov/jbrowse/). Underlying genes and their functions were determined according to Reyes-Chin-Wo et al. (2017).
3 Results
3.1 SPET array
Based on SNP data retrieved from 131 lettuce raw sequences (Wei et al., 2021) and on the alignment to reference genome L. sativa cv Salinas V8, 41,547 probes were designed, of which 1,707 (4.1%) were localized in intergenic regions and 39,840 (95.9%) within genes (Supplementary Table 3). The average coverage of the total set of probes was 77.1×; for those located within intergenic regions, 93.4×; and for those within genes, 76.6× (Supplementary Figure 1). The SPET panel showed an average distribution of one probe per 55.5 kilobase pair (kbp). Regarding inter-probe distance, 27% of the probes were more than 50 kbp apart, while the largest gap was 3.2 mega base pair (Mbp) on chromosome 3 (Figure 2). The sequencing of SPET libraries in the 160 study samples produced a total of 668,695,867 paired end raw reads corresponding to an average of 4,179,349 read pairs per sample ranging from 2,000 to 21 million and a mean depth of 79.7× (Supplementary Table 4). The mapping rate on the whole genome was on average 88%, and only eight samples had an average below 70% (Supplementary Figure 2).
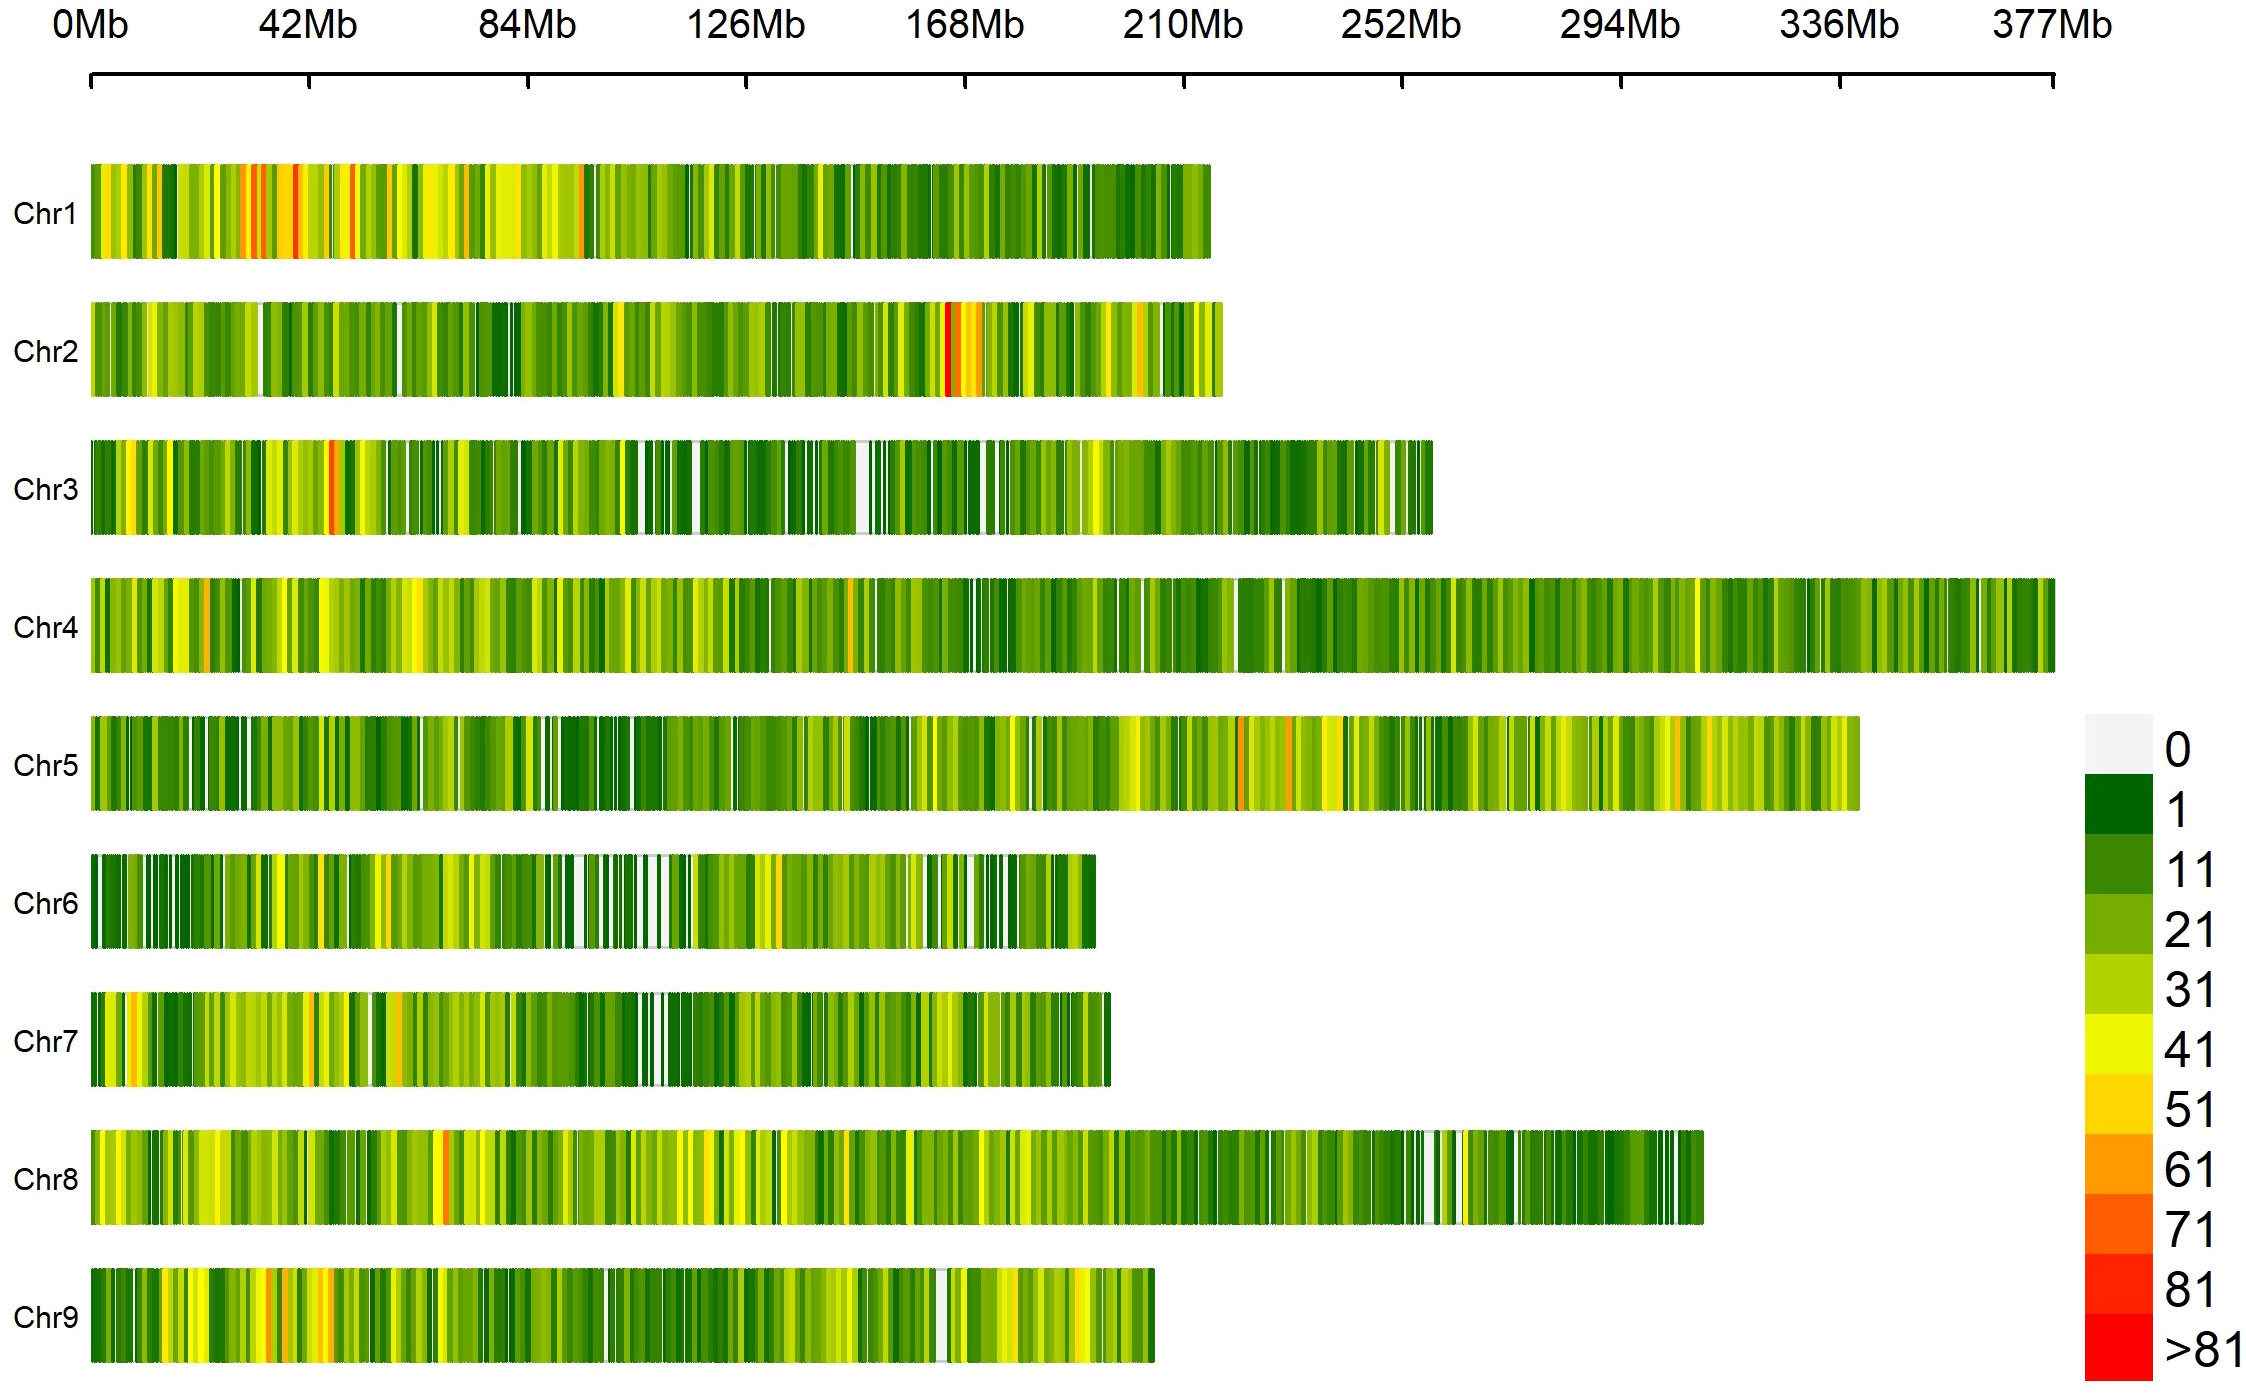
Figure 2 Distribution of 41,547 SPET probes on the nine lettuce chromosomes. The number of SNPs is represented within 1 Mb window size. The horizontal axis shows the chromosome (Chr) length (Mb); each bar represents a chromosome, with Chr 1 at the top and Chr 9 at the bottom. The different colors depict SNP density following the gradient in the legend on the right.
By applying stringent filtering criteria, we identified 81,531 SNPs ranging from 5,291 on chromosome 6 to 13,920 on chromosome 4 (Table 1). SNPs were predominantly located within transcript regions, covering over 65% of the gene space in all chromosomes. SNP effect analysis showed that the majority of SNPs (88.08%) have a possible modifier effect, while the rest exhibited low (6.96%), moderate (4.82%), and high (0.14%) impacts (Supplementary Table 5). Within gene space, SNPs were mostly localized in upstream and downstream gene regions (27.45% and 16.27%, respectively). SNPs in exons and introns were 11.37% and 7.47%, respectively (Supplementary Figure 3). The average density corresponded to one SNP every 28.99 kbp across the nine chromosomes, ranging from 21.48 kbp on chromosome 1 to 36.35 kbp on Chr 6. Across the whole set, PIC values ranged from 0.033 to 0.375 (data not shown) with a mean of 0.240. The minimum average PIC value was encountered on Chr 6 (0.226), while the maximum value was found in Chr 2 (0.258). Chr 6 and Chr 2 exhibited the lowest and highest nucleotide diversity with 4.681e-4 and 6.459e-4, respectively. On average, heterozygosity was 0.292, reaching values above 0.300 only on chromosomes 2 and 5. The observed transitions/transversions ratio was 2.12 (Supplementary Figure 4A). In particular, among transition events, C > T and G > A were the most abundant (18.697% and 18.225%, respectively), whereas C > A and A > T abounded within transversion events (4.826% and 4.506%, respectively). The allele content of the SNP matrix was balanced, being on average represented for 70% by the four nucleotide bases in homozygosity state (Supplementary Figure 4B).
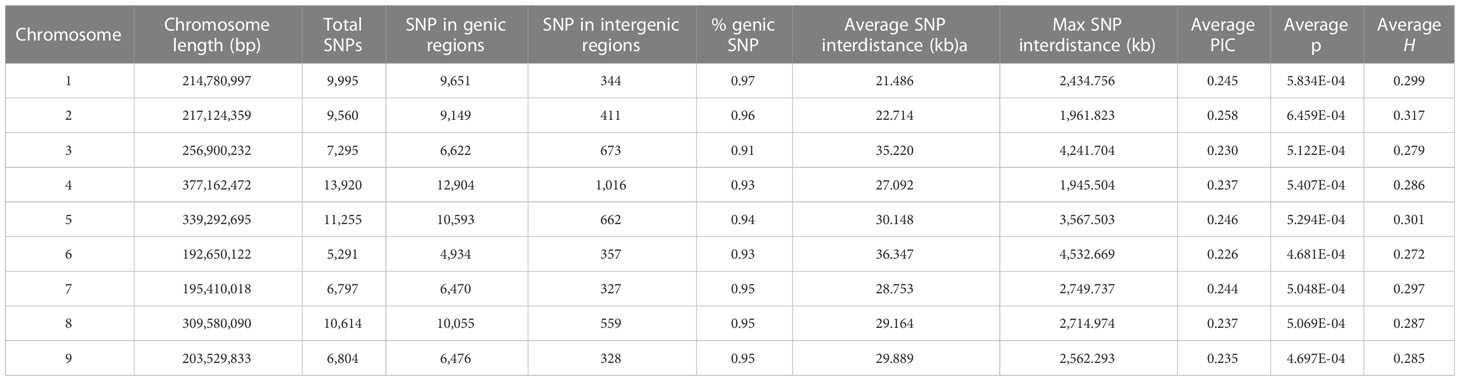
Table 1 SNP number, distribution in intergenic and genic regions, average distance for each chromosome, polymorphic information content (PIC), nucleotide diversity (π), and heterozygosity (H).
3.2 Genomic diversity and population structure
An admixture-based clustering model implemented in the software ADMIXTURE (Alexander et al., 2015) was used to infer the genetic structure of the studied germplasm. Using the entire SNP dataset, results of CV error suggested six different clusters (Supplementary Figure 5) representing the most likely number of subpopulations (K) (Figure 3).
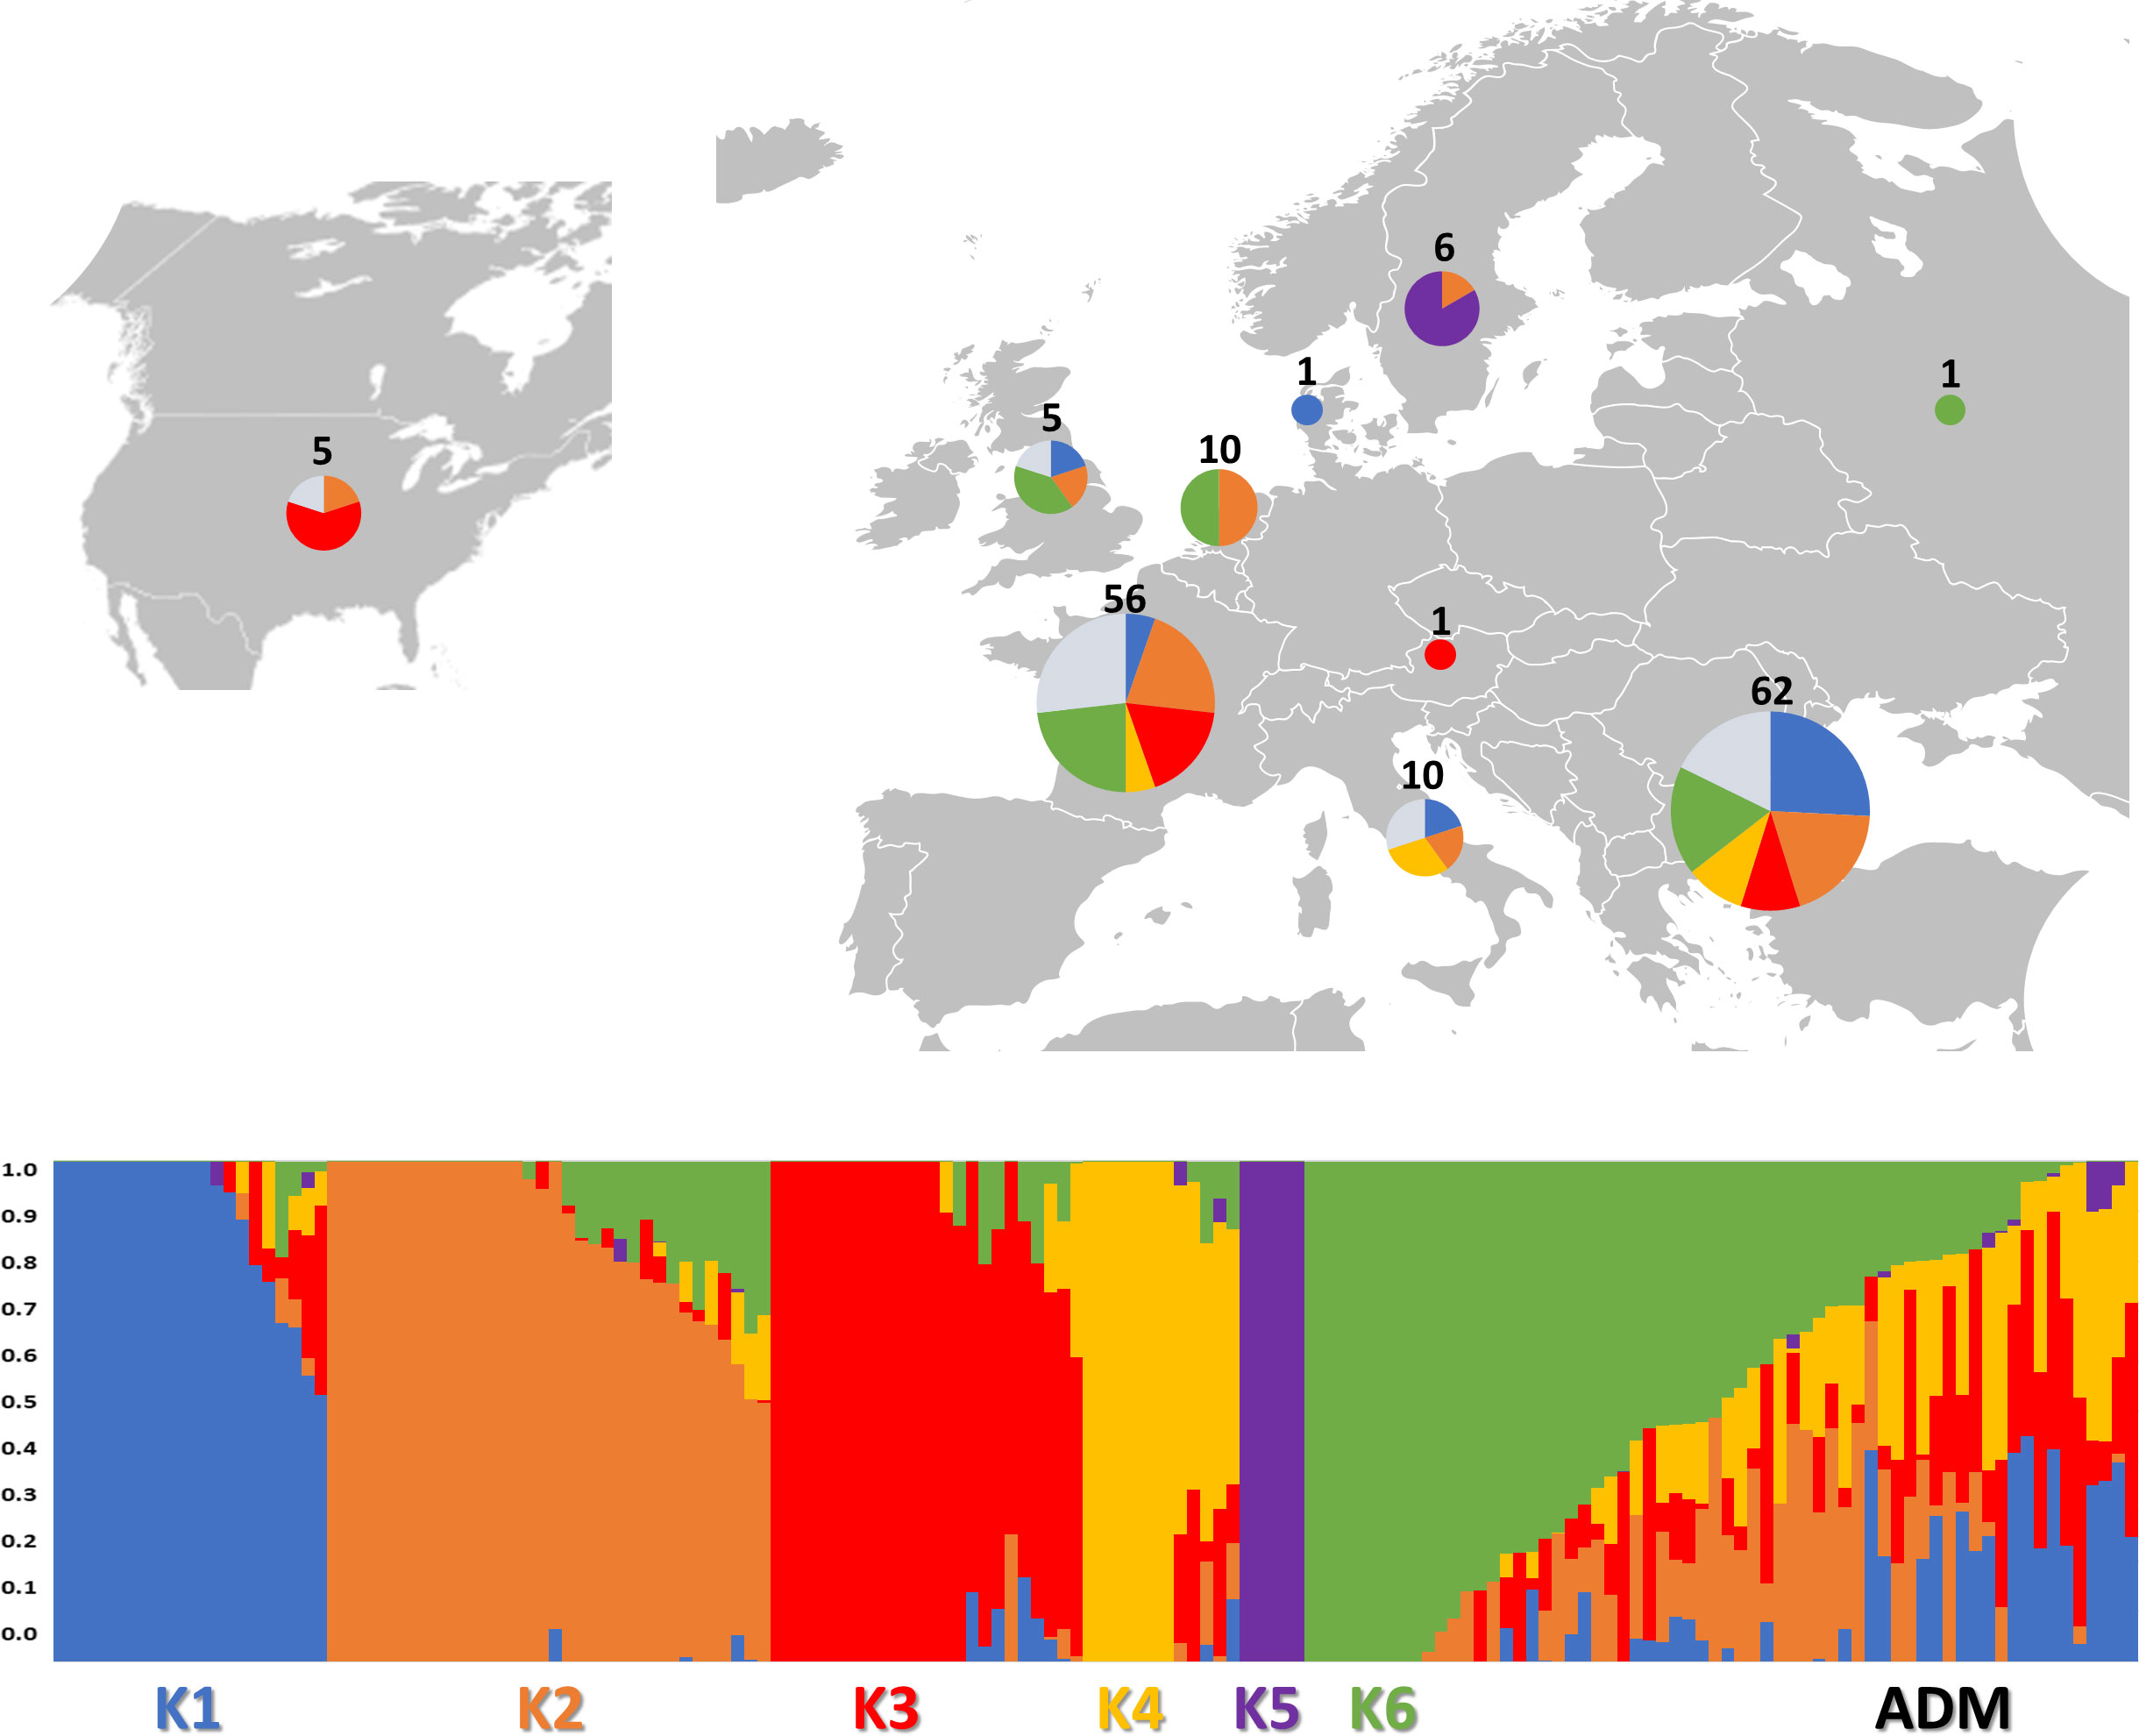
Figure 3 Genetic structure of the 160 study samples using 81,531 SNPs from SPET analysis. On the top: the geographical distribution of the germplasm studied and its subdivision according to the observed K groups; in the pie chart, the proportion of admixed accessions is indicated in ice blue color. On the bottom: bar plot describing the population admixture by the Bayesian approach. Each individual is represented by a thin vertical line, which is partitioned into K-colored segments whose length is proportional to the estimated membership coefficient (q). The population was divided into six (K = 6) groups according to the most informative K value.
The subpopulations reflected to some extent a differentiation based on cultivar typology rather than country of provenance (Figure 3; Supplementary Table 6). The first cluster (K1) grouped 21 accessions, mostly Iceberg and Cos lettuce types from Bulgaria. Butterhead were mostly grouped in clusters 2 (K2) and 6 (K6) and represented 62% and 67% of the total individuals within each cluster, respectively. The subpopulation 3 (K3) included several Batavia and Crisp types whereas Oak leaf types were included in cluster 4 (K4) together with Iceberg and Loose leaf types. Among the different cultivar types, Iceberg accessions were clustered in several subpopulations. Lactuca serriola accessions were grouped separately from the rest in a distinct group (K = 5). Thirty-two accessions belonging to 8 out of the 10 considered cultivar types were classified as admixed, as they showed values for the highest cluster membership coefficient (qi) lower than 0.5. The Fixation Index (FST) values, measuring the population (K) differentiation based on SNP data, are reported in Table 2.
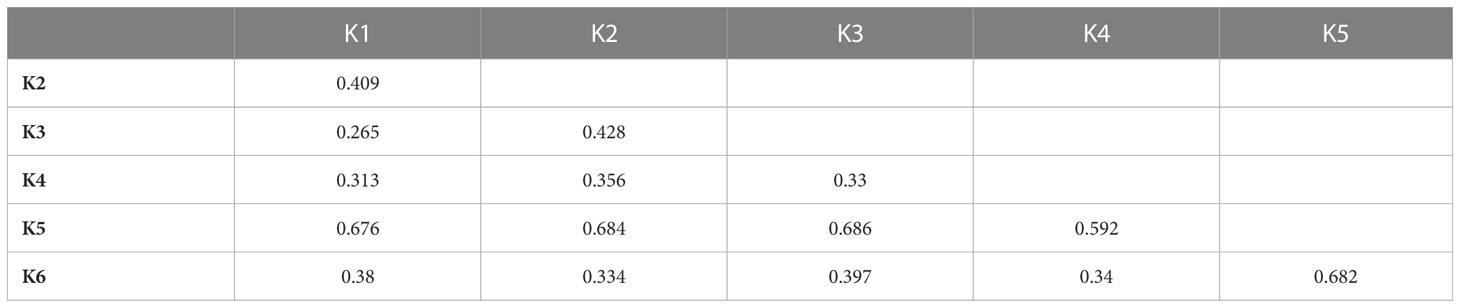
Table 2 FST values between populations inferred from a model-based ancestry estimation through the ADMIXTURE analysis.
The highest FST values were found between K5 and the other subpopulations, thus confirming the differentiation of the wild L. serriola from the cultivated L. sativa. The lowest divergence was found between clusters 1 and 3 (FST = 0.265) mostly comprising the same type of cultivars. Considering the average q-value at K = 6 (Figure 4), the analysis showed how among the most represented cultivars, iceberg types were included in five out of the six detected clusters while butterheads were included in clusters 2, 3, and 6. Batavia, Crisp, and Lollo as well as Loose and Oak leaf types were mostly represented by clusters 3 and 4, respectively. The average heterozygosity of the accessions was on average lower than 4% in all cultivated variety groups (Figure 5). Prickly lettuce accessions showed an average heterozygosity of 4.69% with values ranging from 4.64% to 4.99%. The same trend was observed among different subpopulations based on admixture analysis (data not shown). Twelve accessions belonging to Butterhead (7) and Iceberg (5) exhibited heterozygosity higher than 5% with values up to 6.61% (Butterhead) and 10.08% (Iceberg). Only a single accession, representing the Cos horticultural type, showed a relatively high heterozygosity of 16.11%.
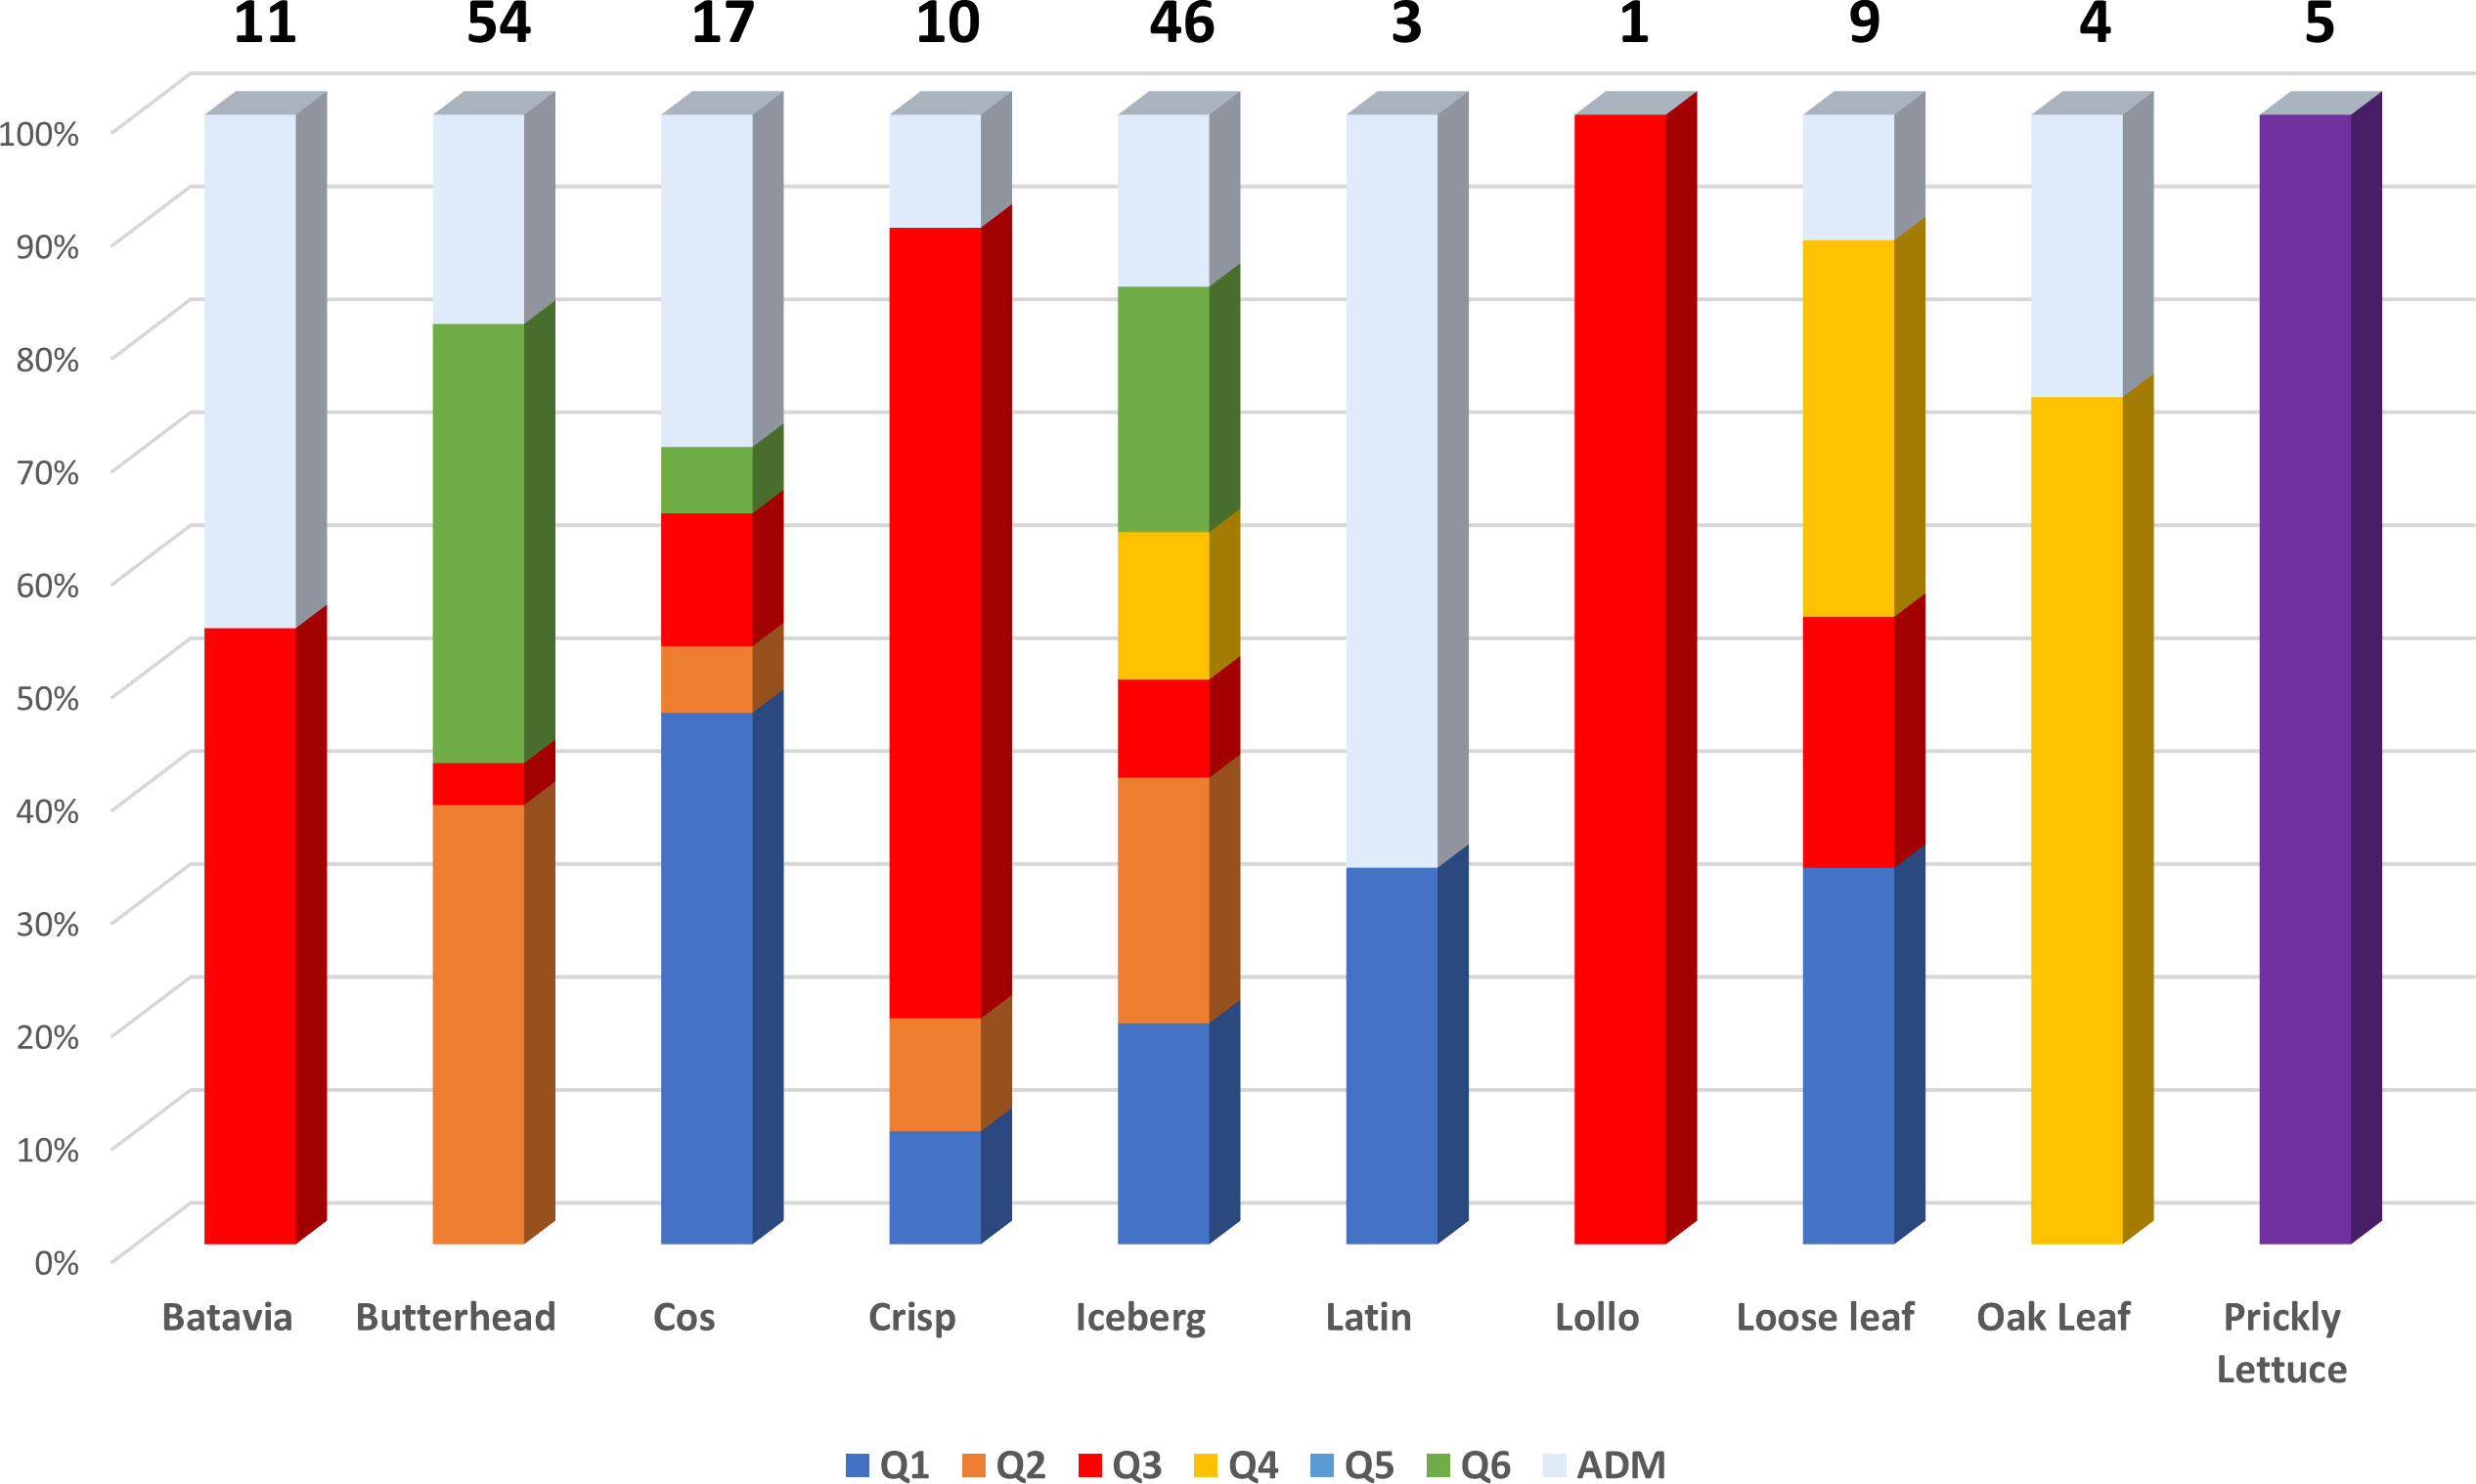
Figure 4 Stacked bar chart of the allele frequency based on Q membership coefficient at K = 6. For each cultivar group, the number of accessions is indicated above each bar.
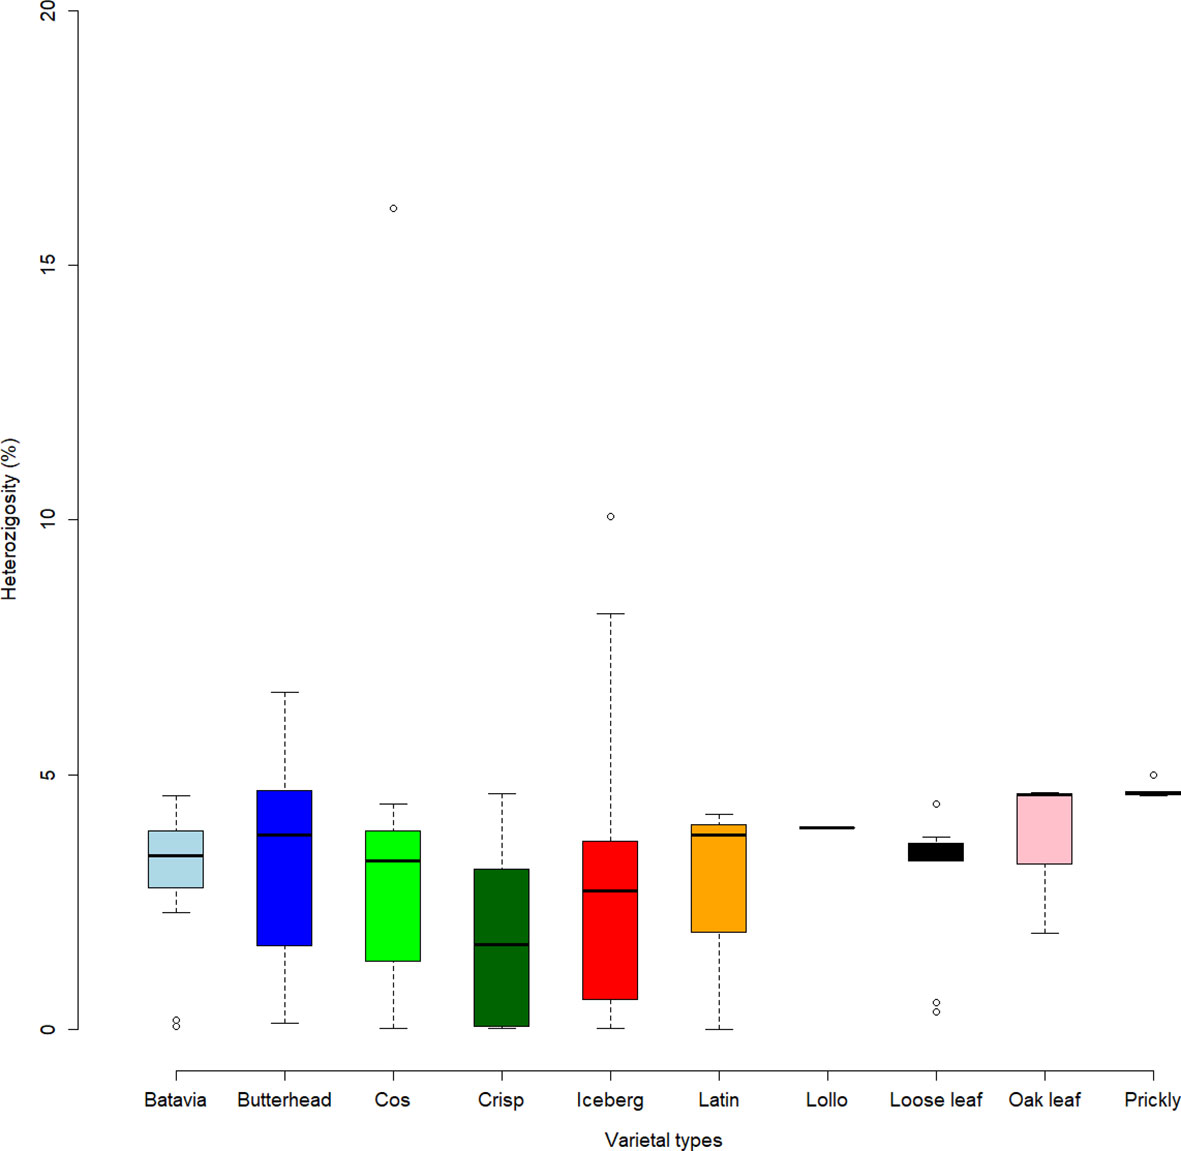
Figure 5 Heterozygosity level (in percentage) of the lettuce accessions. Box plots show median values and quartiles (first and third) of accessions considering the different varietal types.
3.3 Genetic relationships among accessions
Phylogenetic clustering and PCA were performed to find patterns of genetic variation among accessions. The phylogenetic network using the neighbor-joining method was generally in agreement with Admixture analysis. Two main subpopulations were detected. Group I mostly included butterhead types (Figure 6A) from the clusters K2 and K6 (Figure 6B).
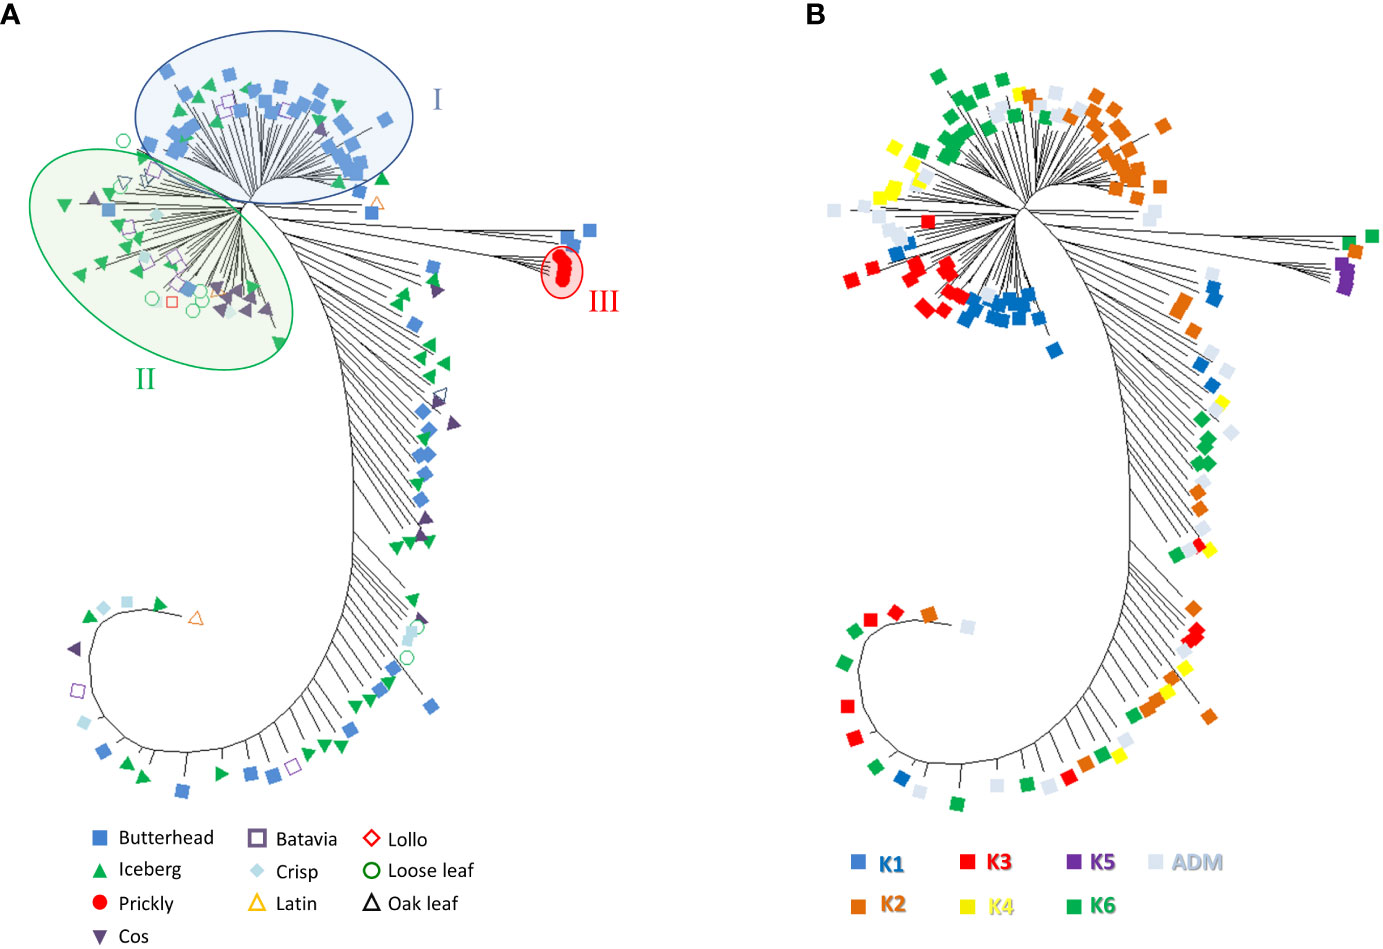
Figure 6 Neighbor-joining phylogenetic tree (radiation style) using 81,531 SNPs from SPET analysis. The evolutionary distances were computed using the Jones–Taylor–Thornton (JTT) model with 1,000 bootstraps. (A) Tree with annotated species and horticultural type. (B) Tree with annotated grouping revealed by the population structure analysis.
Group II consisted of several icebergs, loose leaf, and cos types from clusters K1, K3, and K4 (Figures 6A, B). All prickly lettuce (L. serriola) genotypes were grouped closely together according to the cluster K5. The distribution of the accessions in the PCA bi-plot graph corroborated population structure analysis highlighting, among L. sativa accessions, a clustering of butterhead types compared to the rest (Figure 7A). Prickly lettuce genotypes were grouped apart on the second component, thus confirming the observed subpopulation in the ancestry analysis. A slight differentiation between French and Bulgarian germplasm was observed. Interestingly, several close relationships were found between Italian and Bulgarian accessions. Although more admixtures were found when the geographical provenance was considered, a general differentiation was observed between germplasm retrieved from Western and Eastern Europe (Figure 7B).
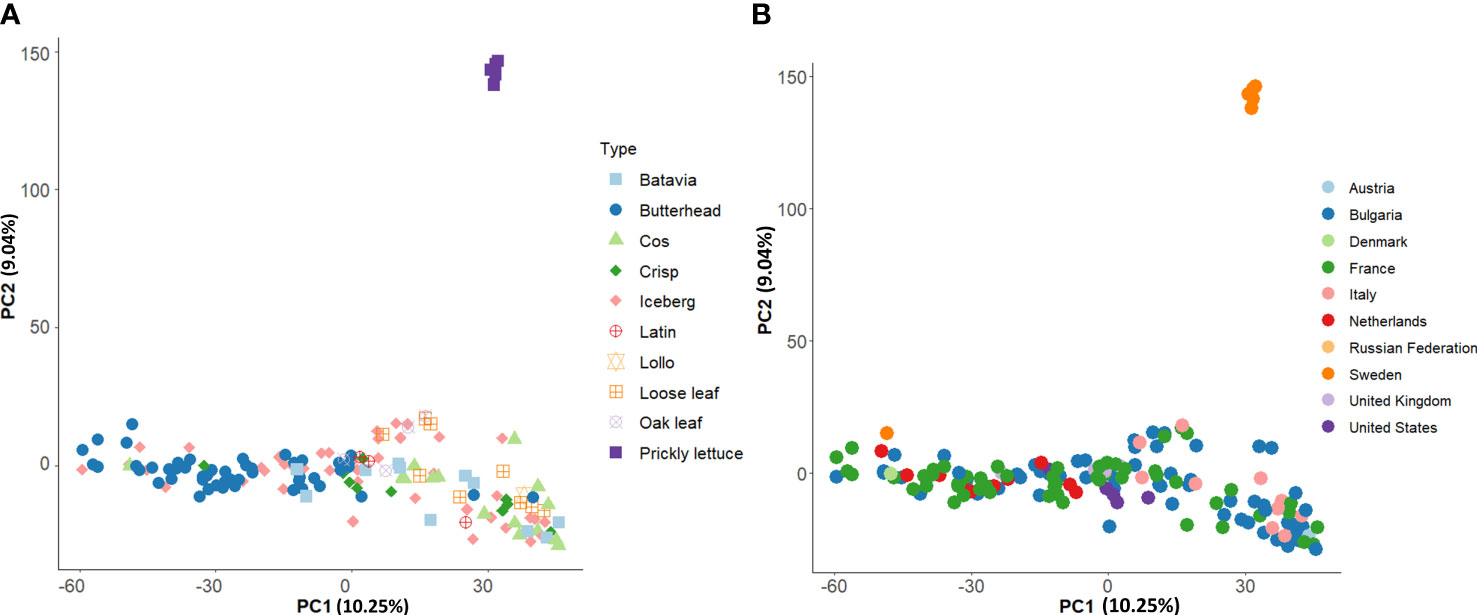
Figure 7 Loading plot in the first two components, showing the genomic diversity of the 160 studied accessions. The PCA was computed with 81,531 SNPs. (A) PCA with annotated species and horticultural types. (B) PCA with annotated country of origin.
3.4 Genome-wide association analysis
Genome-wide association scans using six models detected a total of 306 significant SNP–trait associations (STA) (Supplementary Table 7) distributed across all chromosomes except for chromosome 6. The majority of STA were detected for seed color and leaf anthocyanin content: 133 and 117, respectively. Fifty-eight percent of associations were identified with the GLM, whereas among the five multi-locus models used, MLM and CMLM highlighted the highest number of association signals. Only for bolting time was no association found with multivariate models, except FarmCPU. Considering all models, chromosomes 5, 7, and 9 held over 94% of the STA, showing further several colocalizations. Manhattan plots showing the associations, their chromosomal positions, and Bonferroni threshold are shown in Figure 8, and Q–Q plots for multi-model GWAS and physical position of STA are shown in Figure 9. Two main clusters were found for leaf anthocyanin content and outer leaf color in a 160-kb region at 86 Mbp on chromosome 5 as well as in a 2-Mbp region at 150–152 Mbp on chromosome 9. Furthermore, different significant SNPs were detected on chromosome 7 for seed color in a 3-Mbp region at 49–52 Mbp position and for bolting time at 164 Mbp.
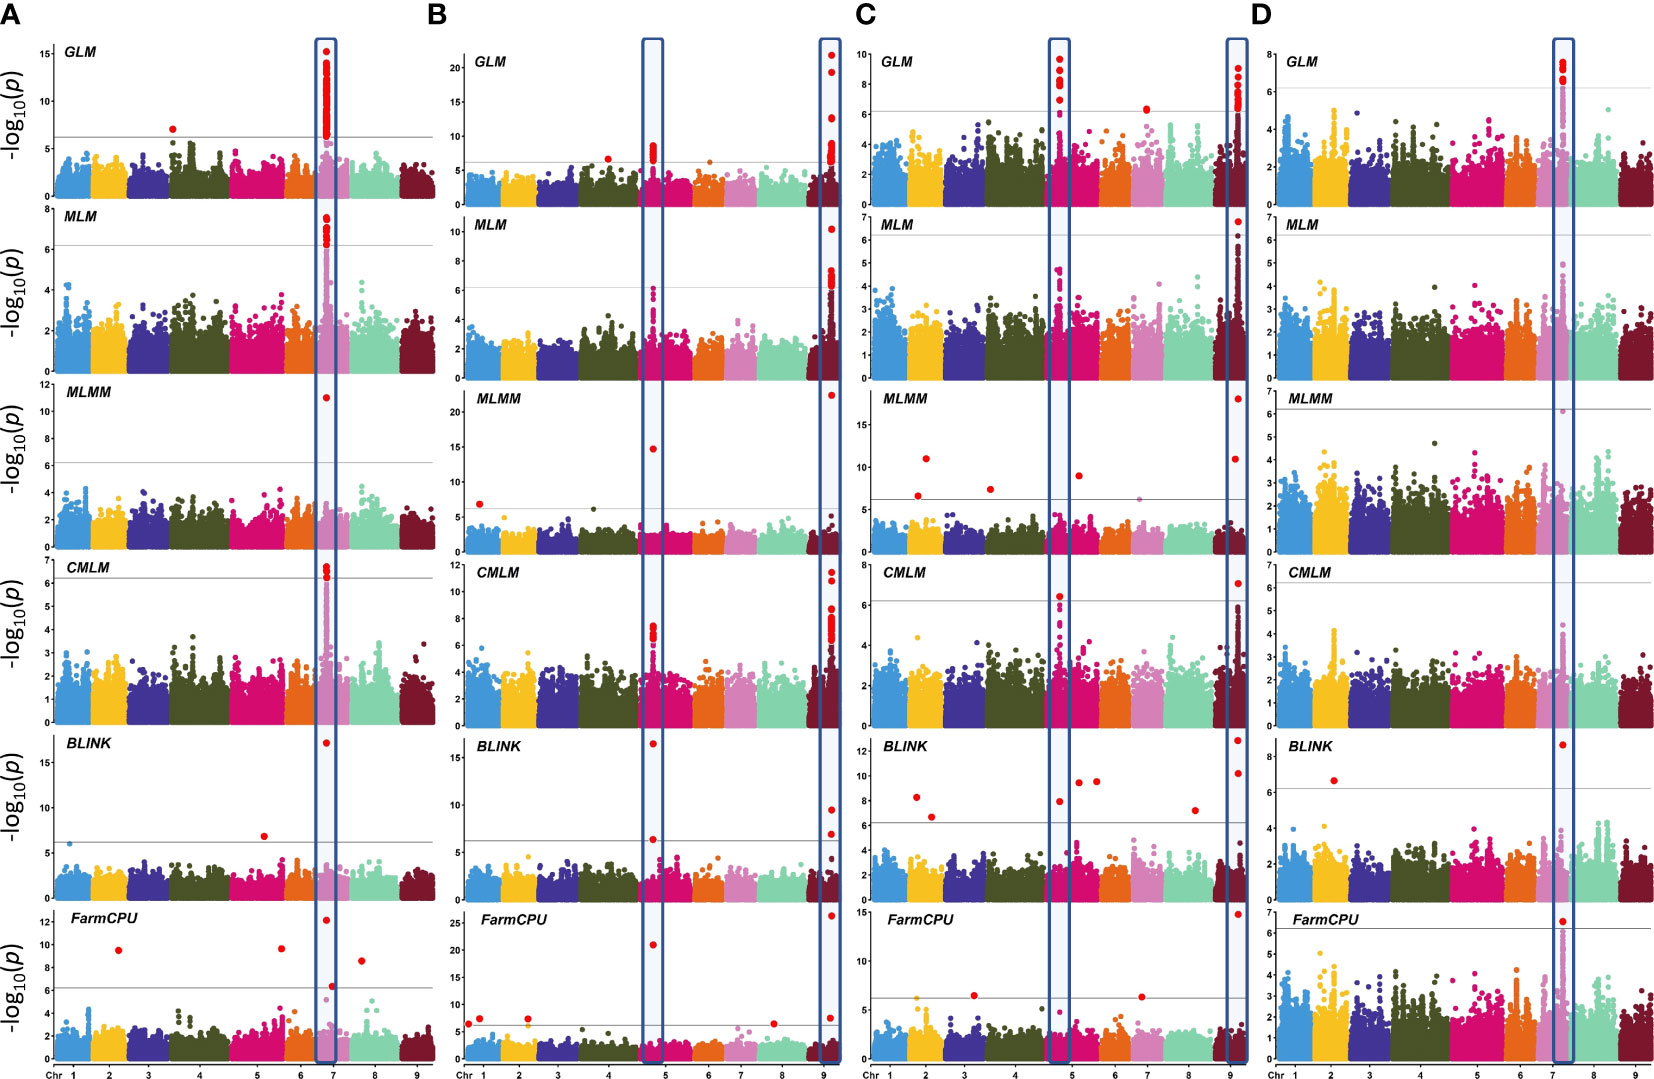
Figure 8 Manhattan plots showing SNP–trait associations (STA) in L. sativa using six multi-locus GWAS models. Four horticultural traits are shown: (A) seed color, (B) leaf anthocyanin content, (C) outer leaf color, and (D) time of beginning of bolting (bolting time). Analysis has been performed considering 81,531 SNPs on 155 accessions. The black horizontal line indicates a significant threshold (−log10 p-value) according to Bonferroni. The X-axis indicates the chromosome position. The STA repeatedly identified by three or more GWAS models are highlighted.
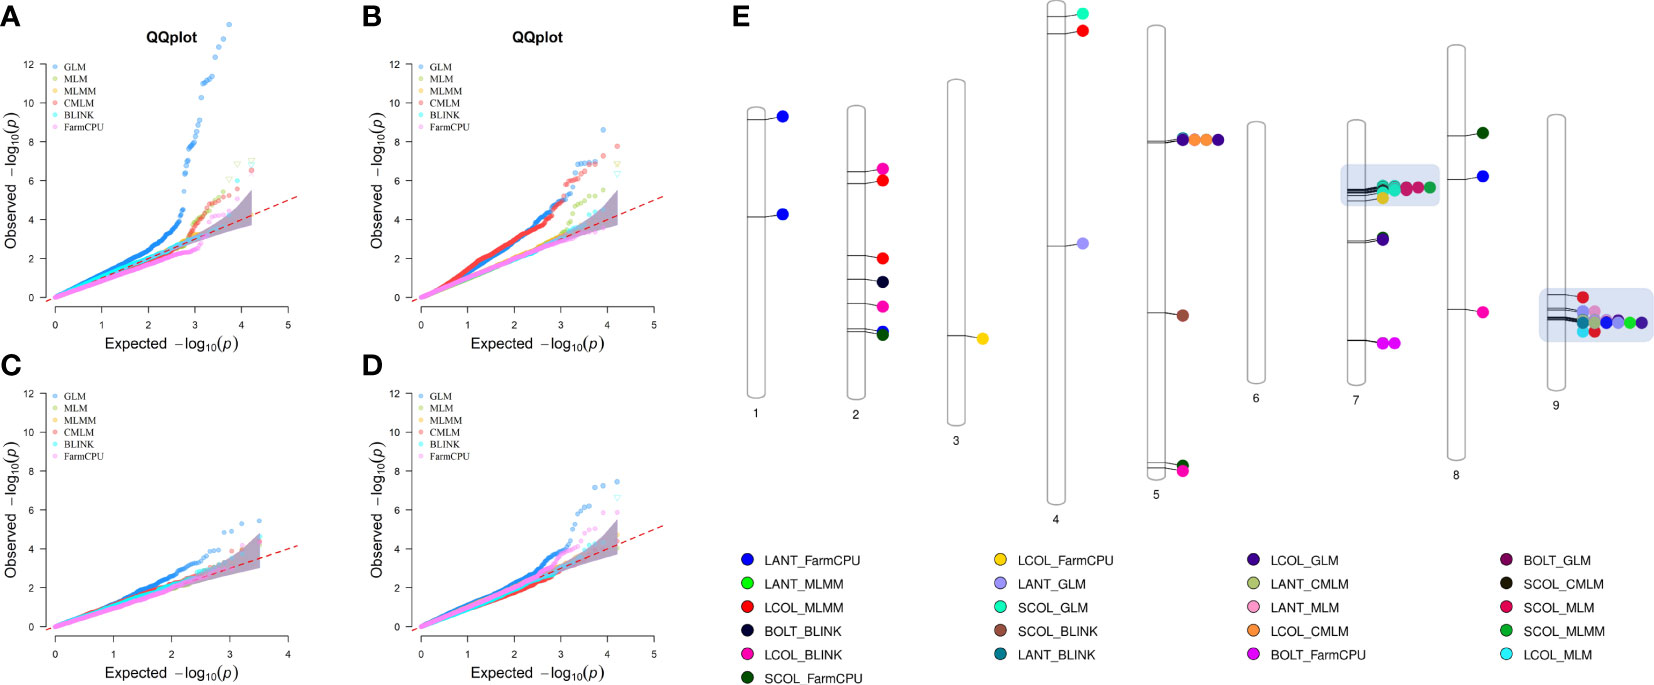
Figure 9 Quantile–quantile plots for six multi-locus GWAS models (A–D) and physical position of SNP–trait associations (E). For QQ plots, the order of traits are as follows: (A) seed color, (B) leaf anthocyanin content, (C) outer leaf color, and (D) time of beginning of bolting. For chromosomes 7 and 9, the clusters of regions with most STA are highlighted.
In order to narrow down to potential GWAS hotspots, we considered the top-ranked SNPs within each model (Table 3). For seed color, five out of the six models detected the strongest signal at 50.40 Mbp on chromosome 7 in an intergenic region at 19.55 kb to an Atp-dependent rna helicase DEAH5. The percentage of phenotypic variation explained (PVE%) by each locus ranged from 0.03% to 45.26%. Only with the CMLM model was the highest peak found 147 kb downstream to the previous one (chromosome 7, 50.54 Mbp) and in correspondence to Cytokinin dehydrogenase 3. For leaf anthocyanin content, five models detected a robust association on chromosome 5 at 86.12 Mbp in correspondence to Phototropin-2 with a PVE% ranging from 4.55% to 15.26%. In addition, all models detected the strongest STA on chromosome 9 at 152.91 Mbp within an MLO like protein 11. Also, for outer leaf color, the strongest associations were in both chromosome 5 and 9, at ~27 kbp distance from those identified for leaf anthocyanin content. For leaf color, a Signal peptidase complex subunit 3B was the candidate gene identified with GLM, CMLM, and FarmCPU on chromosome 5 at 86.15 Mbp. The three models exhibited a PVE% ranging from 2.78 to 20.32. Furthermore, all models detected the strong STA at 152.88 Mbp on chromosome 9 in correspondence to a General transcription factor 3C polypeptide 6, with a PVE% ranging from 10.46% to 47.65%.
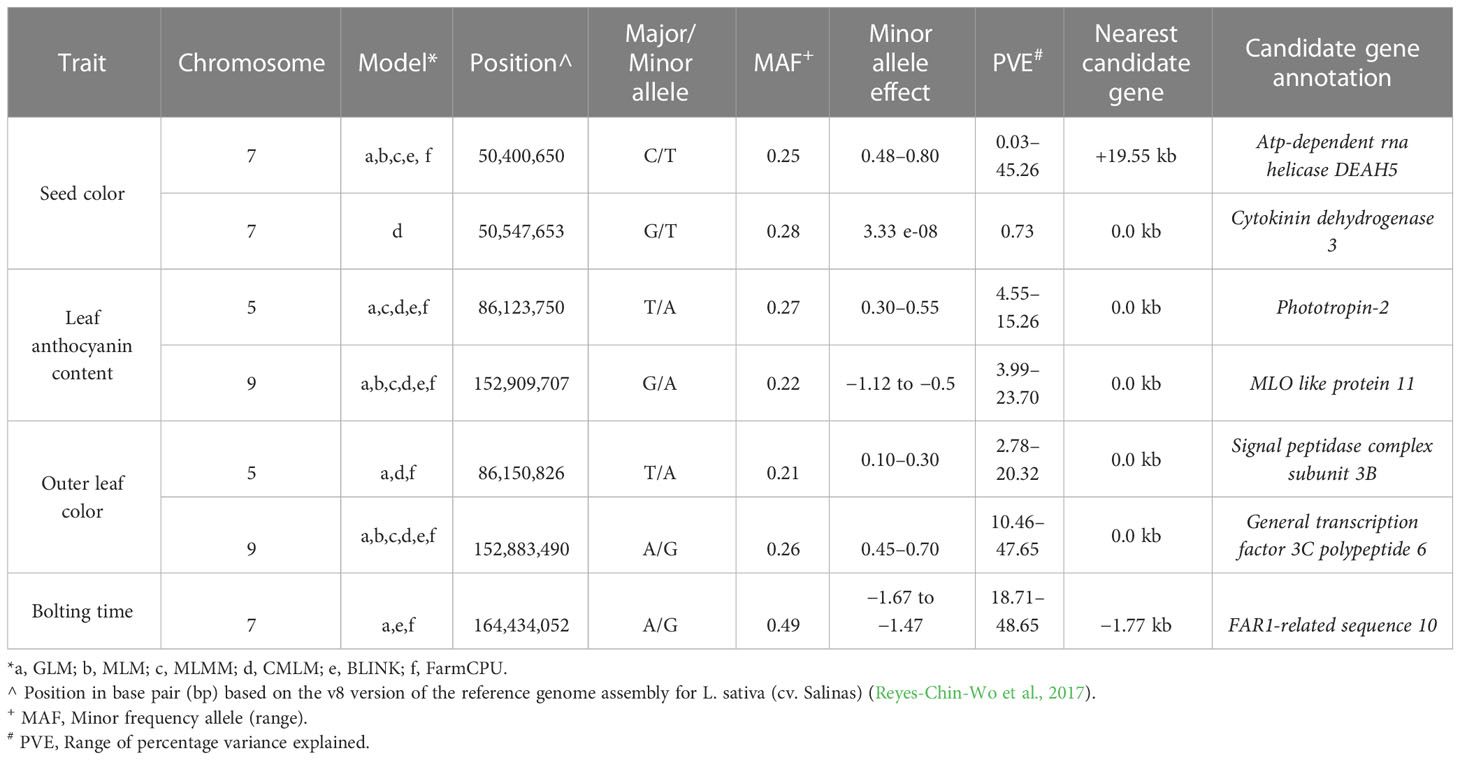
Table 3 Robust associations detected with a multimodel GWAS for four horticultural traits in a germplasm collection of 155 cultivated lettuce accessions.
For bolting time, only GLM, BLINK, and FarmCPU revealed the strongest STA in an intergenic region at 1.77 kbp from FAR1-related sequence 10 located on chromosome 7 at 164.43 Mbp. The three models exhibited a PVE% ranging from 18.71% to 48.65%.
4 Discussion
4.1 SPET development and genomic diversity
In this work, we investigated the effectiveness of SPET as a tool for high-throughput genotyping in lettuce. This method has been developed recently, but so far, very little information about how well it performs in plants is reported. To that end, we developed and validated a novel SNP panel enriched of intraspecific SNPs from 131 resequenced genomes and consisting of over 40,000 probes across the lettuce genome. The potentialities of SPET rely on the high-efficiency enrichment of targeted loci and the high scalability of up to thousands of probes in a single reaction (Scaglione et al., 2019). In addition, it offers the possibility of discovering novel SNPs by sequencing the genomic regions surrounding the target SNPs. Compared to other genotyping strategies for reducing genome complexity, this method offers full control of target sites, thus broadening the investigation of variation within genomic regions with a functional role. Furthermore, the possibility to detect SNPs within probe-defined regions improves reproducibility, thus enabling one to implement and/or compare genomic information from different genotyping experiments. Our main goal was to determine the applicability of SPET for assessing the diversity of a heterogeneous germplasm collection of lettuce including genotypes belonging to different horticultural types with diverse geographic origins. This work was done as part of the ECPGR European Evaluation Network (EVA) with the goal of improving the knowledge of crop genetic diversity and exploiting it to breed more resilient crops that can meet the major problems facing agriculture in the upcoming years (FAO, 2021; ECPGR, 2023). A more efficient use of crop diversity is essential for genetic improvement, management, and conservation of germplasm resources. The sequenced dataset comprised an average of 4 million SNPs per sample, which has been indicated to be adequate for processing several thousands of probes (Scaglione et al., 2019). Compared to the 25K SPET panel reported in peach (Baccichet et al., 2022) and the 5K SPET panel described for tomato, eggplant, and oil palm (Barchi et al., 2019; Herrero et al., 2020), the 40K SPET assay designed in lettuce provides a higher number of SNPs covering up to 96% of gene-rich regions. Our findings demonstrated how effective SPET is compared to other genotyping techniques for detecting SNPs within coding regions. In fact, prior studies in lettuce utilizing genotyping by sequencing revealed that the proportion of SNP loci within genic regions ranged from 0.94% to 27.6% (Park et al., 2021; Park et al., 2022).
We detected over 80,000 high-quality polymorphisms that were analyzed to determine population ancestry, phylogenetic relationships, and principal components among the EVA lettuce accessions. The three approaches were complementary, thus supporting the interpretation of results. In agreement with earlier findings (Park et al., 2021; Park et al., 2022; Simko, 2009; Stoffel and van Leeuwen, 2012), no admixture was found between L. sativa and L. serriola. Indeed, the accessions of the two species were clearly separated. This evidence promotes the potentiality of SPET for phylogenetic studies, as already observed in aubergine and tomato (Barchi et al., 2019). Population structure and phylogenetic analysis revealed the presence of five distinct subpopulations within L. sativa with a variable degree of mixture across cultivar groups, confirming previous studies using both short-read genotyping-based techniques (Park et al., 2021; Park et al., 2022; Stoffel and van Leeuwen, 2012) and microsatellites (Rauscher and Simko, 2013). This could be related to the fact that in lettuce breeding, different horticultural types may be used in the pedigree scheme. In the collection assayed, we found a major clustering of butterhead genotypes when compared to the rest. This tendency contrasted with Park and colleagues (2021), who reported instead a greater separation of iceberg accessions from the other types in a collection of 441 individuals. Despite finding a slight differentiation according to geographical provenance, the effect due to the composition of the diversity panel assayed in terms of horticultural types and represented countries must be considered. Furthermore, for breeding and research materials, the reported origin often matches the places where the selection is carried out, thus providing an additional confounding effect. Several factors could affect the subpopulations enclosed in germplasm collections, such as the management practices occurring in the holding genebanks (e.g., level of heterozygosity retained and duplications), the areas of sampling of materials, or the biological status of accessions. Iceberg types investigated by Park et al. (2021) were mostly patented lines from the USDA, whereas we assayed mostly breeding materials, thus suggesting the presence of accessions still under development. The possibility to discover de novo polymorphisms free from any sequencing ascertainment bias and at affordable costs commensurable to other next-generation genotyping methodologies designates SPET as an efficient tool for population genomic analysis in lettuce.
4.2 Genome-wide association analysis
The advances in genomics and cutting-edge genotyping technology have contributed to the growing availability of large-scale genotypic data of germplasm resources for various crops. The analysis of the genetic underpinnings of complex traits used in GWAS has benefited greatly from the ability to link phenotypic data to genomic sequence data. GWAS has proven to be an effective method for finding genetic variations that are significantly more common for a specific phenotype in unrelated individuals (Xiao et al., 2022). Owing to the greater number of recombination events occurring in natural populations, the advantage over bi-parental mapping populations depends on a larger genetic base to exploit and on higher map resolution (Han et al., 2020). Over the past years, the GWAS computing efficiency has been improved by developing different multivariate models that consider the family kinship inference and population structure covariates to enhance the power of associations and decrease the rate of false positives (Wang and Zhang, 2021). GWAS has been performed with the aim of investigating the potentiality of the SPET panel for candidate gene detection. To that end, we focused on four main agronomic traits driving the selection of cultivated lettuce cultivars and underlying market and consumer preferences. To test the most likely candidate regions underpinning the variation of the considered traits, different models were implemented. As expected, the GLM detected the highest number of STA in all traits, although this model accumulates several false positives, which are eliminated by incorporating additional correcting factors involving a multi-dimensional genome scan able to simultaneously estimate all marker effects (Wang et al., 2014: Chaurasia et al., 2021). By combining multivariate models, we identified seven candidate regions across chromosomes 5, 7, and 9 for the assayed traits. For seed color, the STA found on chromosome 7 confirmed a previous investigation reporting three associations in a 12-Mbp region spanning 69.87 Mbp to 80.63 Mbp (Kwon et al., 2013). We better refined the position at 50.40 Mbp near deah5, an ATP-dependent RNA helicase involved in abscisic acid and stress responses in the acquisition of embryogenic competence (Almeida et al., 2020). The cytokinin dehydrogenase 3 detected within the association may regulate cell division as well as a large number of developmental events in plants (Schmülling et al., 2003). The two candidates may therefore play a role in seed coat development and color.
The position of STA located on chromosomes 5 and 9 for leaf color traits agreed with previous studies (Zhang et al., 2017; Su et al., 2020; Wei et al., 2021). On chromosome 5, Zhang et al. (2017) reported the lead SNPs for leaf color at less than 150 bp (86,123,627, 86,123,633, and 86,123,651) from the top association for leaf anthocyanin color. In the same study, the association on chromosome 9 was in the same region at 17.45 kb (152,892,248) from the top- ranked STA found in this study. These regions are reported to harbor two genes RLL2 (Red Lettuce Leaves 2) and ANS (Anthocyanin Synthase) that encode key enzymes for anthocyanin biosynthesis. We found four main candidate genes. Phototropin 2 and mlo like protein 11 both play a key role in leaf development and physiology. Phototropin 2 is primarily involved in the reception of light direction in the blade and has been demonstrated to promote leaf expansion and flattening (Legris et al., 2021). In Pistacia chinensis, Phototropin 2 has been reported to be involved in the signal transduction for anthocyanin accumulation during leaf coloration in autumn (Song et al., 2021), whereas in octaploid strawberry, it was involved in anthocyanin accumulation in strawberry fruits (Kadomura-Ishikawa et al., 2013).
The mlo like protein 11 is part of the large family of proteins that regulates pathogen defense and leaf cell death (Pozharskiy et al., 2022). No previous report indicates any function of mlo like protein 11 in leaf color. A general transcription factor (3C polypeptide 6) was found to be involved in outer leaf color on chromosome 9. In plants, transcription factors regulate secondary metabolism (Vom Endt et al., 2002) and are potential candidates for plant organ pigmentation (Ban et al., 2007; Zhou et al., 2014; Su et al., 2020).
The strongest signals found for bolting time at 164.43 Mb on chromosome 7 confirmed previous evidence. Indeed, several studies consistently supported the importance of chromosome 7 for lettuce flowering control (Kwon et al., 2013; Sthapit Kandel et al., 2020; Lee et al., 2021; Rosental et al., 2021). Despite the exact comparisons of the candidate region not always being possible, owing to the different marker system used (Han et al., 2021), our study supports whole-genome resequencing data findings (Wei et al., 2021), which detected a strong association at 164.5 Mbp in correspondence to phytochrome c involved in delaying of flowering. With the same effect, the strong STA found in the present study was near far1 (far-red impaired response 1), a component of the phytochrome A and putatively involved in regulating light control during the developmental stage (Siddiqui et al., 2016; Liu et al., 2020). far1 directly activates the expression of the evening gene ELF4 that plays a key role in the circadian flowering clock. In Arabidopsis, it negatively regulates flowering time in synergy with other FRS (FAR-Related Sequence) and FRF (FRS-Related Factor) genes (Ma and Li, 2018). The variation of far1 expression has also been reported to regulate shoot growth and flowering time in roses.
The creation of a novel SPET assay in lettuce was described in this work, and its potential for genetic diversity and GWAS research was demonstrated by comparing the results with earlier discoveries using different genotyping technologies. Additional research could weigh the benefits and drawbacks of SPET in comparison to whole-genome short and long read sequencing.
5 Conclusion
Here, we presented SPET as an efficient method combining the properties of random complexity reduction techniques and arrays, allowing us to choose a set of gene-associated targeted markers for the accurate characterization of lettuce germplasm. The combination of population ancestry and phylogenetic approaches proved to be effective to better understand the genomic structure of lettuce genotypes. It is evident that the observed diversity patterns reflect the varietal composition of the collection and, to a minor extent, the geographical origin, which can be assumed primary factors underlying the diversification. Given the high marker density, the SPET panel has been used as a proof of concept for genome-wide association analysis to identify genomic regions underpinning the variation of main agronomic traits in lettuce. We confirmed previous findings, refined the genomic position of trait loci, and demonstrated the power of SPET for GWAS. These results will be useful for breeding and selection in lettuce. Further applications may include analysis of genetic relationships among species, management of genebank collections, and genetic fingerprinting for plant variety protection as well as GWAS for other additional important traits in lettuce.
Data availability statement
The original contributions presented in the study are included in the article/Supplementary Files. Further inquiries can be directed to the corresponding authors.
Author contributions
SG and MB conceived and coordinated the project. PT analyzed genomic data and prepared the draft of the manuscript. MB, DP, IK, CV, AL, GB, CA, and TZ performed phenotyping trials. DS, MB, RvT, and SG jointly designed the SPET array. DS and PT performed bioinformatic analysis. All authors contributed to the article and approved the submitted version.
Funding
The authors are grateful for the financial support for this work by the German Federal Ministry of Food and Agriculture, grant GenRes 2019-2 to ECPGR, which allowed the implementation of the EVA networks.
Conflict of interest
DS was employed by the company IGA Technology Services Srl. MB was employed by the company ISI Sementi SpA. DP was employed by the company Limagrain - Vilmorin-Mikado. AL and GB were employed by the company Gautier Semences. CA was employed by the company Sativa Rheinau AG. TZ was employed by the company Zollinger Conseilles Sarl.
The remaining authors declare that the research was conducted in the absence of any commercial or financial relationships that could be construed as a potential conflict of interest.
Publisher’s note
All claims expressed in this article are solely those of the authors and do not necessarily represent those of their affiliated organizations, or those of the publisher, the editors and the reviewers. Any product that may be evaluated in this article, or claim that may be made by its manufacturer, is not guaranteed or endorsed by the publisher.
Supplementary material
The Supplementary Material for this article can be found online at: https://www.frontiersin.org/articles/10.3389/fpls.2023.1252777/full#supplementary-material
References
Alexander, D. H., Shringarpure, S. S., Novembre, J., Lange, K. L. (2015). Admixture 1.3 software manual (Los Angeles: UCLA Human Genetics Software Distribution).
Almeida, F. A., Passamani, L. Z., Santa-Catarina, C., Mooney, B. P., Thelen, J. J., Silveira, V. (2020). Label-free quantitative phosphoproteomics reveals signaling dynamics involved in embryogenic competence acquisition in sugarcane. J. Proteome Res. 19 (10), 4145–4157. doi: 10.1021/acs.jproteome.0c00652
Amorese, D., Armour, C., Kurn, N. (2013). Compositions and methods for targeted nucleic acid sequence enrichment and high efficiency library regeneration US Patent US9650628B2.
Baccichet, I., Chiozzotto, R., Scaglione, D., Bassi, D., Rossini, L., Cirilli, M. (2022). Genetic dissection of fruit maturity date in apricot (P. Armeniaca L.) through a Single Primer Enrichment Technology (SPET) approach. BMC Genomics 23 (1), 1–16. doi: 10.1186/s12864-022-08901-1
Ban, Y., Honda, C., Hatsuyama, Y., Igarashi, M., Bessho, H., Moriguchi, T. (2007). Isolation and functional analysis of a MYB transcription factor gene that is a key regulator for the development of red coloration in apple skin. Plant Cell Physiol. 48, 958–970. doi: 10.1093/pcp/pcm066
Barchi, L., Acquadro, A., Alonso, D., Aprea, G., Bassolino, L., Demurtas, O. C., et al. (2019). Single Primer Enrichment Technology (SPET) for high-throughput genotyping in tomato and eggplant germplasm. Front. Plant Sci. 10. doi: 10.3389/fpls.2019.01005
Bradbury, P. J., Zhang, Z., Kroon, D. E., Casstevens, T. M., Ramdoss, Y., Buckler, E. S. (2007). Tassel: software for association mapping of complex traits in diverse samples. Bioinformatics 23, 2633–2635. doi: 10.1093/bioinformatics/btm308
Chaurasia, S., Singh, A. K., Kumar, A., Songachan, L. S., Yadav, M. C., Kumar, S., et al. (2021). Genome-wide Association Mapping Reveals Key Genomic Regions for Physiological and Yield-Related Traits under Salinity Stress in Wheat (Triticum aestivum L.). Genomics 113 (5), 3198–3215. doi: 10.1016/j.ygeno.2021.07.014
Cingolani, P. (2022). Variant annotation and functional prediction: SnpEff. Methods Mol. Biol. Clifton NJ 2493, 289–314. doi: 10.1007/978-1-0716-2293-3_19
Danecek, P., Auton, A., Abecasis, G., Albers, C. A., Banks, E., DePristo, M. A., et al. (2011). The variant call format and VCFtools. Bioinformatics 27, 2156–2158. doi: 10.1093/bioinformatics/btr330
Del Fabbro, C., Scalabrin, S., Morgante, M., Giorgi, F. M. (2013). An extensive evaluation of read trimming effects on Illumina NGS data analysis. PloS One 8, e85024. doi: 10.1371/journal.pone.0085024
DePristo, M. A., Banks, E., Poplin, R., Garimella, K. V., Maguire, J. R., Hartl, C., et al. (2011). A framework for variation discovery and genotyping using next-generation DNA sequencing data. Nat. Genet. 43, 491–498. doi: 10.1038/ng.806
Deschamps, S., Llaca, V., May, G. D. (2012). Genotyping-by-sequencing in plants. Biol. 1, 460–483. doi: 10.3390/biology1030460
ECPGR (2023). Available at: https://www.ecpgr.cgiar.org/european-evaluation-network-eva/eva-networks/lettuce (Accessed July 1, 2023).
FAO (2021) FAO’s Strategic Framework 2022-31. Available at: https://www.fao.org/3/cb7099en/cb7099en.pdf (Accessed July 1, 2023).
FAOSTAT (2023) FAOSTAT. Available at: http://www.fao.org/faostat/en/ (Accessed July 1, 2023).
Guo, X., Chen, F., Gao, F., Li, L., Liu, K., You, L., et al. (2020). CNSA: a data repository for archiving omics data. Database (Oxford) 2020, baaa055. doi: 10.1093/database/baaa055
Han, Z., Hu, G., Liu, H., Liang, F., Yang, L., Zhao, H., et al. (2020). Bin-based genome-wide association analyses improve power and resolution in QTL mapping and identify favorable alleles from multiple parents in a four-way MAGIC rice population. Theor. Appl. Genet. 133, 59–71. doi: 10.1007/s00122-019-03440-y
Han, R., Truco, M. J., Lavelle, D. O. (2021). Michelmore, R.W. @ a composite analysis of flowering time regulation in lettuce. Front. Plant Sci. 12. doi: 10.3389/fpls.2021.632708
Herrero, J., Santika, B., Herrán, A., Erika, P., Sarimana, U., Wendra, F., et al. (2020). Construction of a high density linkage map in Oil Palm using SPET markers. Sci. Rep. 10, 1–9. doi: 10.1038/s41598-020-67118-y
Huang, M., Liu, X., Zhou, Y., Summers, R. M., Zhang, Z. (2019). BLINK: a package for the next level of genome-wide association studies with both individuals and markers in the millions. Gigascience 8. doi: 10.1093/gigascience/giy154
Huang, X., Han, B. (2014). Natural variations and genome-wide association studies in crop plants. Annu. Rev. Plant Biol. 65, 531–551. doi: 10.1146/annurev-arplant-050213-035715
Kadomura-Ishikawa, Y., Miyawaki, K., Noji, S., Takahashi, A. (2013). Phototropin 2 is involved in blue light-induced anthocyanin accumulation in Fragaria × ananassa fruits. J. Plant Res. 126, 847–857. doi: 10.1007/s10265-013-0582-2
Kim, C., Guo, H., Kong, W., Chandnani, R., Shuang, L.-S., Paterson, A. H. (2016a). Application of genotyping by sequencing technology to a variety of crop breeding programs. Plant Sci. 242, 14–22. doi: 10.1016/j.plantsci.2015.04.016
Kim, M. J., Moon, Y., Tou, J. C., Mou, B., Waterland, N. L. (2016b). Nutritional value, bioactive compounds and health benefits of lettuce (Lactuca sativa L.). J. Food Compos. Anal. 49, 19–34. doi: 10.1016/j.jfca.2016.03.004
Kumar, S., Stecher, G., Li, M., Knyaz, C., Tamura, K. (2018). MEGA X: Molecular evolutionary genetics analysis across computing platforms. Mol. Biol. Evol. 35, 1547–1549. doi: 10.1093/molbev/msy096
Kwon, S., Simko, I., Hellier, B., Mou, B., Hu, J. (2013). Genome-wide association of 10 horticultural traits with expressed sequence tag-derived SNP markers in a collection of lettuce lines. Crop J. 1, 25–33. doi: 10.1016/j.cj.2013.07.014
Lee, N., Fukushima, K., Park, H. Y., Kawabata, S. (2021). QTL analysis of stem elongation and flowering time in lettuce using genotyping-by-sequencing. Genes 12, 947. doi: 10.3390/genes12060947
Legris, M., Szarzynska-Erden, B. M., Trevisan, M., Allenbach Petrolati, L., Fankhauser, C. (2021). Phototropin-mediated perception of light direction in leaves regulates blade flattening. Plant Physiol. 187 (3), 1235–1249. doi: 10.1093/plphys/kiab410
Li, H., Durbin, R. (2009). Fast and accurate short read alignment with Burrows-Wheeler transform. Bioinformatics 25, 1754–1760. doi: 10.1093/bioinformatics/btp324
Liu, X., Huang, M., Fan, B., Buckler, E. S., Zhang, Z. (2016). Iterative usage of fixed and random effect models for powerful and efficient genome-wide association studies. PLoS Genet 12 (2), e1005767. doi: 10.1371/journal.pgen.1005767
Liu, Y., Ma, M., Li, G., Yuan, L., Xie, Y., Wei, H., et al. (2020). Transcription factors FHY3 and FAR1 regulate light-induced CIRCADIAN CLOCK ASSOCIATED1 gene expression in Arabidopsis. Plant Cell 32, 1464–1478. doi: 10.1105/tpc.19.00981
Loley, C., König, I. R., Hothorn, L., Ziegler, A. (2013). A unifying framework for robust association testing, estimation, and genetic model selection using the generalized linear model. Eur. J. Hum. Gen. 21 (12), 1442–1448. doi: 10.1038/ejhg.2013.62
Lovci, M. T., Bruns, S. C., Eide, M., Sherlin, L., Heath, J. D. (2018). “Nugen’s allegro™ Targeted genotyping: an accurate and cost-effective sequencing workflow for any genome,” in Plant and Animal Genome XXVI Conference (PAG, San Diego).
Lu, H., Hu, J., Kwon, S. J. (2014). Association analysis of bacterial leaf spot resistance and SNP markers derived from expressed sequence tags (ESTs) in lettuce (Lactuca sativa L). Mol. Breed 34, 997–1006. doi: 10.1007/s11032-014-0092-5
Ma, L., Li, G. (2018). FAR1-RELATED SEQUENCE (FRS) and FRS-RELATED FACTOR (FRF) family proteins in arabidopsis growth and development. Front. Plant Sci. 9. doi: 10.3389/fpls.2018.00692
Martin, M. (2011). Cutadapt removes adapter sequences from high-throughput sequencing reads. EMBnet J. 17, 10–12. doi: 10.14806/ej.17.1.200
Onda, Y., Mochida, K. (2016). Exploring genetic diversity in plants using high-throughput sequencing techniques. Curr. Genomics 17, 356–365. doi: 10.2174/1389202917666160331202742
Pante, E., Abdelkrim, J., Viricel, A., Gey, D., France, S. C., Boisselier, M. C., et al. (2015). Use of RAD sequencing for delimiting species. Heredity 114, 450–459. doi: 10.1038/hdy.2014.105
Park, J. S., Kang, M. Y., Shim, E. J., Oh, J. H., Seo, K. I., Kim, K. S., et al. (2022). Genome-wide core sets of SNP markers and Fluidigm assays for rapid and effective genotypic identification of Korean cultivars of lettuce (Lactuca sativa L.). Hortic. Res. 9, 1–15. doi: 10.1093/hr/uhac119
Park, S., Kumar, P., Shi, A., Mou, B. (2021). Population genetics and genome-wide association studies provide insights into the influence of selective breeding on genetic variation in lettuce. Plant Genome 14, 20086. doi: 10.1002/tpg2.20086
Peterson, G. W., Dong, Y., Horbach, C., Fu, Y. B. (2014). Genotyping-by-sequencing for plant genetic diversity analysis: a lab guide for SNP genotyping. Diversity 6, 665–680. doi: 10.3390/d6040665
Poland, J. A., Rife, T. W. (2012). Genotyping-by-sequencing for plant breeding and genetics. Plant Genome 5, 92–102. doi: 10.3835/plantgenome2012.05.0005
Pozharskiy, A., Kostyukova, V., Nizamdinova, G., Kalendar, R., Gritsenko, D. (2022). MLO proteins from tomato (Solanum lycopersicum L.) and related species in the broad phylogenetic context. Plants 11 (12), 1588. doi: 10.3390/plants11121588
Rauscher, G., Simko, I. (2013). Development of genomic SSR markers for fingerprinting lettuce (Lactuca sativaL.) cultivars and mapping genes. BMC Plant Biol. 13, 11. doi: 10.1186/1471-2229-13-11
Reyes-Chin-Wo, S., Wang, Z., Yang, X., Kozik, A., Arikit, S., Song, C., et al. (2017). Genome assembly with in vitro proximity ligation data and whole-genome triplication in lettuce. Nat. Commun. 8, 14953. doi: 10.1038/ncomms14953
Rosental, L., Still, D. W., You, Y., Hayes, R. J., Simko, I.. (2021). Mapping and identification of genetic loci affecting earliness of bolting and flowering in lettuce. Theor. Appl. Genet. 134, 3319–3337. doi: 10.1007/s00122-021-03898-9
Segura, V., Vilhjálmsson, B. J., Platt, A., Korte, A., Seren, Ü., Long, Q., et al. (2012). An efficient multi-locus mixed-model approach for genome-wide association studies in structured populations. Nat. Genet. 44, 825–830. doi: 10.1038/ng.2314
Scaglione, D., Pinosio, S., Marroni, F., Centa, E., Di Fornasiero, A., Magris, G., et al. (2019). Single primer enrichment technology as a tool for massive genotyping: a benchmark on black poplar and maize. Ann. Bot. 124 (4), 543–551. doi: 10.1093/aob/mcz054
Schmülling, T., Werner, T., Riefler, M., Krupková, E., Bartrina y Manns, I. (2003). Structure and function of cytokinin oxidase/dehydrogenase genes of maize, rice, Arabidopsis and other species. J. Plant Res. 116, 241–252. doi: 10.1007/s10265-003-0096-4
Seki, K., Komatsu, K., Hiraga, M., Tanaka, K., Uno, Y., Mastumura, H. (2020). Identification of two QTLs for resistance to Fusarium wilt race 1 in lettuce (Lactuca sativa L.). Euphytica 216, 174. doi: 10.1007/s10681-020-02713-8
Shete, S., Tiwari, H., Elston, R. C. (2000). On estimating the heterozygosity and polymorphism information content value. Theor. Popul. Biol. 57, 265–271. doi: 10.1006/tpbi.2000.1452
Siddiqui, H., Khan, S., Rhodes, B. M., Devlin, P. F. (2016). FHY3 and FAR1 act downstream of light stable phytochromes. Front. Plant Sci. 7. doi: 10.3389/fpls.2016.00175
Simko, I. (2009). Development of EST-SSR markers for the study of population structure in lettuce (Lactuca sativa L.). J. Heredity 100 (2), 256–262. doi: 10.1093/jhered/esn072
Song, X., Duan, X., Chang, X., Xian, L., Yang, Q., Liu, Y. (2021). Molecular and metabolic insights into anthocyanin biosynthesis during leaf coloration in autumn. Env. Exp. Bot. 190, 104584. doi: 10.1016/j.envexpbot.2021.104584
Sthapit Kandel, J., Peng, H., Hayes, R. J., Mou, B., Simko, I. (2020). Genome-wide association mapping reveals loci for shelf life and developmental rate of lettuce. Theor. Appl. Genet. 133, 1947–1966. doi: 10.1007/s00122-020-03568-2
Stoffel, K., van Leeuwen, H. (2012). Kozik, A. et al.(2012) Development and application of a 6.5 million feature Affymetrix Genechip® for massively parallel discovery of single position polymorphisms in lettuce (Lactuca spp.). BMC Genomics 13, 185. doi: 10.1186/1471-2164-13-185
Su, W., Tao, R., Liu, W., Yu, C., Yue, Z., He, S., et al. (2020). Characterization of four polymorphic genes controlling red leaf colour in lettuce that have undergone disruptive selection since domestication. Plant Biotechnol. J. 18, 479–490. doi: 10.1111/pbi.13213
Tripodi, P. (2022). Next generation sequencing technologies to explore the diversity of germplasm resources: Achievements and trends in tomato. Comput. Struct. Biotechnol. J. 6250–6258. doi: 10.1016/j.csbj.2022.11.028
Van der Auwera, G. A., O'Connor, B. D. (2020). Genomics in the cloud: using Docker, GATK, and WDL in Terra. O'Reilly Media. pp 1–440.
Van Tassell, C. P., Smith, T. P., Matukumalli, L. K., Taylor, J. F., Schnabel, R. D., Lawley, C. T., et al. (2008). SNP discovery and allele frequency estimation by deep sequencing of reduced representation libraries. Nat. Methods 5 (3), 247–252. doi: 10.1038/nmeth.1185
van Treuren, R., Coquin, P., Lohwasser, U. (2012). Genetic resources collections of leafy vegetables (lettuce, spinach, chicory, artichoke, asparagus, lamb’s lettuce, rhubarb and rocket salad): composition and gaps. Genet. Resour Crop Evol. 59, 981–997. doi: 10.1007/s10722-011-9738-x
van Treuren, R., van Hintum, T. J. (2009). Comparison of anonymous and targeted molecular markers for the estimation of genetic diversity in ex situ conserved Lactuca. Theor. Appl. Genet. 119, 1265–1279. doi: 10.1007/s00122-009-1131-1
Van Treuren, R., van Hintum, T. (2014). Next-generation genebanking: plant genetic resources management and utilization in the sequencing era. Plant Genet. Resour. 12, 298–307. doi: 10.1017/S1479262114000082
Vom Endt, D., Kijne, J. W., Memelink, J. (2002). Transcription factors controlling plant secondary metabolism: what regulates the regulators? Phytochemistry 61 (2), 107–114. doi: 10.1016/S0031-9422(02)00185-1
Wang, Q., Tian, F., Pan, Y., Buckler, E. S., Zhang, Z. (2014). A SUPER powerful method for genome wide association study. PloS One 9, e107684. doi: 10.1371/journal.pone.0107684
Wang, J., Zhang, Z. (2021). GAPIT version 3: Boosting power and accuracy for genomic association and prediction. Genom. Proteomics Bioinf. 19, 629–640. doi: 10.1016/j.gpb.2021.08.005
Wei, T., van Treuren, R., Liu, X., Zhang, Z, Chen, J, Liu, Y, et al. (2021). Whole-genome resequencing of 445 Lactuca accessions reveals the domestication history of cultivated lettuce. Nat. Genet. 53, 752–760. doi: 10.1038/s41588-021-00831-0
Wendt, F. R., Novroski, N. M. (2019). Identity informative SNP associations in the UK Biobank. Forensic Science International. Genetics 42, 45–48. doi: 10.1016/j.fsigen.2019.06.007
World Flora Online Plant List (2023). Available at: https://wfoplantlist.org/plant-list/taxon/wfo-7000000146-2022-12 (Accessed July, 1, 2023).
Xiao, Q., Bai, X., Zhang, C., He, Y. (2022). Advanced high-throughput plant phenotyping techniques for genome-wide association studies: A review. J. Adv. Res. 35, 215–230. doi: 10.1016/j.jare.2021.05.002
You, Q., Yang, X., Peng, Z., Xu, L., Wang, J. (2018). Development and applications of a high throughput genotyping tool for polyploid crops: single nucleotide polymorphism (SNP) array. Front. Plant Sci. 9. doi: 10.3389/fpls.2018.00104
Zhang, L., Su, W., Tao, R., Zhang, W., Chen, J., Wu, P., et al. (2017). RNA sequencing provides insights into the evolution of lettuce and the regulation of flavonoid biosynthesis. Nat. Commun. 8 (1), 2264–2312. doi: 10.1038/s41467-017-02445-9
Zhang, Z., Ersoz, E., Lai, C. Q., Todhunter, R. J., Tiwari, H. K., Gore, M. A., et al. (2010). Mixed linear model approach adapted for genome-wide association studies. Nat. Genet. 42, 355–360. doi: 10.1038/ng.546
Zhou, Y., Zhou, H., Lin-Wang, K., Vimolmangkang, S., Espley, R. V., Wang, L., et al. (2014). Transcriptome analysis and transient transformation suggest an ancient duplicated MYB transcription factor as a candidate gene for leaf red coloration in peach. BMC Plant Biol. 14, 388. doi: 10.1186/s12870-014-0388-y
Keywords: lettuce, SPET, high-throughput genotyping, genomic diversity, phenotyping, GWAS, candidate genes
Citation: Tripodi P, Beretta M, Peltier D, Kalfas I, Vasilikiotis C, Laidet A, Briand G, Aichholz C, Zollinger T, Treuren Rv, Scaglione D and Goritschnig S (2023) Development and application of Single Primer Enrichment Technology (SPET) SNP assay for population genomics analysis and candidate gene discovery in lettuce. Front. Plant Sci. 14:1252777. doi: 10.3389/fpls.2023.1252777
Received: 04 July 2023; Accepted: 26 July 2023;
Published: 18 August 2023.
Edited by:
Christos Bazakos, Max Planck Institute for Plant Breeding Research, GermanyReviewed by:
Hao Li, Henan University, ChinaChristos Noutsos, State University of New York at Old Westbury, United States
Copyright © 2023 Tripodi, Beretta, Peltier, Kalfas, Vasilikiotis, Laidet, Briand, Aichholz, Zollinger, Treuren, Scaglione and Goritschnig. This is an open-access article distributed under the terms of the Creative Commons Attribution License (CC BY). The use, distribution or reproduction in other forums is permitted, provided the original author(s) and the copyright owner(s) are credited and that the original publication in this journal is cited, in accordance with accepted academic practice. No use, distribution or reproduction is permitted which does not comply with these terms.
*Correspondence: Pasquale Tripodi, cGFzcXVhbGUudHJpcG9kaUBjcmVhLmdvdi5pdA==; Sandra Goritschnig, cy5nb3JpdHNjaG5pZ0BjZ2lhci5vcmc=