 Jinglu Wang1,2,3†
 Shuaihao Zhao1,2,3†
 Ying Zhang2,3Xianju Lu2,3
 Jianjun Du2,3Chuanyu Wang2,3
 Weiliang Wen2,3
 Xinyu Guo1,3*Chunjiang Zhao1,2*
- 1College of Plant Science and Technology, Huazhong Agricultural University, Wuhan, China
- 2National Engineering Research Center for Information Technology in Agriculture, Beijing Academy of Agriculture and Forestry Sciences, Beijing, China
- 3Beijing Key Lab of Digital Plant, Information Technology Research Center, Beijing Academy of Agriculture and Forestry Sciences, Beijing, China
The morphology of maize ears plays a critical role in the breeding of new varieties and increasing yield. However, the study of traditional ear-related traits alone can no longer meet the requirements of breeding. In this study, 20 ear-related traits, including size, shape, number, and color, were obtained in 407 maize inbred lines at two sites using a high-throughput phenotypic measurement method and system. Significant correlations were found among these traits, particularly the novel trait ear shape (ES), which was correlated with traditional traits: kernel number per row and kernel number per ear. Pairwise comparison tests revealed that the inbred lines of tropical-subtropical were significantly different from other subpopulations in row numbers per ear, kernel numbers per ear, and ear color. A genome-wide association study identified 275, 434, and 362 Single nucleotide polymorphisms (SNPs) for Beijing, Sanya, and best linear unbiased prediction scenarios, respectively, explaining 3.78% to 24.17% of the phenotypic variance. Furthermore, 58 candidate genes with detailed functional descriptions common to more than two scenarios were discovered, with 40 genes being associated with color traits on chromosome 1. After analysis of haplotypes, gene expression, and annotated information, several candidate genes with high reliability were identified, including Zm00001d051328 for ear perimeter and width, zma-MIR159f for ear shape, Zm00001d053080 for kernel width and row number per ear, and Zm00001d048373 for the blue color channel of maize kernels in the red-green-blue color model. This study emphasizes the importance of researching novel phenotypic traits in maize by utilizing high-throughput phenotypic measurements. The identified genetic loci enrich the existing genetic studies related to maize ears.
1 Introduction
Maize (Zea mays L.) has become one of the paramount staple crops worldwide, surpassing the production of wheat or rice. Maize not only is consumed directly but also is extensively used as animal feed and industrial raw material, leading to an increased demand for maize in contemporary society (Gao et al., 2022). However, recent and frequent natural disasters have posed great challenges to food production, including maize. Therefore, ensuring food security and increasing maize yields are the basic objectives of maize production. Among the various methods to increase maize yield, selection and planting of new varieties is one of the most critical technologies. Morphological characteristics of maize ears are key factors in the selection of new varieties. In addition, the maize ear serves as a significant storage reservoir for photosynthetic products in maize and is directly linked to yield. Therefore, it is important to study the phenotype and genetic patterns of maize ears to improve maize yield and quality.
Phenotypic traits of maize ears have been a major concern in maize breeding, especially yield-related traits such as ear size, number of rows, and kernel size. Traditionally, these traits have been derived from manual measurements and visual calculations, which are labor-intensive and time-consuming. However, with the development of computer technology and the application of machine vision and image analysis techniques, fully automated maize variety testing systems have been developed, to capture maize ear-related traits with high-throughput and high accuracy in large-scale breeding programs. For example, Song et al. (2017) developed a high-throughput seed testing device that integrated maize cob testing, threshing, and seed testing into a single device, which significantly improved the efficiency of seed testing. Du et al. (2018) provided a panoramic surface image-based variety test method and system for maize ears assembly line, which achieved a high computational accuracy for various traits. In addition, Liang et al. (2021) designed a high-throughput and low-cost maize ear trait scorer that can be used for ear scoring. All these developments provide the foundation and technical support for high-throughput acquisition of maize ear-related traits and study of maize phenomics, which ultimately contribute to improving maize yield and food security.
An optimized research strategy, genome-wide association study (GWAS), has been widely used to study the relationship between phenotype and genotype at the population level, not only in human diseases but also as a routine tool for gene mining of quantitative traits in crops, such as maize vascular bundle (Zhang et al., 2021; Guo et al., 2022; Sun et al., 2022), plant height (Yang et al., 2014; Farfan et al., 2015; Li et al., 2016), flowering time (Hung et al., 2012; Yang et al., 2013; Yang et al., 2014; Farfan et al., 2015), and husk (Cui et al., 2016; Cui et al., 2020; Jiang et al., 2020). Furthermore, GWAS has also been applied to the study of maize ear-related traits (Xiao et al., 2016; Zhu et al., 2018; Yang et al., 2020; Zhang et al., 2022). For the morphological traits of ears and kernels, Zhou et al. (2018) identified candidate genes for maize ear length (EL) by combining three mapping strategies; Luo et al. (2022) found that genetic variation in YIGE1 contributed to maize EL and yield. In addition, candidate genes for kernel length and ear diameter were reported (Zhu et al., 2018) to include ubiquitin-activating enzyme (GRMZM2G015287), carotenoid cleavage dioxygenase (GRMZM2G446858), MYB-CC–type transcription factor, and phosphate starvation response protein 3. For the number of kernel rows, KRN4 was found to control quantitative variation in maize kernel row number (Liu et al., 2015). Zhang et al. (2022) found that a gene encoding a serine/threonine protein kinase, Zm00001d016656, was associated with five yield-related traits in multiple environments. Although there are many studies on ear-related traits, there are few studies on genetic analysis of ear-related traits obtained from high-throughput ear testing systems. Therefore, there is still a great potential to explore the genetic basis of ear-related traits using data obtained from high-throughput ear testing systems. This approach can greatly improve the efficiency and accuracy of identifying potential genes and pathways for maize ear-related traits, which will ultimately help to breed new maize varieties with higher yield and better quality.
In this study, 20 ear-related traits were obtained from 407 inbred lines from the maize association analysis population (Yang et al., 2011) using a high-throughput phenotypic measurement method and system based on panoramic surface image (Du et al., 2018). These traits included maize ear size, shape, number, and color, 13 of which were novel and different from the traditional ear testing traits. These 20 ear-related traits were analyzed by GWAS using Genome-wide efficient mixed model association (GEMMA) (Zhou and Stephens, 2012), which was obtained from two scenarios and best linear unbiased prediction (BLUP) values. The objectives of this study were (1) to analyze the phenotypic characteristics of ear-related traits, with emphasis on the significance of the novel traits, and (2) to identify the key genetic loci and candidate genes for ear-related traits, providing a reference for the genetic basis of the novel ear testing traits.
2 Materials and methods
2.1 Plant materials and sample collection
The materials used in this study were 407 inbred lines from the maize association mapping panel published by Yang et al. (2011). These lines were classified into four subpopulations: non-stiff stalk (NSS) with 108 lines, stiff stalk (SS) with 31 lines, tropical-subtropical (TST) with 175 lines, and 93 mixed lines (Mixed). The plants were cultivated at two sites in China: in 2019 (SY) at the Nanfan breeding station of Maize Research Center, Beijing Academy of Agriculture and Forestry (Yazhou District, Sanya City, Hainan Province; longitude, 109.1832; latitude, 18.3623) and in 2020 (BJ) at the Beijing Academy of Agriculture and Foresting Science (Tongzhou District, Beijing City; longitude, 116.65; latitude, 39.92). All field trials were conducted in a randomized complete design with planting density and water and fertilizer management based on local field (Lu et al., 2020). At maturity, approximately five uniform ears of each inbred line were selected for phenotypic measurements.
2.2 Phenotype acquisition of maize ear
Maize ear-related phenotype acquisition was carried out by a high-throughput phenotypic measurement method and system (Figure 1A) based on panoramic surface image (Du et al., 2018). As shown in Figure 1, the system consisted of an imaging unit, computing unit, and ear transmission unit and included a roller conveyor for automatic and continuous transfer of maize ears (Figure 1B). The imaging unit was composed of an industrial camera and two light emitting diode (LED) illumination lamps, which detected ear movement and collected real-time images to create an image sequence (Figure 1C) covering the entire surface of the ear.
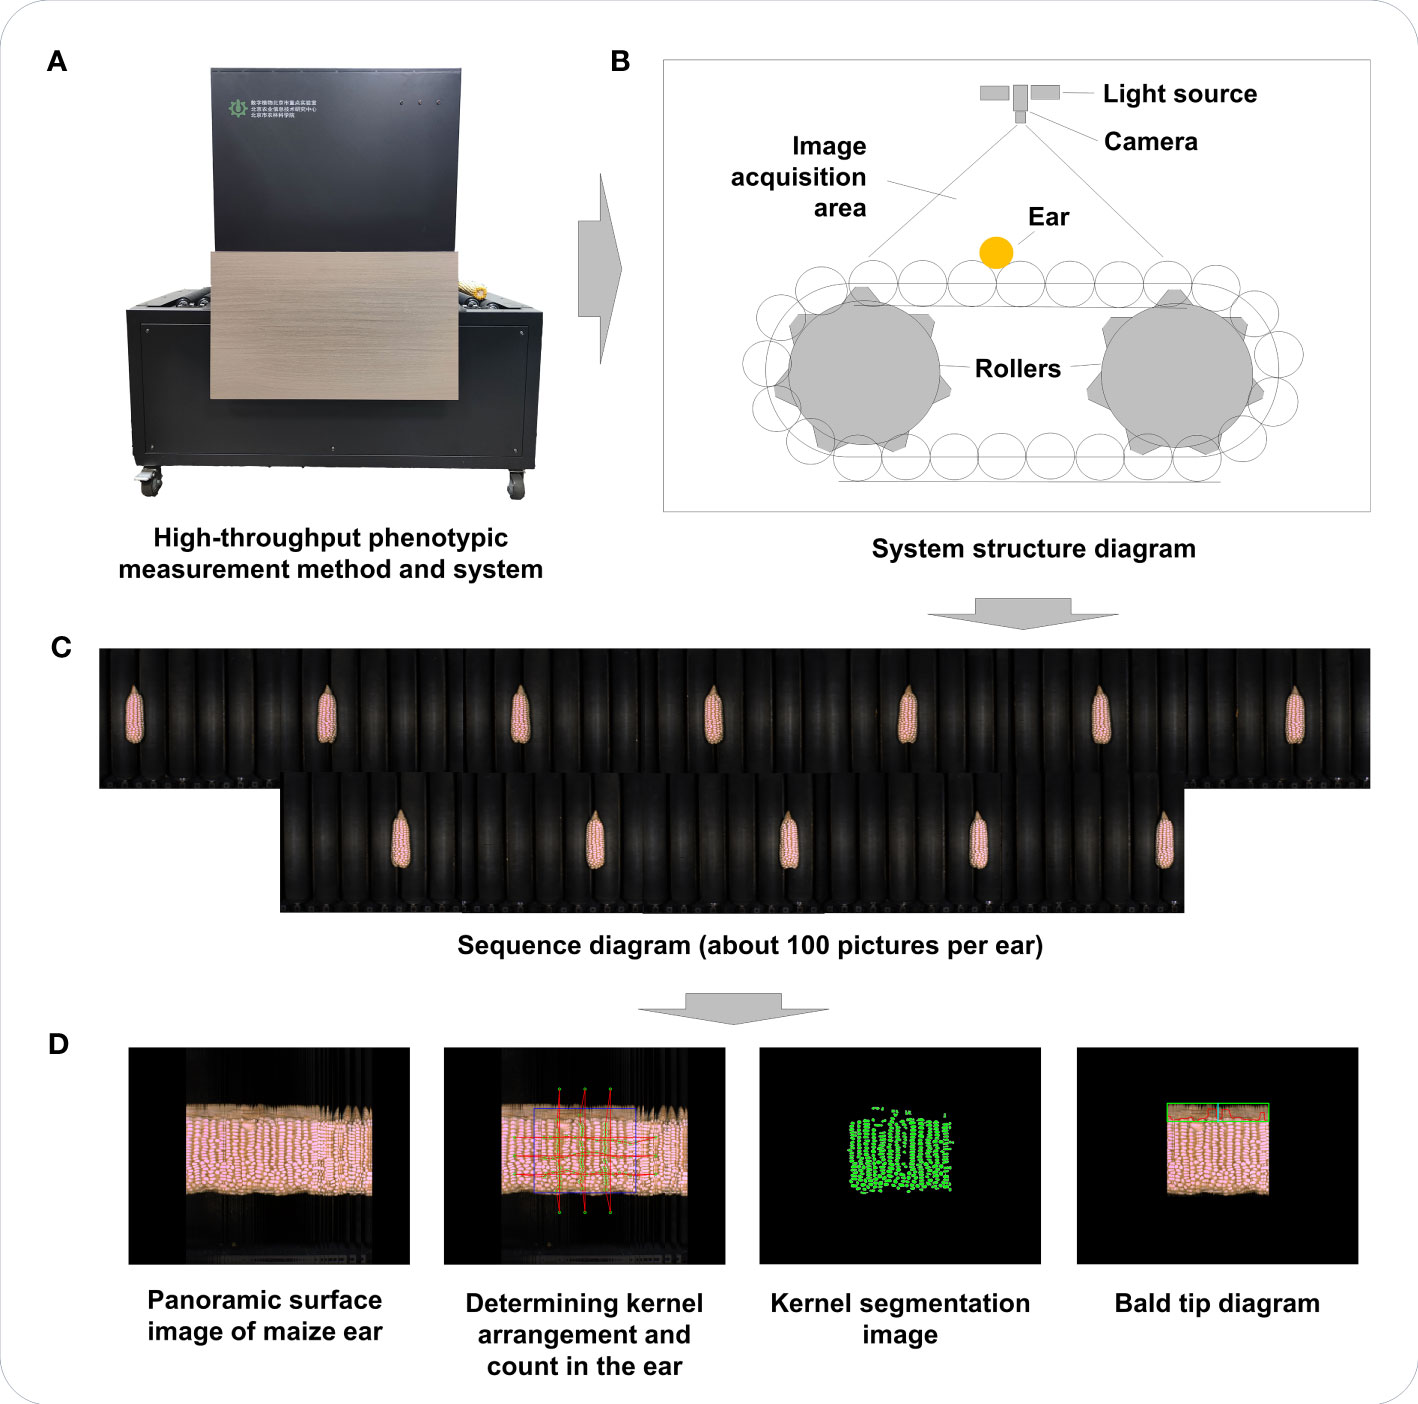
Figure 1 Flowchart of conducting high-throughput phenotypic measurements of maize ear traits. (A) The high-throughput phenotypic measurement method and system used in this study. (B) System structure diagram. (C) Image sequence diagram of maize ear (from left to right, then from top to bottom). (D) Panoramic surface image and image segmentation for maize ear.
The system had a pallet translation speed of 121 pixels/s, with an imaging unit equipped with two 30-W LED illumination lamps and a high-frame-rate charge coupled device (CCD) industrial camera [MER-125 series, 1/3-inch CCD sensor, 30 frames per second (fps)] with resolution of 1.25 million pixels. The working frame rate for camera image acquisition was approximately 15 fps, and the image was saved in a JPEG format with a resolution of 1,292 × 964 pixels and a pixel size of 3.126 × 10⁻² cm/pixel. OpenCV was used for image processing, and Visual C++ was used to develop modules for corncob state detection, image acquisition, image stitching, phenotype calculation, and statistical analysis modules (Du et al., 2018).
By analyzing the color differences between the background and the roller chain in ear images, the state of the ear was detected, triggering image acquisition upon placing the ear in the imaging area. Ear segmentation employed color features, and the ear’s shape was enhanced through morphological calculations. It is important to note that the ear image represents a two-dimensional projection of the ear on a plane. On the surface of the ear, the kernels exhibited complex distortions within the image, and the shape and size of the kernels varied significantly across different positions. Comparatively smaller distortions were observed in the small region near the central axis of the ear. Extracting regions with the least distortions from the sequence of ear images allowed for stitching them together to obtain a panoramic image of the ear’s surface. Effective kernels were identified and extracted using ear boundary detection, kernel segmentation, and validity identification techniques. Figure 1D shows, notably, that determining the number of rows and kernels per row involved the calculation of centroids for each ear kernel to establish a distribution node reflecting kernel arrangement. Beyond the kernel distribution area, a set of nodes (including a start point and an end point) was defined to represent the direction of kernel arrangement. The Delaunay triangulation method was then applied to connect these nodes, forming a triangular mesh that represented the adjacent relationships between the kernels. The Bellman–Ford method was subsequently utilized to determine the shortest path between each start and end point group, indicating the number of kernels passed through each path and representing the number of rows or kernels per row. Twenty ear-related traits were obtained using this high-throughput phenotypic measurement method and system (Table 1).
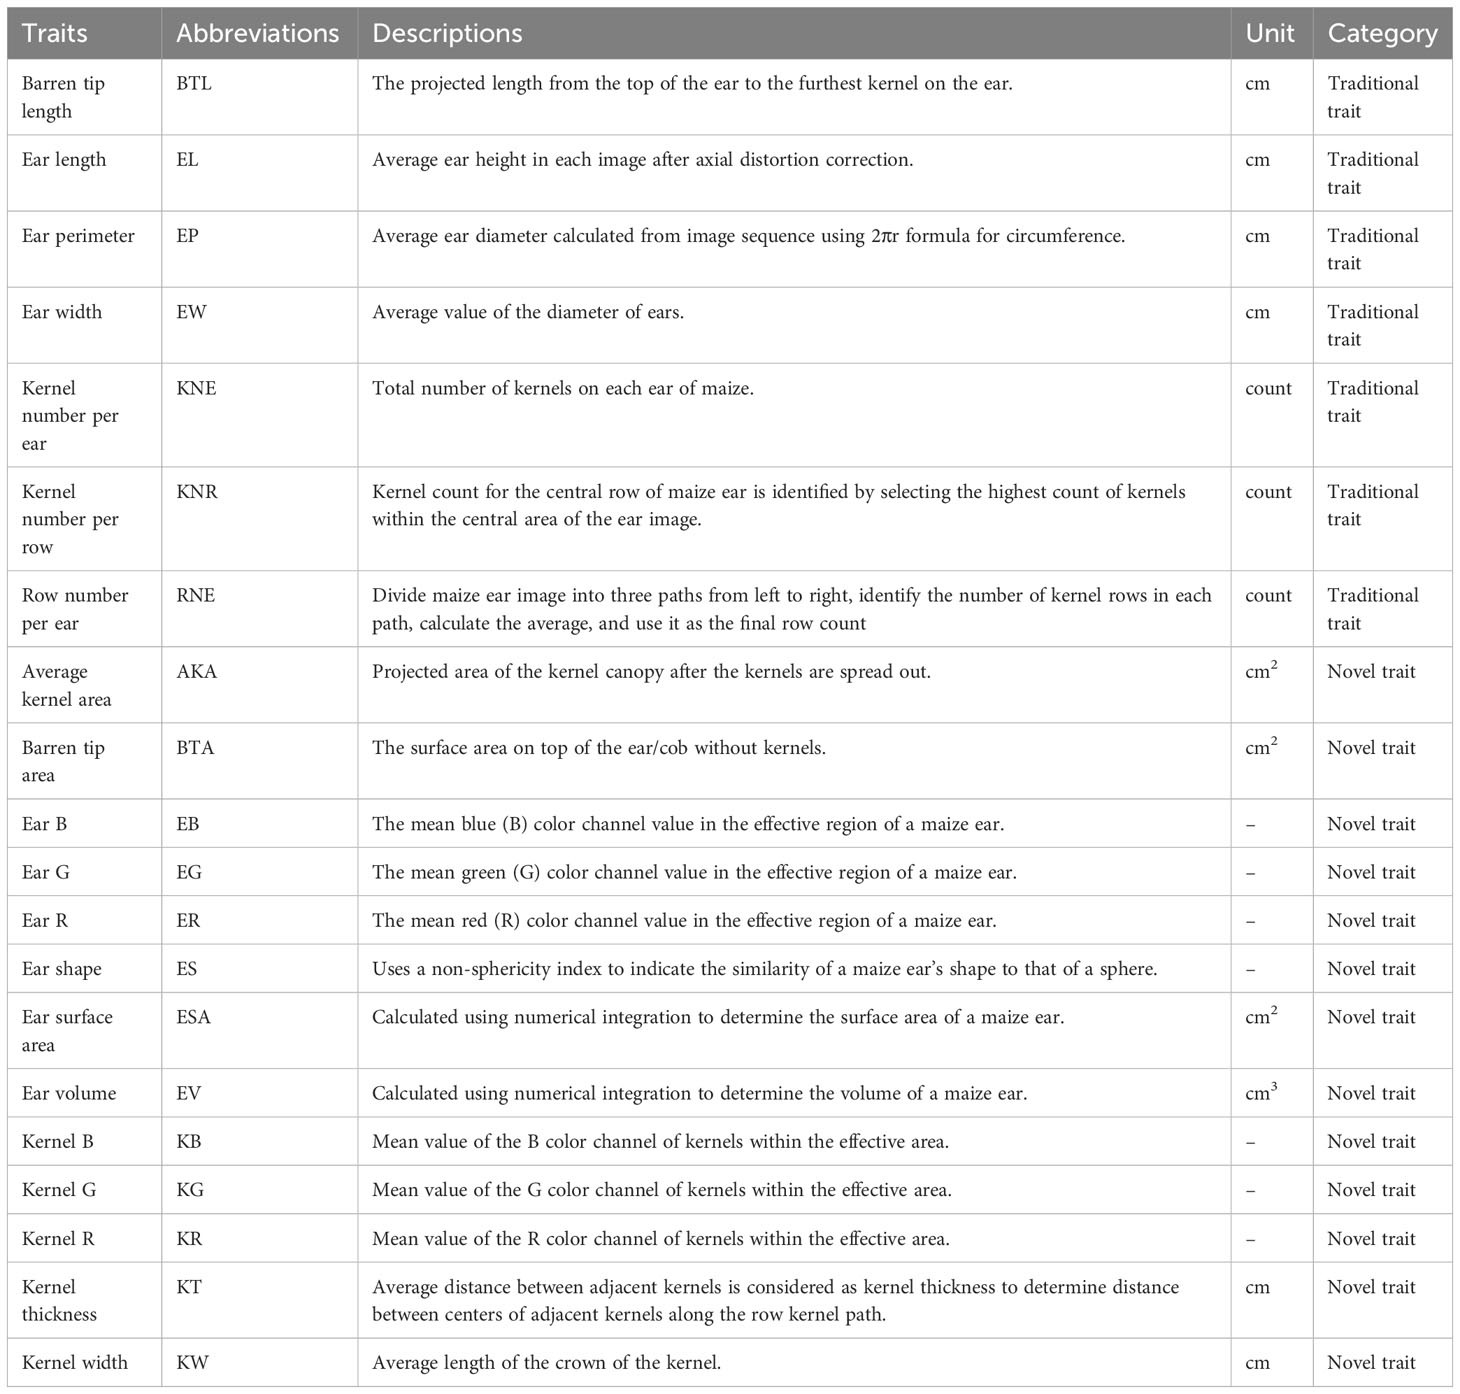
Table 1 Description of 20 traits obtained by high-throughput phenotypic measurement method and system.
2.3 Statistical analysis of phenotypic data
Descriptive statistical analysis of phenotypic data distributions was conducted using R (version 3.6.3) software, including the generation of histograms. An analysis of variance (ANOVA) was carried out to assess the differences in traits across subpopulations, utilizing the Holm method (Holm, 1979) to account for multiple testing corrections. In addition, the relationship between traits was evaluated using the Spearman’s rank correlation coefficient method, and, to ensure accurate and robust results, Holm correction (Holm, 1979) was applied for multiple testing.
The BLUP for the 20 phenotypic traits was estimated with the following linear mixed model in ASReml-R v.4.0 by using the “asreml” function of R package asreml (Butler, 2009). The formula for BLUP is
where Y is the vector of phenotypic values, X is the design matrix for fixed effects, β is the vector of the coefficients for fixed effects, Z is the design matrix for the random effects, u is the vector of the random effects, and ε is the vector of residuals. The BLUP values were considered as new phenotypic values in the subsequent phenotypic analysis and GWAS analysis.
Broad-sense heritability (H2) was calculated for each trait as follows:
where L is the number of sites; R is the number of replications; and , , and represent the genotypic variance, the interaction between inbred lines and environmental variance, and the error variance, respectively. The analysis of heritability was conducted using the R package asreml (Butler, 2009).
2.4 Genome-wide association study
Genotypic data of maize association mapping panel were obtained from Maizego (www.maizego.org/Resources.html). Quality control of genotypic data of 407 inbred lines was performed, leaving 798,048 SNPs with a minor allele frequency (MAF) more than 0.05 and a call rate greater than 0.9. The GWAS for 20 ear-related traits from BJ, SY, and BLUP were conducted using GEMMA (Zhou and Stephens, 2012). GEMMA builds upon the mixed linear model (MLM) framework and leverages eigen decomposition to increase computational speed significantly. To account for population structure, the first 10 principal components calculated by principal component analysis (PCA) of the 798,048 SNPs using PLINK 1.09 software were used. GEMMA with 798,048 SNPs and the parameter “-gk 2” was employed to calculate the relative relationship of 407 inbred lines. P-values for SNP-trait associations were calculated using the likelihood ratio test, and Genetic Type I error calculator (Li et al., 2012) was used to establish the significant threshold for SNPs linked to traits. A suggestive P-value threshold of 2.50E-6 (1/effective number = 1/399313.86) was adopted to define statistical significance. Finally, Manhattan plots and quantile-quantile (QQ) plots were utilized to visualize the results. All candidate genes were annotated by annotate variation (ANNOVAR) (Wang et al., 2010) according to the maize B73 reference genome (B73 RefGen_v4) available in EnsemblPlants (http://plants.ensembl.org/Zea_mays/Info/Index) and national center for biotechnology information (NCBI) Gene database (https://www.ncbi.nlm.nih.gov/gene).
The degree of explanation of phenotypic variation (PVE) for each SNP was calculated as follows:
where N is the sample size, se is the standard error of effect size for the genetic variant of interest, beta is the effect size for the genetic variant of interest, and af is the MAF for the genetic variant of interest.
2.5 Haplotype analysis and expression heatmap of candidate genes
Haplotype analysis was performed on the SNPs that were significantly associated with each trait. The Confidence Intervals method in Haploview 4.2 (Barrett et al., 2005) was utilized, allowing for the comparison of SNPs within the 95% confidence interval of D′, with each comparison being classified as “strong linkage disequilibrium,” “inconclusive,” or “strong recombination.” SNPs with over 95% of comparisons categorized as “strong linkage disequilibrium” were grouped as a block, which indicates a strong linkage among these SNPs. Haploview’s visualization tool was utilized to display the linkage disequilibrium (LD) values. All adjacent SNPs within a block showed LD values above 0.9. Finally, the phenotypic differences among different haplotypic materials were analyzed using ANOVA.
Candidate gene expression levels for different maize tissues of B73 were obtained from the MaizeGDB qTeller database (https://qteller.maizegdb.org/) and visualized using data from the Kaeppler lab (Stelpflug et al., 2016) and the Briggs lab (Walley et al., 2016) to generate heatmaps. The pheatmap package (Kolde, 2019) in the R 4.2.1 was used to generate the heatmap.
3 Results
3.1 Phenotypic extraction of maize ear
A high-throughput phenotypic measurement method and system, based on panoramic surface image, was utilized in our study to replace conventional approaches for assessing maize ear-related traits. This novel approach enabled the extraction of not only the traditional traits such as EL, row number per ear (RNE), and kernel size but also the multi-scale traits such as ear shape (ES) and color. A total of 2,333 valid image samples from 407 inbred lines were obtained, resulting in the acquisition of 20 ear-related traits. These traits were categorized into two groups on the basis of the acquisition method: seven traditional traits and 13 novel traits. The high-throughput phenotypic measurement method and system employed in this study facilitated a more efficient evaluation of phenotypic traits for future research. Detailed descriptions and definitions of the 20 ear-related traits can be found in Table 1.
3.2 Phenotypic characteristics of maize ear
The statistical analysis of 20 ear-related traits from two sites (Supplementary Table 1) revealed a wide range of continuous variation among the inbred lines in the maize association analysis population. The variation coefficient spanned from 0.0718 to 0.5575, indicating significant differences in phenotypic traits. Specifically, within the BJ group, the coefficients of variation ranged from 0.0718 to 0.5572. For the SY group, the coefficients of variation fell between 0.0922 and 0.5575. Moreover, histograms of data from both BJ and SY suggested that all traits were quantitative, displaying a continuous variable distribution (Figure 2). These findings highlight the extensive and varied nature of phenotypic traits within the population, with practical applications for future research.
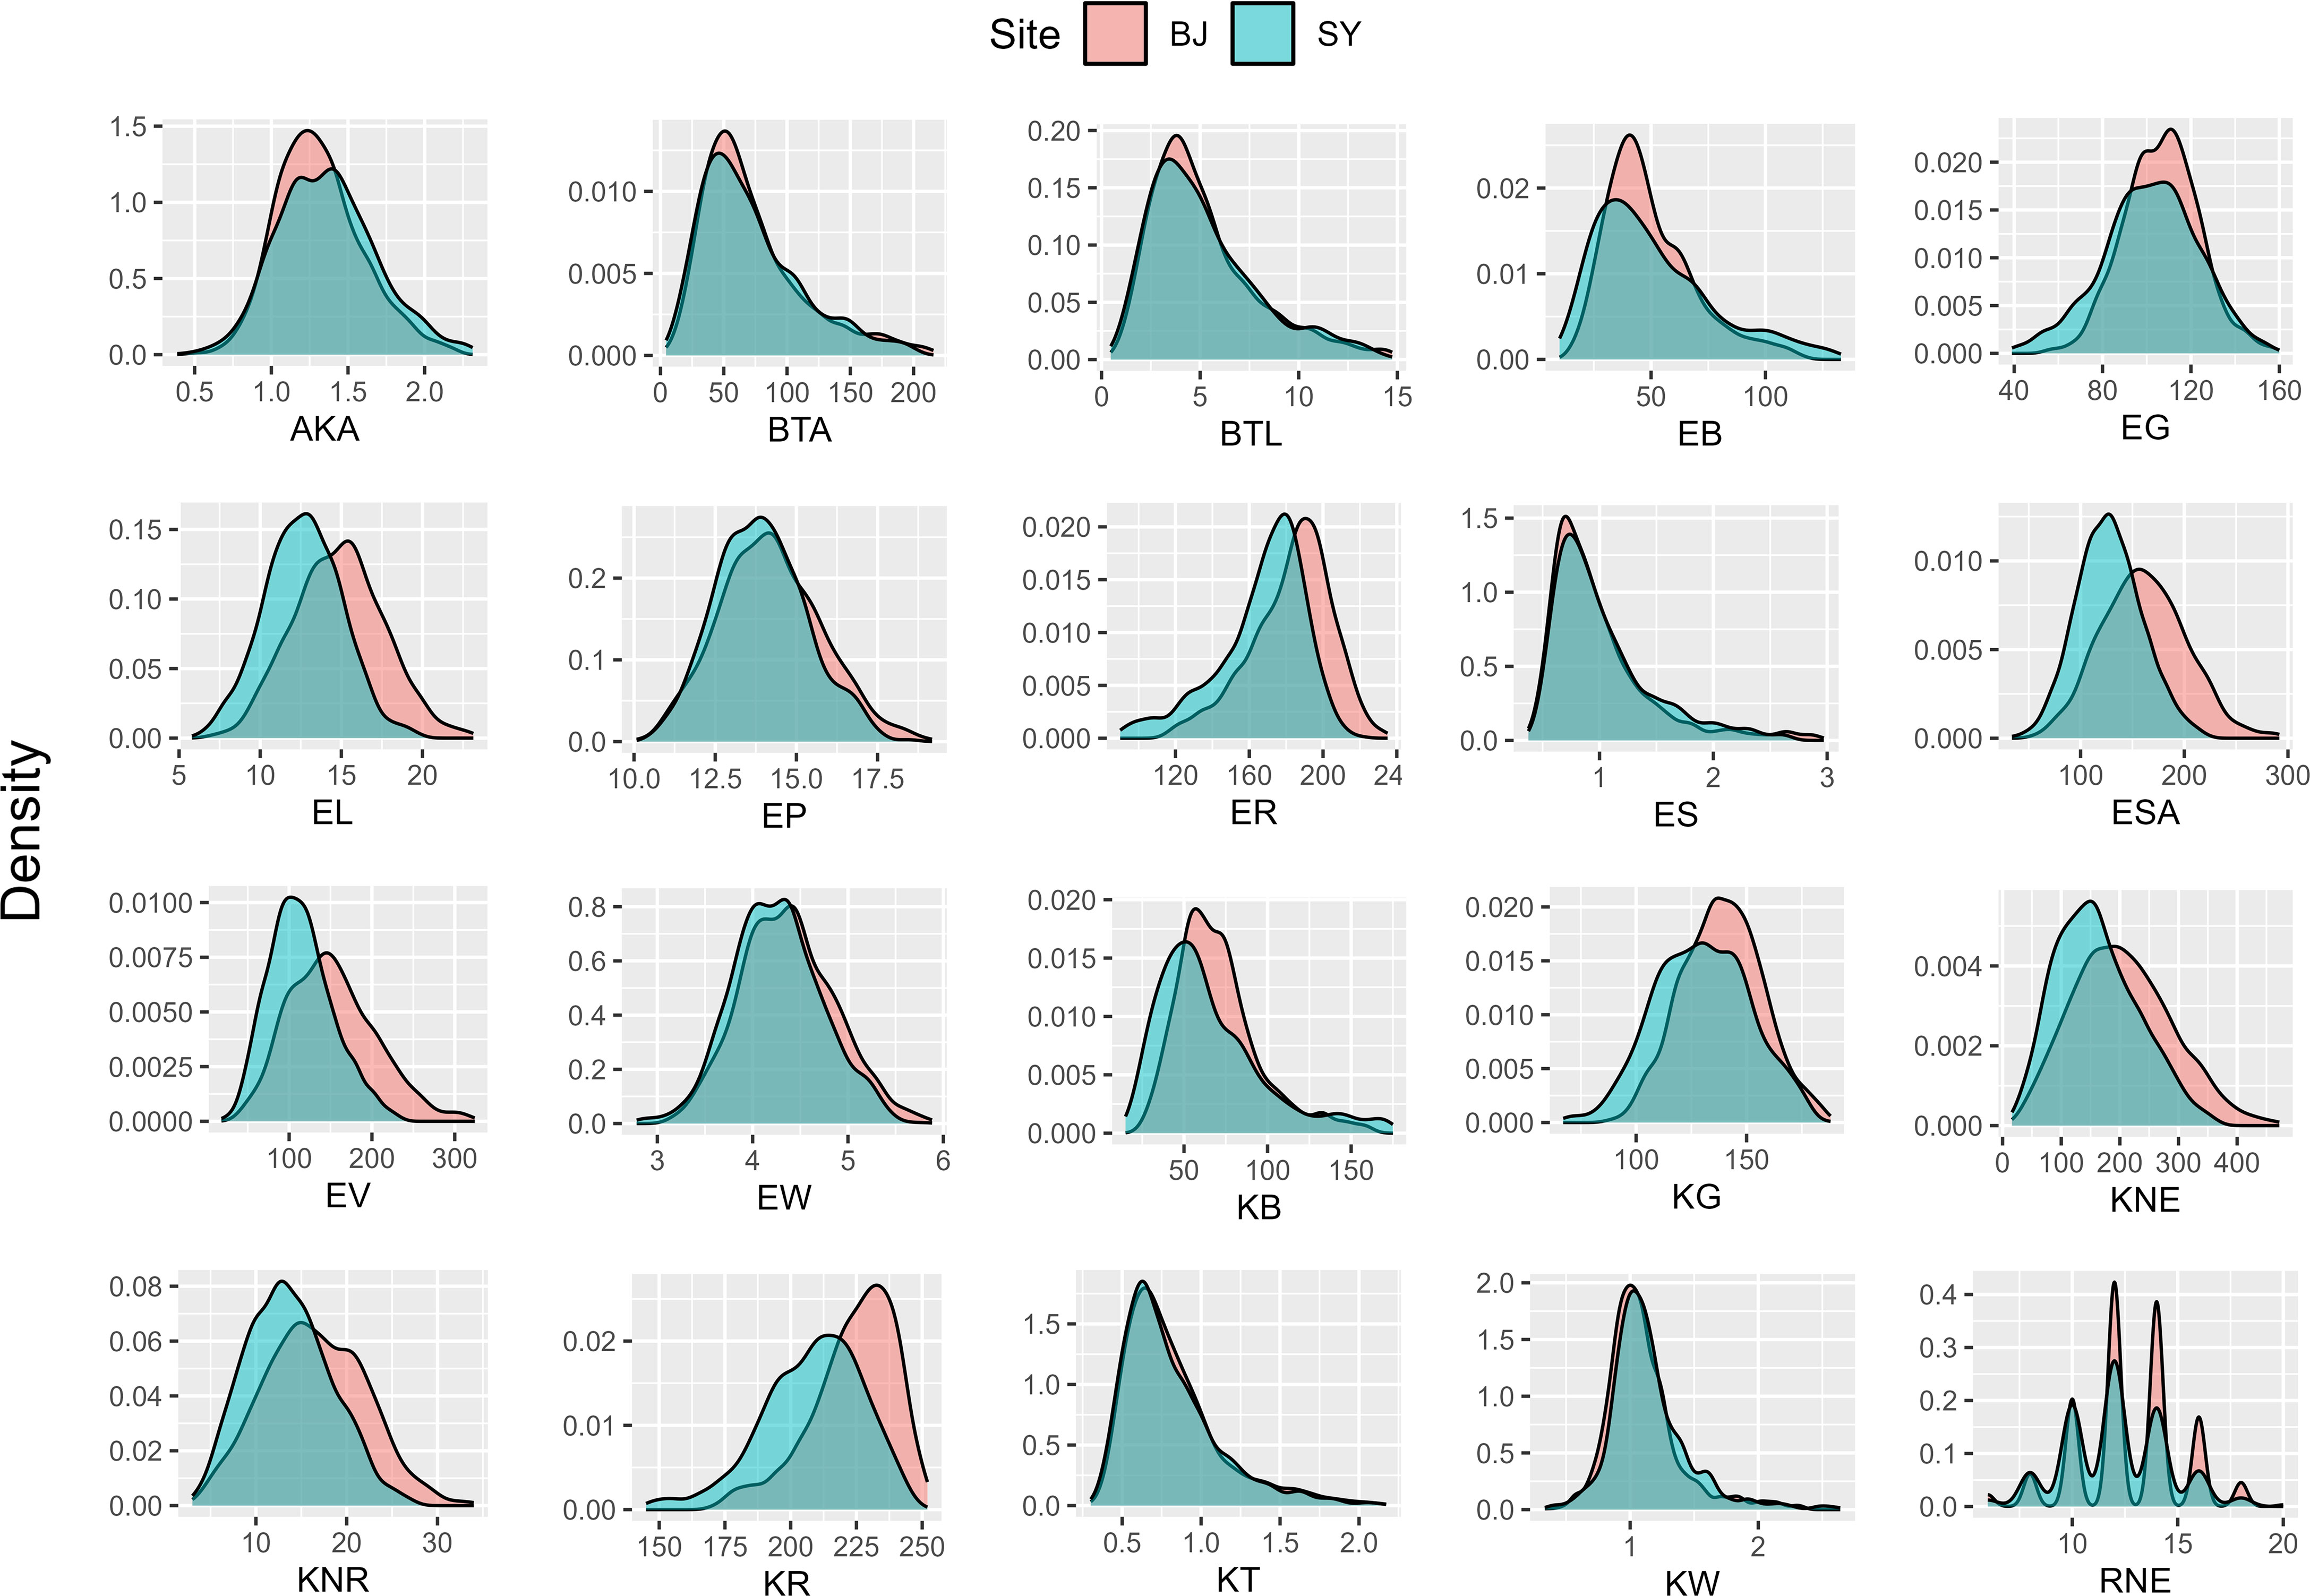
Figure 2 Histogram of 20 ear-related traits obtained from two sites. BJ, Beijing; SY, Sanya.
A comprehensive analysis of heritability was carried out for 20 ear-related traits using high-throughput phenotypic measures and systems. The results revealed a range of heritability values from 0.3002 to 0.8320 (Supplementary Figure S1). Notably, three color traits displayed high heritability values (H2 > 0.82), warranting further exploration of their underlying genetic mechanisms. In contrast, both bald tip traits [barren tip length (BTL) and barren tip area (BTA)] exhibited modest heritability (0.3002 and 0.3447, respectively), suggesting that environmental factors may have a greater impact on their formation. Overall, 70% of ear traits displayed heritability greater than 0.5, indicating that genetic factors still greatly influence maize ear traits. These findings provide valuable insights into the genetic and environmental factors that contribute to phenotypic variation in maize ear traits.
3.3 Relationship among ear traits in maize
The correlation between traits was determined using Spearman’s rank correlation coefficient method, and the conclusive correlation results were obtained by applying multiple testing corrections and reporting the corrected P-values. The analysis revealed several significant correlations among the traits. Specifically, a strong positive correlation was found between kernel number per row (KNR) and kernel number per ear (KNE) with r = 0.85 and adjusted P < 0.05. Furthermore, these two traits were significantly and positively correlated with EL, EV, and ear surface area (ESA) with r > 0.51 and adjust P < 0.05 but were significantly negatively correlated with ES and kernel thickness (KT) with r < −0.49 and adjust P < 0.05. In addition, the two bald tip traits (BTL and BTA) exhibited a strong positive correlation with each other with r = 0.97 and adjust P < 0.05. They were also found to have a significant negative correlation with average kernel area (AKA) (r > −0.33, adjust P < 0.05) but a significant positive correlation with ES (r < −0.49, adjust P < 0.05). Notably, ES, a novel trait investigated in this study, was found to be correlated with traditional traits of interest, KNR and KNE, as well as bald tip traits (BTL and BTA), highlighting its importance as a reference for the screening and determination of typical traits of maize ear. Finally, all six color traits showed a significant positive correlation with each other (r > 0.46, adjust P < 0.05) as shown in Figure 3.
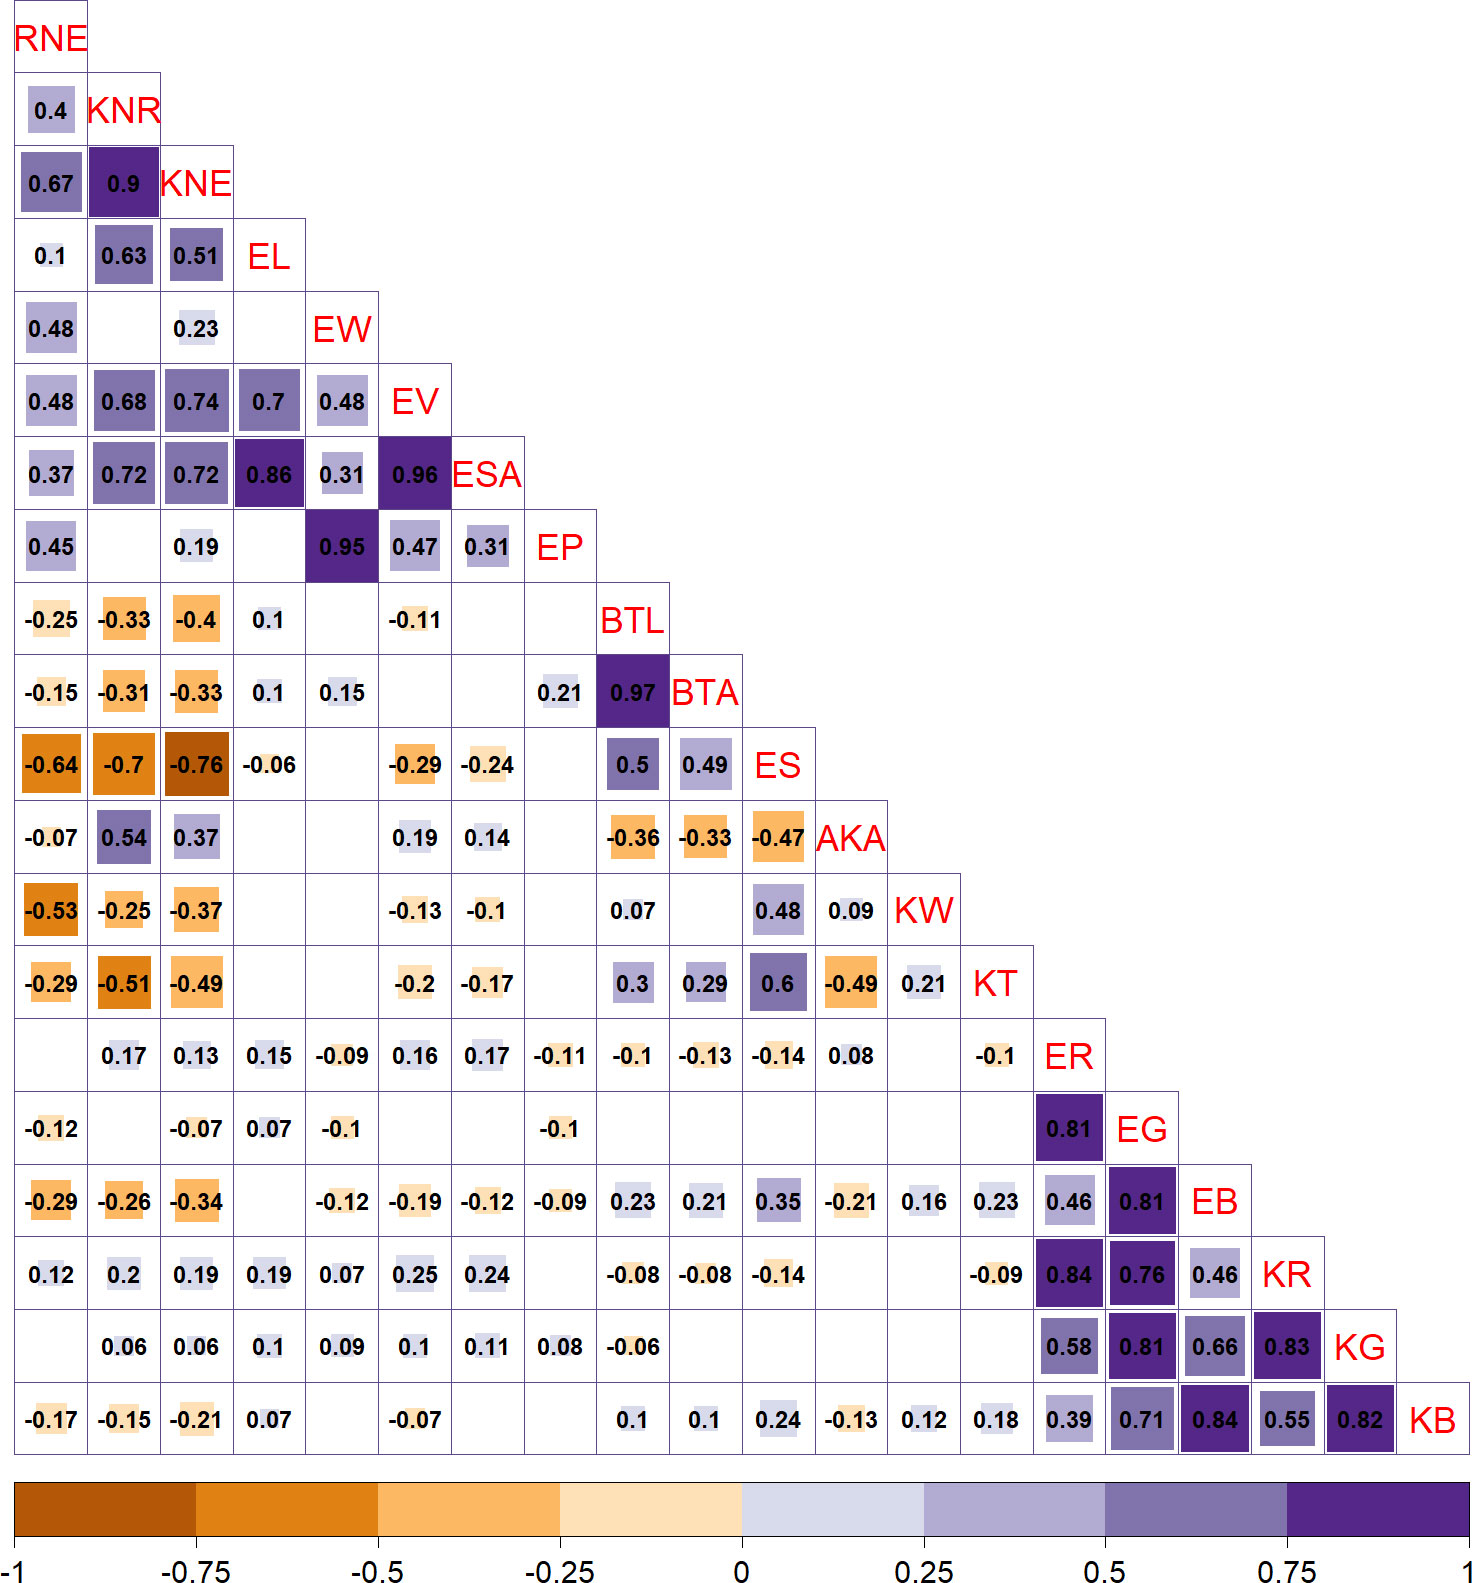
Figure 3 Results of correlation analysis among 20 ear-related traits. The size of the square in the upper right corner represents the significance, as per adjusted P-values. The number in the lower left corner represents the correlation coefficient.
3.4 Differences in ear traits among subpopulations
To further analyze the differences among subpopulations, a pairwise comparison test analysis of 20 ear-related traits in maize was conducted (Figure 4). The results showed that the inbred lines of TST subpopulation had distinct characteristics and were significantly different from at least one subpopulation in 14 traits (70%) (adjust P < 0.05). Among them, RNE, KNE, and ER showed significant differences between TST and the other three subpopulations (adjust P < 0.05) (Figure 3). It indicated that the inbred lines of TST were significantly different from other subpopulations in row numbers per ear, kernel numbers per ear, and ear color, and these traits could be used as selection characteristics for maize varieties. Interestingly, ER of TST was significantly higher than that in other subpopulations, whereas KNE and RNE were significantly lower. Moreover, the distinctions between TST and NSS were more pronounced, with KR, EB, ER, and EG being significantly higher in TST than that in NSS, and EP, ESA, EV, and ear width (EW) being significantly lower in TST. It suggested that tropical materials were higher than temperate materials in color red-green-blue (RGB) channel values, and tropical materials were smaller than temperate materials in ear size and morphology.
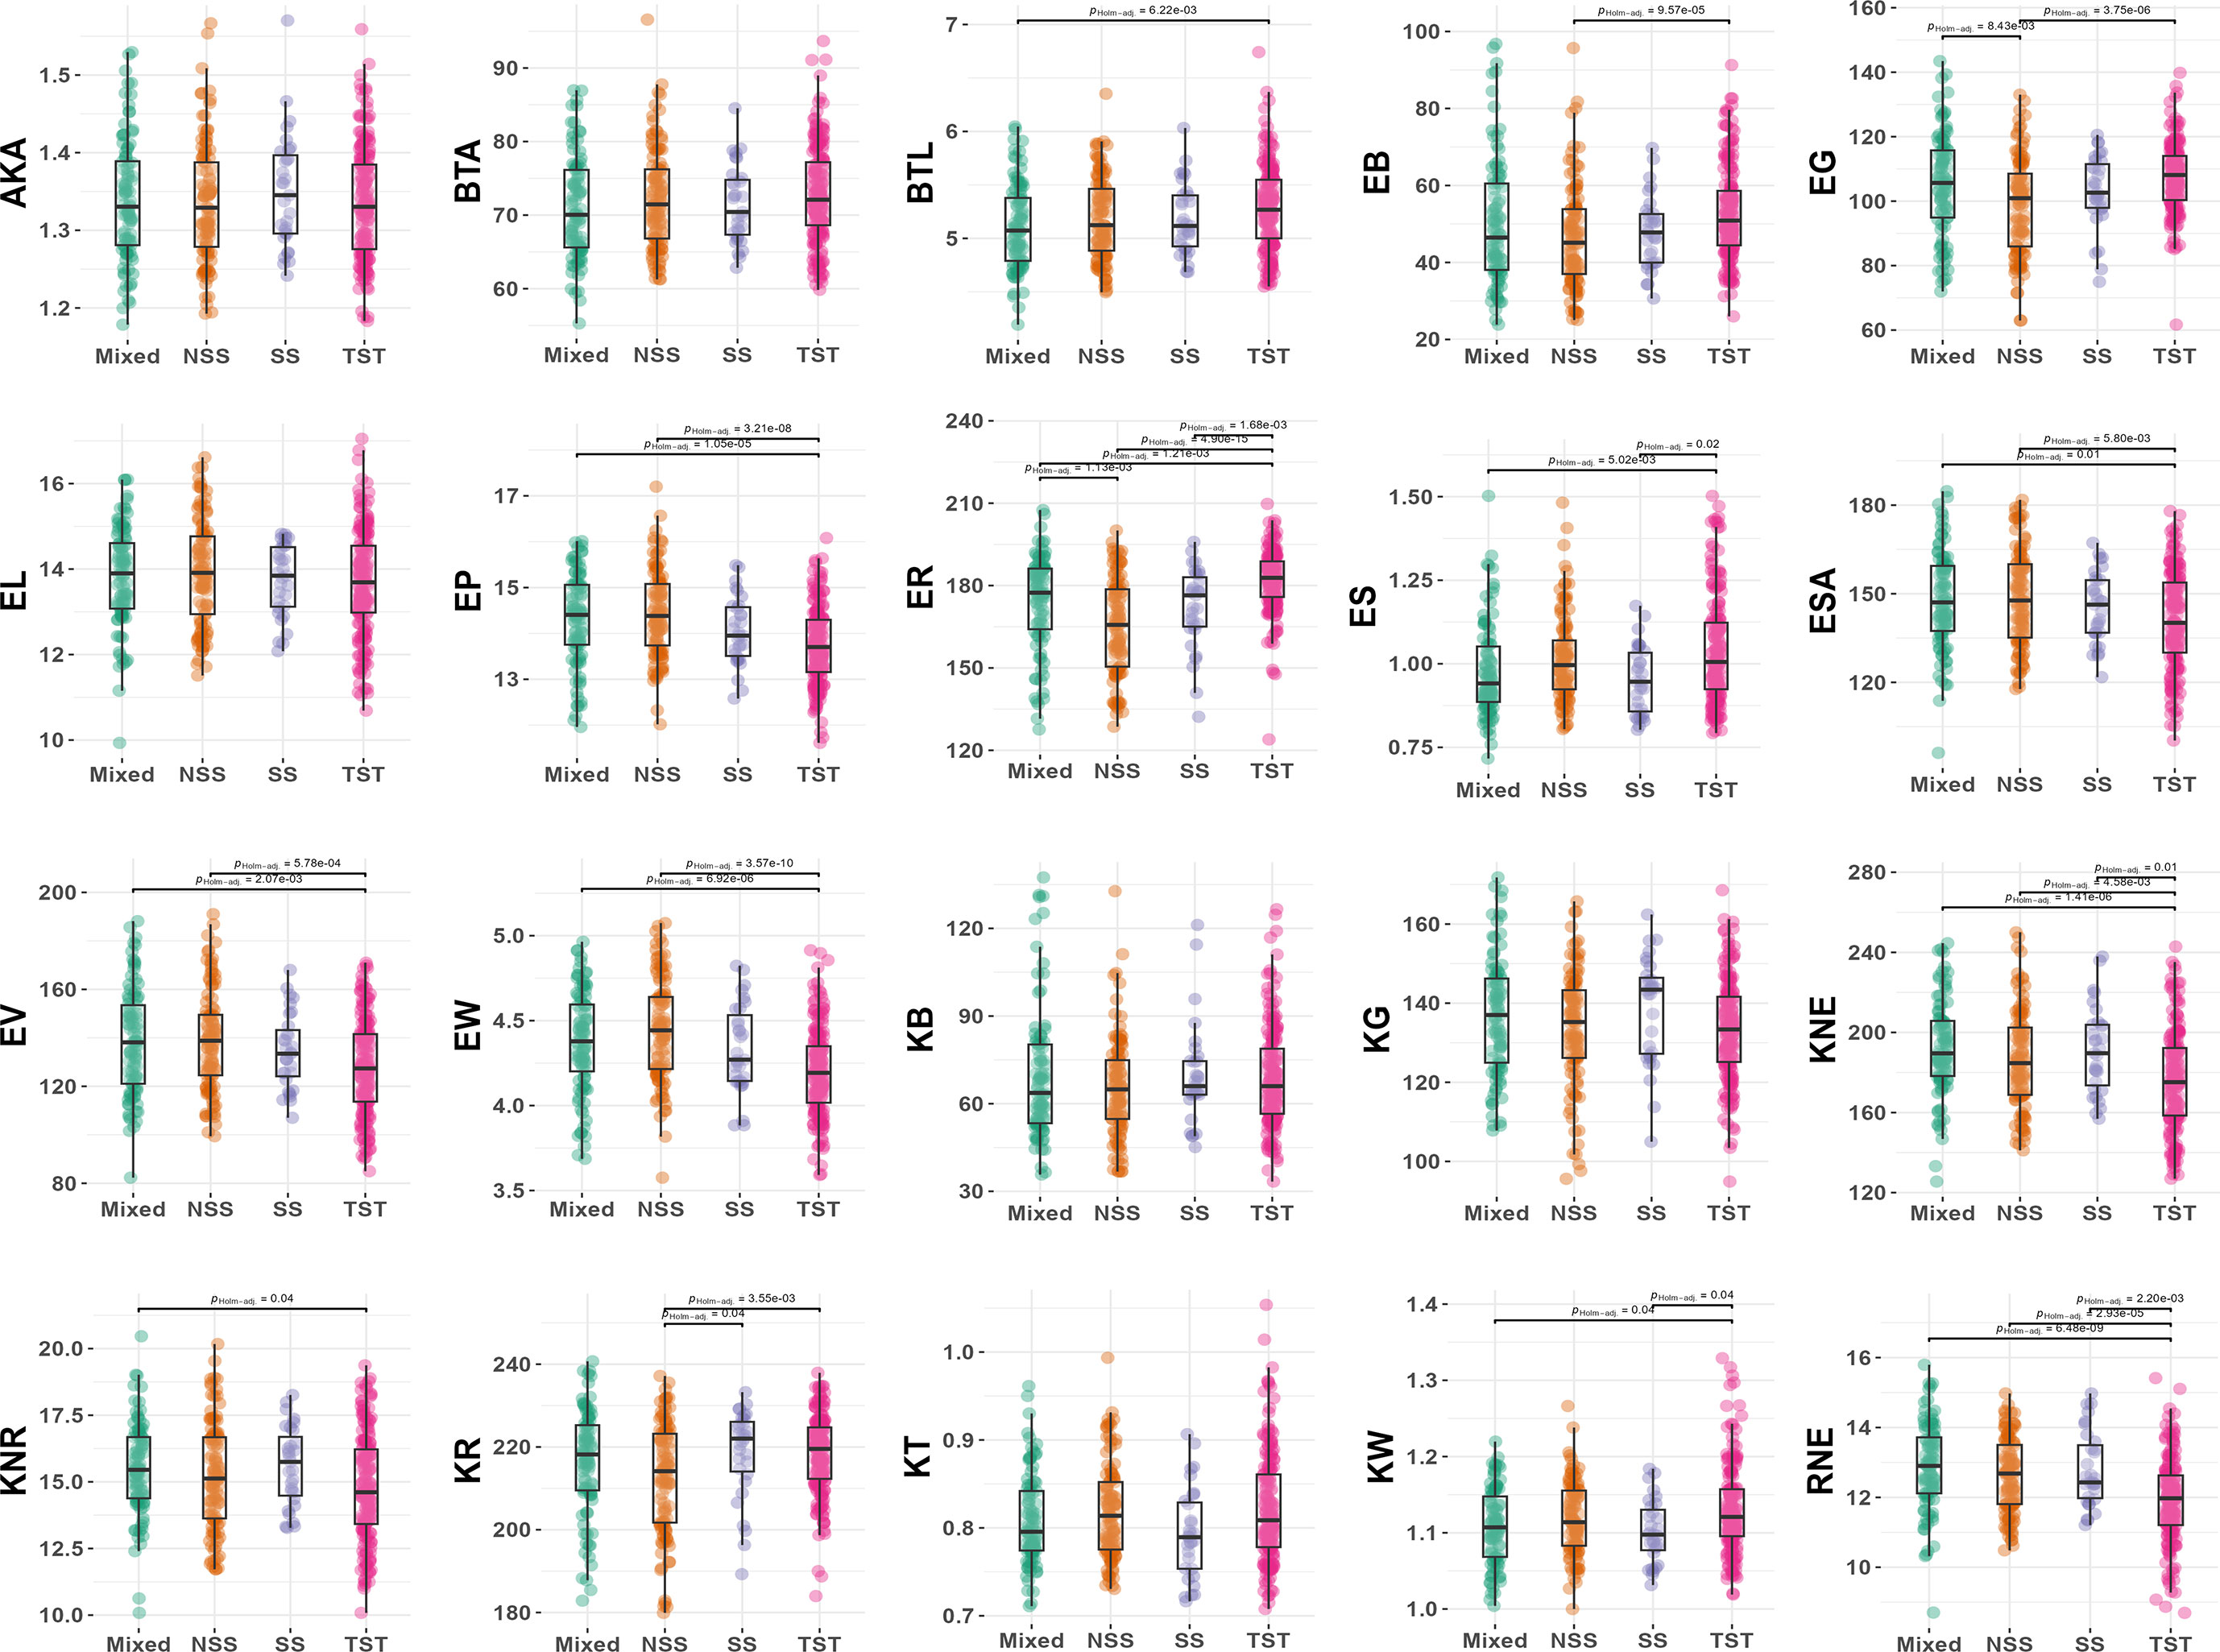
Figure 4 Phenotypic differences among four subpopulations. NSS, non-stiff stalk lines; SS, stiff stalk lines; TST, tropical-subtropical lines; Mixed, mixed lines.
However, AKA, BTA, EL, KT, kernel B (KB), and kernel G (KG) did not show significant differences among subpopulations, indicating that these traits alone cannot be used as selection characteristics to differentiate between tropical or subtropical materials from temperate ones in maize varieties.
3.5 Significant SNPs identified by GWAS
In this study, a comprehensive GWAS analysis was conducted on 20 ear-related traits, utilizing GEMMA under three scenarios: BJ, SY, and BLUP. The analysis yielded 275, 434, and 362 significant SNPs for BJ, SY, and BLUP, respectively. Of these, the number of significant SNPs detected varied from 0 to 25 for traditional traits and from 2 to 247 for novel traits in a single scenario (Table 2). It is noteworthy that both traditional and novel traits showed detectable SNPs. The results highlight the importance of investigating each trait because they tend to have genetic variants that may be linked to important phenotypic differences. Furthermore, the discovery of significant SNPs for novel traits allows for the possibility of exploring previously unexamined aspects of ear-related traits.

Table 2 Summarized statistical results of GWAS for 20 ear-related traits.
The phenotypic interpretation of the significantly associated SNPs varied across different traits, with the PVE by all SNPs ranging from 3.78% to 24.17%. Most of the loci showed a small PVE, averaging 7.06% (Table 2). However, 24 significant loci for three ear color traits [ear R (ER), ear G (EG), and ear B (EB)] had PVEs of more than 15%. Notably, chr1.s_48334591 and chr1.s_48336474, both located on chromosome 1, were common to all three color traits. These findings suggest that certain SNPs can explain a substantial proportion of the phenotypic variation in ear color traits and can thus be utilized in breeding programs aimed at improving these traits.
3.6 Identification and annotation of candidate genes
Using the maize B73 reference genome (B73 RefGen_v4) available in EnsemblPlants, gene annotation was performed on all SNPs that displayed significant associations with 20 ear-related traits across three distinct scenarios. As a result, 174, 203, and 174 candidate genes were identified for BJ, SY, and BLUP, respectively. The number of candidate genes varied widely depending on the scenario and trait evaluated. For traditional traits, the number of candidate genes was generally modest, with a range of 0 to 15, whereas, for novel traits, there was a broader range, spanning from 2 to 95. Interestingly, our comparison of SNP results with gene annotations revealed that some genes were associated with multiple SNPs. This was particularly notable for color traits, suggesting that these genes could play a key role in regulating ear-related traits.
To further investigate the candidate genes obtained from the three scenarios, we searched for their detailed functional descriptions in NCBI Gene databases. A total of 58 candidate genes associated with ear-related traits were found to have detailed functional descriptions common to more than two scenarios (Table 3). Of these, 40 genes were associated with color traits, and it was observed that 82.5% (33/40) of these genes were located on chromosome 1. This finding indicates that the region in question is most likely associated with the control of ear or kernel color in maize.
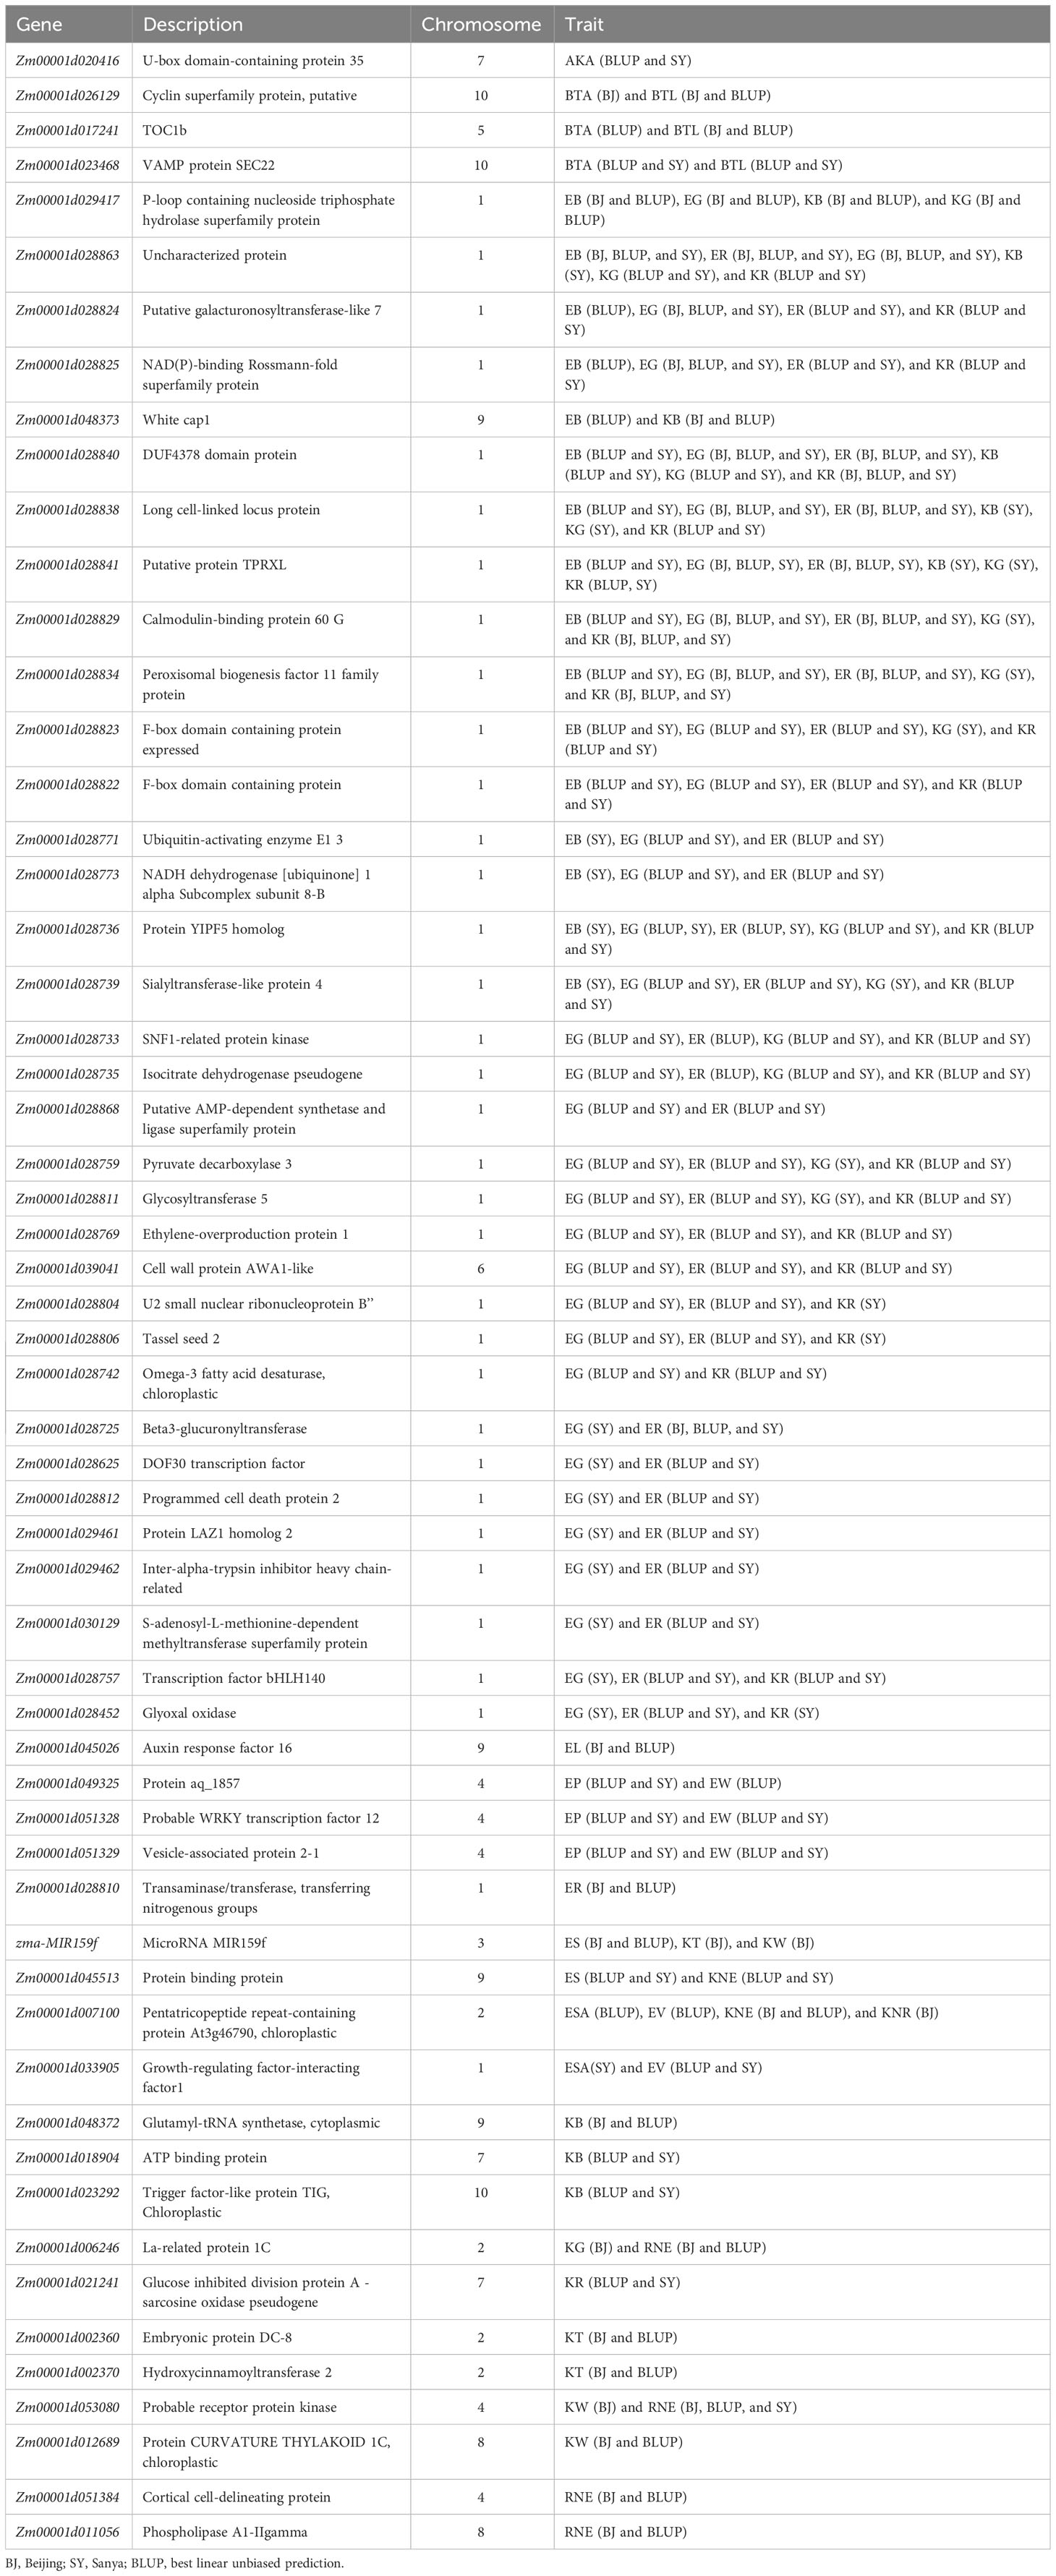
Table 3 Candidate genes for 20 ear-related traits identified in at least two scenarios.
3.7 Haplotype analysis of significant loci
The significant SNPs associated with ear-related traits were subjected to haplotype analysis using Haploview 4.2 (Barrett et al., 2005). Inbred lines within the population exhibited varying combinations of haplotypes at multiple SNP loci, thereby revealing the genetic diversity and variation of the maize population under study. Both traditional and novel ear-related traits were studied in this study, including six novel color traits defined by RGB values. For the traditional trait EL, two SNPs located within the exon region of Zm00001d011060 on chromosome 8 (chr8.s_137865777 and chr8.s_137865788) were identified in two scenarios (BLUP and BJ) and significantly associated with EL. These SNPs formed two haplotypes, GG and AA, with respective population frequencies of 0.762 and 0.237. Inbred lines with the AA haplotype had longer EL compared with those with the GG haplotype (Supplementary Figure S2). For the novel trait EV, two SNPs (chr2.s_222256320 and chr2.s_222256326) located within the exon region of Zm00001d007100 on chromosome 2 formed two haplotypes (CT and TC), which exhibited notable differences in ear volume (EV) (Figure 5). The population frequencies of CT and TC were 0.935 and 0.064, respectively. Ears with the TC haplotype had a larger volume when compared with those with the CT haplotype. For the color trait KB, two SNPs (chr9.s_155231343 and chr9.s_155231598) located within the intron and exon region of Zm00001d048372 on chromosome 9 were significantly associated with KB and identified in two scenarios (BLUP and BJ). These SNPs formed two haplotypes (AT and GC) with respective population frequencies of 0.886 and 0.101, and inbred lines with the AT haplotype had a higher KB value compared with those with the GC haplotype (Figure 6).
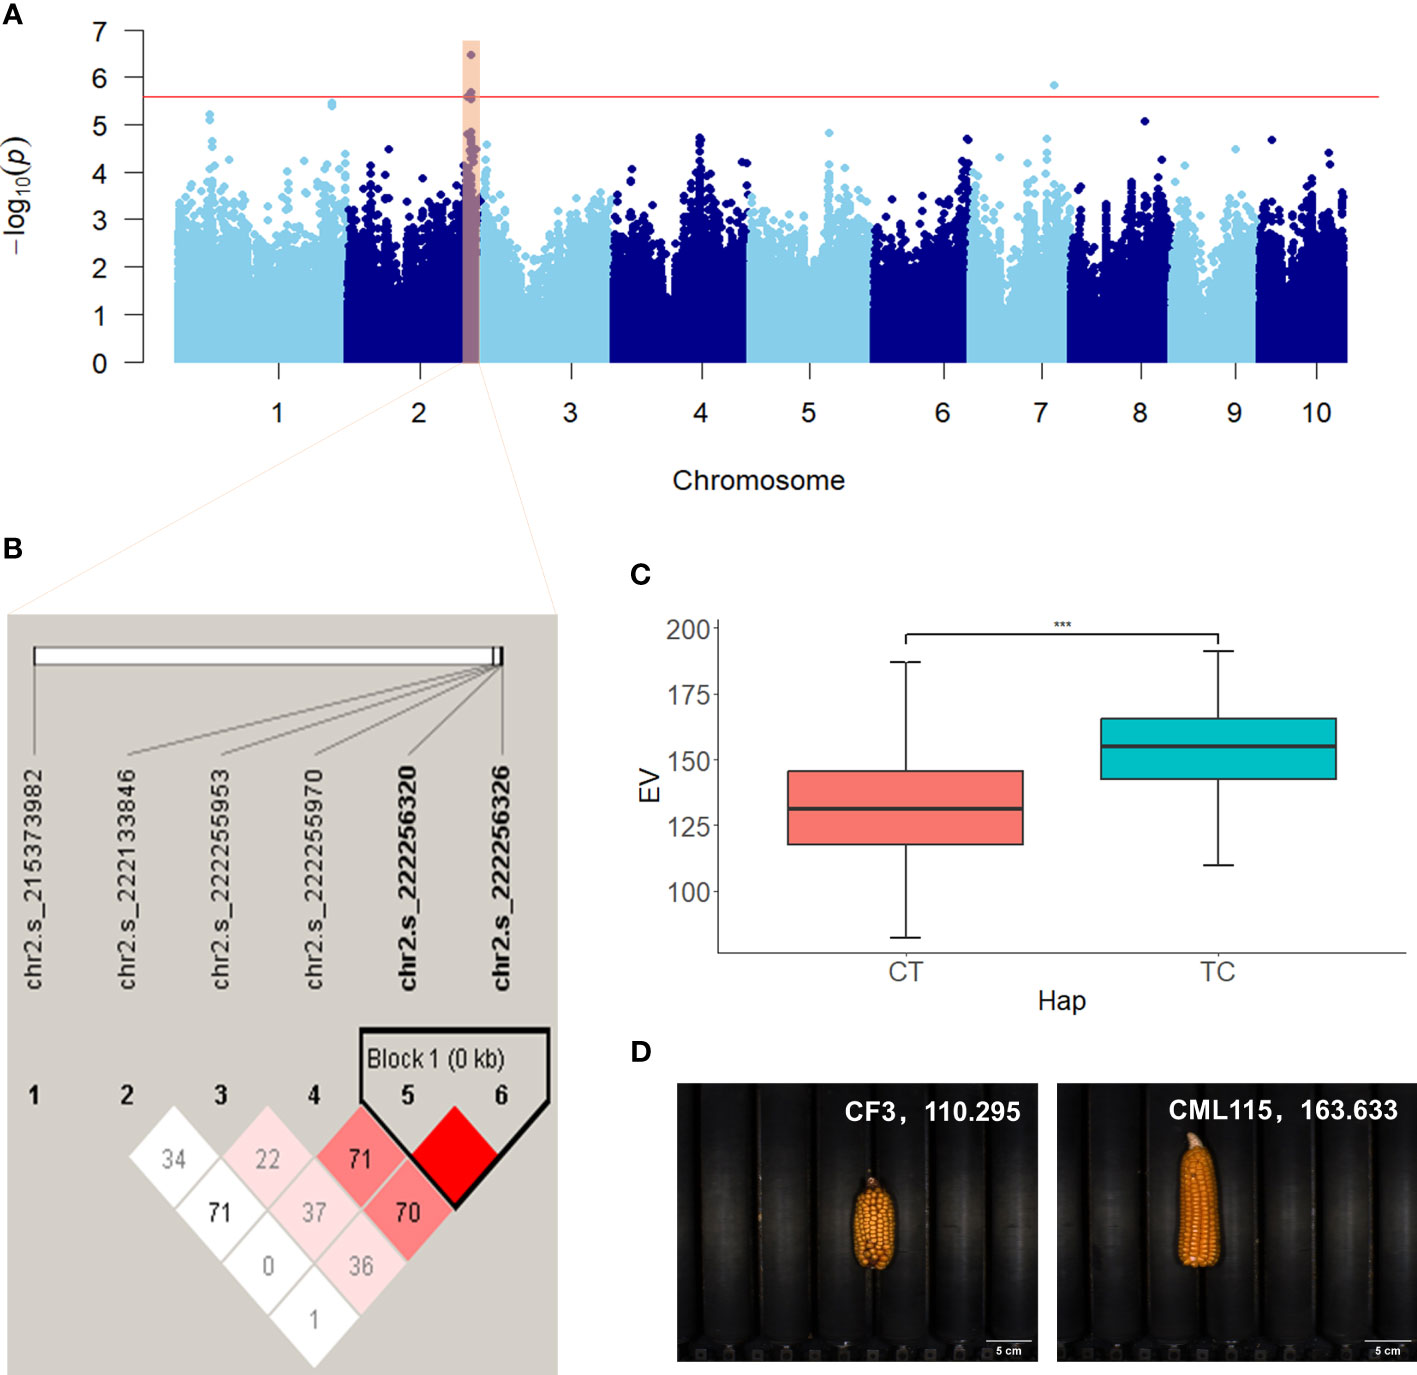
Figure 5 Manhattan plot and haplotype analysis results of EV. (A) Manhattan plot displaying the results of the GWAS for the BLUP of EV. (B) LD among the SNPs associated with EV, showing a haplotype block on chromosome 2. (C) Phenotypic differences between the haplotypes CT and TC. (D) Representative sample images for each haplotype. ***, adjusted P <0.001.
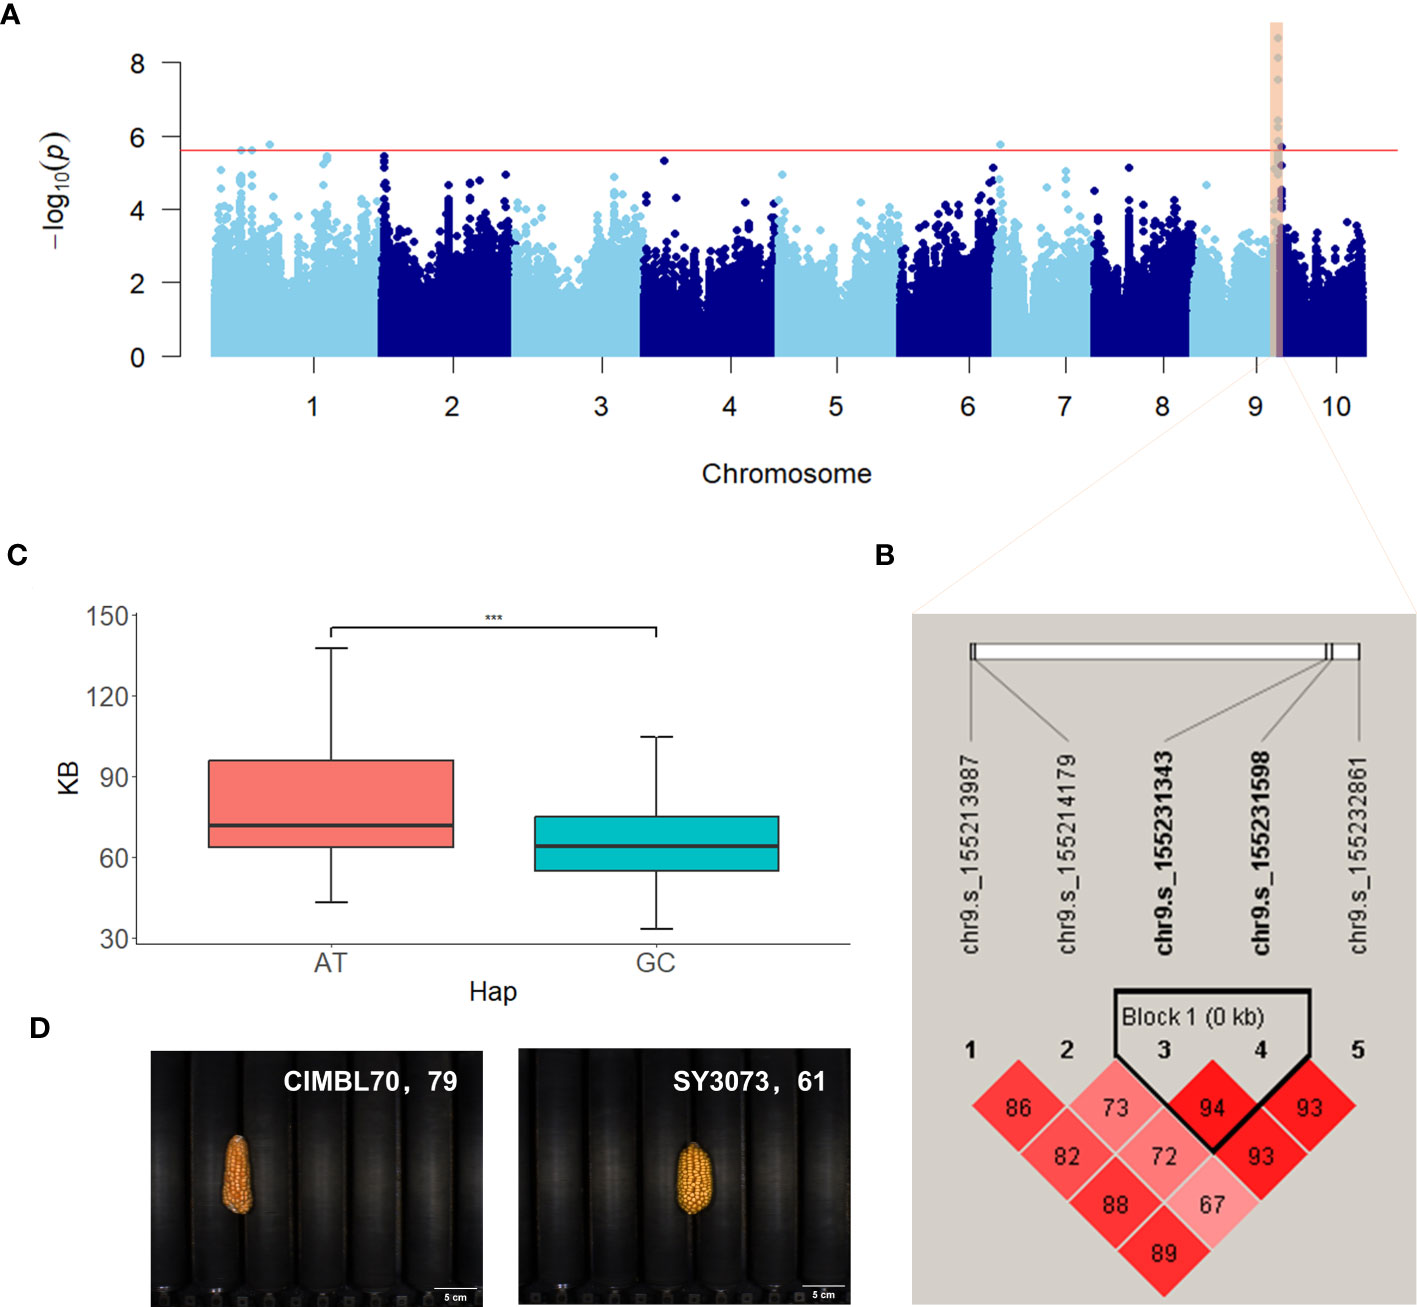
Figure 6 Manhattan plot and haplotype analysis results of KB. (A) Manhattan plot displaying the results of the GWAS for the BLUP of KB. (B) LD among the SNPs associated with KB, highlighting a haplotype block on chromosome 9. (C) Phenotypic differences between the haplotypes AT and GC. (D) Representative sample images for each haplotype. ***, adjusted P <0.001.
3.8 Expression analysis of candidate genes
In this study, we utilized maizeGDB qteller to analyze the expression of 58 candidate genes in different maize ear-related tissues or organs. It was found that nearly all of these genes were expressed in one or more tissues (expression levels exceeded 1), highlighting their potential importance in ear development (Figure 7). Forty-nine of the 58 genes were expressed in at least one instance in 25 previously studied tissues or organs (Stelpflug et al., 2016) (Figure 7A), whereas 51 of the 58 genes were expressed at least once in 11 other tissues or organs (Walley et al., 2016) (Figure 7B). Notably, several color-related genes exhibited the highest levels of expression in specific tissues, such as pericarp and cob. One candidate gene for EG (SY) and ER (BJ, BLUP, and SY), Zm00001d028725, encodes beta3-glucuronyltransferase and had the highest expression level of 26.7 observed 18 days after pollination (DAP), compared with other tissues. Another candidate gene for ER (BJ and BLUP), Zm00001d028810, which encodes transaminase/transferase motifs, had sustained high expression in the endosperm. Moreover, we found that candidate genes for two novel ear-related traits (ESA and EV) were highly expressed in specific tissues. For example, Zm00001d033905, a candidate gene for ESA(SY) and EV (BLUP, SY), encodes growth-regulating factor-interacting factor 1 and had the highest expression level observed in immature cob of V18 stage, with a value of 75.9 as compared to other tissues. Furthermore, we observed that Zm00001d033905 had elevated levels of expression in the tip of ear primordium, indicating its potential candidacy as a candidate gene for ESA (SY) and EV (BLUP and SY).
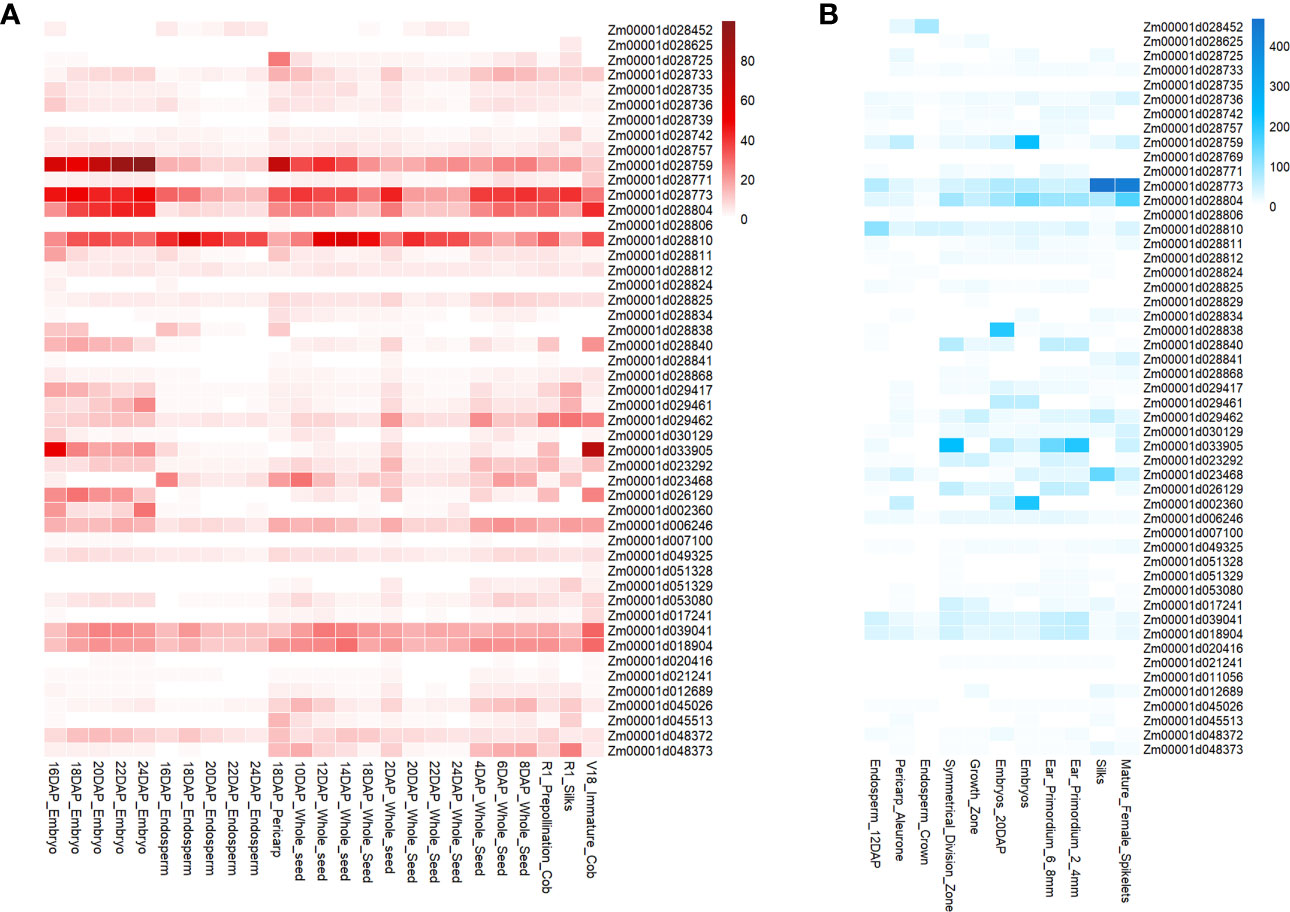
Figure 7 Gene expression levels of candidate genes associated with ear-related traits observed in tissues specifically related to ear development. (A) Data from the Kaeppler lab (Stelpflug et al., 2016). (B) Data from the Briggs lab (Walley et al., 2016).
4 Discussion
4.1 High-throughput phenotypic measurement method and system facilitates maize ear phenotypic acquisition
Maize is the primary grain crop cultivated in China due to economic and social development and the continuous reduction in arable land. An urgent need exists to further enhance maize production, with breeding and planting new varieties being among the most direct and crucial methods to achieve this. Morphological traits of maize ears are essential parameters for selecting and breeding new varieties, including EL, diameter, number of rows, number of kernels in row, and number of kernels in ear. In this study, a high-throughput panoramic image–based method and system for maize ear testing was used to obtain the ear-related traits of the 407 inbred lines. The method and system employed achieved a better balanced the efficiency and accuracy of maize ear testing, with an average efficiency of image acquisition and calculation efficiency of 15 ears/min and four ears/min, respectively. Furthermore, a calculation accuracy of 99% for EL and 98.89% for ear row number was achieved (Du et al., 2018). Because of the high throughput ear testing system, in addition to the traditional ear-related traits, novel phenotypic traits such as ear geometry, color, and texture were calculated using panoramic images that encompassed the entire kernel distribution on the ear surface. High-throughput ear phenotyping methods have been proven to be capable of replacing manual techniques, liberating individuals from laborious manual tasks. This cutting-edge technique significantly improves the efficiency of maize variety testing and provides a comprehensive dataset to support large-scale and commercial breeding programs. By employing the high-throughput phenotypic measurement method and system, maize ear phenotypic acquisition becomes streamlined. Furthermore, high-throughput ear phenotyping methods are crucial in the maize variety testing process as they enable easy, efficient, and accurate estimation of both conventional and novel ear phenotypic traits. By using this advanced measurement technique, a comprehensive and detailed profile of maize traits was obtained, which might provide valuable insights for identifying and selecting of maize varieties with superior attributes.
4.2 The characteristics and significance of novel traits and traditional traits of ear in maize inbred lines
The current study achieved a significant breakthrough by utilizing a high-throughput phenotypic measurement method and system to acquire a comprehensive and detailed profile of 20 traits related to maize ears, encompassing morphology, size, color, and kernel number. For clarity, the 20 traits were classified into two groups: traditional and novel. Seven of the traits (RNE, KNR, KNE, EL, EW, EP, and BTL) were traditional traits typically assessed manually in maize variety testing. The other 13 traits consisted of six color traits (ER, EG, EB, KR, KG, and KB) and seven ear and kernel morphology traits (AKA, BTA, ES, ESA, EV, KT, and KW). These traits, which could not be quantitatively evaluated using traditional methods, were identified as novel ear-related traits.
The results of the correlation analysis revealed significant correlations among different ear-related traits. In addition, the GWAS analysis indicated the existence of shared genes among these traits. For instance, the correlation coefficient between the traditional trait BTL and the novel trait BTA was exceptionally high at 0.97, and they shared three genes, namely, Zm00001d026129, Zm00001d017241, and Zm00001d023468. In addition, ESA and EV showed a strong correlation coefficient of 0.96, and their correlation coefficients with two traditional traits, namely, KNE and KNR, exceeded 0.68. These four traits shared two genes, namely, Zm00001d007100 and Zm00001d033905. Importantly, even negatively correlated traits shared genes, which suggested the possibility of an antagonistic relationship in phenotypic expression, although they may be regulated by the same gene. For instance, the correlation coefficient between ES and KNE was −0.76, and they shared the gene Zm00001d045513, whereas KW and RNE had a negative correlation coefficient of −0.53 and shared the gene Zm00001d053080. The identification of shared genes across different phenotypes provided insights into the genetic foundation of diverse traits. These insights were crucial for understanding the genetic mechanisms underlying complex traits in maize. Although the shared genes served as a foundation for understanding the relationships among different traits, each trait possessed its own locus and gene and, therefore, maintained its individual significance. Specifically, this study revealed numerous novel traits sharing loci with traditional traits, emphasizing their potential importance in the selection and breeding of high-yield maize varieties. Moreover, these newly identified traits could be used as references for screening and determining typical ear-related traits of maize.
This study offers significant insights into the complex genetic mechanisms underlying traits in maize and establishes a foundation for future research in this field. Through the identification of novel ear-related traits, researchers can enhance their understanding of the genetic and molecular pathways involved in maize growth and development. Furthermore, the findings of this study have practical consequences for efforts in maize breeding, providing new avenues for selecting and cultivating desirable traits. Overall, this study makes a significant contribution to the field of maize genetics and is likely to inform future research in this area.
4.3 Candidate genes for ear-related genes
The findings of this study highlight the significance of traits obtained through the high-throughput phenotypic measurement method and system, particularly novel traits that cannot be assessed by traditional methods. The high heritability observed for several traits (Supplementary Figure S1), including novel ear-related traits, suggests that genetic factors play a crucial role in maize ear-related traits, providing potential for further genetic studies. The GWAS analysis identified a number of candidate genes for these traits, further strengthening the genetic basis of these traits.
For traditional traits, it was observed that there is a strong correlation (r = 0.9511, adjust P = 0) between EP and EW in this study. This correlation is further supported by the identification of common genes (such as Zm00001d049325, Zm00001d049326, Zm00001d051328, Zm00001d051329, and Zm00001d005421) through GWAS. One of the identified genes, Zm00001d051328, also known as GRMZM2G377217, was reported to play a fundamental role in maize growth and development (Hu et al., 2021). It encodes a probable WRKY transcription factor 12, involved in various biological processes. Furthermore, a search tool for recurring instances of neighbouring genes (STRING) analysis revealed its interaction with two MYB family genes, MYB109 and MYB92, which are plant transcription factors with diverse functions in biological processes. In addition, a study on the genome-wide atlas of transcription during maize development demonstrated the involvement Zm00001d051328 in the plant ontology (PO) term “central spike of ear (PO:0006505)” and “ear inflorescence (PO:0020136)” (Sekhon et al., 2011). These findings suggest that Zm00001d051328 may play a critical role in the development of the central spike of the ear and the ear inflorescence, thereby potentially affecting the size of maize ear. Similarly, the gene Zm00001d011060 emerged as a candidate gene for EL. In this study, the two identified SNPs, namely, chr8.s_137865777 and chr8.s_137865788, located in the exon region of Zm00001d011060 on chromosome 8, demonstrated significant associations with EL in both BLUP and BJ scenarios, indicating their potential functional relevance. Furthermore, maize inbred lines carrying the AA haplotype, which contains these two SNPs, exhibited longer ELs compared with those with the GG haplotype. Although detailed functional annotation for Zm00001d011060 is currently limited, the observed phenotypic disparities strongly suggest its critical involvement in the regulation of EL. Future investigations should be conducted to unravel the molecular mechanism underlying the control of EL in maize by Zm00001d011060.
In addition to traditional ear-related traits, this study also focuses on novel traits, such as ES. Through GWAS, zma-MIR159f has been identified as a candidate gene for ES. It has demonstrated that zma-MIR159f is involved in encoding the transcription factors MYB33 and MYB101 (Tsuji et al., 2006), which play a role in regulating seed dormancy and germination. Furthermore, the expression of miR159, which is induced by abscisic acid (ABA) (a key regulatory factor in plant maturation and development), reduces the sensitivity of MYB genes to ABA (Phillips et al., 2007). The expression level of zma-MIR159f has also been observed in the maize ear primordium at 2–4 mm and in the embryo at 38 DAP (Walley et al., 2016). In Arabidopsis, miR159 and its target genes are known to be involved in important developmental processes (Millar and Gubler, 2005). In addition, overexpression of miR159 in rice has resulted in the development of deformed, sterile, and significantly smaller flowers compared with that of wild-type plants (Smoczynska and Szweykowska-Kulinska, 2016). Overall, our study suggested that zma-MIR159f could be a promising candidate gene for ES, providing new insights into the developmental mechanism of maize ear growth.
Furthermore, the GWAS results have found that certain traditional ear-related traits share a common genetic foundation with novel ear-related traits. This discovery has opened up new avenues for understanding the genetic architecture of these traits. For example, the gene Zm00001d053080 (also known as GRMZM2G032337) has been identified as a probable receptor protein kinase gene located on chromosome 4. Remarkably, this gene has shown significant associations with KW and RNE, with a correlation coefficient of up to −0.53. In addition, gene expression analysis has indicated that Zm00001d053080 exhibits relatively higher expression levels in the whole seed of B73 at 6 and 8 DAP compared with other tissues (Figure 7A). Moreover, it displays relatively higher expression levels in the 2-mm to 4-mm and 6-mm to 8-mm stages of ear primordium development compared with other tissues (Figure 7B). These findings strongly suggest that Zm00001d053080 may play a pivotal role in regulating kernel width and RNE, particularly during early ear development stages.
In this study, maize ear color was not only mainly reflected by the color of the kernels but also included the color of bald tips or the exposed cob between the rows of kernels, so the traits of ear color were slightly different from the traits of kernel color. The correlation analysis revealed a significant correlation between ear color and kernel color traits, exhibiting strong associations of 0.81–0.84 between color traits derived from the same channel. In addition, the overall correlation coefficients for ear color and kernel color ranged from 0.39 to 1, further highlighting a substantial relationship between the two. Genetic analysis further demonstrated numerous overlapping, significantly related SNPs and candidate genes between these color traits. For example, the gene Zm00001d028840, also known as GRMZM2G017536, has emerged as a strong candidate gene for color traits in this study. This gene encodes a DUF4378 domain protein and is situated on chromosome 1. Its significance in relation to color traits is highlighted by its identification as a candidate gene for EB, EG, ER, KB, KG, and KR traits in maize. In addition to this, the high significance of the SNPs associated with this gene further strengthens its candidacy for color traits. The identification of this gene provides valuable insights into the genetic basis of color traits in maize, paving the way for further research to understand its mechanism of action and potential applications in improving color quality and yield of maize crops.
Notably, Zm00001d048373, also known as white cap1, CCD, wc1, CCD1, and GRMZM2G057243, was identified as a candidate gene for EB (BLUP) and KB (BJ and BLUP) in our study. The selection for yellow- and white-kernel types has been central to postdomestication improvement of maize. It has previously been reported (Dutta et al., 2021) that the copy number of ccd1 gene varied among different maize varieties, with yellow maize typically having one to six copies and white maize having 7 to 35 copies, whereas their wild relatives contain one to four copies of the ccd1 gene per genome. Another study (Tan et al., 2017) demonstrated that the Wc locus contained multiple, tandem copies of a carotenoid cleavage dioxygenase 1 (Ccd1) gene that encodes a carotenoid-degrading enzyme, playing a role in evolution of kernel color in maize. These findings suggested that Zm00001d048373 could be an important candidate gene for the color trait in maize, specifically EB and KB. In contrast to previous research that primarily focused on classifying yellow and white maize kernels, our study took a more detailed approach by specifically examining the single color channel of the kernel in the RGB color model. By isolating and analyzing this specific color channel, we were able to gain deeper insights into the genetic factors that influence the precise coloration of maize kernels. This finer-grained investigation is of significant importance for understanding the underlying mechanisms that govern maize kernel color development, thus providing valuable insights for future breeding and improvement strategies.
It has been reported that a major effect quantitative trait locus (QTL) (qEL1) with significant association to maize EL was identified on chromosome 1 through GWAS (Luo et al., 2022a). Four candidate genes within the qEL1 interval were subsequently validated through knockout using clustered regularly interspaced short palindromic repeats (CRISPR/Cas9) technology. The results showed that the functional gene for qEL1 was Zm00001d028915 (also known as YIGE1), which positively regulates maize EL. In this study, this gene was identified as a candidate gene for EG (SY) and ER (SY), and the phenotype analysis displayed a significant positive correlation between EL and EG, as well as ER after multiple verifications (Figure 3). The above findings suggest that there is also a certain degree of genetic correlation among these traits, potentially regulated by the same genetic mechanism.
This study emphasizes the significance of investigating novel phenotypic traits in maize through the utilization of high-throughput phenotypic measurements. The genetic loci identified in this research make a substantial contribution to our understanding of the traits associated with maize ears and enhance current genetic studies on maize ears.
Data availability statement
The original contributions presented in the study are included in the article/Supplementary Material. Further inquiries can be directed to the corresponding authors.
Author contributions
CZ and XG contributed to the study conception and design; JW and SZ analyzed the data, interpreted the results, and drafted the manuscript; XG and YZ revised the manuscript; XL, JD, CW, and WW performed field experiments and obtained phenotypic data. All authors contributed to the article and approved the submitted version.
Funding
This research was funded by the Construction of Collaborative Innovation Center of Beijing Academy of Agriculture and Forestry Science (KJCX201917), Beijing Academy of Agriculture and Forestry Sciences Grants (QNJJ202124), and the National Natural Science Foundation of China (U21A20205).
Acknowledgments
We gratefully acknowledge the Maize Research Center, Beijing Academy of Agriculture and Forestry Sciences for preparing the seeds and materials.
Conflict of interest
The authors declare that the research was conducted in the absence of any commercial or financial relationships that could be construed as a potential conflict of interest.
Publisher's note
All claims expressed in this article are solely those of the authors and do not necessarily represent those of their affiliated organizations, or those of the publisher, the editors and the reviewers. Any product that may be evaluated in this article, or claim that may be made by its manufacturer, is not guaranteed or endorsed by the publisher.
Supplementary material
The Supplementary Material for this article can be found online at: https://www.frontiersin.org/articles/10.3389/fpls.2023.1248446/full#supplementary-material
Supplementary Figure 1 | Heritability of 20 ear-related traits. These traits could be divided into two categories: Traditional traits (BTL, EL, EP, EW, KNE, KNR and RNE), and novel traits (AKA, BTA, EB, EG, ER, ES, ESA, EV, KB, KG, KR, KT and KW).
Supplementary Figure 2 | Manhattan plot and haplotype analysis results of EL. (A) Manhattan plot displaying the results of the GWAS for the BLUP of EL. (B) LD among the SNPs associated with EL, highlighting a haplotype block on chromosome 8. (C) Phenotypic differences between the haplotypes AA and GG. (D) Representative sample images for each haplotype.
Supplementary Table 1 | Descriptive statistics analysis of 20 maize ear-related traits. 1)RNE, Row Number per Ear; KNR, Kernel Number per Row; KNE, Kernel Number per Ear; EL, Ear Length; EW, Ear Width; EV, Ear Volum; ESA, Ear SurfaceArea; EP, Ear Perimeter; BTL, BarrenTip Length; BTA, BarrenTip Area; AKA, Average Kernel Area; ES, Ear Shape; KW, Kernel Width; KT, Kernel Thickness; ER, Ear R; EG, Ear G; EB, Ear B; KR, Kernel R; KG, Kernel G; KB, Kernel B. 2)BJ, Beijing; SY, Sanya; BLUP, best linear unbiased prediction.
References
Barrett, J. C., Fry, B., Maller, J., Daly, M. J. (2005). Haploview: analysis and visualization of LD and haplotype maps. Bioinformatics 21 (2), 263–265. doi: 10.1093/bioinformatics/bth457
Butler, D. (2009) asreml: asreml() fits the linear mixed model. Available at: www.vsni.co.uk.
Cui, Z. H., Dong, H. X., Zhang, A., Ruan, Y. Y., Jiang, S. Q., He, Y., et al. (2020). Denser markers and advanced statistical method identified more genetic loci associated with husk traits in maize. Sci. Rep. 10 (1), 8165. doi: 10.1038/s41598-020-65164-0
Cui, Z. H., Luo, J. H., Qi, C. Y., Ruan, Y. Y., Li, J., Zhang, A., et al. (2016). Genome-wide association study (GWAS) reveals the genetic architecture of four husk traits in maize. BMC Genomics 17 (1), 946. doi: 10.1186/s12864-016-3229-6
Du, J., Guo, X., Wang, C., Xiao, B. (2018). Assembly line variety test method and system for corn ears based on panoramic surface image. Trans. Chin. Soc. Agric. Eng. 34 (13), 195–202. doi: 10.11975/j.issn.1002-6819.2018.13.023
Dutta, S., Muthusamy, V., Chhabra, R., Baveja, A., Zunjare, R. U., Mondal, T. K., et al. (2021). Low expression of carotenoids cleavage dioxygenase 1 (ccd1) gene improves the retention of provitamin-A in maize grains during storage. Mol. Genet. Genomics 296 (1), 141–153. doi: 10.1007/s00438-020-01734-1
Farfan, I. D. B., de la Fuente, G. N., Murray, S. C., Isakeit, T., Huang, P. C., Warburton, M., et al. (2015). Genome wide association study for drought, aflatoxin resistance, and important agronomic traits of maize hybrids in the sub-tropics. PloS One 10 (2), e0117737. doi: 10.1371/journal.pone.0117737
Gao, R., Hu, M., Zhao, H., Lai, J., Song, W. (2022). Genetic dissection of ear-related traits using immortalized F2 population in maize. J. Integr. Agric. 21 (09), 2492–2507. doi: 10.1016/j.jia.2022.07.007
Guo, S. J., Zhou, G. L., Wang, J. L., Lu, X. J., Zhao, H., Zhang, M. G., et al. (2022). High-throughput phenotyping accelerates the dissection of the phenotypic variation and genetic architecture of shank vascular bundles in maize (Zea mays L.). Plants-Basel 11 (10), 1339 doi: 10.3390/plants11101339
Holm, S. (1979). A simple sequentially rejective multiple test procedure. Scandinavian J. Stat 6, 65–70. Available at: http://www.jstor.org/stable/4615733.
Hu, W., Ren, Q., Chen, Y., Xu, G., Qian, Y. (2021). Genome-wide identification and analysis of WRKY gene family in maize provide insights into regulatory network in response to abiotic stresses. BMC Plant Biol. 21 (1), 427. doi: 10.1186/s12870-021-03206-z
Hung, H. Y., Shannon, L. M., Tian, F., Bradbury, P. J., Chen, C., Flint-Garcia, S. A., et al. (2012). ZmCCT and the genetic basis of day-length adaptation underlying the postdomestication spread of maize. Proc. Natl. Acad. Sci. United States America 109 (28), E1913–E1921. doi: 10.1073/pnas.1203189109
Jiang, S. Q., Zhang, H. B., Ni, P. Z., Yu, S., Dong, H. X., Zhang, A., et al. (2020). Genome-wide association study dissects the genetic architecture of maize husk tightness. Front. Plant Sci. 11. doi: 10.3389/fpls.2020.00861
Kolde, R. (2019). heatmap: Pretty Heatmaps. R package version 1.0.12. Available at: https://CRAN.R-project.org/package=pheatmap.
Li, M. X., Yeung, J. M., Cherny, S. S., Sham, P. C. (2012). Evaluating the effective numbers of independent tests and significant p-value thresholds in commercial genotyping arrays and public imputation reference datasets. Hum. Genet. 131 (5), 747–756. doi: 10.1007/s00439-011-1118-2
Li, X. P., Zhou, Z. J., Ding, J. Q., Wu, Y. B., Zhou, B., Wang, R. X., et al. (2016). Combined linkage and association mapping reveals QTL and candidate genes for plant and ear height in maize. Front. Plant Sci. 7. doi: 10.3389/fpls.2016.00833
Liang, X. Y., Ye, J. L., Li, X. Y., Tang, Z. X., Zhang, X. H., Li, W. Q., et al. (2021). A high-throughput and low-cost maize ear traits scorer. Mol. Breed. 41 (2), 17. doi: 10.1007/s11032-021-01205-4
Liu, L., Du, Y. F., Shen, X. M., Li, M. F., Sun, W., Huang, J., et al. (2015). KRN4 controls quantitative variation in maize kernel row number. PloS Genet. 11 (11), e1005670. doi: 10.1371/journal.pgen.1005670
Lu, X., Wang, J., Wang, Y., Wen, W., Zhang, Y., Du, J., et al. (2020). Genome-wide association study of maize aboveground dry matter accumulation at seedling stage. Front. Genet. 11. doi: 10.3389/fgene.2020.571236
Luo, Y., Zhang, M., Liu, Y., Liu, J., Li, W., Chen, G., et al. (2022). Genetic variation in YIGE1 contributes to ear length and grain yield in maize. New Phytol. 234 (2), 513–526. doi: 10.1111/nph.17882
Millar, A. A., Gubler, F. (2005). The Arabidopsis GAMYB-like genes, MYB33 and MYB65, are microRNA-regulated genes that redundantly facilitate anther development. Plant Cell 17 (3), 705–721. doi: 10.1105/tpc.104.027920
Phillips, J. R., Dalmay, T., Bartels, D. (2007). The role of small RNAs in abiotic stress. FEBS Lett. 581 (19), 3592–3597. doi: 10.1016/j.febslet.2007.04.007
Sekhon, R. S., Lin, H., Childs, K. L., Hansey, C. N., Buell, C. R., de Leon, N., et al. (2011). Genome-wide atlas of transcription during maize development. Plant J. 66 (4), 553–563. doi: 10.1111/j.1365-313X.2011.04527.x
Smoczynska, A., Szweykowska-Kulinska, Z. (2016). MicroRNA-mediated regulation of flower development in grasses. Acta Biochim. Pol. 63 (4), 687–692. doi: 10.18388/abp.2016_1358
Song, P., Zhang, H., Wang, C., Luo, B., Lu, W., Hou, P. (2017). Design and experiment of high throughput automatic measuring device for corn. Trans. Chin. Soc. Agric. Eng. 33 (16), 41–47. doi:10.11975/j.issn.1002-6819.2017.16.006
Stelpflug, S. C., Sekhon, R. S., Vaillancourt, B., Hirsch, C. N., Buell, C. R., de Leon, N., et al. (2016). An Expanded Maize Gene Expression Atlas based on RNA Sequencing and its Use to Explore Root Development. Plant Genome 9 (1). doi: 10.3835/plantgenome2015.04.0025
Sun, G. Y., Zhang, X. H., Duan, H. Y., Gao, J. H., Li, N., Su, P. P., et al. (2022). Dissection of the genetic architecture of peduncle vascular bundle-related traits in maize by a genome-wide association study. Plant Biotechnol. J. 20 (6), 1042–1053. doi: 10.1111/pbi.13782
Tan, B. C., Guan, J. C., Ding, S., Wu, S., Saunders, J. W., Koch, K. E., et al. (2017). Structure and origin of the white cap locus and its role in evolution of grain color in maize. Genetics 206 (1), 135–150. doi: 10.1534/genetics.116.198911
Tsuji, H., Aya, K., Ueguchi-Tanaka, M., Shimada, Y., Nakazono, M., Watanabe, R., et al. (2006). GAMYB controls different sets of genes and is differentially regulated by microRNA in aleurone cells and anthers. Plant J. 47 (3), 427–444. doi: 10.1111/j.1365-313X.2006.02795.x
Walley, J. W., Sartor, R. C., Shen, Z., Schmitz, R. J., Wu, K. J., Urich, M. A., et al. (2016). Integration of omic networks in a developmental atlas of maize. Science 353 (6301), 814–818. doi: 10.1126/science.aag1125
Wang, K., Li, M., Hakonarson, H. (2010). ANNOVAR: functional annotation of genetic variants from high-throughput sequencing data. Nucleic Acids Res. 38 (16), e164. doi: 10.1093/nar/gkq603
Xiao, Y. J., Tong, H., Yang, X. H., Xu, S. Z., Pan, Q. C., Qiao, F., et al. (2016). Genome-wide dissection of the maize ear genetic architecture using multiple populations. New Phytol. 210 (3), 1095–1106. doi: 10.1111/nph.13814
Yang, X. H., Gao, S. B., Xu, S. T., Zhang, Z. X., Prasanna, B. M., Li, L., et al. (2011). Characterization of a global germplasm collection and its potential utilization for analysis of complex quantitative traits in maize. Mol. Breed. 28 (4), 511–526. doi: 10.1007/s11032-010-9500-7
Yang, Q., Li, Z., Li, W. Q., Ku, L. X., Wang, C., Ye, J. R., et al. (2013). CACTA-like transposable element in ZmCCT attenuated photoperiod sensitivity and accelerated the postdomestication spread of maize. Proc. Natl. Acad. Sci. United States America 110 (42), 16969–16974. doi: 10.1073/pnas.1310949110
Yang, L., Li, T., Tian, X., Yang, B., Lao, Y., Wang, Y., et al. (2020). Genome-wide association study (GWAS) reveals genetic basis of ear-related traits in maize. Euphytica 216 (11), 172. doi: 10.1007/s10681-020-02707-6
Yang, N., Lu, Y. L., Yang, X. H., Huang, J., Zhou, Y., Ali, F., et al. (2014). Genome wide association studies using a new nonparametric model reveal the genetic architecture of 17 agronomic traits in an enlarged maize association panel. PloS Genet. 10 (9), e1004573. doi: 10.1371/journal.pgen.1004573
Zhang, X., Ren, Z., Luo, B., Zhong, H., Ma, P., Zhang, H., et al. (2022). Genetic architecture of maize yield traits dissected by QTL mapping and GWAS in maize. Crop J. 10 (2), 436–446. doi: 10.1016/j.cj.2021.07.008
Zhang, Y., Wang, J. L., Du, J. J., Zhao, Y. X., Lu, X. J., Wen, W. L., et al. (2021). Dissecting the phenotypic components and genetic architecture of maize stem vascular bundles using high-throughput phenotypic analysis. Plant Biotechnol. J. 19 (1), 35–50. doi: 10.1111/pbi.13437
Zhou, X., Stephens, M. (2012). Genome-wide efficient mixed-model analysis for association studies. Nat. Genet. 44 (7), 821–824. doi: 10.1038/ng.2310
Zhou, B., Zhou, Z., Ding, J., Zhang, X., Mu, C., Wu, Y., et al. (2018). Combining three mapping strategies to reveal quantitative trait loci and candidate genes for maize ear length. Plant Genome 11 (3), 170107. doi: 10.3835/plantgenome2017.11.0107
Keywords: maize, high-throughput phenotypic measurement, ear-related traits, color traits, GWAS, candidate genes
Citation: Wang J, Zhao S, Zhang Y, Lu X, Du J, Wang C, Wen W, Guo X and Zhao C (2023) Investigating the genetic basis of maize ear characteristics: a comprehensive genome-wide study utilizing high-throughput phenotypic measurement method and system. Front. Plant Sci. 14:1248446. doi: 10.3389/fpls.2023.1248446
Received: 27 June 2023; Accepted: 09 August 2023;
Published: 28 August 2023.
Edited by:
Hanwei Mei, Shanghai Agrobiological Gene Center, ChinaReviewed by:
Hongjian Zheng, Shanghai Academy of Agricultural Sciences, ChinaZefeng Yang, Yangzhou University, China
Copyright © 2023 Wang, Zhao, Zhang, Lu, Du, Wang, Wen, Guo and Zhao. This is an open-access article distributed under the terms of the Creative Commons Attribution License (CC BY). The use, distribution or reproduction in other forums is permitted, provided the original author(s) and the copyright owner(s) are credited and that the original publication in this journal is cited, in accordance with accepted academic practice. No use, distribution or reproduction is permitted which does not comply with these terms.
*Correspondence: Xinyu Guo, Z3VveHk3M0AxNjMuY29t; Chunjiang Zhao, emhhb2NqQG5lcmNpdGEub3JnLmNu
†These authors have contributed equally to this work