 Mingyu Yin
 Chunsheng Wang
 Huan Wang1
 Junjie Guo
- 1Research Institute of Tropical Forestry, Chinese Academy of Forestry, Guangzhou, China
- 2Agricultural College, Shihezi University, Shihezi, China
Tree height (H) and stem diameter at breast height (DBH) (H-D) relationship is correlated with timber yield and quality as well as stability of forest and is crucial in forest management and genetic breeding. It is influenced by not only environmental factors such as site quality and climate factors but also genetic control that is mostly neglected. A dataset of H and DBH of 25 provenances of Betula alnoides Buch.–Ham. ex D. Don at four sites was used to model the H-D relationship. The dummy variable nonliner mixed-effect equations were applied to evaluate the effects of sites and provenances on variations of the H-D relationship and to select superior provenances of B. alnoides. Weibull equation was selected as the base model for the H-D relationship. The sites affected asymptotes of the H-D curves, and the provenance effect on asymptotes of the H-D curves varied across sites. Taking above-average DBH and lower asymptote of the H-D curves as indicators, five excellent provenances were screened out at each site with a rate of 20%. Their selection gains of individual volume ranged from 1.99% to 29.81%, and their asymptote parameter (kj) and H-D ratio were 7.17%–486.05% and 3.07–4.72% lower than the relevant total means at four sites, respectively. Genetic selection based on the H-D relationship could promote selection efficiency of excellent germplasms and was beneficial for the large-sized timber production of B. alnoides.
1 Introduction
The relationship between tree height (H) and stem diameter at breast height (DBH) (H-D) is related to wood volume and quality (Price et al., 2007; Kroon et al., 2008; Richter, 2015), and it also influences the tree vigor and mechanical stability (Robichaud and Methven, 1991; Peltola et al., 2000; Valinger and Fridman, 2011). The H-D relationship is of important applications in forest measurement, volume or biomass estimation, and forest management (Gould and Marshall, 2010; Ducey, 2012; Temesgen et al., 2014; Yih et al., 2017). All sorts of the H-D equations have been developed up to now, such as power (Stage, 1975), hyperbolic (Scaranello et al., 2012), exponential (Wykoff et al., 1982), monomolecular (Pearl and Reed, 1920), logistic (Huang and Titus, 1992), and Weibull (Yang et al., 1978) models, which lay a foundation for the understanding of the H-D relationship.
It is said that introduction of biotic and abiotic factors into H-D basic equations can improve their prediction accuracy (Zhang et al., 2019) and promote the cognition on driving forces for the variance of the H-D relationship. Many studies have been documented on modeling the H-D relationship, in which stand characteristics, site quality, and geographical and climate factors are usually taken into consideration (Wang et al., 2006; Feldpausch et al., 2011; Hulshof et al., 2015; Trouvé et al., 2015; Vizcaíno-Palomar et al., 2016). Homeier et al. (2010) found out that H of forest stands decreased more than DBH with increasing altitude in the European forests. It was indicated from the study of Bošeľa et al. (2013) that good soil nutrient and climatic conditions also sped up the growth of height and DBH and thus influenced the H-D relationship of Norway spruce [Picea abies (L.) Karst.]. Zhang et al. (2019) verified that higher stand density always promoted growth of H more than that of DBH and built more slender stem of Chinese fir [Cunninghamia lanceolata (Lamb.) Hook.]. Although genetic influences on the H-D relationship have been given less attention to, only a few studies have been reported, in which the significant effects of genetic entry on the H-D relationship are shown. Buford (1986) found out that the asymptotes of the H-D curves were different among the provenances of loblolly pine (Pinus taeda L.). The study of Sabatia and Burkhart (2013) on loblolly pine demonstrated that the asymptotes of the H-D curves increased with increasing levels of genetic improvement. These studies all demonstrate the importance of incorporating genetic factors into models about the H-D relationship.
As to the accurate evaluation of the genetic effect on the H-D relationship, there are still several challenges. First, the genetic effect on the H-D relationship usually varies with tree species (Vizcaíno-Palomar et al., 2016), although only a small number of studies have been reported, and for a few coniferous species (Buford and Burkhart, 1987; Weng et al., 2008; Egbäck et al., 2018). Second, large-sized samples under well-designed experiments are also essential to model and illustrate the genetic effect on the H-D relationship. Third, the interaction between genotype and site normally exists in the practice, and incorporating site effect into the H-D model is thus also necessary.
Up to now, few case studies of germplasm selection have been reported taking H-D relationship into consideration. In the previous studies, H and DBH are usually used as core and independent traits for the selection of elite germplasm (Vergara et al., 2004). This causes disproportional improvement for both traits and further reduces the breeding efficiency (e.g., Carson et al., 1999; Andersson et al., 2007; Sabatia and Burkhart, 2013). Introducing the H-D relationship into the selection process may avoid this disadvantage and promote selection efficiency of excellent germplasms.
Betula alnoides Buch.–Ham. ex D. Don is a fast-growing valuable tree species in the family Betulaceae and is indigenous to the warm subtropical and tropical regions in Southeast Asia and southern China (Zeng et al., 2003). The typical rotation age is 20 years for this species, and its wood is well known for its beautiful texture, moderate density, and excellent manufacturing characteristics and is extensively used for high-grade floor, furniture, and overlaid veneer making (Wang et al., 2016). Its bark is rich in secondary metabolites with anti-inflammatory and lipid-lowering functions and is also an ideal ingredient for traditional medicine (Sur et al., 2002; Raj et al., 2015). Strong adaptability to different environments has resulted in the distribution of the species across wide ranges of soil types, altitudes, and climate conditions (Zeng et al., 1999). To meet the increasing demand for its high-quality timber, B. alnoides has been widely planted, and more than 220,000 ha of its plantations have been established in Yunnan, Guangxi, Guangdong, and Fujian Provinces of China up to now. To select excellent germplasms for plantation forestry, many provenances and family trials have been established to reveal the genetic variation of growth and stem quality traits at multiple sites. Guo et al. (2008) and Yang et al. (2012) used H and DBH to select excellent provenances for B. alnoides at single site. Yin et al. (2019) conducted multi-site joint selection on basis of H, DBH, individual volume, and stem quality. Although some excellent provenances of B. alnoides are screened out, neglection of the H-D relationship in these studies may result in disproportional improvement for H and DBH and thus decrease its breeding efficiency. On the basis of the provenance and family selection trials of B. alnoides at Mengla, Pingxiang, Hua’an, and Changning sites in southern China, the objectives of the present study are (1) to simulate the H-D curves with considering the effects of provenance and site using dummy variable approach and (2) to select superior provenances taking the H-D relationship into consideration.
2 Materials and methods
2.1 Materials
The provenance family trials of B. alnoides were established at Mengla and Pingxiang in 2002, Hua’an in 2003, and Changning in 2007 (Figure 1), where 400, 386, 280, and 250 half-sib families were involved, respectively, all from 25 provenances. Their seeds were collected from the natural forests in Yunnan and Guangxi, China, and their seedlings were raised separately at a nursery near each site. Specimens of each family were made when sampling in the natural forests, and species identification was done by Dr. Jie Zeng. Voucher specimens of 25 provenances were deposited at the Herbarium of the Research Institute of Tropical Forestry, Chinese Academy of Forestry, Guangzhou, China, and their information were shown in Supplementary Table 1. The information of geographic locations and climatic conditions at the four sites and geographic locations of 25 provenances could be seen detailedly in our previous study (Yin et al., 2019). The seedlings were planted in randomized complete block design with single individual plots and 12 to 19 blocks at a spacing of 2 m × 3 m.
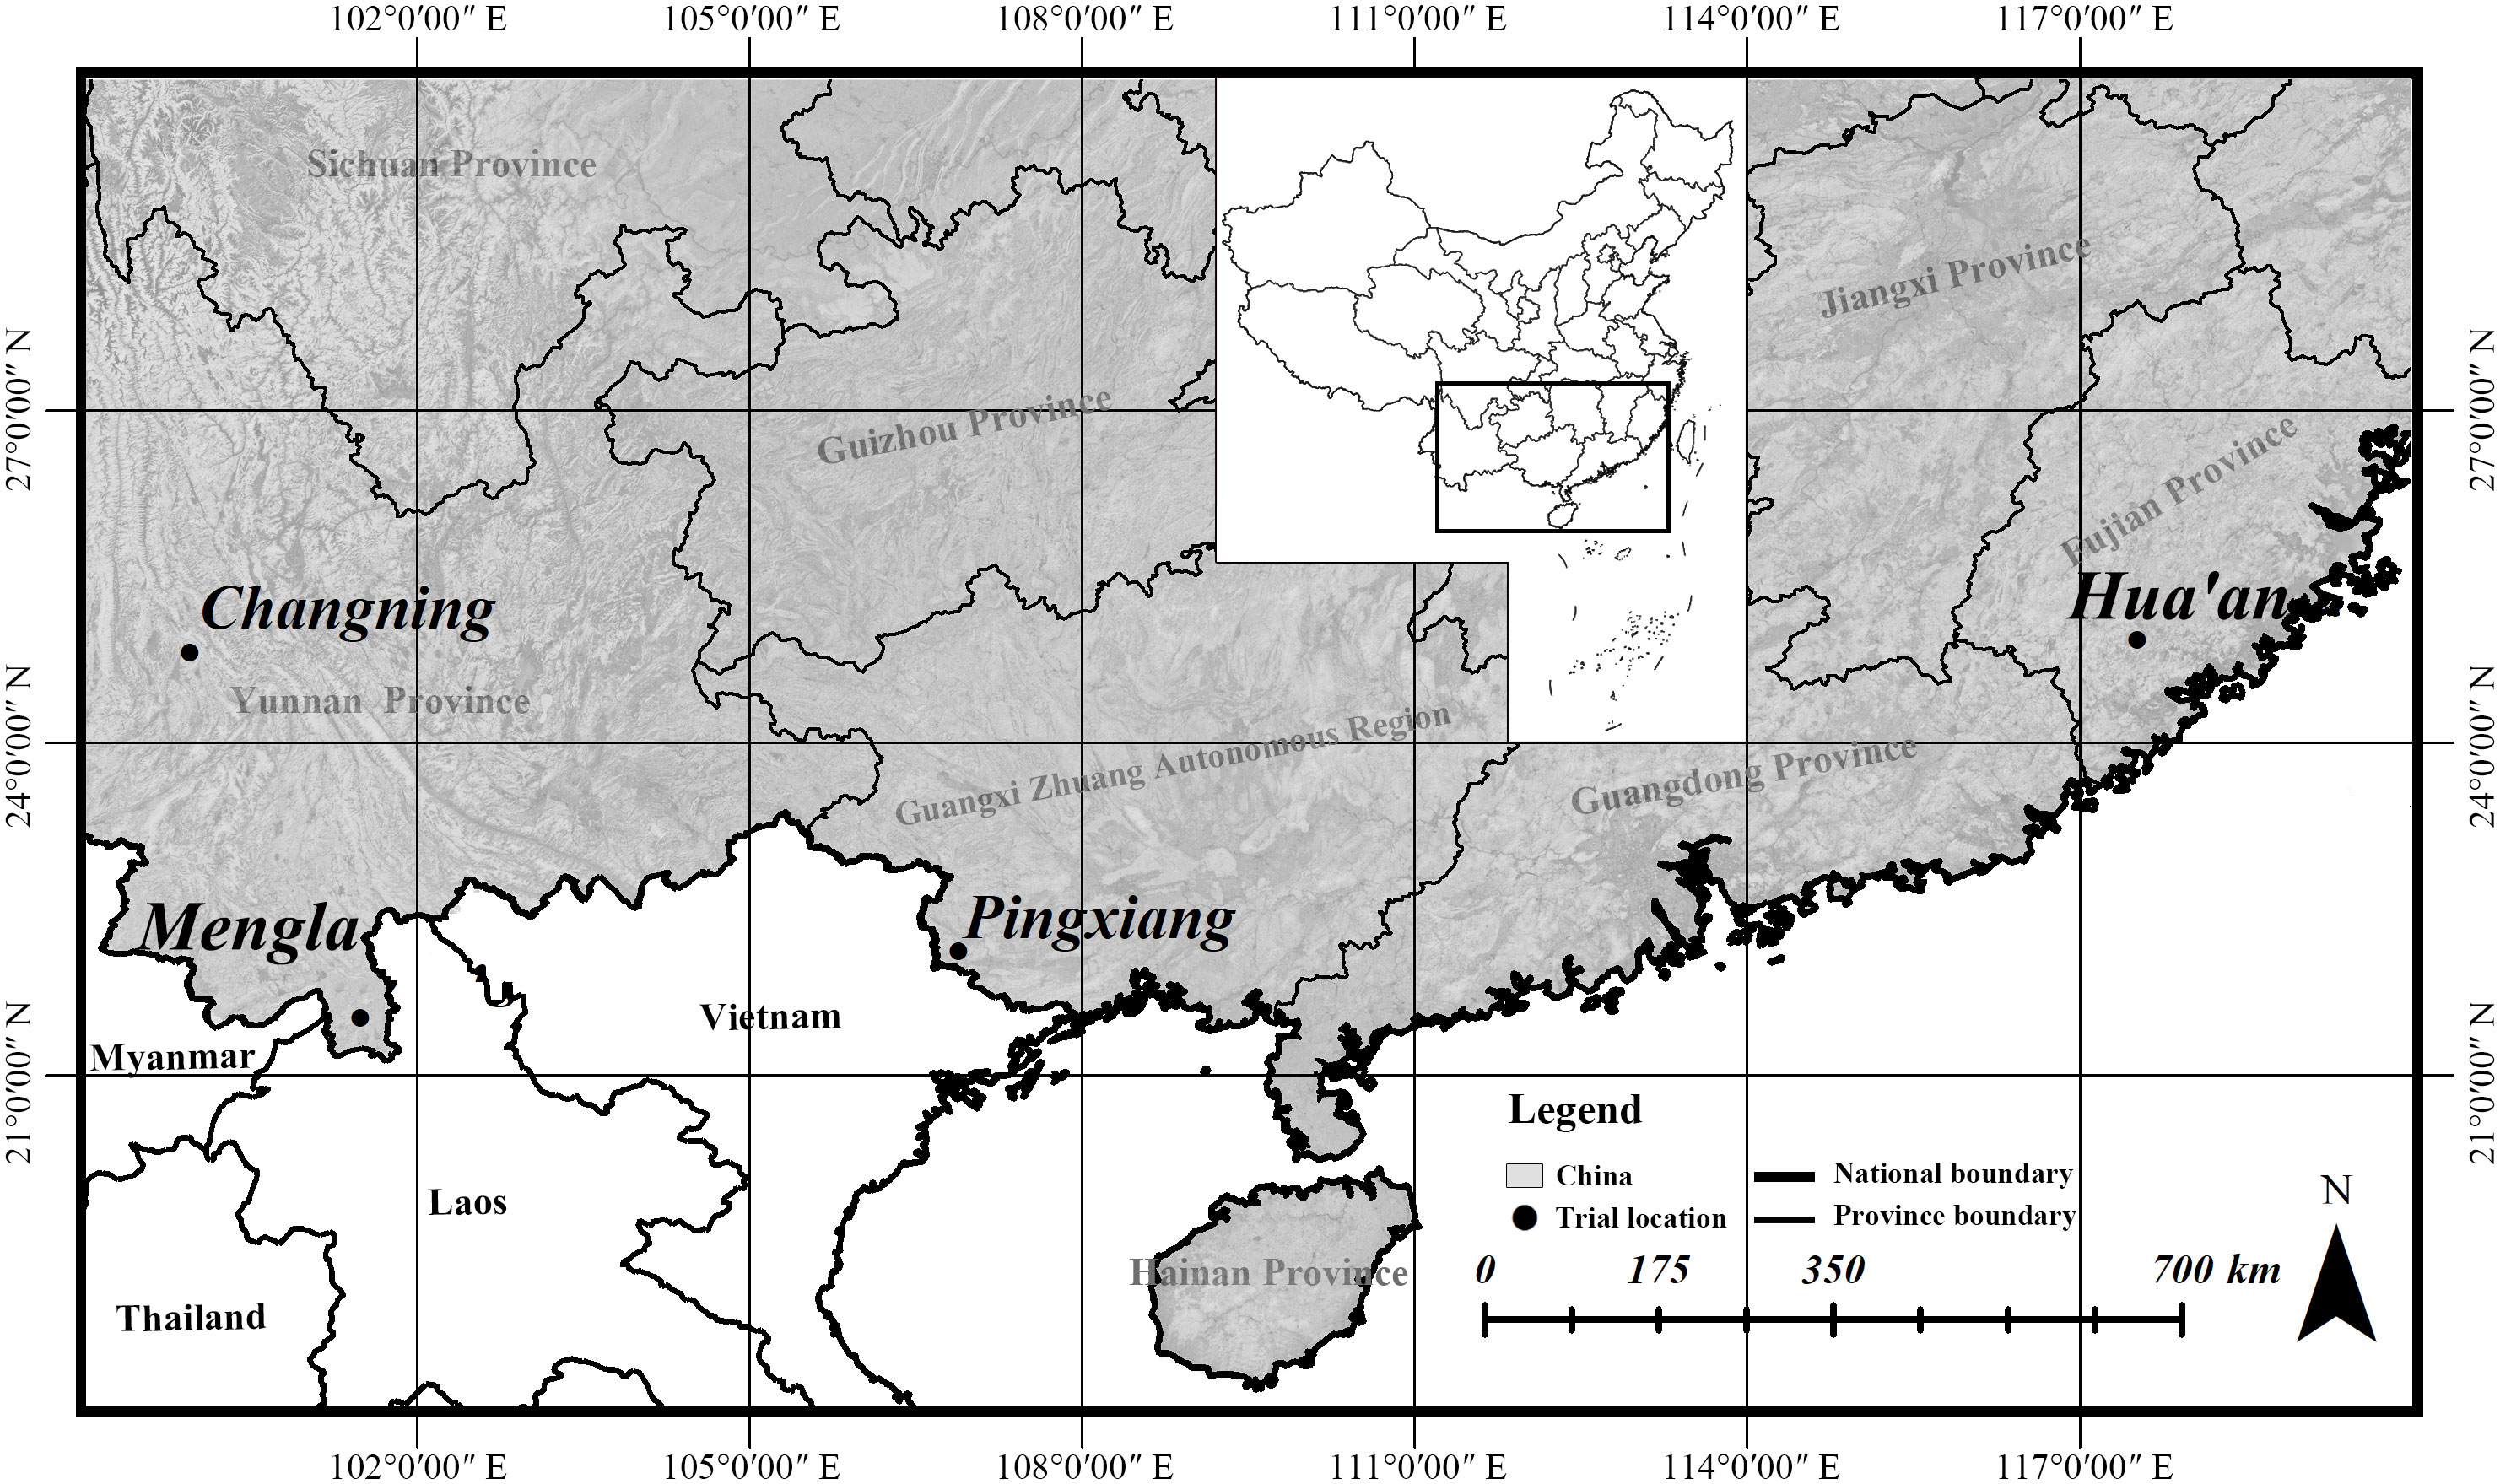
Figure 1 Locality of provenance family trials for Betula alnoides.
2.2 Measurement of tree growth traits
Tree growth was investigated at four sites in late 2017 to early 2018. The blocks with survival rates lower than 60% were discarded at each site so as to keep consistency of survival rate among provenances and sites and thus avoid the impact of mortality on the H-D relationship. The current survival rate ranges from about 63.16% to 66.61% at four sites. All trees in well-reserved blocks were measured for DBH to the nearest 0.1 cm using a diameter tape and for H to the nearest 0.1 m using a Vertex IV Altimeter (Haglöf Sweden AB, Västernorrland, Sverige). A total of 7,724 trees were used for model analysis, including 3,403, 953, 1,438, and 1,930 trees at the ages of 15, 15, 14, and 10 years in Mengla, Pingxiang, Hua’an, and Changning sites, respectively. Variance analyses (ANOVA) and Tukey’s multiple range tests were conducted to estimate the differences in DBH and height among sites and provenances. The scatter plots of H and DBH showed a curvilinear relationship at all four sites (Figure 2).
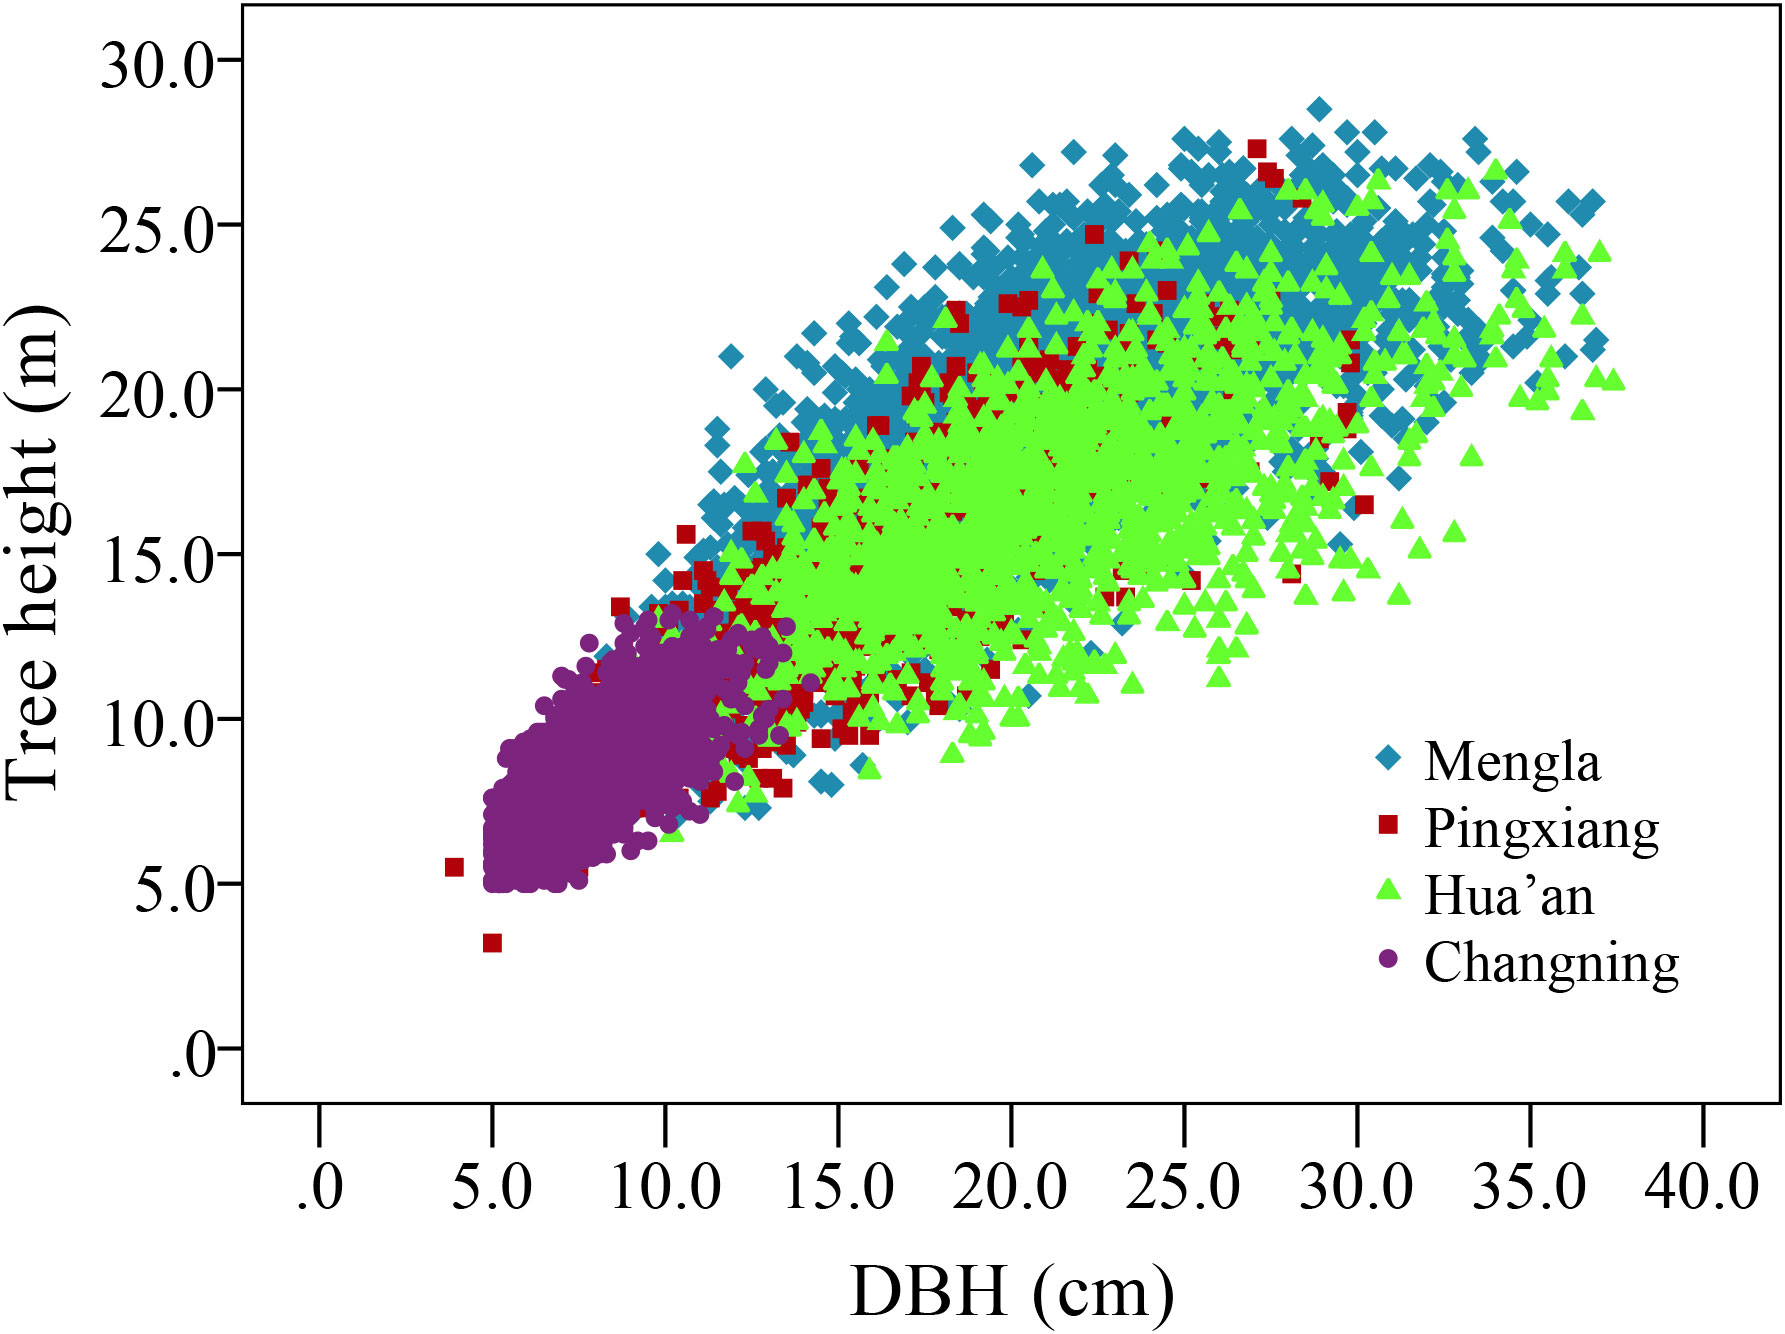
Figure 2 Scatter plot of tree height and stem diameter at breast height (DBH) of Betula alnoides at four sites.
2.3 Selection and extension of statistical models
Ten commonly used H-D equations (Table 1), including two linear and eight nonlinear ones, were used to model the H-D relationships. For evaluating the model performances, the goodness of fit for each model was then assessed with mean absolute error (MAE), Akaike’s information criterion (AIC), adjusted coefficient of determination (R2), largest log-likelihood (LL) and paired t-test (Liu et al., 2017). The equation with a high goodness of fit was selected as the base model for further analysis.
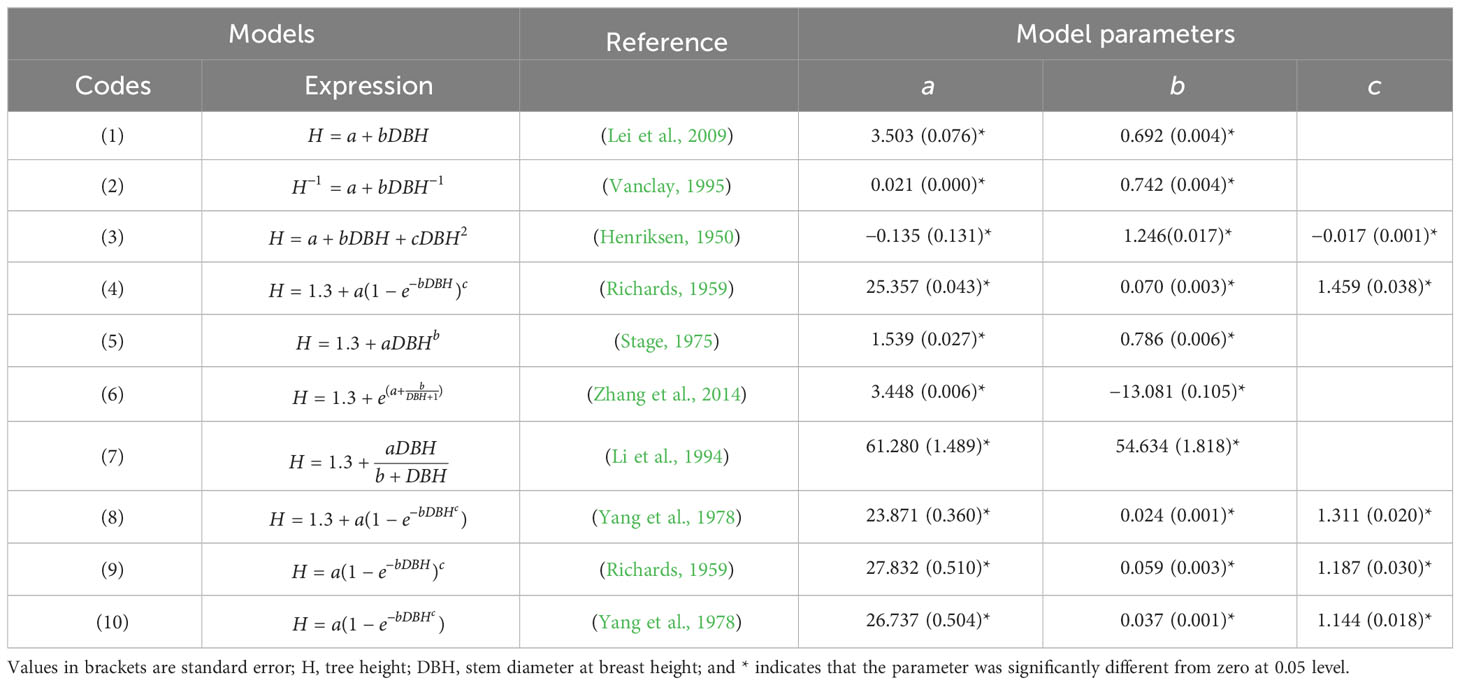
Table 1 Parameter estimates for the candidate models.
Site and provenance variables usually affected the asymptotes rather than the slopes of the H-D equations (Buford, 1986; Fu et al., 2016; Zhang et al., 2019); they were thus introduced step by step into the asymptote parameter of the base model in the present study. Here, the extended models for Equations (1) and (8) in Table 1 were taken as examples for linear and nonlinear equations, respectively:
where H and DBH are the tree height and stem diameter at breast height, respectively; , , and , are basic parameters; and are dummy parameters; and is error term. denotes the site dummy variable with i = 1, 2, and 3. Changning site is taken as a reference, and Mengla, Pingxiang, and Hua’an are set as dummy variables: = 1 denotes Mengla site and 0 for the rest of sites; = 1 denotes Pingxiang site and 0 for the rest of sites; = 1 denotes Hua’an site and 0 for the rest of sites; and the Changning site is represented by = = = 0. denotes the provenance dummy variable with j = 1, 2, 3, …, 24. Provenance Y is taken as a reference, and other provenances are set as dummy variables: = 1 denotes provenance A and 0 for the rest of provenances; =1 denotes provenance B and 0 for the rest of provenances; and so on…. = 1 denotes provenance X and 0 for the rest of provenances; and the provenance Y is represented by = = ⋯ = = 0. The likelihood-ratio test (LRT) (Fang and Bailey, 2001) was used to estimate whether the site or provenance variables influenced the equation parameters significantly:
where and are largest log-likelihood of extended model i and base model j. Compared with the critical values for chi-squared distribution, if , there exist significant differences between model i and model j at 0.05 level. The model parameters then are influenced significantly by site or provenance variables, where and are the degrees of freedom of extended model i and base model j, respectively.
Block was then introduced into the dummy model as random effects to analyze the H-D allometry. A method of Davisian and Giltinan (1995) was used to account for the within-tree heteroscedasticity and autocorrelation in the variance–covariance matrix () of the error term ():
where is a variance–covariance matrix of the error term () in the mth tree nested within lth block for the jth provenance at the ith site; is a scaling factor for error dispersion, given by a value of residual variance of the estimated model; and and are × diagonal matrix explaining the variance of within-tree heteroscedasticity and autocorrelation structure of errors. Power variance fuction (Fu et al., 2016) was used to reduce heterogeneity in variance:
where x is fitted values as the selected predictor, γ is the parameter to be estimated, and is an error term. The all parameters in the nonlinear mixed-effects (NLME) models were estimated with restricted maximum likelihood implemented in R software “nlme” package (Pinheiro et al., 2017).
On the basis of NLME models, the curves of the H-D relationship at four sites and of 25 provenances at each site were simulated to assess variation among sites and provenances. Considering the visualization and simplicity for the H-D relationship in line graphs as well as subsequent provenance selection, the 25 provenances were clustered into several groups through the system clustering method based on Euclidean distance of asymptote parameter at each site. The H-D relationship of groups was then showed in a line graphs and used for comparison and selection for provenances.
2.4 Excellent provenances selection
The H-D relationship was further involved in the selection of excellent germplasm. Because the large-sized timber production is the target of management for valuable tree species and lower asymptote of the H-D relationship at a given DBH is important for wood quality and tree stability, above-average DBH growth and lower asymptote of the H-D curves were thus used as the indicators. The provenances with above-average DBH were ranked by their asymptote parameter in the H-D equations, and excellent provenances with lower values of asymptote parameter were then selected with a rate of 20% at each site, i.e., five provenances of the total 25 were selected. The individual volumes were used to evaluate the effect of selection and were calculated as volume = 0.45/4πDBH2 × H (Wang et al., 2013), and selection gains were calculated as selection gain = (selected mean − total mean)/total mean × 100%.
All data analyses and modeling were performed using R software, SPSS 13.0, and Microsoft Excel 2010.
3 Results
3.1 Site and provenance variations of DBH and tree height
There were significant differences in DBH and H of B. alnoides among the four sites at 0.05 level (Table 2). The DBH and height performed better at Mengla and Hua’an than at the other two sites. At each site, both traits differed significantly among provenances, and well-performed provenances varied with sites, which demonstrated obvious interaction between sites and provenances. Provenance A, G, and B performed the best in both growth traits at Mengla, Hua’an, and Changning, respectively; and provenance V and R performed the best in H and DBH at Pingxiang, respectively.
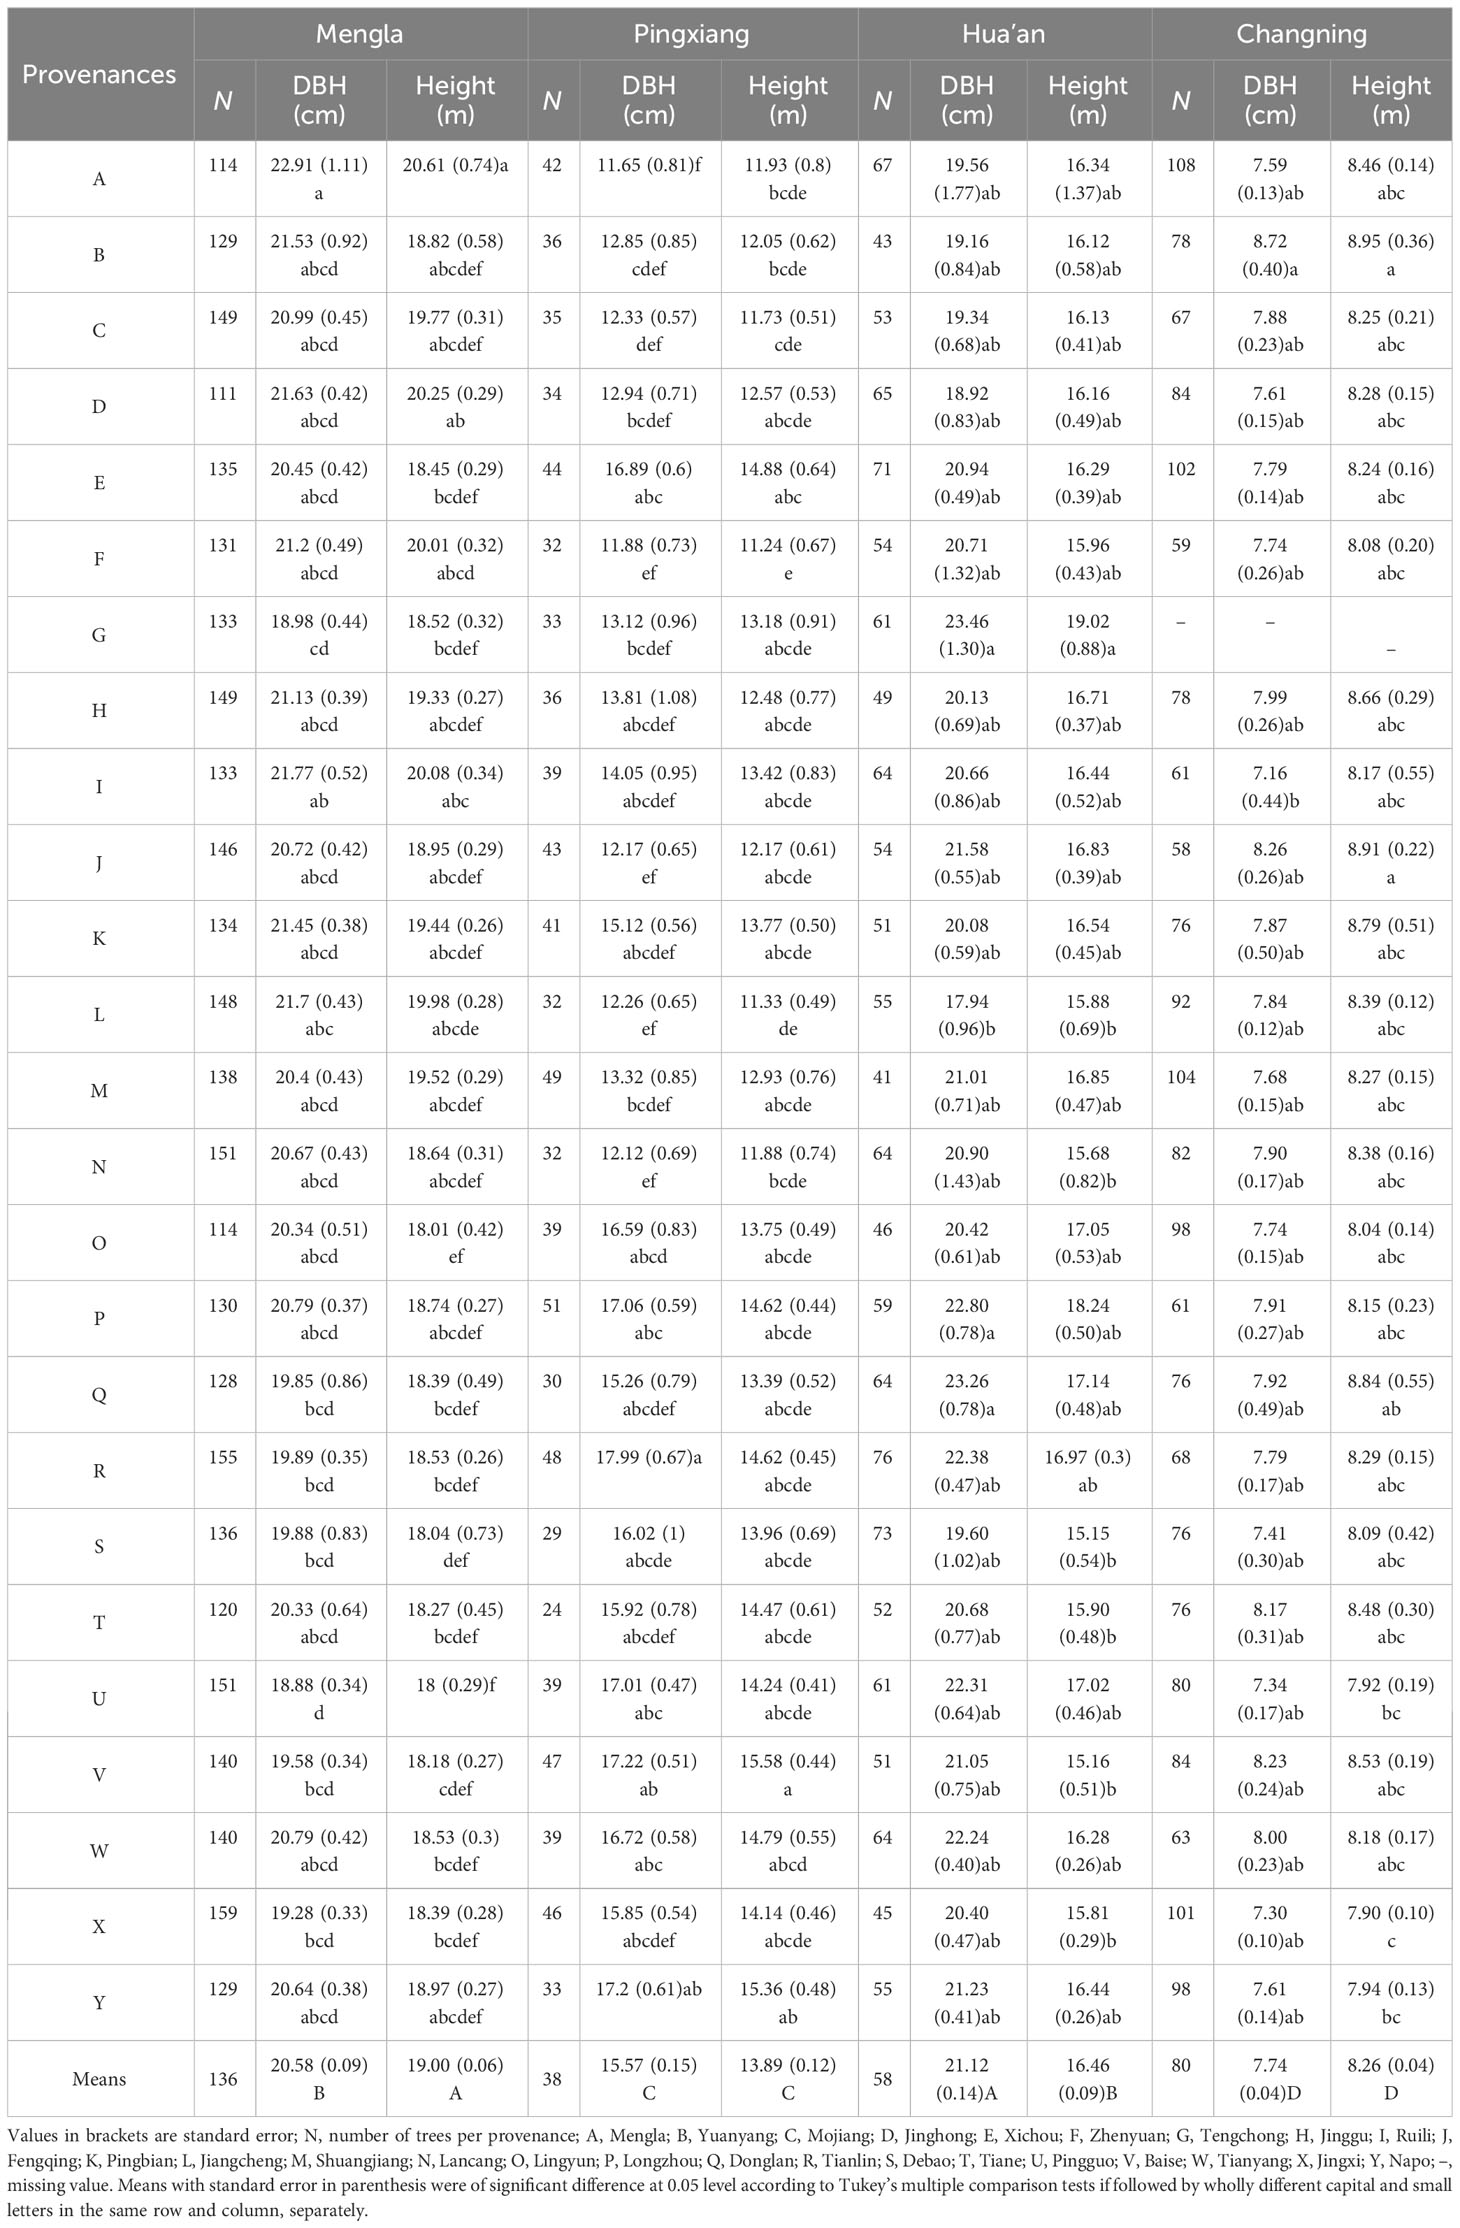
Table 2 Mean values of stem diameter at breast height (DBH) and tree height of 25 Betula alnoides provenances at four sites.
3.2 Nonlinear mixed-effect H-D model
All parameters estimated in each H-D candidate function were of significant difference from zero at 0.05 level (Table 1). The paired t-test showed that there was no significant difference between observed values and predicted values of each model except model (10). The MAE and AIC of the Weibull model [Equation (8)] were the lowest, and its coefficient of determination (R2) was the greatest among all equations (Table 3). Weibull model also satisfied the biological assumption that H is 1.3 m (breast height) when DBH equals to zero for the H-D relationship (Bi et al., 2012), it was thus selected as the base model.
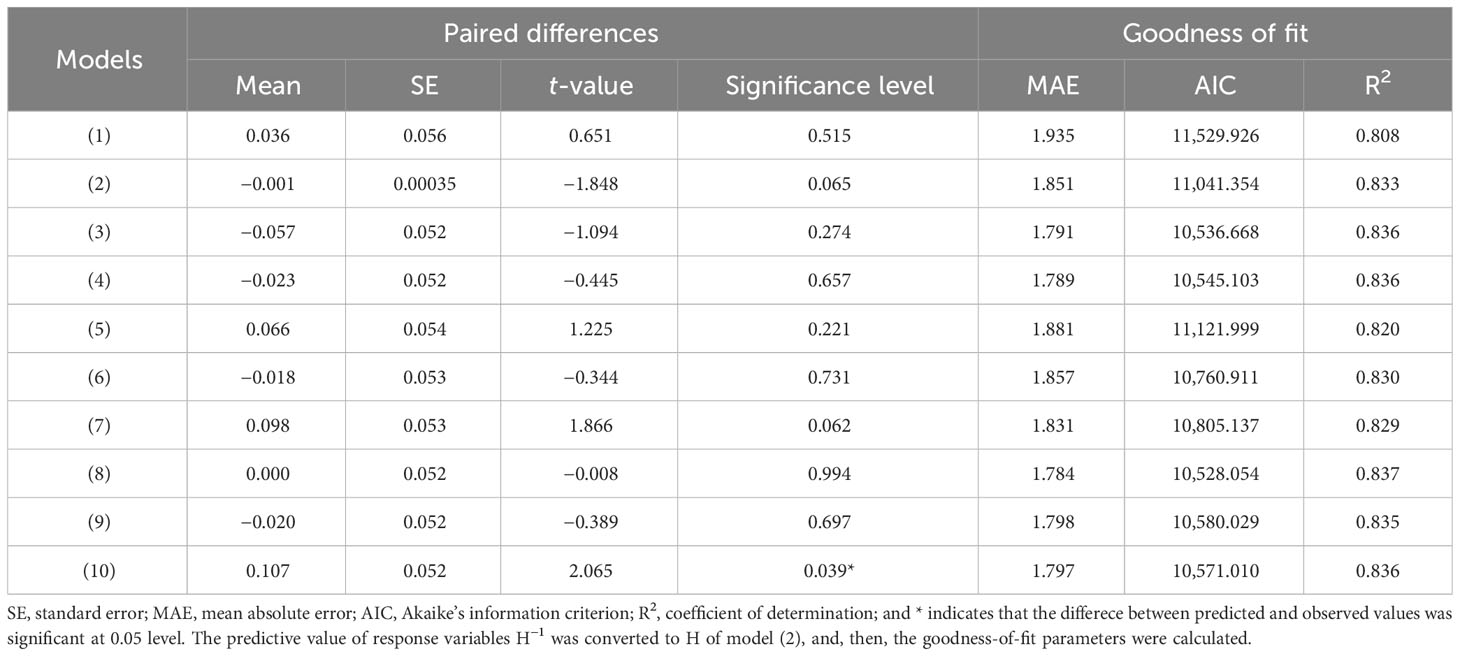
Table 3 Paired t-test of predicted and observed values and goodness-of-fit statistics for the candidate models.
Site and provenance variable was introduced as dummy variables step by step into the asymptote parameter of the base model [Equation (8)], and the random parameters of block were then added to the asymptote and slope of DBH to develop site-level NLME model [Equation (16)] as follows:
Considering the interaction between sites and provenances, provenance dummy variables were introduced into the base model [Equation (8)] at each site, the provenance-level NLME model was then shown as follows:
where and are the random effects on asymptote and slope caused by the lth block, and ~N(0, ), ~N(0, ).
The simulation results and the model performance of the extended models are shown in Tables 4, 5, respectively. The performance of site-level NLME model [Equation (16)] and provenance-level NLME model [Equation (17)] were significantly improved with a smaller MAE and AIC values and a larger R2 and LL values than the base model [Equation (8)]. The LRT test results also demonstrated that asymptote parameters of the models were influenced significantly by site variables and provenance variables at four sites (P< 0.05). The residual scatter diagram of Equation (8) inferred obvious increase trend of predicted H with increasing DBH. Because the heteroscedasticity was effectively accounted by the power variance function [Equation (15)], this trend disappeared with NLME models [Equations (16) and (17) at four sites] (Figure 3).
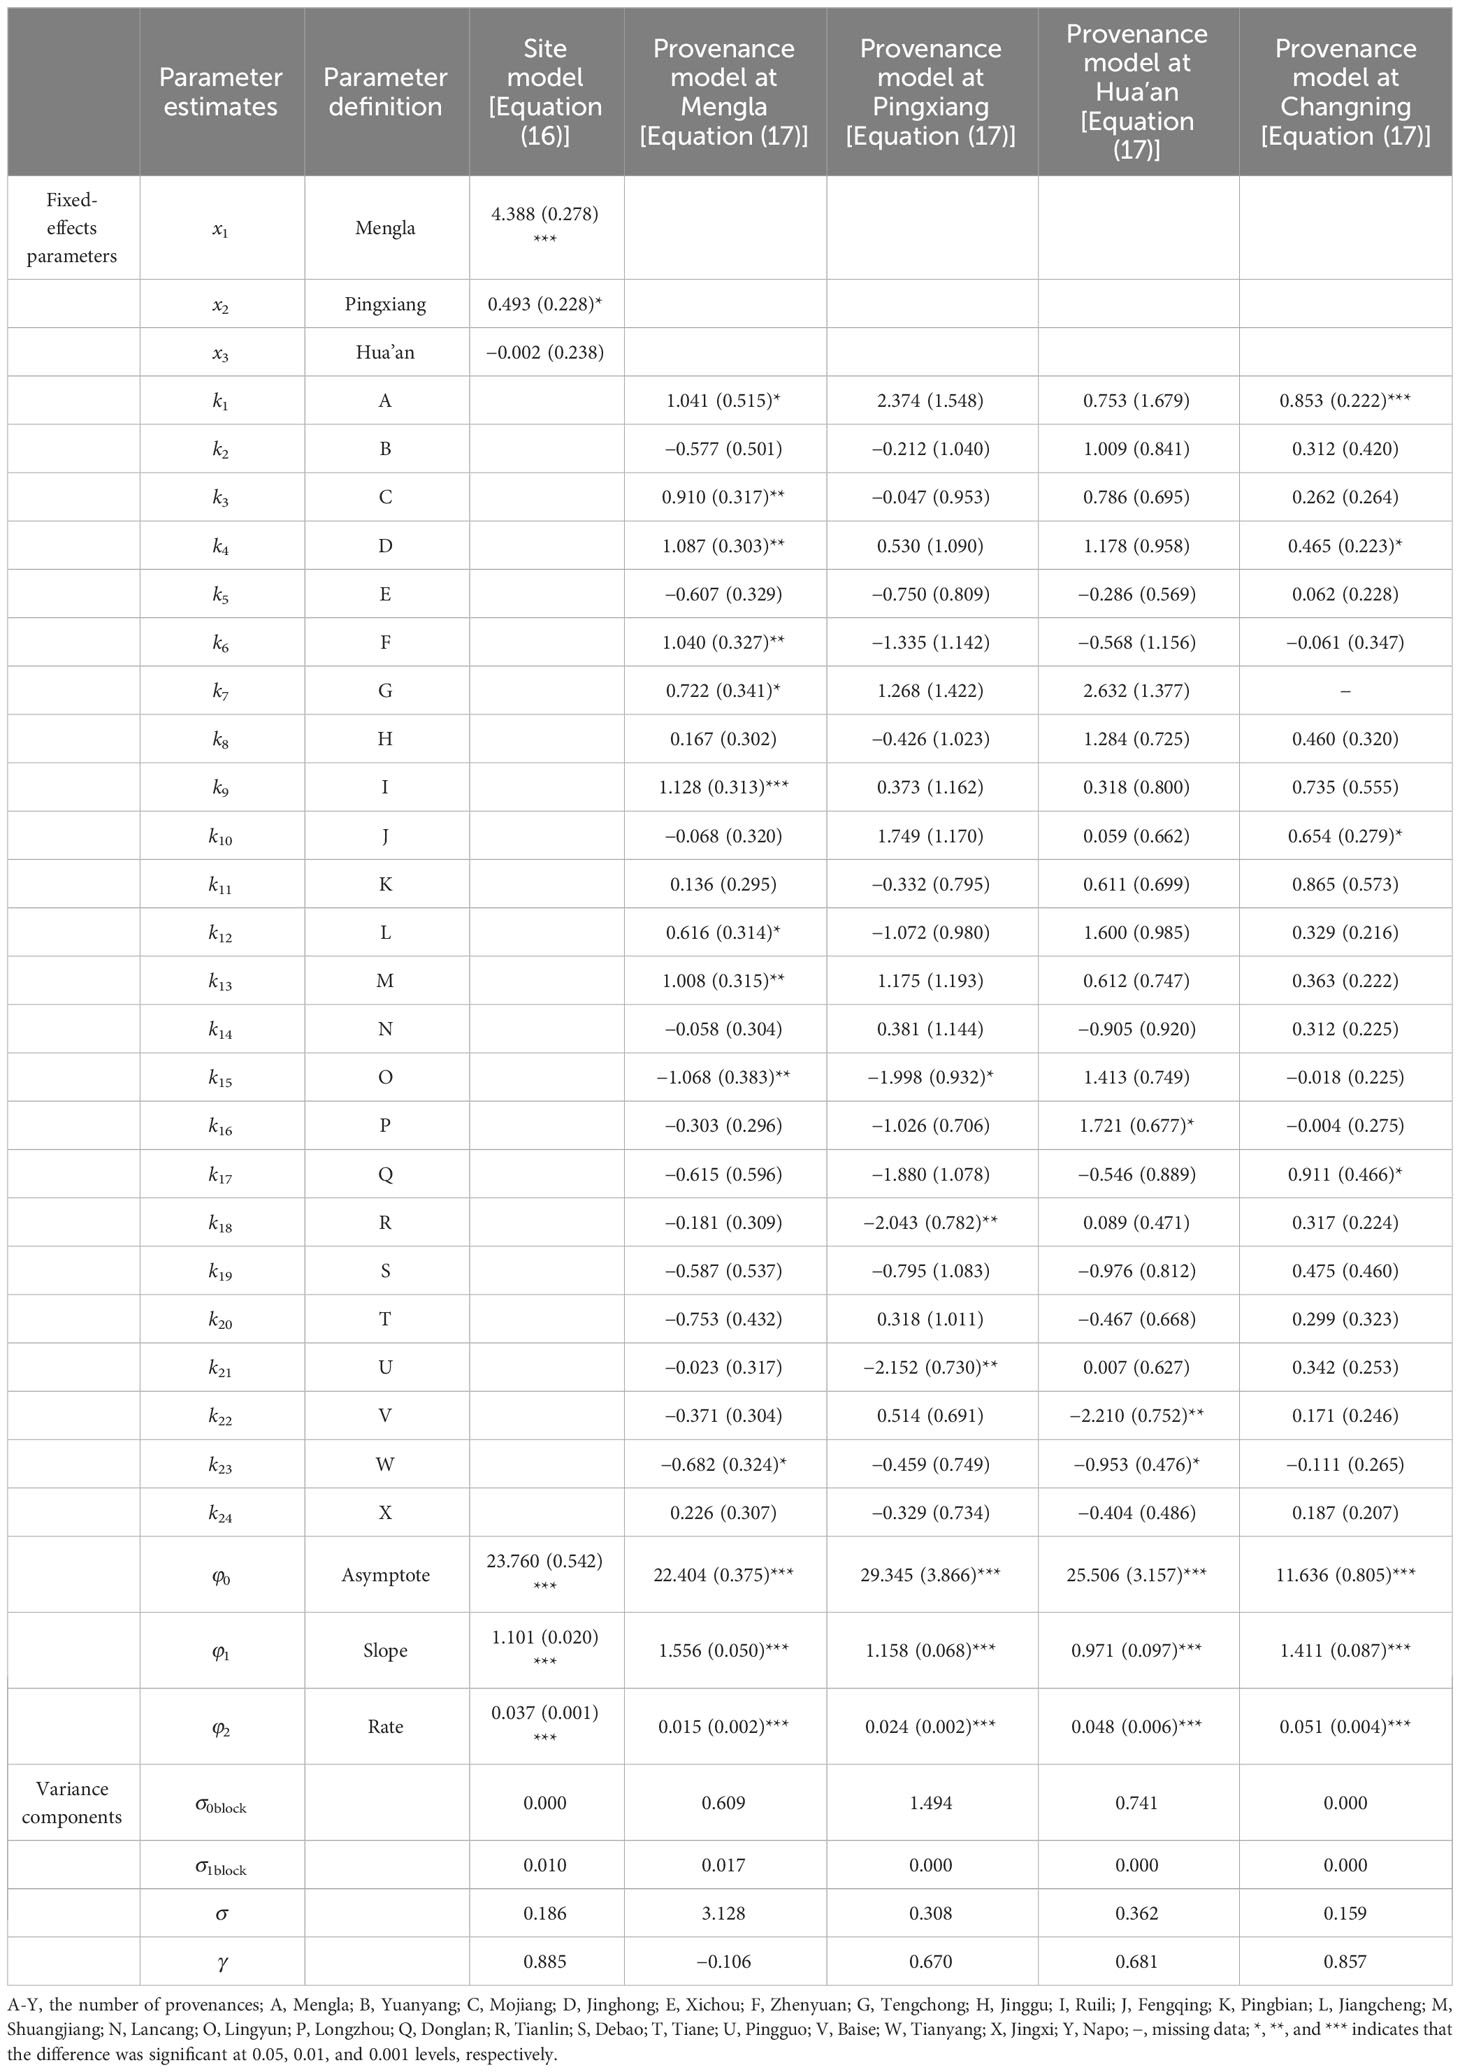
Table 4 Parameter estimates of the nonlinear mixed-effects model at site-level [Equation (16)] and provenance-level [Equation (17)] for Betula alnoids.
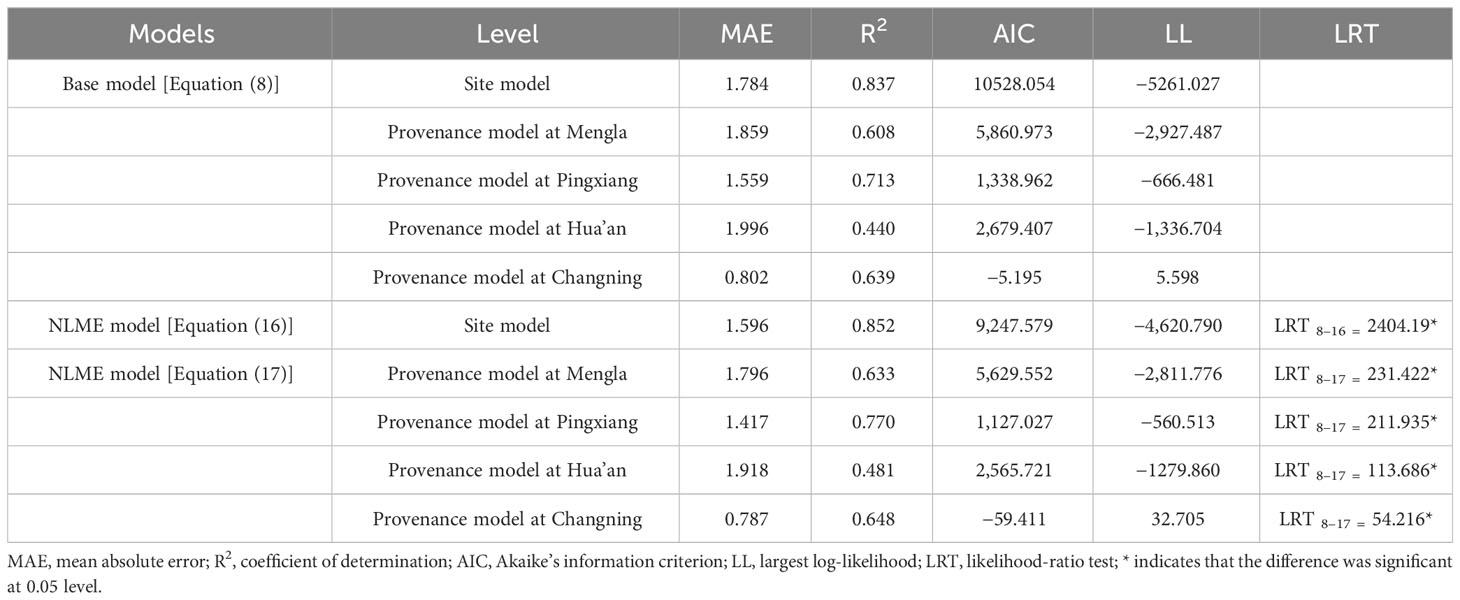
Table 5 Comparison of goodness-of-fit statistics for base model [Equation (8)] and nonlinear mixed-effects (NLME) model [Equations (16) and (17)] at site-level and provenance-level.
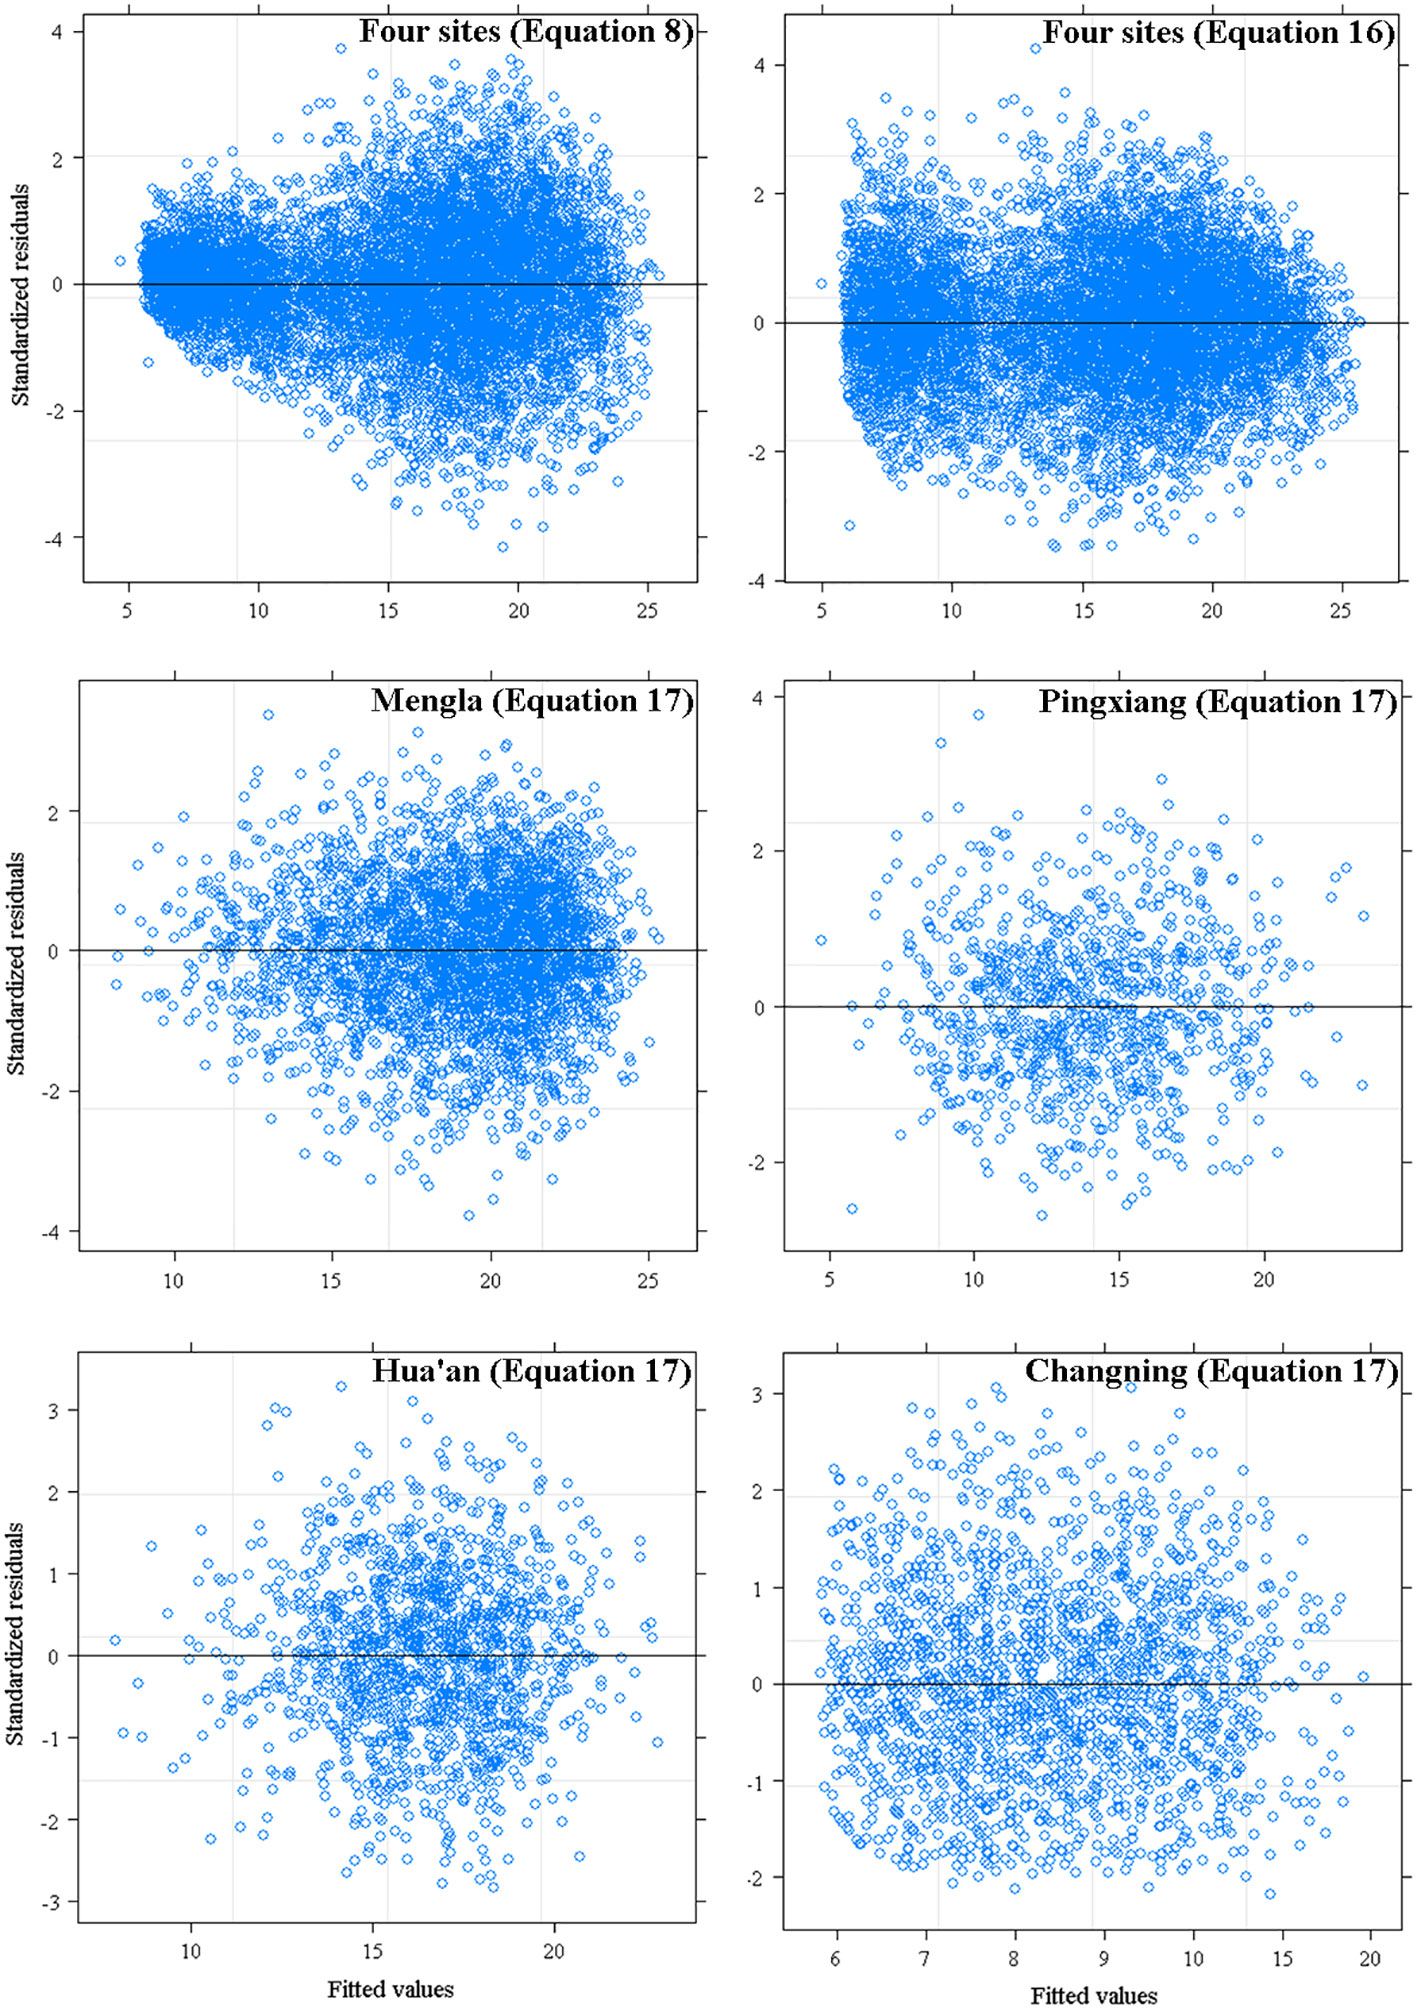
Figure 3 Residuals plots of base model [Equation (8)], site-level [Equation (16)] and provenance-level mixed-effects model [Equation (17)] against fitted values of tree height.
3.3 Site and provenance variations of the H-D relationship
All the basic estimated parameters (, , and ) of the models were significantly different from zero (P< 0.001), and the parameters and were also significant (P< 0.001 and P< 0.05) rather than (Table 4), indicating that the trees at Mengla and Pingxiang sites were significantly taller than those at Hua’an and Changning sites for a given DBH. The H-D curves at four sites by Equation (16) are shown in Figure 4. The simulation results of provenance-level NLME model [Equation (17)] indicated that the influences of provenance variables on asymptote of the models differed among four sites, and difference of asymptote parameters () among provenances was more significant at Mengla than other three sites. To demonstrate the variance of the H-D relationships clearly, the provenances were clustered into three to five groups based on asymptote parameters (kj) of Equation (17) at each site (Supplementary Figure 1; Table 6). The simulation plots of the H-D curves for these groups were shown in Figure 5. The H increased rapidly with increasing DBH at Changning site, whereas it gradually increased slowly at the other sites, and it tended to be stable at Mengla site. The differences of asymptote among provenances increased with increasing DBH and were not obvious at Changning site.
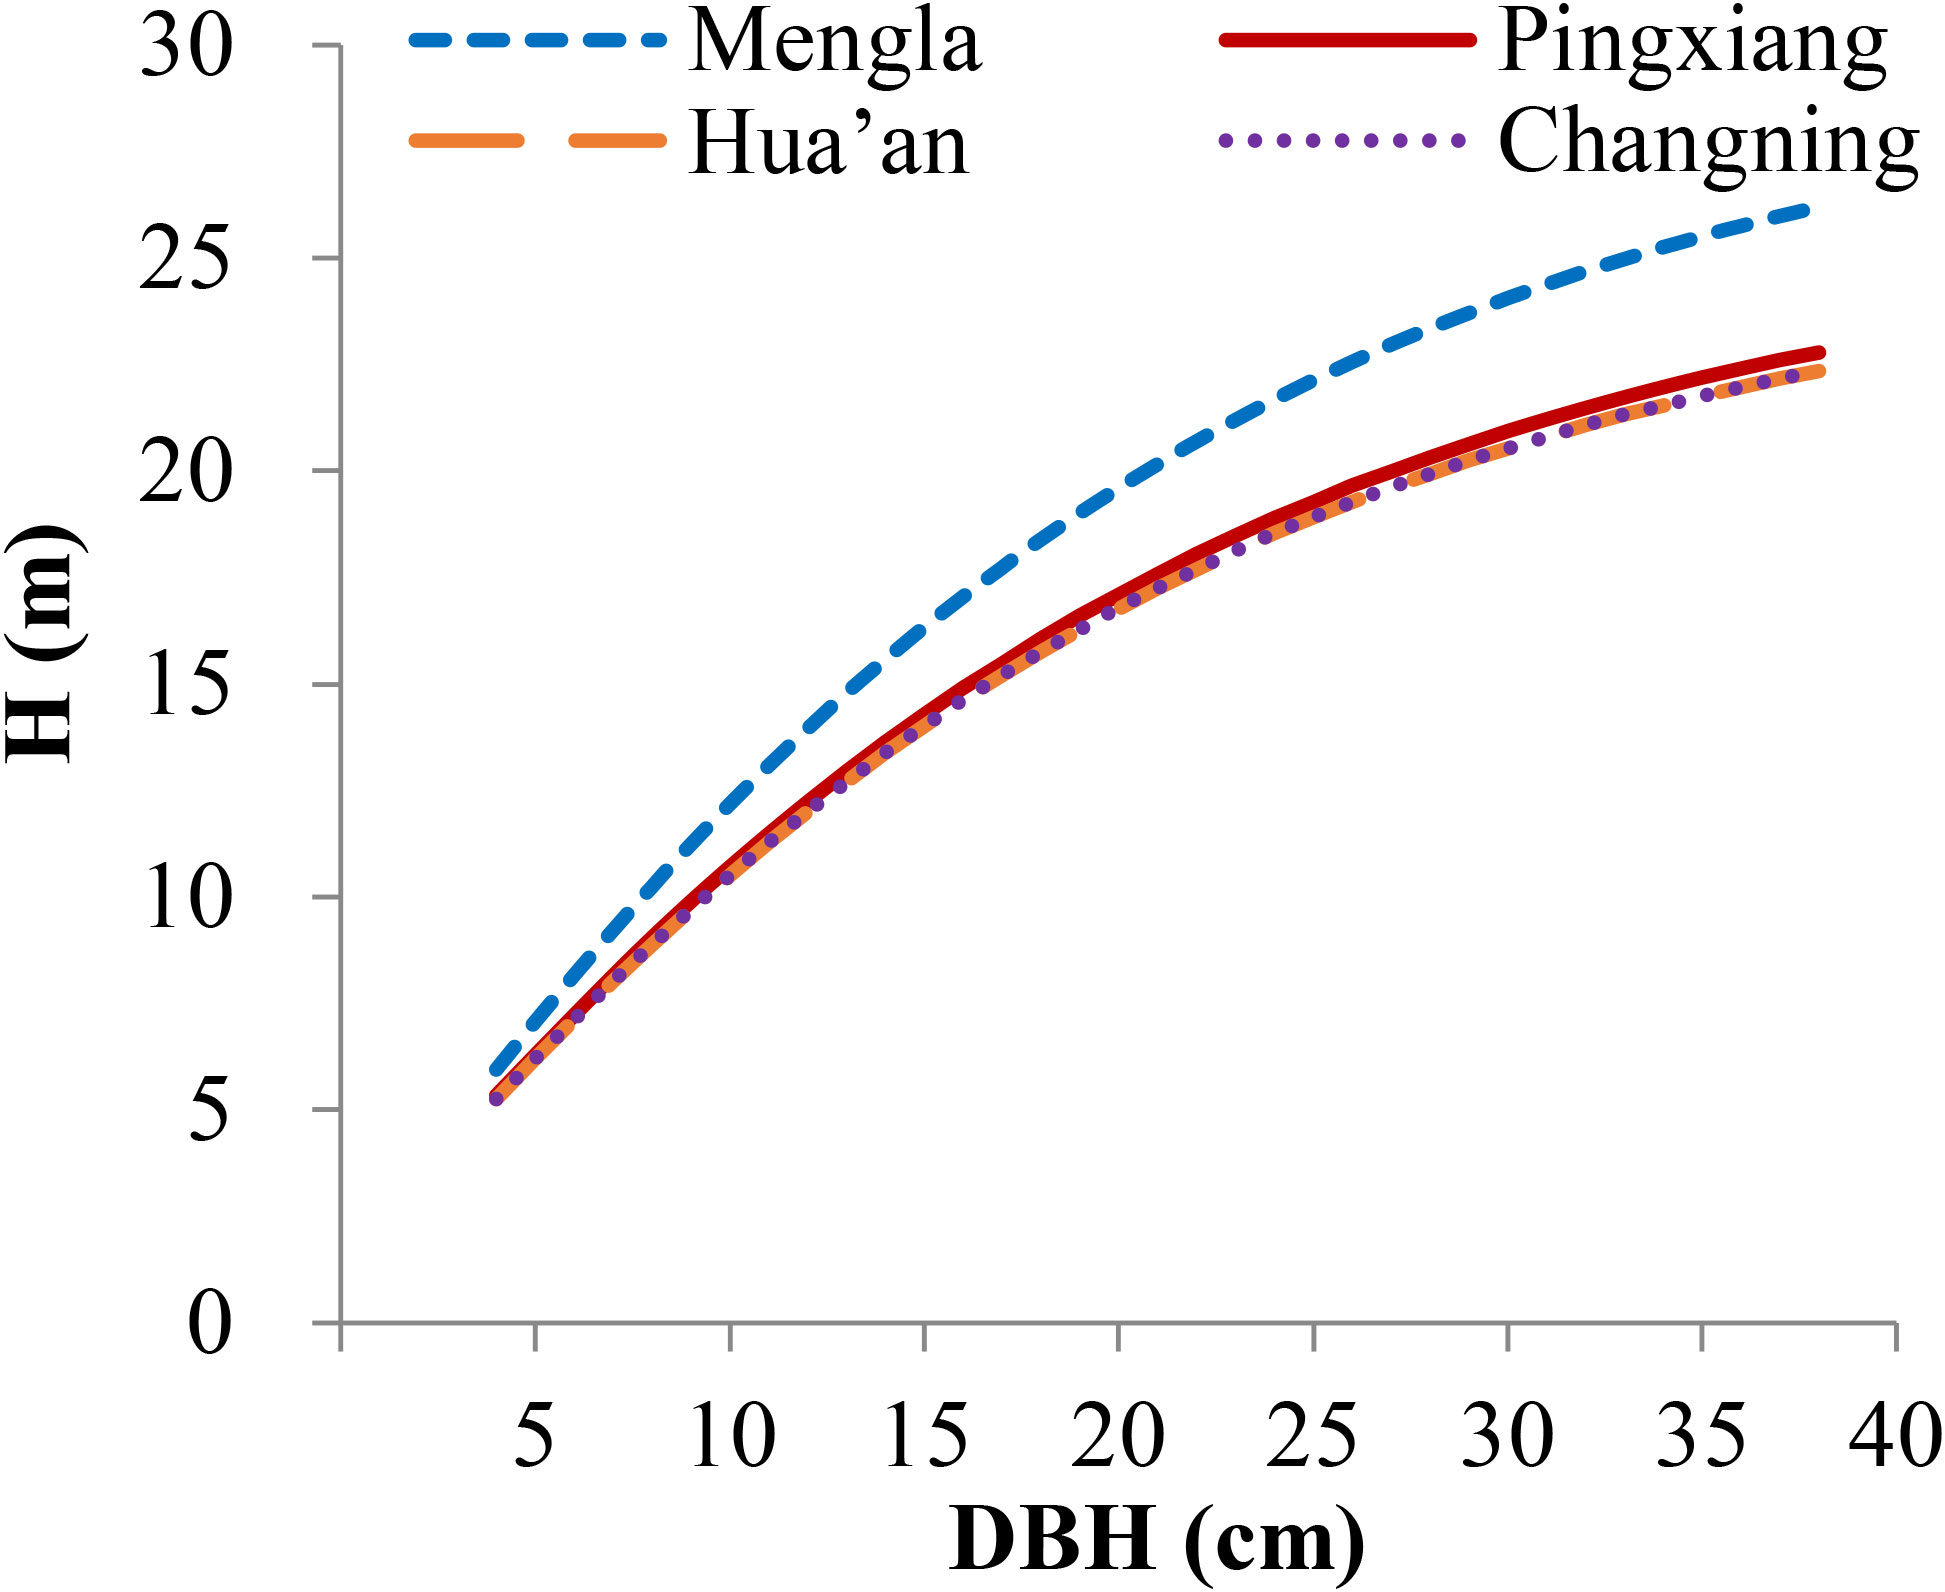
Figure 4 Simulation plots of height–diameter curves for Betula alnoides based on site-level nonlinear mixed-effects model [Equation (16)]. H, tree height; DBH, stem diameter at breast height.
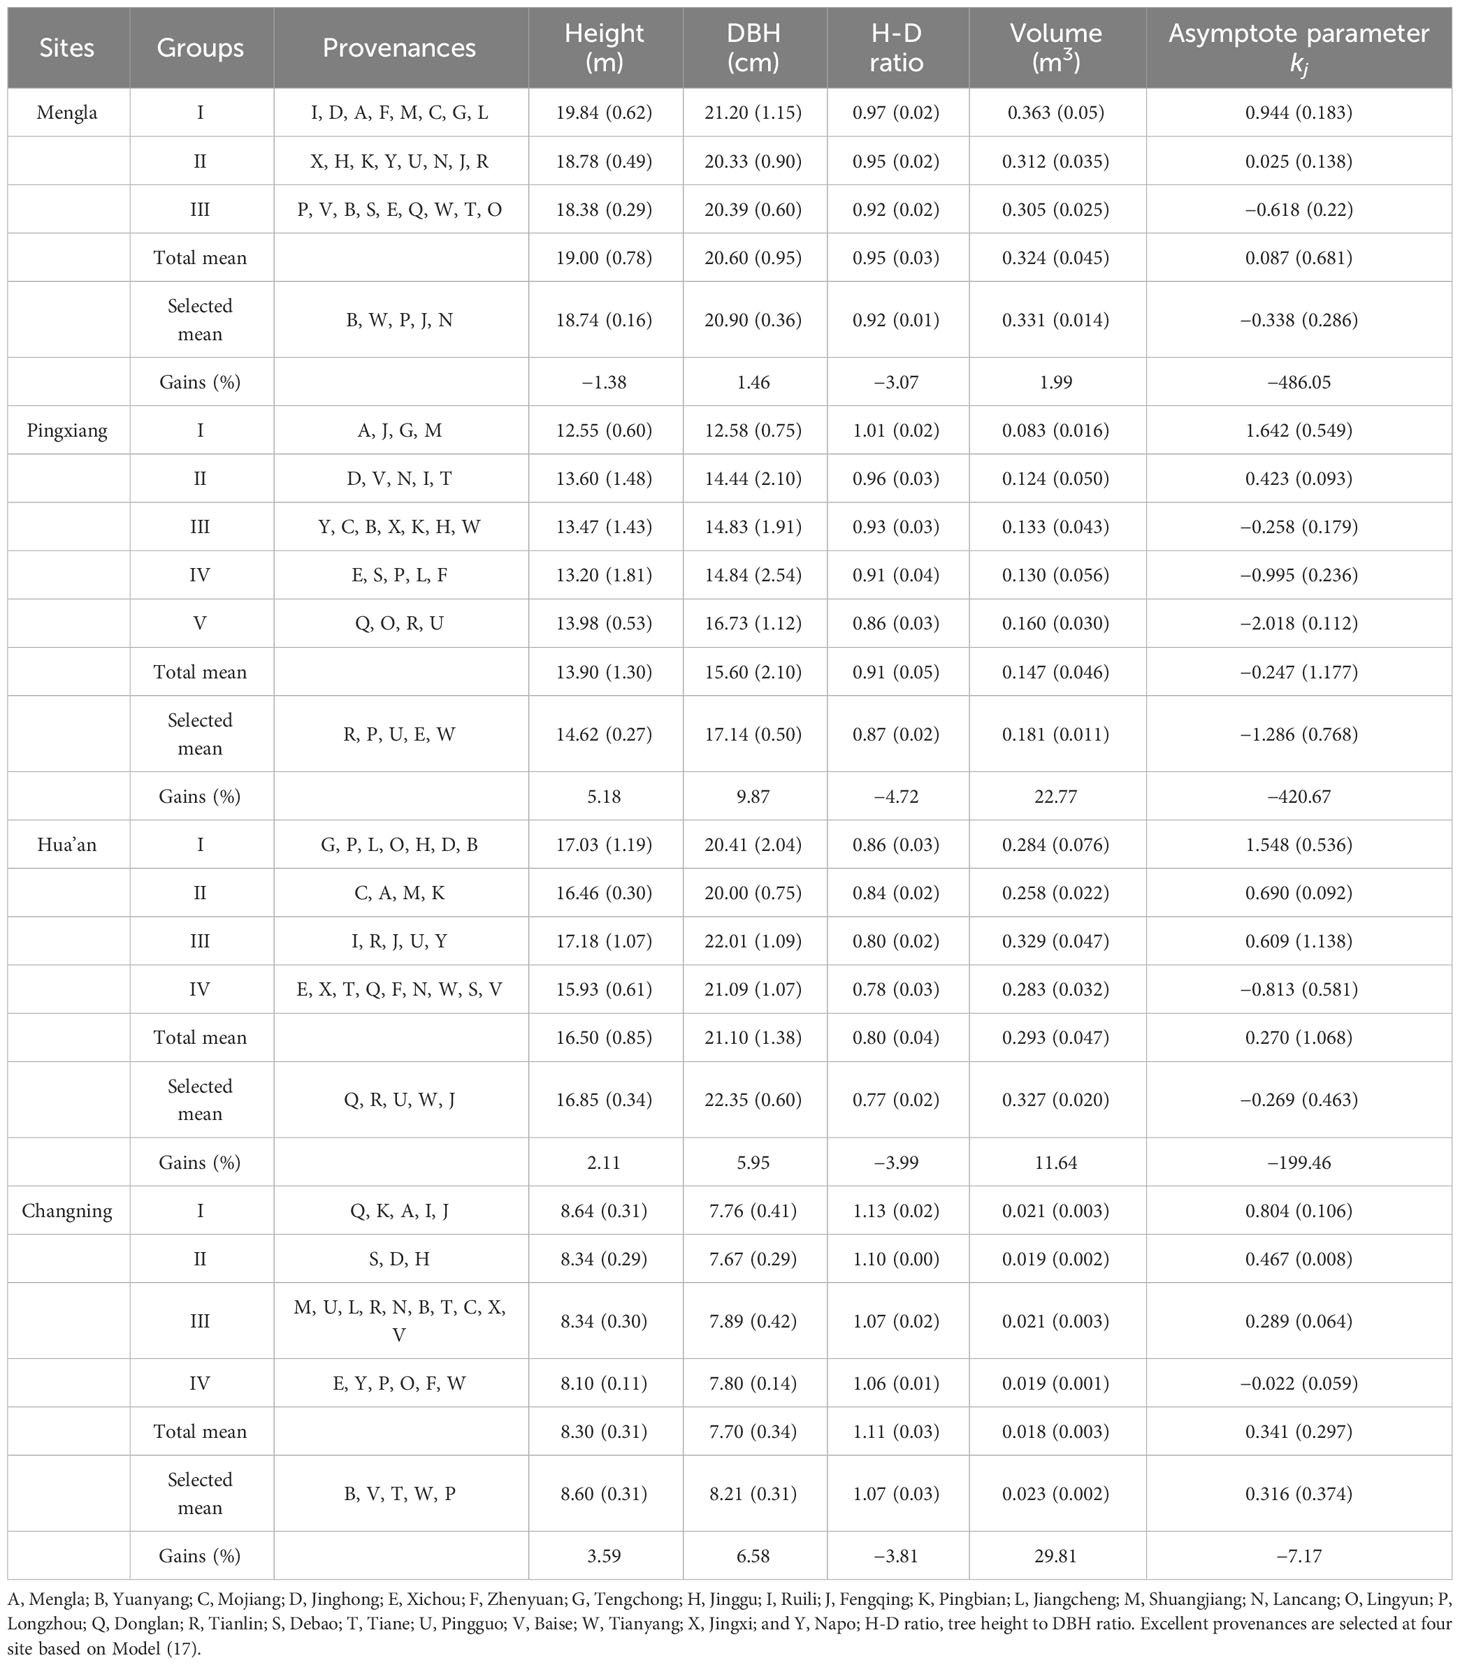
Table 6 Growth performances and selected gains (values in brackets are standard error) of the excellent Betula alnoides provenances seleted by asymptote parameter (kj) and stem diameter at breast height (DBH) at four sites.
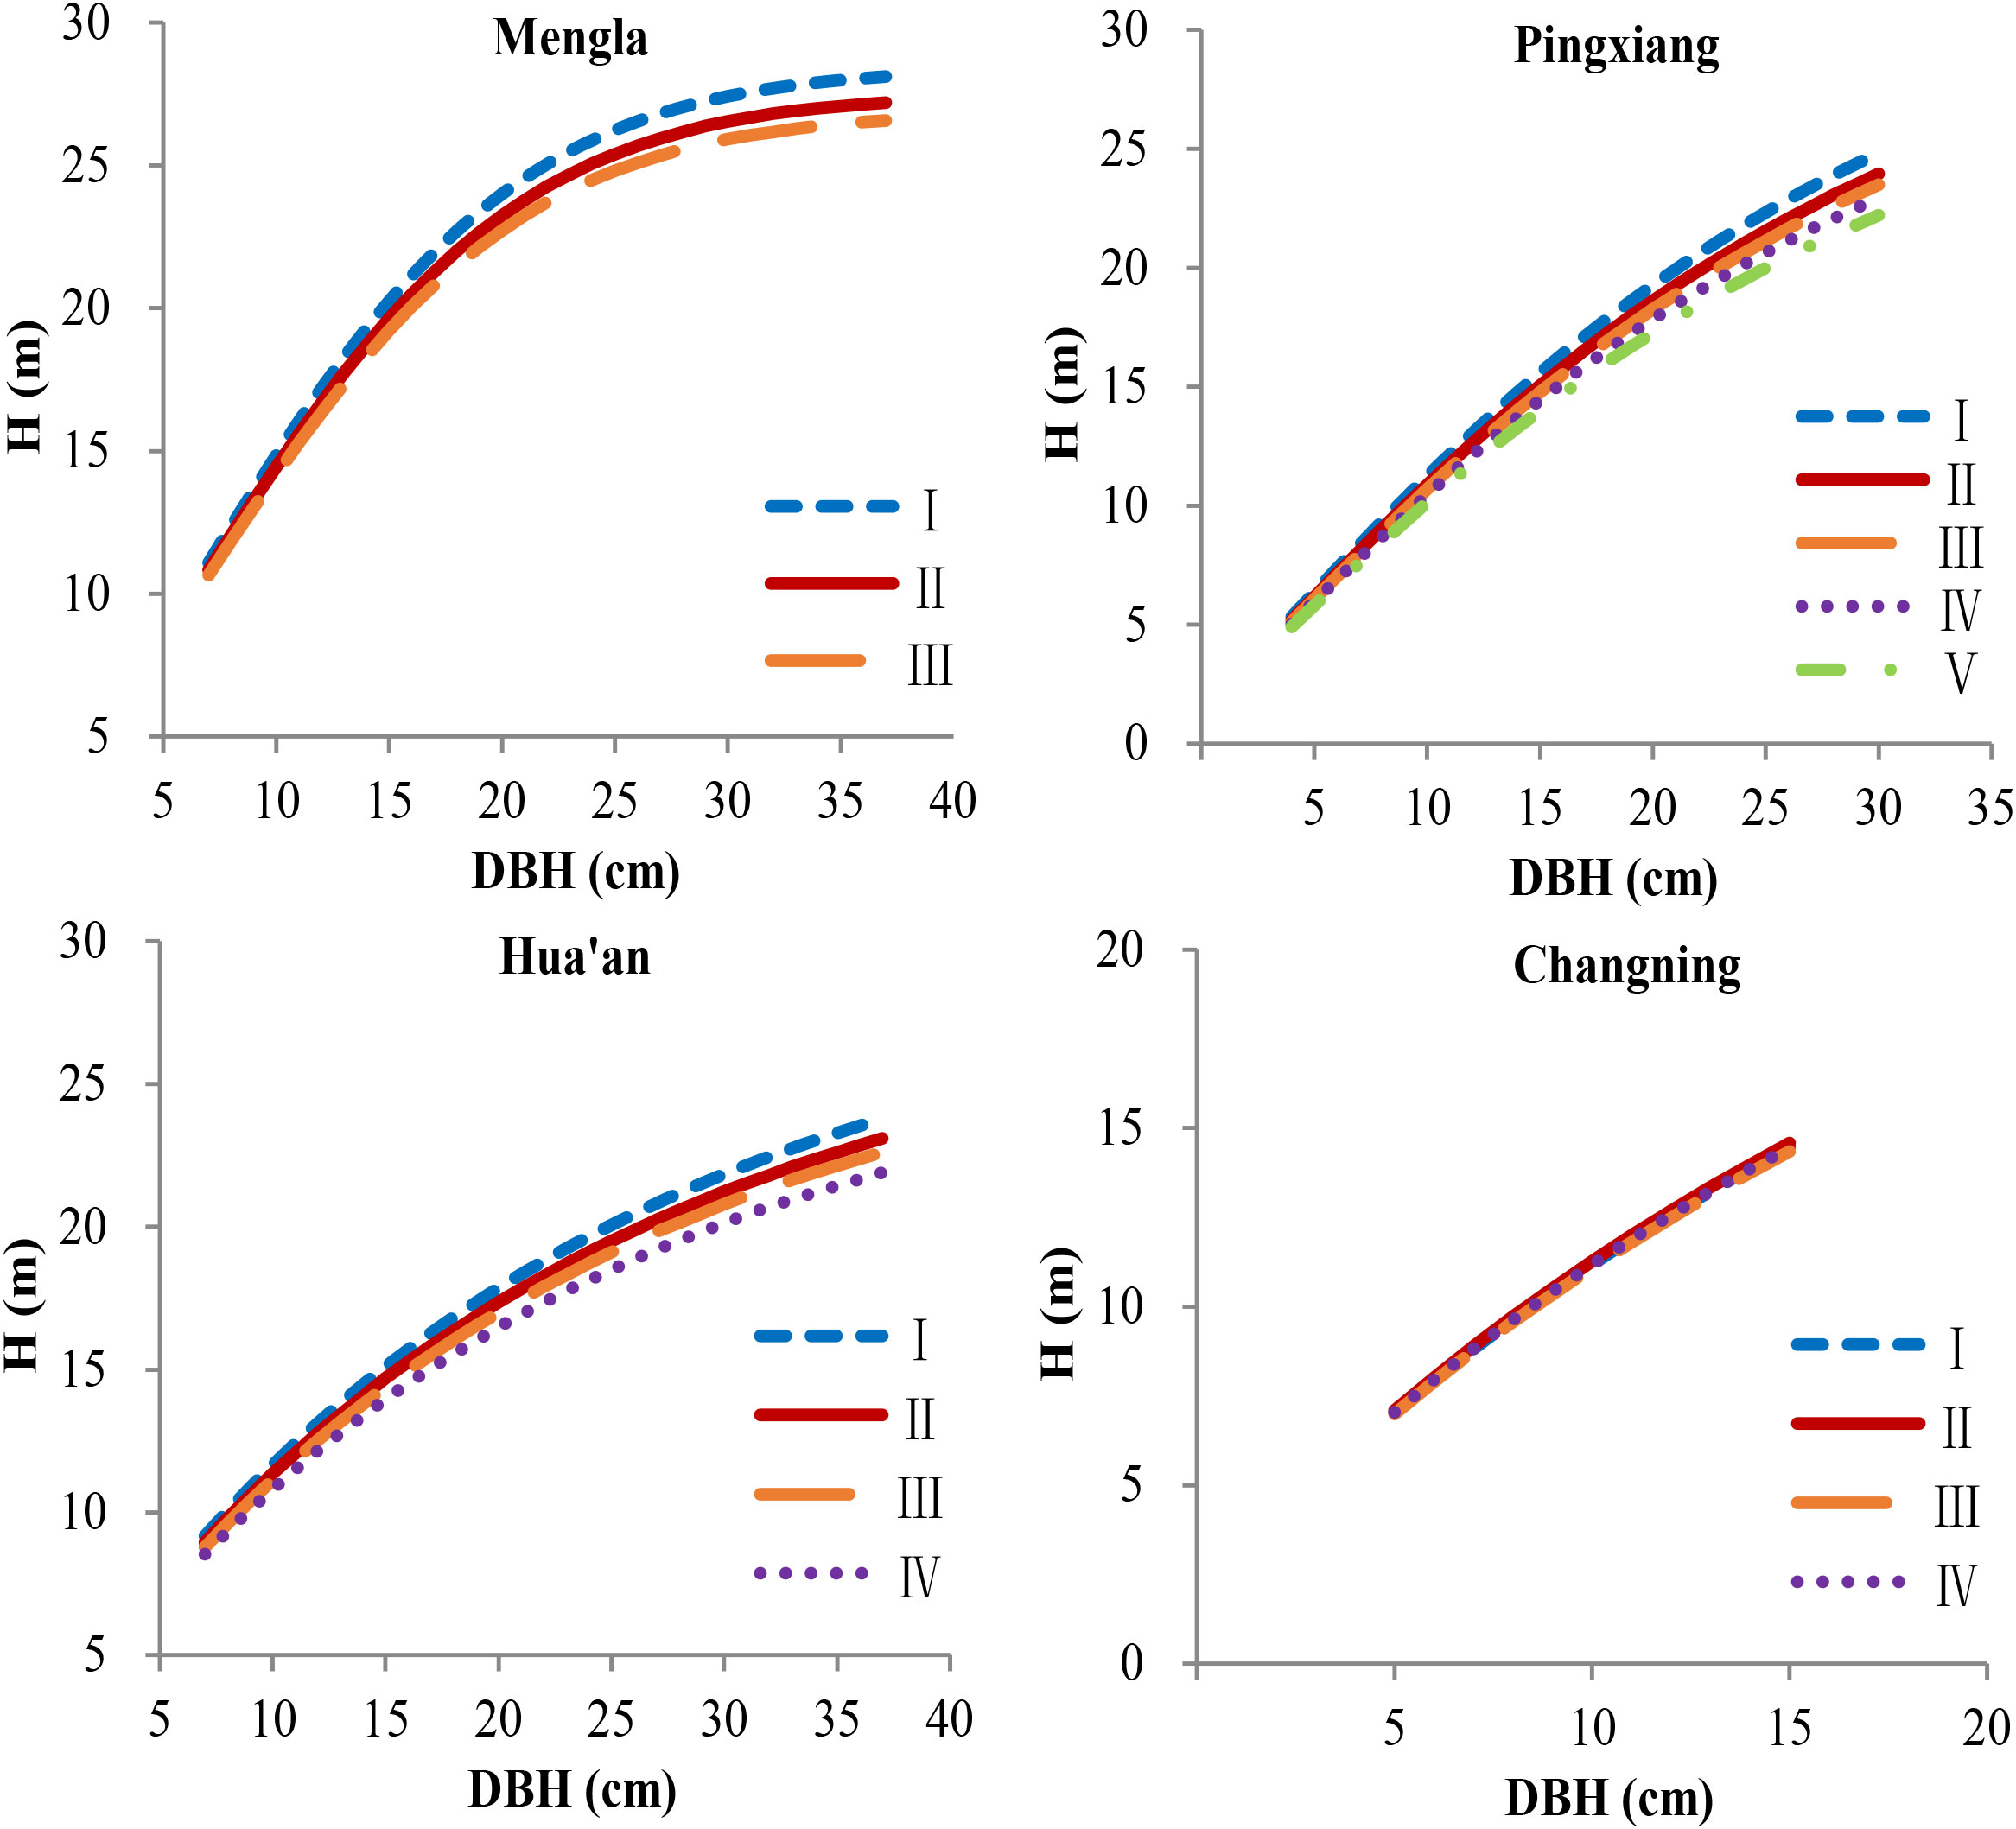
Figure 5 Simulation plots of height–diameter curves for Betula alnoides at four sites based on provenance-level mixed-effects model [Equation (17)]. I–V, provenance groups, see Table 6; H, tree height.
3.4 Excellent provenances selection
The results of elite provenances selection showed that provenances B, W, P, J, and N performed well at Mengla; R, P, U, E, and W did well at Pingxiang; Q, R, U, W, and G did well at Hua’an; and B, V, T, W, and P did well at Changning (Table 6). Their asymptotes parameters values () and H-D ratio decreased from 7.17% to 486.05% and from 3.07% to 4.72% at four sites, respectively, and the selection gains of H, DBH, and individual volume ranged from −1.38% to 5.18%, from 1.46% to 9.87%, and from 1.99% to 29.81%, respectively.
4 Discussion
4.1 Model simulation
The application of sigmoidal nonlinear models with inflexion points and asymptotes in simulation height–diameter (H-D) relationship has a long history in tropical and subtropical zones, and many nonlinear models have been developed (Scaranello et al., 2012). The study of Scaranello et al. (2012) indicated that Weibull and Chapman–Richards nonlinear models could improve the fitting accuracy of the H-D relationship in biomass estimates for tropical Atlantic forests in southeastern Brazil. Linear models are also suitable tools once a linearizing relationship can be established through data transformation and reasonable biological significance can be interpreted (Curtis, 1967; Watt and Kirschbaum, 2011). One typical example was that Buford (1986) used transformed linear models to fit the H-D relationship of loblolly pine and found out that the R2 values were consistently larger than 0.88, which provided an appropriate and accurate simulation of height–diameter curves. In the present study, Weibull nonlinear model [Equation (8)] showed the best goodness of fit (R2 = 0.837) among 10 candidate models when fitted with the dataset of H and DBH and was selected as a base H-D model for B. alnoides.
Whether based on linear or nonlinear models, the way to further improve the goodness of fit is to introduce and explain more effect variables (Zhang et al., 2019). The mixed model and dummy variable model approaches are frequently used to construct the H-D relationship equations for tree species. Mixed-effects models can isolate fixed and random variations and are applied to incorporate complex nested stochastic structure in the H-D curves. For instance, Zhang et al. (2019) introduced climate, site, plot variables, etc., into the NLME model to reveal the influence factors on the H-D relationship of Chinese fir. Dummy variable models are also of adequate methodology, especially for the quantification of categorical variables. For an example, Buford (1986) introduced locations into the linear model as dummy variables and revealed clearly the variation of asymptotes in H-D curves among locations.
For the variation analysis of multi-layer complex variables, both dummy variables and mixed-effects models are all powerful modeling tools. There is a little difference between the two kinds of models when the number of samples in each category is large (Wang et al., 2008; Fu et al., 2012). In the present study, the dataset contained 953–3,403 individuals at four site with average of 38–136 individuals per provenance at each site (Table 2), and both dummy variables model and mixed-effects model were thus applied comprehensively. Sites and provenances were introduced into the base model as dummy variables, and block was introduced as random effect to develop the nonlinear mixed-effects models. Significant variations of the H-D relationship were then observed among sites and provenances at each site, and the clear visualization of variation for the H-D relationship among provenances would provide a great convenience for the following selection breeding for B. alnoides.
4.2 Site effect
A better performance of height growth and higher asymptote of the H-D curves was observed, and the H was infinitely close to the growth limit at Mengla, indicating that better soil nutrients and water conditions might be conducive to realise the genetic potential of H in the present study. A study on Norway spruce indicated that abundant soil water and nutrients were beneficial to height growth and thus had a high asymptote of the H-D curves (Bošeľa et al., 2014). In the study of Trouvé et al. (2015) on Quercus petraea Liebl. and the study of Kempes et al. (2011) on the forests in the continental United States, H growth usually decreased and more resources were assigned into radial growth with increasing water stress, which could also result in a low asymptote of the H-D curves. Zhang et al. (2019) reported that the H of Chinese fir plantations decreased with increasing annual heat moisture index in the subtropical zone. These also verify that sufficient water and nutrients can promote H growth and affect the H-D curves. The study of Homeier et al. (2010) on Ecuadorian montane rain forest and the study of Bošeľa et al. (2014) on Norway spruce in the Western Carpathians demonstrated that H tended to decrease with increasing altitude, and DBH gradually played a more important role than H in the H-D relationship. In the present study, the H-D relationship did not show a clear trend with such a large range variation of altitude (275–1250 m) at four sites. This might be closely dependent on the complex geomorphic features in southern China. Buford (1986) found that the asymptotes of the H-D curves for loblolly pine were different across six sites based on a dummy variable model. The site variables used in the present study are also a general one, and specific variables of site conditions should be included to improve the model accuracy and reveal influencing factors in further studies.
4.3 Provenance effect
The variation of the H-D relationship among provenances was not consistent at four sites, demonstrating that there were interactions between provenances and sites. This genotype by environment interaction of other growth and quality traits was also observed in our previous study (Yin et al., 2019). The differences among provenances were modeled separately for each site to deal with this interaction in the present study. The specific expression of genetic effect was that different asymptotes and similar slopes of the H-D curves were seen among provenances at each sites. This was following the study of Buford (1986) on loblolly pine at the age of 15 years, in which six of the nine sites showed a provenance effect on the asymptotes of the H-D curves, whereas the study of Egbäck et al. (2015) on loblolly pine at the age of 6 years indicated that there were no significant differences among one seed orchard mix and six families for both the asymptote and slope parameters from the Korf function. This inconsistency of genetic variance may be due to the facts that the differences are larger at provenance level than those at family level, and more genetic differences of the H-D relationship are expressed at the age of 15 years than those at the age of 6 years. In the present study, the variance of asymptotes of the H-D relationship among provenances was relatively smaller in Changning site at the age of 10 years compared with that in other sites at the age of 14–15.
4.4 Superior provenance selection
High selective gain is the core purpose of the selective breeding process. In the present study, five excellent provenances were selected on the basis of the lower asymptotes [kj in Equation (17)] of the H-D curves and DBH above mean values at each site. The selection gains of DBH, height, and individual volume ranged from 1.46% to 9.87%, from −1.38% to 5.18%, and from 1.99% to 29.81%, respectively, for four sites in the present study, whereas they were 7.31%, 4.57%, and 14.84% based on growth and quality traits in our previous study (Yin et al., 2019). Although DBH, height, and individual volume varied among the sites, the maximum selection gains of them in the present study were all higher than those in the previous study. The selection gains of DBH, height, and individual volume at Mengla were lower than those at the other three sites. This could be attributed to the trade-off between lower asymptote and biger DBH of provenances at Mengla site, in which the fertile soil and suitable climate formed biger DBH and also higher tree hight and asymptote of provenances.
Although there is a statistical correlation between DBH and H, the disproportional selection of DBH and H will still occur in the selection process. For example, Yin et al. (2019), using biplot analysis for main genotypic effects and G × E interaction to select the superior provenances of B. alnoides, found that the selection gains of DBH (7.31%) were much higher than that of H (4.57%), whereas Wang et al. (2017) observed that the superior clones’ selection gain of H (14.84%) was much higher than that of DBH (3.95%) during selecting superior clones of B. alnoides based on simple index method. When selecting through volume alone in the present study, the selection gain of DBH (6.0%–10.8%) was higher than that of H (5.3%–8.1%) (Supplementary Table 2). These inferred that excellent germplasms with high selection gains in the H-D relationship could not be obtained through disproportional selection of DBH and H.
The selection results of DBH and H can affect the H-D ratio, which is related to the stem quality and stand stability (Coutts, 1986; Sharma et al., 2016; Zhang et al., 2020). Schmidt and Kändler (2009) once found that the individuals of the higher site index had the lower H-D ratios for Norway spruce; and for a given site index, the lower the H-D ratios, the higher the stem quality. Tree pulling experiments conducted by Peltola et al. (2000) also showed that individuals of birch species (Betula spp.) with the lower H-D ratios had the bigger resistive bending moment for stem breakage. Therefore, excellent germplasms with lower H-D ratios have more production value in plantation management. Moreover, H-D ratio is a factor which should be taken into account during selecting excellent germplasms. Because of the disproportional selection of DBH and H, the excellent germplasms usually had a higher H-D ratio than the unselected germplasm in previous studies. Andersson et al. (2007) and Kroon et al. (2008) all observed that the selection for improved growth, based on H, resulted in trees with a higher H-D ratio. Similarly, Sabatia and Burkhart (2013) also found that the average H of the improved loblolly pine clones increased, whereas the average DBH did not, because the H-D relationship was not considered. Therefore, they also pointed out the high necessity of introducing the H-D relationship into the selection methods system of superior germplasm.
In the present study, the H-D ratios of the superior germplasms reduced from 3.07% to 4.72% at four sites based on selection by asymptote parameter (kj) and DBH. While after calculating the selection gains of the H-D ratios in the excellent germplasms of our previous study (Yin et al.2019), we found they were −1.7%, −0.8%, 2.5%, and −0.5% in Mengla, Pingxiang, Hua’an, and Changning, respectively (not published). When using volume for selection alone in the present study (Supplementary Table 2), the modified direction of the H-D ratios was also unstable, which increased at Mengla site with the percentages of 0.84% but reduced from 0.39% to 3.00% at other three sites due to improvement prior to DBH. Their asymptote parameter (kj) was all increased significantly from 37.73% to 1023.22% at four sites. The inconsistency between H-D ratio and asymptote parameter (kj) was attributable to the fact that the H-D ratio is not constant over time and may include scaling effects (Kroon et al., 2008). These also proved the superiority of asymptote parameter (kj) in selecting superior germplasms by the H-D relationship. As a whole, selecting excellent provenances with the lower asymptote parameter (kj) of the H-D curves and above-average DBH was a logical and valid genetic improvement strategy. In addition, further studies should be carried out on linking stem form factor with the H-D relationship to predict volume gains more accurately.
5 Conclusions
The H-D relationship was modeled for 25 provenances of B. alnoides at four sites at the ages of 10–15 years in the present study. On our opinion, it is the fist report on genetic improvement with the H-D relationship involved for hardwood species. Among 10 candidate models, Weibull model was selected as the base model for the H-D relationship because of its best goodness of fit. The further dummy variable NLME models showed that there exist significant site, provenance, and provenance-site effects for the H-D relationship. The asymptotes of the H-D curves were affected by site, and the provenance effect on the H-D relationship varied across sites. Five superior provenances were selected on the basis of asymptote of the H-D curves and DBH at each site, which can be applied in large-sized timber production of B. alnoides. Their selection gains of individual volume ranged from 1.99% to 29.81%, and those of asymptote parameter (kj) and H-D ratio decreased from 7.17% to 486.05% and from 3.07% to 4.72% at four sites, respectively.
Data availability statement
The raw data supporting the conclusions of this article will be made available by the authors, without undue reservation.
Author contributions
MY: investigation, data curation, formal analysis, visualization, and writing—original draft; JG: conceptualization, project administration, investigation, methodology, and writing—review and editing; CW: methodology, formal analysis, and visualization; HW and ZZ: methodology and visualization; HQ: formal analysis and visualization; CT: methodology and formal analysis; JZ: conceptualization, resources, methodology, and writing—review and editing. All authors contributed to the article and approved the submitted version.
Funding
This work was supported by the National Nonprofit Institute Research Grant of Chinese Academy of Forestry, China (CAFYBB2017SY019); Forestry Science and Technology Innovation Project of Guangdong, China (2017KJCX032); and the National Key Research and Development Program of China (2016YFD0600604).
Acknowledgments
We would like to thank the Experimental Center of Tropical Forestry, Chinese Academy of Forestry (ECTF), Baoshan Forest Extension Station (BFES), Mengla County Forestry and Grassland Bureau (MCFGB), and Jinshan State-owned Forest Farm of Hua’an for their permission to establish trial plantations. We would also like to thank Mr. Wenfu Guo in ECTF, Mr. Yanping Yang and Mr. Jiacong Huang in BFES, Mr. Xiancheng Zhu in MCFGB, and Mr. Bihua Chen in Fujian Academy of Forestry Sciences for their assistance in management and growth measurement of the trial plantations.
Conflict of interest
The authors declare that the research was conducted in the absence of any commercial or financial relationships that could be construed as a potential conflict of interest.
The reviewer XZ declared a shared affiliation with the authors MY, CW, HW, HQ, JG, and JZ to the handling editor at the time of review.
Publisher’s note
All claims expressed in this article are solely those of the authors and do not necessarily represent those of their affiliated organizations, or those of the publisher, the editors and the reviewers. Any product that may be evaluated in this article, or claim that may be made by its manufacturer, is not guaranteed or endorsed by the publisher.
Supplementary material
The Supplementary Material for this article can be found online at: https://www.frontiersin.org/articles/10.3389/fpls.2023.1248278/full#supplementary-material
References
Andersson, B., Elfving, B., Persson, T., Ericsson, T., Kroon, J. (2007). Characteristics and development of improved Pinus sylvestris in northern Sweden. Can. J. For. Res. 37, 84–92. doi: 10.1139/x06-224
Bi, H. Q., Fox, J. C., Li, Y., Lei, Y. C., Pang, Y. (2012). Evaluation of nonlinear equations for predicting diameter from tree height. Can. J. For. Res. 42, 789–806. doi: 10.1139/x2012-019
Bošeľa, M., Konôpka, B., Šebeň, V., Vladovič, J., Tobin, B. (2014). Modelling height to diameter ratio-an opportunity to increase Norway spruce stand stability in the Western Carpathians. Lesn. Cas. For. J. 60, 71–80. doi: 10.2478/forj-2014-0007
Bošeľa, M., Máliš, F., Kulla, L., Šebeň, V., Deckmyn, G. (2013). Ecologically based height growth model and derived raster maps of Norway spruce site index in the Western Carpathians. Eur. J. For. Res. 132, 691–705. doi: 10.1007/s10342-013-0708-z
Buford, M. A. (1986). Height-diameter relationships at age 15 in 1oblolly pine seed sources. For. Sci. 32, 812–818.
Buford, M. A., Burkhart, H. E. (1987). Genetic improvement effects on growth and yield of loblolly pine plantations. For. Sci. 33, 707–724.
Carson, S. D., Garcia, O., Hayes, J. D. (1999). Realized gain and prediction of yield with genetically improved Pinus radiata in New Zealand. For. Sci. 45, 186–200. doi: 10.1093/forestscience/45.2.186
Coutts, M. P. (1986). Components of tree stability in Sitka Spruce on peaty gley soil. Forestry 59, 173–197. doi: 10.1093/forestry/59.2.173
Curtis, R. O. (1967). Height-diameter and height-diameter-age equations for second-growth Douglas-fir. For. Sci. 13, 365–375. doi: 10.1515/hfsg.1968.22.6.190
Davisian, M., Giltinan, D. M. (1995). Nonlinear models for repeated measurement data (London, UK: Chapman and Hall), 360.
Ducey, M. J. (2012). Evergreenness and wood density predict height–diameter scaling in trees of the northeastern United States. For. Ecol. Manage. 279, 21–26. doi: 10.1016/j.foreco.2012.04.034
Egbäck, S., Bronson, P. B., Isik, F., Mckeand, S. E. (2015). Height-diameter relationships for different genetic planting stock of loblolly pine at age 6. For. Sci. 61 (3), 424–425. doi: 10.5849/forsci.14-015
Egbäck, S., Karlsson, B., Högberg, K.-A., Nyström, K., Nilsson, U. (2018). Effects of phenotypic selection on height-diameter ratio of Norway spruce and Scots pine in Sweden. Silva. Fenn. 52, 1–15. doi: 10.14214/sf.7738
Fang, Z., Bailey, R. L. (2001). Nonlinear mixed-effect modeling for slash pine dominant height growth following intensive silvicultural treatments. For. Sci. 47, 287–300. doi: 10.1046/j.1439-0329.2001.00240.x
Feldpausch, T. R., Banin, L., Phillips, O. L., Baker, T. R., Lewis, S. L., Quesada, C. A., et al. (2011). Height-diameter allometry of tropical forest trees. Biogeosciences 8, 1081–1106. doi: 10.5194/bg-8-1081-2011
Fu, L. Y., Sun, W., Wang, G. X. (2016). A climate-sensitive aboveground biomass model for three larch species in northeastern and northern China. Trees 31, 557–573. doi: 10.1007/s00468-016-1490-6
Fu, L. Y., Zeng, W. S., Tang, S. Z., Sharma, R. P., Li, H. K. (2012). Using linear mixed model and dummy variable model approaches to construct compatible single-tree biomass equations at different scales – A case study for Masson pine in Southern China. J. For. Sci. 58, 101–115. doi: 10.17221/69/2011-JFS
Gould, P. J., Marshall, D. D. (2010). Incorporation of genetic gain into growth projections of Douglas-fir using ORGANON and the forest vegetation simulator. West. J. Appl. For. 25, 55–61. doi: 10.1093/wjaf/25.2.55
Guo, W. F., Zeng, J., Li, M. (2008). Provenance and family trials for Betula alnoides in Pingxiang Guangxi province I. early variation of growth traits. For. Res. 21, 652–656.
Henriksen, H. A. (1950). Height/diameter curve with logarithmic diameter: brief report on a more reliable method of height determination from height curves, introduced by the State Forest Research Branch. Dansk Skovforeningens Tidsskrift 35, 193–202.
Homeier, J., Breckle, S. W., Günter, S., Rollenbeck, R. T., Leuschner, C. (2010). Tree diversity, forest structure and productivity along altitudinal and topographical gradients in a species-rich Ecuadorian montane rain forest. Biotropica 42, 140–148. doi: 10.1111/j.1744-7429.2009.00547.x
Huang, S., Titus, S. J. (1992). Comparison of nonlinear height-diameter functions for major Alberta tree species. Can. J.For. Res. 22, 1297–1304. doi: 10.1139/x92-172
Hulshof, C. M., Swenson, N. G., Weiser, M. D. (2015). Tree height-diameter allometry across the United States. Ecol. Evol. 5, 1193–1204. doi: 10.1002/ece3.1328
Kempes, C. P., West, G. B., Crowell, K., Girvan, M. (2011). Predicting maximum tree heights and other traits from allometric scaling and resource limitations. PloS One 6, 1–10. doi: 10.1371/journal.pone.0020551
Kroon, J., Andersson, B., Mullin, T. J. (2008). Genetic variation in the diameter–height relationship in Scots pine (Pinus sylvestris). Can. J. For. Res. 38, 1493–1503. doi: 10.1139/X07-233
Lei, X. D., Peng, C. H., Wang, H. Y., Zhou, X. L. (2009). Individual height-diameter models for young black spruce (Picea mariana) and jack pine (Pinus banksiana) plantations in New Brunswick. Canada. Forest. Chron. 85, 43–56. doi: 10.5558/tfc85043-1
Li, X. F., Tang, S. Z., Yuan, G. R., Ban, D. C. (1994). Self-adjusted height-diameter curves and one-entry volume model. For. Res. 7, 512–518.
Liu, M., Feng, Z. K., Zhang, Z. X., Ma, C. H., Zhang, L. (2017). Development and evaluation of height diameter at breast models for native Chinese Metasequoia. PloS One 12, e0182170. doi: 10.1371/journal.pone.0182170
Pearl, R., Reed, L. J. (1920). On the rate of growth of the population of the United States since 1790 and its mathematical representation. Proc. Natl. Acad. Sci. U.S.A. 6, 275–288. doi: 10.1073/pnas.6.6.275
Peltola, H., Kellomäki, S., Hassinen, A., Granander, M. (2000). Mechanical stability of Scots pine, Norway spruce and birch: an analysis of tree-pulling experiments in Finland. For. Ecol. Manage. 135, 143–153. doi: 10.1016/S0378-1127(00)00306-6
Pinheiro, J., Bates, D., DebRoy, S., Sarkar, D., R Core Team (2017) nlme: Linear and nonlinear mixed effects models. R package persion. Available at: https://CRAN.R-project.org/package=nlme (Accessed 6 February, 2017).
Price, C. A., Enquist, B. J., Savage, M. (2007). A general model for allometric covariation in botanical form and function. Proc. Natl. Acad. Sci. U.S.A. 104, 13204–13209. doi: 10.1073/pnas.0702242104
Raj, A. D. A., Malarvili, T., Velavan, S. (2015). Restorative effect of Betula alnoides bark on hepatic metabolism in high fat diet fed Wistar rats. Int. J. Pharma Biosci. 6, 1281–1288.
Richards, F. J. (1959). A flexible growth function for empirical use. J. Exp. Bot. 10, 290–301. doi: 10.1093/jxb/10.2.290
Richter, C. (2015). “Wood characteristics inherent in a tree's natural growth,” in Wood Characteristics (Cham, Switzerland: Springer), 35–124.
Robichaud, E., Methven, I. R. (1991). Tree vigor and height growth in Black Spruce. Trees 5, 158–163. doi: 10.1007/BF00204338
Sabatia, C. O., Burkhart, H. E. (2013). Height and diameter relationships and distributions in loblolly pine stands of enhanced genetic material. For. Sci. 59, 278–289. doi: 10.5849/forsci.11-093
Scaranello, M. A. D. S., Alves, L. F., Vieira, S. A., Camargo, P. B. D., Joly, C. A., Martinelli, L. A. (2012). Height-diameter relationships of tropical Atlantic moist forest trees in southeastern. Brazil. Sci. Agric. 69, 26–37. doi: 10.1590/S0103-90162012000100005
Schmidt, M., Kändler, G. (2009). An analysis of Norway spruce stem quality in Baden-Württemberg: results from the second German national forest inventory. Eur. J. For. Res. 128, 515–529. doi: 10.1007/s10342-009-0301-7
Sharma, R. P., Vacek, Z., Vacek, S. (2016). Modeling individual tree height to diameter ratio for Norway spruce and European beech in Czech Republic. Trees 30, 1969–1982. doi: 10.1007/s00468-016-1425-2
Stage, A. R. (1975). Prediction of height increment for models of forest growth. USDA For. Ser. Res. Paper INT-164. doi: 10.5962/bhl.title.69034
Sur, T. K., Pandit, S., Battacharyya, D., Kumar, C. K. A., Lakshmi, S. M., Chatttopadhyay, D. (2002). Studies on the anti-inflammatory activity of Betula alnoides bark. Phytother. Res. 16, 669–671. doi: 10.1002/ptr.942
Temesgen, H., Zhang, C. H., Zhao, X. H. (2014). Modelling tree height-diameter relationships in multi-species and multi-layered forests: A large observational study from Northeast China. For. Ecol. Manage. 316, 78–89. doi: 10.1016/j.foreco.2013.07.035
Trouvé, R., Bontemps, J. D., Seynave, I., Catherine, C., Lebourgeois, F. (2015). Stand density, tree social status and water stress influence allocation in height and diameter growth of Quercus petraea (Liebl.). Tree Physiol. 35, 1035–1046. doi: 10.1093/treephys/tpv067
Valinger, E., Fridman, J. (2011). Factors affecting the probability of wind throw at stand level as a result of Gudrun winter storm in southern Sweden. For. Ecol. Manage. 262, 398–403. doi: 10.1016/j.foreco.2011.04.004
Vanclay, J. K. (1995). Growth models for tropical forests: A synthesis of models and methods. For. Sci. 41, 7–42. doi: 10.1093/forestscience/41.1.7
Vergara, R., White, T. L., Huber, D. A., Shiver, B. D., Rockwood, D. L. (2004). Estimated realized gains for first-generation slash pine (Pinus elliottii var. elliottii) tree improvement in the southeastern United States. Can. J. For. Res. 34, 2587–2600. doi: 10.1139/x04-136
Vizcaíno-Palomar, N., Ibáñez, I., Benito-Garzón, M., González-Martínez, S. C., Zavala, M. A., Alía, R. (2016). Climate and population origin shape pine tree height-diameter allometry. New Forest. 48, 363–379. doi: 10.1007/s11056-016-9562-4
Wang, M., Borders, B. E., Zhao, D. (2008). An empirical comparison of two subject-specific approaches to dominant heights modeling the dummy variable method and the mixed model method. For. Ecol. Manage. 255, 2659–2669. doi: 10.1016/j.foreco.2008.01.030
Wang, X., Fang, J., Tang, Z., Zhu, B. (2006). Climatic control of primary forest structure and DBH-height allometry in Northeast China. For. Ecol. Manage. 234, 264–274. doi: 10.1016/j.foreco.2006.07.007
Wang, C. S., Hein, S., Zhao, Z. G., Guo, J. J., Zeng, J. (2016). Branch occlusion and discoloration of Betula alnoides, under artificial and natural pruning. For. Ecol. Manage. 375, 200–210. doi: 10.1016/j.foreco.2016.05.027
Wang, H., Zeng, J. X., Luo, B. G., Guo, J. J., Wang, C. S., Zhao, Z. G. (2017). Multiple-trait combined selection of superior Betula alnoides clones in eastern Guangdong. J. Cent. South Univ. For. Tech. 37, 72–75, 84. doi: 10.14067/j.cnki.1673-923x.2017.12.012
Wang, C. S., Zhao, Z. G., Zeng, J., Guo, J. J., Sha, E., Guo, W. F. (2013). Relationship between planting density and tree growth process of Betula alnoides mid-young plantation in Pingxiang’ Guangxi. For. Res. 26, 257–262. doi: 10.13275/j.cnki.lykxyj.2013.02.020
Watt, M. S., Kirschbaum, M. U. F. (2011). Moving beyond simple linear allometric relationships between tree height and diameter. Ecol. Model. 222, 3910–3916. doi: 10.1016/j.ecolmodel.2011.10.011
Weng, Y. H., Kershaw, J., Tosh, K., Adams, G., Fullarton, M. S. (2008). Height-diameter delationships for Jack pine seedlots of different genetic improvement levels. Silvae Genet. 57, 276–282. doi: 10.1515/sg-2008-0042
Wykoff, W. R., Crookston, N. L., Stage, A. R. (1982). User's guide to the stand prognosis model. USDA For. Ser. Gen. Tech. Rep. INT-133. doi: 10.2737/INT-GTR-133
Yang, Y. P., Guo, J. J., Huang, J. C., Zhao, Z. G., Zhou, Z. M., Zeng, J. (2012). Early choose of Betula alnoides provenance and family in western part of Yunnan province. Seed 31, 67–70. doi: 10.16590/j.cnki.1001-4705.2012.01.074
Yang, R. C., Kozak, A., Smith, J. H. G. (1978). The potential of weibull-type functions as a flexible growth curves. Can. J. For. Res. 8, 424–431. doi: 10.1139/x78-062
Yih, L. T., Kershaw, J. A., Nur, H. Z. S., Abd, R. K., Weiskittel, A. R., Potts, M. D. (2017). Evaluating and modelling genus and species variation in height-to-diameter relationships for Tropical Hill Forests in Peninsular Malaysia. Forestry 90, 268–278. doi: 10.1093/forestry/cpw051
Yin, M. Y., Guo, J. J., Wang, C. S., Zhao, Z. G., Zeng, J. (2019). Genetic Parameter Estimates and Genotype×Environment Interactions of Growth and Quality Traits for Betula alnoides Buch-Ham. ex D. Don in Four Provenance-Family Trials in Southern China. Forests 10, 1036. doi: 10.3390/f10111036
Zeng, J., Wang, Z. R., Zhou, S. L., Bai, J. Y., Zheng, H. S. (2003). Allozyme variation and population genetic structure of Betula alnoides from Guangxi, China. Biochem. Genet. 41, 61–75. doi: 10.1023/A:1022027832065
Zeng, J., Zheng, H. S., Weng, Q. J. (1999). Geographic distributions and ecological conditions of Betula alnoides in China. For. Res. 12, 479–484.
Zhang, X. Q., Chhin, S., Fu, L. Y., Lu, L., Duan, A. G., Zhang, J. G. (2019). Climate-sensitive tree height–diameter allometry for Chinese fir in southern China. Forestry 92, 167–176. doi: 10.1093/forestry/cpy043
Zhang, X. Q., Duan, A. G., Zhang, J. G., Xiang, C. W. (2014). Estimating tree height-diameter models with the Bayesian method. Sci. World J. 2014, 683691. doi: 10.1155/2014/683691
Keywords: Betula alnoides, dummy variable model, genetic improvement, height-diameter relationship, stem form
Citation: Yin M, Wang C, Wang H, Han Q, Zhao Z, Tang C, Guo J and Zeng J (2023) Modeling and evaluating site and provenance variation in height–diameter relationships for Betula alnoides Buch.–Ham. ex D. Don in southern China. Front. Plant Sci. 14:1248278. doi: 10.3389/fpls.2023.1248278
Received: 27 June 2023; Accepted: 13 September 2023;
Published: 02 October 2023.
Edited by:
Peter Prislan, Slovenian Forestry Institute, SloveniaReviewed by:
Xiongqing Zhang, Research Institute of Forestry, Chinese Academy of Forestry, ChinaLuka Krajnc, Slovenian Forestry Institute, Slovenia
Copyright © 2023 Yin, Wang, Wang, Han, Zhao, Tang, Guo and Zeng. This is an open-access article distributed under the terms of the Creative Commons Attribution License (CC BY). The use, distribution or reproduction in other forums is permitted, provided the original author(s) and the copyright owner(s) are credited and that the original publication in this journal is cited, in accordance with accepted academic practice. No use, distribution or reproduction is permitted which does not comply with these terms.
*Correspondence: Junjie Guo, Z3VvanVuamllQGNhZi5hYy5jbg==