
94% of researchers rate our articles as excellent or good
Learn more about the work of our research integrity team to safeguard the quality of each article we publish.
Find out more
ORIGINAL RESEARCH article
Front. Plant Sci., 11 October 2023
Sec. Plant Bioinformatics
Volume 14 - 2023 | https://doi.org/10.3389/fpls.2023.1243664
This article is part of the Research TopicOmics-Driven Crop Improvement for Stress Tolerance, volume IIView all 12 articles
 Haibi Li1,2,3†
 Yiyun Gui1,2†Kai Zhu1,2†Jinju Wei1,2Ronghua Zhang1,2
 Rongzhong Yang1,2Liqiu Tang3Hui Zhou1,2*
 Xihui Liu1,2*
Sugarcane (Saccharum spp.) is an important cash crop, and drought is an important factors limiting its yield. To study the drought resistance mechanism of sugarcane, the transcriptomes of two sugarcane varieties with different levels of drought resistance were compared under different water shortage levels. The results showed that the transcriptomes of the two varieties were significantly different. The differentially expressed genes were enriched in starch and sucrose metabolism, linoleic acid metabolism, glycolysis/gluconeogenesis, and glyoxylate and dicarboxylate metabolic pathways. Unique trend genes of the variety with strong drought resistance (F172) were significantly enriched in photosynthesis, mitogen-activated protein kinases signaling pathway, biosynthesis of various plant secondary metabolites, and cyanoamino acid metabolism pathways. Weighted correlation network analysis indicated that the blue4 and plum1 modules correlated with drought conditions, whereas the tan and salmon4 modules correlated with variety. The unique trend genes expressed in F172 and mapped to the blue4 module were enriched in photosynthesis, purine metabolism, starch and sucrose metabolism, beta-alanine metabolism, photosynthesis-antenna proteins, and plant hormone signal transduction pathways. The expression of genes involved in the photosynthesis-antenna protein and photosynthesis pathways decreased in response to water deficit, indicating that reducing photosynthesis might be a means for sugarcane to respond to drought stress. The results of this study provide insights into drought resistance mechanisms in plants, and the related genes and metabolic pathways identified may be helpful for sugarcane breeding in the future.
Drought stress is a major factor limiting global agricultural production, and the development of drought-resistant crop varieties is of great significance in modern agriculture (Ozturk et al., 2021; Conti et al., 2023). The cultivation of drought-resistant crop varieties requires an understanding of the damage inflicted by drought and the mechanisms of crop drought resistance. Drought stress can affect the basic physiological activities of plants, such as enzymatic function, osmotic pressure, and energy supply, and inhibit mitosis and normal cell metabolism (Tardieu et al., 2018). In response, plants have evolved a series of mechanisms to overcome drought stress or drought-stress conditions, such as closing the stomata to reduce water loss from transpiration, regulating osmotic pressure, altering the expression of numerous genes, adjusting photosynthesis, modulating abscisic acid, and pigment levels, and altering sugar metabolism (Agurla et al., 2018; Conti et al., 2023).
Sugarcane (Saccharum spp.) is an economically important crop that can be used as food, feed, and fuel, and has strict water requirements for cultivation (Meena et al., 2020; Dinesh Babu et al., 2022). To adapt to water scarcity, sugarcane has evolved drought resistance mechanisms involving morphological and physiological responses, such as abscisic acid accumulation, ROS scavenging and antioxidant activity, lipid peroxidation and altered expression of certain genes (Ferreira et al., 2017). As the basis of life function, gene expression and its products play a central role in drought resistance of crops. For example, upon exposure to drought stress, dirigent proteins exhibit significant transcriptional responses and improve physiological and biochemical indices (Gentile et al., 2015). Studies have shown that miRNA-mediated post-transcriptional regulation plays an important role in drought resistance in sugarcane, particularly in regulating the production of transcription factors, transporters, senescence-related proteins, and proteins associated with flower development (Ferreira et al., 2017). The ScDREB2B-1 gene cloned from the Saccharum spp. hybrid ROC22 responds to drought stress by regulating the abscisic acid signaling pathway, ROS levels, and stress-related gene expression (Li et al., 2022). In addition, the expression of ShCBSD-PB1-5A and ShCBSD-PB1-7A-1 significantly decreased, whereas that of SsCBSDCBS-5A distinctly increased in ROC22 cells in response to drought stress (Gentile et al., 2013). Most of these studies have focused on one aspect of gene expression; however, to gain a comprehensive understanding of gene expression under water-deficit conditions, it is necessary to focus on the expression of all genes, and the rise of sequencing and transcriptomic technologies provides a technical means to solve this problem.
Since the publication of the whole-genome sequence of Arabidopsis thaliana in December 2000, research on crop plants has undergone significant advances, such as genome sequencing, and decoding of gene expression and function during development, and during the response to various environmental stimuli (Chen et al., 2022). With the development of sequencing and omics technologies, transcriptome analysis has been widely used to study the relationships between various factors and drought resistance in sugarcane, including those among varieties (Meena et al., 2020). A previous study showed that drought conditions can cause changes in the expression of many sugarcane genes. A total of 3,389 genes have been identified in wild sugarcane exposed to drought stress, including 1,772 upregulated and 1,617 downregulated genes (Belesini et al., 2017). Leaf transcriptomic analysis has shown that the expression of genes related to water retention, antioxidant secondary metabolite biosynthesis, oxidation, and osmotic stress responses is higher in the drought-tolerant sugarcane genotype, while the sensitive genotype has a higher number of downregulated genes, which include those involved in photosynthesis, carbon fixation, and the Calvin cycle (Nawae et al., 2020). A similar study showed that the drought-tolerant genotype Co-06022 expressed more genes than the drought-susceptible genotype Co-8021 under different degrees of drought stress. However, more genes are expressed in sensitive genotypes during the recovery period (Selvi et al., 2020). The results of these studies indicated that the relationship between drought resistance and sugarcane varieties is closely related gene expression at the transcriptome level under drought conditions. In addition, different parts of the sugarcane plant respond differently to drought stress. Fewer genes are upregulated and downregulated in the leaves, whereas more genes re upregulated and downregulated in the roots (Taheri et al., 2022). The organ heterogeneity of multiple gene expression is difficult to study using traditional methods and transcriptomic technology has helped to overcome this difficulty. In addition to the aspects mentioned above, the effects of biological factors such as disease, abiotic factors such as nutritional deficiencies, and extreme temperatures on the sugarcane transcriptome have also been studied (Li et al., 2023).
Although the relationships between the genic expression and drought resistance of sugarcane, as well as some cultivar-related studies, have been reported, these studies are insufficient; understanding the mechanism of drought resistance requires further exploration because of the complexity of the sugarcane genome as well as its source, and the development of modern sugarcane varieties (Pereira-Santana et al., 2017; Liu et al., 2018). To gain a more comprehensive understanding of the drought tolerance mechanisms for different sugarcane varieties, differences in transcriptomes of two sugarcane cultivar GT31, with weak drought tolerance, and F172 with strong drought tolerance were investigated in this study. Based on the transcriptome data, we further explored the differences in metabolic pathways and related gene expression between the different varieties under drought stress and confirmed that drought-resistant sugarcane responds to drought stress by regulating metabolic pathways and related gene expression, particularly the photosynthesis pathway. These results enrich our understanding of the molecular mechanisms underlying drought resistance in plants and provide a basis for sugarcane breeding.
In this study, plant materials from two sugarcane Saccharum L. cultivars, F172 and Guitang 31 (GT31), with strong and weak drought tolerance, developed by the Taiwan Sugar Research Institute (Taiwan, China) and Sugarcane Research Institute, Guangxi Academy of Agricultural Sciences (Nanning China), respectively, were used (Yang and Li, 1992; Li et al., 2011).
The sugarcane seedlings were observed and photographed at 4, 5, and 7 d after water withdrawal and were categorized under different drought treatment conditions: mild drought stress (B), moderate drought stress (C), and severe drought stress (D) (Figure 1). Both varieties showed significant changes across the three time points, and cultivar F172 showed stronger drought tolerance than Guitang31 (Figure 1). Sugarcane leaf tissues from cultivars F172 and GT31 were obtained under B, C, and K drought conditions for subsequent transcriptomic sequencing and photosynthetic rate detection. In parallel, leaf tissues from the two cultivars under normal watering conditions were collected at the same time points as controls for subsequent transcriptomic sequencing and detection of the photosynthetic rate, which are abbreviated as BCK (on day 4), CCK (on day 5), and DCK (on day 7).
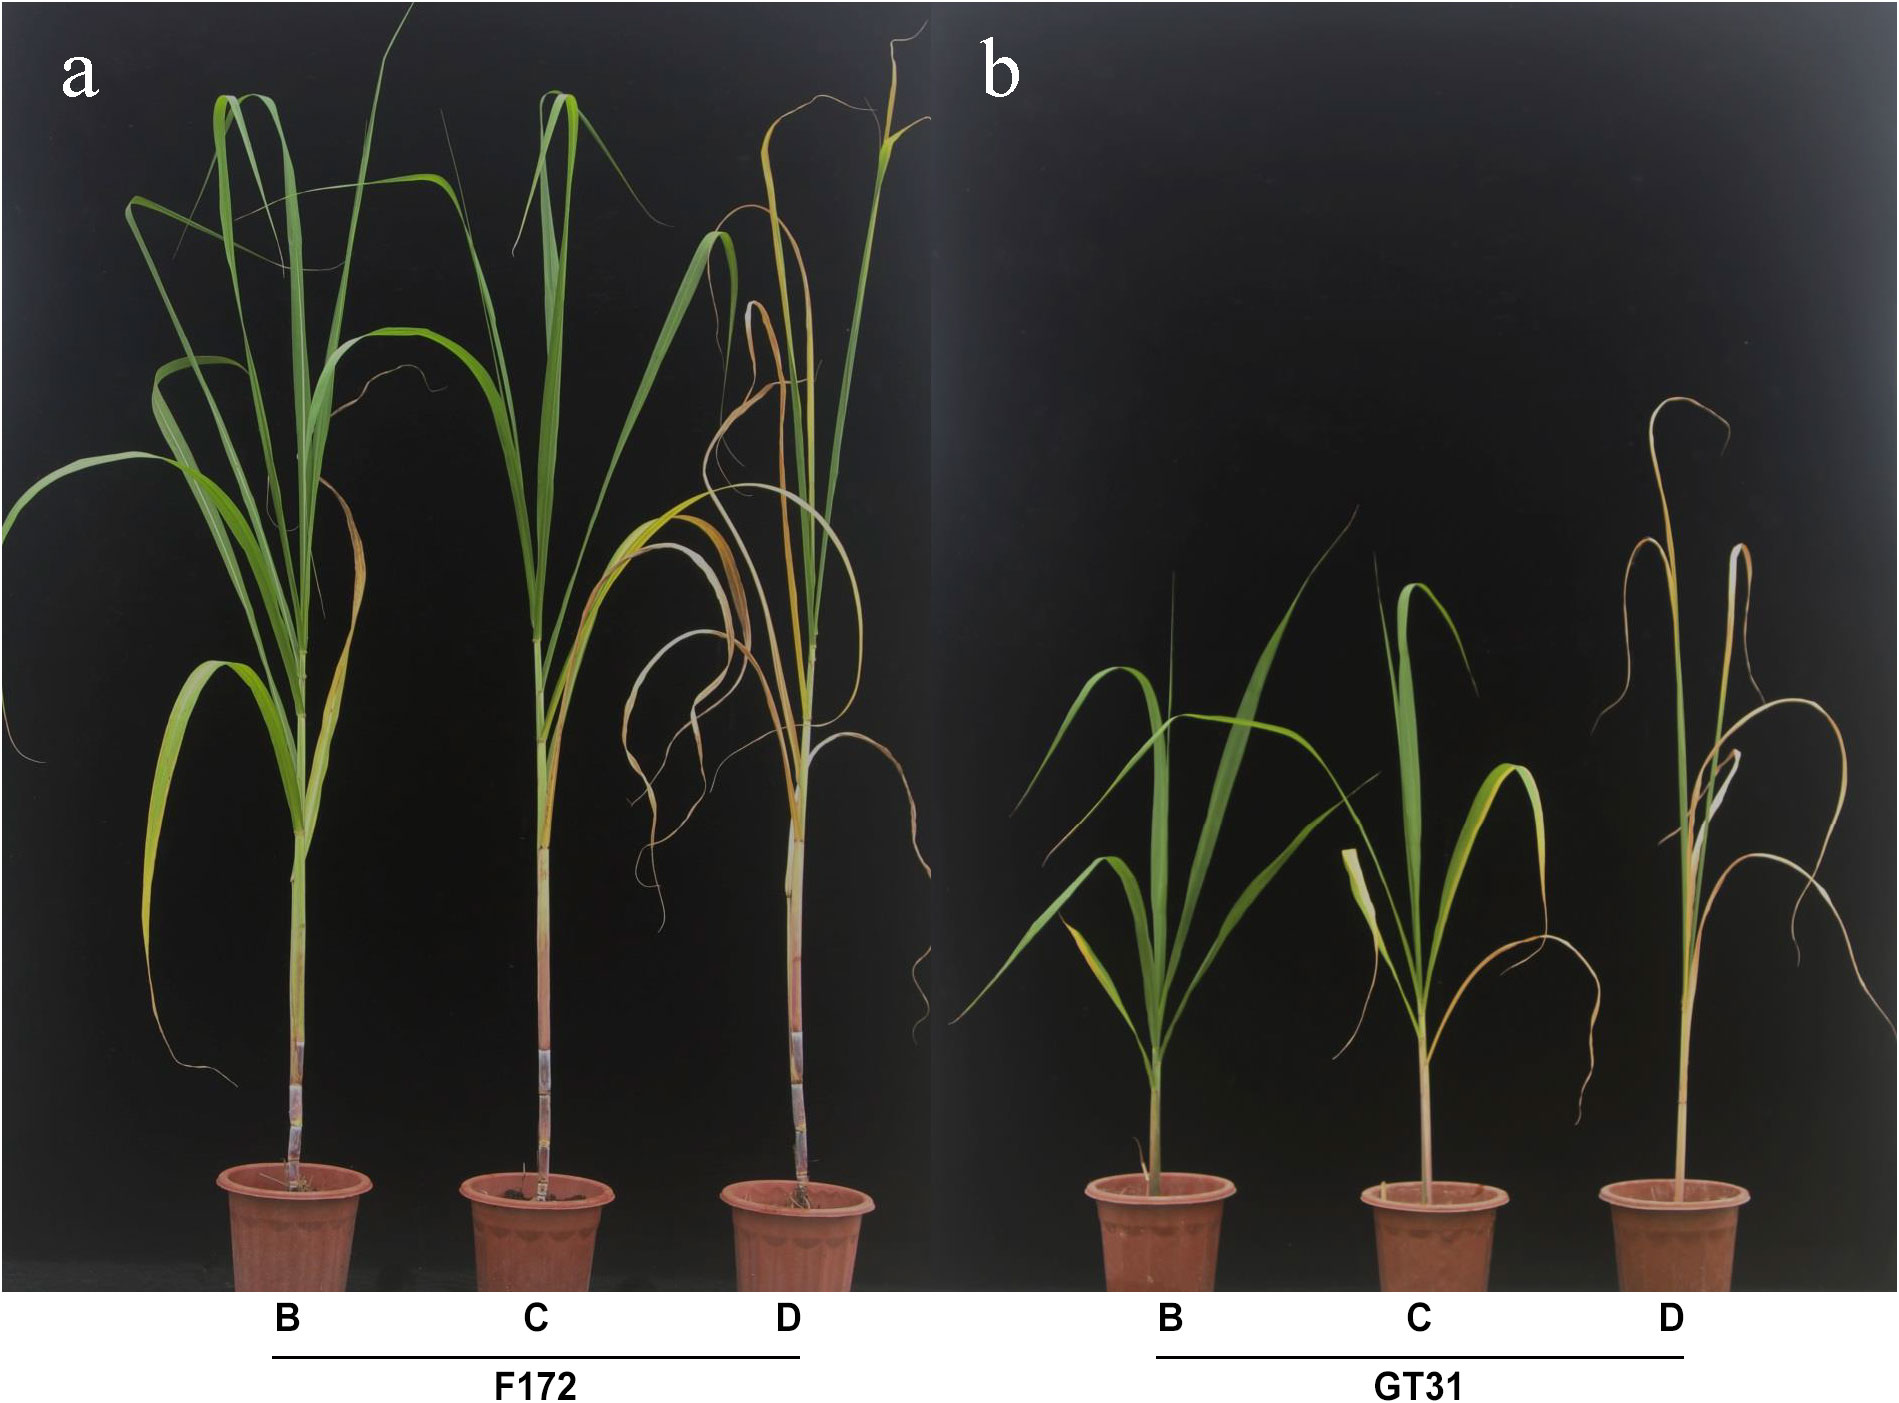
Figure 1 Appearance of two sugarcane varieties in drought tolerance. (A) Appearance of cultivar F172 under mild (left), moderate (middle), and severe (right) drought stress, respectively. (B) Appearance of cultivar GT31 under mild (left), moderate (middle), and severe (right) drought stress, respectively.
The experiment was performed in triplicates for each condition and cultivar. All the leaf samples were flash-frozen with liquid nitrogen and stored at −80°C until further use.
RNA was extracted using the RNeasy Mini Kit (Qiagen, Beijing, China), followed by purification, fragmentation, and quality control using a NanoDrop 2000 (Thermo Scientific) and an Agilent 2100 Bioanalyzer (Agilent Technologies). Strand-specific libraries were obtained using dUTP for second-strand synthesis and subsequently sequenced on a BGISEQ-500 instrument (BGI, Shenzhen, China). The experiments were conducted in triplicates for each cultivar at each time point under drought (B, C, and K) and control (BCK, CCK, and DCK) conditions.
Preprocessing of the paired-end reads was performed using FASTP (v 0.23.1), and mapped to the sugarcane genome (NCBI accession: ASM2245720v1) using HISAT2 (v 2.20) (Kim et al., 2019). Raw read counts were quantified using the featureCounts software (SUBREAD v2.0.0) (Liao et al., 2014). Differential expression analysis was performed using the DESeq2 package (v1.38.3) (Love et al., 2014) for transcriptome comparisons between cultivars under the same conditions (GT31-B-vs-F172-B, GT31-C-vs-F172-C, GT31-D-vs-F172-D, GT31-BCK-vs-F172-BCK, GT31-CCK-vs-F172-CCK, and GT31-DCK-vs-F172-DCK) and between treatments and the corresponding controls for each cultivar (GT31-BCK-vs-GT31-B, F172-BCK-vs-F172-B, GT31-CCK-vs-GT31-C, F172-CCK-vs-F172-C, GT31-DCK-vs-GT31-D, and F172-DCK-vs-F172-D) to identify the differentially expressed genes (DEGs) with an absolute value of log2 FC > 1.0 and false discovery rate < 0.05. KEGG pathway analyses of the identified DEGs were conducted using ClusterProfiler (v4.3.1) (Yu et al., 2012).
Clusters of genes with the same expression profile over different time points were identified using the short time-series expression miner (v1.3.13) (Ernst and Bar-Joseph, 2006) for cultivar F172 under drought stress (F172), cultivar F172 controls (F172CK), cultivar GT31 under drought stress (GT31), and cultivar GT31 controls (GT31CK). The statistical significance of the number of genes for each profile compared to the expected number was computed using a permutation-based test. Unique and common trend genes for significant profile clusters (p < 0.05) from the above-mentioned four groups were selected and KEGG enrichment analysis was performed as described above.
Weighted correlation network analysis (v 1.69) (Langfelder and Horvath, 2008) was used to infer the network modules (parameters: softPower = 20, mergeCutHeight = 0.7, minModuleSize = 30)for 58,873 genes after filtering those with low expression levels (Fragments per kilobase of transcripts per million fragments mapped < 0.5). Module-trait associations were estimated using the correlation between module eigengenes and traits, including cultivars, drought conditions, and the strength of drought stress. Module–trait associations were considered statistically significant at p < 0.05. Trait-related genes with significant correlations were extracted from the module and subjected to KEGG enrichment analysis as described above. Hub genes in the modules were identified using the CytoHubba module in Cytoscape software.
A portable photosynthesissystem (Li-6800, Li-COR Biosciences, Lincoln, NE, USA) was used to observe the net photosynthetic rate for the functional topvisible dewlap leaf (leaf + 1) of sugarcane. as previously described (Verma et al., 2020). The photosynthesis rate was measured with three biological replicates for each cultivar at each time point under both drought treatment and control conditions.
The pheatmap package (v1.0.12) (https://CRAN.R-project.org/package=pheatmap) was used to plot the heatmaps. Differences were calculated using the t-test and were considered statistically significant at p < 0.05. Photosynthetic rate data were statistically analyzed using one-way ANOVA followed by Duncan’s multiple range test.
RNA sequencing generated a total of 379.6 G of raw data for all 36 samples (each in the range of 7.8 G–13.9 G) (Table S1). Approximately 373.8 G clean reads were obtained and passed through quality control; all samples were of high quality (Q20 ≥ 96.68% and Q30 ≥ 91.86%) (Table S1). The mapping rate of clean reads to the sugarcane reference genome ranged from 76.16% to 79.84% (Table S1). Principal component analysis showed low inter-replicate variability, and the samples in each group clustered together (Figure 2A). The principal component analysis clearly distinguished between the water deficit and control conditions, and the cultivars were also well separated (Figure 2A), indicating a large variability between the F172 and GT31 cultivars.
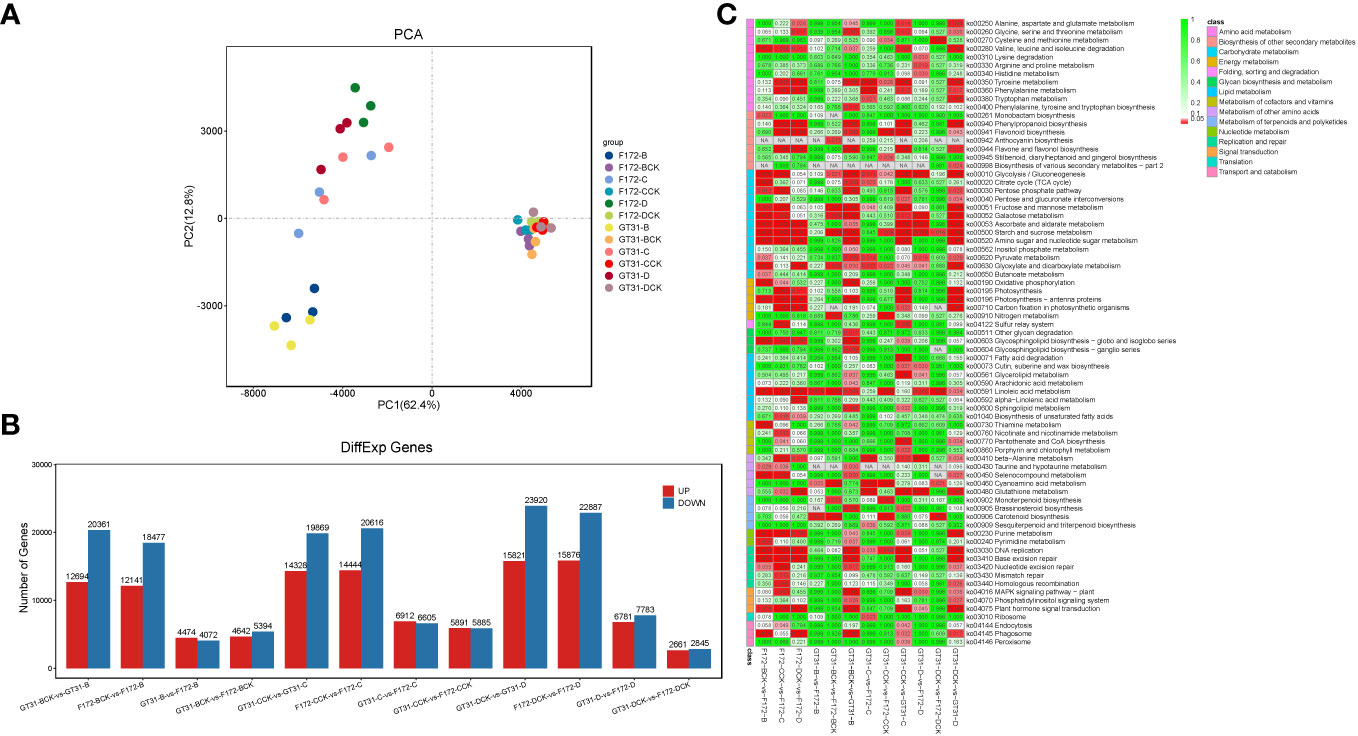
Figure 2 Transcriptome analysis of the sugarcane cultivars. (A) Principal component analysis (PCA) of transcriptome data. (B) Bar plot of the differentially expressed genes (DEGs) between cultivars in the same condition and between treatments and the corresponding controls for each cultivar, respectively. (C) Heatmap of relative enrichment qvalue of each pathway (rows) for each comparison (columns).
Differential gene expression analysis was performed between both cultivars grown under the same conditions, and between those grown under different conditions along with the corresponding controls (Figure 2B; Table S2). A total of 8,546, 10,036, 13,517, 11,776, 14,564, and 5,506 DEGs were identified between the GT31 and F172 cultivars under the same drought conditions, including B, BCK, C, CCK, D, and DCK, respectively (Figure 2B). On comparing intra-cultivar drought treatments and controls, we identified 33,058, 34,197, and 39,741 DEGs from the comparisons of three conditions (B vs. B-vs-BCK, C vs. C-vs-CCK, and D-vs-DCK) for strain GT31, and 30,618, 35,060, and 38,763 DEGs for strain F172, respectively (Figure 2B). In general, the number of DEGs between the intra-cultivar drought treatments and controls was much greater than that between the inter-cultivar differences under the same conditions. These DEGs between cultivars grown under the same conditions were mainly enriched in starch and sucrose metabolism, linoleic acid metabolism, glycolysis/gluconeogenesis, glyoxylate and dicarboxylate metabolism, nitrogen metabolism, carotenoid biosynthesis, and ribosome pathways among others (Figure 2C). Compared with the DEGs between cultivars under normal watering conditions, those under drought conditions enriched in pyruvate metabolism, beta-alanine metabolism, glutathione metabolism specifically under moderate and severe drough stress (Figure 2C). In the comparison groups BCK-vs-GT31-B, CCK-vs-GT31-C, and DCK-vs-GT31-D, we identified 33,058 DEGs (12,697 up and 20,361 down), 34,197 DEGs (14,328 up and 19,869 down), and 39,741 DEGs (15,821 up and 23,920 down) for strain GT31, and 30,618 DEGs (12,141 up and 18,477 down), 35,060 DEGs (14,444 up and 20,616 down), and 38,763 DEGs (15,876 up and 22,887 down) for stain F172, respectively (Figure 2B). The DEGs between cultivars grown under different conditions along with the corresponding controls were mainly enriched in starch and sucrose metabolism, linoleic acid metabolism, glycolysis/gluconeogenesis, glyoxylate and dicarboxylate metabolism, valine, leucine and isoleucine degradation, phenylpropanoid biosynthesis, flavone and flavonol biosynthesis, photosynthesis-antenna proteins, glycosphingolipid biosynthesis (globo- and isoglobo- series), and phagosome pathways among others (Figure 2C). Many DEGs were identified between the drought stress and control groups for the same time points for both cultivars (Figure 2B; Table S2), indicating that drought stress has a significant impact on gene expression.
Time-series expression analysis was performed to examine the dynamic transcriptomic differences in drought tolerance between cultivars. The gene expression patterns for cultivars grown under different conditions and their corresponding controls were analyzed for both cultivars across different drought time points, and the profiles with p < 0.05 in the permutation test were considered as significant (Figure 3). Profiles 0, 1, and 6 were considered to be significant for cultivar F172 in drought stress (Figure 3A; Table S3); profiles 4 and 3 were considered to be significant for cultivar F172 controls (Figure 3B; Table S4); profiles 1, 6, and 0 were considered to be significant for cultivar GT31 under drought stress (Figure 3C; Table S5); and profiles 1 and 6 were considered to be significant for cultivar GT31 controls (Figure 3D; Table S6).
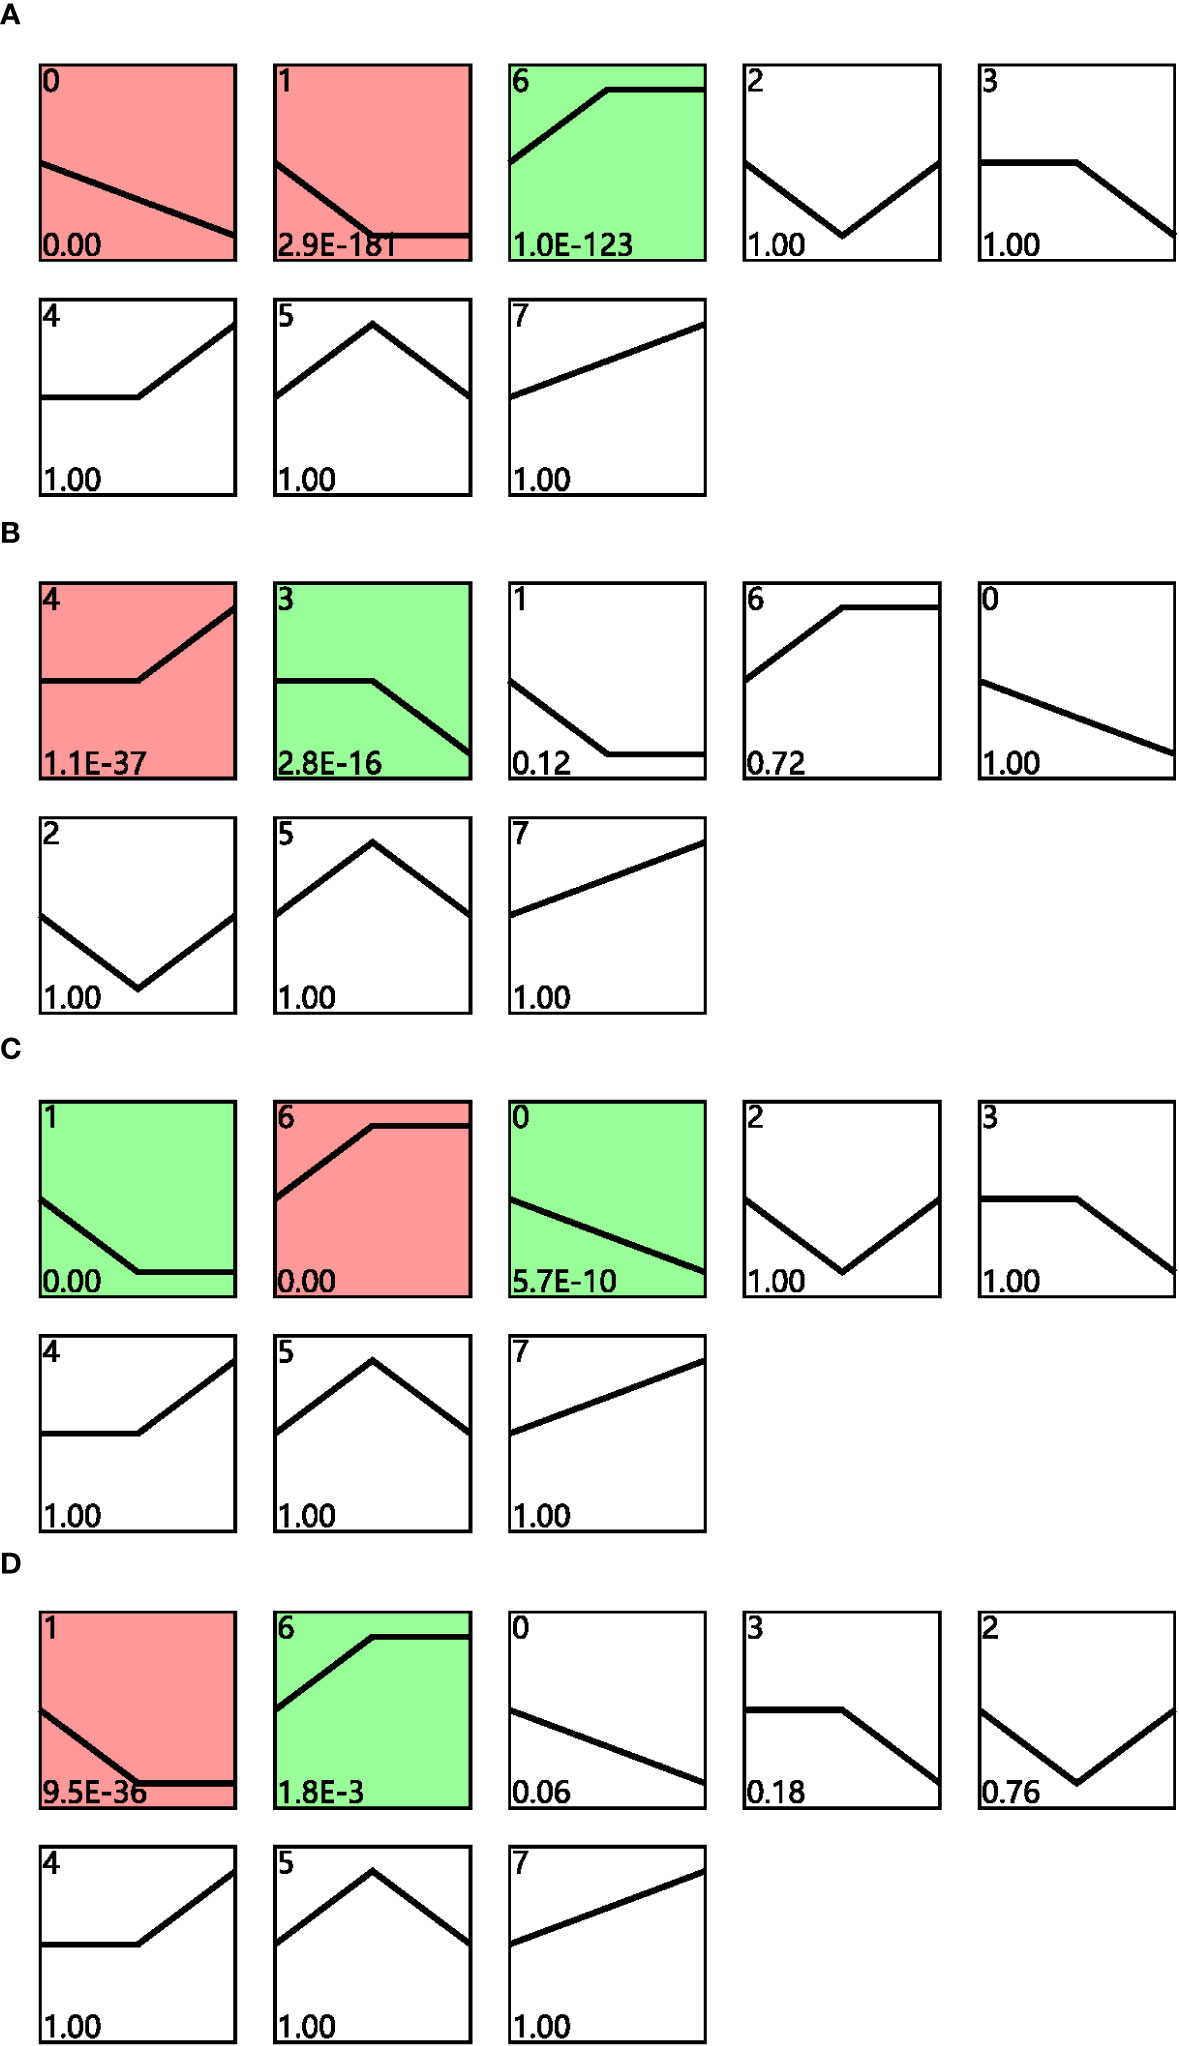
Figure 3 STEM analysis of gene expression profiles. Distinct expression profiles of cultivar F172 in drought stress (A), cultivar F172 controls (B), cultivar GT31 in drought stress (C), and cultivar GT31 controls (D) were identified, respectively. The profiles were ordered by pvalue and those highlighted with colored background were significant profiles.
To identify the trend genes specific to F172 in response to drought stress, an intersection analysis was conducted for the trend genes in different groups, including the cultivar F172 under drought stress (F172), cultivar F172 controls (F172CK), GT31 under drought stress (GT31), and GT31 controls (GT31CK) (Figure 4A). Among them, 5,103 genes exhibited a specific trend in the F172 group that was inconsistent with those in the GT31 and the F172 controls, potentially related to the drought tolerance of F172. The KEGG pathway enrichment results showed that these genes were significantly enriched in photosynthesis, mitogen-activated protein kinases (MAPK) signaling pathway, biosynthesis of various plant secondary metabolites, and cyanoamino acid metabolism pathways (Figure 4B).
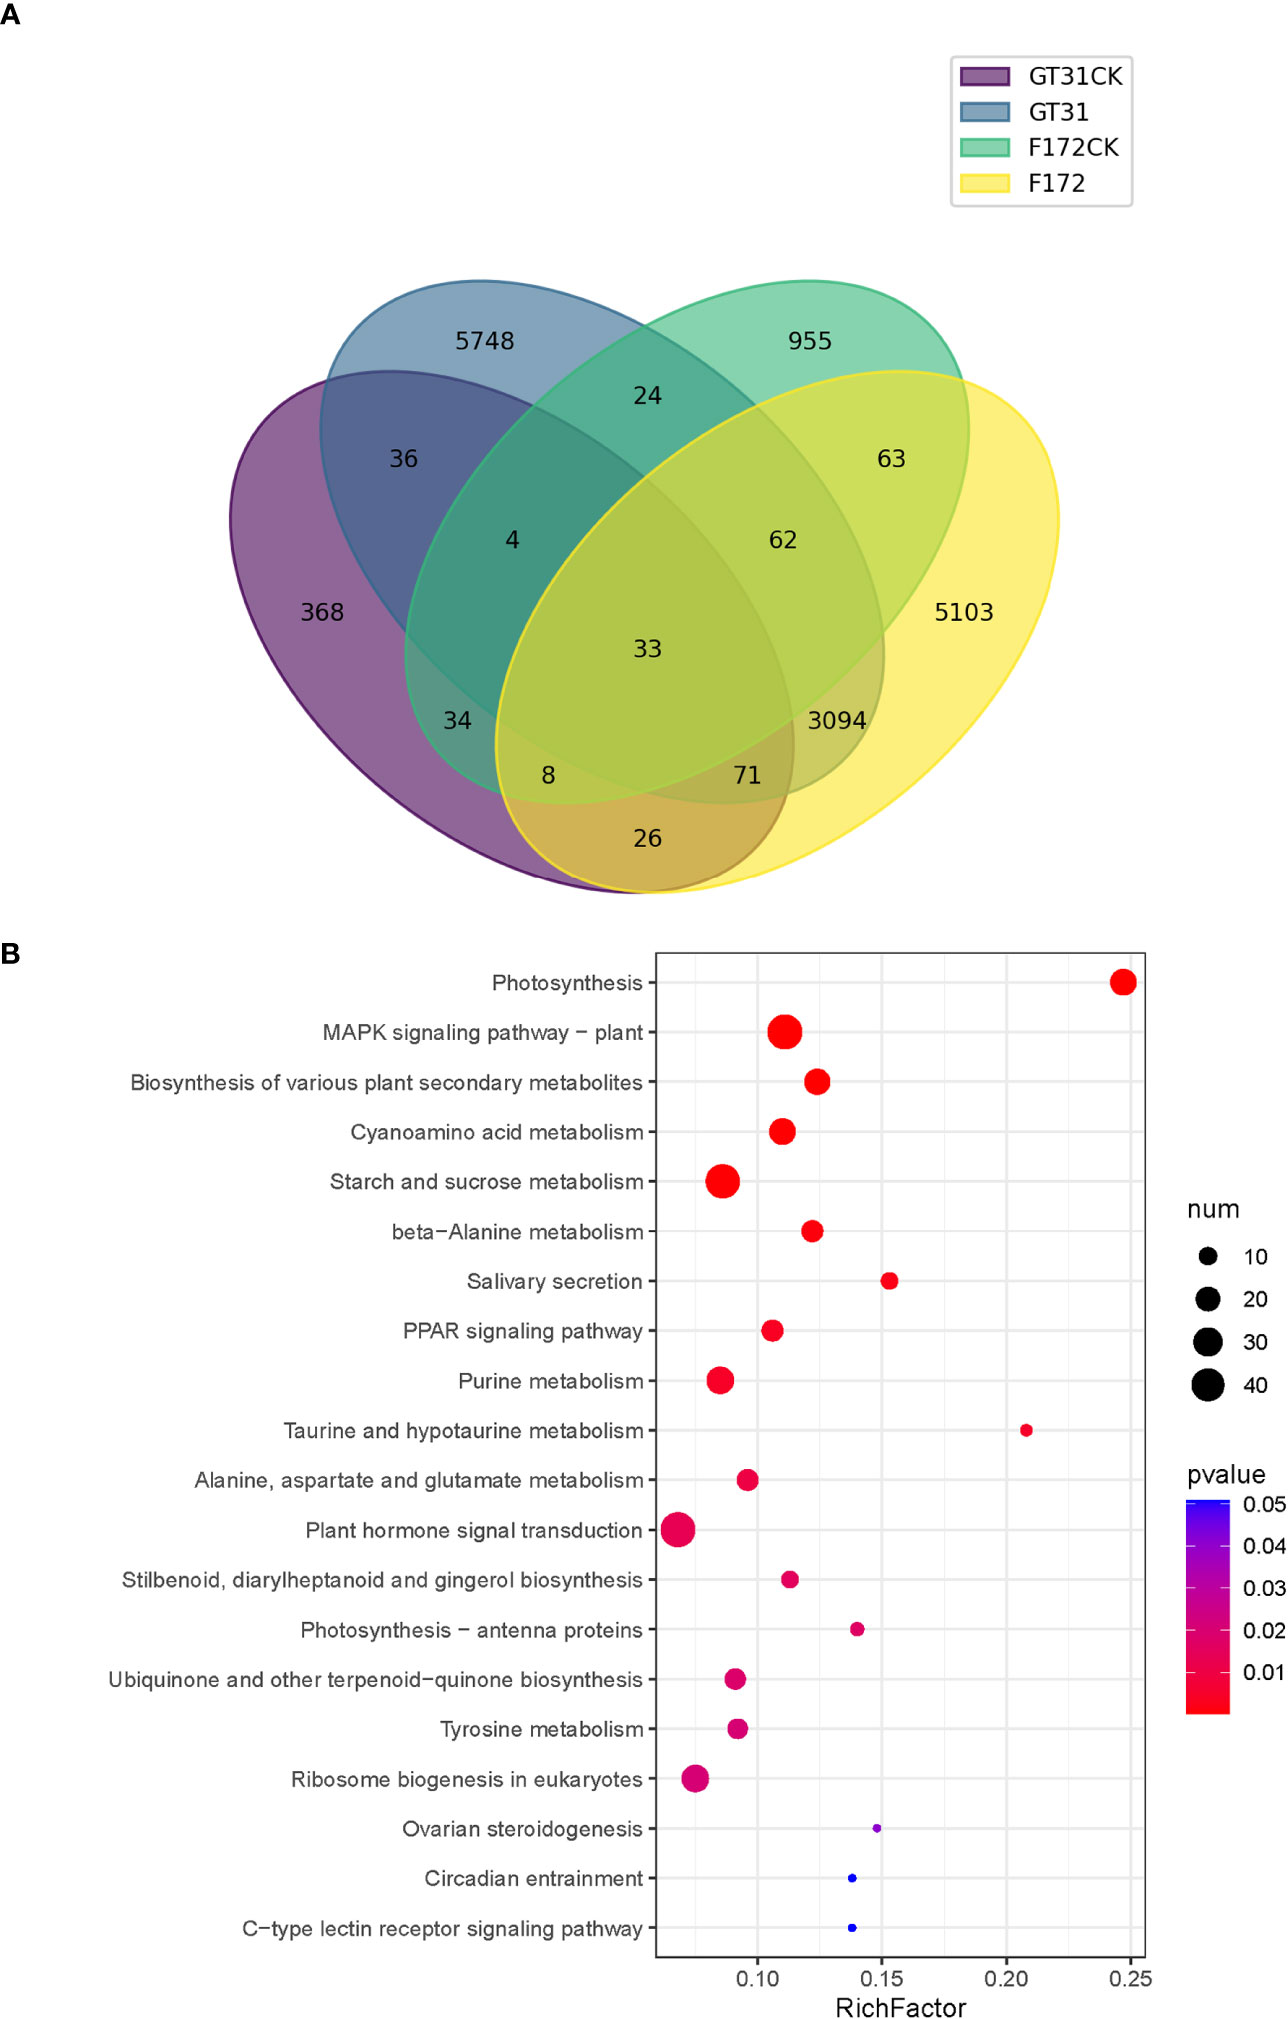
Figure 4 Comparison of trends between F172 and GT31 in different drought stress. (A) identification of unique trend genes in cultivar F172 in drought stress (F172) compared with cultivar F172 controls (F172CK), cultivar GT31 in drought stress (GT31), and cultivar GT31 controls (GT31CK). (B) Significantly enriched KEGG pathways of the unique trend genes in F172.
We employed WGCNA to identify potential co-expression modules and key regulatory networks, and further elucidate their roles in the response of the F172 cultivar to drought stress. WGCNA categorized all genes into 15 modules (Figure 5A). Module-trait relationships were explored to extract significant associations between cultivars, drought conditions, strength of drought stress, and modules (Figure 5B). The blue4 and plum1 modules showed significant negative (–0.86, p < 0.01) and positive (0.96, p < 0.01) correlations, respectively, with drought conditions, (Figure 5B). The tan and salmon4 modules showed significant negative (-0.93, p < 0.01) and positive (0.8, p < 0.01) correlations, respectively, with the cultivars (Figure 5B).
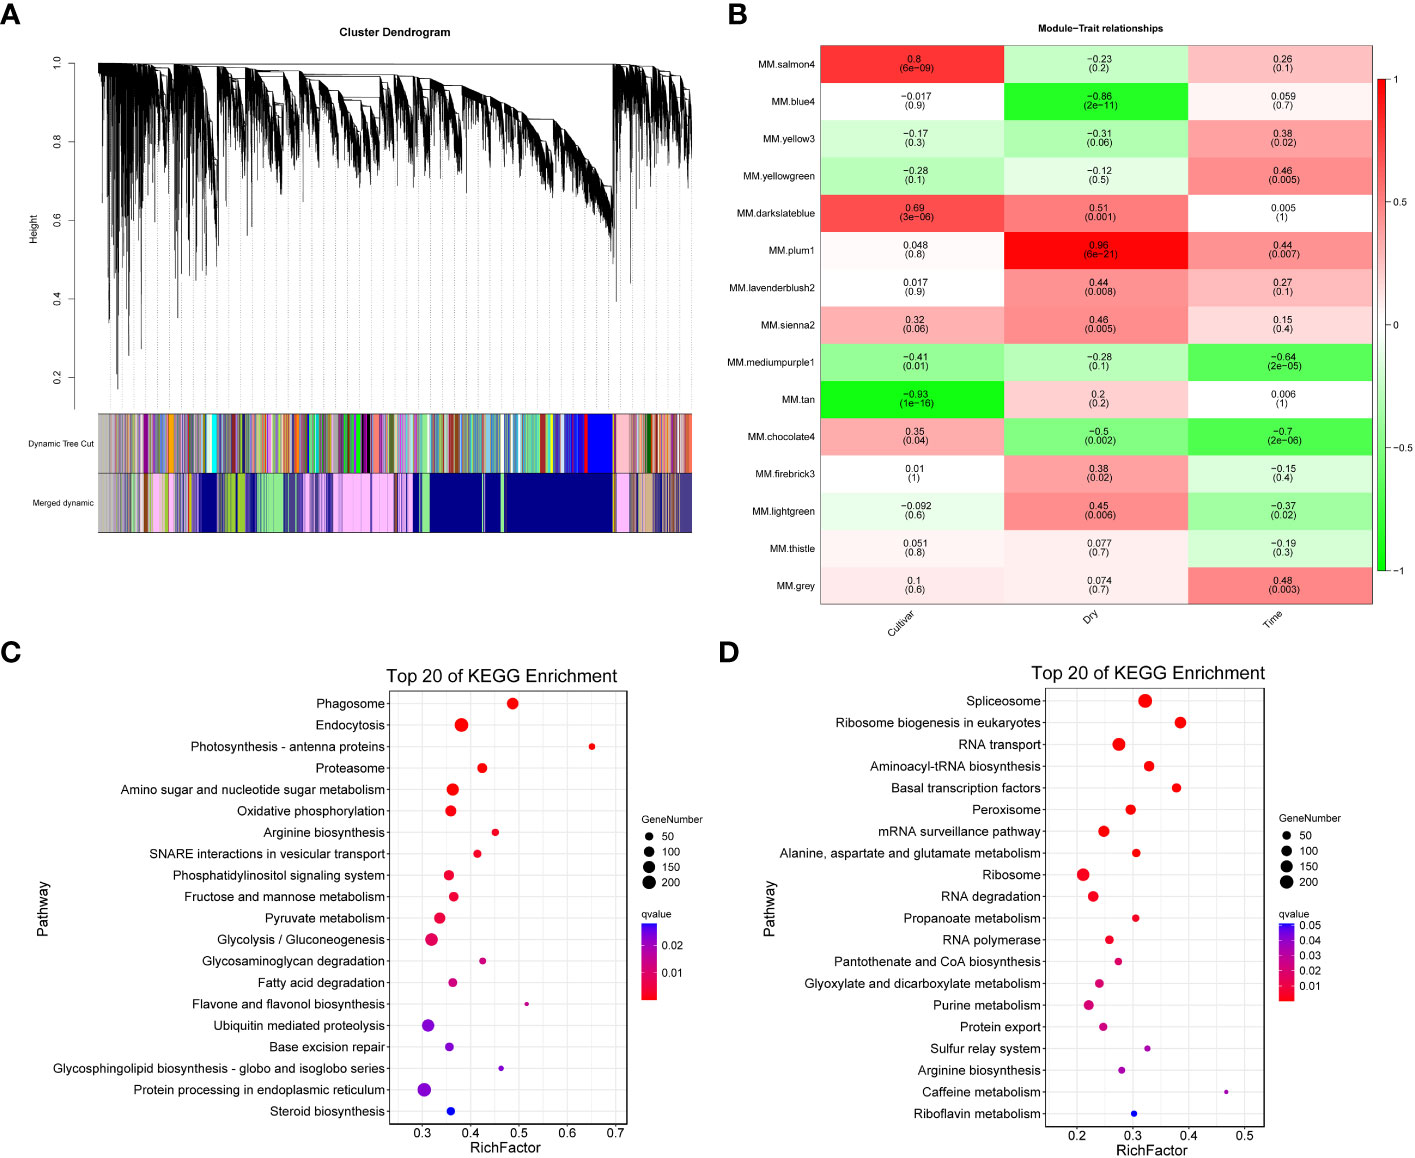
Figure 5 Weighted Gene Co-expression Network Analysis (WGCNA). (A) WGCNA module detection. (B) Heatmap of module - trait correlation, displaying the correlation values for each module (rows) and each trait (columns). (C) Significantly enriched KEGG pathways of the genes in blue4 module. (D) Significantly enriched KEGG pathways of the genes in plum1 module.
All unique trend genes (Figure 4A) were mapped to weighted correlation network analysis modules (Table S7). Among the unique trend genes identified in F172 compared to GT31 and controls, most were in the blue4 (1,301) and plum1 (983) modules (Table S7); these were then used for KEGG enrichment analysis. Genes in the blue4 module were mainly enriched in phagosome, endocytosis, photosynthesis-antenna proteins, amino sugar and nucleotide sugar metabolism, and oxidative phosphorylation, among others (Figure 5C; Table S8). Those genes in the plum1 module were mainly enriched in spliceosome, RNA transport, aminoacyl-tRNA biosynthesis, basal transcription factors, peroxisome, and alanine, aspartate, and glutamate metabolism, among others (Figure 5D). Several enriched pathways, including those of photosynthesis, purine metabolism, starch and sucrose metabolism, beta-alanine metabolism, photosynthesis-antenna proteins, and plant hormone signal transduction, were shared between those genes in the blue4 module and the unique trend genes in F172 (Figure 5C; Table S8). The hub genes identified in the blue4 module included ARF14 (auxin response factor 14) and Os10g0147400 (similar to auxin influx carrier protein), which are associated with the plant hormone signal transduction pathway, and Os02g0733300 (glycoside hydrolase gene), which is associated with the starch and sucrose metabolism pathway (Table S9). The hub genes of plum1 module included the spliceosome-related genes RS31 (serine/arginine-rich splicing factor RS31) and CLPC1 (chaperone protein ClpC1, chloroplastic), and peroxisome-related genes PEX1 (peroxisomal biogenesis factor 1) and PEX2 (peroxisomal biogenesis factor 2) (Table S10).
Photosynthesis is closely associated with drought stress in plants (Figure 6). In the photosynthesis-antenna protein pathway for F172, the expression levels of Lhca1 (light-harvesting complex I chlorophyll a/b binding protein 1) and Lhca4 (light-harvesting complex I chlorophyll a/b binding protein 4) were high at stage 1 and significantly decreased at later stages, exhibiting a distinct downward trend (Figure 6). Further, PsbO (photosystem II oxygen-evolving enhancer protein 1), PsbP (photosystem II oxygen-evolving enhancer protein 2), PsbQ (photosystem II oxygen-evolving enhancer protein 3), PsbW (photosystem II PsbW protein), PsbY (photosystem II PsbY protein), Psb27 (photosystem II Psb27 protein), PsaD (photosystem I subunit II), PsaE (photosystem I subunit IV), PsaF (photosystem I subunit III), PsaH (photosystem I subunit VI), PsaL (photosystem I subunit XI), PsaN (photosystem I subunit PsaN), PetF (ferredoxin), and petH (ferredoxin–NADP+ reductase), which participate the photosynthesis pathway, also showed a similar expression pattern for F172 (Figure 6).
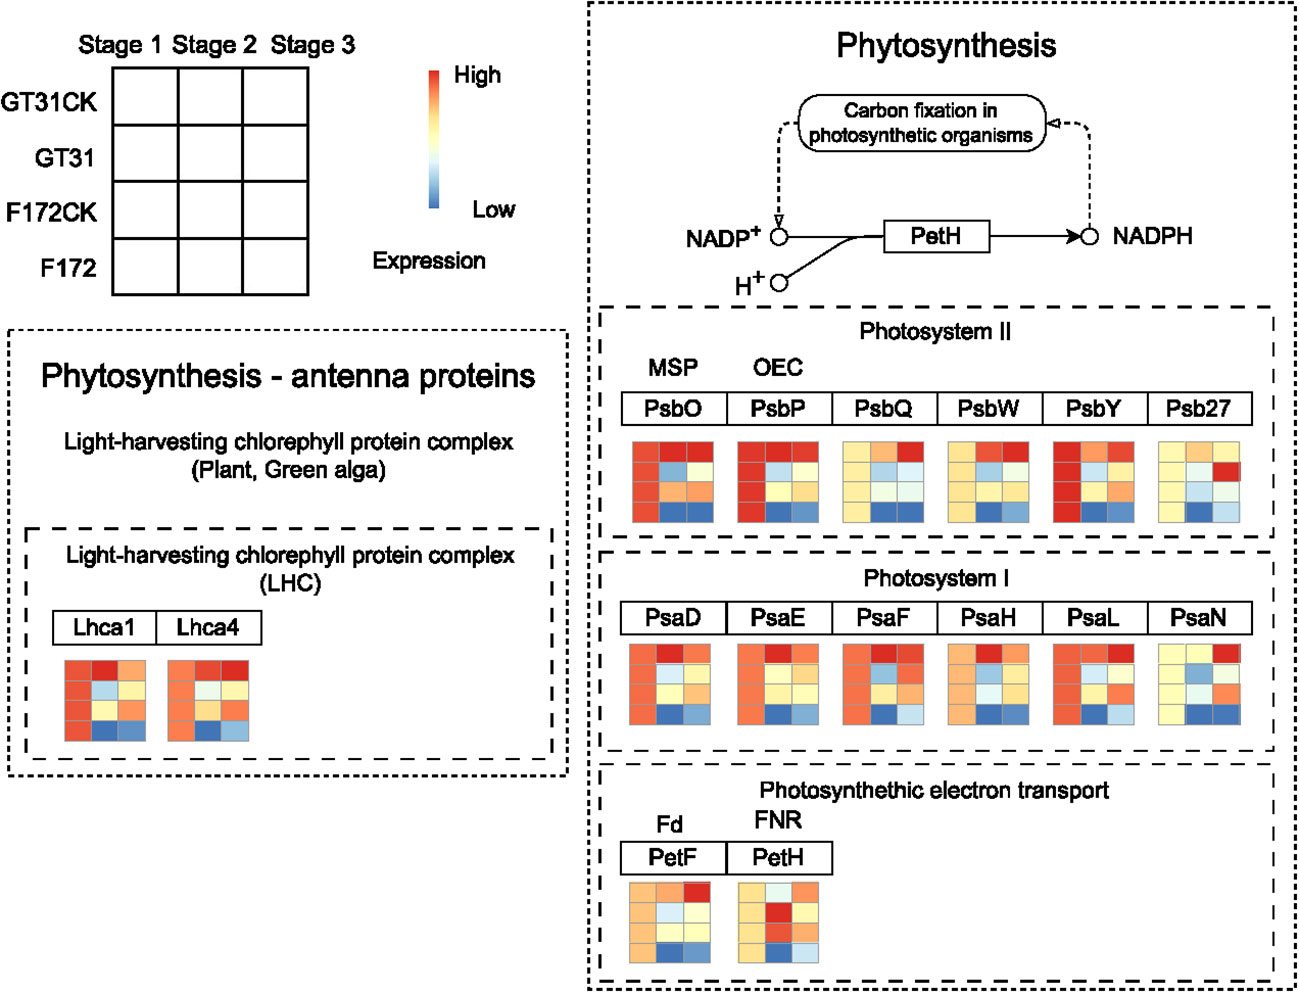
Figure 6 The expression pattern of genes in blue4 module which involved in Phytosynthesis - antenna proteins and Phytosynthesis pathways for cultivar F172 in drought stress (F172), cultivar F172 controls (F172CK), cultivar GT31 in drought stress (GT31), and cultivar GT31 controls (GT31CK), respectively.
The photosynthetic rates for two cultivars F172 and GT31 were significantly down-regulated under drought conditions. However, this decrease was more pronounced for the F172 variety, which was consistent with the declining trend observed in the expression of genes related to the photosynthetic pathway as described above (Figure 7). These results indicate that drought stress resulted in a significantly greater reduction in photosynthesis for cultivar F172, which is associated with stronger drought resistance.
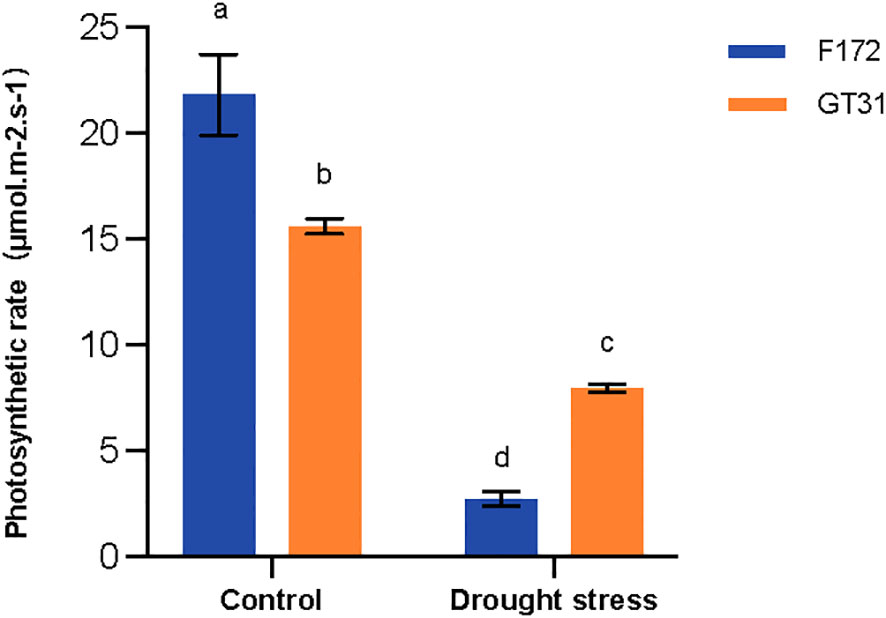
Figure 7 Photosynthetic rate of cultivars F172 and GT31 in drought stress and the corresponding controls. Different letters indicate significant differences (Duncan’s test at P < 0.05).
Sugarcane is an important commercial crop of global significance, more than 80% of the world’s sugar production is derived from sugarcane, which is grown in more than 90 nations (Barnabas et al., 2015). Drought limits sugarcane production (Liu et al., 2021), and different sugarcane cultivars react differently to drought stress (da Silva et al., 2017). In this study, principal component analysis could discriminate between two different sugarcane cultivars under water deficit conditions, but not when the moisture level was normal (Figure 2A). Drought can also alter plant gene expression (Takahashi et al., 2018; Bashir et al., 2019). In this study, based on the DEGs between F172 and GT31 under drought stress, the results of the KEGG pathway analysis showed that starch and sucrose metabolism, and glycolysis/gluconeogenesis were extensively enriched for all comparisons (Figures 2B, C). Changes in these two metabolic pathways may be some of the most common responses to drought because these pathways are also significantly enriched for the IACSP97-7065, IACSP94-2094, and ROC22 sugarcane varieties under drought stress (Contiliani et al., 2022; Yang et al., 2022).
Many other physiological and metabolic processes in plants are involved in the drought stress response; Takahashi et al. (2018) reported that drought inhibits photosynthesis; further, MAPK cascades modulate plant tolerance to drought (Bashir et al., 2019). Drought can also affect the levels of secondary plant metabolites such as calcium, anthocyanins, flavonoids, phenolic acids, chlorophyll and saponins (Yu et al., 2020; Contiliani et al., 2022; Yang et al., 2022). Wan et al. (2021) found that changes in the cyanoamino acid metabolism pathway might be a key factor causing the difference in drought resistance between two cherry rootstocks. In this study, based on the unique trend of genes in F172 compared to that of GT31 and the controls, the results of the KEGG pathway analysis indicated that photosynthesis, MAPK signaling pathway, biosynthesis of various plant secondary metabolites, and cyanoamino acid metabolism pathways were significantly enriched in F172. In addition to these pathways, other enriched metabolic pathways, such as cyanoamino acid, starch, sucrose, urine, and ribosome biogenesis in eukaryotes (Figure 4B), have rarely been associated with drought tolerance in plants. The role of genes exhibiting specific trends in these pathways in the F172 group deserves further investigation.
Weighted correlation network analysis has been an important method used in previous studies on plant drought resistance (Yu et al., 2020; Cao et al., 2021). In Arabidopsis thaliana, both blue and salmon modules responded to drought (Sharma et al., 2018). Moreover, the blue module cprresponded to drought resistance traits in sunflower and Tartary buckwheat (Meng et al., 2022; Wu et al., 2022). In this study, the results of the weighted correlation network analysis demonstrated that the blue4 module was significantly negatively correlated with drought conditions, and the salmon4 module was significantly positively correlated with the cultivars (Figure 5B). In addition to the aforementioned metabolic pathways, several other pathways are involved in plant drought resistance, such as the plant hormone signal transduction pathways (Verma et al., 2016). The purine and phenylpropanoid metabolism pathways in Dendrobium sinense and Arabidopsis are also involved in the drought stress response (Watanabe et al., 2010; Zhang et al., 2021). Metabolome analysis showed that drought stress resulted in an increase in β-alanine in tomato fruit (Asakura et al., 2021). In addition, transcriptome analysis suggested that the photosynthesis-antenna protein pathway in Shanlan upland rice and peanuts is involved in the drought stress response (Ren et al., 2021; Zhou et al., 2022). In this study, KEGG pathway analysis showed that genes with unique trends in the blue module were enriched in photosynthesis, purine metabolism, starch and sucrose metabolism, alanine metabolism, photosynthesis-antenna proteins, and plant hormone signal transduction pathways (Figure 5C).
The most prominent effects of drought on crops are related to the germination and photosynthesis processes (Flexas et al., 2004; Nadeem et al., 2019). In the present study, both the photosynthesis-antenna protein and photosynthesis pathways were enriched for the drought-resistant variety, F172, under drought stress (Figures 4B, 5C). The proteins involved in the two pathways increased at normal moisture levels, but decreased under water-deficit conditions (Figure 6). These results indicated that under water-deficit conditions, drought-resistant sugarcane varieties might mitigate the effects of drought by adjusting the photosynthesis process. Reduced photosynthesis can save plenty of water for the plant itself, which may be the basis of drought resistance oin the F172 variety of sugarcane (Figure 7).
In the present study, we used comparative temporal analysis to unveil the differences in gene expression trends during drought stress between two sugarcane cultivars with differing drought tolerance levels. By performing WGCNA, we found that the two cultivars showed different trends in genes related to photosynthesis, MAPK signaling, biosynthesis of various plant secondary metabolites, and cyanoamino acid metabolism pathways in response to drought stress. The most notable change in this process was the reduction in expression of genes related to photosynthesis; the corresponding decrease in photosynthesis may be an important strategy adopted by plants to cope with drought. The bioinformatic analysis strategies used in this study may also be valuable for uncovering key factors related to important traits by comparing different cultivars.
The original contributions presented in the study are publicly available. This data can be found here: https://www.ncbi.nlm.nih.gov/bioproject/PRJNA975299.
HL, RY and RZ: conceptualization. HL, XL and HZ: validation. KZ and JW: data curation. RZ, YG and HL: writing original draft preparation. LT, HZ and XL. writing review and editing. All authors contributed to the article and approved the submitted version.
This work was supported by the Foundation of Guangxi Province of China (No. GKZY20198005, 2020GXNSFAA297132), the National Natural Science Foundation of China (No. 32160486), the National Modern Agricultural Industry Technology System Construction Special Project (No. CARS-170105), and Guangxi Innovation Team Building Project of National Modern Agricultural Industrial Technology System of China(No. nycytxgxcxtd-2021-03-04).
The authors declare that the research was conducted in the absence of any commercial or financial relationships that could be construed as a potential conflict of interest.
The reviewer YQ declared a past co-authorship with the author XL to the handling editor at the time of review.
All claims expressed in this article are solely those of the authors and do not necessarily represent those of their affiliated organizations, or those of the publisher, the editors and the reviewers. Any product that may be evaluated in this article, or claim that may be made by its manufacturer, is not guaranteed or endorsed by the publisher.
The Supplementary Material for this article can be found online at: https://www.frontiersin.org/articles/10.3389/fpls.2023.1243664/full#supplementary-material
Agurla, S., Gahir, S., Munemasa, S., Murata, Y., Raghavendra, A. S. (2018). Mechanism of stomatal closure in plants exposed to drought and cold stress. Adv. Exp. Med. Biol. 1081, 215–232. doi: 10.1007/978-981-13-1244-1_12
Asakura, H., Yamakawa, T., Tamura, T., Ueda, R., Taira, S., Saito, Y., et al. (2021). Transcriptomic and Metabolomic Analyses Provide Insights into the Upregulation of Fatty Acid and Phospholipid Metabolism in Tomato Fruit under Drought Stress. J. Agric. Food Chem. 69, 2894–2905. doi: 10.1021/acs.jafc.0c06168
Barnabas, L., Ramadass, A., Amalraj, R. S., Palaniyandi, M., Rasappa, V. (2015). Sugarcane proteomics: An update on current status, challenges, and future prospects. Proteomics 15, 1658–1670. doi: 10.1002/pmic.201400463
Bashir, K., Matsui, A., Rasheed, S., Seki, M. (2019). Recent advances in the characterization of plant transcriptomes in response to drought, salinity, heat, and cold stress. F1000Res 8, 658. doi: 10.12688/f1000research.18424.1
Belesini, A. A., Carvalho, F. M. S., Telles, B. R., de Castro, G. M., Giachetto, P. F., Vantini, J. S., et al. (2017). De novo transcriptome assembly of sugarcane leaves submitted to prolonged water-deficit stress. Genet. Mol. Res. 16, gmr16028845. doi: 10.4238/gmr16028845
Cao, L., Lu, X., Wang, G., Zhang, P., Fu, J., Wang, Z., et al. (2021). Transcriptional regulatory networks in response to drought stress and rewatering in maize (Zea mays L.). Mol. Genet. Genomics 296, 1203–1219. doi: 10.1007/s00438-021-01820-y
Chen, Y., Li, Z., Sun, T., Wang, D., Wang, Z., Zhang, C., et al. (2022). Sugarcane scDREB2B-1 confers drought stress tolerance in transgenic nicotiana benthamiana by regulating the ABA signal, ROS level and stress-related gene expression. Int. J. Mol. Sci. 23, 9557. doi: 10.3390/ijms23179557
Conti, V., Parrotta, L., Romi, M., Del Duca, S., Cai, G. (2023). Tomato biodiversity and drought tolerance: A multilevel review. Int. J. Mol. Sci. 24, 10044. doi: 10.3390/ijms241210044
Contiliani, D. F., de Oliveira Nebó, J. F. C., Ribeiro, R. V., Andrade, L. M., Peixoto Júnior, R. F., Lembke, C. G., et al. (2022). Leaf transcriptome profiling of contrasting sugarcane genotypes for drought tolerance under field conditions. Sci. Rep. 12, 9153. doi: 10.1038/s41598-022-13158-5
da Silva, M. D., de Oliveira Silva, R. L., Ferreira Neto, J. R. C., Benko-Iseppon, A. M., Kido, E. A. (2017). Genotype-dependent regulation of drought-responsive genes in tolerant and sensitive sugarcane cultivars. Gene 633, 17–27. doi: 10.1016/j.gene.2017.08.022
Dinesh Babu, K. S., Janakiraman, V., Palaniswamy, H., Kasirajan, L., Gomathi, R., Ramkumar, T. R. (2022). A short review on sugarcane: its domestication, molecular manipulations and future perspectives. Genet. Resour. Crop Evol. 69, 2623–2643. doi: 10.1007/s10722-022-01430-6
Ernst, J., Bar-Joseph, Z. (2006). STEM: a tool for the analysis of short time series gene expression data. BMC Bioinf. 7, 191. doi: 10.1186/1471-2105-7-191
Ferreira, T. H. S., Tsunada, M. S., Bassi, D., Araújo, P., Mattiello, L., Guidelli, G. V., et al. (2017). Sugarcane water stress tolerance mechanisms and its implications on developing biotechnology solutions. Front. Plant Sci. 8. doi: 10.3389/fpls.2017.01077
Flexas, J., Bota, J., Loreto, F., Cornic, G., Sharkey, T. D. (2004). Diffusive and metabolic limitations to photosynthesis under drought and salinity in C(3) plants. Plant Biol. (Stuttg). 6, 269–279. doi: 10.1055/s-2004-820867
Gentile, A., Dias, L. I., Mattos, R. S., Ferreira, T. H., Menossi, M. (2015). MicroRNAs and drought responses in sugarcane. Front. Plant Sci. 6. doi: 10.3389/fpls.2015.00058
Gentile, A., Ferreira, T. H., Mattos, R. S., Dias, L. I., Hoshino, A. A., Carneiro, M. S., et al. (2013). Effects of drought on the microtranscriptome of field-grown sugarcane plants. Planta 237, 783–798. doi: 10.1007/s00425-012-1795-7
Kim, D., Paggi, J. M., Park, C., Bennett, C., Salzberg, S. L. (2019). Graph-based genome alignment and. genotyping with HISAT2 and HISAT-genotype. Nat. Biotechnol. 37, 907–915. doi: 10.1038/s41587-019-0201-4
Langfelder, P., Horvath, S. (2008). WGCNA: an R package for weighted correlation network analysis. BMC Bioinf. 9, 559. doi: 10.1186/1471-2105-9-559
Li, A. M., Liao, F., Wang, M., Chen, Z. L., Qin, C. X., Huang, R. Q., et al. (2023). Transcriptomic and proteomic landscape of sugarcane response to biotic and abiotic stressors. Int. J. Mol. Sci. 24, 8913. doi: 10.3390/ijms24108913
Li, X., Liu, Z., Zhao, H., Deng, X., Su, Y., Li, R., et al. (2022). Overexpression of sugarcane scDIR genes enhances drought tolerance in nicotiana benthamiana. Int. J. Mol. Sci. 23, 5340. doi: 10.3390/ijms23105340
Li, H. G., Tan, Y. M., Tan, F., Wang, L. W., Yang, R. Z., Liu, X. J. (2011). Breeding of new sugarcane variety guitang 31 with high productivity and sugar content and ratoon ability. Seed 30 (08), 116–118. doi: 10.16590/j.cnki.1001-4705.2011.08.061
Liao, Y., Smyth, G. K., Shi, W. (2014). featureCounts: An efficient general purpose program for assigning sequence reads to genomic features. Bioinformatics 30, 923–930. doi: 10.1093/bioinformatics/btt656
Liu, X., Zhang, R., Ou, H., Gui, Y., Wei, J., Zhou, H., et al. (2018). Comprehensive transcriptome analysis reveals genes in response to water deficit in the leaves of Saccharum narenga (Nees ex Steud.) hack. BMC Plant Biol. 18, 250. doi: 10.1186/s12870-018-1428-9
Liu, Q., Zhao, X., Liu, Y., Xie, S., Xing, Y., Dao, J., et al. (2021). Response of sugarcane rhizosphere bacterial community to drought stress. Front Microbiol. 12. doi: 10.3389/fmicb.2021.716196
Love, M. I., Huber, W., Anders, S. (2014). Moderated estimation of fold change and dispersion for RNA-seq data with DESeq2. Genome Biol. 15, 550. doi: 10.1186/s13059-014-0550-8
Meena, M. R., Kumar, R., Chinnaswamy, A., Karuppaiyan, R., Kulshreshtha, N., Ram, B. (2020). Current breeding and genomic approaches to enhance the cane and sugar productivity under abiotic stress conditions. 3 Biotech. 10, 440. doi: 10.1007/s13205-020-02416-w
Meng, H. L., Sun, P. Y., Wang, J. R., Sun, X. Q., Zheng, C. Z., Fan, T., et al. (2022). Comparative physiological, transcriptomic, and WGCNA analyses reveal the key genes and regulatory pathways associated with drought tolerance in Tartary buckwheat. Front. Plant Sci. 13. doi: 10.3389/fpls.2022.985088
Nadeem, M., Li, J., Yahya, M., Sher, A., Ma, C., Wang, X., et al. (2019). Research progress and perspective on drought stress in legumes: A review. Int. J. Mol. Sci. 20 (10), 2541. doi: 10.3390/ijms20102541
Nawae, W., Shearman, J. R., Tangphatsornruang, S., Punpee, P., Yoocha, T., Sangsrakru, D., et al. (2020). Differential expression between drought-tolerant and drought-sensitive sugarcane under mild and moderate water stress as revealed by a comparative analysis of leaf transcriptome. PeerJ 8, e9608. doi: 10.7717/peerj.9608
Ozturk, M., Turkyilmaz Unal, B., García-Caparrós, P., Khursheed, A., Gul, A., Hasanuzzaman, M. (2021). Osmoregulation and its actions during the drought stress in plants. Physiol. Plant 172, 1321–1335. doi: 10.1111/ppl.13297
Pereira-Santana, A., Alvarado-Robledo, E. J., Zamora-Briseño, J. A., Ayala-Sumuano, J. T., Gonzalez-Mendoza, V. M., Espadas-Gil, F., et al. (2017). Transcriptional profiling of sugarcane leaves and roots under progressive osmotic stress reveals a regulated coordination of gene expression in a spatiotemporal manner. PLoS One 12, e0189271. doi: 10.1371/journal.pone.0189271
Ren, J., Zhang, H., Shi, X., Ai, X., Dong, J., Zhao, X., et al. (2021). Genome-wide identification of key candidate microRNAs and target genes associated with peanut drought tolerance. DNA Cell Biol. 40, 373–383. doi: 10.1089/dna.2020.6245
Selvi, A., Devi, K., Manimekalai, R., Prathima, P. T. (2020). Comparative analysis of drought-responsive transcriptomes of sugarcane genotypes with differential tolerance to drought. 3 Biotech. 10, 236. doi: 10.1007/s13205-020-02226-0
Sharma, R., Singh, G., Bhattacharya, S., Singh, A. (2018). Comparative transcriptome meta-analysis of Arabidopsis thaliana under drought and cold stress. PLoS One 13, e0203266. doi: 10.1371/journal.pone.0203266
Taheri, S., Gantait, S., Azizi, P., Mazumdar, P. (2022). Drought tolerance improvement in Solanum lycopersicum: an insight into "OMICS" approaches and genome editing. 3 Biotech. 12, 63. doi: 10.1007/s13205-022-03132-3
Takahashi, F., Kuromori, T., Sato, H., Shinozaki, K. (2018). Regulatory gene networks in drought stress responses and resistance in plants. Adv Exp Med Biol. 1081, 189–214. doi: 10.1007/978-981-13-1244-1_11
Tardieu, F., Simonneau, T., Muller, B. (2018). The physiological basis of drought tolerance in crop plants: A scenario-dependent probabilistic approach. Annu. Rev. Plant Biol. 69, 733–759. doi: 10.1111/ppl.13297
Verma, V., Ravindran, P., Kumar, P. P. (2016). Plant hormone-mediated regulation of stress responses. BMC Plant Biol. 16, 86. doi: 10.1186/s12870-016-0771-y
Verma, K. K., Song, X. P., Zeng, Y., Li, D. M., Guo, D. J., Rajput, V. D., et al. (2020). Characteristics of leaf stomata and their relationship with photosynthesis in Saccharum officinarum under drought and silicon application. ACS Omega. 4, 5(37):24145–24153. doi: 10.1021/acsomega.0c03820
Wan, T., Feng, Y., Liang, C., Pan, L., He, L., Cai, Y. (2021). Metabolomics and transcriptomics analyses of two contrasting cherry rootstocks in response to drought stress. Biology 10, 201. doi: 10.3390/biology10030201
Watanabe, S., Nakagawa, A., Izumi, S., Shimada, H., Sakamoto, A. (2010). RNA interference-mediated suppression of xanthine dehydrogenase reveals the role of purine metabolism in drought tolerance in Arabidopsis. FEBS Lett. 584, 1181–1186. doi: 10.1016/j.febslet.2010.02.023
Wu, Y., Wang, Y., Shi, H., Hu, H., Yi, L., Hou, J. (2022). Time-course transcriptome and WGCNA analysis revealed the drought response mechanism of two sunflower inbred lines. PLoS One 17, e0265447. doi: 10.1371/journal.pone.0265447
Yang, L., Li, Y. (2022). Analysis of photosynthetic rate and sugar accumulation of Taitang 172. Guangxi Agric. Sci. 02, 61–62.
Yang, S., Chu, N., Zhou, H., Li, J., Feng, N., Su, J., et al. (2022). Integrated Analysis of Transcriptome and Metabolome Reveals the Regulation of Chitooligosaccharide on Drought Tolerance in Sugarcane (Saccharum spp. Hybrid) under Drought Stress. Int. J. Mol. Sci. 23, 9737. doi: 10.3390/ijms23179737
Yu, B., Liu, J., Wu, D., Liu, Y., Cen, W., Wang, S., et al. (2020). Weighted gene coexpression network analysis-based identification of key modules and hub genes associated with drought sensitivity in rice. BMC Plant Biol. 20, 478. doi: 10.21203/rs.3.rs-56040/v2
Yu, G., Wang, L. G., Han, Y., He, Q. Y. (2012). clusterProfiler: An R package for comparing biological themes among gene clusters. OMICS 16, 284–287. doi: 10.1089/omi.2011.0118
Zhang, C., Chen, J., Huang, W., Song, X., Niu, J. (2021). Transcriptomics and metabolomics reveal purine and phenylpropanoid metabolism response to drought stress in dendrobium sinense, an endemic orchid species in hainan island. Front. Genet. 12. doi: 10.3389/fgene.2021.692702
Keywords: sugarcane, drought, transcriptome, variety, metabolic pathways, photosynthesis
Citation: Li H, Gui Y, Zhu K, Wei J, Zhang R, Yang R, Tang L, Zhou H and Liu X (2023) Comparative transcriptomic analyses of two sugarcane Saccharum L. cultivars differing in drought tolerance. Front. Plant Sci. 14:1243664. doi: 10.3389/fpls.2023.1243664
Received: 21 June 2023; Accepted: 27 September 2023;
Published: 11 October 2023.
Edited by:
Weicong Qi, Jiangsu Academy of Agricultural Sciences (JAAS), ChinaReviewed by:
Khushi Muhammad, Hazara University, PakistanCopyright © 2023 Li, Gui, Zhu, Wei, Zhang, Yang, Tang, Zhou and Liu. This is an open-access article distributed under the terms of the Creative Commons Attribution License (CC BY). The use, distribution or reproduction in other forums is permitted, provided the original author(s) and the copyright owner(s) are credited and that the original publication in this journal is cited, in accordance with accepted academic practice. No use, distribution or reproduction is permitted which does not comply with these terms.
*Correspondence: Xihui Liu, eGlodWlsaXUyMDA2QDEyNi5jb20=; Hui Zhou, emhvdWh1aUBneGFhcy5uZXQ=
†These authors have contributed equally to this work
Disclaimer: All claims expressed in this article are solely those of the authors and do not necessarily represent those of their affiliated organizations, or those of the publisher, the editors and the reviewers. Any product that may be evaluated in this article or claim that may be made by its manufacturer is not guaranteed or endorsed by the publisher.
Research integrity at Frontiers
Learn more about the work of our research integrity team to safeguard the quality of each article we publish.