 Zi-Piao Ye1
 Alexandrina Stirbet2
 Ting An3
 Piotr Robakowski4
 Hua-Jing Kang5
 Xiao-Long Yang6*
 Fu-Biao Wang1*
- 1The Institute of Biophysics in College of Mathematics and Physics, Jinggangshan University, Ji’an, Jiangxi, China
- 2Retired, Newport News, VA, United States
- 3School of Biological Sciences and Engineering, Jiangxi Agriculture University, Nanchang, China
- 4Faculty of Forestry and Wood Technology, Poznan University of Life Sciences, Poznan, Poland
- 5Southern Zhejiang Key Laboratory of Crop Breeding, Wenzhou Academy of Agricultural Sciences, Wenzhou, Zhejiang, China
- 6School of Life Sciences, Nantong University, Nantong, Jiangsu, China
Investigation on intrinsic properties of photosynthetic pigment molecules participating in solar energy absorption and excitation, especially their eigen-absorption cross-section (σik) and effective absorption cross-section (σ′ik), is important to understand photosynthesis. Here, we present the development and application of a new method to determine these parameters, based on a mechanistic model of the photosynthetic electron flow-light response. The analysis with our method of a series of previously collected chlorophyll a fluorescence data shows that the absorption cross-section of photosynthetic pigment molecules has different values of approximately 10−21 m2, for several photosynthetic organisms grown under various conditions: (1) the conifer Abies alba Mill., grown under high light or low light; (2) Taxus baccata L., grown under fertilization or non-fertilization conditions; (3) Glycine max L. (Merr.), grown under a CO2 concentration of 400 or 600 μmol CO2 mol−1 in a leaf chamber under shaded conditions; (4) Zea mays L., at temperatures of 30°C or 35°C in a leaf chamber; (5) Osmanthus fragrans Loureiro, with shaded-leaf or sun-leaf; and (6) the cyanobacterium Microcystis aeruginosa FACHB905, grown under two different nitrogen supplies. Our results show that σik has the same order of magnitude (approximately 10−21 m2), and σ′ik for these species decreases with increasing light intensity, demonstrating the operation of a key regulatory mechanism to reduce solar absorption and avoid high light damage. Moreover, compared with other approaches, both σik and σ′ik can be more easily estimated by our method, even under various growth conditions (e.g., different light environment; different CO2, NO2, O2, and O3 concentrations; air temperatures; or water stress), regardless of the type of the sample (e.g., dilute or concentrated cell suspensions or leaves). Our results also show that CO2 concentration and temperature have little effect on σik values for G. max and Z. mays. Consequently, our approach provides a powerful tool to investigate light energy absorption of photosynthetic pigment molecules and gives us new information on how plants and cyanobacteria modify their light-harvesting properties under different stress conditions.
Introduction
In the primary reaction process of photosynthesis, light is absorbed by the light-harvesting pigments including chlorophyll a. At room temperature, chlorophyll a molecules in their excited state return to the ground state via fluorescence emission and thermal dissipation processes, but most of the excitation energy is transferred to the photosystem II (PSII) and the photosystem I (PSI) to drive photochemistry and charge separation (Mar and Govindjee, 1972; Govindjee, 1990; Bixon et al., 1991; Govindjee, 2004; Wang et al., 2007; Baker, 2008; Grayson et al., 2017; Stirbet et al., 2020). The physical processes of light absorption and other photochemical processes, involving photosynthetic pigment molecules (chlorophyll and carotenoid molecules in plants and green algae), have been extensively studied both theoretically and experimentally due to their importance in photosynthesis (Ley and Mauzerall, 1982; Stirbet et al., 1998; Govindjee, 2004; Walters, 2005; De Boni et al., 2007; Suggett et al., 2007; Baker, 2008; Ye et al., 2013a; Ye et al., 2013b; Klughammer and Schreiber, 2015; Mishra et al., 2019; Stirbet et al., 2019; Hu et al., 2021; Celebi-Ergin et al., 2022; He et al., 2022).
Previous studies have mainly focused on investigating the relationship between the chlorophyll content and the plant’s light absorption and excitation capacity, without considering the impact of parameters such as the intrinsic and effective absorption cross-sections of photosynthetic pigment molecules on this process (Baker, 2008; Ahammed et al., 2018; Robakowski et al., 2018). However, the intrinsic properties of photosynthetic pigment molecules in light absorption and excitation are essential to understand the light-harvesting mechanism in photosynthetic organisms. Between different parameters studied, the following are essential to understand this process: (1) the effective absorption cross-sections of photosystem II (PSII) (σPSII) (Suggett et al., 2007; Klughammer and Schreiber, 2015; see Table 1 for the list of abbreviations); (2) the absorption cross-section for oxygen production () (Ley and Mauzerall, 1982); (3) the absorption cross-section of chlorophyll molecules (σchl) (Ley and Mauzerall, 1982; Suggett et al., 2007); (4) the eigen-absorption cross-section (σik, from the ground state to the first excited state) (Ye et al., 2013a; Ye et al., 2013b; Zuo et al., 2019; Hashemi and Leppert, 2021; Hu et al., 2021; He et al., 2022); (5) the effective absorption cross-section of photosynthetic pigment molecules (σ′ik) (Ye et al., 2013a; Ye et al., 2013b; Hu et al., 2021; He et al., 2022); and (6) the optical cross-section (aL*(λ), where λ is the wavelength) (Celebi-Ergin et al., 2022). These absorption cross-sections measured in cyanobacteria, algae, and plants vary among taxa and/or with various growth conditions, as shown in the studies mentioned above.
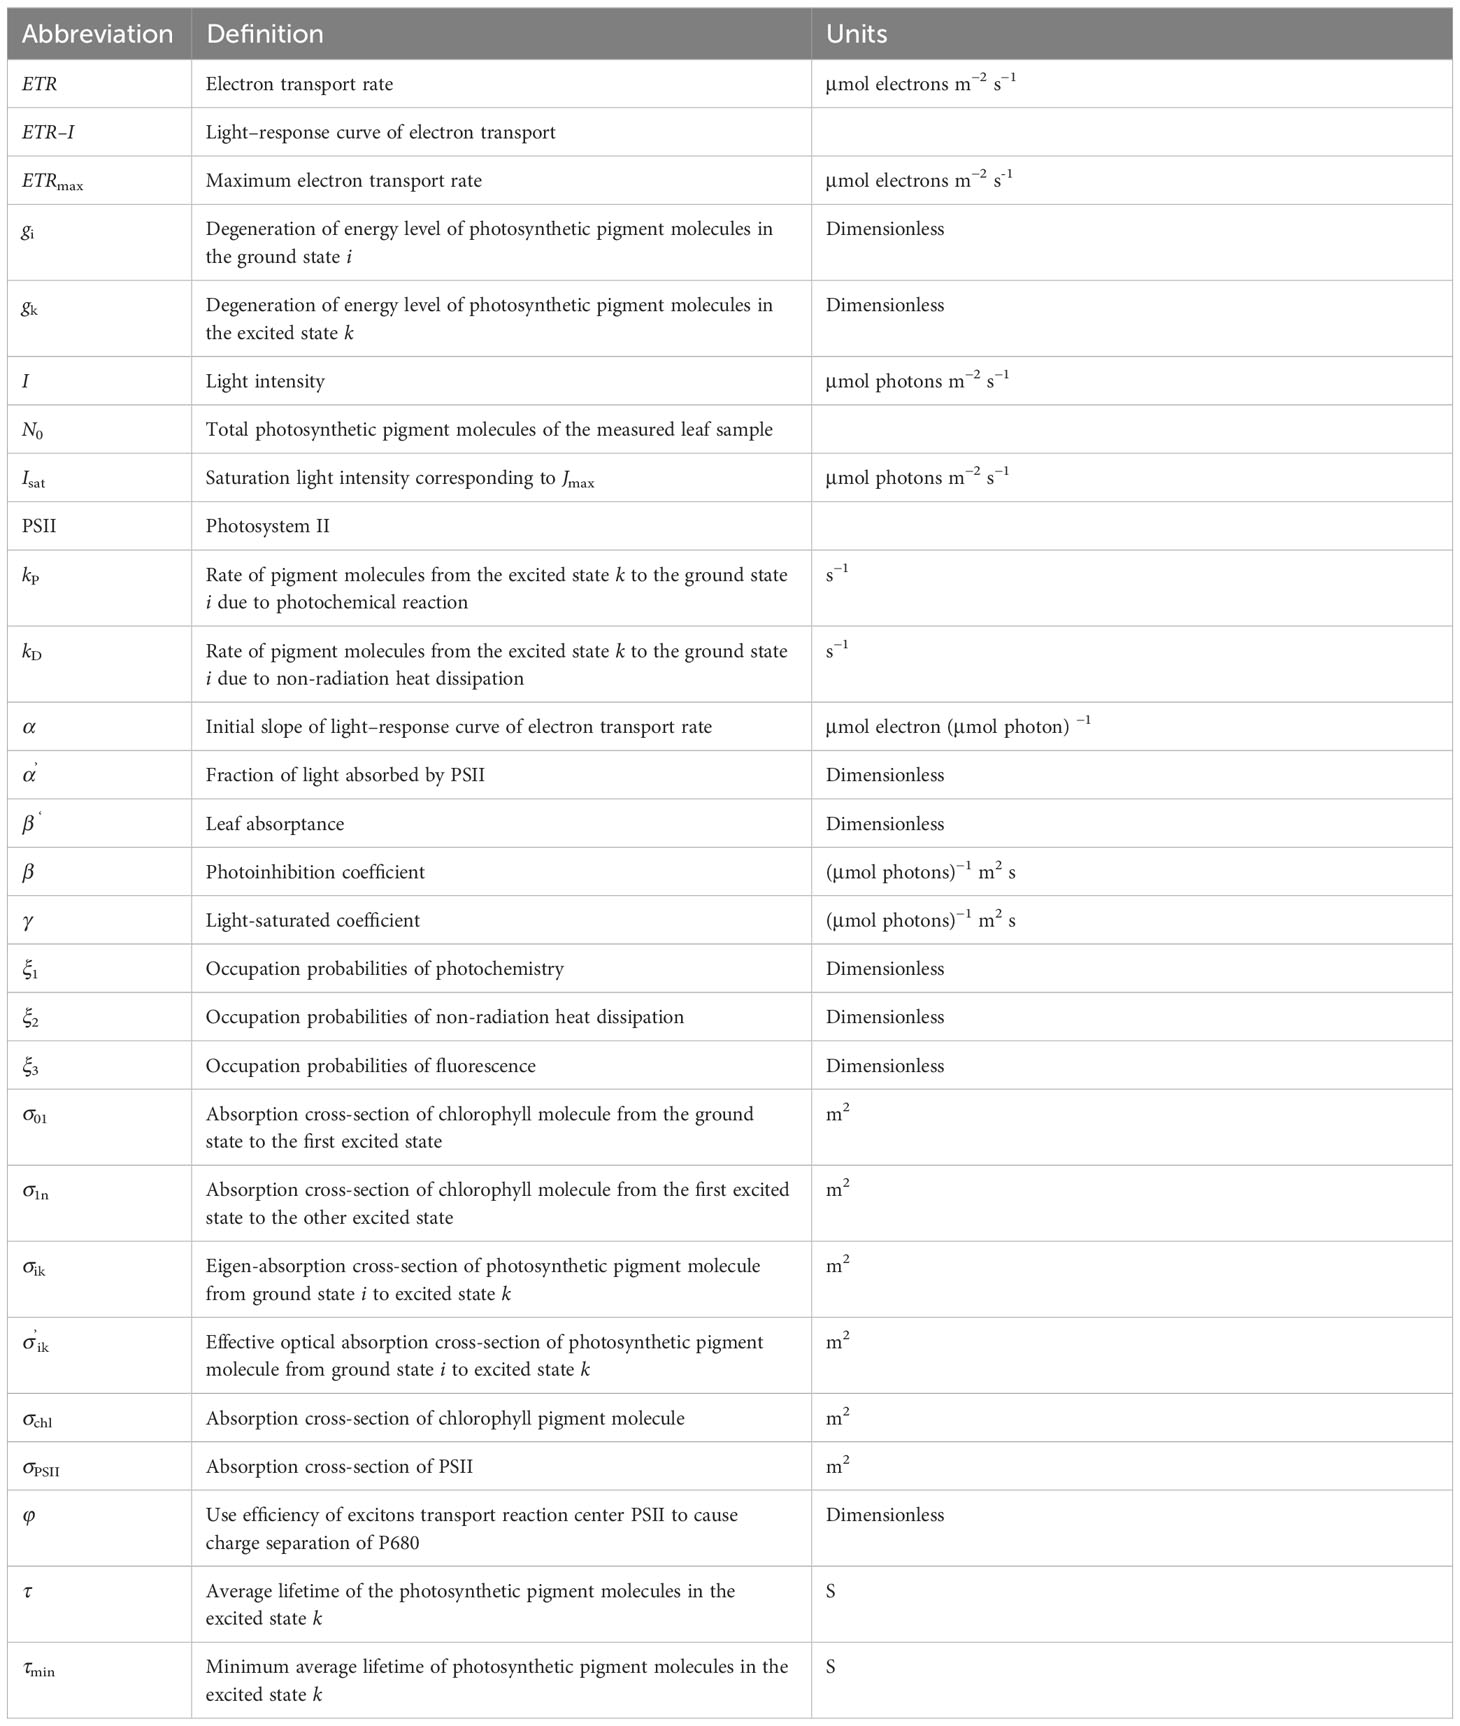
Table 1 Definitions of the abbreviations.
Currently, there are several methods or techniques for determining the values of these types of parameters. For example, Ley and Mauzerall (1982) estimated σchl in Chlorella vulgaris by measuring the rates of O2 production and found that decreased with increasing growth light intensity. Surprisingly, there were no significant differences in σchl between cells grown under low-light or high-light conditions. De Boni et al. (2007) used the white light continuum (WLC) Z-scan technique to measure the resonant nonlinear spectrum of chlorophyll a extracted from Spinacia oleracea, to study σ01 (from the ground state to the first excited state), as well as σ1n (from the first excited state to higher excited states), and showed that σ01 is dependent on wavelength. Based on the fast repetition rate (FRR) fluorescence technique, Suggett et al. (2007) found that as the growth light intensity increased, the σPSII and σchl in Emiliania huxleyi (Lohmann) decreased. Klughammer and Schreiber (2015) used a kinetic multi-color PAM chlorophyll fluorometer (referred to as MC-PAM method), which allows measurements of the sub-millisecond fluorescence rise kinetics upon the onset of strong variously colored actinic light and found that σPSII was a function of wavelength. Moreover, Ye et al. (2013a) proposed the YRS method, which can be used to determine σik and σ′ik when the light–response curve of electron transport rate (ETR–I curve) and chlorophyll content are measured. In the results mentioned above, the dependence of σPSII, σchl, and aL*(λ) on wavelength has been confirmed (De Boni et al., 2007; Klughammer and Schreiber, 2015; Celebi-Ergin et al., 2022). Furthermore, previous studies have demonstrated that the σPSII and σchl values can vary during growth under different light intensities (Ley and Mauzerall, 1982; Suggett et al., 2007; Yang et al., 2018; Hu et al., 2021). In addition, Celebi-Ergin et al. (2022) found that the decrease in total chlorophyll resulted in an increased aL*(λ) when growth [CO2] increases. However, it is interesting to note that, despite variations among different photosynthetic organisms and environmental conditions, the magnitude of σchl [σik, σ01, and aL*(λ)] remains consistent at approximately 10−21 m2 (Ley and Mauzerall, 1982; De Boni et al., 2007; Suggett et al., 2007; Ye et al., 2016; Yang et al., 2018; Zuo et al., 2019; Hu et al., 2021; He et al., 2022). Only cell suspensions were used for the measurements mentioned above, except for the YRS method (2013a), which also measured leaves. The YRS is the only method capable of investigating σik and σ′ik in the leaves of C3, C4, and CAM species under various conditions because it requires only a commercial portable gas-exchange and fluorescence systems and measured chlorophyll content (Ye et al., 2018; Zuo et al., 2019; Hu et al., 2021; He et al., 2022; Yang et al., 2023).
In order to address uncertainties about the relationship between light intensity, environmental factors (such as temperature, CO2, O2 and O3 concentrations), and the values of σchl or σPSII, we have used here the YRS method to investigate σik and σ′ik in plant leaves and a cyanobacterium in both dilute and dense suspensions. The objective of this study is to estimate both σik and σ′ik of photosynthetic pigment molecules based on the experimental data collected on six different species grown under different conditions. Our results show that both σik and σ′ik acclimate to growth light environment, CO2 concentration or different nitrogen source supplies, and their values are easily obtained by the YRS method independently of the species and experimental conditions.
The mechanistic model of the ETR–I curve of Chl a fluorescence
ETR via PSII can be calculated with Eq. 1 (Ye et al., 2013a; Ye et al., 2013b) as:
where α’ is fraction of light absorbed by PSII (dimensionless), β’ is leaf absorptance (dimensionless), φ is the exciton-use efficiency of PSII (dimensionless), N0 is total photosynthetic pigment molecules of the measured leaf sample, S is the measured area of leaf sample (m2), and gi and gk are the degeneracy of energy level of photosynthetic pigment molecules in the ground state (i) and excited state (k) (dimensionless), respectively. kP and kD are rates of the photochemical reaction and heat loss (s−1), respectively (Baker, 2008). ξ1, ξ2, and ξ3 were referred to as “statistical weight of photochemistry, heat loss, and fluorescence emission” (dimensionless), respectively, in our previous work (Ye, 2012; Ye et al., 2013a, Ye et al., 2013b). Furthermore, σik (m2) is the eigen-absorption cross-section of photosynthetic pigment molecules from the ground state i to the excited state k (after light exposure), τ (s) is the average lifetime of the photosynthetic pigment molecules in the lowest excited state k, and I is the light intensity (μmol photons m−2 s−1). For the details of the derivation of the mechanistic model, see Ye et al. (2013a, b).
According to Ye et al. (2013a, b), σik, τ, ξ1, ξ2, ξ3, gi, gk, kP, and kD (Eq. 1) are inherently specific but have different values, depending on the species and the environmental conditions (e.g., light, temperature, CO2 concentration, and the nutrient used). Therefore, for a given species and at a specific environmental condition, all parameters such as σik, τ, ξ1, ξ2, ξ3, gi, gk, kP, and kD should be constant. In this case, we may assume that [μmol electron (μmol photons)−1], which referred to as the initial slope of the ETR–I curve, [(μmol photons)−1 m2 s], referred to as the “dynamic downregulation term of PSII/photoinhibition”, and [(μmol photons)−1 m2 s] referred to as “the saturation term of photosynthesis” in our previous work (Ye, 2012; Ye et al., 2013a, Ye et al., 2013b). Then, Eq. 1 can be simplified as:
Equations 1 and 2 describe the ETR–I function and characterize the interdependence between ETR and light intensity. Since Eq. 1 is a non-asymptotic function, it has the first derivative. When the first derivative of Eq. 1 equals zero, the saturation light intensity (Isat) corresponding to the maximum ETR can be calculated as follows:
Substituting Eq. 3 into Eq. 2, the maximum ETR (ETRmax) can be calculated as:
Moreover, when chlorophyll content (unit: mg m−2) is determined, σik can be calculated as:
where n0 is the number of photosynthetic pigment molecules of the measured leaf sample per unit volume (m−3), and d is the thickness of leaf sample (m). The biological significance of the other parameters in Eq. 5 is the same as that in Eq. 1.
In this work, we neither fit the values of the initial parameters of the model (ξi, kP, kD, τ, and others) nor used their values assessed by other authors. We realize that the values of some of these parameters may differ significantly from the values known from the literature, and this is the weakness of the YRS model. Instead, we used Eq. 2 to fit the parameters α, β, and γ composed of the initial ones. We realize that this approach means using the YRS model actually as a phenomenological model. To some extent, this is due to the fact that the YRS model does not explicitly take into account the reactions of electron transport. Taking into account the reactions of electron transport and finding an interpretation of results of the fitting in terms of the values of the initial parameters of the model is the task for future research.
Equation 1 has been widely used in the literature to simulate the ETR–I curves of photosynthetic organisms and to extract several parameters from those curves (Serôdio et al., 2013; Morfopoulos et al., 2014; Sun et al., 2015; Ahammed et al., 2018; Robakowski et al., 2018; Yang et al., 2018; Zuo et al., 2019; Hu et al., 2021; He et al., 2022; Robakowski et al., 2022; Yang et al., 2023). In addition, when the chlorophyll content (mg m−2) is measured, besides α, ETRmax, and Isat, some other key parameters characterizing photosynthetic pigment molecules (e.g., σ′ik; the minimum average life time of the light-harvesting pigment molecules in the lowest excited state, τmin; the light-harvesting pigment molecules in the excited state, Nk) can also be obtained (Ye et al., 2013a; Ye et al., 2013b).
Effective absorption cross-section of photosynthetic pigment molecules
The σ′ik, based on uniform light absorption in leaves, can be described as follows (Ye et al., 2013a; Ye et al., 2013b):
Or
The biological significance of the parameters in Eq. 6 is the same as that in Eq. 1. We note, from Eq. 6, that σ′ik will decrease with increasing I when photosynthetic organisms are under certain environmental conditions; from Eq. 6, σ′ik = σik when I = 0 μmol photons m−2 s−1. As such, the σ′ik is not a constant under any given light intensity (except when I = 0 μmol photons m−2 s−1).
Data processing and statistical analysis
The mechanistic model presented above was fitted to obtain key parameters (e.g., ETRmax, Isat, σik, and σ′ik) defining the ETR–I curves, using the Photosynthesis Model Simulation Software (PMSS) (http://photosynthetic.sinaapp.com, Jinggangshan University, Ji’an, China). When fitting the ETR–I curves using the YRS model, the initial values are set as follows: αe = 0.06, βe = 0.002, γe = 0.01.
All statistical tests were performed using the statistical package SPSS 18.5 statistical software (SPSS, Chicago, IL). Student’s t-test was conducted to test whether there were significant differences between the fitted and the measured values of quantitative traits (such as ETRmax and Isat). Goodness of the fit of experimental observations with results obtained with the mathematical model was assessed using the coefficient of determination (R2 = 1 – SSE/SST, where SST is the total sum of squares and SSE is the error sum of squares).
Examples of model application
Details of the growth conditions, the species examined, and the procedures for generating the ETR–I curves to be examined with our model are described in the Supporting Information [for A. alba, see Robakowski et al., 2022; for T. baccata, see Robakowski et al., 2018; for G. max at 400 and 600 μmol CO2 mol−1, see Ye et al., 2018; for Z. mays at 30°C and 35°C temperatures, see Wang et al., 2022; for O. fragrans (both for sun-leaf and shaded-leaf), see Hu et al., 2021; and for M. aeruginosa, under two different nitrogen supplies, see Yang et al., 2023]. In the present study, representative ETR–I curves (fitting the model of Eq. 1) for four C3 species (i.e., A. alba, T. baccata, G. max, and O. fragrans), one C4 species (Z. mays), and one cyanobacterium (M. aeruginosa) are shown in Figure 1. For A. alba grown under HL (Figure 1A), O. fragrans (shaded-leaf) (Figure 1E) and M. aeruginosa grown under two nitrogen supplies (Figure 1F), the value of ETR initially increased (almost linearly) with the light intensity towards saturation, and subsequently, beyond the highest irradiance (i.e., Isat), it showed a significant degree of decline, likely reflecting an onset of dynamic downregulation of PSII, especially in M. aeruginosa. On the other hand, A. alba grown under LL (Figure 1A), T. baccata (fertilization) (Figure 1B), G. max at 400 μmol CO2 mol−1 under shaded conditions (Figure 1C), Z. mays (Figure 1D), and O. fragrans (sun-leaf) (Figure 1E) exhibited only a small decline of ETR with increasing light intensity beyond the Isat. Data for T. baccata (non-fertilization) (Figure 1B) and G. max at 600 μmol CO2 mol−1 under shaded conditions (Figure 1C) showed that ETR hardly increases with increasing light intensity beyond the Isat. Moreover, the fitted curves show that Eq. 1 reproduces quite well the ETR–I curves of all the six species, regardless of whether there is dynamic downregulation, and this with extremely good fits (R2 ≥ 0.995) (Figure 1; Table 2).
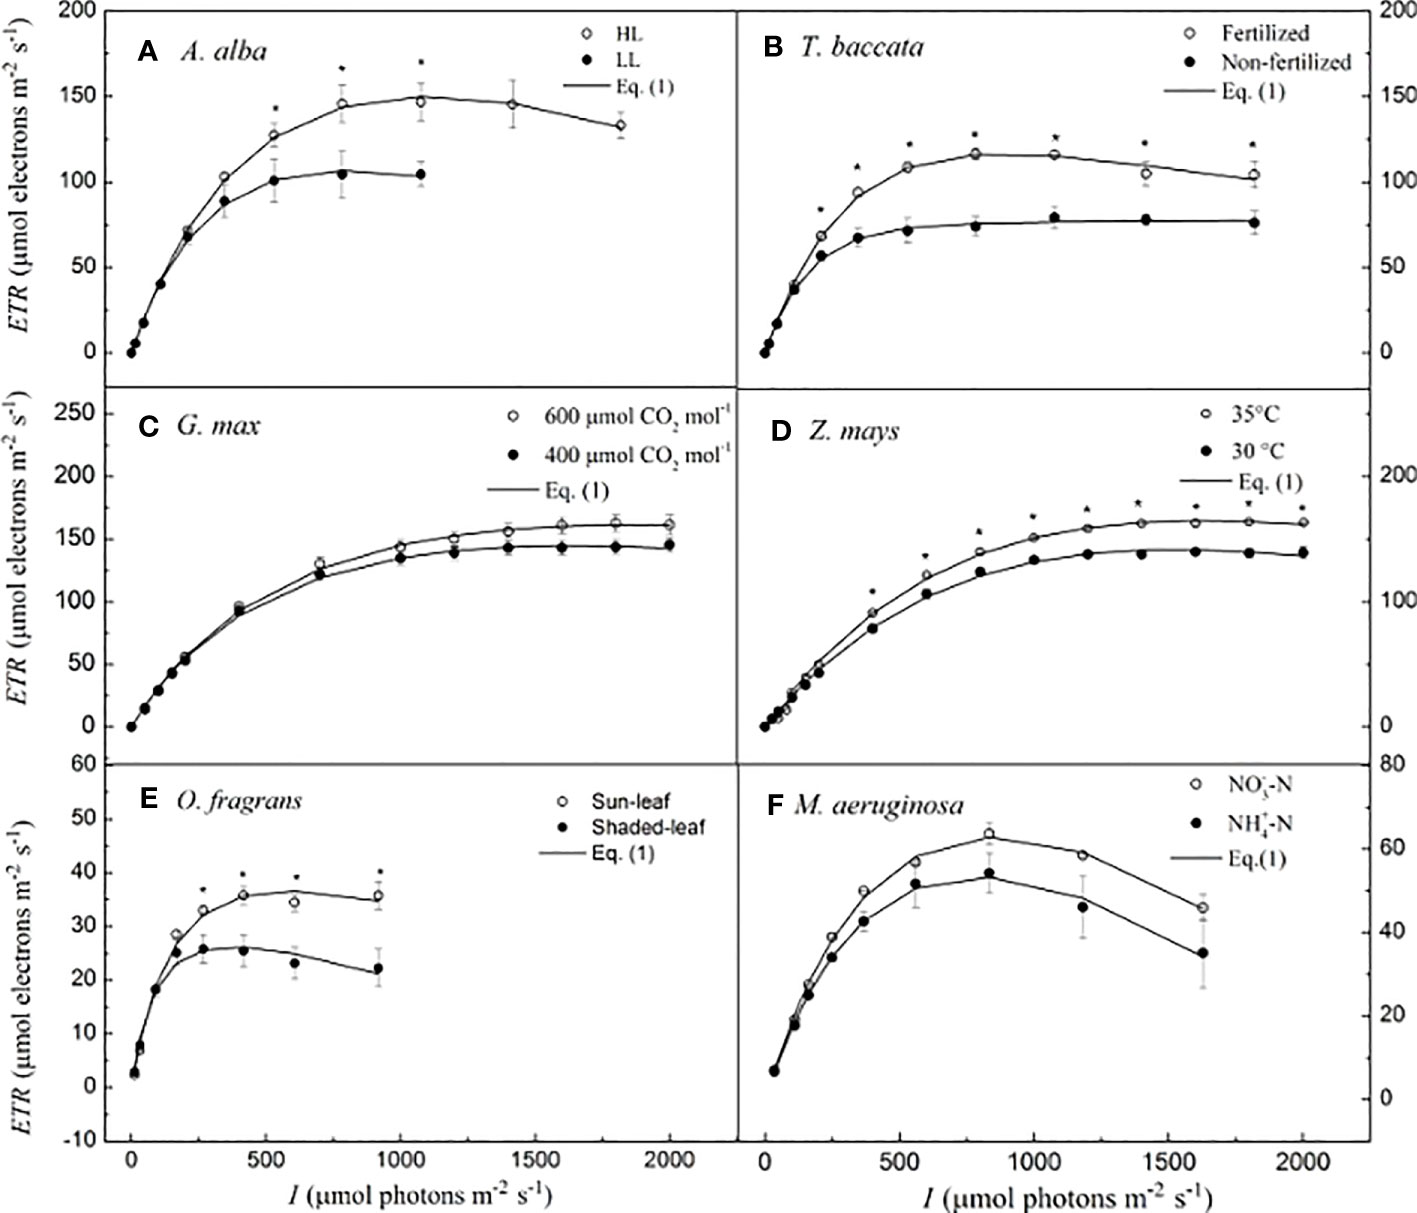
Figure 1 Light-response curves of photosynthetic electron flow and curves fitted by Eq. I for six species. (A) for A. alba; (B) for T. baccata; (C) for G. max; (D) for Z. mays; (E) for O. fragrans; and (F) for M aeruginosa. An asterisk indicates that mean values of ETR at the given / value are significantly different using Student's t-test at p<0.05 (n-5-12). Data are mean±SE (n-3-12). The results of the statistical analyses, see Table 2. I, lightintensity.
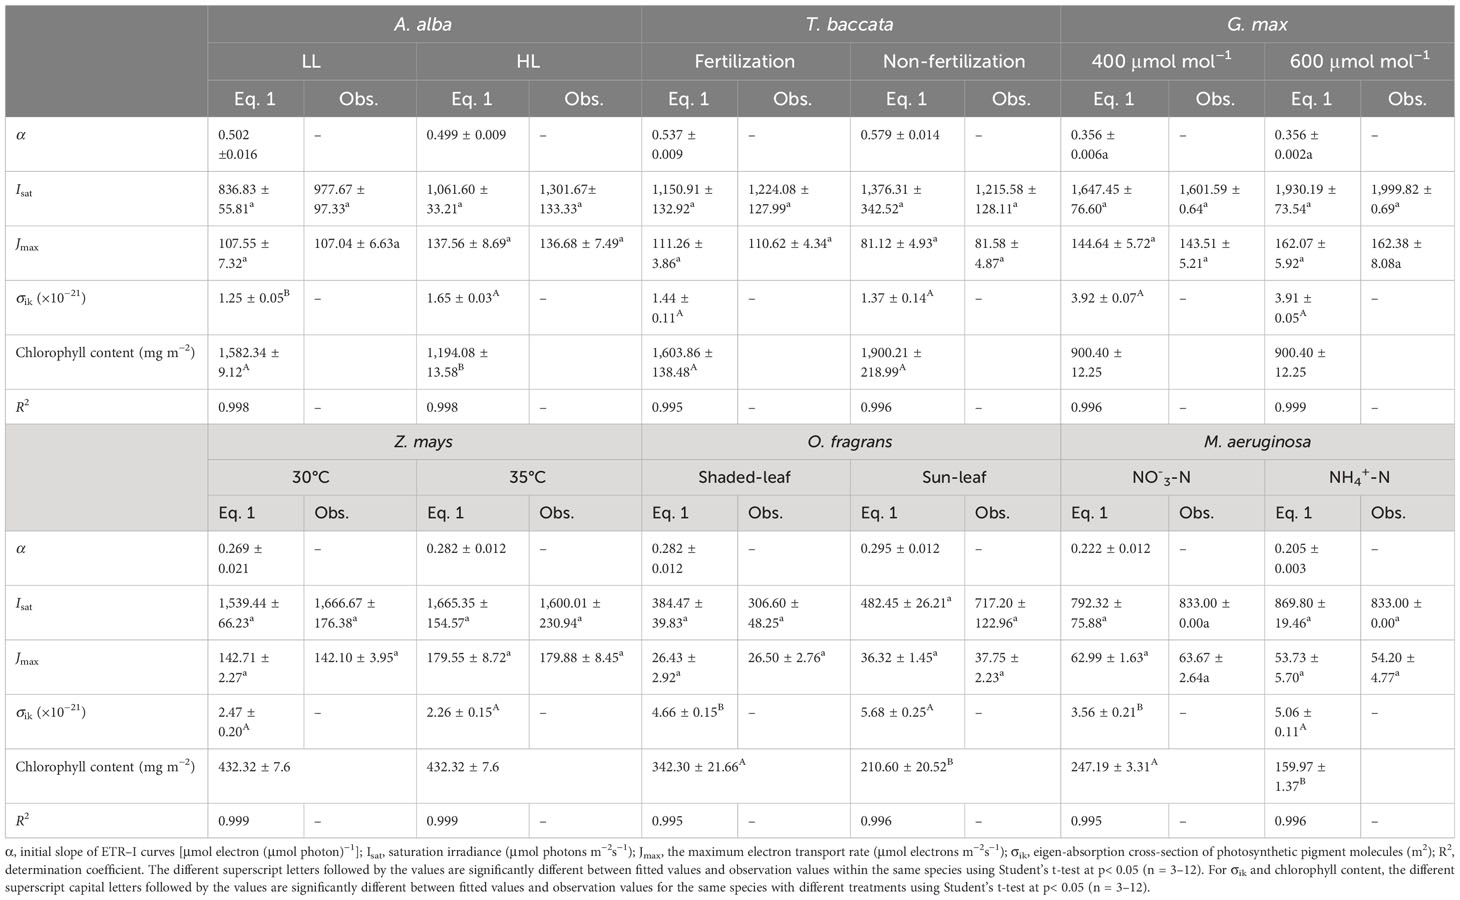
Table 2 Results fitted by Eq. 1 and observation values of photosynthetic parameters for six species under various conditions (mean ± SE, n = 3-12).
Table 2 lists the photosynthetic parameters (such as α, ETRmax, and Isat) estimated by Eq. 1 and their corresponding observed values for the four C3 species, a C4 species, and a cyanobacterium grown under different conditions, described earlier. In this study, we did not observe significant differences between the estimated values of ETRmax (and Isat) and their corresponding observed values (p > 0.05). Furthermore, Table 2 shows that the values of σik, calculated by Eq. 5, have different values ranging from 1.25 × 10⁻²¹ m2 to 5.68 ×10⁻²¹ m2 for the six species used in this study. For A. alba, there was a significant difference between σik at HL and at LL (p< 0.05), with the values of σik at HL being higher than that at LL; for O. fragrans, there was a significant difference between σik evaluated for the shaded-leaf and for the sun-leaf (p< 0.05), with the values of σik of the sun-leaf being larger than that of the shaded-leaf; for M. aeruginosa, there was a significant difference between σik under NO3−-N supply and under NH4+-N supply (p< 0.05), with the values of σik under NO3−-N supply being smaller than that under NH4+-N supply. In addition, no significant difference was found between σik evaluated in G. max at 400 μmol CO2 mol−1 and 600 μmol CO2 mol−1; furthermore, no significant difference was found for σik between Z. mays at 30°C and 35°C. Also there were no significant differences in σik between T. baccata seedlings grown in fertilization and in non-fertilization conditions.
Effective absorption cross-section of photosynthetic pigment molecules
The values of σ′ik nonlinearly decrease with I in A. alba at HL and LL (Figure 2A), in T. baccata grown under fertilized and non-fertilized conditions (Figure 2B), in G. max at 400 μmol CO2 mol−1 and 600 μmol CO2 mol−1 (Figure 2C), in O. fragrans of sun-leaf and shaded-leaf (Figure 2E), and in M. aeruginosa grown under NO3−-N supply and NH4+-N supply (Figure 2F). For Z. mays at 30°C versus that at 35°C (Figure 2D), we observed that σ′ik decreases almost nonlinearly with increasing I. In addition, for A. alba, there is a significant difference between σ′ik at HL and at LL for any I (p< 0.05) (Figure 2A), and the values of σ′ik at HL are higher than those of σ′ik at LL. For example, at 783 μmol photons m−2 s−1 for A. alba, the value of σ′ik at HL is 0.697 (± 0.060) × 10−21 m2, while the value of σ′ik at LL is 0.263 (± 0.032) × 10−21 m2. For Z. mays, there is a significant difference between σ′ik at 30°C and at 35°C (p< 0.05) when the light intensity ranges from 800 to 1,800 μmol photons m−2 s−1, with the σ′ik values at 35°C higher than those at 30°C. For instance, at 1,800 μmol photons m−2 s−1 for Z. mays, the value of σ′ik at 35°C is 0.898 (± 0.049) × 10−21 m2, while the value of σ′ik at 30°C is 0.717 (± 0.030) × 10−21 m2. For O. fragrans, there is a significant difference between σ′ik for shaded-leaf and sun-leaf (p< 0.05), as the values of σ′ik of sun-leaf are higher than those of shaded-leaf at any light intensity. For instance, at 606 μmol photons m−2 s−1 for O. fragrans, the value of σ′ik for the sun-leaf is 0.588 (± 0.044) × 10−21 m2, while the value of σ′ik for the shaded-leaf is 0.266 (± 0.043) × 10−21 m2. For M. aeruginosa, there is a significant difference between σ′ik under NO3−-N supply and under NH4+-N supply (p< 0.05) when the light intensity is below 559 μmol photons m−2 s−1, and in this case, the values of σ′ik under NO3−-N supply are less than those under NH4+-N supply. For instance, at 559 μmol photons m−2 s−1, for M. aeruginosa, the value of σ′ik is 1.666 (± 0.037) × 10−21 m2 under NO3−-N supply, and the value of σ′ik is 2.230 (± 0.162) × 10−21 m2 under NH4+-N supply. In contrast, for G. max, no significant difference between σ′ik at 400 μmol CO2 mol−1 and at 600 μmol CO2 mol−1 is found (Figure 2C).
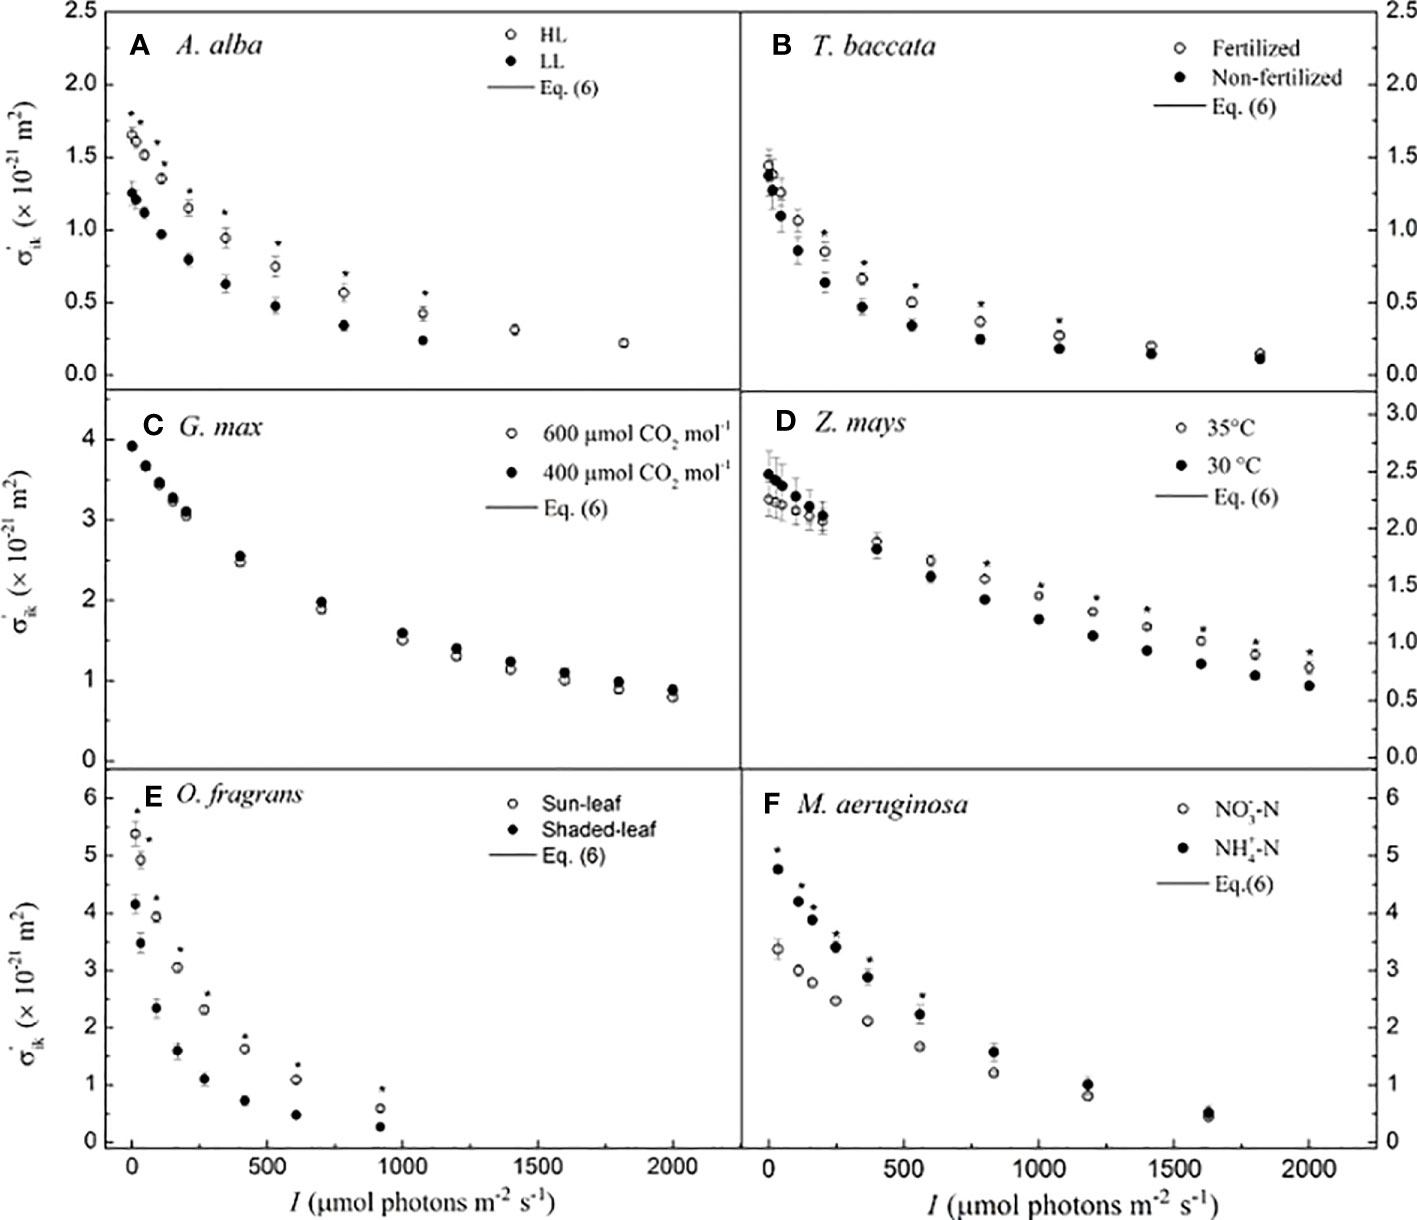
Figure 2 Light-response curves of the effective absorption cross-section of photosynthetic pigment molecules calculated by Eq. 6 for six species. (A) for A. alba; (B) for T. baccata; (C) for G. max; (D) for Z. mays; (E) for O. fragrans; and (F) for M aeruginosa. An asterisk indicates that mean values of σ'ik at the given I value are significantly different using Student's t-test at p< 0.05 (n = 3-12). Data are mean ± SE (n=3-12). I, light intensity.
Discussion
We have simulated the ETR−I curves of six different species under different conditions using the mechanistic model developed by Ye et al. (2013a, b). Fitting this model to previously collected data (including HL and LL conditions, fertilized and non-fertilized conditions, two CO2 concentrations, two temperatures, and different species, i.e., four C3, one C4, and one cyanobacterium) showed extremely good fits (R2 ≥ 0.995), and the fitted values for ETRmax and Isat were consistent with all the observations (Table 2), and with no significant difference between the fitted values for ETRmax (and Isat) and their corresponding observations (p< 0.05; Table 2). This shows that Eq. 1 is highly adequate for fitting ETR−I curves regardless of dynamic downregulation of PSII/photoinhibition in the photosynthetic organisms used in our current study. Furthermore, our results are consistent with previous studies (Ye et al., 2013a; Ye et al., 2013b; Ye et al., 2016; Yang et al., 2018; Zuo et al., 2019; Hu et al., 2021; He et al., 2022).
There are several methods that can be used to determine σchl. For example, Ley and Mauzerall (1982) estimated σPSII of C. vulgaris by measuring the rates of O2 production and found that the estimated value of σchl was 2.90 (± 0.10) × 10−21 m2. At the same time, these authors found no significant differences in σchl measured on LL-grown and HL-grown cells. After 25 years of Ley and Mauzerall’s work, De Boni et al. (2007) used WLC Z-scan technique to study the values of σ01 and σ1n of Chl a and found that the value of σ01 was ~4.7 × 10⁻²¹ m2 at 680 nm, while the value of σ1n was ~0 m2. Furthermore, De Boni et al. (2007) found that σ01 is wavelength-dependent, while Klughammer and Schreiber (2015) using a MC-PAM method determined that σchl is a function of wavelength and can be determined in combination with chlorophyll content. Moreover, Suggett et al. (2007) using the fast repetition rate fluorescence technique studied that both σPSII and σchl in E. huxleyi decrease as the growth light intensity increases. For instance, σchl was 3.25 × 10⁻²¹ m2 in cells grown under low light (25 μmol photons m−2 s−1), but decreased to 2.95 × 10⁻²¹ m2 under high light (600 μmol photons m−2 s−1). Their results revealed that growth light intensity affects the values of σchl, and indirectly demonstrated that σchl is a function of light intensity, and seems to decrease with light intensities. Thus, although the values of σchl obtained with various methods are different, the estimated values are in the same order of magnitude (approximately 10−21 m2). These results are consistent with our results given in Table 2.
However, σchl, σ01, aL*(λ), and σik have different definitions and different biological significance. For example, if i = 0 and k = 1, σik represents the chlorophyll molecules that are excited from the ground state (i = 0) to the first excited state (k = 1), i.e., σ01. In addition, when k ≥ 1, σik represents the average light absorption cross-section of a photosynthetic pigment since the accessory pigments transfer the absorbed solar energy to chlorophyll molecules, which will make a transition from the ground state (i = 0) to different excited states (k ≥ 1), depending on the wavelength of light. It, thus, follows that σik has the same biological significance as σchl and aL*(λ). Consequently, both σchl and aL*(λ) indicate the average light absorption cross-section of the photosynthetic pigment under light illumination.
From an operational perspective of the YRS method (Ye et al., 2013a, Ye et al., 2013b), the value of σik can be easily estimated by using Eq. 5, for any species and under different environmental conditions. For instance, the value of σik is 1.12 × 10⁻²¹ m2 for T. baccata (fertilization), while it is 5.68 × 10⁻²¹ m2 for O. fragrans. In this study, the values of σik for other photosynthetic organisms were found to be between these two values (Table 2). Thus, our work demonstrates that although the experimental materials and methods used have been different (Ley and Mauzerall, 1982; De Boni et al., 2007; Suggett et al., 2007; Ye et al., 2013a, Ye et al., 2013b; Klughammer and Schreiber, 2015; Celebi-Ergin et al., 2022), the values of σik or σchl are approximately of the same order of magnitude (approximately 10−21 m2). Previous studies have demonstrated that the relationship between σchl and light adaptation is crucial for understanding how plants and algae adapt to different light environments (Ley and Mauzerall, 1982; Suggett et al., 2007; Neale and Melis, 2010). Plant species and algae grown under different light conditions may have different evolutionary strategies in optimizing light absorption and utilization (Neale and Melis, 2010; Buckley and Diaz-Espejo, 2015). The magnitude of σchl can reflect the light-harvesting capability and light adaptation ability of plants and algae. In this study, the value of σik for A. alba grown under LL conditions is smaller than that of σik for A. alba grown under HL (Table 2), and there is a significant difference between them. This result is different from the results obtained by Ley and Mauzerall (1982) and Suggett et al. (2007). Ley and Mauzerall (1982) found that there was no significant difference between σchl of C. vulgaris in LL and in HL, while Suggett et al. (2007) found that σchl of E. huxleyi (B11) at LL growth was higher than those under HL growth. This indicates that the shade-tolerant conifer A. alba has a different strategy from the alga E. huxleyi grown under different light environments. This inconsistency between our results and those of others may reflect evolutionary differences between the terrestrial plants and algae, which are adapted to totally different light environments. In addition, in our present study, we found that there was no significant difference between σik values at 30°C and 35°C for Z. mays, or at 400 μmol CO2 mol−1 and 600 μmol CO2 mol−1 for G. max. These results are inconsistent with those obtained by Celebi-Ergin et al. (2022) on eelgrass (Zostera marina L.), as they found that the decrease in total chlorophyll at greater [CO2] values resulted in an increased aL*(Λ). It is uncertain whether this difference between our results and those of the other authors result from the different experimental conditions or the species-specific, genetic features, and thus further research is needed.
Suggett et al. (2007) found that σchl of E. huxleyi (B11) decreased as the growth light intensity increased. Their results showed that E. huxleyi (B11) at the lowest growing irradiance (25 μmol photons m−2 s−1) had the highest values of σchl (i.e., 3.25 × 10⁻²¹ m2), while at the highest light intensity (600 μmol photons m−2 s−1), it had the smallest values of σchl (i.e., 2.95 × 10⁻²¹ m2). For the intermediate growth irradiances (i.e., 150 and 300 μmol photons m−2 s−1), the values of σchl were between 2.95 × 10⁻²¹ m2 and 3.25 × 10⁻²¹ m2. These results suggest that the value of σchl is a function of light intensity, and that it decreases with light intensity. Therefore, the results of Suggett et al. (2007) are consistent with our conclusion on σ′ik, which decreases nonlinearly with increasing I. However, Ley and Mauzerall (1982) found no significant differences in σchl measured on LL-grown and HL-grown cells. Moreover, Klughammer and Schreiber (2015) found that σPSII (625 nm) nonlinearly increases with increasing light, and then it decreases nonlinearly at high light intensities, but the decrease in σPSII (625 nm) with light intensity depends on the value of Jp (where Jp is a parameter characterizing the energetic connectivity between PSII units; see Stirbet, 2013). For instance, Klughammer and Schreiber (2015) reported that σPSII (625 nm) nonlinearly increases with I beyond 2,000 μmol photons m−2 s−1 for Jp = 2. This obviously contradicts our common sense expectation, since photoinhibition would occur in most dilute suspensions of Chlorella exposed to high light intensities of over 2,000 μmol photons m−2 s−1.
We emphasize that our results have been derived from instantaneous measurement of ETR–I curves of plants and one cyanobacterium; thus, some differences between σchl obtained by Ley and Mauzerall (1982) and by Suggett et al. (2007) and σ′ik may result from the different growth irradiance conditions. Compared to the complex methods and techniques required for obtaining parameters such as σPSII, σchl, and aL*(λ) in Ley and Mauzerall (1982); Suggett et al. (2007); De Boni et al. (2007); Klughammer and Schreiber (2015), and Celebi-Ergin et al. (2022), we can easily determine the values of σ′ik by Eq. 6 for any given species under any environmental condition. In addition, it should be noted that due to Eq. 1 being a non-asymptotic function, it possesses a first derivative. According to the principles of calculus, when the first derivative of Eq. 1 equals zero, Isat and its corresponding ETRmax can be calculated using Eqs. (4) and (3), respectively. However, it is only when the selected model perfectly fits the ETR–I curve that the fitted values will match the observed values. Empirical models such as the single exponential model, double exponential model, non-rectangular hyperbolic model, and Suggett et al.’s semi-mechanistic model are asymptotic and cannot accurately fit the ETR–I curve when plants or algae experience dynamic downregulation of PSII/photoinhibition (Platt et al., 1980; Suggett et al., 2007; Brading et al., 2011; Yang et al., 2023). As a result, obtaining ETRmax and Isat becomes challenging, let alone other parameters reflecting the intrinsic characteristics of photosynthetic pigment molecules (such as σik, σ′ik, τmin, and Nk). Although the double exponential model can be used to fit the ETR–I curve of algae, it needs to be coupled with modified exponential model to derive ETRmax and Isat, and the obtained ETRmax and Isat values are significantly higher than the measured values (Maxwell and Johnson, 2000; Brading et al., 2011; Buckley and Diaz-Espejo, 2015). On the other hand, the YRS method not only effectively fits the ETR response curves of plants and algae to light but also shows no significant difference between the fitted ETRmax and Isat values and the observation values (Liang et al., 2018; Yang et al., 2018; Furutani et al., 2022). In this study, the results obtained using the YRS model for fitting also exhibit no significant difference from the observation values, further demonstrating the applicability and reliability of this model.
Furthermore, the reason why σ′ik decreases with light intensity in our study, in addition to the characteristics of harvesting pigment molecule itself (e.g., change in σik, ξ1, ξ2, ξ3, gi, and gk), may be due to the photo-relocation movement of chloroplasts to anticlinal cell walls (i.e., negative blue/UV-A light-dependent chloroplast phototaxis) where light absorption is reduced (Kasahara et al., 2002; Lazár et al., 2022), presumably to minimize the saturation of photosynthesis by decreasing the amount of excess excitation energy (Murchie and Niyogi, 2011). Such observations may help to investigate the underlying nature of plants’ photoprotection mechanism under high light intensity (Murchie and Niyogi, 2011), since decreases in σ′ik with light intensity would prevent the pigment molecules from absorbing light energy further, and could thus provide us a means to quantitatively investigate the photoinhibition and photoprotection in photosynthetic organisms.
Although different fluorescence and O2 evolution methods, such as the specific O2 evolution technique (Ley and Mauzerall, 1982; Celebi-Ergin et al., 2022), WLCZ-scan technique (De Boni et al., 2007), and FRR technique (Suggett et al., 2007), may estimate the light absorption of chlorophyll pigments, these methods have the disadvantage to be technically challenging. Moreover, they use only dilute suspensions of cells, which is why these methods have not been widely applied for the σchl evaluation. On the other hand, while the MC-PAM technique (Klughammer and Schreiber, 2015) can be used not only for dense suspensions of unicellular algae, but also for optically more complex samples (like leaves and corals), there still remains a difficulty in determining σchl, due to the complexity of their methods used for data processing. In contrast with the above approaches, combined commercial portable gas-exchange and fluorescence systems (e.g., LI-6400, Li-Cor Inc., Lincoln, Nebraska, USA; CIRAS-II, PP Systems, Hitchin, UK; LCA4 ADC-Biosciences, Hoddesdon, UK; Dual-PAM-100, Walz Inc., Germany), the values of σik can be obtained easily by using the YPS method presented here for any plant species, algae, and cyanobacteria, under diverse environmental conditions, once their chlorophyll content is measured. Therefore, our method has a greater advantage over the methods and techniques in determining the values of σik (see Eq. 5).
In conclusion, (1) the mechanistic model, used in this research, has universality in fitting ETR−I curves and in estimating photosynthetic parameters such as ETRmax, Isat, σik, and σ′ik; (2) compared with other methods, estimating σchl, σPSII(λ), or aL*(λ), our method is much more convenient in determining σik and σ′ik than those used by other authors (Ley and Mauzerall, 1982; De Boni et al., 2007; Suggett et al., 2007; Klughammer and Schreiber, 2015; Celebi-Ergin et al., 2022); (3) Eqs. 5 and 6 can be used to investigate the effects of different environmental factors (e.g., CO2, O2, O3, NO2, temperature, and nutrition) on σik and σ′ik, respectively. We conclude that Eq. 1 (see above for the description of the YRS method) provides a powerful means to predict and simulate the ETR−I curves, and to obtain several important parameters such as ETRmax, Isat, σik, and σ′ik. Furthermore, the latter can be used to investigate light energy absorption properties of photosynthetic pigment molecules and to understand how plants, algae, and cyanobacteria modify their light-harvesting properties underlying photo-acclimation, photoprotection, and abiotic stress. Dynamic changes of σ′ik in response to light indicate that these pigment–protein complexes are used by the photosynthetic organisms, not only as antennae capturing light energy, but also to serve an important role in light energy partitioning and dissipation. Thus, we recommend the use of the YRS method to calculate the values of σik and σ′ik to investigate light energy absorption properties of photosynthetic pigment molecules for all plants, algae, and cyanobacteria under any environmental condition. We are planning further studies (i) for evaluating the performance of Eq. 1 when applied to observations on different photosynthesizing organisms under extreme environmental conditions; (ii) for estimating σik and σ′ik when the samples, under investigation, are concurrently stressed by various environmental factors, including, e.g., low or high temperatures, different CO2, O2, O3, and NO2 concentrations, water stress, or salt stress; and (iii) for comparison of σik and σ′ik among different functional groups of plants, cyanobacteria, and algae, to better understand evolutionary mechanisms of adaptation in photosynthetic organisms to different environmental conditions.
In order to facilitate others to utilize our developed mechanistic model of ETR−I, we have developed and exploited PMSS (http://photosynthetic.sinaapp.com). Using measured ETR−I data and combining it with measurements on chlorophyll content (mg m−2), many characteristics, associated with light energy absorption of chlorophyll molecules, can be obtained with this software.
Data availability statement
The original contributions presented in the study are included in the article/Supplementary Material. Further inquiries can be directed to the corresponding authors.
Author contributions
All authors contributed to the conception of the work. Z-PY and X-LY mainly fitted the data. Z-PY and F-BW drafted the original manuscript. All authors critically reviewed and revised the manuscript with new data sets and contributed substantially to the completion of the present study. All authors contributed to the article and approved the submitted version.
Funding
This research was supported by the Natural Science Foundation of China (Grant Nos. 32260063 and 31960054).
Acknowledgments
We are highly thankful to Professor Govindjee, who recently turned 90, for reading this paper and for making valuable suggestions for language improvement; furthermore, we celebrate, through this paper, his outstanding contributions, since 1960, in relating chlorophyll a fluorescence changes to various photosynthetic reactions.
Conflict of interest
The authors declare that the research was conducted in the absence of any commercial or financial relationships that could be construed as a potential conflict of interest.
Publisher’s note
All claims expressed in this article are solely those of the authors and do not necessarily represent those of their affiliated organizations, or those of the publisher, the editors and the reviewers. Any product that may be evaluated in this article, or claim that may be made by its manufacturer, is not guaranteed or endorsed by the publisher.
Supplementary material
The Supplementary Material for this article can be found online at: https://www.frontiersin.org/articles/10.3389/fpls.2023.1234462/full#supplementary-material
References
Ahammed, G. J., Xu, W., Liu, A., Chen, S. (2018). COMT1 silencing aggravates heat stress-induced reduction in photosynthesis by decreasing chlorophyll content, photosystem II activity and electron transport efficiency in tomato. Front. Plant Sci. 9. doi: 10.3389/fpls.2018.00998
Baker, N. R. (2008). Chlorophyll fluorescence: A probe of photosynthesis in vivo. Annu. Rev. Plant Biol. 59, 89–113. doi: 10.1146/annurev.arplant.59.032607.092759
Bixon, M., Jortner, J., Michel-Beyerle, M. E. (1991). On the primary charge separation in bacterial photosynthesis. BBA–Bioenergetics 1056, 301–315. doi: 10.1016/S0005-2728(05)80062-3
Brading, P., Warner, M. E., Davey, P., Smith, D. J., Achterberg, E. P., Suggett, D. J. (2011). Differential effects of ocean acidification on growth and photosynthesis among phylotypes of Symbiodinium (Dinophyceae). Limnol. Oceanogr. 56, 927–938. doi: 10.4319/lo.2011.56.3.0927
Buckley, T. N., Diaz-Espejo, A. (2015). Reporting estimates of maximum potential electron transport rate. New Phytol. 205, 14–17. doi: 10.1111/nph.13018
Celebi-Ergin, B., Zimmerman, R. C., Hill, V. J. (2022). Photorespiration in eelgrass (Zostera marina L.): A photoprotection mechanism for survival in a CO2-limited world. Front. Plant Sci. 13. doi: 10.3389/fpls.2022.1025416
De Boni, L., Correa, D. S., Pavinatto, F. J., dos Santos, D. S., Mendonça, C. R. (2007). Excited state absorption spectrum of chlorophyll a obtained with white-light continuum. J. Chem. Phys. 126, 165102. doi: 10.1063/1.2722755
Furutani, R., Ohnishi, M., Mori, Y., Wada, S., Miyake, C. (2022). The difficulty of estimating the electron transport rate at photosystem I. J. Plant Res. 135, 565–577. doi: 10.1007/s10265-021-01357-6
Govindjee, G. (1990). Photosystem II heterogeneity: the acceptor side. Photosyn. Res. 25, 151–160. doi: 10.1007/BF00033157
Govindjee, G. (2004). Chlorophyll a fluorescence: A bit of basics and history. In: G. Papageorgiou and G. Govindjee (Eds) Chlorophyll a Fluorescence: A Signature of Photosynthesis. Kluwer Academic (now. Springer) Dordrecht Netherlands. pp, 2–42. doi: 10.1007/978-1-4020-3218-91
Grayson, K. J., Faries, K. M., Huang, X., Qian, P., Dilbeck, P., Martin, E. C., et al. (2017). Augmenting light coverage for photosynthesis through YFP-enhanced charge separation at the Rhodobacter sphaeroides reaction centre. Nat. Commun. 8, 13972. doi: 10.1038/ncomms13972
Hashemi, Z., Leppert, L. (2021). Assessment of the ab initio Bethe-Salpeter equation approach for the low-lying excitation energies of bacteriochlorophylls and chlorophylls. J. Phys. Chem. A. 125, 2163–2172. doi: 10.1021/acs.jpca.1c01240
He, Y. L., Wu, Y., Ye, Z. P., Zhou, S. X., Ye, S. C., Liu, W. X. (2022). Response of intrinsic characteristics of light-harvesting pigment molecules, light use efficiency to light intensity for oil-tea (Camellia oleifera). Acta Bot. Boreal. Occident. Sin. 42, 1552–1560. doi: 10.7606/j.issn.1000-4025.2022.09.1552
Hu, W. H., Xiao, Y. A., Yan, X. H., Ye, Z. P., Zeng, J. J., Li, X. H. (2021). Photoprotective mechanisms under low temperature and high light stress of Photinia × fraseriand Osmanthus fragrans during overwintering. Bull. Bot. Res. 41, 938–946. doi: 10.7525/j.issn1673-5102.2021.06.012
Kasahara, M., Kagawa, T., Oikawa, K., Suetsugu, N., Miyao, M., Wada, M. (2002). Chloroplast avoidance movement reduces photodamage in plant. Nature 420, 829–832. doi: 10.1038/nature01213
Klughammer, C., Schreiber, U. (2015). Apparent PS II absorption cross-section and estimation of mean PAR in optically thin and dense suspensions of Chlorella. Photosyn. Res. 123, 77–92. doi: 10.1007/s11120-014-0040-6
Lazár, D., Stirbet, A., Björn, L. O., Govindjee, G. (2022). Light quality, oxygenic photosynthesis and more. Photosynthetica 60, 25–58. doi: 10.32615/ps.2021.055
Ley, A. C., Mauzerall, D. C. (1982). Absolute absorption cross-sections for photosystem II and the minimum quantum requirement for photosynthesis in Chlorella vulgaris. BBA-Bioenergetics 680, 95–106. doi: 10.1016/0005-2728(82)90320-6
Liang, Z. R., Liu, F. L., Yuan, Y. M., Du, X. X., Wang, W. J., Sun, X. T., et al. (2018). Effect of different temperatures on growth and photosynthetic characteristic of Laminaria hyperborea young seedling. Mar. Sci. 42, 71–78. doi: 10.11759/hykx20171121003
Mar, T., Govindjee, G. (1972). Kinetic models of oxygen evolution in photosynthesis. J. Theor. Biol. 36, 427–446. doi: 10.1016/0022-5193(72)90001-X
Maxwell, K., Johnson, N. G. (2000). Chlorophyll fluorescence-a practical guide. J. Exp. Bot. 51, 659–668. doi: 10.1093/jxb/51.345.659
Mishra, K. B., Mishra, A., Kubásek, J., Otmar, U. O., Heyer, A. G., Govindjee, G. (2019). Low temperature induced modulation of photosynthetic induction in non-acclimated and cold-acclimated Arabidopsis thaliana: chlorophyll a fluorescence and gas-exchange measurements. Photosyn. Res. 139, 123–143. doi: 10.1007/s11120-018-0588-7
Morfopoulos, C., Sperlich, D., Peñuelas, J., Filella, I., Llusià, J., Medlyn, B. E., et al. (2014). A model of plant isoprene emission based on available reducing power captures responses to atmospheric CO2. New Phytol. 203, 125–139. doi: 10.1111/nph.12770
Murchie, E. H., Niyogi, K. K. (2011). Manipulation of photoprotection to improve plant photosynthesis. Plant Physiol. 155, 86–92. doi: 10.1104/pp.110.168831
Neale, P. J., Melis, A. (2010). Algal photosynthetic membrane complexes and the photosynthesis-irradiance curve: a comparison of light-adaptation responses in Chlamydomonas reinhardtii (Chlorophyta). J. Phycol. 22, 531–538. doi: 10.1111/j.1529-8817.1986.tb02497.x
Platt, T., Gallegos, C. L., Harrison, W. G. (1980). Photoinhibition of photosynthesis in natural assemblages of marine phytoplankton. J. Mar. Res. 38, 687–701. doi: 10.1093/pasj/57.2.341
Robakowski, P., Łukowski, A., Ye, Z. P., Kryszewski, A., Kowalkowski, W. (2022). Northern provenances of silver fir differ with acclimation to contrasting light regimes. Forests 13, 1164. doi: 10.3390/f13081164
Robakowski, P., Pers-Kamczyc, E., Ratajczak, E., Thomas, P. A., Ye, Z. P., Rabska, M., et al. (2018). Photochemistry and antioxidative capacity of female and male Taxus baccata L. acclimated to different nutritional environments. Front. Plant Sci. 9. doi: 10.3389/fpls.2018.00742
Serôdio, J., Ezequiel, J., Frommlet, J., Laviale, M., Lavaud, J. (2013). A method for the rapid generation of nonsequential light-response curves of chlorophyll fluorescence. Plant Physiol. 163, 1089–1102. doi: 10.1104/pp.113.225243
Stirbet, A. (2013). Excitonic connectivity between photosystem II units; what is it, and how to measure it? Photosyn. Res. 116, 189–214. doi: 10.1007/s11120-013-9863-9
Stirbet, A., Govindjee, G., Strasser, B., Strasser, R. (1998). Chlorophyll a fluorescence induction in higher plants: modelling and numerical simulation. J. Theor. Biol. 193, 131–151. doi: 10.1006/jtbi.1998.0692
Stirbet, A., Lazár, D., Guo, Y., Govindjee, G. (2020). Photosynthesis: basics, history, and modeling. Ann. Bot-London 126, 511–537. doi: 10.1093/aob/mcz171
Stirbet, A., Lazár, D., Papageorgiou, G. C., Govindjee, G. (2019). Chlorophyll a fluorescence in cyanobacteria: relation to photosynthesis. Cyanobacteria. pp, 79–130. doi: 10.1016/B978-0-12-814667-5.00005-2
Suggett, D. J., Le Floc, E., Harris, G. N., Leonardos, N., Geider, R. J. (2007). Different strategies of photoacclimation by two strains of Emiliania huxleyi (Haptophyta). J. Phycol. 43, 1209–1222. doi: 10.1111/j.1529-8817.2007.00406.x
Sun, J., Sun, J., Feng, Z. (2015). Modelling photosynthesis in flag leaves of winter wheat (Triticum aestivum) considering the variation in photosynthesis parameters during development. Funct. Plant Biol. 42, 1036–1044. doi: 10.1071/FP15140
Walters, R. G. (2005). Towards an understanding of photosynthetic acclimation. J. Exp. Bot. 56, 435–447. doi: 10.1093/jxb/eri060
Wang, H., Su, L., Allen, J. P., Williams, J., Blankert, S., Laser, C., et al. (2007). Protein dynamics control the kinetics of initial electron transfer in photosynthesis. Science 316, 747–750. doi: 10.1126/science.1140030
Wang, X., Yang, X. L., Ye, Z. P., Lu, Y. T., Ma, X. F. (2022). Stomatal and non-stomatal limitations to photosynthesis in Sorghum bicolor at different temperatures. Plant Physiol. J. 58, 1245–1253. doi: 10.13592/j.cnki.ppj.2021.0403
Yang, X. L., Dong, W., Liu, L. H., Bi, Y. H., Xu, W. Y., Wang, X. (2023). Uncovering the differential growth of Microcystis aeruginosa cultivated under nitrate and ammonium from a photophysiological perspective. ACS ES&T Water 3, 1161–1171. doi: 10.1021/acsestwater.2c00624
Yang, X. M., Wu, X. L., Liu, Y. F., Li, T. L., Qi, M. (2018). Analysis of chlorophyll and photosynthesis of a tomato chlorophyll-deficient mutant induced by EMS. Chin. J. Appl. Ecol. 29, 1983–1989. doi: 10.13287/j.1001-9332.201806.021
Ye, Z. P. (2012). Nonlinear optical absorption of photosynthetic pigment molecules in leaves. Photosynth. Res. 112, 31–37. doi: 10.1007/s11120-012-9730-0
Ye, Z. P., Hu, W. H., Yan, X. H., Duan, S. H. (2016). Photosynthetic characteristics of different plant species based on a mechanistic model of light-response of photosynthesis. Chin. J. Ecol. 35, 2544–2552. doi: 10.13292/j.1000-4890.201609.032
Ye, Z. P., Kang, H. J., Duan, S. H., Wang, Y. Y. (2018). Photosynthetic physio-ecological characteristics in soybean leaves at different CO2 concentrations. Chin. J. Appl. Ecol. 29, 583−591. doi: 10.13287/j.1001-9332.201802.025
Ye, Z. P., Robakowski, P., Sugget, D. J. (2013a). A mechanistic model for the light response of photosynthetic electron transport rate based on light harvesting properties of photosynthetic pigment molecules. Planta 237, 837–847. doi: 10.1007/s00425-012-1790-z
Ye, Z. P., Suggett, D. J., Robakowski, P., Kang, H. J. (2013b). A mechanistic model for the photosynthesis–light response based on the photosynthetic electron transport of photosystem II in C3 and C4 species. New Phytol. 199, 110–120. doi: 10.1111/nph.12242
Keywords: absorption cross-section, effective absorption cross-section, environmental factors, photosynthetic pigment molecules, photosynthesis
Citation: Ye Z-P, Stirbet A, An T, Robakowski P, Kang H-J, Yang X-L and Wang F-B (2023) Investigation on absorption cross-section of photosynthetic pigment molecules based on a mechanistic model of the photosynthetic electron flow-light response in C3, C4 species and cyanobacteria grown under various conditions. Front. Plant Sci. 14:1234462. doi: 10.3389/fpls.2023.1234462
Received: 04 June 2023; Accepted: 07 August 2023;
Published: 29 August 2023.
Edited by:
Qinglong Dong, Hebei Agricultural University, ChinaReviewed by:
Baris Uzilday, Ege University, TürkiyeVasily Ptushenko, Lomonosov Moscow State University, Russia
Copyright © 2023 Ye, Stirbet, An, Robakowski, Kang, Yang and Wang. This is an open-access article distributed under the terms of the Creative Commons Attribution License (CC BY). The use, distribution or reproduction in other forums is permitted, provided the original author(s) and the copyright owner(s) are credited and that the original publication in this journal is cited, in accordance with accepted academic practice. No use, distribution or reproduction is permitted which does not comply with these terms.
*Correspondence: Xiao-Long Yang, eWFuZ3hsQG50dS5lZHUuY24=; Fu-Biao Wang, d2ZiMTk4NzI4NTZAMTYzLmNvbQ==