 Aruna TS1
 Arpita Srivastava1
 Bhoopal Singh Tomar1
 Tusar Kanti Behera2
 Hari Krishna3
 Pradeep Kumar Jain4
 Renu Pandey5
 Bhupinder Singh6Ruchi Gupta7
 Manisha Mangal1*
- 1Division of Vegetable Science, Indian Agricultural Research Institute, Indian Council of Agricultural Research (ICAR), New Delhi, India
- 2Indian Council of Agricultural Research-Indian Institute of Vegetable Research (IIVR), Indian Council of Agricultural Research (ICAR), Varanasi, India
- 3Division of Genetics, Indian Agricultural Research Institute, Indian Council of Agricultural Research (ICAR), New Delhi, India
- 4National Institute of Plant Biotechnology, Indian Council of Agricultural Research (ICAR), New Delhi, India
- 5Division of Plant Physiology, Indian Agricultural Research Institute, Indian Council of Agricultural Research (ICAR), New Delhi, India
- 6Division of Environment Science, Indian Agricultural Research Institute, Indian Council of Agricultural Research (ICAR), New Delhi, India
- 7Department of Computer Sciences, Jamia Milia Islamia, New Delhi, India
High temperatures present a formidable challenge to the cultivation of hot pepper, profoundly impacting not only vegetative growth but also leading to flower and fruit abscission, thereby causing a significant reduction in yield. To unravel the intricate genetic mechanisms governing heat tolerance in hot pepper, an F2 population was developed through the crossing of two distinct genotypes exhibiting contrasting heat tolerance characteristics: DLS-161-1 (heat tolerant) and DChBL-240 (heat susceptible). The F2 population, along with the parental lines, was subjected to comprehensive phenotyping encompassing diverse morphological, physiological, and biochemical heat-related traits under high temperature conditions (with maximum temperature ranging from 31 to 46.5°C and minimum temperature from 15.4 to 30.5°C). Leveraging the Illumina Nova Seq-6000 platform, Double digest restriction-site associated DNA sequencing (ddRAD-seq) was employed to generate 67.215 Gb data, with subsequent alignment of 218.93 million processed reads against the reference genome of Capsicum annuum. Subsequent variant calling and ordering resulted in 5806 polymorphic SNP markers grouped into 12 LGs. Further QTL analysis identified 64 QTLs with LOD values ranging from 2.517 to 11.170 and explained phenotypic variance ranging from 4.05 to 19.39%. Among them, 21 QTLs, explaining more than 10% phenotypic variance, were identified as major QTLs controlling 9 morphological, 3 physiological, and 2 biochemical traits. Interestingly, several QTLs governing distinct parameters were found to be colocalized, suggesting either a profound correlation between the QTLs regulating these traits or their significant genomic proximity. In addition to the QTLs, we also identified 368380 SSR loci within the identified QTL regions, dinucleotides being the most abundant type (211,381). These findings provide valuable insights into the genetics of heat tolerance in hot peppers. The identified QTLs and SSR markers offer opportunities to develop heat-tolerant varieties, ensuring better crop performance under high-temperature conditions.
Introduction
Hot pepper is a widely cultivated vegetable crop belonging to the Solanaceae family also known as the night shade family. It was originated from the wild and weedy species Capsicum annuum var minimum indigenous to Mexico, southern Peru, and Bolivian region of Latin America (Villalon, 1981). It is a diploid species with 2n=2x=24 (X=12) and genome size of ~ 3.5 Gb, with 75 to 80% of the genome composed of repetitive elements (Saisupriya and Saidaiah, 2021). India is the largest producer, consumer and exporter of the hot pepper in the world (Chilli outlook, 2021) with a production of 4.50 million tons of green chilli from an area of 0.418 million ha with a national average productivity of 10.7 t/ha (MOAFW, 2021). The escalating carbon dioxide and other greenhouse gas emissions as a result of relentless anthropogenic and industrial activities cause serious repercussions on our planet’s climatic equilibrium. These emissions contribute to the trapping of long wave radiations reflected back from the earth’s surface in the atmosphere consequently ushering in an insidious upsurge in global temperatures. It is an unsettling reality that between 1800 and 2012, the average surface temperature of earth was increased by 0.85°C (IPCC, 2018). Projections foretell a further ascent of 1.5°C by 2040 and a staggering 2°C by 2050 (IPCC, 2021).The maximum temperature of plains and hills exceeding 40°C and 30°C respectively is considered as heat wave. As carbon emissions continue to rise, heat waves in India are expected to last 25 times longer by 2036-65 (G20 climate risk atlas, 2021). Hot pepper is cultivated both in tropical and subtropical regions of the world up to an altitude of 600 meters above mean sea level (Gopalakrishnan, 2007). The ideal temperature range for its cultivation is between 20°C and 30°C (Gopalakrishnan, 2007). High temperature is a major abiotic stress factor which significantly affects hot pepper production. Increased flower abscission is reported when the day temperature ranges from 32°C to 38°C, and crop failure in fruit setting occurs at temperatures above 40°C (Srivastava et al., 2022). Such high temperatures adversely affect the normal physiological and metabolic functions within the plants, so plants have evolved unique mechanisms to withstand high-temperature conditions. These mechanisms include traits such as leaf area, canopy temperature depression (CTD), stomatal density, pollen viability, stigma and ovary health, membrane stability, photosystem II stability, transpiration, and activity of antioxidant enzymes. However, these component traits of heat stress tolerance are dispersed among different lines and varieties, each exhibiting varying degrees of resilience. Unfortunately, many popular varieties cultivated over vast areas have been significantly affected by high-temperature conditions, resulting in substantial reduction in pepper yields. Understanding the genetic basis of pepper heat tolerance is essential for devising strategies to combat heat stress as well as for developing heat tolerant varieties. Heat tolerance is a complex phenomenon that is known to be controlled polygenically by set of genes referred as Quantitative trait loci (QTL).The identification of QTLs for heat tolerance is carried out through linkage mapping by developing the dedicated mapping populations as well as by genome wide association analysis of natural populations. Several QTLs governing heat tolerance have been identified in various crops (Jha et al., 2014). These QTLs have been subsequently transferred into the genetic background of elite varieties lacking heat tolerance resulting in heat tolerant varieties with superior agronomic performance. Though few heat-tolerant genotypes have been identified in hot pepper (Usman et al., 2014; Dahal et al., 2006; Srivastava et al., 2022), however, currently no information is available regarding the QTLs responsible for heat tolerance in hot pepper. Our group has been actively engaged in the evaluation of chilli germplasm for identification of heat tolerant genotypes and through our research efforts we have successfully identified few heat tolerant lines including DLS-161-1 (Srivastava et al, 2020; Srivastava et al, 2022). The heat tolerant line DLS-161-1 used in the present study has been registered with Indigenous Collection (IC) number IC0646850 and registration number INGR22158 with National Bureau of Plant Genetic Resources, New Delhi, India.
The objective of the present study was to dissect the genetic architecture underlying heat tolerance in hot pepper for which a biparental F2 mapping population was developed by crossing the heat tolerant (DLS-161-1) and heat susceptible (DChBL-240) genotypes which exhibit contrasting phenotypic differences for heat tolerance.
Materials and methods
Plant materials and treatment conditions
The two genotypes of hot pepper which have performed contrastingly for heat tolerance consistently for four generations (Supplementary Figure S1), were crossed using DLS-161-1 (heat tolerant) as maternal parent (P1) and DChBL-240 (heat sensitive) as a male parent (P2). The morphological, physiological, and biochemical traits of five randomly selected plants per replication were recorded for each parent and data were recorded in three replications and mean value was calculated for the parents.
F2 seeds were collected from multiple fruits of a single F1 individual and 91 F2 individuals along with both parents were sown during February, 2022 in plastic protrays (96 celled, 54 x27 cm in size) filled with perlite, coco-peat and vermiculate (1:2:1) and the seedlings were transplanted 35 days after sowing in polyhouse conditions. The maximum (day temperature) and minimum (night temperature) temperature during the crop growing period (March-July) ranged from 24 to 46.5°C and 8 to 30.5°C respectively.
Phenotyping
Both the parents and F2 individuals were evaluated under heat stress. Seeds of the test plants were sown on February, 2022. Observations were recorded on 14 morphological, 7 physiological and 4 biochemical traits under high temperature condition from April to July, 2022 during which daily maximum temperature of 31 to 46.5°C and a minimum temperature of 15.4 to 30.5°C was observed (Supplementary Figure S2).
Morphological traits
The data was recorded on morphological traits. Plant height (PH) was directly measured in centimeters (cm) using a scale, while the number of primary branches (PB) and number of fruits per plant (FPP) were counted. Traits such as average fruit length (AFL) and average fruit weight (AFW) were determined by measuring ten randomly selected fruits, with length recorded in centimeters (cm) and weight in grams (g). The number of healthy seeds per fruit (NS) was recorded from three randomly selected fruits and averaged. Electronic weighing balance was used to measure fruit yield per plant (FYP), fresh biomass weight (FBW) and 100 seed weight (HSW) which were expressed in grams (g). Leaf parameters, including leaf area (LA) in square centimeters (cm2), leaf length (LL) in centimeters (cm), leaf width (LW) in centimeters (cm), leaf perimeter (LP) in centimeters (cm), and leaf aspect ratio (AR), were recorded from the top ten leaves of each plant using WinFOLIA basic software (Regent Instruments, Inc. Canada), and the values were averaged.
Physiological parameters
The physiological traits like canopy temperature (CT) and canopy temperature depression (CTD) were measured in degrees Celsius (°C) using a handheld infrared thermometer (Fluke-62-Max). The normalized difference vegetation index (NDVI) which is dimensionless and is an indicator of ground cover and plant greenness, was recorded using a green seeker (Handheld-505). Stomatal density (SD) was measured by examining imprints of the lower leaf surface under a light microscope with Magvision Imaging tool (Magnus Opto Systems, India) and expressed as number of stomata mm-2. Pollen viability (PV) was determined as a percentage (%) using the acetocarmine test (2.5%). Membrane stability index (MSI) was measured as a percentage (%) using a conductivity meter following the procedure described by Deshmukh et al. (1991). Net photosynthetic rate (NPR) was measured using the LI-6400 portable photosynthesis system from LI-COR (Lincoln, Nebraska) on physiologically mature leaves during a sunny morning between 9 a.m. and 11 a.m. and expressed in micromoles of carbon dioxide per square meter per second (μmol CO2 m-²s-1).
Biochemical parameters
The relative chlorophyll content (RCC) of the topmost recently matured leaves was measured with CCM-200 plus chlorophyll meter (Opti-Sciences, Inc., Hudson, USA), and the activity of antioxidant enzymes such as guaiacol peroxidase (GPX), catalase (CAT), superoxide dismutase (SOD) were recorded by following the protocols of Chance and Maehly (1955); Aebi (1984) and Dhindsa et al. (1981) respectively.
Statistical analysis
The mean, range, skewness, kurtosis and frequency distribution of all the above traits were analyzed and the histograms representing frequency distribution of F2 population were derived using IBM SPSS v.26.
Correlation analysis was performed among different morphological, physiological, and biochemical traits to understand the relationships and dependencies between them under high temperature conditions and correlation matrix was plotted using metan package of R package (Olivoto and Lúcio, 2020).
Genotyping and construction of linkage maps
Genomic DNA isolation, purification, and quantification
The isolation and purification of genomic DNA of both the parents and 91 F2 individuals was carried out by following CTAB method with slight modifications (Murray and Thompson, 1980). Both Agarose gel electrophoresis (0.8%) and Nanodrop 2000 spectrophotometer (Thermo Fisher Scientific) was used to assess the quality and quantity of DNA samples. For sequencing purpose, the DNA was further purified using Qiagen DNAeasy Plant mini kit. Only DNA with A260/A280 ratio of ≥1.8 was considered good for further sequencing.
Library preparation, genotyping, variant calling and construction of linkage maps
For each sample, a total of 300 nanograms of DNA (6 μl in total, with a concentration of 50 ng/μl) was subjected to double digestion using the EcoRI-HF (rare-cutting) and MseI (frequent-cutting) enzymes (New England BioLabs, Ipswich, MA). The DNA was digested for four hours at 37°C, followed by heat deactivation of the enzymes at 65°C for 10 minutes. The resulting digested DNA fragments were ligated with the EcoRI-specific P1 adapter and the MseI-specific P2 adapter, using the T4 ligase enzyme (New England BioLabs, Ipswich, MA). The ligation reaction was performed by incubating the mixture overnight (>12 hours) at room temperature (approximately 21°C), followed by heat deactivation of the enzyme at 65°C for 10 minutes. To remove unincorporated adapters and small DNA fragments (<300 base pairs), the ligation reactions were purified using 0.8X volume of Agencourt AMPure XP SPRI magnetic beads (Beckman Coulter). A unique combination of the dual-indexed barcodes was attached to purified fragments with 14 cycles of PCR. The indexed PCR products were then pooled in equal volumes, and fragments with sizes ranging from 300 to 700 base pairs were selected using Agencourt AMPure XP SPRI magnetic beads. The final libraries were analyzed for size using a Tape Station instrument (Agilent Technologies, Santa Clara, CA) and the library concentration was determined using a Qubit™ 3 Fluorometer with the Qubit™ 1X dsDNA HS Assay Kit. The final DNA libraries were sequenced on a single lane of the Novaseq 6000 platform from Illumina® Inc., San Diego, CA, USA, using V4 sequencing chemistry.
The sequencing data was obtained in FastQ format. To ensure the quality of the raw data and remove adapter contamination, the data were processed using FAST QC and Trim Galore v0.6.2. The processed reads were aligned to the reference genome of Capsicum annum, which was downloaded from http://peppergenome.snu.ac.kr/download.php. Variant calling was performed using the GATK pipeline v3.6. The resulting variants were filtered, removing indels with vcftools v0.1.16, and only biallelic SNPs were retained. These SNPs were further filtered based on parent information and a minor allele frequency (MAF) threshold of 5%. QTL-ICIMapping v4.2.53 (Meng et al., 2015) was used to discard markers that lacked polymorphism in the progenies or failed the chi-square test (with marker segregation ratio of 1:2:1) at a significance level of P=0.01. Finally, JoinMap v4.1 was employed to map and group the markers, with a LOD threshold of 3.0. The genetic distance between the markers was estimated using the Kosambi mapping function.
QTL mapping
The identification of QTLs for different morphological, physiological and biochemical traits studied under heat stress was performed using composite interval mapping with ICIM function of QTL ICI Mapping 4.2.53 tool (Meng et al., 2015). 1000 permutations were used to determine the LOD threshold. A QTL with a LOD threshold of 2.5 was considered a significant QTL. Genetic maps for locating the QTLs were prepared by using MapChart v2.32 (Voorrips, 2002) and observations regarding QTL name, chromosome number, left and right CI (cM), left and right coordinates, LOD, PVE (%), additive effect and QTL size (Mb) were recorded.
Results
Heat tolerance in F2 population
As Heat tolerance is a complex trait and can be estimated indirectly through yield and yield contributing traits under heat-stress, therefore the phenotyping was done for twenty-five different traits governing morphological, physiological and biochemical responses of hot pepper under heat stress. A wide range of variability was recorded among the F2 population for all the studied traits (Table 1). The plant height in the F2 population ranged from 29.1 to 96.5 cm, while number of primary branches per plant varied from 3 to 19. Similarly the 91 F2 individuals produced 22 to 470 fruits per plant with a total fruit yield of 13.85 to 377.6 g. The average fruit length ranged from 4.28 to 9.32 cm and the F2 progenies produced 19.67 to 104.7 healthy seeds per fruit and fresh biomass of 38 to 977 g (Table 1 and Figure 1). The physiological traits such as canopy temperature in the population ranged from 28.90 to 38.5°C, while CTD varied from -1.90 to 6.30°C, the MSI ranged between 22.14 to 76.69%, while stomatal density and pollen viability ranged between 74.85 to 302.06 per mm2 and 40.47 to 95.46% respectively (Table 1 and Figure 2). Furthermore, the F2 individuals exhibited net photosynthetic rates of 6.45 to 27.69 μmol CO2 m-²s-1 (Table 1 and Figure 2). The activities of catalase, guaiacol peroxidase and superoxide dismutase among the F2 progenies varied between 50 to 1571.4, 34.57 to 826.88 and 111.11 to 600 U/g fresh weight respectively, while the RCC ranged from 23 to 115.6 CCI (Table 1 and Figure 3).
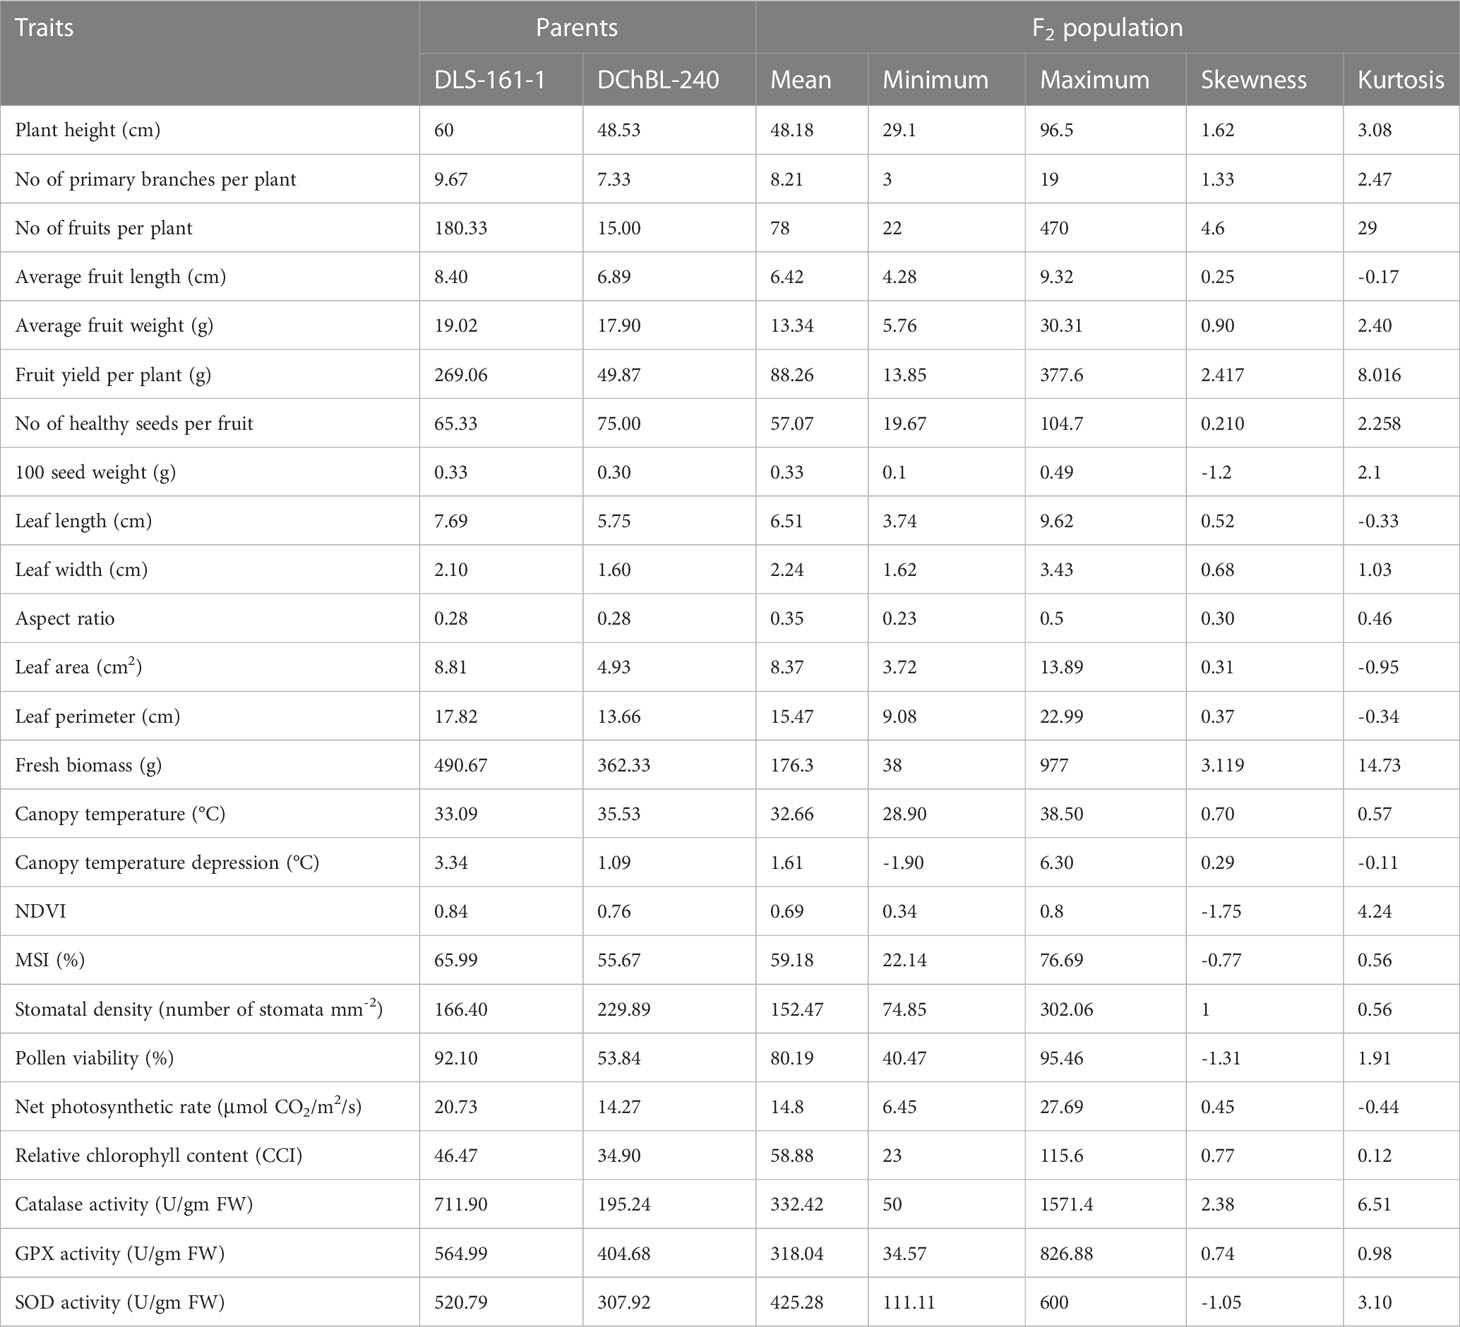
Table 1 Descriptive statistics of the two parental lines and F2 population (DLS-161-1× DChBL-240) under heat stress condition.
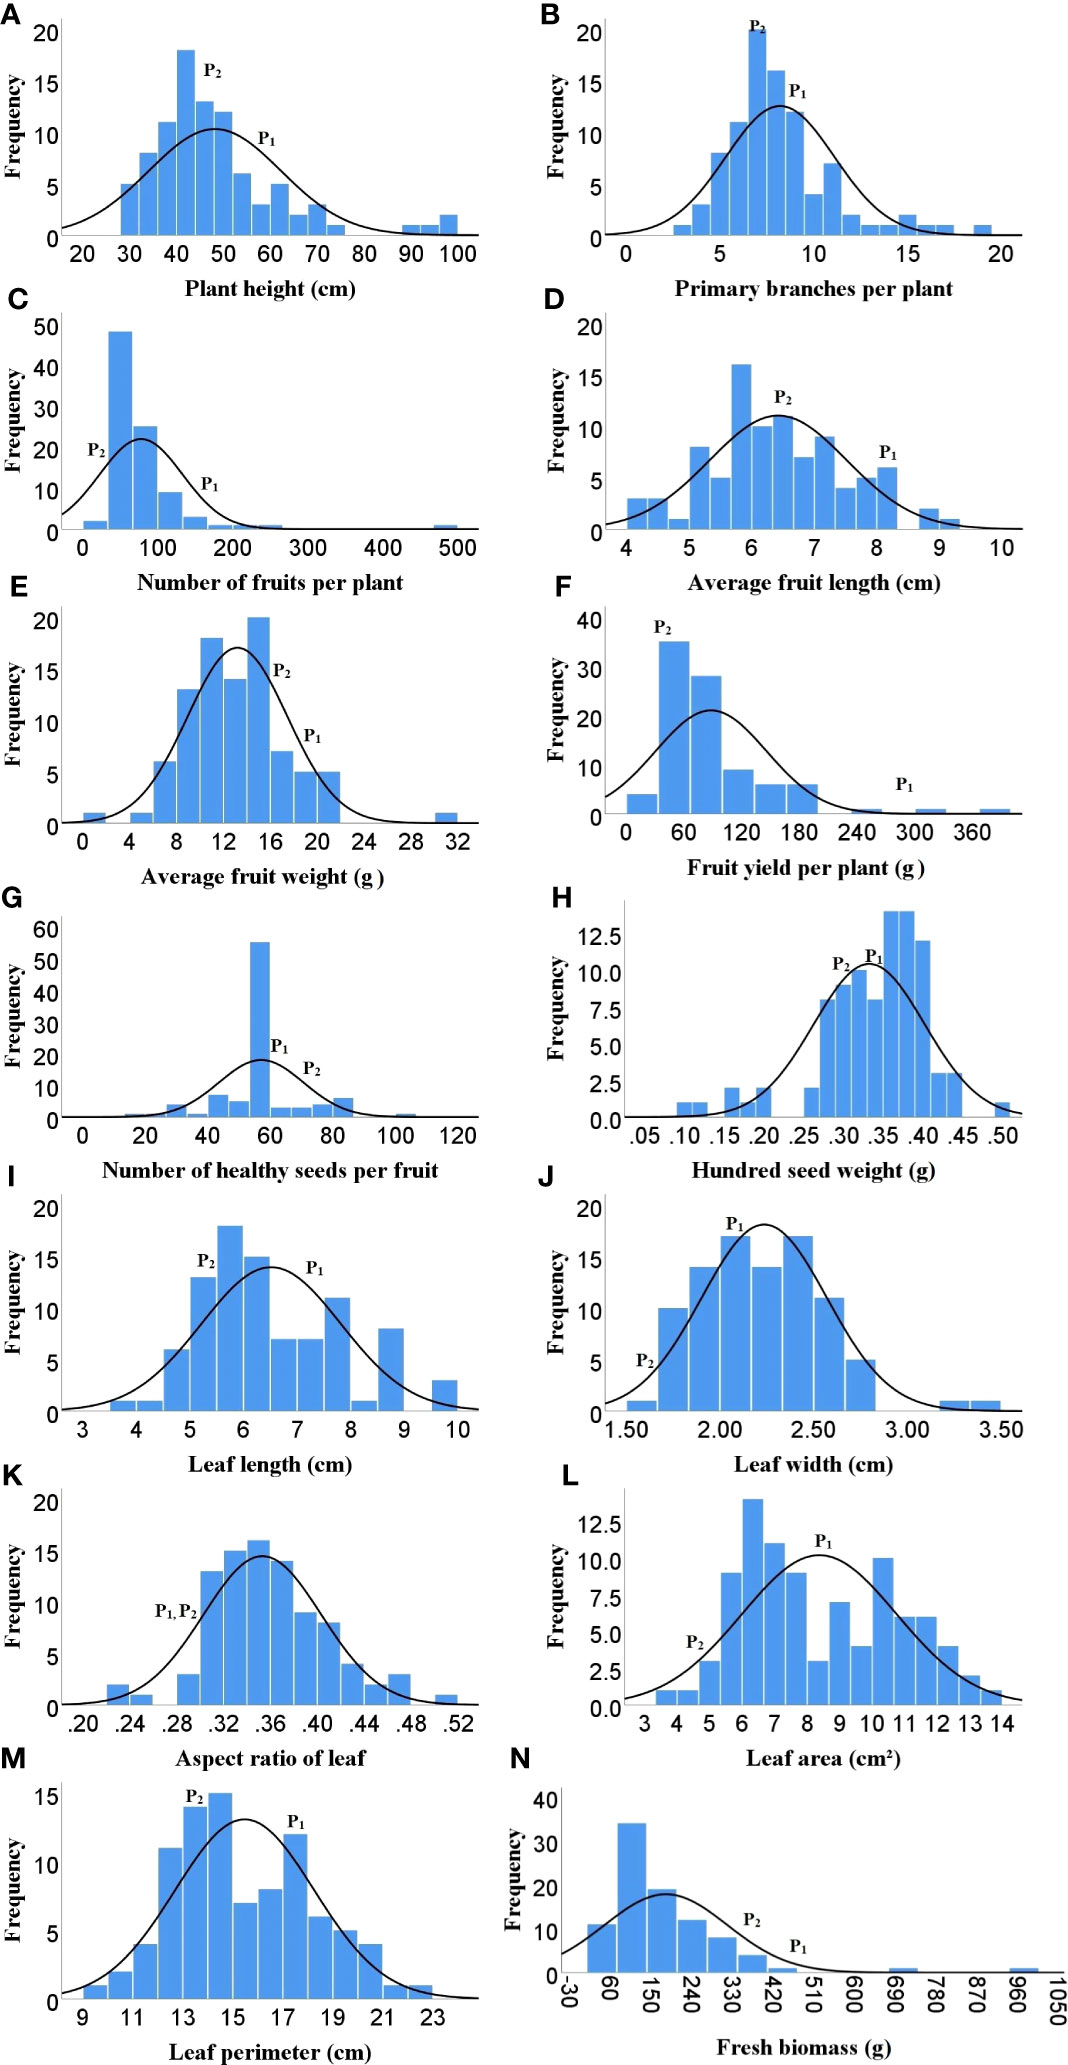
Figure 1 Frequency distribution of F2 population for different morphological traits. (A) Plant height, (B) Number of primary branches per plant. (C) Number of fruits per plant, (D) Average fruit length, (E) Avg fruit weight, (F) Fruit yield per plant, (G) Number of healthy seeds per fruit, (H) Hundred seed weight, (I) Leaf length, (J) Leaf width, (K) Aspect ratio, (L) Leaf area, (M) Leaf perimeter, (N) Fresh biomass weight, ( P1)- DLS-161-1, (P2)- DChBL-240.
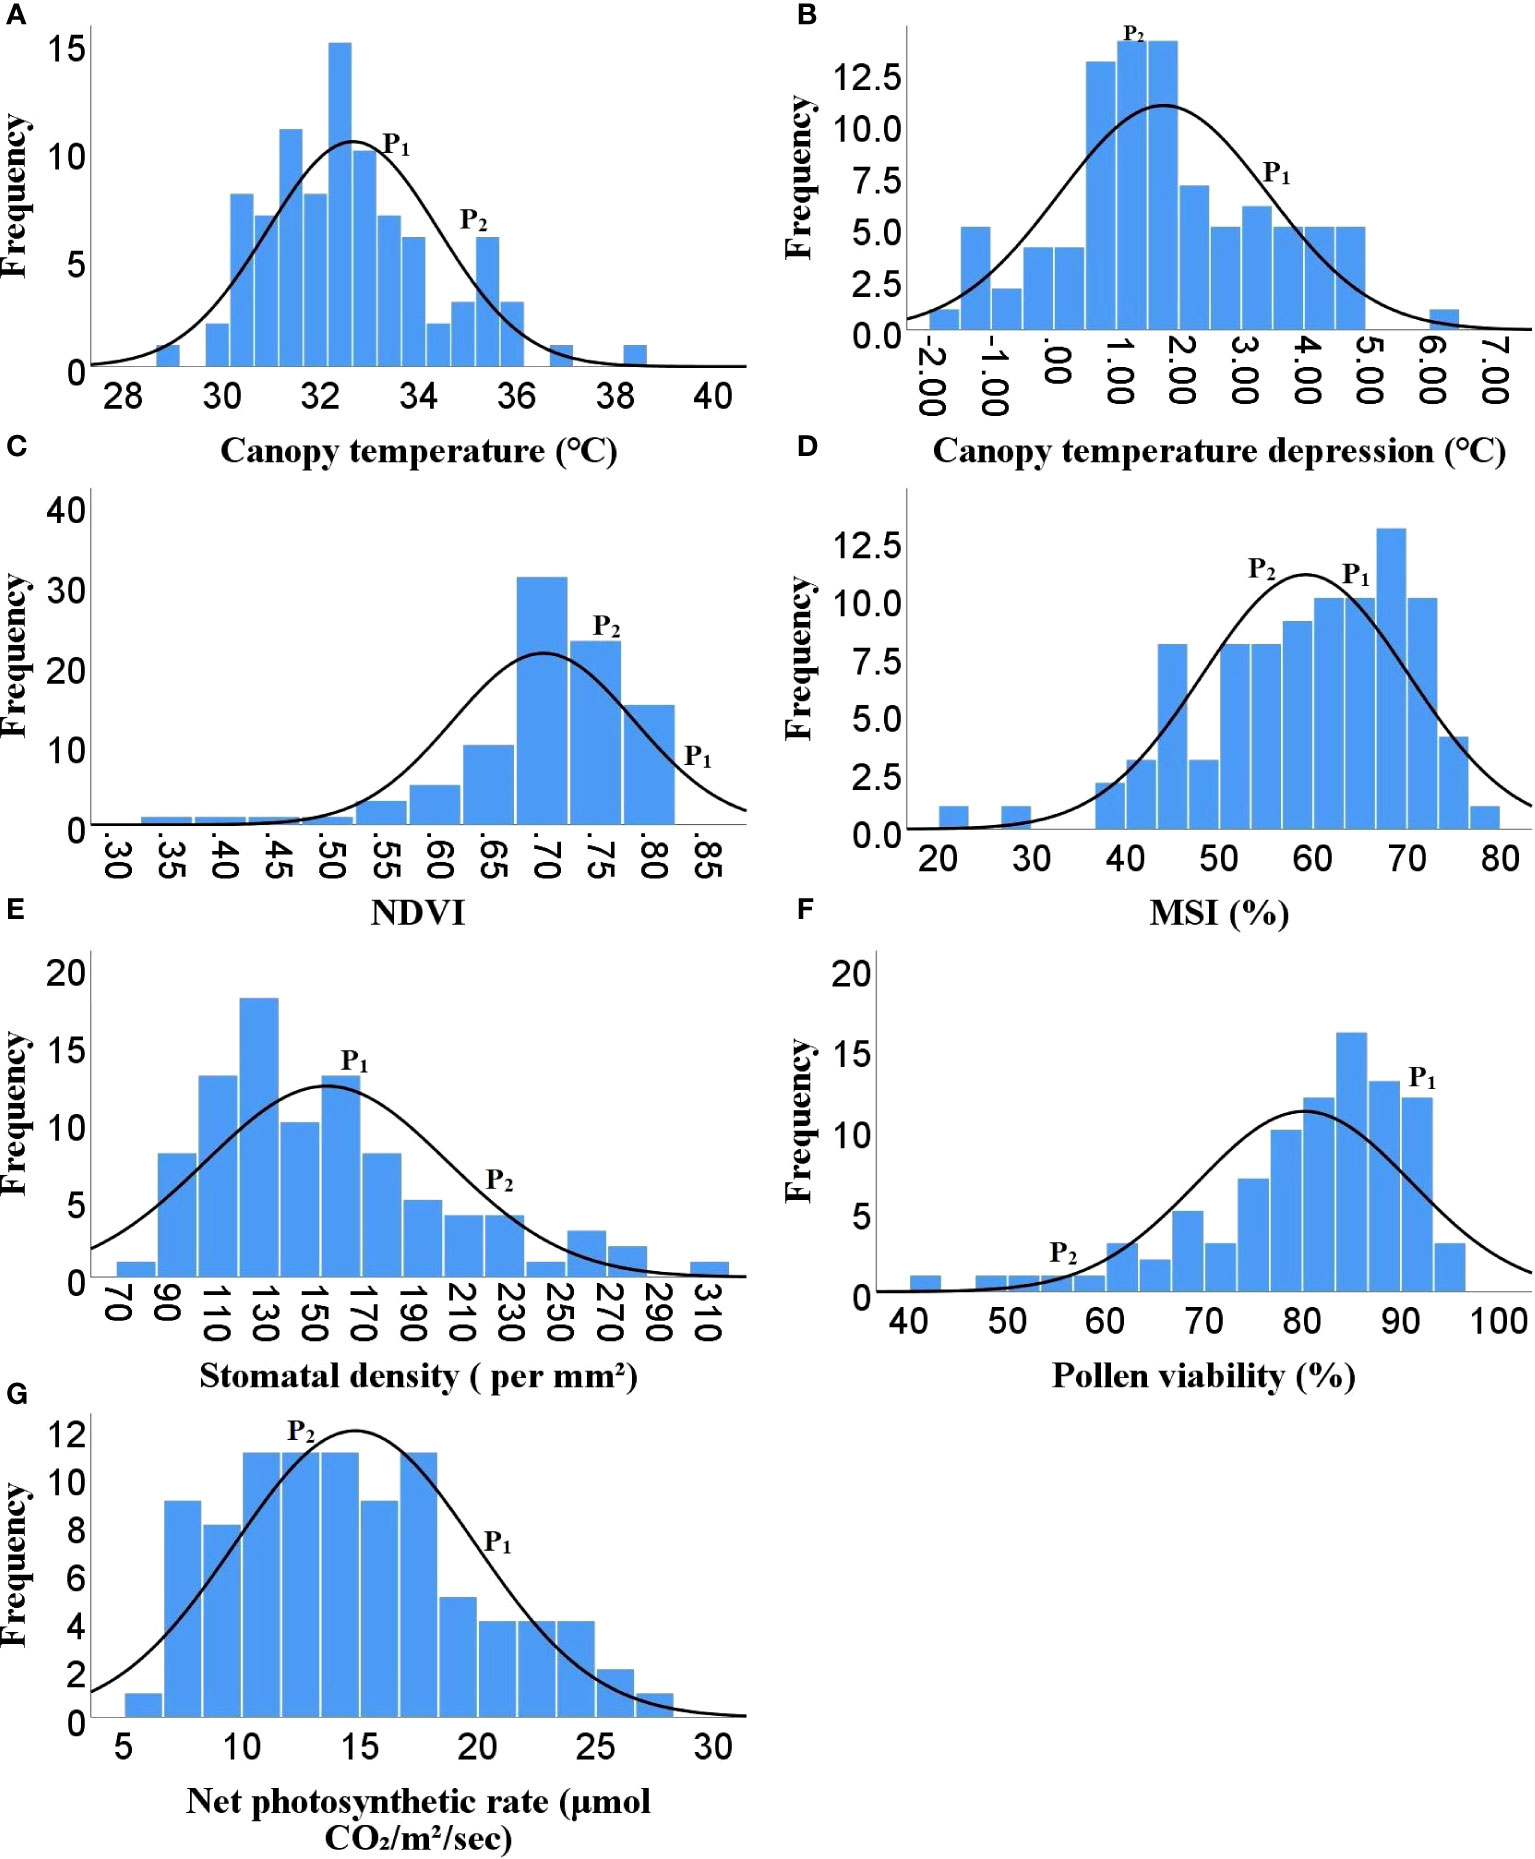
Figure 2 Frequency distribution of F2 population for different physiological traits (A) Canopy temperature, (B) Canopy temperature depression, (C) NDVI, (D) MSI, (E) Stomatal density, (F) Pollen viability, (G) Net photosynthetic rate, ( P1)- DLS-161-1, (P2) DChBL-240.
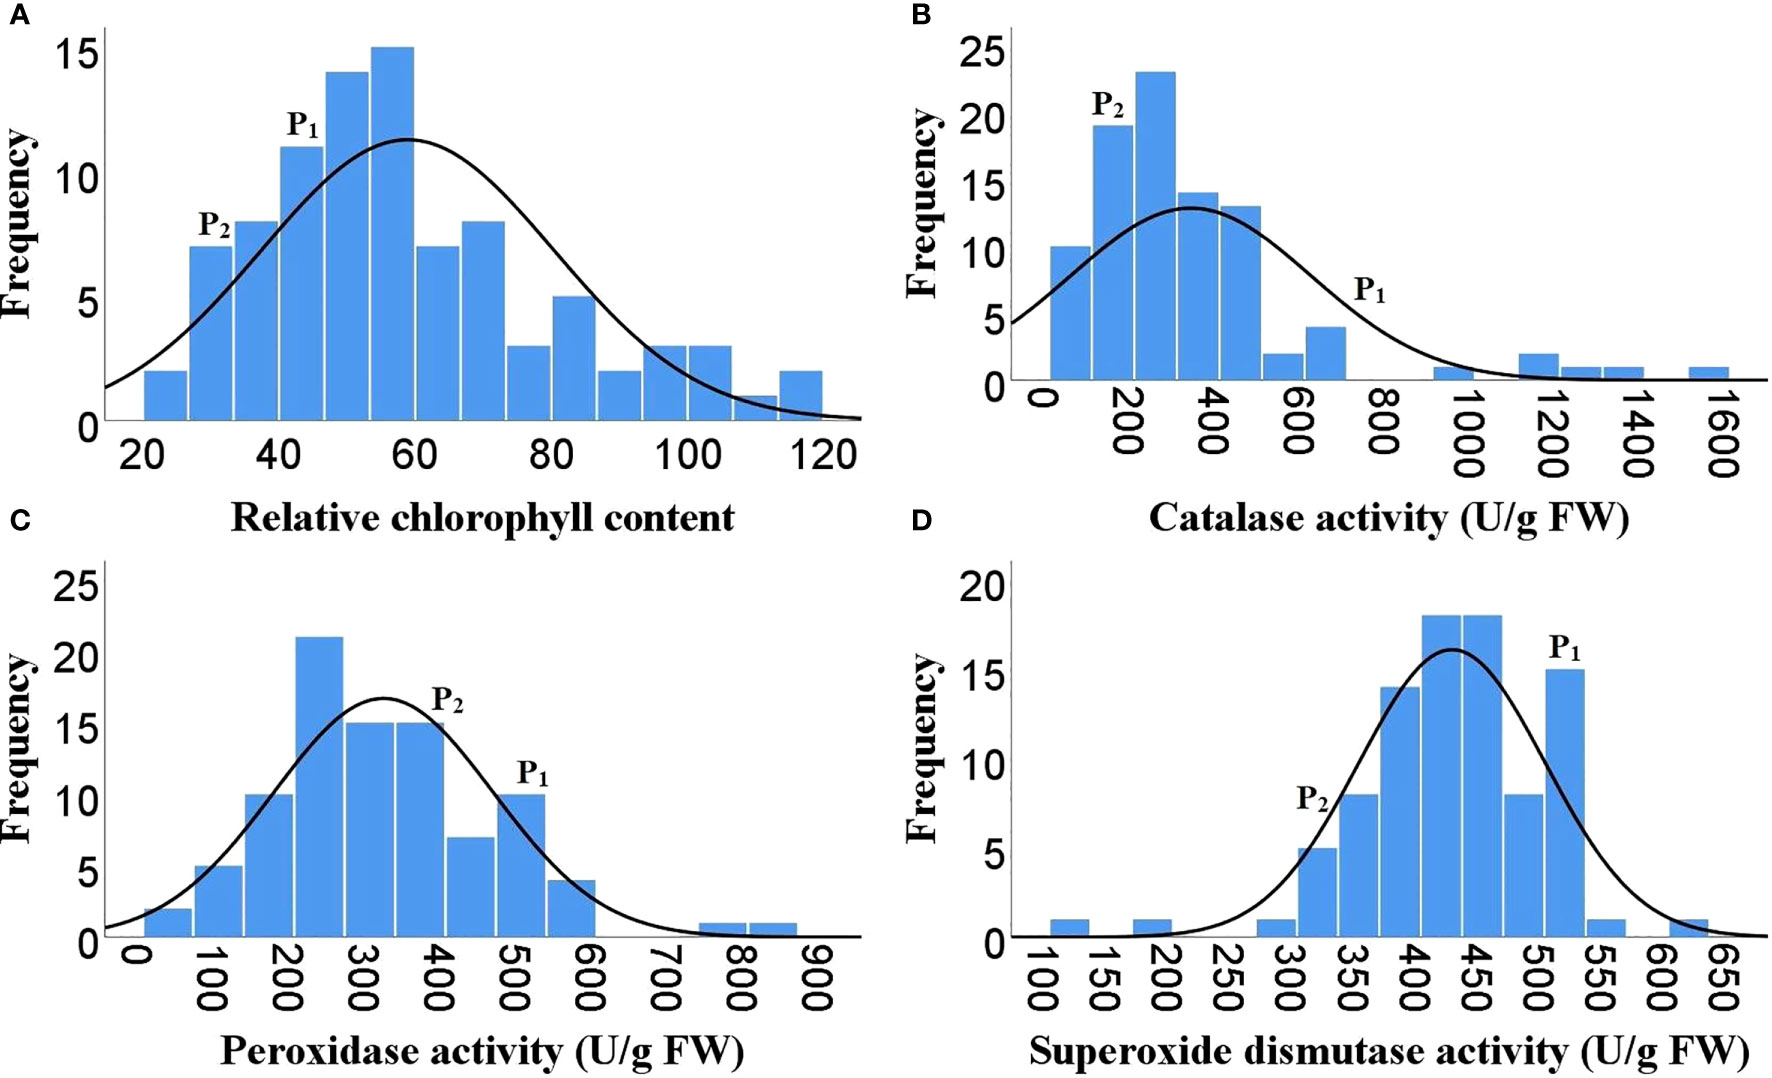
Figure 3 Frequency distribution of F2 population for different biochemical traits. (A) Relative chlorophyll content, (B) Catalase activity, (C) Guaiacol peroxidase activity, (D) Superoxide dismutase activity, ( P1)- DLS-161-1, (P2) DChBL-240.
The skewness values in the F2 population for number of fruits per plant (4.6), fruit yield per plant (2.41) and catalase activity (2.38) were positive and relatively high, as there were few plants with extreme phenotypic value (Table 1 and Figures 1, 3). Besides these the population was also positively skewed for plant height (1.62), number of primary branches per plant (1.33) as well as stomatal density (1.00), indicating that large proportion of the F2 progenies had relatively lower values for these traits (Table 1 and Figures 1, 2).The traits such as average fruit length (0.25), average fruit width (0.90), number of healthy seeds per fruit (0.21), leaf parameters (0.30-0.68), canopy temperature (0.70), canopy temperature depression (0.29), net photosynthetic rate (0.45), relative chlorophyll content (0.77) and GPX activity (0.74) were slightly positively skewed, suggesting that their distributions were close to being symmetric and distributions of the remaining traits were skewed somewhat to the left (Table 1 and Figures 1–3).
Correlation among the traits for heat tolerance
A comprehensive analysis of the morphological, physiological, and biochemical traits revealed noteworthy correlations among the variables investigated (Figure 4). Plant height exhibited a significant positive correlation with the number of fruits per plant (0.613), fruit yield per plant (0.534), hundred seed weight (0.278), NDVI (0.243), MSI (0.248). Additionally, fruit yield per plant demonstrated a strong positive association with number of fruits per plant (0.893), average fruit length (0.458), average fruit weight (0.539), number of healthy seeds per fruit (0.210), 100 seed weight (0.317), NDVI (0.339), MSI (0.229), stomatal density (0.287) and pollen viability (0.231) (Figure 4). Moreover, significant positive correlations were observed among various leaf parameters. For instance, leaf length displayed a robust positive correlation with leaf width (0.699), leaf area (0.935), and leaf perimeter (0.983), while exhibiting a negative correlation with leaf aspect ratio (-0.659) (Figure 4). In addition, both number of healthy seeds per fruit (-0.240) and 100 seed weight (-0.223) exhibited significant negative correlations with canopy temperature (Figure 4). Among the physiological traits, canopy temperature demonstrated a significant negative correlation with canopy temperature depression (-0.550) and stomatal density (-0.312), while displaying a positive correlation with GPX activity (Figure 4). Stomatal density exhibited a strong positive association with canopy temperature depression (0.288). It was also observed that MSI positively correlated with pollen viability (0.307), net photosynthetic rate (0.539), and GPX activity (0274) while RCC showed a negative correlation with canopy temperature depression (-0.246) (Figure 4). Additionally, SOD activity exhibited a positive correlation with stomatal density (0.220) (Figure 4). However, no significant correlation was observed between catalase activity and other traits examined in the present study.
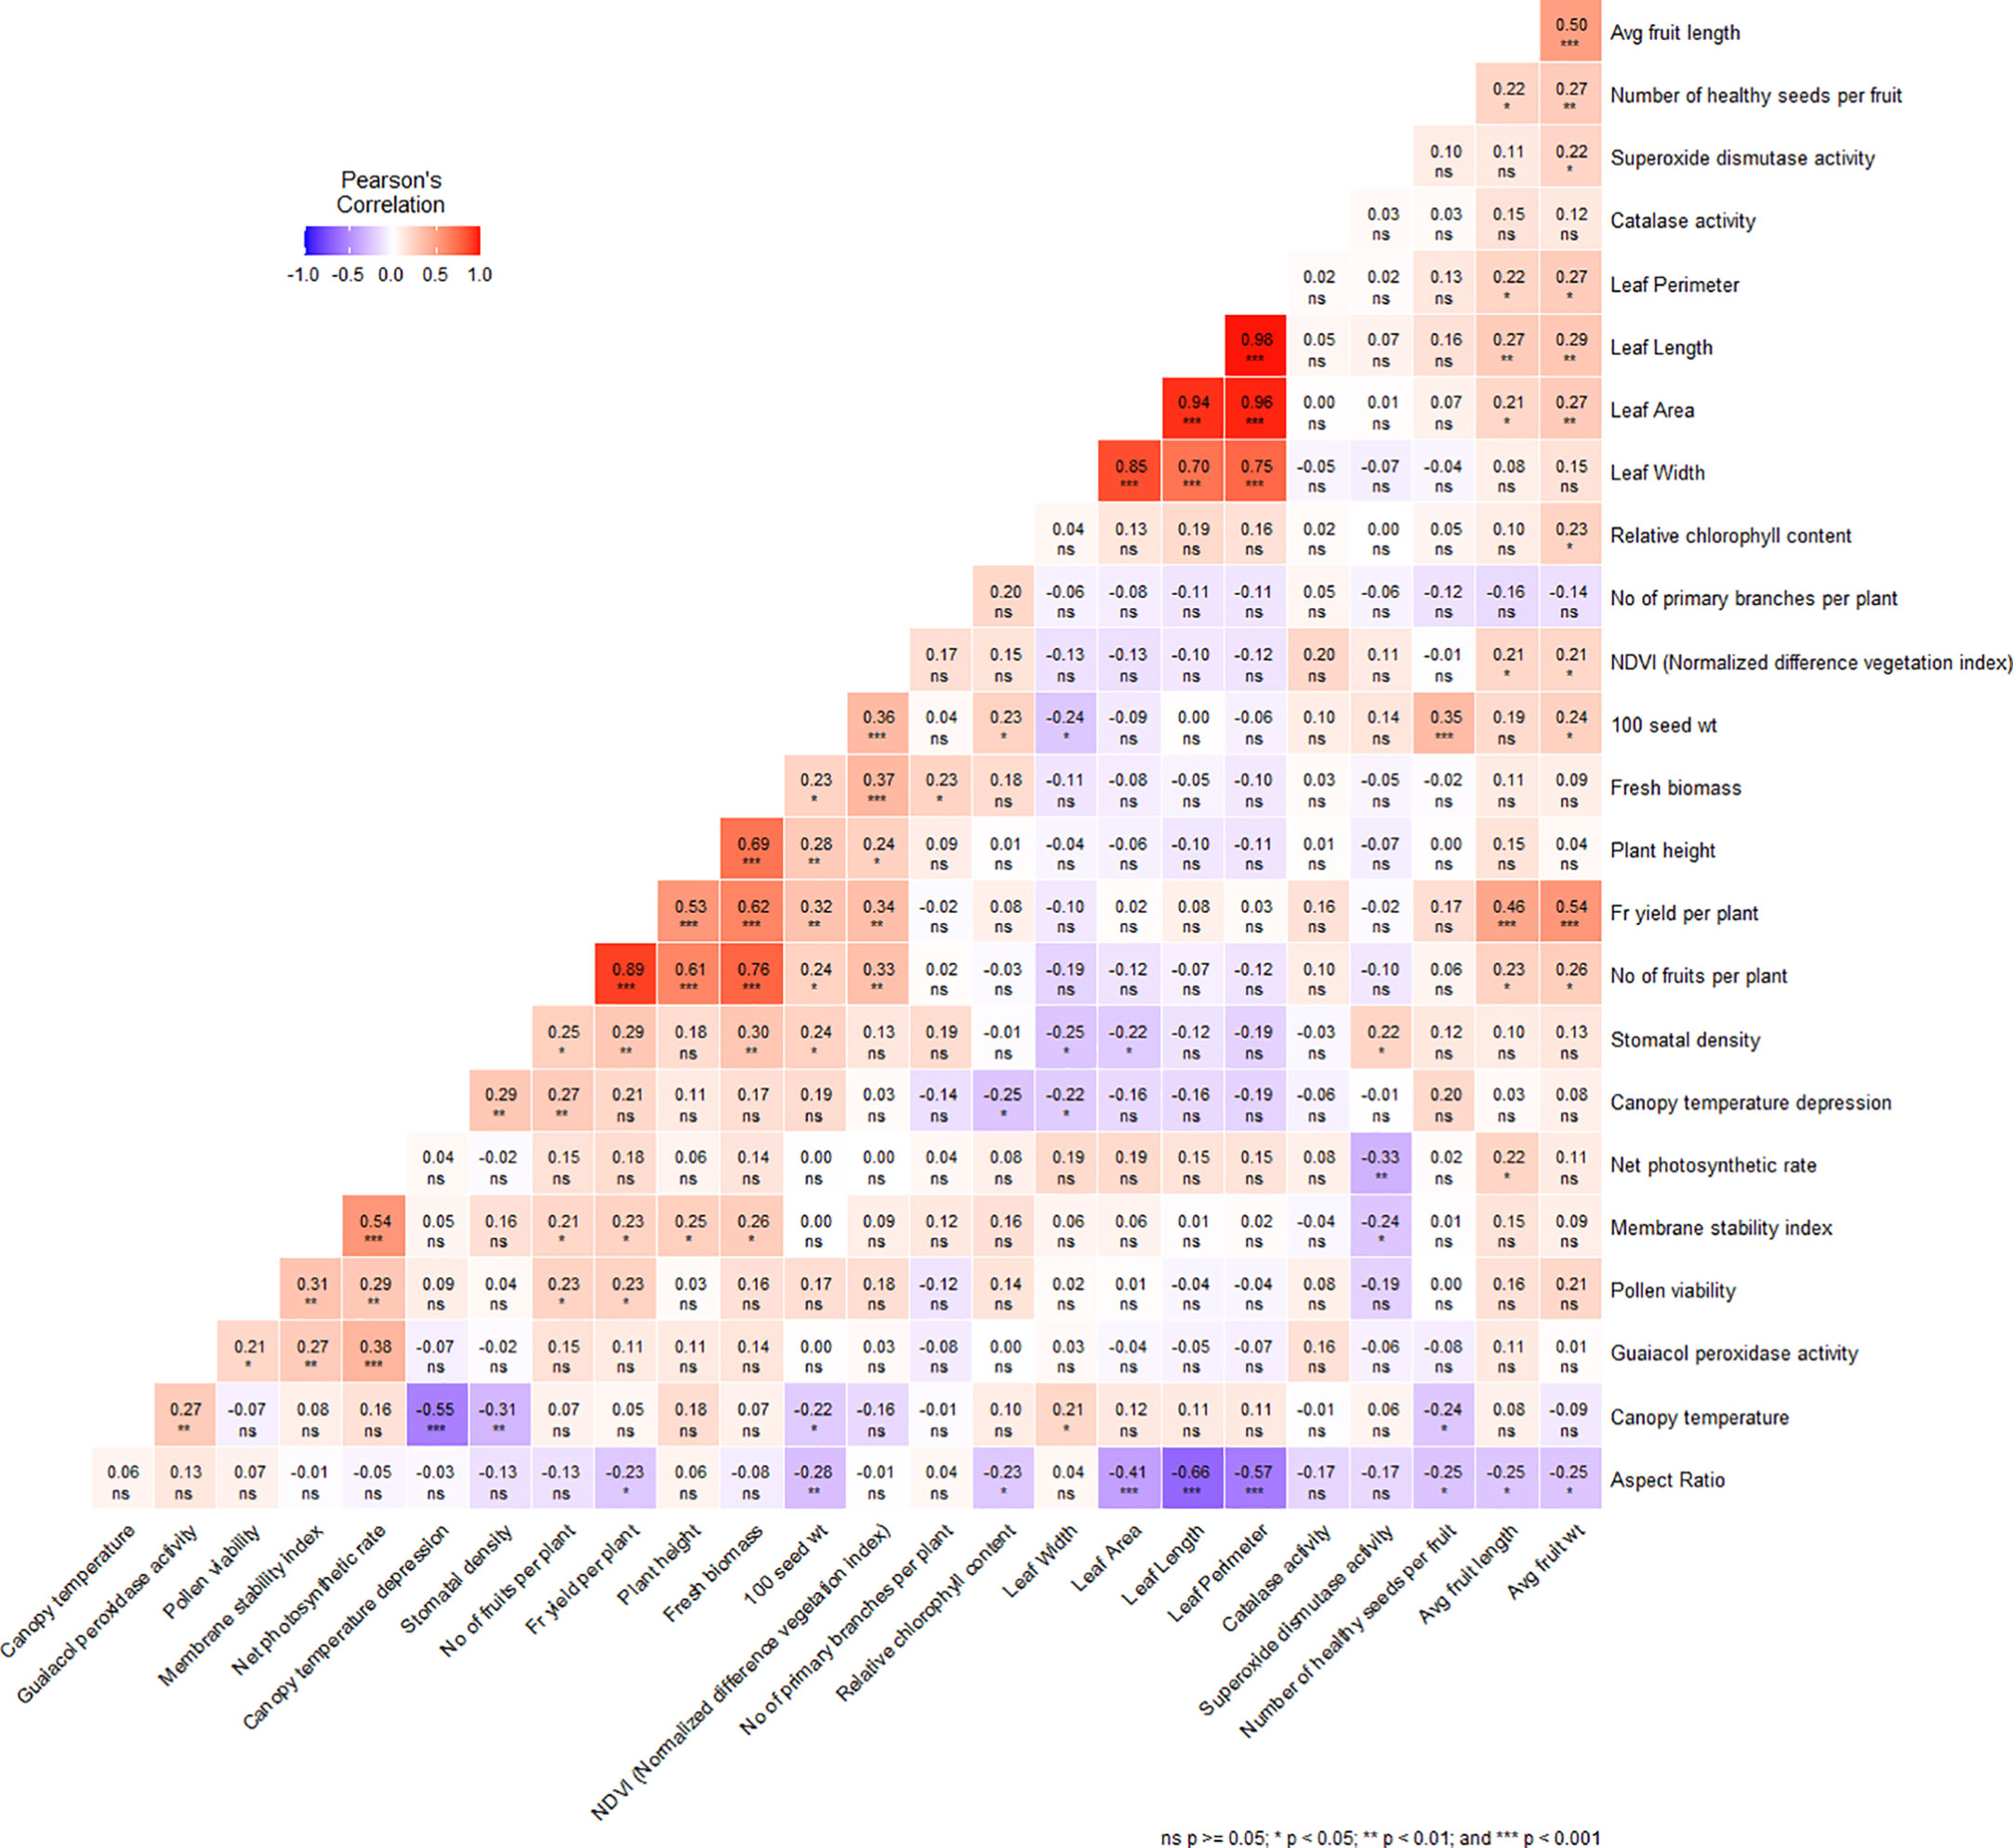
Figure 4 Correlation matrix plot showing the relationship between the different morphological, physiological and biochemical traits under heat stress condition. *, P ≥ 0.05, **, P ≥ 0.01, ***, P ≥ 0.001 level; ns, nonsignificant.
ddRAD sequencing, data processing, and linkage map construction
The paired end sequencing of 151-plex DNA libraries of both parents and F2 population generated 222.5629 million reads (67.215Gb) of data (Table 2), which was processed to remove chemical contaminants and adapters, a total of 218.93 million clean reads were retained and aligned against the pepper reference genome (Supplementary Table S1) and a mapping percent of 99.31 and 99.4% was observed for DLS-161-1 and DChBL-240 respectively while the mapping per cent ranged from 97.36 to 99.52% among the F2 progenies.
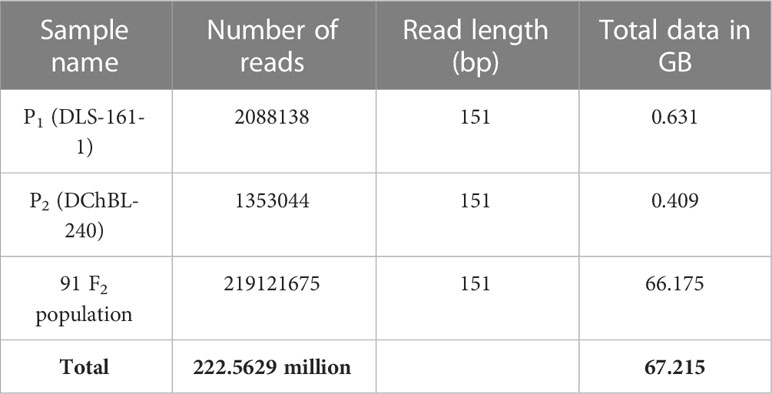
Table 2 Raw reads summary of the parental lines and F2 population.
The variant calling identified a total 41,72,807 variants, out of which 40,63,930 were SNPs and 1,08,877 were Indels. Of the total SNPs, 40,58,802 were biallelic. Parental filtering of SNPs resulted in retention of 2,59,283 SNPs, while SNP filtering especially with regard to the frequency of missing data (0.8%) and minor allele frequency (5%) retained 54,642 SNPs whose chromosome wise distribution and density plot is presented in Figures 5 (A&B). The SNPs which did not show polymorphism in progenies and did not pass chi-square test were removed and finally only 5806 SNPs markers were grouped into 12 LGs (Table 3). The genetic length of the linkage groups (LG) ranged from 157.77 cM (LG8) to 221.31 cM (LG3), spanning a total map length of 2295.272 cM, with an average marker density of 0.395 cM. Among the 12 LGs, a total of 13 gaps of ≥ 10 cM were found between the markers with the maximum number of three gaps observed on LG3 (Table 3).
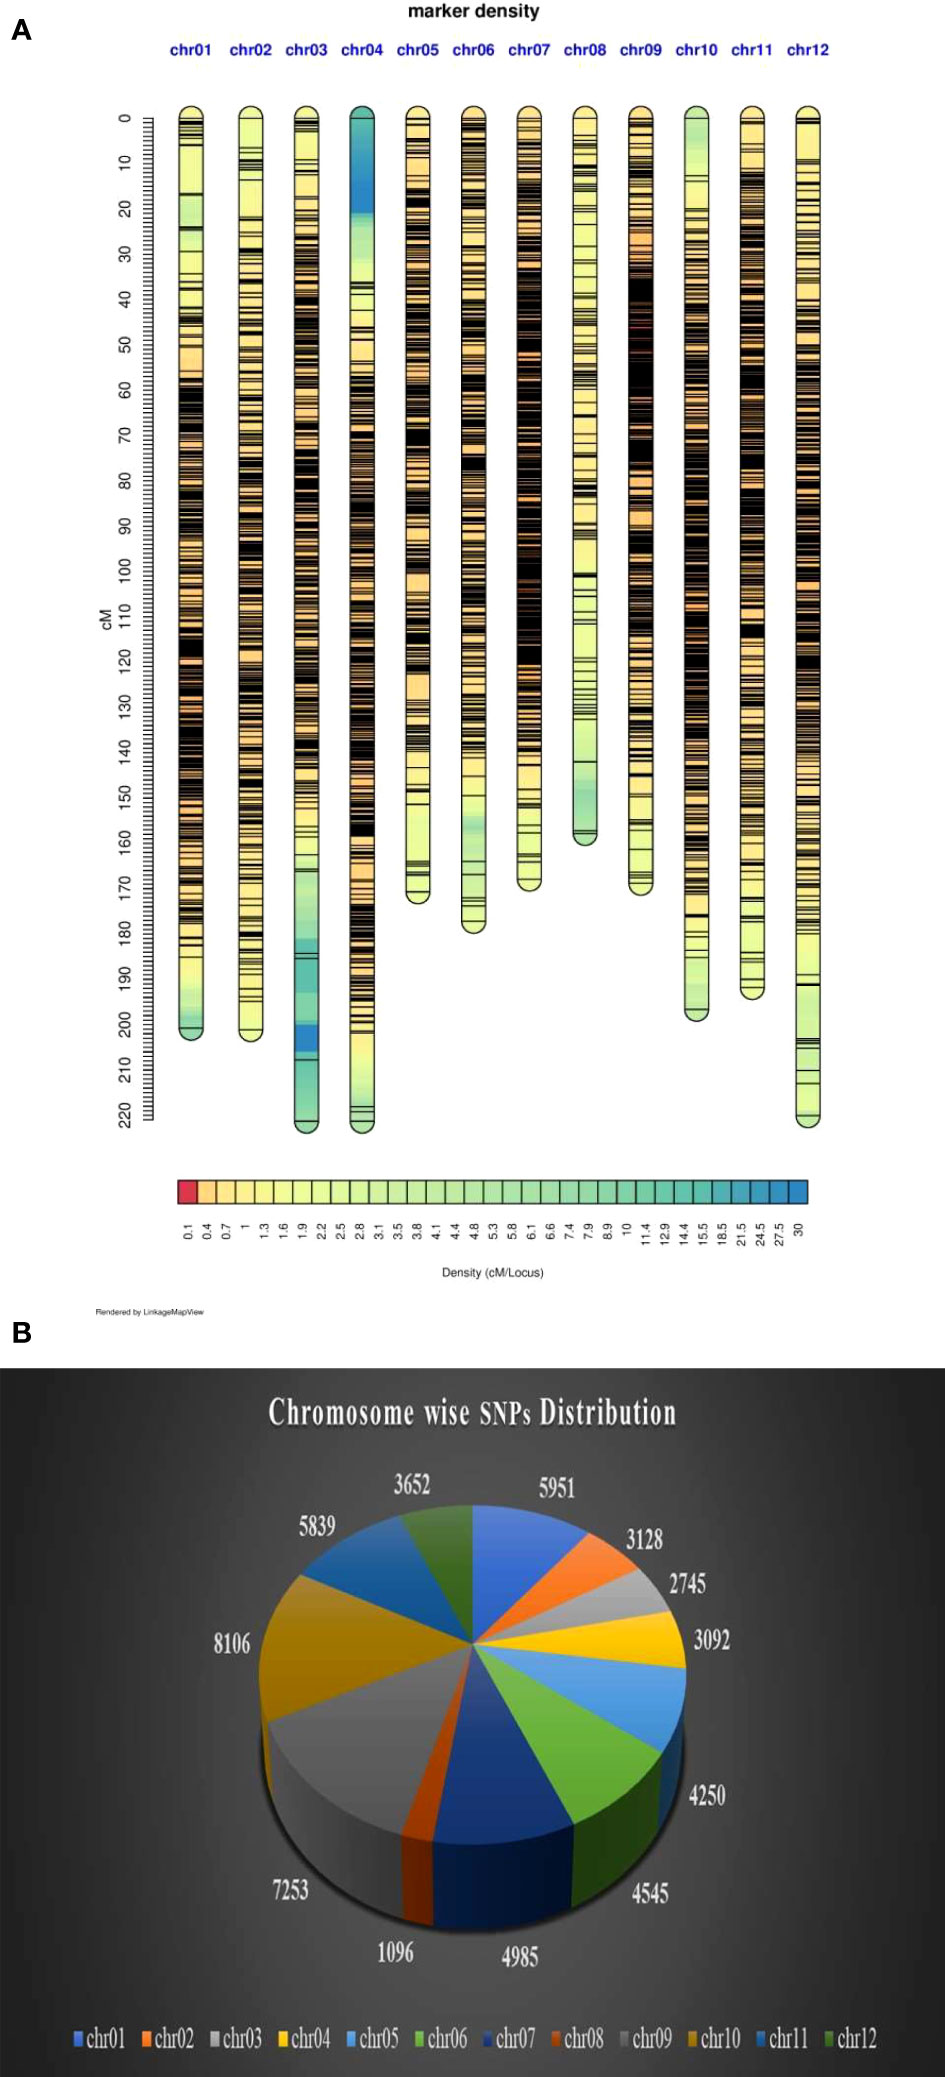
Figure 5 (A) Density plot of markers on 12 chromosomes. (B) Chromosome wise distribution of SNP markers.
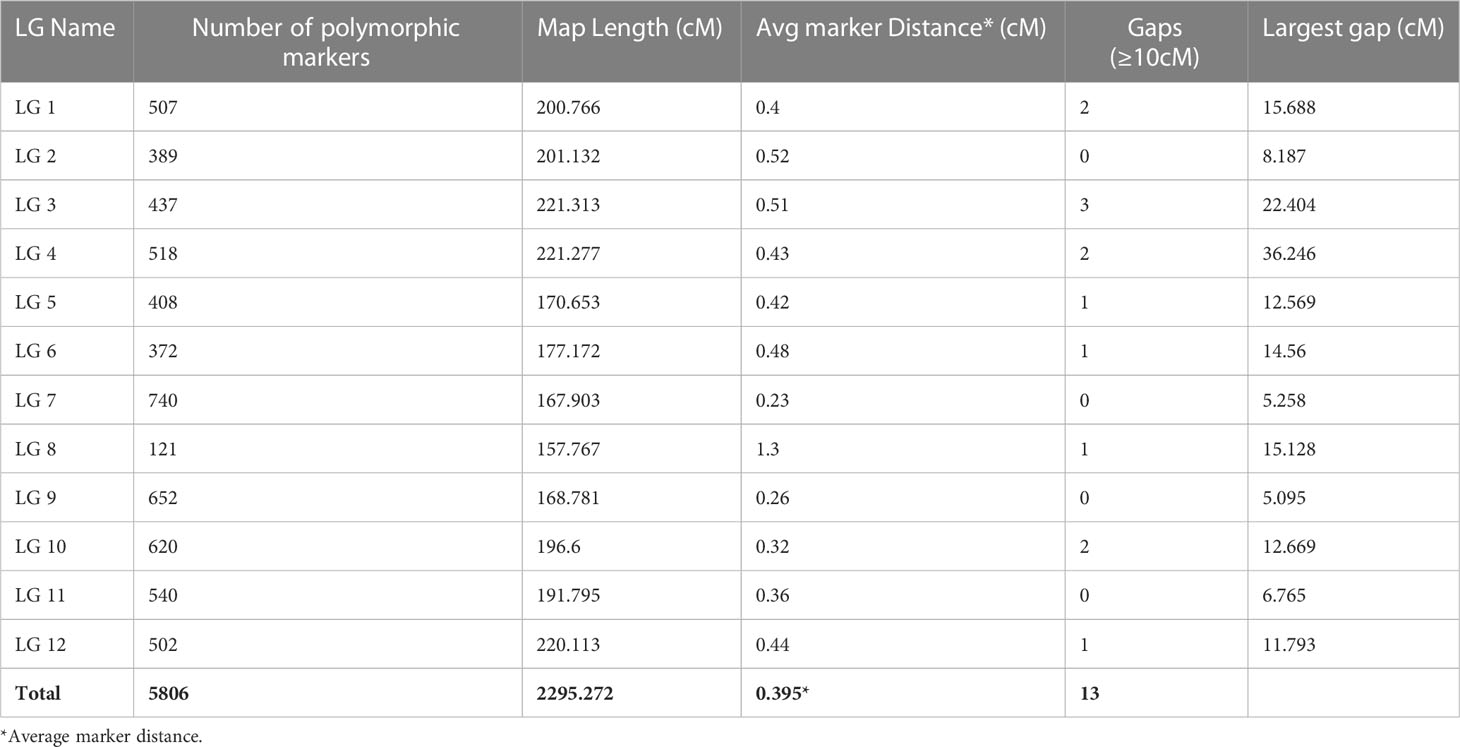
Table 3 Statistics of Linkage maps.
QTL analysis
The QTL analysis for different morpho-physio and biochemical traits under heat tolerance resulted in the identification of 64 QTLs for 24 out of the 25 different traits for which the phenotyping was done (Table 4). No QTL was detected for net photosynthetic rate. The identified QTLs were distributed across 12 linkage groups (Table 4 and Figure 6). Among the 64 QTLs, those QTLs explaining >10% phenotypic variation were classified as major QTLs (Table 5).
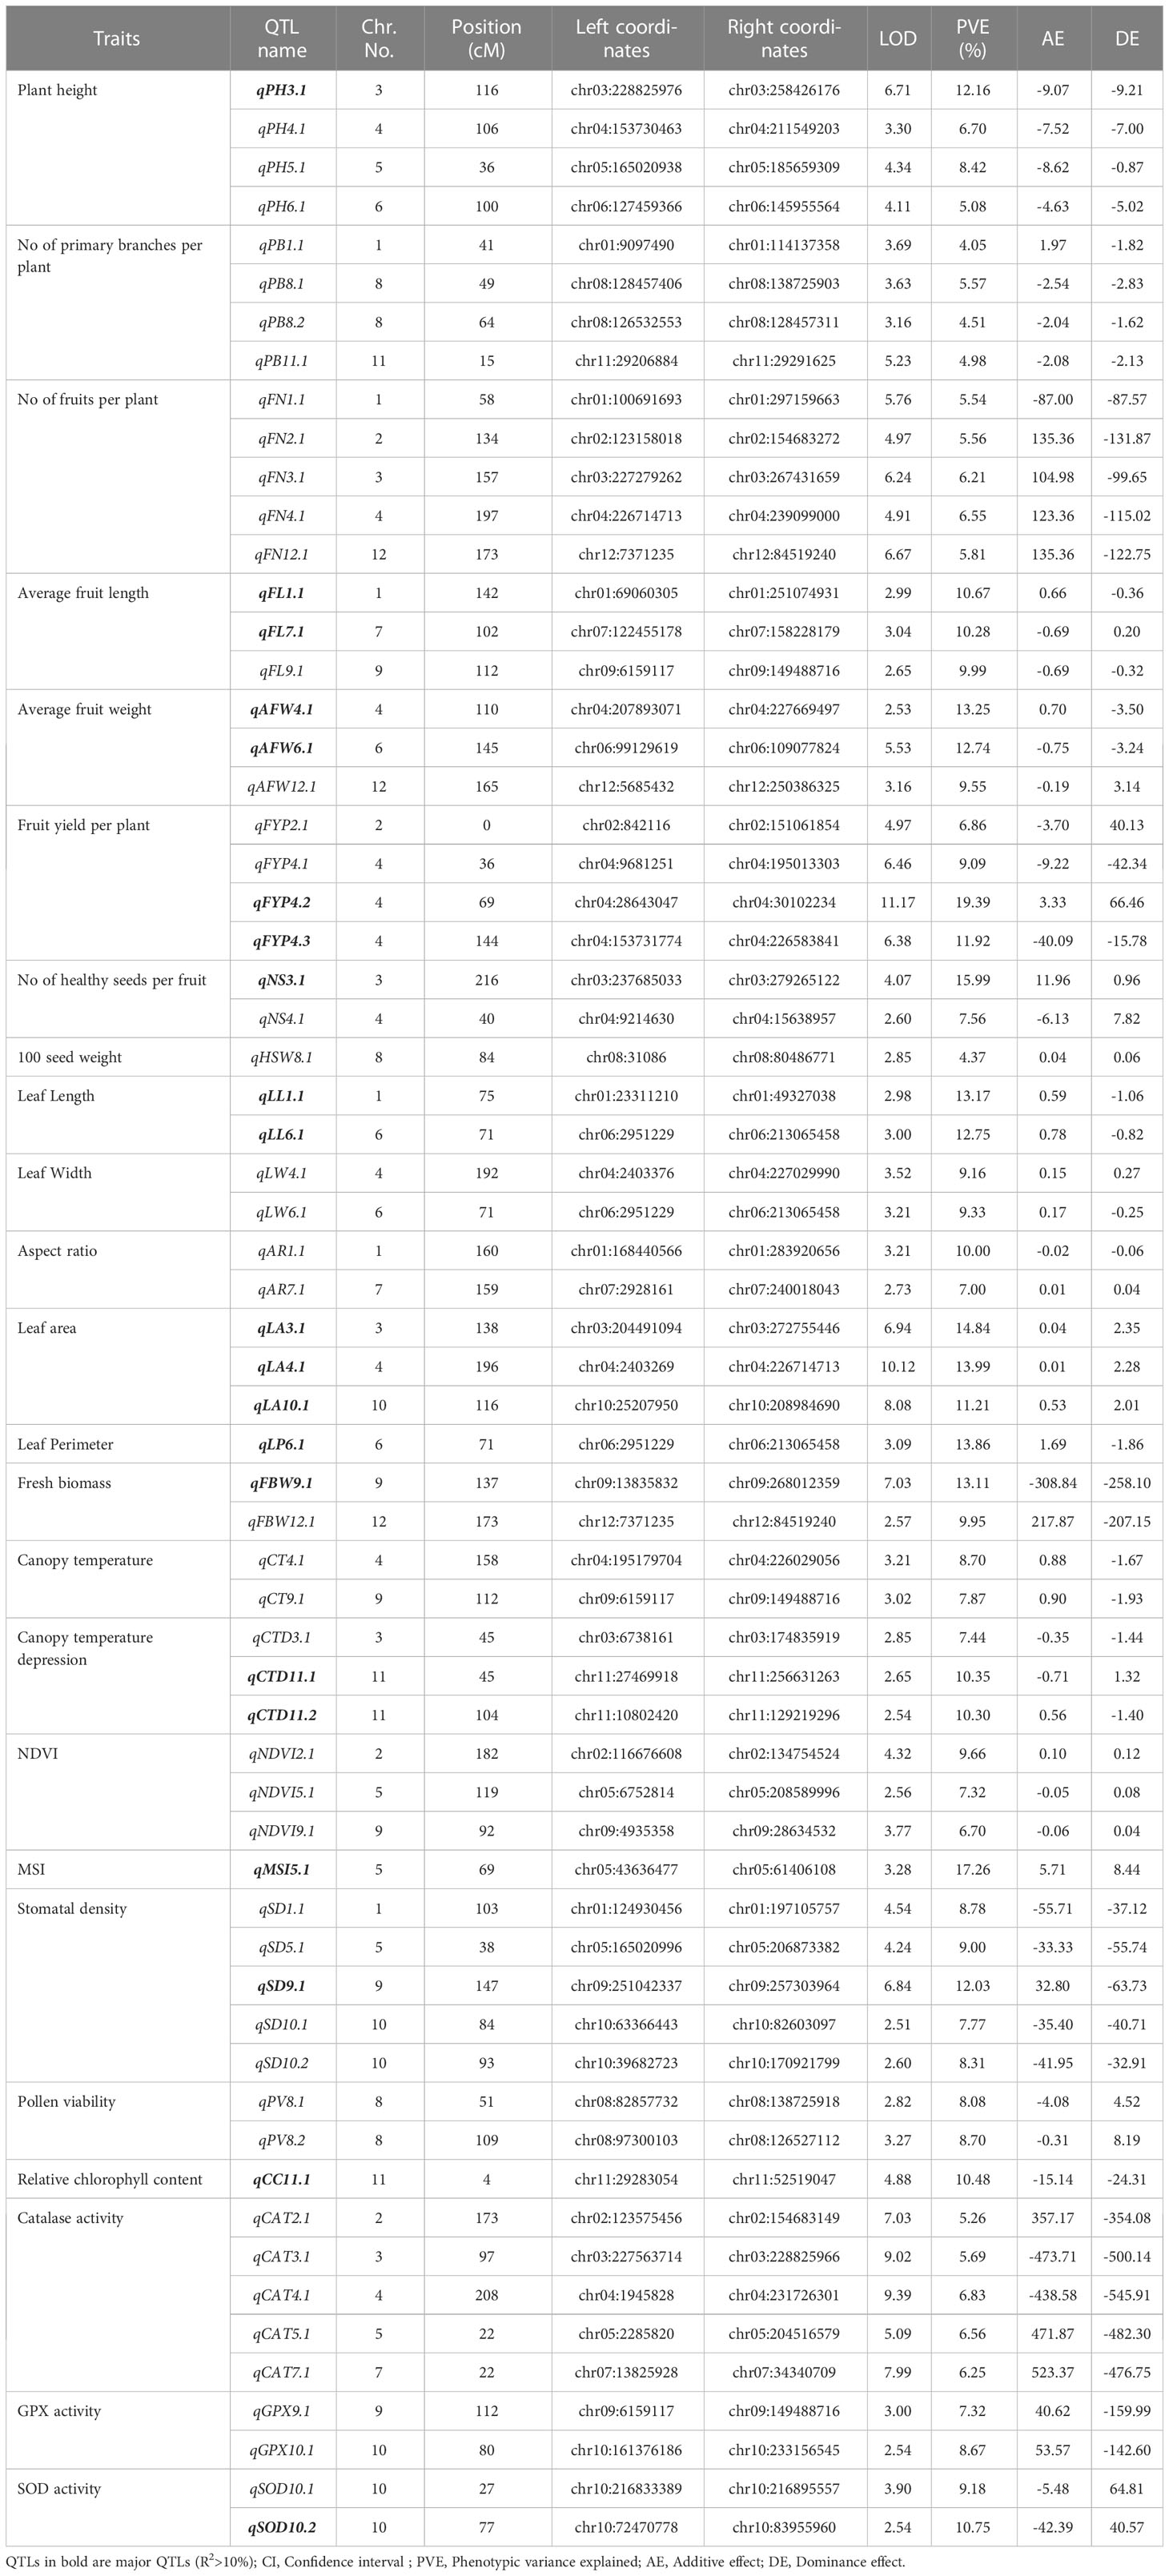
Table 4 List of the all identified QTLs governing different morpho, physio and biochemical traits under heat stress in hot pepper.
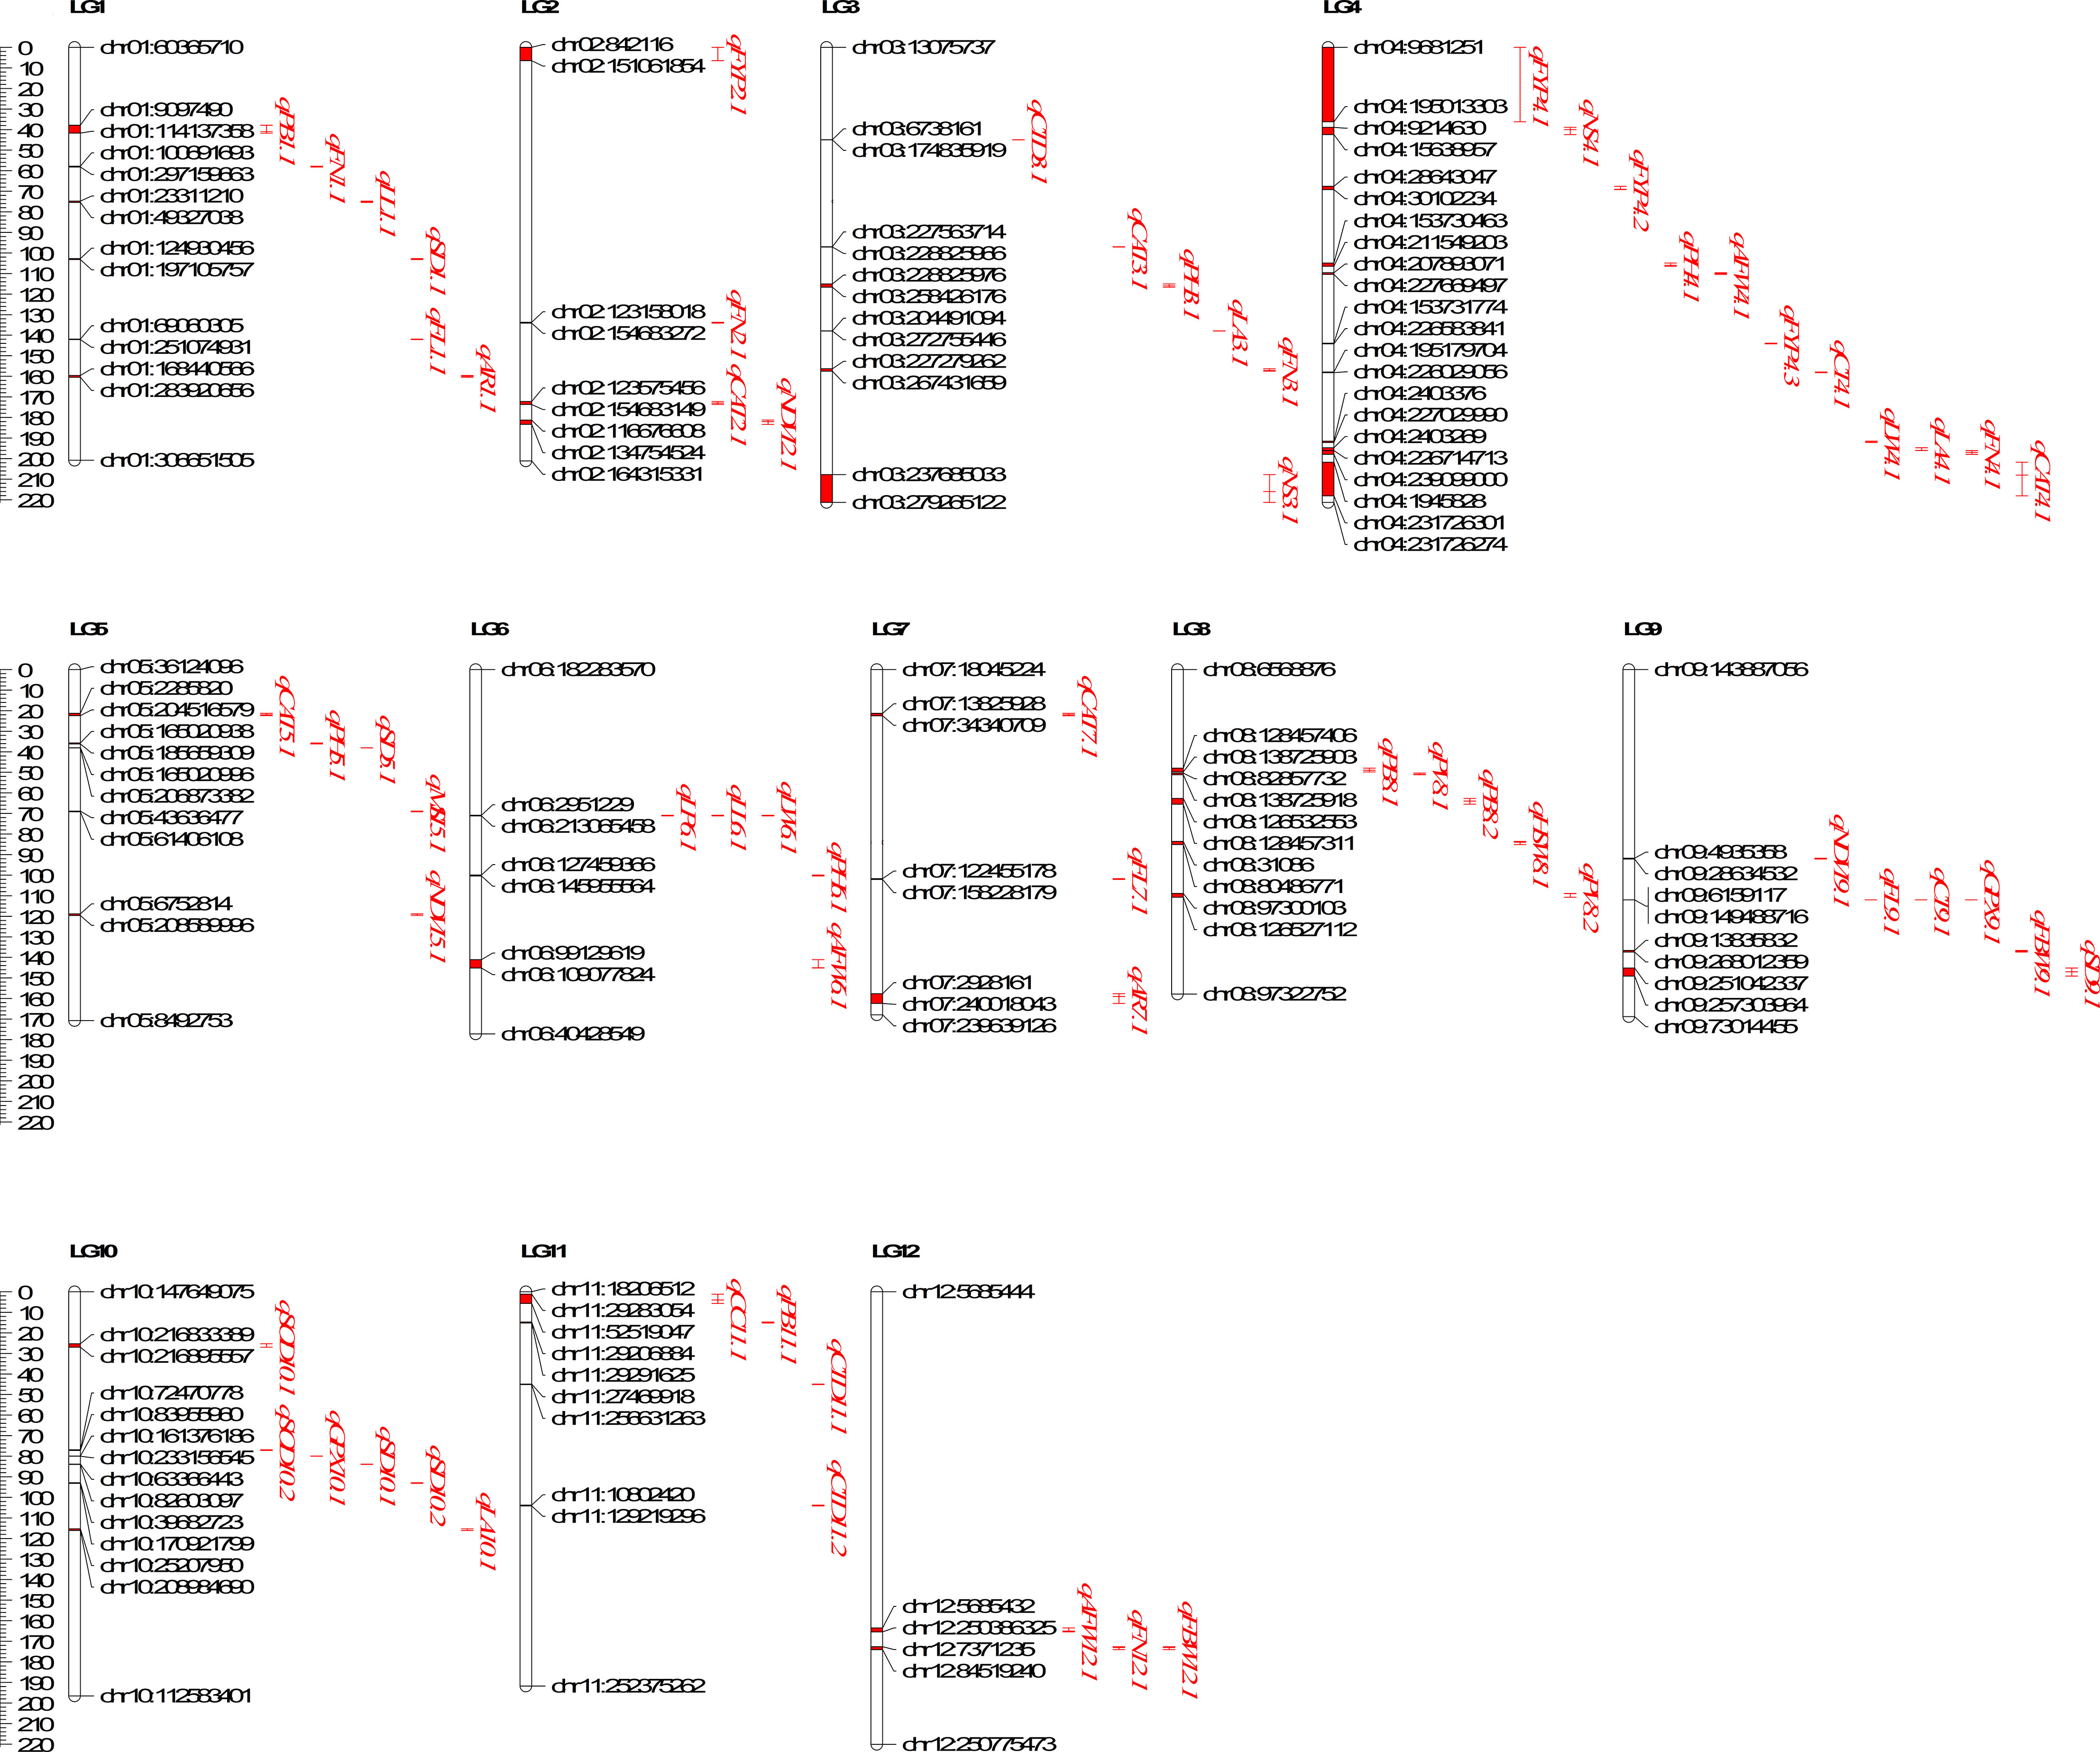
Figure 6 Distribution of QTLs governing different Heat tolerance traits on 12 linkage groups of Capsicum annuum.
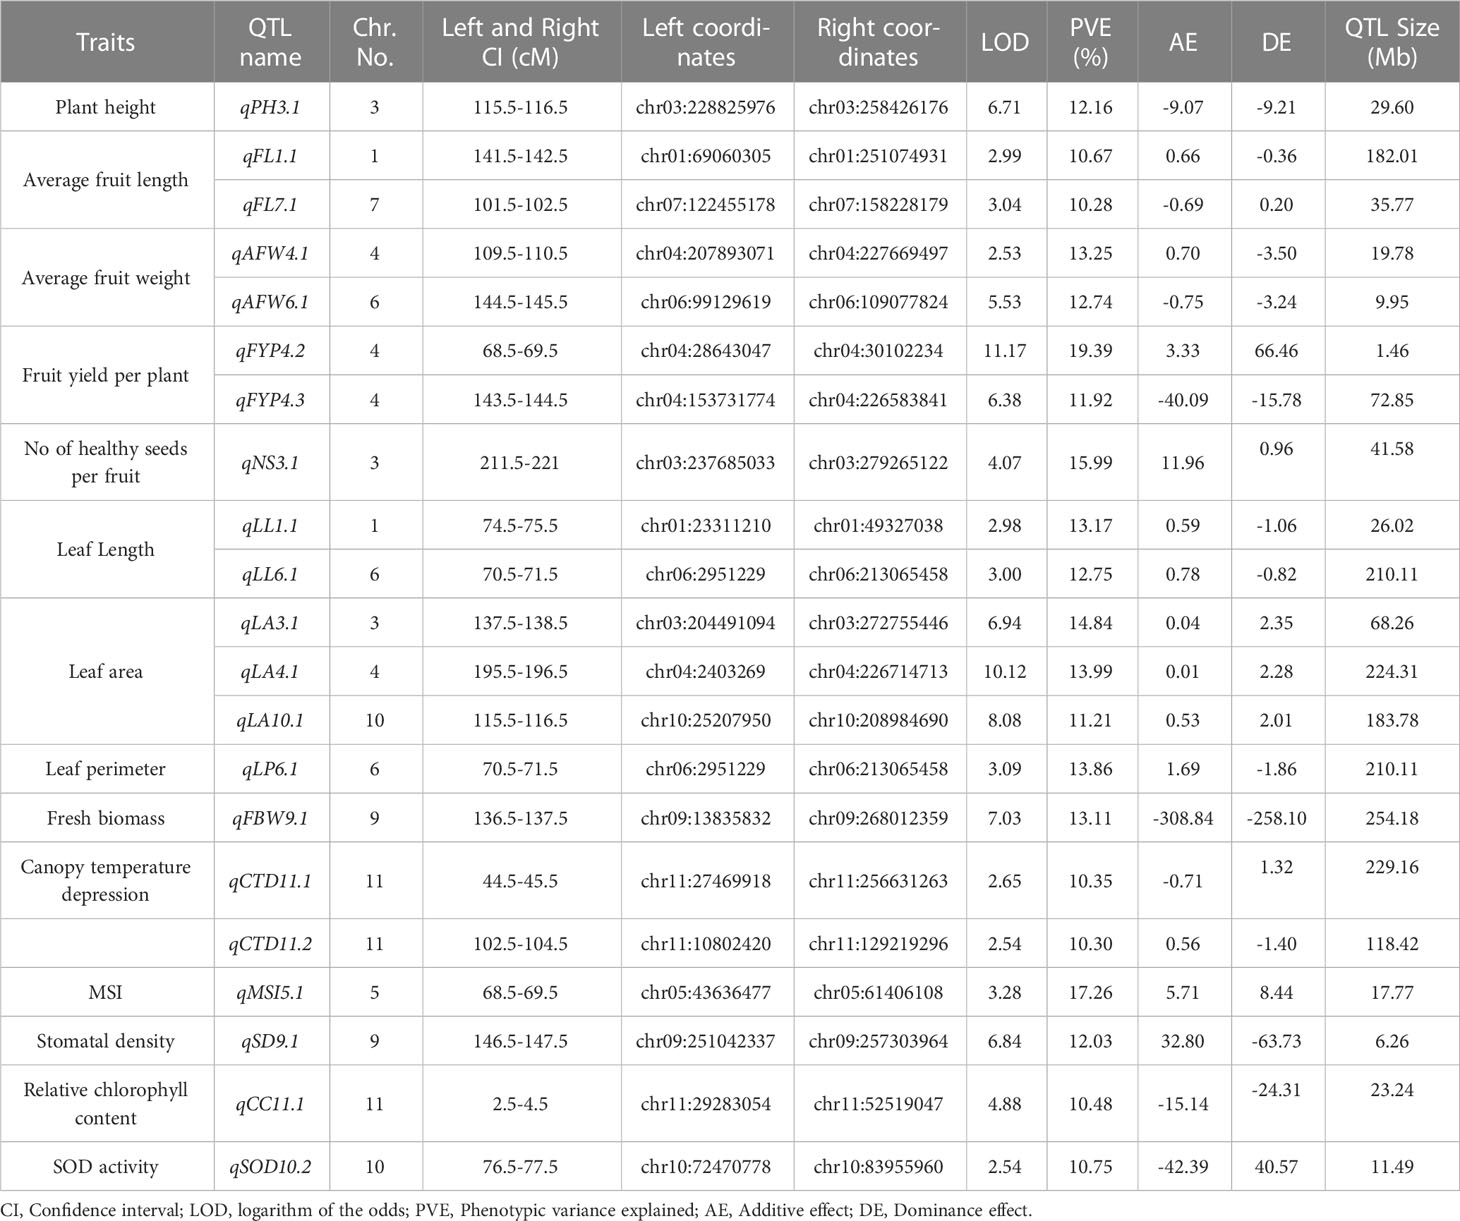
Table 5 List of major QTLs governing different morpho, physio and biochemical traits under heat stress in hot pepper.
A total of 21 major Quantitative Trait Loci (QTLs) were identified, of which 15 QTLs governed nine distinct morphological traits, four QTLs controlled three physiological traits and two QTLs controlled two biochemical traits. Among the morphological traits major QTLs were identified for plant height (PH), average fruit length (AFL), average fruit weight (AFW), fruit yield per plant (FYP), number of healthy seeds (NS), leaf length (LL), leaf area (LA), leaf perimeter (LP), and Fresh biomass weight (FBW) (Table 5); three physiological traits included canopy temperature depression (CTD), membrane stability index (MSI), and stomatal density (SD) (Table 5) while a single major QTL was discovered each for relative chlorophyll content and superoxide dismutase (SOD) activity (Table 5).
These 21 major QTLs accounted for a considerable portion of the phenotypic variance, ranging from 10.28% to 19.39% (Table 5). However, it is worth noting that the small population size used in the present study may have led to overestimation of the additive and dominance effects associated with some of the QTLs (Vales et al., 2005).
Distribution of SSR repeat motifs in the identified QTLs
A comprehensive analysis of our study revealed the identification of 368380 Simple Sequence Repeat (SSR) loci encompassed within 64 distinct Quantitative Trait Loci (QTLs). Among these SSRs, the most prevalent types were dinucleotide repeats, constituting a substantial proportion of 66.41% (211,381). Trinucleotide repeats followed closely, comprising 28.54% (105,158), while tetranucleotide repeats accounted for 2.83% (10,439). Pentanucleotide and hexanucleotide repeats represented smaller percentages, amounting to 0.44% (1,625) and 0.21% (782), respectively (Supplementary Table S2 and Figure 7).
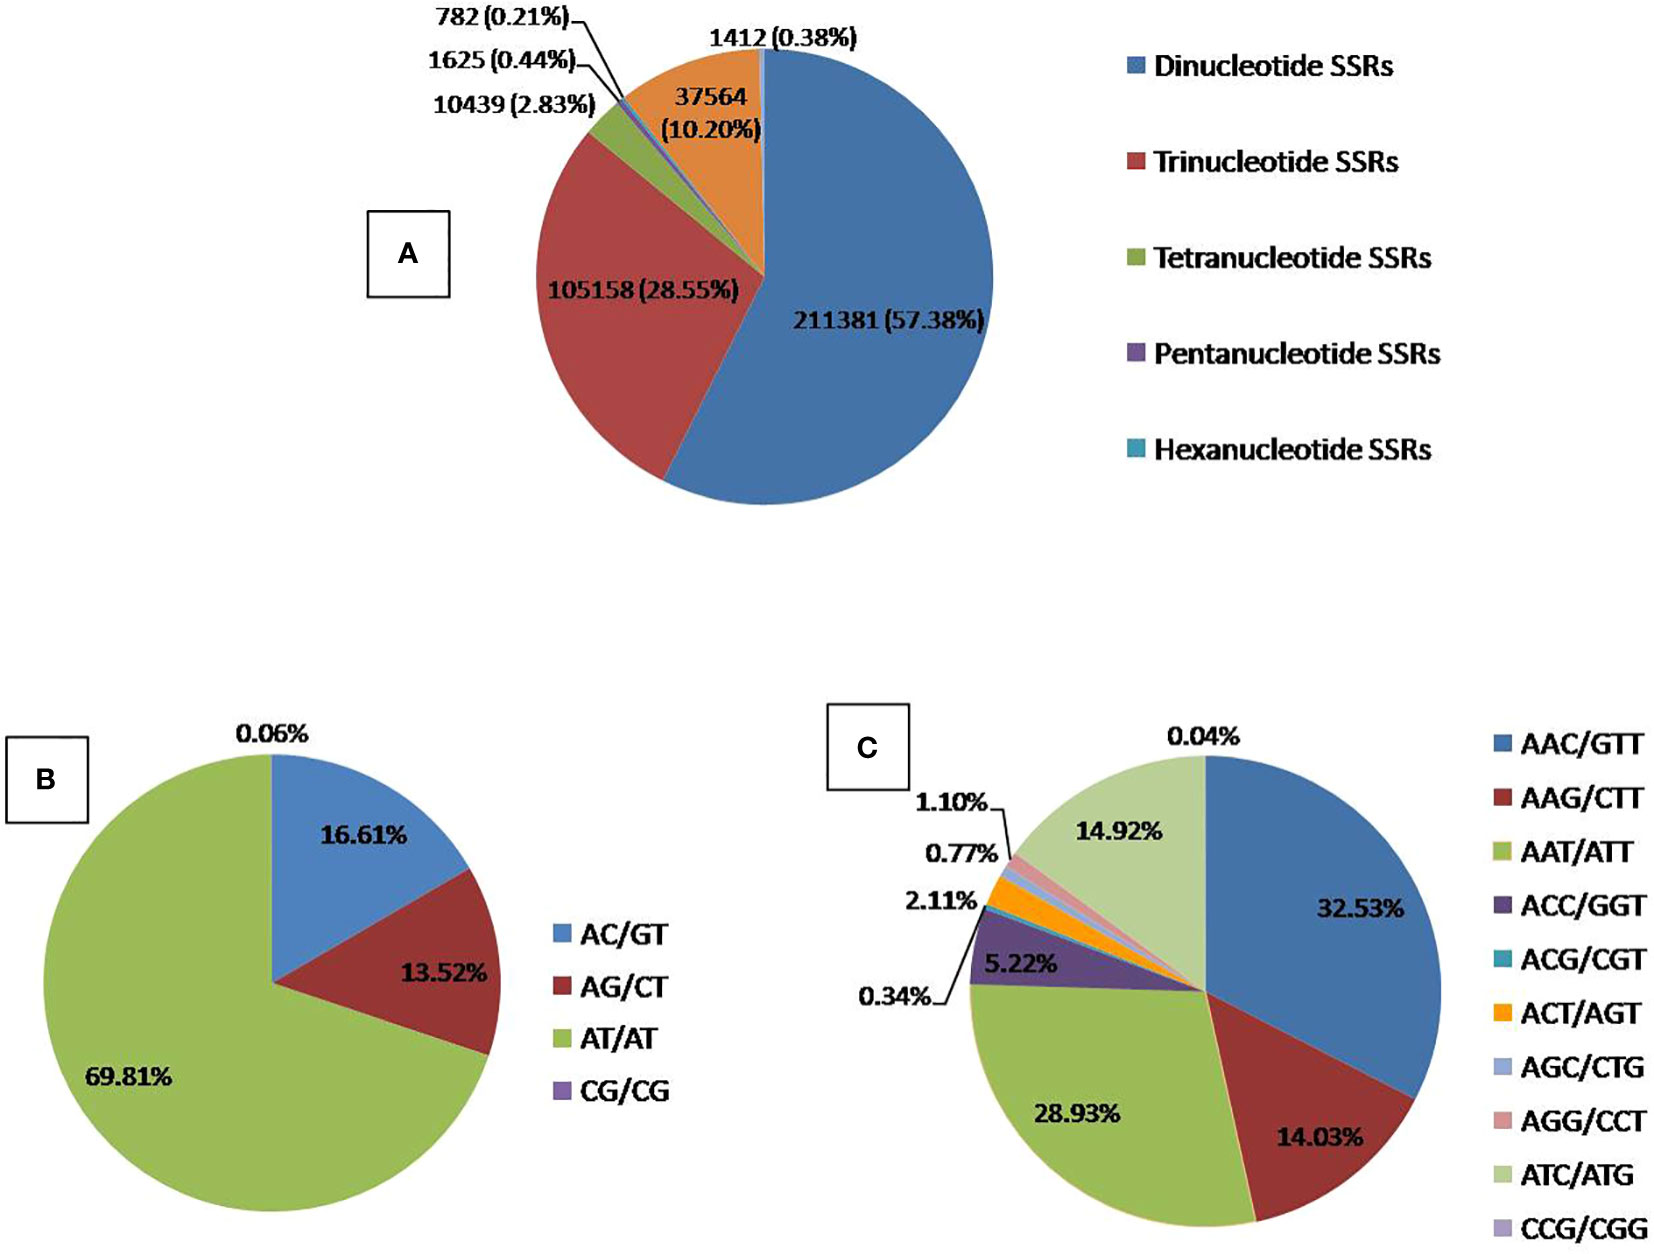
Figure 7 Distribution of SSR Repeat motifs in the identified QTLs. (A) Overall SSRs distribution, (B) Dinucleotide SSRs distribution, (C) Trinucleotide SSRs distribution.
QTLs identified for morphological traits under heat stress
Multiple Quantitative Trait Loci (QTLs) associated with various important traits were identified in the present study. For plant height, four QTLs were detected with LOD values ranging from 3.30 to 6.71. Among them a major QTL (qPH3.1) located on chromosome 3 explained 12.16% of the phenotypic variation (Table 5). Similarly, for the number of primary branches per plant, we identified four minor QTLs (qPB1.1, qPB8.1, qPB8.2, and qPB11.1) with LOD values ranging from 3.16 to 5.23, explaining phenotypic variation of 4.05 to 5.57% (Table 4). Five minor QTLs (qFN1.1, qFN2.1, qFN3.1, qFN4.1, qFN12.1) were identified for the number of fruits per plant with LOD values ranging from 4.91 to 6.67 and PVE ranging from 5.54 to 6.55. Moreover, we observed three QTLs for average fruit length, with LOD values ranging from 2.65 to 3.04. Among them, two major QTLs (qFL1.1, qFL7.1) explained 10.67 and 10.28% of the phenotypic variation respectively (Table 4, 5). For average fruit weight, three genomic loci were identified, with LOD values ranging from 2.53 to 5.53. Notably, two of these loci (qAFW4.1, qAFW6.1) were major QTLs, explaining 13.25% and 12.74% of the phenotypic variation, respectively. Our genetic map also revealed the presence of four QTLs for fruit yield per plant, with LOD values ranging from 4.97 to 11.17. Among them, two were major QTLs (qFYP4.2, qFYP4.3). The QTL qFYP4.2 exhibited a remarkably high LOD score of 11.17 and explained the highest phenotypic variation (R2 = 19.39%) (Table 5 and Figure 6).
In addition, two QTLs each for number of healthy seeds per fruit (qNS3.1, qNS4.1), leaf length (qLL1.1, qLL6.1), leaf width (qLW4.1, qLW6.1) and leaf aspect ratio (qAR1.1, qAR7.1) were identified (Table 4). Notably, qNS3.1 for number of healthy seeds per fruit (R2 = 15.99) and qLL1.1 and qLL6.1 for leaf length (R2 = 13.17 and 12.75% respectively) were the major effect QTLs (Table 5). Additionally, three major QTLs, namely qLA3.1, qLA4.1 and qLA10.1 were identified for leaf area (R2 = 14.84, 13.99 and 11.21% respectively). Another significant major QTL, qLP6.1 contributed to leaf perimeter variation with an R2 value of 13.86%. Furthermore, two QTLs, qFBW9.1 (R2 = 13.11%) and qFBW12.1 (R2 = 9.95%) were found to control fresh biomass weight, while a minor QTL, qHSW8.1, influenced the 100 seed weight with an R2 value of 4.37% (Table 4).
QTLs identified for physiological traits under heat stress
A total of 16 QTLs were identified for six different physiological traits under high temperature conditions (Table 4). Among these, two QTLs each were found for canopy temperature (qCT4.1, qCT9.1), and pollen viability (qPV8.1, qPV8.2), while a single major effect QTL, qMSI5.1, exerted control over MSI and accounted for a substantial proportion of phenotypic variation (17.26%). Additionally, three QTLs were identified each for canopy temperature depression (qCTD3.1, qCTD11.1, qCTD11.2) and NDVI (qNDVI2.1, qNDVI5.1, qNDVI9.1). It is worth mentioning that qCTD11.1 and qCTD11.2 both located on LG11 explained phenotypic variation of 10.35 and 10.30%, respectively (Table 4 and Figure 6).
QTLs identified for biochemical traits under heat stress
A single major QTL, qCC11.1 was successfully mapped on LG11 for relative chlorophyll content explaining 10.48% of the phenotypic variation and having a LOD score of 4.88 (Table 5). Additionally, five minor QTLs were identified for catalase activity, with LOD values ranging from 5.09 to 9.39. These minor QTLs accounted for phenotypic variations ranging from 5.26% to 6.83% (Table 4). For the activity of guaiacol peroxidase, two QTLs were discovered (qGPX9.1, qGPX10.1) while two QTLs (qSOD10.1, qSOD10.2) were found to control superoxide dismutase activity (Table 4). Notably, qSOD10.2 was a major effect QTL contributing 10.75% of the phenotypic variation (Table 5).
Colocalization of the identified QTLs
To identify colocalizing QTLs, a comparison of the physical coordinates of each QTL was conducted. The analysis revealed several instances where QTLs shared the exact coordinates or overlapped.
On LG1, qFN1.1 was found to colocalize with qAR1.1 and qSD1.1. Additionally, qSD1.1 overlapped with qFL1.1, and qPB1.1 colocalized with qLL1.1. On chromosome 2, qFN2.1 was found to colocalize with qCAT2.1, and qFYP2.1 colocalized with qNDVI2.1. On LG3, qFN3.1 was observed to overlap with qPH3.1 and qCAT3.1. On chromosome 4, the QTLs controlling leaf area (qLA4.1) and leaf width (qLW4.1) colocalized with QTLs for fruit yield per plant (qFYP4.1, qFYP4.2, qFYP4.3). On chromosome 5, qNDVI5.1 colocalized with qPH5.1, qMSI5.1, and qSD5.1. Similarly, the QTLs controlling different leaf parameters (qLL6.1, qLW6.1, qLP6.1) were colocalized on chromosome 6. The QTL controlling the aspect ratio of leaves (qAR7.1) colocalized with qFL7.1 and qCAT7.1 on LG7. Two QTLs controlling pollen viability (qPV8.1 and qPV8.2) were found to colocalize on chromosome 8. The QTL responsible for the activity of GPX (qGPX9.1) colocalized with qCT9.1 and qFL9.1 on LG9. Additionally, the QTLs for stomatal density (qSD10.1, qSD10.2) were colocalized with each other, and the genomic region governing SOD activity (qSOD10.2) colocalized with qSD10.2. Furthermore, both qCTD11.1 and qCTD11.2 (associated with CTD) colocalized with qPB11.1 and qCC11.1. Lastly, qAFW12.1 colocalized with qFN12.1 on LG12. For a detailed overview, please refer to Supplementary Table S3.
Discussion
High temperature is a critical determinant that profoundly impacts the cultivation of hot pepper in tropical, subtropical and arid regions. It affects both the vegetative and reproductive stages of the crop, leading to flower and fruit abscission, ultimately resulting in a significant reduction in hot pepper yield (Srivastava et al., 2022). The F2 population under scrutiny in this investigation exhibited an extensive spectrum of variations across various heat-related traits, aligning harmoniously with previous studies conducted in different crops (Poli et al., 2013; Xu et al., 2017; Song et al., 2020; Jha et al., 2021; Liu et al., 2021). This observation underscores the inherent quantitative nature of heat tolerance, as affirmed by the work of Farnham and Bjorkman (2011). Moreover, multiple prior studies have proposed the polygenic control of high-temperature tolerance (Jha et al., 2014), further substantiating the complexity of this phenomenon.
The significant positive correlation between plant height and the number of fruits per plant (0.6130), fruit yield per plant (0.534), hundred seed weight (0.278), and fresh biomass (0.694) indicates that better vegetative growth helps mitigate the negative effects of high temperatures on reproductive parameters. Similar positive correlations between plant height and yield under high temperatures have been reported in previous studies (Khodarahmpour, 2012; Mason and Singh, 2014). Positive correlations of the number of fruits per plant with average fruit length (0.231), average fruit weight (0.257), fruit yield per plant (0.893), and fresh biomass (0.760) are consistent with previous studies demonstrating positive associations between fruit yield and the number of fruits, fruit length, fruit weight, and plant biomass (Poudyal et al., 2018; Rajametov et al., 2021).
Leaf area exhibited positive correlations with leaf length (0.935), width (0.848), and perimeter (0.960), but a negative correlation with the leaf length-to-width ratio (aspect ratio) (-0.411), supporting the earlier suggestion by Guo et al. (2018) regarding the relationship between different leaf parameters. The significant negative correlation of leaf aspect ratio with various fruit parameters, and that of leaf area and perimeter with average fruit length and weight, observed in this study may be attributed to the relative change of photosynthetic area with leaf size (Nicotra et al., 2011). The positive associations between the number of fruits per plant and canopy temperature depression, as well as between both the number of fruits and yield with NDVI, MSI, SD, and PV, indicate that physiological processes under high temperatures play a crucial role in the reproductive success of plants. Previous studies have also suggested positive correlations between yield under heat stress and pollen viability (which enhances successful fertilization), membrane stability (which helps maintain normal cellular functions), stomatal density (higher stomatal density aids in lowering canopy temperatures through transpiration), and vegetation index (Saint Pierre et al., 2010; Akhtar et al., 2012; Lopes and Reynolds, 2012; Kumari et al., 2013; Mondal et al., 2013; Pinto et al., 2016; Xu et al., 2017). Conversely, canopy temperature is negatively correlated with hundred seed weight (-0.223) due to reduced pollination and fertilization and increased malformed seeds (Paliwal et al., 2012). Furthermore, we also found that stomatal density is correlated positively with canopy temperature depression (0.288) and negatively with canopy temperature (-0.312), leaf area (-0.223) and leaf width (-0.248). This suggests that due to reduced epidermal cell expansion, smaller leaves are expected to have higher stomatal density, which in turn increases transpirational cooling, making the plant canopy cooler and reducing heat (Beerling and Chaloner, 1993).
The negative correlation between leaf aspect ratio and relative chlorophyll content (-0.235) can be attributed to the fact that chlorophyll levels in leaves are directly proportional to their photosynthetic capacity, and narrower leaves have a smaller photosynthetic area (Nicotra et al., 2011). High temperatures often induce the production of reactive oxygen species (ROS), which can damage cells. In response, plants produce various antioxidant enzymes to scavenge these ROS, maintaining cell membrane stability for normal cellular functioning and protecting the photosynthetic apparatus and cell membrane from oxidative stress (Ogweno et al., 2008; Asthir, 2015). This was evident in the present study, as guaiacol peroxidase activity showed positive associations with MSI (0.274), pollen viability (0.208), and net photosynthetic rate (0.382).
QTL analyses based on linkage maps with limited markers often result in large confidence intervals, reducing mapping precision and efficiency. High-throughput genotyping, utilizing next-generation sequencing (NGS) platforms has been successfully used to identify QTLs associated with heat tolerance in various vegetables, such as cowpea, tomato, broccoli, and cucumber (Lucas et al., 2013; Branham et al., 2017; Xu et al., 2017; Branham and Farnham, 2019; Dong et al., 2020). In the present study, we employed Double digest restriction-site associated DNA sequencing to develop high-density genetic maps and efficiently and cost-effectively identify QTLs controlling heat-related traits under high temperature conditions.
The present study represents the first successful identification of heat tolerance-related QTLs in hot pepper (Capsicum annuum L.). A total of 64 QTLs associated with 24 different traits related to high temperature tolerance were discovered. Among these QTLs, four were found to control fruit yield per plant, with qFYP4.2 exhibiting the highest LOD score of 11.17 and explaining the highest phenotypic variance (19.39%) among the identified QTLs. This QTL had a relatively short physical length of 1.46 Mb, indicating a strong likelihood of its association with fruit yield and a major impact on the overall productivity per plant. Notably, qFYP4.2 also displayed a positive additive effect, suggesting that the allele for increased fruit yield per plant was contributed by the heat-tolerant parent (DLS-161-1). Previous studies have reported the regulation of high-temperature fruit set by multiple QTLs, with 5-6 QTLs identified in tomato (Lin et al., 2010).
The additive effect as well as dominance effects of each of the QTL identified was estimated in the study. The additive effect of a QTL refers to the combined effect of the alleles contributed by each parent, where the trait’s value is influenced by the sum of the individual effects of the alleles at that locus. Positive additive effect indicates that alleles from maternal parent enhance the trait value, whereas negative additive effect indicates that alleles from male parent enhances the trait value (Hu et al., 2021). On the other hand, the dominance effect of a quantitative trait locus (QTL) refers to the interaction between alleles at a particular locus that results in a deviation from an additive genetic model and describes how the presence of one allele can mask or override the effect of another allele at the same locus. In F2 populations, understanding the additive effects of quantitative trait loci (QTLs) is more important than the dominance effects as additive effects contribute to the overall genetic variance and play a major role in determining the genetic architecture of complex traits. Additive genetic variance is directly related to the response to selection, meaning that individuals with high additive genetic values can be reliably used for breeding purposes to improve a particular trait in subsequent generations. Dominance effects are more complex and their impact on breeding decisions is less predictable (Zhang et al., 2008).
We observed that average fruit weight is controlled by two major QTLs (qAFW4.1, qAFW6.1) and a single minor QTL (qAFW12.1), collectively explaining 35.53% of the phenotypic variation. However, qAFW6.1 and qAFW12.1 exhibited negative additive effects, while qAFW4.1 displayed a positive additive effect. Earlier studies have also reported the control of fruit weight by 2-3 major QTLs with positive additive effects in tomato under heat stress conditions (Lin et al., 2010; Bineau et al., 2021). In line with previous research on bean (Vargas et al., 2021) and tomato (Lin et al., 2010), we identified five minor QTLs for the number of fruits per plant. In the case of the number of healthy seeds per fruit, a pair of QTLs (qNS3.1 and qNS4.1) exerted positive and negative additive effects, respectively. These findings align with the results reported by Lin et al. (2010) in tomato, where two major QTLs controlling seed number under heat stress displayed contrasting additive effects.
These reports further support the notion of remarkable conservation in the order and sequence of orthologs in solanaceous genomes, despite minor differences and positive gene selections (Doganlar et al., 2002; Wang et al., 2008). Previous studies on common bean have identified four major QTLs with negative additive effects for 100 seed weight under heat stress (Vargas et al., 2021). Similarly, in our study, we identified a single minor QTL controlling 100 seed weight on LG8 (LOD= 2.85, R2 = 4.37%).
Regarding plant height, we found that it is controlled by three minor QTLs (qPH4.1, qPH5.1, qPH6.1) and a major QTL (qPH3.1), while pollen viability is influenced by two minor QTLs (qPV8.1, qPV8.2) with negative additive effects. Earlier studies on tomato have indicated the regulation of plant height under heat stress by two QTLs located on LG2 and LG4, respectively, while pollen viability is controlled by a single major QTL (qPV11), explaining 36.3% of the phenotypic variance (Xu et al., 2017). In previous studies conducted on common bean, three major QTLs (located on LG5 and LG8) were reported to influence pollen viability under heat stress conditions, collectively explaining 51.61% of the phenotypic variation (Xu et al., 2017; Vargas et al., 2021). Canopy temperature depression (CTD) serves as a measure of a plant’s cooling capacity under high-temperature conditions, crucial for maintaining optimal growth and yield. In our study, we identified a minor QTL (qCTD3.1) with a negative additive effect on LG3, as well as two major QTLs (qCTD11.1, qCTD11.2) on LG11, one exhibiting a positive additive effect (qCTD11.2) and the other a negative additive effect (qCTD11.1). Similarly, a consistently identified QTL with a positive additive effect for CTD (QHtctd.bhu-7B) has been reported in three different trials involving the RIL population of wheat (Paliwal et al., 2012).
The identification of co-localized quantitative trait loci (QTLs) governing various heat-related traits represents a remarkable opportunity to gain profound insights into the intricate mechanisms underlying heat tolerance. Such co-localizations arise from the convergence of multiple crucial genes within the same genomic region, the presence of linkage disequilibrium, or the pleiotropic effects of specific genes (Kato et al., 2000; Baytar et al., 2021). Furthermore, the mapping of correlated traits to similar genetic locations is expected since they are likely controlled by common genetic factors, establishing an intriguing genetic architecture (Kato et al., 2000).
The co-localization of qFN1.1 and qSD1.1 on LG1 may be attributed to the significant positive correlation observed between the number of fruits and stomatal density. Similarly, the co-localization of qFN3.1 and qPH3.1 can be explained by the strong positive association between the number of fruits per plant and plant height. The significant correlation between NDVI and plant height is also reflected in the overlapping QTLs controlling these traits on LG5. The significant positive correlation between GPX activity and canopy temperature is further supported by the co-localization of the corresponding QTLs on LG9. Furthermore, the QTL controlling leaf area (qLA10.1) was found to co-localize with the QTL controlling stomatal density, and both traits displayed a significant correlation. QTLs for SOD and stomatal density also overlapped on LG10 and exhibited a significant correlation. Similarly, the strong correlation observed between the number of fruits and fresh biomass is supported by the co-localization of their respective QTLs on LG12. Several previous studies have also indicated the relationship between trait correlation and the co-localization of QTLs controlling those traits. For example, the positive correlation between the number of inflorescences and the number of flowers per inflorescence aligns with the co-localization of QTLs controlling these traits (Xu et al., 2017). Talukder et al. (2014) identified common QTLs on LG6A, 7A, and 1D for chlorophyll content, plasma membrane damage, and thylakoid membrane damage, which were strongly correlated, suggesting pleiotropic genetic influences on these traits.
The strong correlation between leaf perimeter, leaf length, and leaf width is further supported by the fact that the loci responsible for these traits are found in the same position on LG6, indicating that the same genetic factors control all three leaf parameters. However, the small additive effect of qLA3.1 and qLA4.1 suggests the influence of environmental conditions or other genetic factors on these traits. Additionally, our investigation uncovered a fascinating convergence of QTLs controlling average fruit length (qFL9.1), canopy temperature (qCT9.1), and GPX activity (qGPX9.1), as they mapped to the same genomic region on LG6. Furthermore, the overlapping QTLs governing pollen viability (qPV8.1 and qPV8.2) indicate a functional interrelation between these genetic factors, collectively influencing the phenotype.
Conclusion
Heat-related traits are complex quantitatively inherited traits that are profoundly influenced by environmental conditions, posing significant challenges in breeding for heat tolerance in hot pepper. Nonetheless, our study successfully identified 38 QTLs governing 14 distinct morphological traits, 16 QTLs regulating 6 diverse physiological traits, and 9 QTLs orchestrating the activities of three vital antioxidant enzymes. Furthermore, a solitary QTL has been identified to govern relative chlorophyll content under high temperature conditions. Notably, the QTL qFYP4.2, governing fruit yield per plant, exhibited the highest phenotypic variance and LOD score, while also displaying a compact genetic region. This QTL holds tremendous potential for further fine mapping and validation.
To advance the development of heat-tolerant varieties, it is crucial to conduct targeted fine mapping of the identified QTLs. This process will help narrow down the specific genomic regions responsible for heat tolerance, providing valuable insights for future breeding efforts. Moreover, the SSR/SNP markers identified within these QTLs can be leveraged for marker-assisted selection, facilitating more efficient and precise breeding strategies for heat tolerance in hot pepper.
In conclusion, this study represents a significant advancement in our understanding of the genetic architecture underlying heat-related traits in hot pepper. The comprehensive identification of QTLs, their potential for fine mapping, and the availability of molecular markers for marker-assisted selection collectively contribute to the broader goal of developing heat-tolerant pepper varieties and empowering farmers with resilient cultivars capable of withstanding the challenges posed by high temperatures.
Data availability statement
The sequencing data generated under the study has been submitted at NCBI SRA portal under the BioProject “PRJNA982575” with url https://www.ncbi.nlm.nih.gov/search/all/?term=PRJNA982575.
Author contributions
Conceived theme of the study and designed experiment, MM and AS. Data curation, AT, MM, AS, and RG. Investigation, AT, AS, and MM. Resources, AS, BST, MM, BS, HK and RP. Supervision, MM, AS, and PKJ. Visualization, AS, MM, and BST. Writing original draft, AT and MM. Review and editing, MM, AS, PKJ, and TKB. All authors contributed to the article and approved the submitted version.
Acknowledgments
The authors acknowledge the financial support received from NAHEP-CAAST programme of Indian Council of Agricultural Research for publication of this Manuscript.
Conflict of interest
Author RG was employed by the company NGB Diagnostics Pvt Ltd, New Delhi, India to which the sequencing work was outsourced.
The remaining authors declare that the research was conducted in the absence of any commercial or financial relationships that could be construed as a potential conflict of interest.
Publisher’s note
All claims expressed in this article are solely those of the authors and do not necessarily represent those of their affiliated organizations, or those of the publisher, the editors and the reviewers. Any product that may be evaluated in this article, or claim that may be made by its manufacturer, is not guaranteed or endorsed by the publisher.
Supplementary material
The Supplementary Material for this article can be found online at: https://www.frontiersin.org/articles/10.3389/fpls.2023.1232800/full#supplementary-material
Supplementary Figure 1 | Performance of Heat tolerant (DLS-161-1) and Heat sensitive DLS-161-1 parents under heat stress conditions (July, 2022).
Supplementary Figure 2 | Temperature graph of IARI, Pusa, New Delhi during recording of observations.
References
Aebi, H. (1984). “Catalase in vitro,” in Methods in Enzymology, vol. 105. (New York: Academic Press), 121–126. doi: 10.1016/S0076-6879(84)05016-3
Akhtar, S., Ansary, S. H., Dutta, A. K., Karak., C., Hazra, P. (2012). Crucial reproductive characters as screening indices for tomato (Solanum lycopersicum) under high temperature stress. J. Crop Weed. 8, 114–117.
Asthir, B. (2015). Mechanisms of heat tolerance in crop plants. Biol. Plant 59, 620–628. doi: 10.1007/s10535-015-0539-5
Baytar, A. A., Peynircioglu, C., Sezener, V., Frary, A., Doganlar, S. (2021). Molecular mapping of QTLs for fiber quality traits in Gossypium hirsutum multi-parent recombinant inbred lines. Euphytica 217, 181. doi: 10.1007/s10681-021-02914-9
Beerling, D. J., Chaloner, W. G. (1993). The impact of atmospheric CO2 and temperature changes on stomatal density: observation from Quercus robur Lammas leaves. Ann. Bot. 71, 231–235. doi: 10.1006/anbo.1993.1029
Bineau, E., Diouf, I., Carretero, Y., Duboscq, R., Bitton, F., Djari, A., et al. (2021). Genetic diversity of tomato response to heat stress at the QTL and transcriptome levels. Plant J. 107, 1213–1227. doi: 10.1111/tpj.15379
Branham, S. E., Farnham, M. W. (2019). Identification of heat tolerance loci in broccoli through bulked segregant analysis using whole genome resequencing. Euphytica 215, 1–9. doi: 10.1007/s10681-018-2334-9
Branham, S. E., Stansell, Z. J., Couillard, D. M., Farnham, M. W. (2017). Quantitative trait loci mapping of heat tolerance in broccoli (Brassica oleracea var. italica) using genotyping-by-sequencing. Theor. Appl. Genet. 130, 529–538. doi: 10.1007/s00122-016-2832-x
Chance, B., Maehly, A. C. (1955). Assay of catalases and peroxidases. Meth Enzymol. 2, 764–775. doi: 10.1016/S0076-6879(55)02300-8
Chilli outlook. (2021). Agricultural Market Intelligence Centre (PJTSAU). Available at: https://pjtsau.edu.in/files/AgriMkt/2021/August/chilli-August-2021.pdf (Accessed April 19, 2023).
Dahal, K. C., Sharma, M. D., Dhakal, D. D., Shakya, S. M. (2006). Evaluation of heat tolerant chilli (Capsicum annuum L.) genotypes in Western Terai of Nepal. J. Inst. Agric. Anim. Sci. 27, 59–64. doi: 10.3126/jiaas.v27i0.696
Deshmukh, P. S., Sairam, R. K., Shukla, D. S. (1991). Measurement of ion leakage as a screening technique for drought resistance in wheat genotypes-Short Communication. Indian J. Plant Physiol. 34, 89–91.
Dhindsa, R. S., Plumb-Dhindsa, P. A., Thorpe, T. A. (1981). Leaf senescence: Correlated with increased levels of membrane permeability and lipid peroxidation, and decreased levels of superoxide dismutase and catalase. J. Exp.Bot. 32, 93–101. doi: 10.1093/jxb/32.1.93
Doganlar, S., Frary, A., Daunay, M. C., Lester, R. N., Tanksley, S. D. (2002). Conservation of gene function in the Solanaceae as revealed by comparative mapping of domestication traits in eggplant. Genetics 161, 1713–1726. doi: 10.1093/genetics/161.4.1713
Dong, S., Zhang, S., Wei, S., Li, Y., Li, C., Bo, K., et al. (2020). Identification of quantitative trait loci controlling high-temperature tolerance in cucumber (Cucumis sativus L.) seedlings. Plants (Basel) 9, 1155. doi: 10.3390/plants9091155
Farnham, M. W., Bjorkman, T. (2011). Breeding vegetables adapted to high temperatures: a case study with broccoli. Hortic. Sci. 46, 1093–1097. doi: 10.21273/HORTSCI.46.8.1093
G20 climate risk atlas. (2021). Impacts, policy, economics (CMCC). Available at: https://www.g20climaterisks.org/India/ (Accessed April 20, 2023).
Gopalakrishnan, T. R. (2007). “Solanaceous fruit vegetables,” in Vegetable crops. Ed. Peter, K. V. (New Delhi: New India Publishing Agency), 63–102.
Guo, Z., Lin, H., Chen, S., Yang, Q. (2018). Altitudinal patterns of leaf traits and leaf allometry in bamboo Pleioblastus amarus. Front. Plant Sci. 9. doi: 10.3389/fpls.2018.01110
Hu, G., Wang, B., Gong, T., Li, R., Guo, X., Liu, W., et al. (2021). Mapping additive and epistatic QTLs for forage quality and yield in soybean [Glycine max (L.) Merri.] in two environments. Biotechnol. Biotechnol. Equip. 35, 839–852. doi: 10.1080/13102818.2021.1932593
IPCC. (2018). SR15: Summary for Policymakers (Intergovernmental Panel on Climate Change). Available at: https://www.ipcc.ch/site/assets/uploads/sites/2/2022/06/SPM_version_report_LR.pdf (Accessed April 20, 2023).
IPCC. (2021). The physical science basis in Climate Change. Available at: https://www.ipcc.ch/report/ar6/wg1/downloads/report/IPCC_AR6_WGI_FOD_Chapter04.pdf (Accessed April 24, 2023).
Jha, U. C., Bohra, A., Singh, N. P. (2014). Heat stress in crop plants: its nature, impacts and integrated breeding strategies to improve heat tolerance. Plant Breed. 133, 679–701. doi: 10.1111/pbr.12217
Jha, U. C., Kole, P. C., Singh, N. P. (2021). QTL mapping for heat stress tolerance in chickpea (Cicer arietinum L.). Legume Res. 44, 382–387. doi: 10.18805/LR-4121
Kato, K., Miura, H., Sawada, S. (2000). Mapping QTLs controlling grain yield and its components on chromosome 5a of wheat. Theor. Appl. Genet. 101, 1114–1121. doi: 10.1007/s001220051587
Khodarahmpour, Z. (2012). Morphological classification of maize (Zea mays L.) genotypes in heat stress condition. J. Agric. Sci. 4, 31. doi: 10.5539/jas.v4n5p31
Kumari, M., Pudake, R. N., Singh, V. P., Joshi, A. K. (2013). Association of stay green trait with canopy temperature depression and yield traits under terminal heat stress in wheat (Triticum aestivum L.). Euphytica 190, 87–97. doi: 10.1007/s10681-012-0780-3
Lin, K. H., Yeh, W. L., Chen, H. M., Lo, H. F. (2010). Quantitative trait loci influencing fruit-related characteristics of tomato grown in high-temperature conditions. Euphytica 174, 119–135. doi: 10.1007/s10681-010-0147-6
Liu, Y., Dong, S., Wei, S., Wang, W., Miao, H., Bo, K., et al. (2021). QTL mapping of heat tolerance in cucumber (Cucumis sativus L.) at adult stage. Plants (Basel) 10, 324. doi: 10.1186/1939-8433-6-36
Lopes, M. S., Reynolds, M. P. (2012). Stay-green in spring wheat can be determined by spectral reflectance measurements (norMalized difference vegetation index) independently from phenology. J. Exp. Bot. 63, 3789–3798. doi: 10.1093/jxb/ers071
Lucas, M. R., Ehlers, J. D., Huynh, B. L., Diop, N. N., Roberts, P. A., Close, T. J. (2013). Markers for breeding heat-tolerant cowpea. Mol. Breeding. 31, 529–536. doi: 10.1007/s11032-012-9810-z
Mason, R. E., Singh, R. P. (2014). Considerations when deploying canopy temperature to select high yielding wheat breeding lines under drought and heat stress. Agronomy 4, 191–201. doi: 10.3390/agronomy4020191
Meng, L., Li, H., Zhang, L., Wang, J. (2015). QTL IciMapping: Integrated software for genetic linkage map construction and quantitative trait locus mapping in biparental populations. Crop J. 3, 269–283. doi: 10.1016/j.cj.2015.01.001
MOAFW. (2021). Third advanced estimates of area and production of Horticulture crops for 2021-22. https://agricoop.nic.in/en/StatHortEst#gsc.tab=0 [Accessed April 24, 2023].
Mondal, S., Singh, R. P., Crossa, J., Huerta Espino, J., Sharma, I., Chatrath, R., et al. (2013). Earliness in wheat: a key to adaptation under terminal and continual high temperature stress in South Asia. Field Crops Res. 151, 19–26. doi: 10.1016/j.fcr.2013.06.015
Murray, M. G., Thompson, W. F. (1980). Rapid isolation of high molecular weight plant DNA. Nucleic Acids Res. 8, 4321–4325. doi: 10.1093/nar/8.19.4321
Nicotra, A. B., Leigh, A., Boyce, C. K., Jones, C. S., Niklas, K. J., Royer, D. L., et al. (2011). The evolution and functional significance of leaf shape in the angiosperms. Funct. Plant Biol. 38, 535–552. doi: 10.1071/FP11057
Ogweno, J. O., Song, X. S., Shi, K., Hu, W. H., Mao, W. H., Zhou, Y. H., et al. (2008). Brassinosteroids alleviate heat-induced inhibition of photosynthesis by increasing carboxylation efficiency and enhancing antioxidant systems in. Lycopersicon esculentum. J. Plant Growth Regul. 27, 49–57. doi: 10.1007/s00344-007-9030-7
Olivoto, T., Lúcio, A. D. (2020). metan: An R package for multi-environment trial analysis. Methods Ecol. Evol. 11, 783–789. doi: 10.1111/2041-210X.13384
Paliwal, R., Roder, M. S., Kumar, U., Srivastava, J. P., Joshi, A. K. (2012). QTL mapping of terminal heat tolerance in hexaploid wheat (T. aestivum L.). Theor. Appl. Genet. 125, 561–575. doi: 10.1007/s00122-012-1853-3
Pinto, R. S., Lopes, M. S., Collins, N. C., Reynolds, M. P. (2016). Modelling and genetic dissection of staygreen under heat stress. Theor. Appl. Genet. 129, 2055–2074. doi: 10.1007/s00122-016-2757-4
Poli, Y., Basava, R. K., Panigrahy, M., Vinukonda, V. P., Dokula, N. R., Voleti, S. R., et al. (2013). Characterization of a Nagina22 rice mutant for heat tolerance and mapping of yield traits. Rice 6, 1–9. doi: 10.1186/1939-8433-6-36
Poudyal, D., Rosenqvist, E., Ottosen, C. O. (2018). Phenotyping from lab to field–tomato lines screened for heat stress using Fv/Fm maintain high fruit yield during thermal stress in the field. Funct. Plant Biol. 46, 44–55. doi: 10.1071/FP17317
Rajametov, S. N., Yang, E. Y., Jeong, H. B., Cho, M. C., Chae, S. Y., Paudel, N. (2021). Heat treatment in two tomato cultivars: A study of the effect on physiological and growth recovery. Horticulturae 7, 119. doi: 10.3390/horticulturae7050119
Saint Pierre, C., Crossa, J., Manes, Y., Reynolds, M. P. (2010). Gene action of canopy temperature in bread wheat under diverse environments. Theor. Appl. Genet. 120, 1107–1117. doi: 10.1007/s00122-009-1238-4
Saisupriya, P., Saidaiah, P. (2021). “Breeding in Chilli,” in Advances in genetics and plant breeding. Ed. Saidaiah, P. (New Delhi: AkiNik Publications), 155–168.
Song, H., Huang, Y., Gu, B. (2020). QTL-Seq identifies quantitative trait loci of relative electrical conductivity associated with heat tolerance in bottle gourd (Lagenaria siceraria). PloS One 15 (11), 1–16. doi: 10.1371/journal.pone.0227663
Srivastava, A., Mangal, M., Parihar, B. R. (2020). Development and characterization of heat tolerant genotypes in chilli (Capsicum annuum L.). Ann. Hortic. 13, 34–38. doi: 10.5958/0976-4623.2020.00004.3
Srivastava, A., Singh, K., Khar, A., Parihar, B. R., Tomar, B. S., Mangal, M. (2022). Morphological, biochemical and molecular insights on responses to heat stress in chilli. Indian J. Hortic. 79, 15–22. doi: 10.5958/0974-0112.2022.00003.2
Talukder, S. K., Babar, M. A., Vijayalakshmi, K., Poland, J., Prasad, P. V., Bowden, R., et al. (2014). Mapping QTL for the traits associated with heat tolerance in wheat (Triticum aestivum L.). BMC Genet. 15, 97. doi: 10.1186/s12863-014-0097-4
Usman, M. G., Rafii, M. Y., Ismail, M. R., Malek, M. A., Abdul Latif, M. (2014). Heritability and genetic advance among chili pepper genotypes for heat tolerance and morphophysiological characteristics. Sci. World J. 2014, 1–14. doi: 10.1155/2014/308042
Vales, M. I., Schon, C. C., Capettini, F., Chen, X., Corey, A., Mather, D., et al. (2005). Effect of population size on the estimation of QTL: A test using resistance to barley stripe rust. Theor. Appl. Genet. 111, 1260–1270. doi: 10.1007/s00122-005-0043-y
Vargas, Y., Mayor-Duran, V. M., Buendia, H. F., RuizGuzman, H., Raatz, B. (2021). Physiological and genetic characterization of heat stress effects in a common bean RIL population. PloS One 16, e0249859. doi: 10.1371/journal.pone.0249859
Villalon, B. (1981). Breeding peppers to resist virus diseases. Plant Dis. 65, 557–561. doi: 10.1094/PD-65-557
Voorrips, R. E. (2002). MapChart: software for the graphical presentation of linkage maps and QTLs. J. Hered. 93, 77–78. doi: 10.1093/jhered/93.1.77
Wang, Y., Diehl, A., Wu, F., Vrebalov, J., Giovannoni, J., Siepel, A., et al. (2008). Sequencing and comparative analysis of a conserved syntenic segment in the Solanaceae. Genetics 180, 391–408. doi: 10.1534/genetics.108.087981
Xu, J., Driedonks, N., Rutten, M. J. M., Vriezen, W. H., de Boer, G. J., Rieu, I. (2017). Mapping quantitative trait loci for heat tolerance of reproductive traits in tomato (Solanum lycopersicum). Mol. Breed. 37, 58. doi: 10.1007/s11032-017-0664-2
Keywords: Capsicum annuum, heat tolerance, QTL mapping, additive effect, dominance effect, phenotyping, genotyping
Citation: TS A, Srivastava A, Tomar BS, Behera TK, Krishna H, Jain PK, Pandey R, Singh B, Gupta R and Mangal M (2023) Genetic analysis of heat tolerance in hot pepper: insights from comprehensive phenotyping and QTL mapping. Front. Plant Sci. 14:1232800. doi: 10.3389/fpls.2023.1232800
Received: 01 June 2023; Accepted: 31 July 2023;
Published: 25 August 2023.
Edited by:
Sushil Satish Chhapekar, University of Missouri, United StatesReviewed by:
Usman Aslam, University of Agriculture, Faisalabad, PakistanSatish Kumar Yadava, University of Delhi, India
Copyright © 2023 TS, Srivastava, Tomar, Behera, Krishna, Jain, Pandey, Singh, Gupta and Mangal. This is an open-access article distributed under the terms of the Creative Commons Attribution License (CC BY). The use, distribution or reproduction in other forums is permitted, provided the original author(s) and the copyright owner(s) are credited and that the original publication in this journal is cited, in accordance with accepted academic practice. No use, distribution or reproduction is permitted which does not comply with these terms.
*Correspondence: Manisha Mangal, bWFuaXNoYW1hbmdhbEByZWRpZmZtYWlsLmNvbQ==; bWFuaXNoYS5tYW5nYWxAaWNhci5nb3YuaW4=