 Luke Bell
 Martin Chadwick
 Manik Puranik
 Jake Jasper2
 Lisa Methven
 Carol Wagstaff
- 1School of Agriculture, Policy & Development, Crop Sciences, University of Reading, Reading, United Kingdom
- 2School of Chemistry, Food & Pharmacy, Food & Nutritional Sciences, University of Reading, Reading, United Kingdom
- 3Vegetable Plant Breeding, Elsoms Seeds Ltd., Spalding, United Kingdom
Rocket (Eruca vesicaria subsp. sativa) is a source of sulfur-containing glucosinolates (GSLs). GSLs and their breakdown hydrolysis products (GHPs) are responsible for health-related benefits, such as anti-cancer and anti-neurodegenerative properties. Understanding how phytochemical composition changes between cultivation environments is key to developing cultivars with improved nutritional quality. Two consecutive harvests (first and second regrowth) of crops, grown in both Italy and the UK, were used to determine the phytochemical and transcriptomic differences between six lines of Eruca. Samples were taken upon delivery from field sites (D0) and after five days of cold storage (D5) for each location. Leaves were analysed for sulfur content, volatile organic compounds (VOCs), GSLs, GHPs, and sugars. Transcriptome data were associated with metabolite profiles to identify differentially expressed genes between plants grown in the two environments. VOC compounds (carbon disulfide, methyl thiocyanate) were associated with growth environment and with differences in sulfur metabolism gene expression (APR2, LSU2, LSU3, SDI1, SiR), GSL biosynthesis (MYB28, FMOGS-OX2) and GHP formation (ESM1, TGG1, TGG2). The concentrations of sugars were an order of magnitude greater in UK grown samples (up to 29.9 mg g-1 dry weight; dw). Sulfur content was significantly higher in the Italy plant samples (11.4 – 20.1 mg g-1 dw), which was in turn associated with higher concentrations of GSLs (pentyl GSL, up to 15.8 μmol g-1 dw; sinigrin, up to 0.005 μmol g-1 dw; glucoraphanin, up to 5.1 μmol g-1 dw; glucorucolamine, up to 23.6 μmol g-1 dw; neoglucobrassicin, up to 5.3 μmol g-1 dw) and hydrolysis products (sativin, up to 13.5 μmol g-1 dw; erucin, up to 1 μmol g-1 dw; sulforaphane, up to 34.7 μmol g-1 dw). VOC profiles of plants cultivated in the UK were distinct from Italy grown plants, with higher relative abundances of alkanes and esters in second cut and shelf-life (D5) samples. The data indicate a significant interaction of cultivar response with environment, highlighting the difficulty of producing Eruca crops with consistent phytochemical and postharvest traits. Genes with differential expression between plants grown in Italy and the UK could be used as markers of phytochemical quality and composition.
Introduction
‘Salad’ rocket (Eruca vesicaria subsp. sativa; also known as arugula and rucola) is a member of the Brassicaceae family and is closely related to thale cress (Arabidopsis thaliana), cabbage (Brassica oleracea), and radish (Raphanus sativus; Bell et al., 2020a). It is widely consumed across the world as a leafy vegetable and has become naturalized on every inhabited continent (Tripodi et al., 2021). Leaves are known for their characteristic peppery flavour, pungent aroma, and bitter taste (Bell et al., 2017a); however, the intensity of these attributes is closely linked with the cultivation environment (Bell et al., 2020b). Previous research has shown that high growth temperatures are associated with increased concentrations of defensive phytochemicals called glucosinolates (GSLs) (Jasper et al., 2020). These compounds are hydrolysed by endogenous myrosinase enzymes and their cofactors to produce volatile organic chemical (VOC) hydrolysis products such as isothiocyanates (ITCs; Blažević et al., 2019). ITCs compounds are associated with beneficial health effects in humans (Bell and Wagstaff, 2017), but some impart bitterness and pungency that a large proportion of consumers find repellent (Bell et al., 2017b; Oloyede et al., 2021). Previous research on the sensory properties and consumer acceptability of Eruca have found that most consumers prefer sweet, peppery leaves with low levels of pungency and bitterness (Bell et al., 2017b). Given that these attributes are responsive to cultivation practices and growth conditions it is challenging to produce crops with consistent quality between growing regions and across growing seasons.
GSL profiles of Eruca plants are now well established (Bell et al., 2021), however the impacts of environment on the formation and abundance of their hydrolysis products (GHPs) are less well studied. There are many theoretical ways in which GSL hydrolysis can be promoted or inhibited depending on the native cellular environment (pH and temperature; Nastruzzi et al., 2000), presence/absence of enzyme co-factors (Backenköhler et al., 2018) and abundance of other cellular metabolites (including sugars, such as glucose, fructose, galactose, and sucrose; Román et al., 2018). Few studies have examined how different field conditions impact the formation of GHPs from Eruca leaves, which is problematic, as the generation of these compounds underpins the basis of sensory properties and postharvest quality traits. The practice of harvesting Eruca plants multiple times also presents challenges in maintaining the consistency of produce, as increases in GHPs make the leaves more pungent (Bell et al., 2020b). The genetic mechanisms regulating hydrolysis are poorly understood, and evidence from previous studies in related species suggests that there is a significant genotypic component that determines the abundance of GHPs (Witzel et al., 2019) and other VOCs (Guijarro-Real et al., 2020) that are produced.
Previous research has identified sugars as a component that reduce or ‘mask’ the pungency and bitterness of Eruca leaves (Bell et al., 2017a). The accumulation of sugars in leaves is closely linked with environment (Song et al., 2017), however the regulation of sugar metabolism in response to environmental factors remains unclear. Eruca itself is a Mediterranean species and has become naturalized in colder regions of the world, leading researchers to hypothesize that the higher concentrations of sugars observed in the UK may be due to a cold stress response (Bell et al., 2022). As demonstrated by Román et al. (2018), free sugars themselves may also act as inhibitors of myrosinase, blocking GSL hydrolysis and reducing the abundance of GHPs produced. Understanding the genes associated with sugar accumulation in leaves will assist breeders in selecting lines which have tempered pungency (which are favored by a many consumers), but which also retain high concentrations of secondary metabolites (GSLs) and produce health-related breakdown products (GHPs).
In this study we conducted metabolomic and transcriptomic profiling of six Eruca lines. These lines were of high (68, 112, 130) and low (21, 25, 72) GSL content and were grown in Italy and the United Kingdom. Leaves of each line were sampled at day 0 (D0; intake of samples at the University of Reading) and day five of shelf-life (D5; cold storage at 4°C) for both first and second harvests of plants. Leaves of the six lines underwent transcriptome sequencing (RNAseq) at two consecutive harvest time points and their corresponding shelf life time point (D5) for both the Italy and UK trials. We hypothesised that specific phytochemical (such as GSLs and sugars), VOC abundances, and GHPs, would be associated with differential expression patterns of genes involved with sulfur assimilation, GSL biosynthesis and hydrolysis, sugar metabolism, and abiotic stress response pathways.
Based on previous field trial observations (Bell et al., 2022) we also hypothesised that UK-grown plants would contain significantly higher concentrations of sugars compared with Italy-grown. The rationale for this hypothesis was based upon reports from growers and processors that rocket leaves produced in the UK are typically of a lower quality (lacking pungency and postharvest longevity) than those from Italy owing to suboptimal pre-harvest temperatures and humidity; this in turn leads to greater levels of disease and stress burden, increasing respiration and the increased need for sugars in primary metabolism (Sami et al., 2016). Previous controlled environment transcriptome and phytochemical analyses of parent line material (of which the plants in this study are derived) has also highlighted the effect of genotype that underpins differences in phytochemical and nutritional traits of Eruca. In this study we aimed to determine if such genetic factors were consistent between growing locations in terms of the relative abundances of GSLs and GHPs produced by lines in each environment (Italy and the UK). Our goal in this research is to study and understand Eruca lines from the perspective of driving high nutritional and phytochemical yield for the improvement of consumers’ long-term health and acceptance.
Materials and methods
Plant materials
Six lines of ‘salad’ rocket were selected from a segregating F2 mapping population of 139 lines based on their high and low abundances of GSLs across two growing locations (Bell et al., 2022). The selected lines were referred to as 21 (low GSL), 25 (low GSL), 68 (high GSL), 72 (low GSL), 112 (high GSL), and 130 (high GSL). Twenty plants of each line were grown, and bulk pollinated (F4B1) in cages within a glasshouse environment at Elsoms Seeds Ltd. (Spalding, UK) to produce sufficient seed amounts for commercial scale productions.
The selected lines were grown in two contrasting environments reflective of commercially produced ‘salad’ rocket leaves: a polytunnel near Rome, Italy (41°55’31.1”N 12°08’15.8”E) in September 2018, and in an open field near Owermoigne, Dorchester, UK (50°40’40.9”N 2°19’34.3”W) in July 2019. The dates were selected because they are representative of the peak output of rocket crops in the two respective growing locations. The UK season is substantially shorter than that in Italy and so production peaks earlier in the year and coincides with increased summer demand for domestic salad leaves. The Italian season peaks later when the UK-domestic season is beginning to decline. For both trials seeds were broadcast seeded in pre-prepared parallel soil beds, as per standard commercial practices in the respective countries. See Table 1 for the weather data of each respective trial.
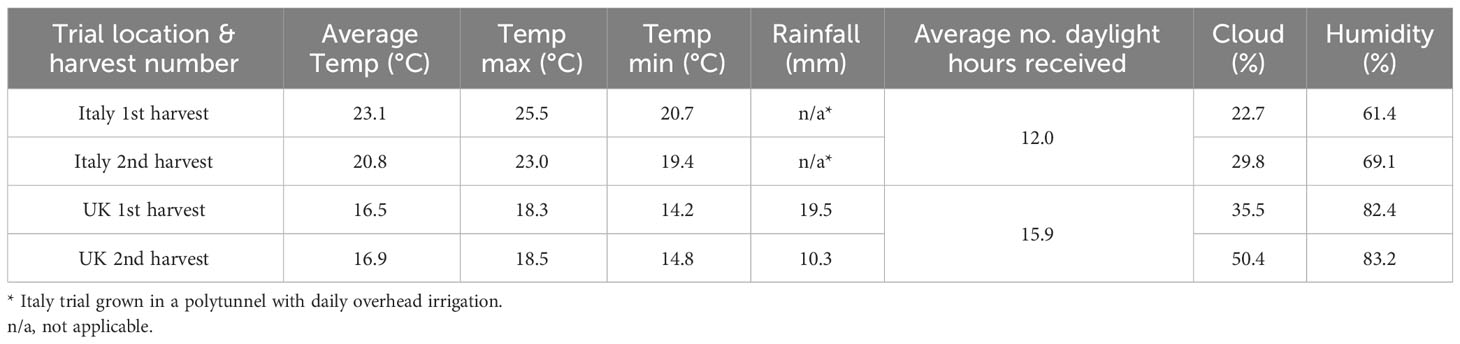
Table 1 Average daily weather data for two ‘salad’ rocket field trials, in Italy and the United Kingdom.
First harvest of Italy grown plants was 23 days after sowing (DAS), and a second harvest at 30 DAS. The UK trial first cut was taken 26 DAS, and a second cut at 37 DAS. The difference in harvest times between locations was due to the difference in respective growth rates, with the Italy trial establishing and re-growing more quickly than the UK trial. Both trials were bordered by a commercial guard crop of commercial salad rocket. Both trials were harvested by band blade machines in the morning. Leaves were placed into crates and vacuum cooled using on-farm facilities at each respective site. Leaves from the Italy trial were transported to the UK in a temperature-controlled van (4°C) and delivered to a processing facility in Owermoigne, Dorchester, UK. Leaves from the UK trial were stored for two days postharvest in a 4°C cold store at the same site to match the duration of leaves in transit from Italy. Each of the rocket lines were washed, rinsed, and spin-dried by hand according to the protocol of Jasper et al. (2020). A sample of 50 g of leaves were taken randomly from crates of each line, placed into microperforated plastic bags, and heat sealed (n = 12 bags per line, per trial). Each 50 g bag constituted a representative biological sample for the subsequent analyses. The sealed bags were then transported via temperature-controlled van (4°C) to the University of Reading School of Chemistry, Food & Pharmacy. All bags were stored overnight in a cold store at 4°C.
Six bags of each line were used for Solid Phase Microextraction (SPME) of VOCs by Gas Chromatography Mass Spectrometry (GC-MS; fresh leaves), and six for other laboratory analyses (lyophilized; see following sections). Three bags were used as D0 samples and the remaining three were stored for a period of five days at 4°C and tested constituting the D5 shelf-life samples. This replicates a typical period that bagged rocket leaves may spend in a domestic refrigerator (Jasper et al., 2021). The six bags for sulfur, GSL, GHP, and sugar extractions were divided in the same fashion and stored for the same corresponding time points. These samples were frozen on dry ice at -80°C to preserve phytochemical (and RNA; see following section) integrity. Samples of each line therefore consisted of the following: 1st cut D0, 1st cut D5, 2nd cut D0, and 2nd cut D5 for both the Italy and UK field trials (see Supplementary File S1 for sampling plan).
Solid Phase Microextraction of VOCs and GC-MS analysis
A 2 g sample of fresh leaves for each cultivar was taken in triplicate from sealed bags. The method of extraction and analysis by SPME GC-MS was identical to that presented by Bell et al. (2021). A list of detected compounds from both Italy and UK trials is presented in Supplementary File S2.
Phytochemical and elemental sulfur extraction and analysis
Bags of each line used for metabolite analyses were lyophilized in batches for three days. Dried leaves were ground into a fine powder using a Wiley Mini Mill (Thomas Scientific, Swedesboro, NJ, USA).
Intact GSLs were extracted and analysed by Ultra High Pressure Liquid Chromatography Triple Quadrupole Mass Spectrometry (UHPLC-MS/MS) according to the method presented by Bell et al. (2021). Authentic standards were purchased from PhytoPlan (Heidelberg, Germany): glucoiberin (GIB; 99.61%), progoitrin (PRO; 99.07%), sinigrin (SIN; 99%), glucoraphanin (GRA; 99.86%), glucoalyssin (GAL; 98.8%), gluconapin (GNP; 98.66%), 4-hydroxyglucobrassicin (4HGB; 96.19%), glucotropaeolin (GTP; 99.61%), glucoerucin (GER; 99.68%), glucobrassicin (GBC; 99.38%), gluconasturtiin (GNT; 98.38%). All compound purities were determined by High Performance Liquid Chromatography Diode Array Detector (HPLC-DAD). Pentyl GSL (PEN), glucorucolamine (GRM), glucoputranjivin (GPJ), diglucothiobeinin (DGTB), glucoberteroin (GBT), glucosativin (GSV), dimeric 4-mercaptobutyl GSL (DMB), 4-methylpentyl GSL (4MP), hexyl GSL (HEX), and butyl GSL (BUT) were semi-quantified using SIN, and 4-methoxyglucobrassicin (4MGB) and neoglucobrassicin (NGB) were semi-quantified using the GBC standard, as no authentic standards were available. GLSs were identified by matching ion spectra and fragmentation with standards and literature sources (Cataldi et al., 2007; Rochfort et al., 2008; Agneta et al., 2012; Maldini et al., 2017; Shi et al., 2017; Andini et al., 2019). PEN, GRM, GPJ, 4MP, and BUT are tentatively identified due to the lack of robust literature ion data and the possibility of being isomers of GSLs with identical mass (Table 2).
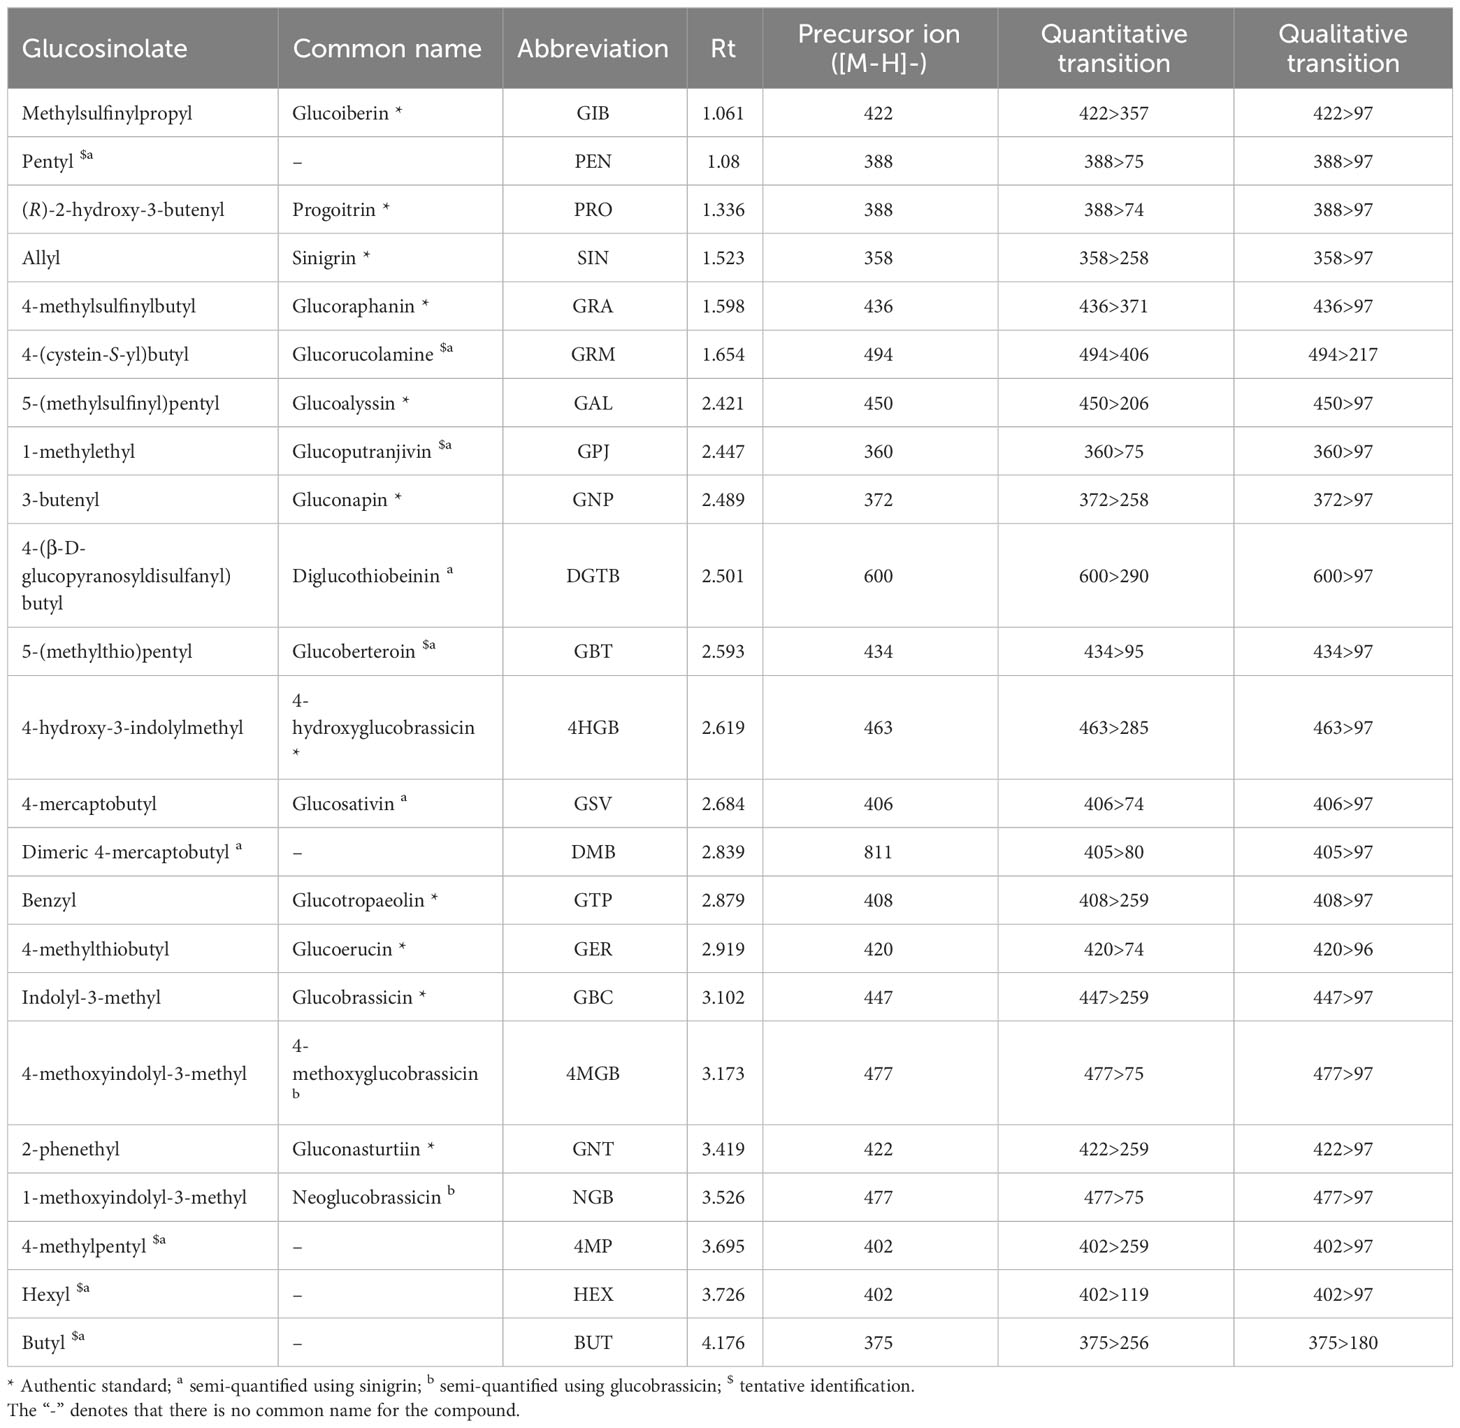
Table 2 Glucosinolate compounds identified in Eruca vesicaria subsp. sativa extreme lines by UPLC-MS/MS.
Semi-volatile GHPs (sativin, SAT; erucin, ERU; sulforaphane, SF; and bis(4-isothiocyanatobutyl) disulfide, B4IBD) and elemental sulfur compositions of Eruca leaves were extracted and analysed in identical fashion to Bell et al. (2020a). GHPs were semi-quantified by GC-MS using authentic SF (Merck-Sigma, Gillingham, UK) as an external standard. Sulfur content was determined by Inductively Coupled Plasma Optical Emission Spectroscopy (ICP-OES) using the radial signal at 181.975 nm.
Sugars were quantified using authentic standards (Merck-Sigma) by High Pressure Ion Chromatography Mass spectrometry (HPIC-MS). The method of extraction was identical to that of Bell et al. (2020a) with the following modification: 1.5 mL aliquots of rocket leaf extracts were diluted with 1.5 mL of dH2O containing an internal standard of rhamnose (20 mM) to give a final concentration of 10 mM. Samples were analysed using a Dionex ICS 6000 (ThermoFisher Scientific, Loughborough, UK) with an eluent gradient composed of 10 mM NaOH (A) and 250 mM NaOH (B). Gradient timetable was as follows: (i) 0 min (A–B, 100:0, v/v); (ii) 0–35 min (A–B, 100:0, v/v); (iii) 35–40 min (A–B, 0:100, v/v); (iv) 40–50 min (A–B, 0:100, v/v); (v) 50–55 min (A–B, 100:0, v/v). The flow rate was 1 mL/min, with a column temperature of 20°C.
RNA extraction, transcriptome sequencing, bioinformatics, and co-expression analysis
RNA extraction, sequencing, bioinformatics and co-expression analysis were performed according to the methods described by Bell et al. (2020a). Extracts were taken from homogenized lyophilized samples corresponding to the same samples and time points outlined for the chemical analyses (Supplementary File S1). All samples were checked for degradation and contamination by gel electrophoresis, Qubit fluorometer, NanoDrop (Thermo Fisher Scientific, Loughborough, UK) and Agilent 2100 Bioanalyzer (Agilent, Santa Clara, CA, USA). Samples not meeting all quality criteria were omitted from downstream analyses (UK trial, lines 21, 25, and 68; 2nd cut D5). RNA library preparation, sequencing, and bioinformatics were performed by Novogene Ltd. (Cambridge, UK) as a service. Full gene expression and annotation data of all samples can be found in the University of Reading Research Data Archive (https://doi.org/10.17864/1947.000458). A co-expression analysis of expression data was performed using the webCEMiTool (Co-Expression Module Identification Tool) pipeline (Cardozo et al., 2019) according to the parameters described by Bell et al. (2020a). Heatmaps and volcano plots were generated using NovoSmart software (Novogene Ltd.).
Statistical analysis
Phytochemical, VOC, and elemental data sets were analysed using XL Stat (Addinsoft, Paris, France). Data were tested for outliers (Grubb’s test) and these values were removed from downstream analyses. Shapiro-Wilk normality tests were conducted for each variable and concluded to fit a normal distribution. Analysis of variance (ANOVA) tests were conducted with line, geographic region (country), harvesting points and storage time, as treatment effects (with interactions); after which post hoc Tukey’s Honest Significant Difference (HSD) was used for pairwise comparison tests (p<0.05). Summary data of these analyses are presented in Supplementary File S3.
Principal Component Analysis (PCA) with Pearson’s correlation analysis (n-1) was performed on sulfur content, phytochemical (GSL, GHP, and sugar) concentrations, and VOC abundances to determine if samples separated according to cultivation location (Italy and UK). A separate PCA analysis of Italy sample data was conducted in conjunction with 258 genes were selected based on genome annotation data (Bell et al., 2020a) and their putative identifications. These included genes associated with sulfur metabolism, GSL biosynthesis, GSL hydrolysis, cell redox homeostasis, GSL transport, defense response, VOC synthesis, and sugar metabolism. This was done to elucidate differences between genotypes and understand the associations between gene expression and metabolite abundance.
Results
Sugar composition
Phytochemical constituent data and statistical results are collated in Supplementary File S4. Sugar analysis of leaves showed a significant difference in concentrations between Italy and UK-grown plants (p = <0.001). The most abundant sugar in Italy samples was fructose, whereas in the UK grown plants glucose was the major sugar component. Total concentrations of sugars in D0 samples were an order of magnitude greater in UK plants than those form Italy (Supplementary File S4). The highest concentration observed was in line 112 (UK, 1st cut, D0), 29.9 mg g-1 dw. This compares with only 0.2 mg g-1 dw for the corresponding Italy-grown plant sample. This difference in sugar concentrations is consistent with previous observations (Bell et al., 2022).
Sulfur content
Sulfur content was significantly higher in Italy plants than in UK plants (p = <0.0001), with the highest average amounts observed in line 68 (Italy, 17.6 mg g-1 dw; UK, 12.1 mg g-1 dw; Figure 1). The lowest average concentrations were found in line 72 in each trial (Italy, 12.6 mg g-1 dw; UK, 8.0 mg g-1 dw).

Figure 1 Average sulfur content of six Eruca vesicaria subsp. sativa extreme lines grown in Italy and the UK. Error bars represent standard error of the mean. Letters above bars indicate significant differences observed for sulfur content for each cultivar between growing locations (p = <0.05).
Volatile organic chemical composition
VOC abundances are presented in Figure 2. A full list of detected VOCs, their mean (normalized) values, and the significance of treatment effects is presented in Supplementary File S2 and Supplementary File S3. The 1st cut D0 VOC profiles between the two trials are similar, however compositional differences are apparent in D5 samples. While Italy plant profiles remained consistent, there is an evident shift in VOC relative abundances in UK leaves with increases in alkanes and esters in all lines (except for 68). In 2nd cut samples this difference is more pronounced, with relative percentage increases in alkanes, esters, and GSL-derived compounds, with corresponding reduction in the abundance of alcohols (Supplementary File S3).
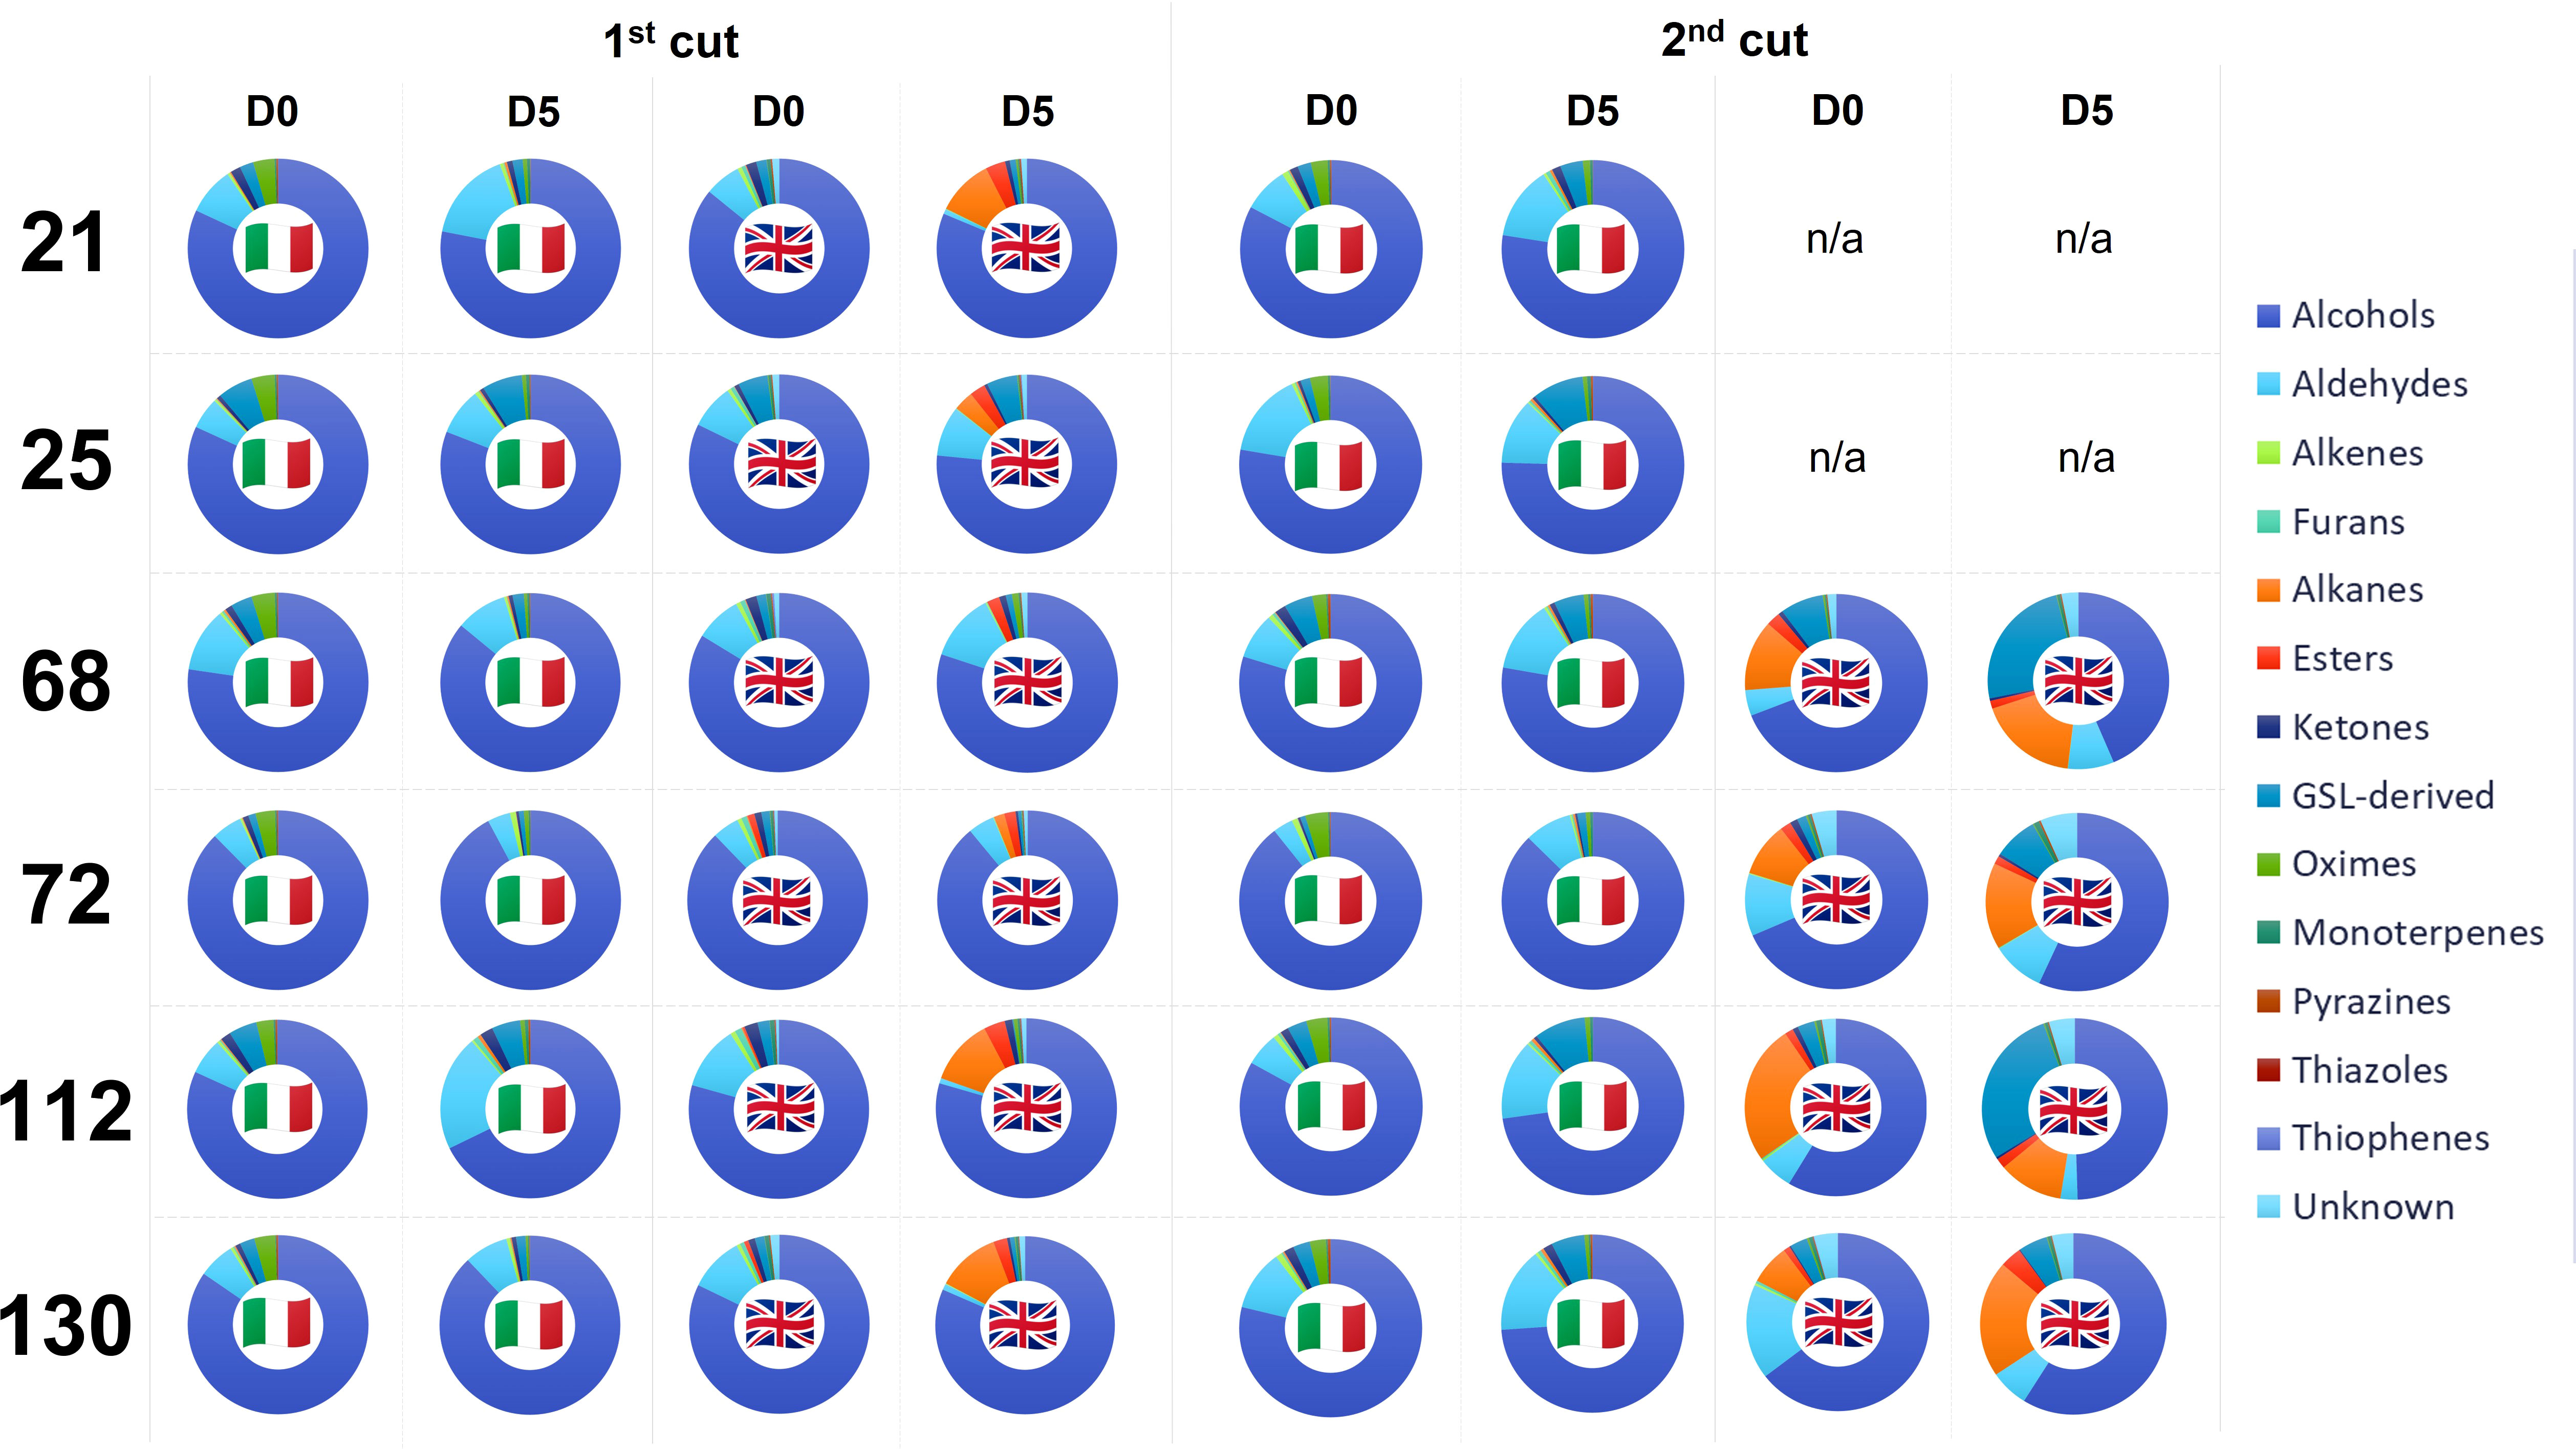
Figure 2 Volatile organic compound (VOC) relative percentage composition for six Eruca extreme lines grown in Italy and the UK across two cuts (1st and 2nd) and two time points; intake (D0) and after five days of shelf-life storage (D5). See inset for VOC colour coding. N.B. UK material for lines 21 and 25 at 2nd cut were not of sufficient quality for robust analysis. See inset for colour coding, which proceeds clockwise from 0°. n/a, not applicable.
96 VOC compounds were identified (38) or tentatively identified (58) across the two cultivation locations and six genotypes tested. Only 31 compounds were detected in both Italy and UK samples (Supplementary File S2), and of these, significant differences in relative abundance were observed for 25 compounds (p = <0.05; Supplementary File S3). A high level of significance was observed for interacting factors of specific VOC relative abundances. 3-methylfuran was primarily observed in Italy-grown samples, with abundances significantly associated with the cultivar x shelf life (time) interaction (p = <0.001). In UK grown samples, the interaction between harvest time and shelf life (time) was significant for several compounds, such as (2Z)-pentene, methyl sulfide, 3-methylfuran, carbon disulfide, (3Z)-3-hexen-1-ol, and β-cyclocitral (p = <0.001). Methyl thiocyanate (a potential breakdown product of ITCs) varied significantly for the cultivar x country interaction effect (p = <0.001), indicating a strong genotype x environment (GxE) effect in determining its abundance. It has been linked with sulfurous and onion-like aromas (Supplementary File S2). Carbon disulfide, 3-methylfuran, and methyl thiocyanate abundances also produced a significant cut x country interaction effect (p = <0.001), and methyl sulfide, (3E)-1,3-pentadiene, 3-methylfuran, and 5-(methylsulfanyl)pentanenitrile abundances had strong interacting effects between shelf life (time) and country. 5-(methylsulfanyl)pentanenitrile is of particular interest as a hydrolysis product of GBT, which has been described as having a radish, cabbage, and broccoli-like aroma (Bell et al., 2021; Supplementary File S2).
Glucosinolate composition
23 GSL compounds were identified in Eruca samples in agreement with previous observations (Bell et al., 2021; Table 2). Concentrations of GSLs were significantly higher in Italy samples compared with UK. Italy 2nd harvest (D0) contained the highest average concentrations (lines 68 and 130 – 191.9 μmol g-1 DW, 213.5 μmol g-1 DW, respectively; Figure 3E). Line 72 produced the lowest average concentrations across both the Italy and UK trials (67.9 μmol g-1 DW, Italy 2nd cut D5, and 11.9 μmol g-1 DW, UK 1st cut D0, respectively). GSL profiles of Italy-grown plants were dominated by DMB, with relatively high concentrations of PEN, GRM, DGTB, and GSV. Of note in line 25 were high concentrations of the tentatively identified 4MP (up to 8.7 μmol g-1 DW, Italy 1st cut D0), which was only observed in very low concentrations in other lines. UK lines contained a lower abundance of DMB relative to GSV, with a significant GxE interaction observed for DMB (p = <0.01) as well as total GSL concentrations (p = <0.001; Supplementary File S3.
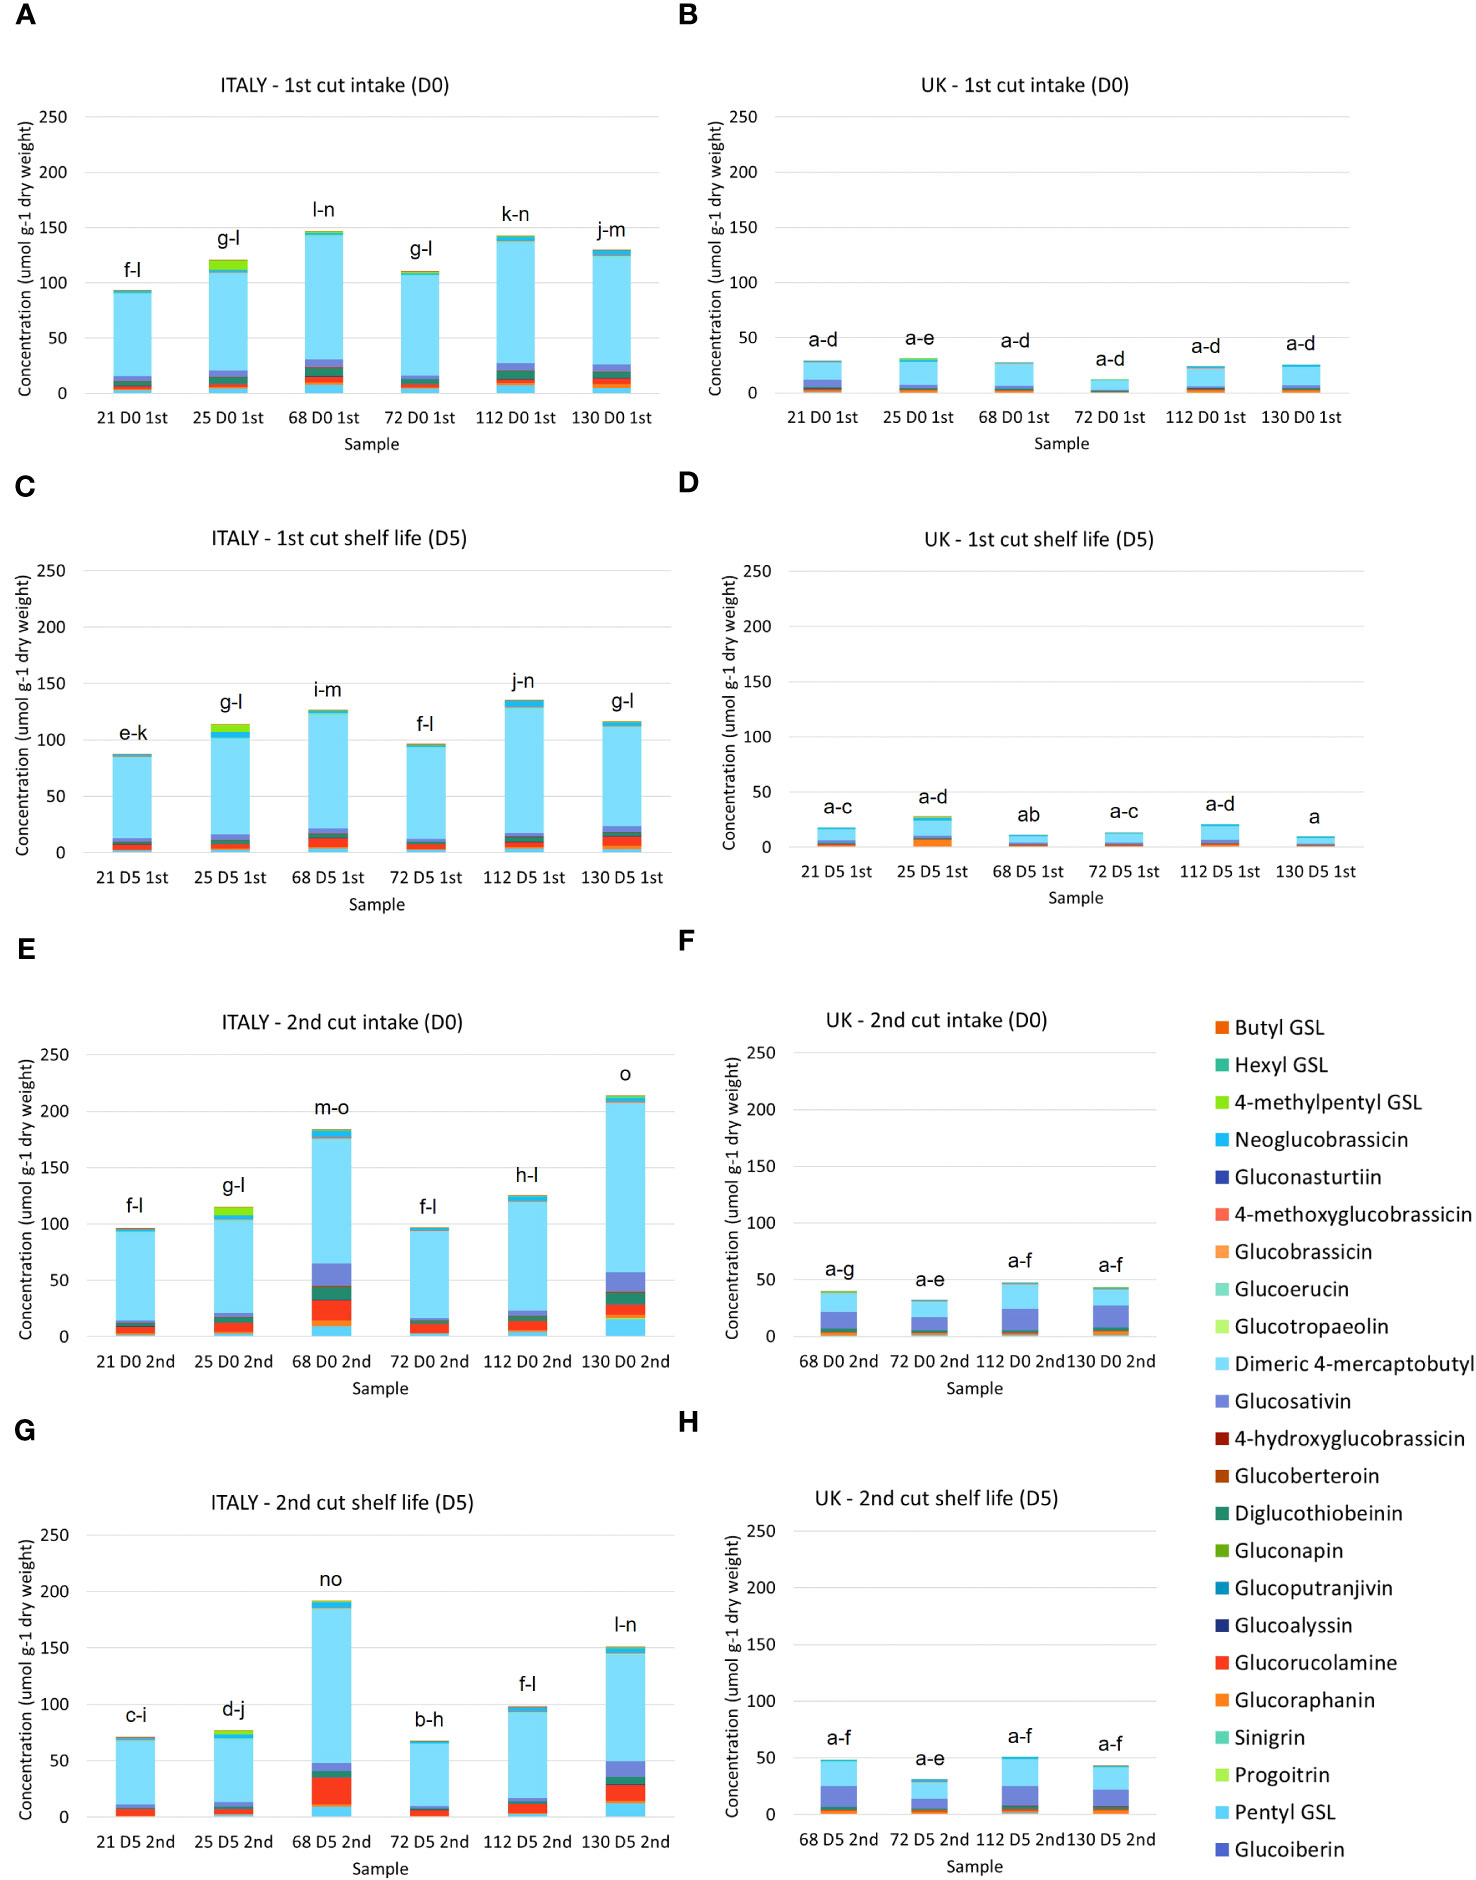
Figure 3 Glucosinolate concentrations of six Eruca vesicaria subsp. sativa extreme lines grown in Italy and the UK. Letters above bars indicate significant differences observed for total glucosinolate concentrations between each sample and environment. (A) Italy, first cut intake (D0); (B) UK, first cut intake (D0); (C) Italy, first cut shelf life (D5); (D) UK, 1st cut shelf life (D5); (E) Italy, second cut intake (D0); (F) UK, second cut intake (D0); (G) Italy, second cut shelf life (D0); (H) UK, second cut shelf life (D5).
Of note was the presence of PEN, GBT, and GTP in Eruca samples, which are rarely reported as constituents of the species GSL profile. The abundances reported here are substantial, and in the case of GBT and GTP verified by comparison with authentic standards. PEN was previously tentatively reported by Bell et al. (2021) in Eruca and hypothesised to have been confused with PRO (both m/z 388) by other studies, and which has been regularly reported. Our analysis showed that the PRO standard (and epiprogoitrin, not found in Eruca but available as a standard) eluted later than the peak identified as PEN. The data suggest that GSL analyses should be conducted with greater attention to such details, and that more comprehensive screening of samples for compounds is required to avoid underreporting of important GSL constituents.
Glucosinolate hydrolysis product composition
Significant differences were observed in the concentrations of semi-volatile GHPs (Supplementary File S3, Figure 4) between Italy and UK samples for all Eruca lines. Very low concentrations were observed for all UK samples, with concentrations in Italy-grown plants over 400-fold greater in one instance (line 130, 1st cut D0). This reflects the trend observed for GSLs (Figure 3). The dominant compounds in extracts were SF and SAT in Italy-grown leaves, and SF and ERU in UK leaves. Lines 68 and 130 produced the highest concentrations at each time point of the Italy trial (36.4 μmol g-1 DW, Italy 2nd cut D0, and 42.9 μmol g-1 DW, Italy 1st cut D0, respectively; Figure 4). The overall difference in GSL and GHP concentrations observed between the two locations is reflected in sulfur content, with Italy samples having significantly higher amounts than the UK (Figure 1).
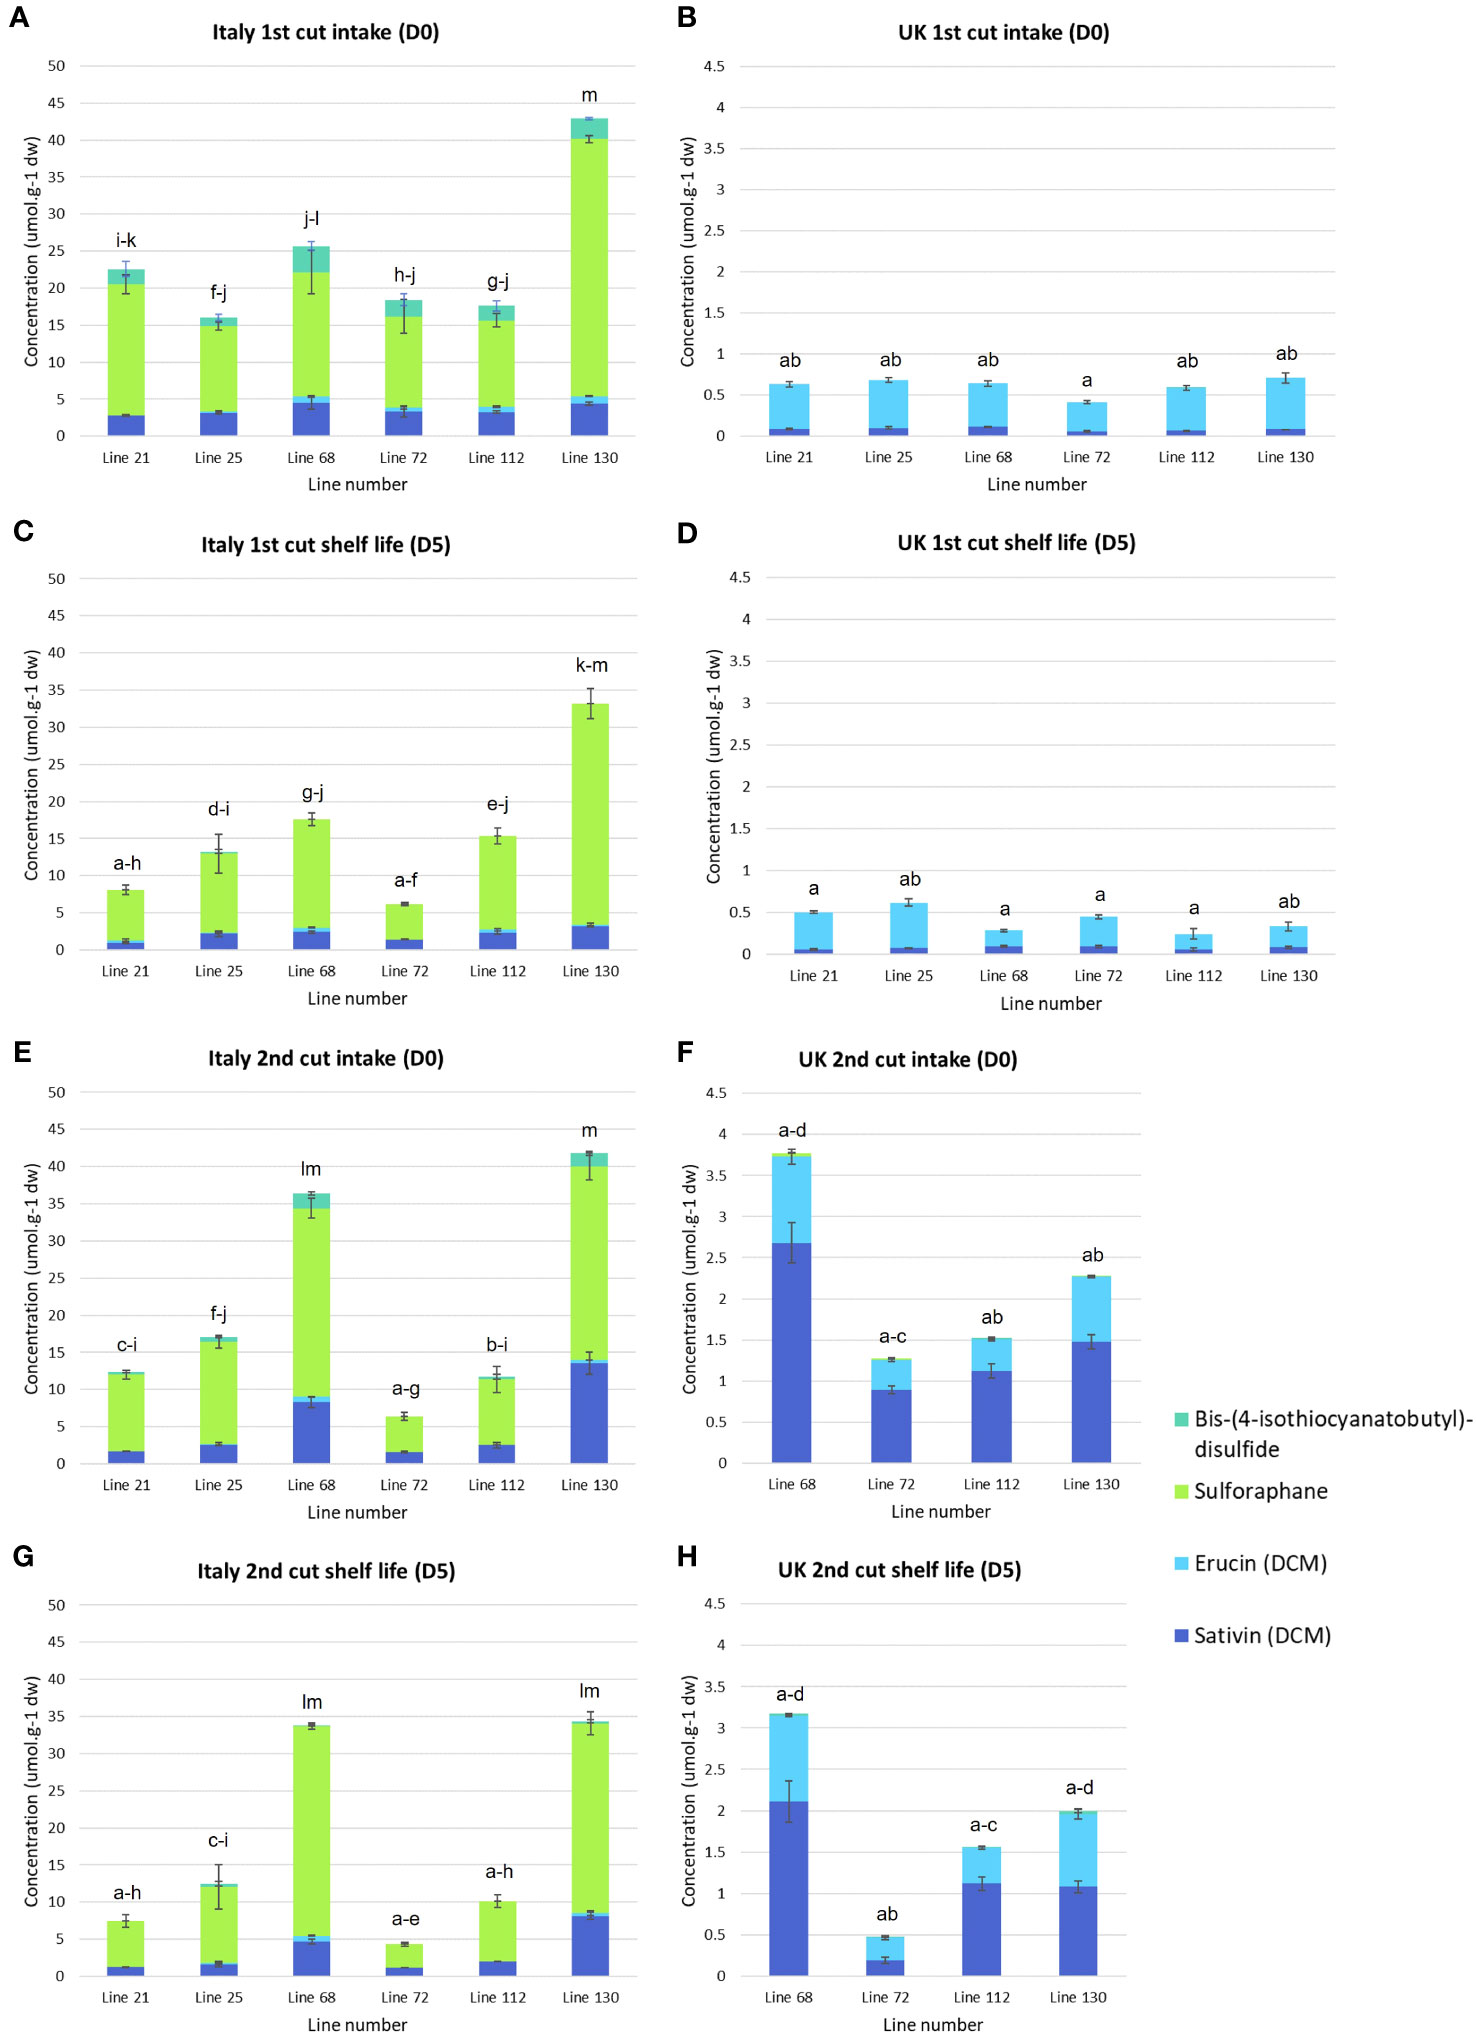
Figure 4 Semi-volatile glucosinolate hydrolysis product concentrations of six Eruca vesicaria subsp. sativa extreme lines grown in Italy and the UK. Error bars represent standard error of the mean for each compound. Letters above bars indicate significant differences observed for total glucosinolate hydrolysis product concentrations between each sample and environment. Note the difference in y-axis scale between Italy and UK samples (B, D, F, H). (A) Italy, first cut intake (D0); (B) UK, first cut intake (D0); (C) Italy, first cut shelf life (D5); (D) UK, 1st cut shelf life (D5); (E) Italy, second cut intake (D0); (F) UK, second cut intake (D0); (G) Italy, second cut shelf life (D0); (H) UK, second cut shelf life (D5).
Plant gene expression and co-expression
Global differential gene expression in Eruca samples between plants grown in the two countries are presented in Figure 5, and between D0 and D5 samples in Figure 6. Data presented in Figure 5 are of UK samples relative to Italy. Data presented in Figure 6 are of D5 samples relative to D0. 2nd cut D5 samples for lines 21, 25, and 68 were omitted due to poor RNA integrity in at least one replicate of UK samples.
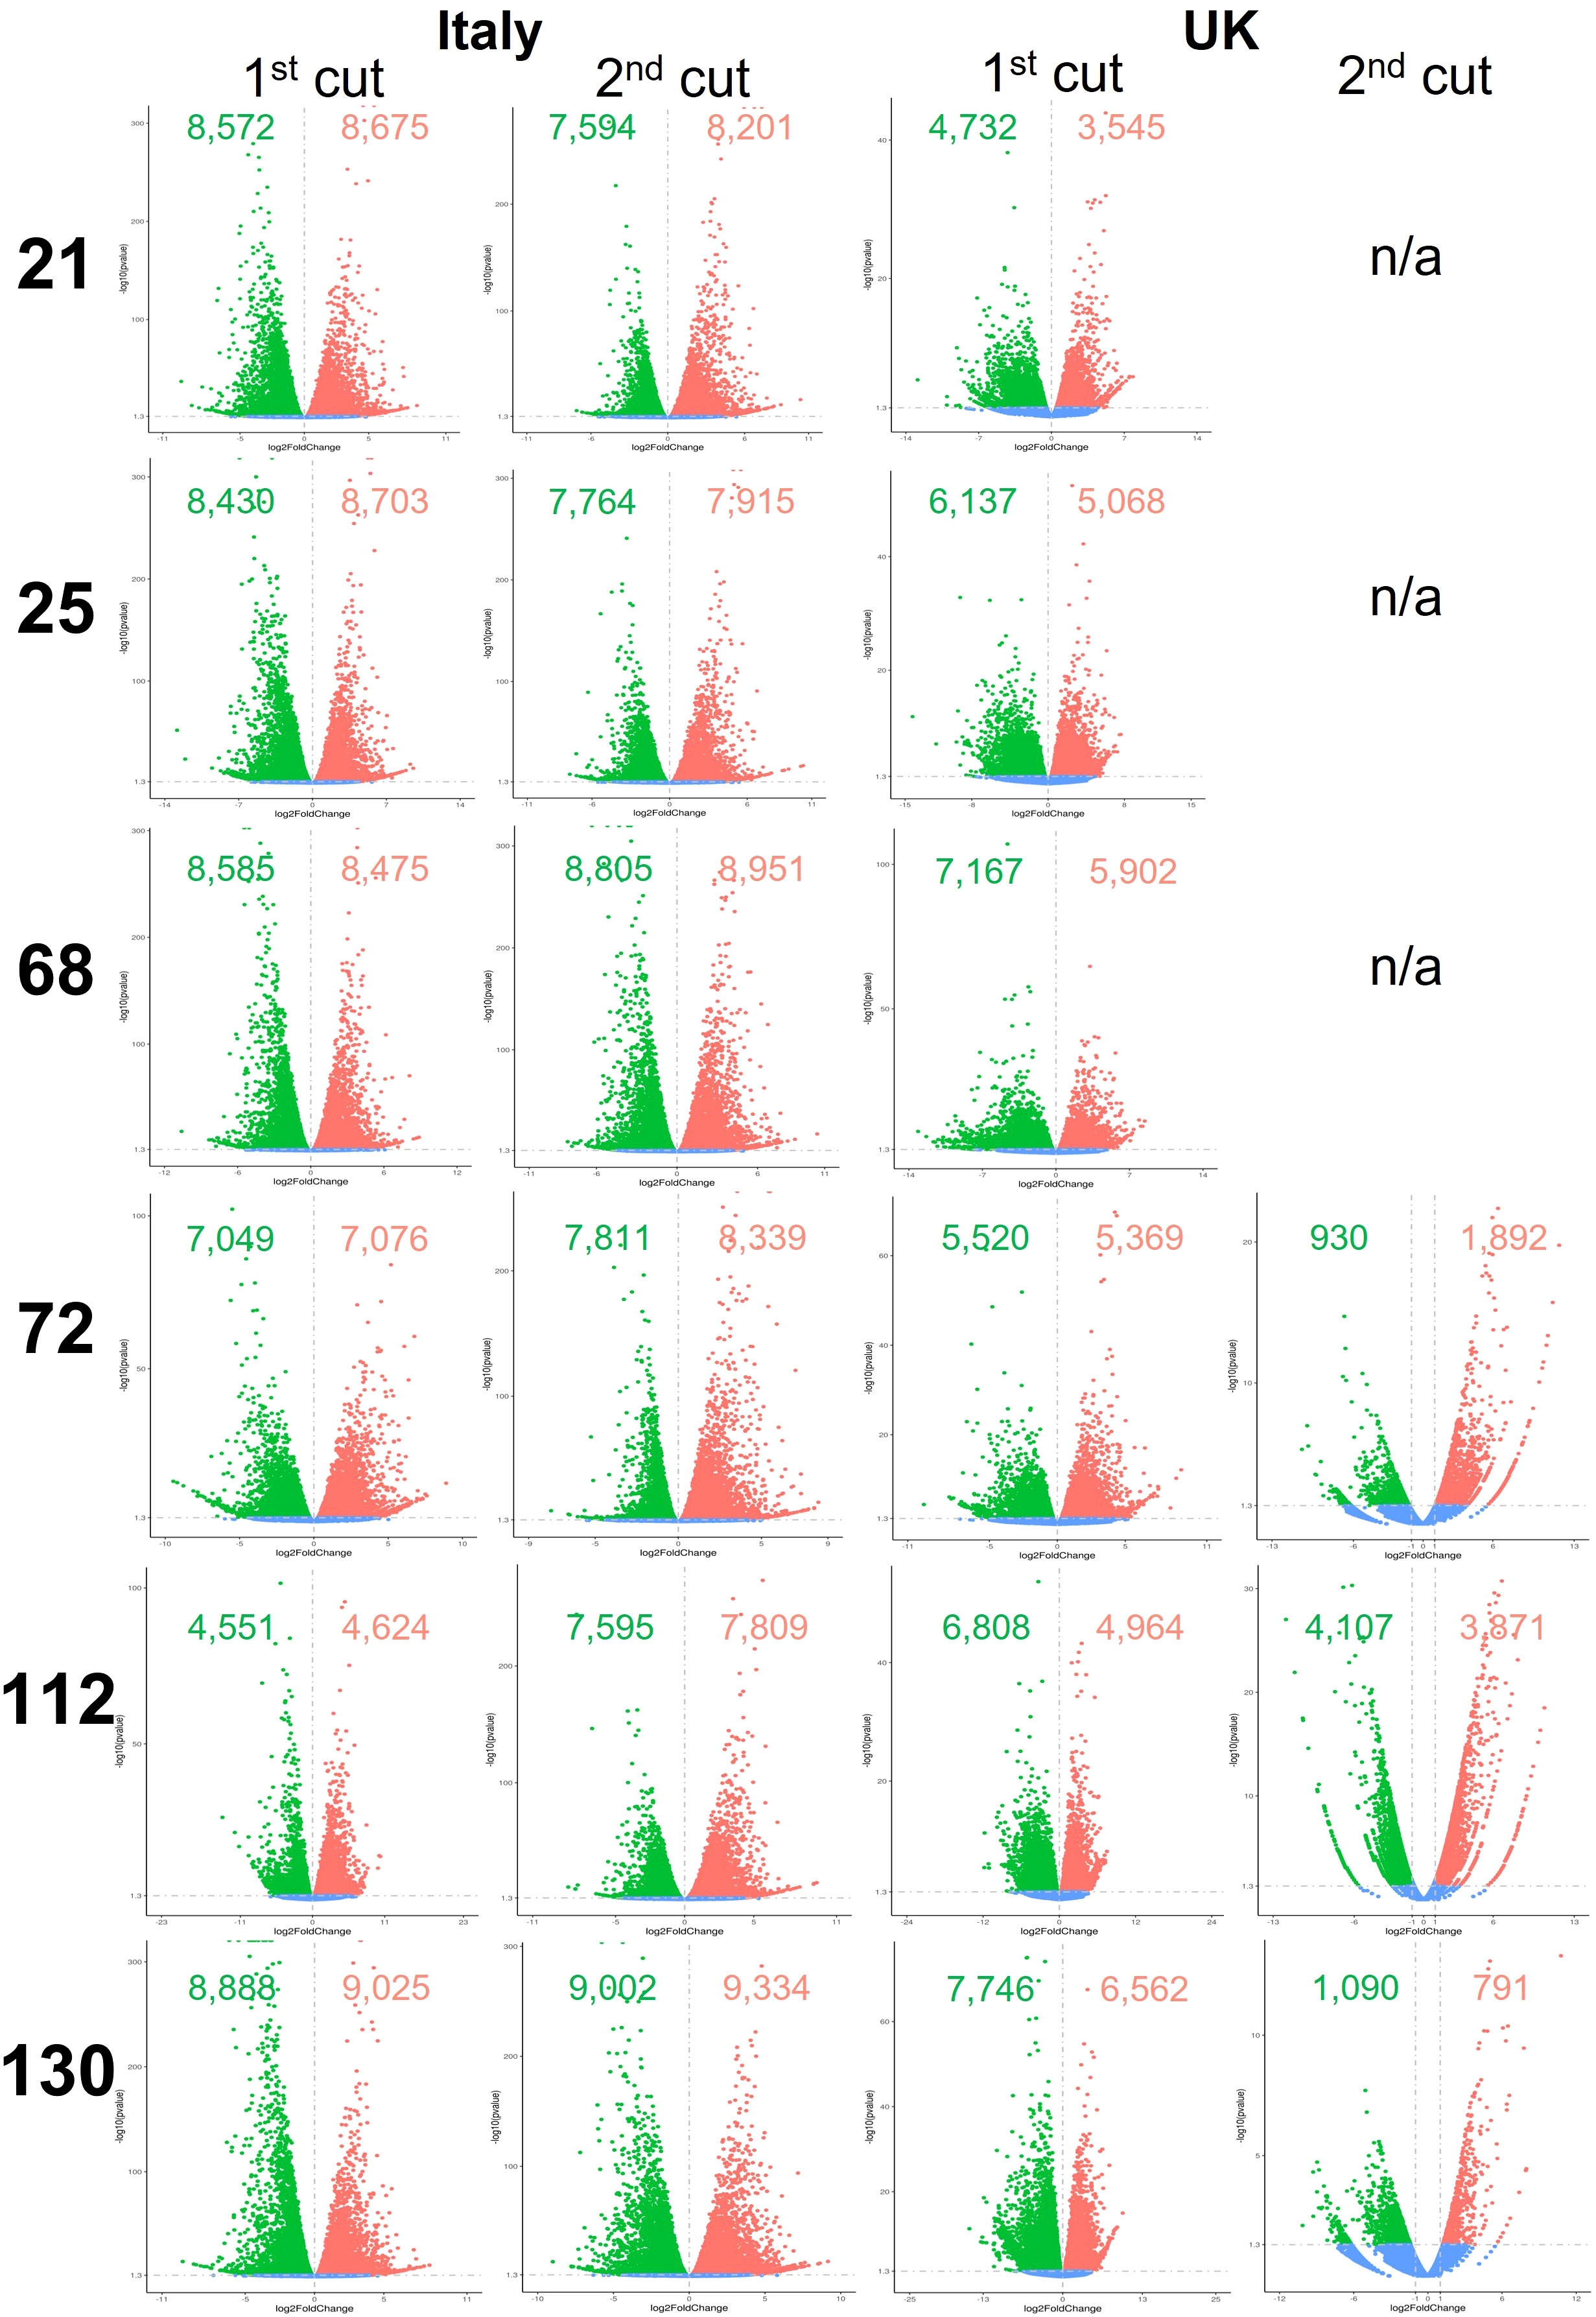
Figure 5 Differentially expressed genes between shelf-life time points (D0 and D5) of six Eruca vesicaria subsp. sativa extreme lines grown in Italy and the UK. Red dots represent significantly up-regulated genes. Green dots represent significantly down-regulated genes. Blue dots represent non-significant differentially expressed genes. Second cut shelf-life samples for lines 21, 25 and 68 grown in the UK were omitted from the analysis because RNA of sufficient quality could not be obtained for these samples. n/a, not applicable.
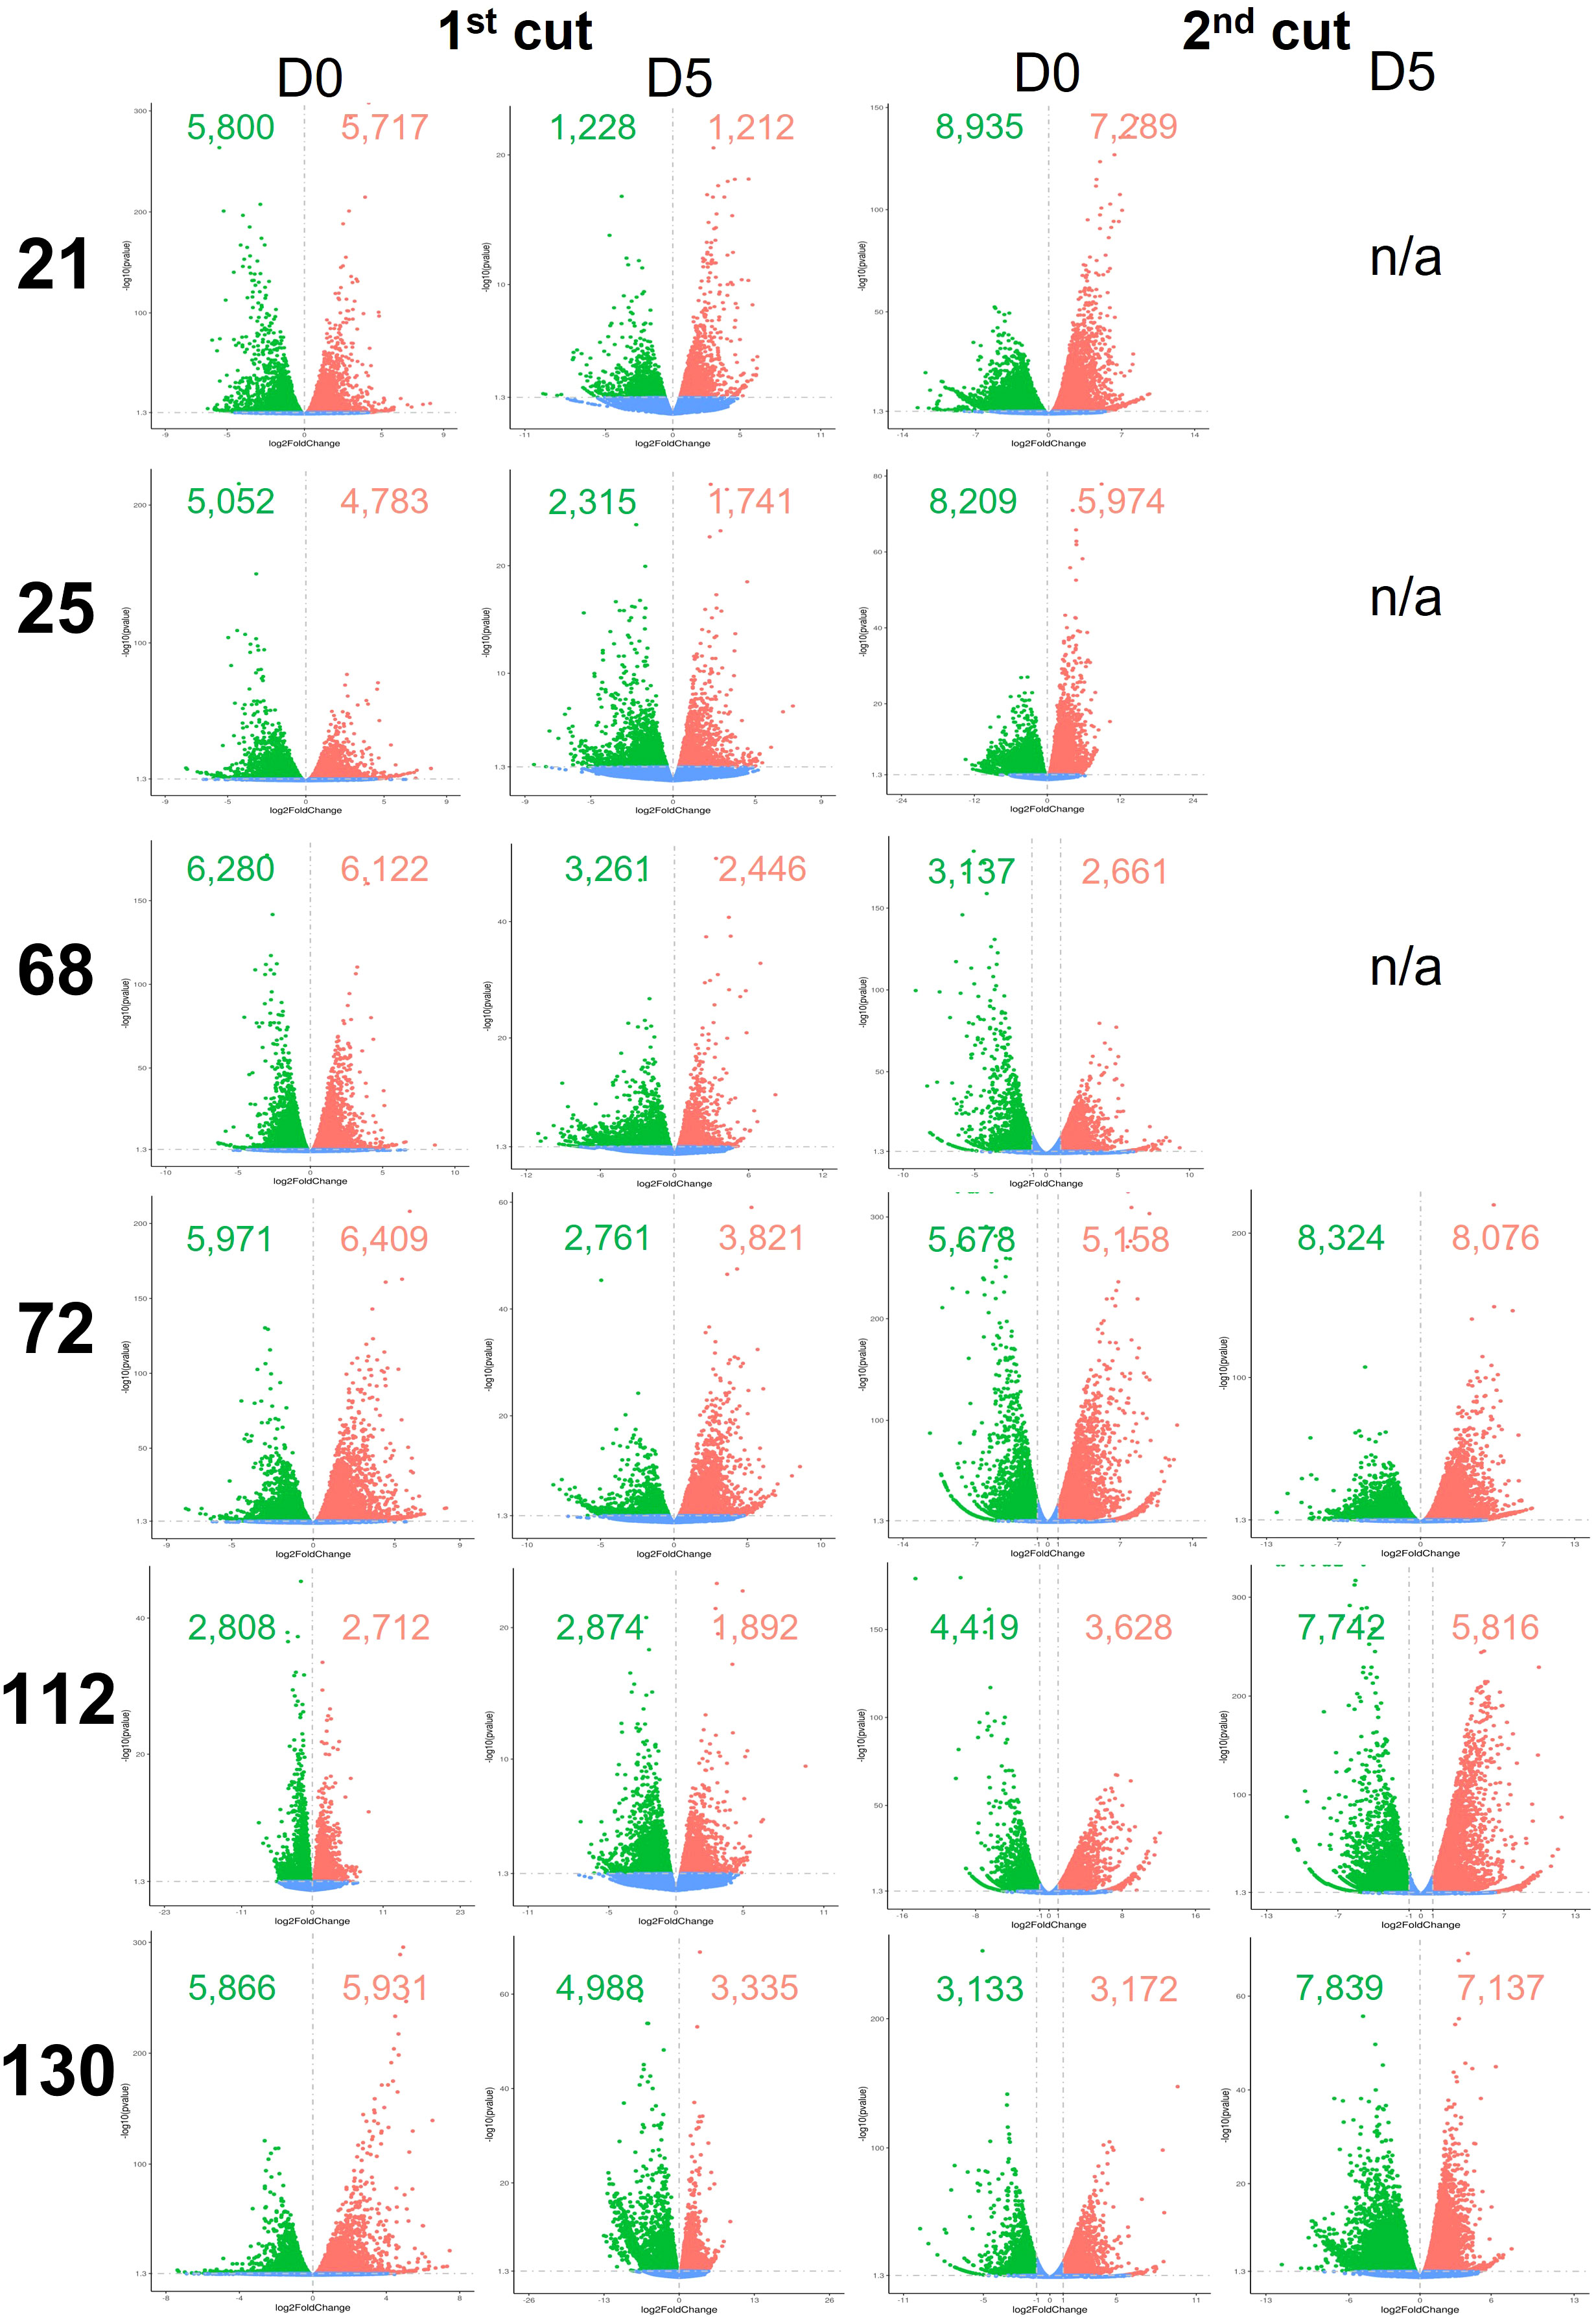
Figure 6 Differentially expressed genes between growing location (Italy and UK) of six Eruca vesicaria subsp. sativa extreme lines grown in Italy and the UK. Red dots represent significantly up-regulated genes. Green dots represent significantly down-regulated genes. Blue dots represent non-significant differentially expressed genes. Second cut shelf-life samples for lines 21, 25 and 68 grown in the UK were omitted from the analysis because RNA of sufficient quality could not be obtained for these samples. n/a, not applicable.
Numbers of differentially expressed genes (DEGs) between plants grown in the two countries and time points are highly genotype dependent. When looking at 1st cut D0, line 112 showed few DEGs (2,712 up, 2,808 down) compared with line 68 (6,122 up, 6,280 down; Figure 6). Different trends were observed in the 2nd cut (D0), where line 68 had a lower number of DEGs (2,661 up, 3,137 down) compared with lines such as 21 (7,289 up, 8,935 down). Expression was more uniform in D5 1st cut than for D5 2nd cut. Lines 72, 112, and 130 showed a 2.1-fold, 3.1-fold, and 2.1-fold change in up-regulated genes (respectively), and a 3.0-fold, 2.7-fold, and 1.6-fold change in the numbers of down-regulated genes (respectively).
DEGs between D0 and D5 samples within each respective country (Figure 5) were high, indicating changes in cellular metabolism postharvest. Two notable exceptions to this were 2nd cuts of lines 72 and 130 in the UK trial. Gene expression was consistent in these samples, with 72 having 1,892 up-regulated genes and 930 down-regulated, and 130 having 791 up-regulated genes and 1,090 down-regulated. This represents a 2.8-fold and 5.9-fold difference (respectively) for 72, and an 8.3-fold and 7.1-fold difference (respectively) for 130 when compared with the UK 1st cut leaves.
Gene co-expression analysis produced 28 modules of varying size (Supplementary File S6) across the six Eruca lines. 12 modules were found to contain genes associated with sulfur metabolism, GSL biosynthesis, GSL hydrolysis, glutathione metabolism, and defense response. Relative expression and enrichment scores for each line are presented in Figure 7. Several genes contained within co-expression modules were found to be significantly differentially expressed between Italy and UK across all leaf samples. Figure 8 shows gene expression for sulfur metabolism, GSL biosynthesis and hydrolysis, and jasmonate (JA) signaling repressors. In nearly all cases expression of these genes was significantly higher in UK-grown plants. The largest co-expression module (M1) contained APR2a, LSU3b, SDI1b, MYB28a, ESM1a, ESM1c, and TGG2b. The only exception was TIFY5Aa, which was expressed significantly more in Italy-grown plants. Two other JA repressors, TIFY5Ab and TIFY5B (M26), also displayed this trend. TIFY5B had 4.6-fold greater expression in Italy leaf samples than UK, for example. Correlation analysis found distinct clusters of associated expression between genes contained in the co-expression modules (Supplementary Files S6) which could be used to develop panels of expression markers for associated quality traits.
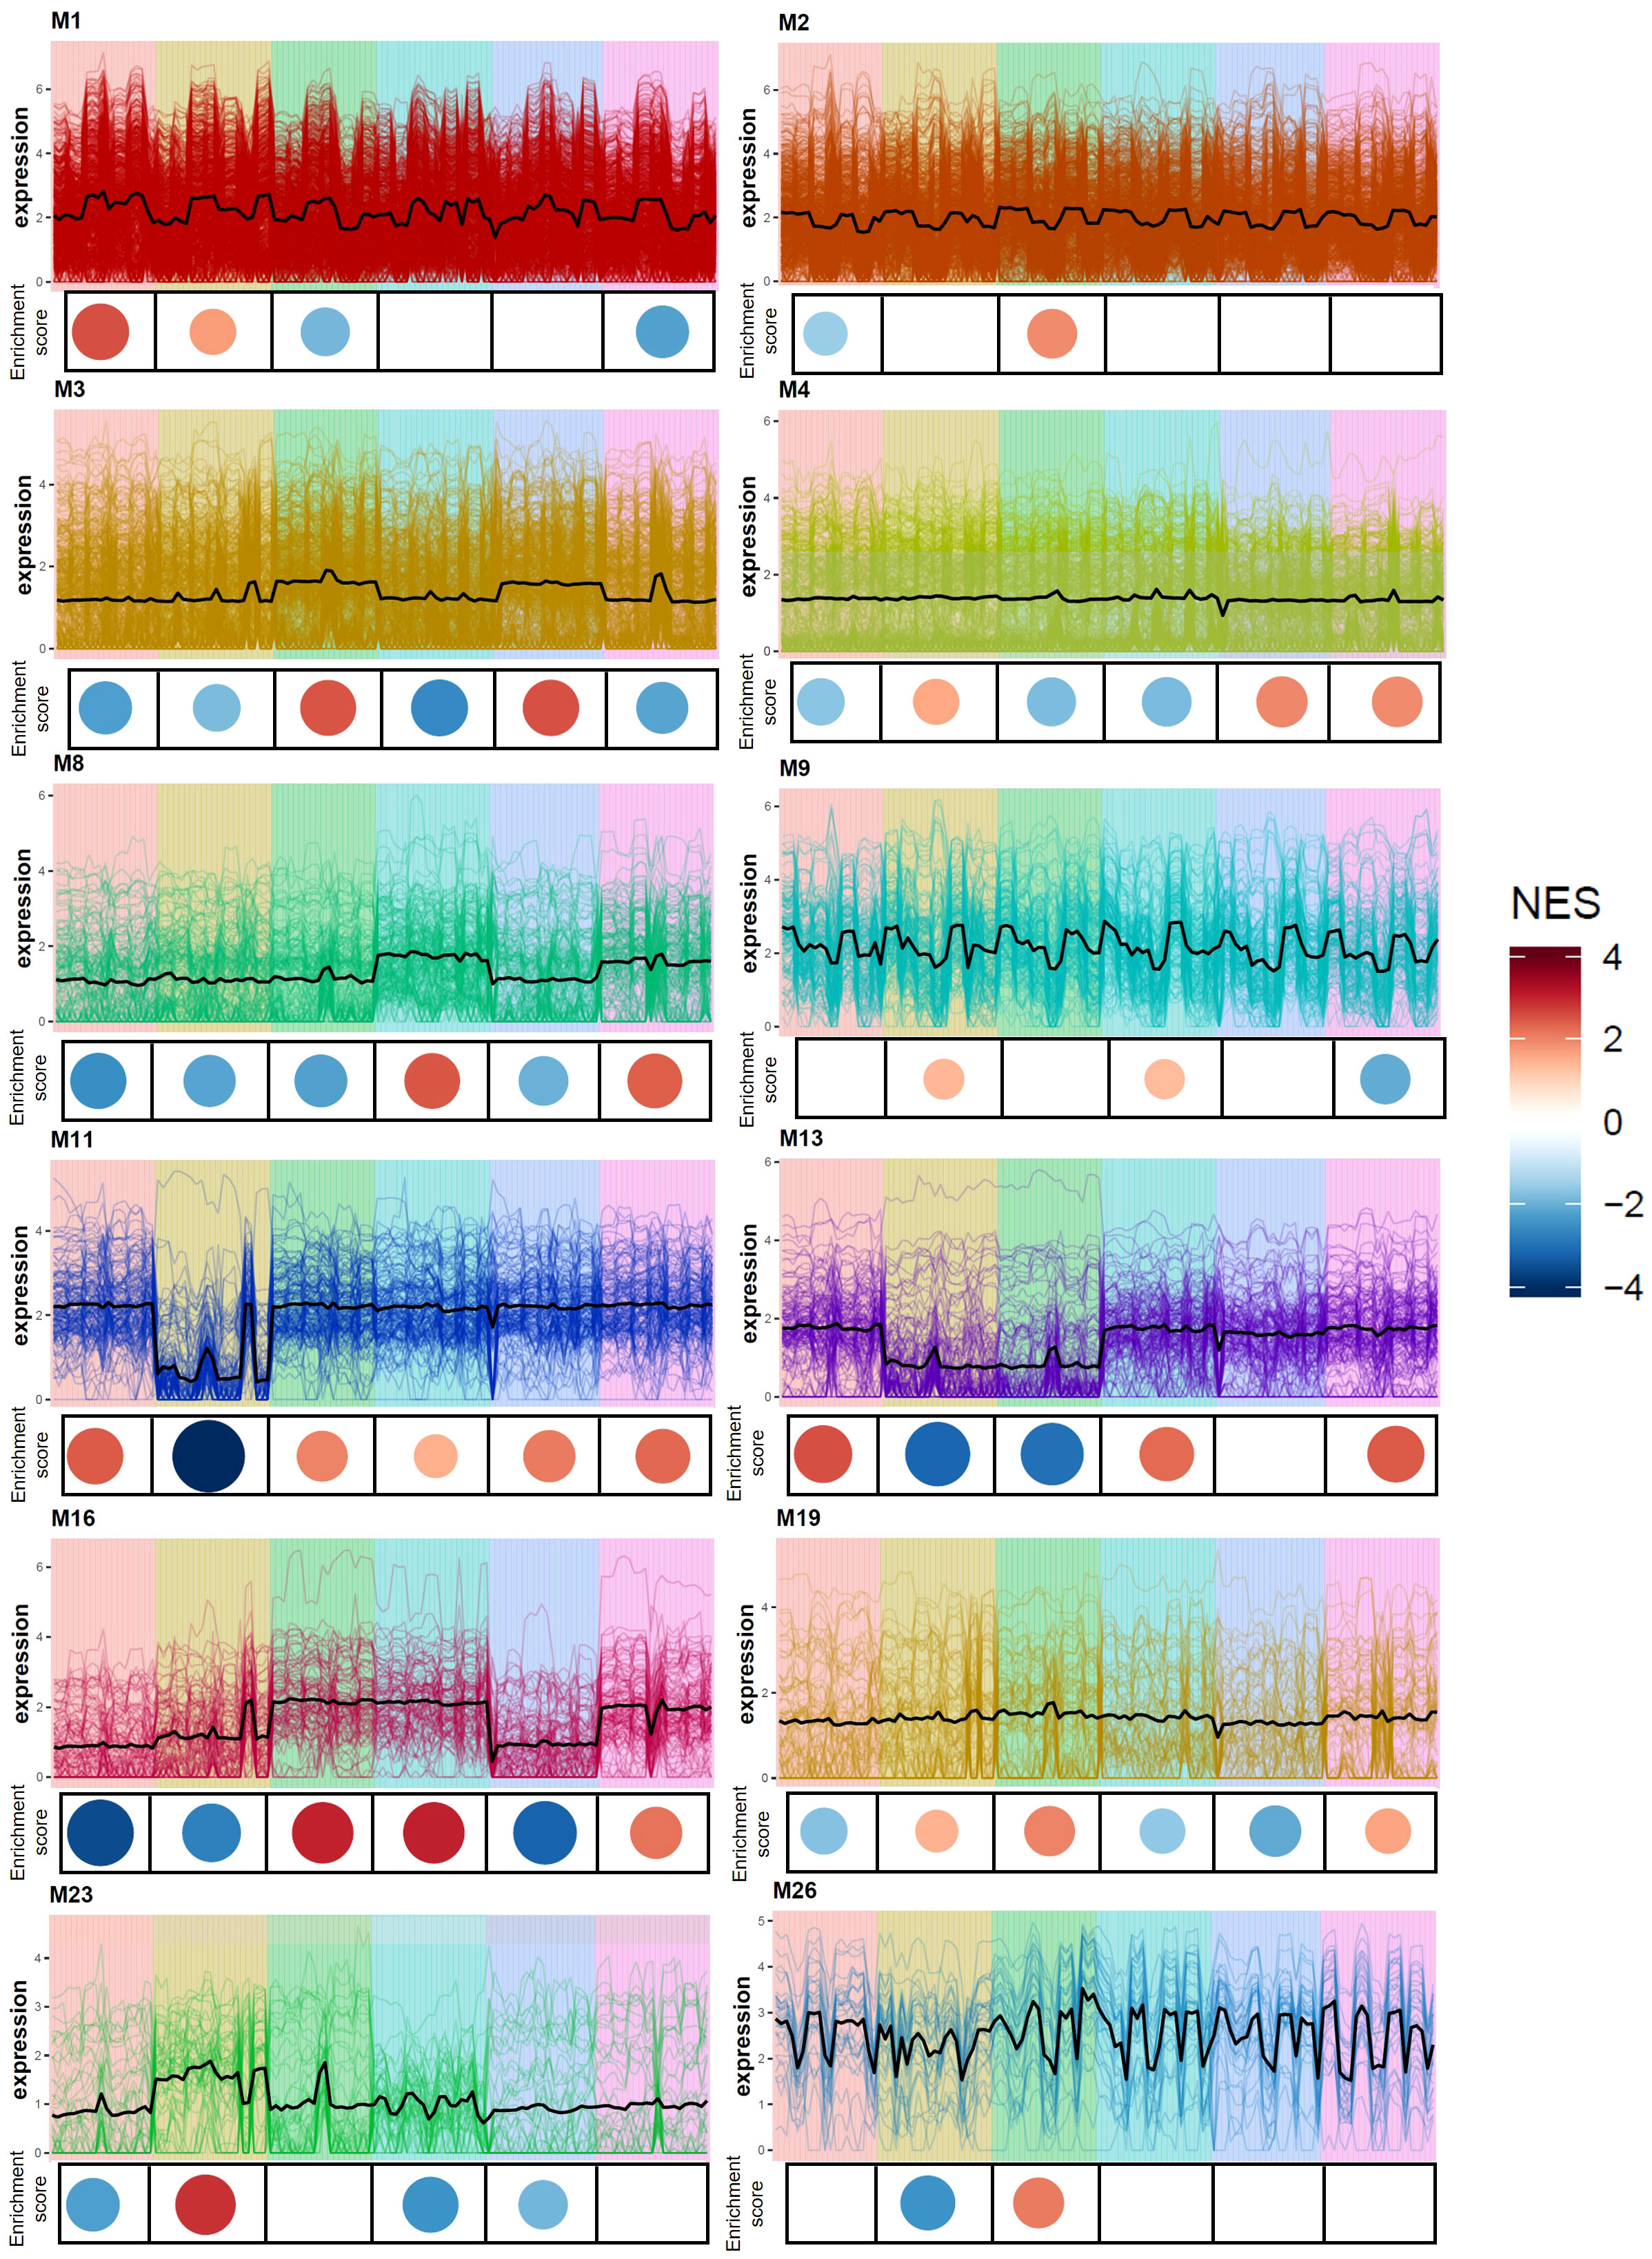
Figure 7 Co-expression gene expression analysis of six Eruca vesicaria subsp. sativa extreme lines. Line charts illustrate expression (fpkm) of genes within each respective module. Coloured circles beneath each line chart signify the normalized enrichment score (NES) of the six Eruca lines. Red signifies enriched up-regulated gene expression, and blue indicates down-regulated gene expression. Values are relative across all co-expression modules.
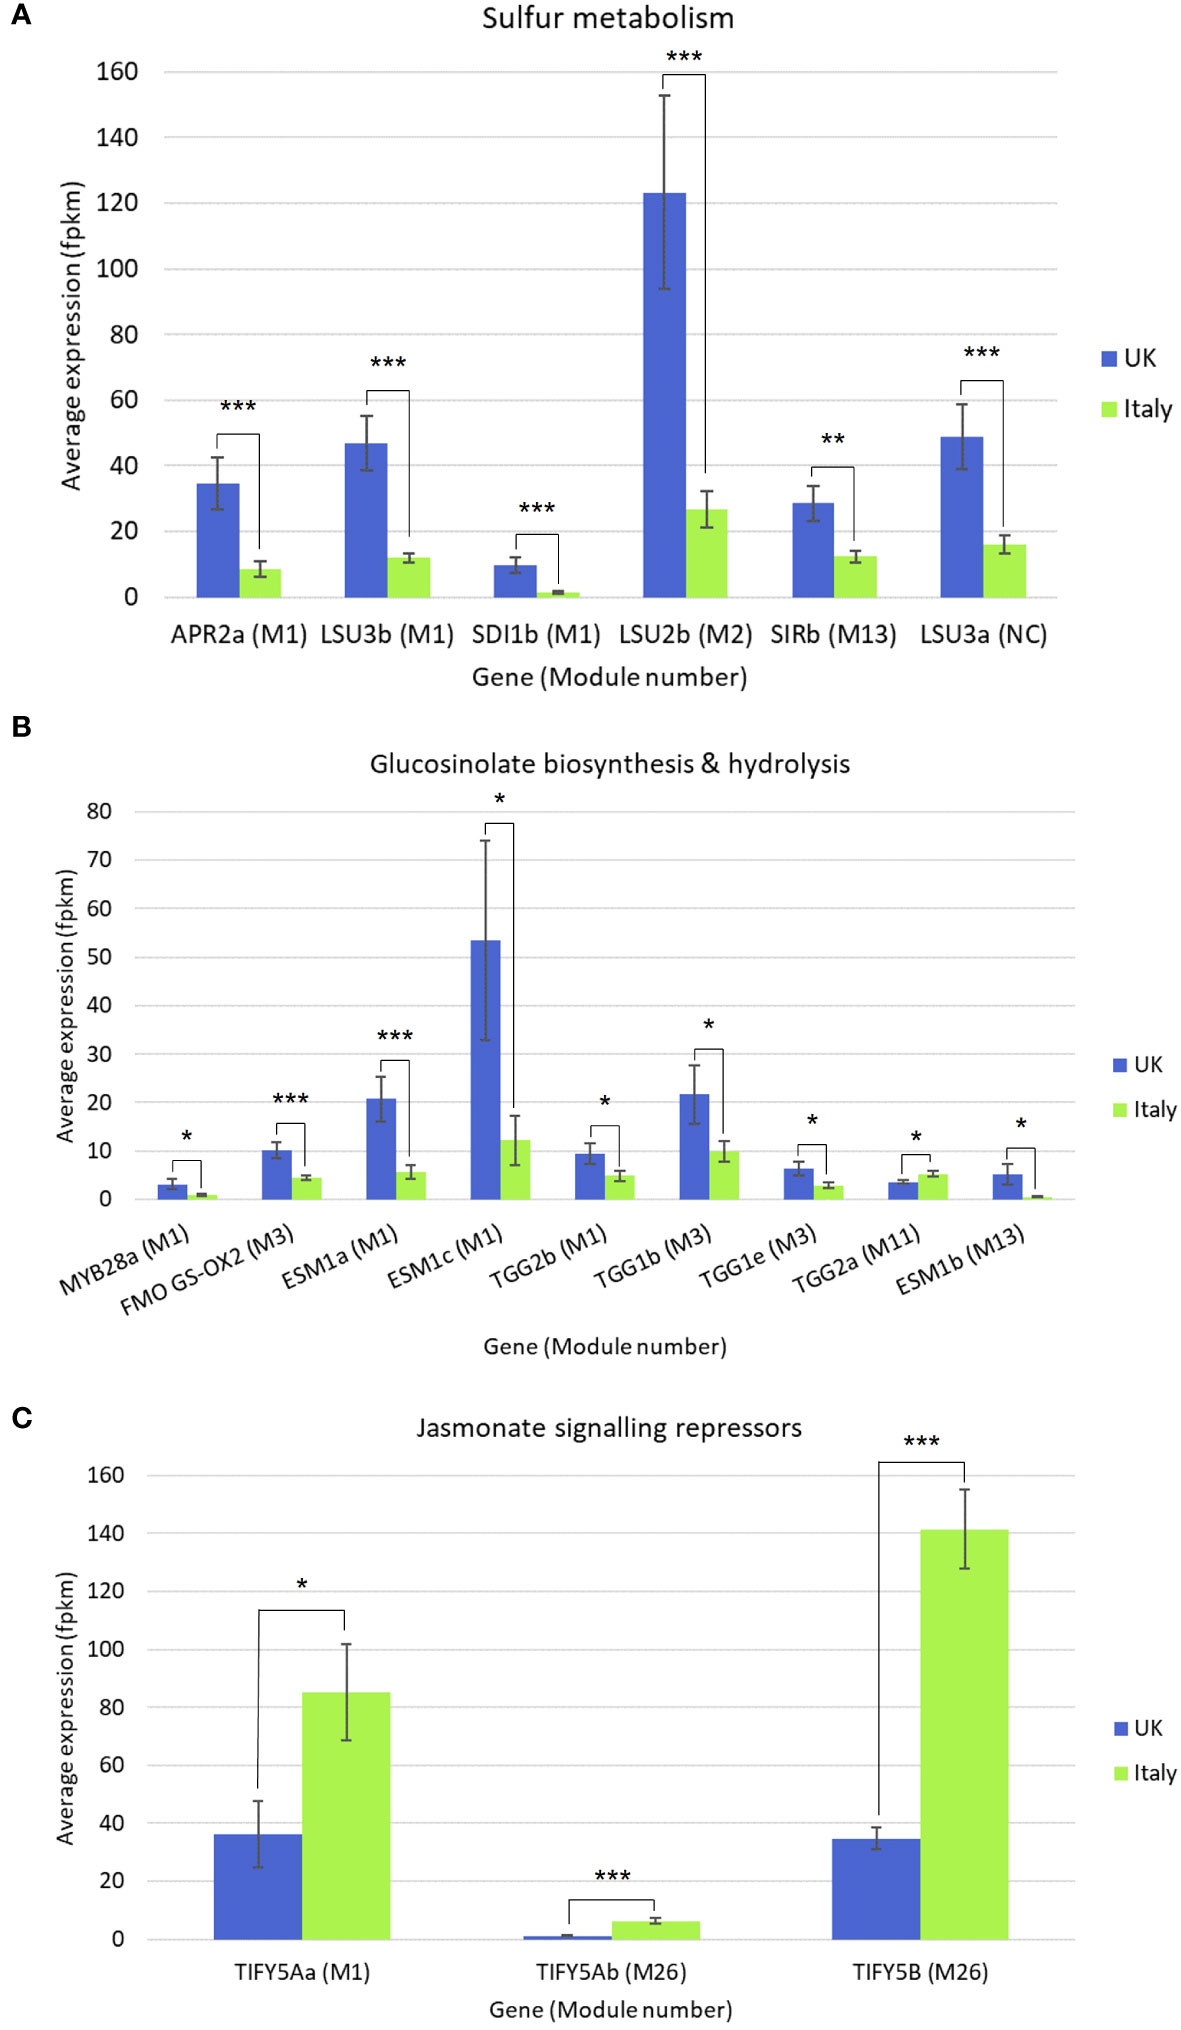
Figure 8 Differentially expressed genes (DEGs) in Eruca plants grown in Italy and the UK. Average expression values (fpkm) are presented for (A) sulfur metabolism, (B) glucosinolate biosynthesis and hydrolysis, and (C) jasmonate signaling repressor genes. Module number refers to co-expression analysis results which can be found in Supplementary File S6. Error bars represent standard error of the mean. Asterisks denote level of significant difference: *p<0.05; **p<0.01; ***p<0.001; See insets for colour coding.
Principal component analysis
Figure 9 presents a PCA of Italy-grown plants’ phytochemical composition and expression levels (fpkm) for selected genes of interest. Italy data were analysed because of the range of observed responses from cultivars, and the completeness of RNAseq data. The PCA explains 44% of the observed variability between samples (PC1, 29.2%; PC2, 14.9%). PC1 and PC2 eigenvalues were >10 and selected for presentation as they explained the greatest percentage variance. PC1 separates primarily for GSL concentrations (total, GBC, DGTB, GSV, 4MGB, and PEN) and PC2 for VOC abundances (1,1-dimethylcyclopropane, 2,4-heptadienal, (2E)-2-hexenal, 5-(methylsulfanyl)pentanenitrile, (2E,4E)-2,4-hexadienal, and 2-ethylfuran).
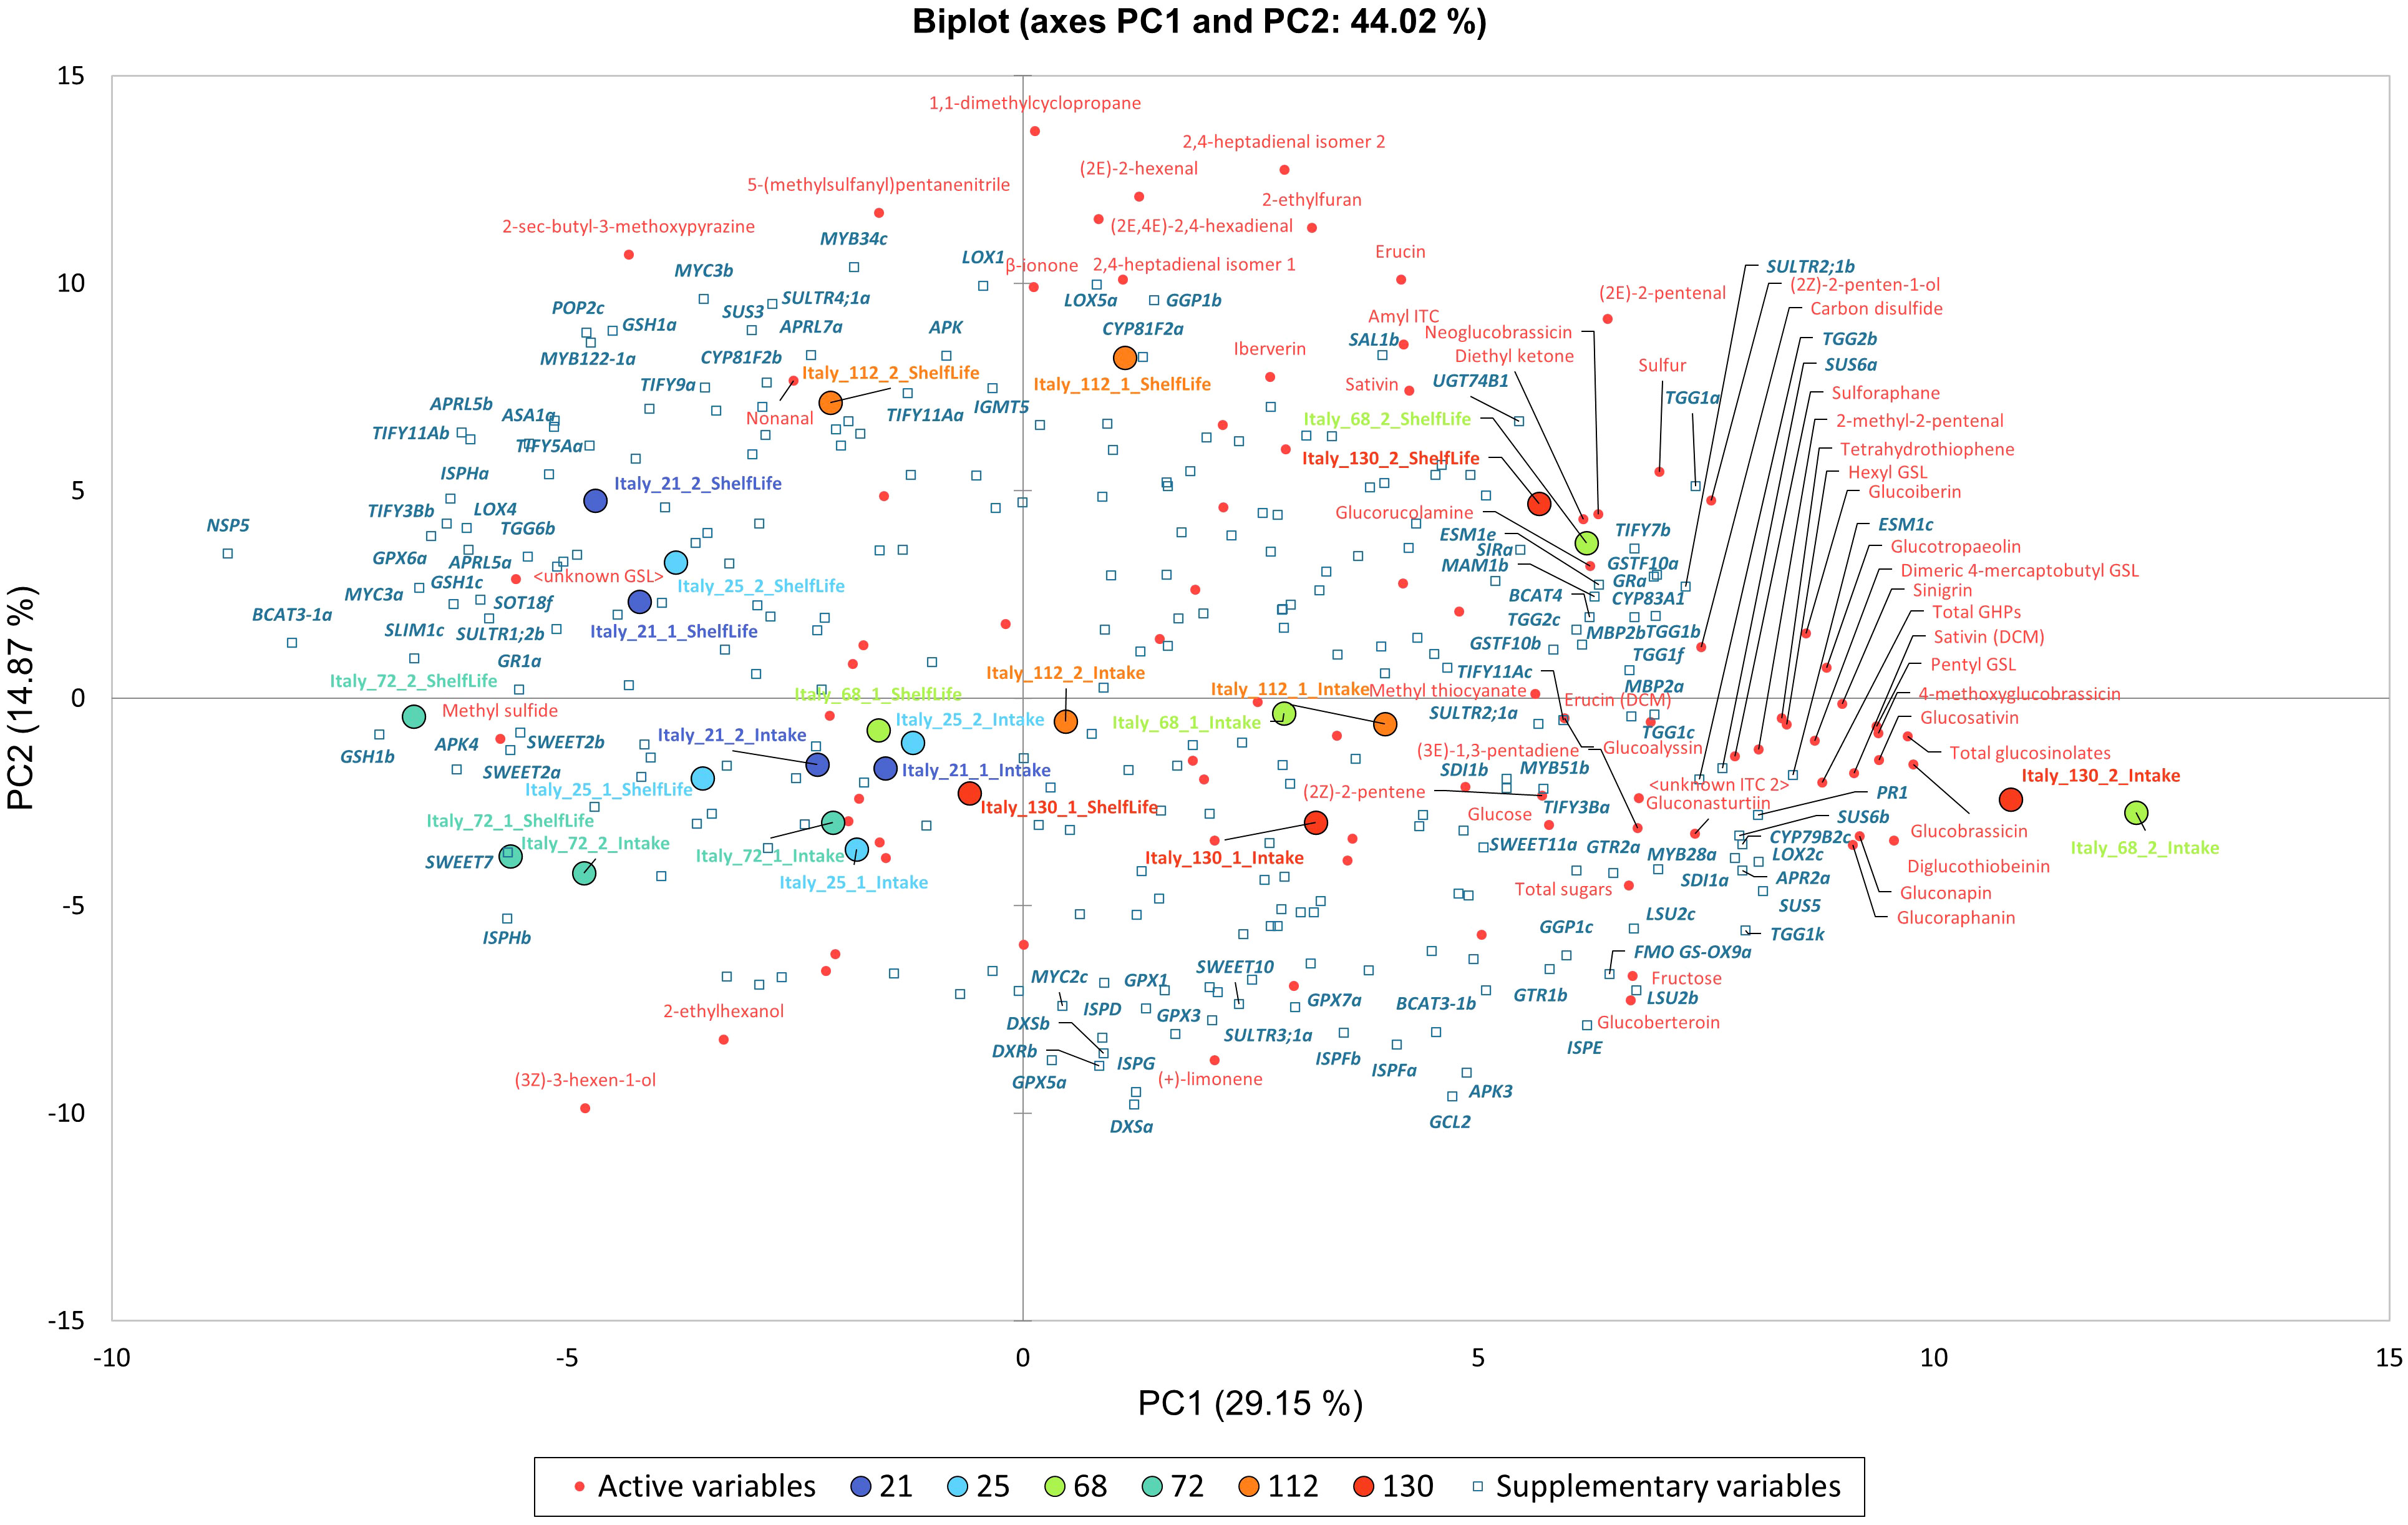
Figure 9 Principal Component Analysis (PCA) biplots for Italy-grown Eruca vesicaria subsp. sativa extreme line sample phytochemical composition values. PC1 and PC2 were selected for presentation and explain 44% of the observed variation. The biplot presents phytochemical data (red text) association with gene expression (fpkm; bold blue italic text). See inset for colour coding of cultivar samples.
Samples separate along PC1 for GSL concentrations with the ‘high’ accumulating lines (68 and 130) present in the right two quadrants, and ‘low’ accumulating lines (21, 25, and 72) on in the left two quadrants. Line 112 samples are loosely clustered in the center of the biplot. To the extreme right of the biplot are 68 and 130 2nd cut D0 samples, with their D5 counterparts located above and to the left in the upper right quadrant. These samples are associated with GSL abundances, hydrolysis products (SAT), and sulfur-containing VOCs (tetrahydrothiophene and carbon disulfide). Abundances of these compounds are associated with expression of genes relating to GSL biosynthesis (CYP79B2c), GSL hydrolysis (ESM1c, TGG1k), sugar metabolism (SUS5, SUS6a, SUS6b), VOC synthesis (LOX2c), plant defense (PR1), and sulfur metabolism (APR2a, SDI1a). Conversely, on the negative axis of PC1 (associated with lower GSL concentrations) lines 21, 25 and 72 are associated with low expression of the aforementioned genes, and higher expression of others involved in GSL biosynthesis (BCAT3-1a), GSL hydrolysis (NSP5), glutathione metabolism (GSH1b, GSH1c, GPX6a), sulfur limitation (SLIM1c), sulfur metabolism (APK4), jasmonic acid-related stress response (MYC3a, TIFY3Bb), and VOC synthesis (ISPHa).
Correlation analysis of gene expression highlighted in co-expression analysis revealed strong and significant (p = <0.001) associations with phytochemical metabolites. A summary table of r values is presented in Table 3 (see Supplementary File S5 for the full correlation data set). Expression of APR2a and two copies of SDI1 (SDI1a and SDI1b) had strong positive correlations with GSLs, such as GNP (r = >0.661), GBC (r = >0.646), 4MGB (r = >0.667), and GNT (r = >0.63), as well as abundance of carbon disulfide (r = >0.754). The expression of MYB28a and CYP79B2c was also significantly correlated with the abundance of several GSLs (GRA, r = >0.716; GNP, r = >0.655; DGTB, r = >0.741; GSV, r = >0.668). Expression of the myrosinases TGG1k and TGG2b, and modifier protein encoding ESM1c were significantly correlated with concentrations of SAT (r = >0.742). These relationships are suggestive of a suite of genes in high GSL/GHP lines which give rise to their phenotype, rather than a single gene controlling the process in isolation. These positive relationships contrast with APK4, BCAT3-1a, NSP5 and SLIM1c where strong negative correlations with sulfur containing metabolites were observed. Of note are negative correlations with glutathione-related genes, GPX6a, GSH1b and GSH1c, as it has been previously hypothesised that glutathione metabolism and GSL biosynthesis are competing pathways for sulfur (Vanegas Torres et al., 2022).
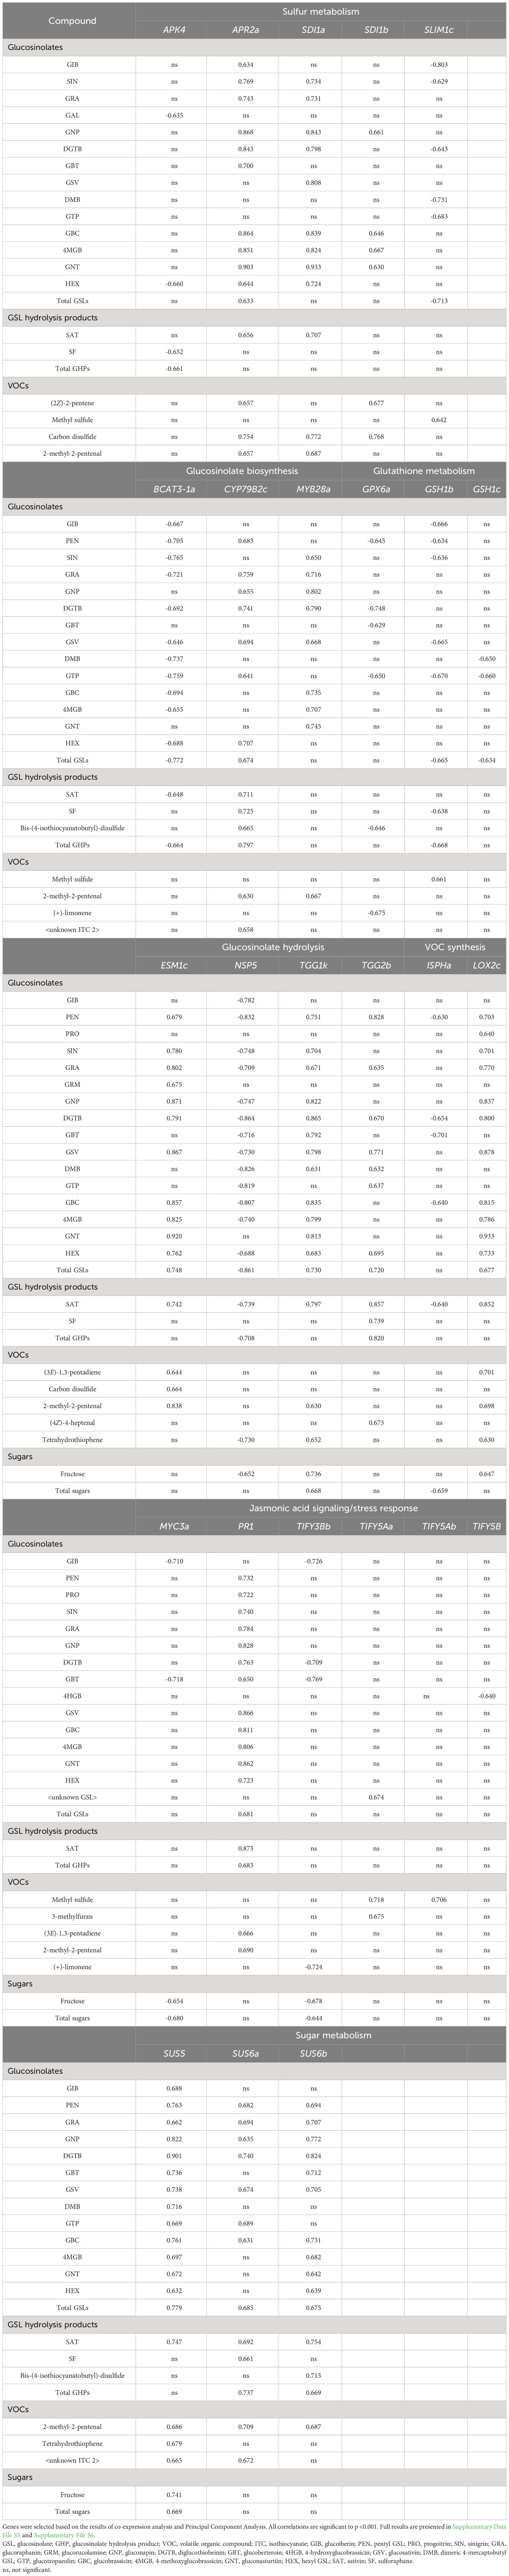
Table 3 Pearson’s Correlation coefficients (r) of Eruca vesicaria subsp. sativa gene expression (fpkm) with phytochemical metabolites from six extreme lines cultivated in Italy.
APR2a, SDI1a, BCAT3-1a, and NSP5 have been highlighted as having associations with GSL concentrations in the parental lines of the Eruca lines tested here (Bell et al., 2020a). This is evidence of the heritable nature of GSL compositions between environments (parental lines were grown in controlled environment chambers) and that these specific genes could act as useful expression markers for GSL concentrations.
Discussion
Growing environment determines Eruca sugar concentrations and impacts shelf-life quality
Consistent with a previous study (Bell et al., 2022), cultivation environment has a significant impact on the accumulation of sugars. This has clear implications for the taste of leaves, and in this study, it was observed that the accumulation of sugars is inversely related to concentrations of sulfur and GSL concentrations in Italy and UK-grown plants. We hypothesised that increased sugar concentrations in UK-grown plants may be reflective of cultivation practice (open field compared with polytunnel in Italy) and that respiration rates and levels of stress are increased because of the cooler, more humid climate (Bell et al., 2020b).
Another possible contributing factor to the disparities in sugar concentrations could be the intensity and duration of daylight between the two growing locations. With the UK being at a higher latitude, the rocket crop received an average of 15.9 daylight hours compared with an average 12 daylight hours in Italy at the times of each respective trials. Experiments in controlled environment have shown that sugars increase in kale when grown under long photoperiods (Steindal et al., 2015). In combination with the impacts of temperature and humidity, the role light plays in sugar accumulations of rocket may be significant, and worthy of more detailed investigation in future.
Sugar accumulation is also known to be associated with stress and the initiation of senescence (Sami et al., 2016), and in Eruca the shortening of shelf-life due to these processes results in lower nutritional quality of leaves. An explanation may be the link between sugar accumulation and acclimatization to adverse environmental conditions through oxidative stress response. Glucose is a known inhibitor of lipid peroxidation (Sami et al., 2016) and high accumulations in leaves may therefore be indicative of the stressful environment and metabolic efforts to slow the degradation of tissues. Combined with lower S-availability, this results in low GSL concentrations in UK crops and a reduction in nutritional quality.
Volatile organic chemical profiles are indicative of increased postharvest stress in UK-grown Eruca
Changes in VOCs during shelf-life can be used as markers of quality and to elucidate biological processes. Rocket species have been researched extensively in this area and it is known that preharvest factors significantly influence the types of compounds produced. Research conducted on Diplotaxis tenuifolia leaves has shown that increases in carbon disulfide and 3-methylfuran are associated with prolonged shelf-life storage and cellular deterioration. It has been suggested that 3-methylfuran has a fungal origin, and may therefore be indicative of leaf spoilage (Luca et al., 2016). In this study the relative abundance of these compounds was found to be significantly impacted by cut number and shelf-life duration between countries, being highest in UK 1st cut D0 samples. Such abundances in early shelf life indicates a high level of cellular degradation, even in freshly harvested material, signifying its low quality. Replicates of lines 21 and 25 had to be omitted from analyses due to the low quality of RNA, for example. This supports our hypothesis that UK-grown plants were suffering increased oxidative stress during growth, thereby accelerating senescence and degradation processes. As well as using specific VOCs as potential markers of Eruca quality, the ratios between VOC components may be indicative (Figure 2). D0 and D5 UK samples showed low abundances of alcohols, and increased amounts of alkanes and aldehydes compared to Italy samples at the same respective time points. This is suggestive of lipid breakdown and high amounts of tissue wounding (Brecht, 1995) which would severely reduce shelf-life viability.
Gene co-expression and sulfur content is associated with greater glucosinolate concentrations and hydrolysis product formation
The low GSL concentration in UK-grown Eruca is associated with lower sulfur found within leaves. The metabolic link between the two is well established, with GSLs acting as a form of sulfur storage molecule as well as a means of chemical defense (Morikawa-Ichinose et al., 2019). Our data show that several sulfur assimilation genes (Figure 8) have significantly higher expression in UK plants compared to Italy, including SDI1b (SULFUR DEFICIENCY INDUCED 1). This indicates that UK-grown plants were in a state of sulfur deficiency, and thus unable to synthesize greater quantities of GSLs. Under these conditions there would be high rates of GSL turnover to conserve sulfur (Maruyama-Nakashita, 2017). The high expression of TGG1 and TGG2 myrosinases is indicative of this (Ristova and Kopriva, 2022; Figure 8), although not itself a measure of enzyme abundance or activity. If the hypothesis of high oxidative stress in UK-grown Eruca is correct, the limitation of sulfur may further impair the quality of leaves at harvest and throughout shelf-life, as molecular sulfur itself is known to be a key component in regulating physiological responses to stress (Chan et al., 2019). Another contributing factor to the differences in GSL concentrations between the two locations may also be light intensity and duration. Light components (such as UV and visible wavelengths) are well known to affect the concentrations of some GSLs (Zhou et al., 2023), and recent reports suggest that this may be of particular importance in the synthesis of DMB and DGTB (Dernovics et al., 2023). The relatively higher-light environment in Italy may have been a contributing factor to the abundance of GSLs alongside the greater availability of sulfur.
Expression of some genes previously shown to be up-regulated under S-deprivation did not follow this pattern in our experiment. For example, PR1 is known to play a role in secondary metabolism through regulation of the salicylic acid pathway and distribution of sulfur and it was up-regulated under S-limited conditions in a previous study using Arabidopsis (Criollo-Arteaga et al., 2021). In our study PR1 was highly expressed in Italy grown plants and associated with high GSL concentrations (Figure 9; Table 3). Sulfur was not limiting and was significantly higher in leaves than all UK-grown samples (Figure 1). PR1 may therefore function differently in Eruca and in fact be up regulated when sulfur is not limited.
Co-expression analysis and PCA has highlighted several genes for further study (e.g., APR2, SDI1, BCAT3, ESM1 and NSP5, and which could be utilized as expression markers in future research and breeding efforts. As demonstrated here, expression of specific gene copies related to sulfur assimilation, GSL biosynthesis, and GHP formation must be considered together, as no single gene appears to be responsible for increased concentrations. Indeed, it has been demonstrated that high/low GSL abundances are heritable traits in Eruca, but that cultivation environment significantly impacts the ability of plants to synthesize health-related secondary metabolites. Panels of expression markers based on these data could be developed for screening Eruca cultivars across a broad range of locations without the need for expensive and time-consuming chemical analyses. This would allow growers to better select cultivars that are well suited to their climate and that will perform best in their production environment.
Study limitations and future research
This study was limited to only a single trial in each of the two countries. It was unfortunately not possible to conduct follow-up experiments and establish inter-year variability of rocket gene expression and metabolite profiles due to the Covid-19 pandemic.
Future research should address the link between cultivation environment and generation of GHPs related to human health and consumer acceptability. Our research has identified potential gene candidates for further study, and manipulation of expression through use of RNA interference or CRISPR-Cas9 genome editing may reveal the functionality and contribution of individual genes to the regulation or promotion of GHP formation. Many of the genes responsible for synthesis of GSL compounds (e.g., GSV, DMB, DGTB, GRM) are unidentified, and there is significant scope for expanding research and knowledge of GSL biosynthesis through utilization of the Eruca genome (Bell et al., 2020a).
Conclusion
Unpicking the effects of different environmental parameters (such as temperature) on transcriptomic changes and phytochemical abundances is challenging under field conditions. This study has attempted to understand the wholistic impacts of cultivation location on phytochemical and nutritional quality and is reflective of ‘real world’ production and what consumers might realistically experience when eating Eruca leaves. We have demonstrated that the environment has significant effects on the amounts of phytochemicals people may receive in their diets depending on rocket genotype and where it has been cultivated. This is a perennial issue for processors in terms of related traits, such as flavour and postharvest longevity. As demonstrated here, it makes it almost impossible to guarantee consistency of Eruca phytochemicals when sourced from multiple locations. As with the wine industry, cultivars should be produced in specific locales according to the distinctive traits generated through the interaction of specific genotypes with the environment. This will allow growers and processors to generate high value and distinctive products that can be produced with much better consistency.
Data availability statement
The datasets presented in this study can be found in online repositories. The names of the repository/repositories and accession number(s) can be found in the article/Supplementary Material.
Author contributions
Conceptualization of the research was by LB, LM, and CW. Methodology was designed by LB, LM, RT, and CW. Formal analysis was conducted by LB, MC, MP, and JJ. Field trials were organized by LB and MC. Analysis of VOCs by GC-MS was performed by JJ. GSL analysis by LC-MS and GHP analysis by GC-MS was performed by LB. Sulfur extraction and analysis by ICP-OES was performed by MC. Sugar analysis by HPIC-MS was performed by MC and MP. RNA extractions were performed by MC. Transcriptome co-expression analysis was performed by LB. Phytochemical statistical analyses were performed by LB. Resources, such as Eruca seed, was provided by RT. Data curation was performed by LB. Writing of the original manuscript draft was done by LB. Additional writing, review and editing was provided by MC, MP, LM, and CW. Visualization of data was performed by LB. Supervision of the research was provided by LM and CW. Project administration was organized by LB, MC, and CW. Funding acquisition was performed by LB, LM, and CW. All authors contributed to the article and approved the submitted version.
Funding
University of Reading Library (Open Access publishing fund). LB, MC, and MP were supported by a BBSRC LINK award (BB/N01894X/1).
Acknowledgments
The authors would like to thank: Dr. Justin Roberts and the Vegetable Plant Breeding Team at Elsoms Seeds Ltd. (Spalding, UK) for performing bulk productions of Eruca seed. Dr. Lorraine Shaw for assistance organizing the Italy and UK field trials. Edoardo Alimandi and Gianluigi Ravasini for assisting with organization and management of the Italy field trial. Stuart Carless for assisting with organization and management of the UK field trial. Transcriptome sequencing and bioinformatics was provided by Novogene (Cambridge, UK) as a service.
Conflict of interest
Author RT was employed by the company Elsoms Seeds Ltd.
The remaining authors declare that the research was conducted in the absence of any commercial or financial relationships that could be construed as a potential conflict of interest.
Publisher’s note
All claims expressed in this article are solely those of the authors and do not necessarily represent those of their affiliated organizations, or those of the publisher, the editors and the reviewers. Any product that may be evaluated in this article, or claim that may be made by its manufacturer, is not guaranteed or endorsed by the publisher.
Supplementary material
The Supplementary Material for this article can be found online at: https://www.frontiersin.org/articles/10.3389/fpls.2023.1218984/full#supplementary-material
Supplementary File S1 | Sampling diagram.
Supplementary File S2 | List of Volatile Organic Compounds (VOCs) identified in six Eruca vesicaria subsp. sativa extreme lines grown in Italy and the UK.
Supplementary File S3 | Summary table of Analysis of Variance (ANOVA) with post-hoc Tukey’s Honest Significant Difference (HSD) results for Eruca vesicaria subsp. sativa phytochemical compositions.
Supplementary File S4 | Sugar concentrations of six Eruca vesicaria subsp. sativa extreme lines grown in Italy and the UK. Error bars represent standard error of the mean for each compound. Letters above bars indicate significant differences observed for total sugar concentrations between each sample and environment.
Supplementary File S5 | Summary of genes identified within each co-expression module of six Eruca vesicaria subsp. sativa extreme lines, with KEGG annotations.
Supplementary File S6 | Pearson’s correlation analysis (n-1) results for six Eruca vesicaria subsp. sativa extreme line phytochemical compositions and selected gene expression data (related to sulfur metabolism, glucosinolate biosynthesis, glucosinolate hydrolysis, redox metabolism, VOC synthesis, stress response, and sugar metabolism). Values in bold are significant correlations p = <0.001. Red cells signify negative correlations, green cells signify positive correlations.
References
Agneta, R., Rivelli, A. R., Ventrella, E., Lelario, F., Sarli, G., Bufo, S. A. (2012). Investigation of glucosinolate profile and qualitative aspects in sprouts and roots of horseradish (Armoracia rusticana) using LC-ESI–hybrid linear ion trap with fourier transform ion cyclotron resonance mass spectrometry and infrared multiphoton dissocia. J. Agric. Food Chem. 60, 7474–7482. doi: 10.1021/jf301294h
Andini, S., Dekker, P., Gruppen, H., Araya-Cloutier, C., Vincken, J.-P. (2019). Modulation of glucosinolate composition in brassicaceae seeds by germination and fungal elicitation. J. Agric. Food Chem. 67, 12770–12779. doi: 10.1021/acs.jafc.9b05771
Backenköhler, A., Eisenschmidt, D., Schneegans, N., Strieker, M., Brandt, W., Wittstock, U. (2018). Iron is a centrally bound cofactor of specifier proteins involved in glucosinolate breakdown. PloS One 13, e0205755–e0205755. doi: 10.1371/journal.pone.0205755
Bell, L., Chadwick, M., Puranik, M., Tudor, R., Methven, L., Kennedy, S., et al. (2020a). The Eruca sativa genome and transcriptome: A targeted analysis of sulfur metabolism and glucosinolate biosynthesis pre and postharvest. Front. Plant Sci. 11, 525102. doi: 10.3389/fpls.2020.525102
Bell, L., Chadwick, M., Puranik, M., Tudor, R., Methven, L., Wagstaff, C. (2022). Quantitative trait loci analysis of glucosinolate, sugar, and organic acid concentrations in Eruca vesicaria subsp. sativa. Mol. Horticulture 2, 1–16. doi: 10.1186/s43897-022-00044-x
Bell, L., Kitsopanou, E., Oloyede, O. O., Lignou, S. (2021). Important odorants of four brassicaceae species, and discrepancies between glucosinolate profiles and observed hydrolysis products. Foods 10, 1055–1055. doi: 10.3390/foods10051055
Bell, L., Lignou, S., Wagstaff, C. (2020b). High Glucosinolate Content in Rocket Leaves (Diplotaxis tenuifolia and Eruca sativa) after Multiple Harvests Is Associated with Increased Bitterness, Pungency, and Reduced Consumer Liking. Foods 9, 1799–1799. doi: 10.3390/foods9121799
Bell, L., Methven, L., Signore, A., Jose Oruna-Concha, M., Wagstaff, C. (2017a). Analysis of seven salad rocket (Eruca sativa) accessions: the relationships between sensory attributes and volatile and non-volatile compounds. Food Chem. 218, 181–191. doi: 10.1016/j.foodchem.2016.09.076
Bell, L., Methven, L., Wagstaff, C. (2017b). The influence of phytochemical composition and resulting sensory attributes on preference for salad rocket (Eruca sativa) accessions by consumers of varying TAS2R38 diplotype. Food Chem. 222, 6–17. doi: 10.1016/j.foodchem.2016.11.153
Bell, L., Wagstaff, C. (2017). Enhancement of glucosinolate and isothiocyanate profiles in brassicaceae crops: addressing challenges in breeding for cultivation, storage, and consumer related traits. J. Agric. Food Chem. 65, 9379–9403. doi: 10.1021/acs.jafc.7b03628
Blažević, I., Montaut, S., Burčul, F., Olsen, C. E., Burow, M., Rollin, P., et al. (2019). Glucosinolate structural diversity, identification, chemical synthesis and metabolism in plants. Phytochemistry 169, 112100–112100. doi: 10.1016/j.phytochem.2019.112100
Brecht, J. K. (1995). Physiology of lightly processed fruits and vegetables. HortScience 30, 18–22. doi: 10.21273/HORTSCI.30.1.18
Cardozo, L. E., Russo, P. S. T., Gomes-Correia, B., Araujo-Pereira, M., Sepúlveda-Hermosilla, G., Maracaja-Coutinho, V., et al. (2019). webCEMiTool: co-expression modular analysis made easy. Front. Plant Sci. 10, 146. doi: 10.3389/fgene.2019.00146
Cataldi, T. R. I., Rubino, A., Lelario, F., Bufo, S. A. (2007). Naturally occurring glucosinolates in plant extracts of rocket salad (Eruca sativa L.) identified by liquid chromatography coupled with negative ion electrospray ionization and quadrupole ion-trap mass spectrometry. Rapid Commun. Mass Spectrom. 21, 2374–2388. doi: 10.1002/rcm.3101
Chan, K. X., Phua, S. Y., Van Breusegem, F. (2019). Secondary sulfur metabolism in cellular signalling and oxidative stress responses. J. Exp. Bot. 70, 4237–4250. doi: 10.1093/jxb/erz119
Criollo-Arteaga, S., Moya-Jimenez, S., Jimenez-Meza, M., Gonzalez-Vera, V., Gordon-Nunez, J., Llerena-Llerena, S., et al. (2021). Sulfur Deprivation Modulates Salicylic Acid Responses via Nonexpressor of Pathogenesis-Related Gene 1 in Arabidopsis thaliana. Plants 10, 1065–1065. doi: 10.3390/plants10061065
Dernovics, M., Molnár, A., Szalai, G. (2023). UV-B-radiation induced di- and polysulfide derivatives of 4-mercaptobutyl glucosinolate from Eruca sativa. J. Food Compost. Anal. 122, 105485. doi: 10.1016/j.jfca.2023.105485
Guijarro-Real, C., Rodríguez-Burruezo, A., Fita, A. (2020). Volatile Profile of Wall Rocket Baby-Leaves (Diplotaxis erucoides) Grown under Greenhouse: Main Compounds and Genotype Diversity. Agronomy 10, 802–802. doi: 10.3390/agronomy10060802
Jasper, J., Elmore, J. S., Wagstaff, C. (2021). Determining the quality of leafy salads: Past, present and future. Postharvest Biol. Technol. 180, 111630–111630. doi: 10.1016/j.postharvbio.2021.111630
Jasper, J., Wagstaff, C., Bell, L. (2020). Growth temperature influences postharvest glucosinolate concentrations and hydrolysis product formation in first and second cuts of rocket salad. Postharvest Biol. Technol. 163, 111157–111157. doi: 10.1016/j.postharvbio.2020.111157
Luca, A., Mahajan, P. V., Edelenbos, M. (2016). Changes in volatile organic compounds from wild rocket (Diplotaxis tenuifolia L.) during modified atmosphere storage. Postharvest Biol. Technol. 114, 1–9. doi: 10.1016/j.postharvbio.2015.11.018
Maldini, M., Foddai, M., Natella, F., Petretto, G. L., Rourke, J. P., Chessa, M., et al. (2017). Identification and quantification of glucosinolates in different tissues of Raphanus raphanistrum by liquid chromatography tandem-mass spectrometry. J. Food Compost. Anal. 61, 20–27. doi: 10.1016/j.jfca.2016.06.002
Maruyama-Nakashita, A. (2017). Metabolic changes sustain the plant life in low-sulfur environments. Curr. Opin. Plant Biol. 39, 144–151. doi: 10.1016/j.pbi.2017.06.015
Morikawa-Ichinose, T., Kim, S.-J., Allahham, A., Kawaguchi, R., Maruyama-Nakashita, A. (2019). Glucosinolate Distribution in the Aerial Parts of sel1-10, a Disruption Mutant of the Sulfate Transporter SULTR1;2, in Mature Arabidopsis thaliana Plants. Plants 8, 95–95. doi: 10.3390/plants8040095
Nastruzzi, C., Cortesi, R., Esposito, E., Menegatti, E., Leoni, O., Iori, R., et al. (2000). In vitro antiproliferative activity of isothiocyanates and nitriles generated by myrosinase-mediated hydrolysis of glucosinolates from seeds of cruciferous vegetables. J. Agric. Food Chem. 48, 3572–3575. doi: 10.1021/jf000191p
Oloyede, O. O., Wagstaff, C., Methven, L. (2021). Influence of cabbage (Brassica oleracea) accession and growing conditions on myrosinase activity, glucosinolates and their hydrolysis products. Foods 10, 2903–2903. doi: 10.3390/foods10122903
Ristova, D., Kopriva, S. (2022). Sulfur signaling and starvation response in Arabidopsis. iScience 25, 104242. doi: 10.1016/j.isci.2022.104242
Rochfort, S. J., Trenerry, V. C., Imsic, M., Panozzo, J., Jones, R. (2008). Class targeted metabolomics: ESI ion trap screening methods for glucosinolates based on MSn fragmentation. Phytochemistry 69, 1671–1679. doi: 10.1016/j.phytochem.2008.02.010
Román, J., Castillo, A., Cottet, L., Mahn, A. (2018). Kinetic and structural study of broccoli myrosinase and its interaction with different glucosinolates. Food Chem. 254, 87–94. doi: 10.1016/j.foodchem.2018.01.179
Sami, F., Yusuf, M., Faizan, M., Faraz, A., Hayat, S. (2016). Role of sugars under abiotic stress. Plant Physiol. Biochem. 109, 54–61. doi: 10.1016/j.plaphy.2016.09.005
Shi, H., Zhao, Y., Sun, J., Yu, L., Chen, P. (2017). Chemical profiling of glucosinolates in cruciferous vegetables-based dietary supplements using ultra-high performance liquid chromatography coupled to tandem high resolution mass spectrometry. J. Food Compost. Anal. 61, 67–72. doi: 10.1016/j.jfca.2017.01.018
Song, Y., Liu, L., Wei, Y., Li, G., Yue, X., An, L. (2017). Metabolite profiling of adh1 mutant response to cold stress in arabidopsis. Front. Plant Sci. 7, 2072. doi: 10.3389/fpls.2016.02072
Steindal, A. L. H., Rødven, R., Hansen, E., Mølmann, J. (2015). Effects of photoperiod, growth temperature and cold acclimatisation on glucosinolates, sugars and fatty acids in kale. Food Chem. 174, 44–51. doi: 10.1016/j.foodchem.2014.10.129
Tripodi, P., Coelho, P. S., Guijarro-Real, C. (2021). “Breeding Advances and Prospects in Rocket Salad (Eruca vesicaria ssp. sativa Mill.) Cultivation,” in Advances in Plant Breeding Strategies: Vegetable Crops (Cham, Switzerland: Springer, Cham), 95–133.
Vanegas Torres, A., Tish, N., Rodov, V. (2022). Enhancement of glucosinolate formation in broccoli sprouts by hydrogen peroxide treatment. Foods 11, 655. doi: 10.3390/foods11050655
Witzel, K., Abu Risha, M., Albers, P., Börnke, F., Hanschen, F. S. (2019). Identification and characterization of three epithiospecifier protein isoforms in Brassica oleracea. Front. Plant Sci. 10, 1552. doi: 10.3389/fpls.2019.01552
Keywords: glucosinolates, isothiocyanates, brassicaceae, transcriptome sequencing, volatile organic compounds, arugula
Citation: Bell L, Chadwick M, Puranik M, Jasper J, Tudor R, Methven L and Wagstaff C (2023) Genotypes of Eruca vesicaria subsp. sativa grown in contrasting field environments differ on transcriptomic and metabolomic levels, significantly impacting nutritional quality. Front. Plant Sci. 14:1218984. doi: 10.3389/fpls.2023.1218984
Received: 08 May 2023; Accepted: 19 October 2023;
Published: 02 November 2023.
Edited by:
Zhihua Liao, Southwest University, ChinaReviewed by:
Tlili Imen, Carthage University, TunisiaDiego A. Moreno, Spanish National Research Council (CSIC), Spain
Antonio Ferrante, University of Milan, Italy
Copyright © 2023 Bell, Chadwick, Puranik, Jasper, Tudor, Methven and Wagstaff. This is an open-access article distributed under the terms of the Creative Commons Attribution License (CC BY). The use, distribution or reproduction in other forums is permitted, provided the original author(s) and the copyright owner(s) are credited and that the original publication in this journal is cited, in accordance with accepted academic practice. No use, distribution or reproduction is permitted which does not comply with these terms.
*Correspondence: Luke Bell, bHVrZS5iZWxsQHJlYWRpbmcuYWMudWs=