
95% of researchers rate our articles as excellent or good
Learn more about the work of our research integrity team to safeguard the quality of each article we publish.
Find out more
ORIGINAL RESEARCH article
Front. Plant Sci. , 10 July 2023
Sec. Plant Breeding
Volume 14 - 2023 | https://doi.org/10.3389/fpls.2023.1216297
This article is part of the Research Topic Advances in Pea Breeding and Genomics View all 6 articles
 Chiara Delvento1
 Francesco Arcieri1
 Angelo Raffaele Marcotrigiano1
 Marzia Guerriero1
 Valentina Fanelli1
 Maria Dellino1
 Pasquale Luca Curci2
 Harro Bouwmeester3
 Concetta Lotti4Luigi Ricciardi1
 Stefano Pavan1*
Pea (Pisum sativum L.) is a widely cultivated legume of major importance for global food security and agricultural sustainability. Crenate broomrape (Orobanche crenata Forsk.) (Oc) is a parasitic weed severely affecting legumes, including pea, in the Mediterranean Basin and the Middle East. Previously, the identification of the pea line “ROR12”, displaying resistance to Oc, was reported. Two-year field trials on a segregant population of 148 F7 recombinant inbred lines (RILs), originating from a cross between “ROR12” and the susceptible cultivar “Sprinter”, revealed high heritability (0.84) of the “ROR12” resistance source. Genotyping-by-sequencing (GBS) on the same RIL population allowed the construction of a high-density pea linkage map, which was compared with the pea reference genome and used for quantitative trait locus (QTL) mapping. Three QTLs associated with the response to Oc infection, named PsOcr-1, PsOcr-2, and PsOcr-3, were identified, with PsOcr-1 explaining 69.3% of the genotypic variance. Evaluation of the effects of different genotypic combinations indicated additivity between PsOcr-1 and PsOcr-2, and between PsOcr-1 and PsOcr-3, and epistasis between PsOcr-2 and PsOcr-3. Finally, three Kompetitive Allele Specific PCR (KASP) marker assays were designed on the single-nucleotide polymorphisms (SNPs) associated with the QTL significance peaks. Besides contributing to the development of pea genomic resources, this work lays the foundation for the obtainment of pea cultivars resistant to Oc and the identification of genes involved in resistance to parasitic Orobanchaceae.
Pea (Pisum sativum L.) is the second most widely cultivated cool season legume in the world, yielding 12.4 Mt of dry seeds and 20.5 Mt of green production in 2021 (FAOSTAT data, 2021). In Europe, there is a positive trend towards the rise of pea cultivation, mostly related to the increased awareness of consumers on the beneficial effects of legumes on human health, the implementation of political incentives in favor of sustainable farming systems, and the growing demand for non-transgenic alternatives to soybean (Daryanto et al., 2015; Centrone et al., 2020; Costantini et al., 2021; Pavan et al., 2022).
Crenate broomrape (Orobanche crenata Forsk.) (Oc) is an obligate root parasite, which occurs widespread in the Mediterranean area and the Middle East and may cause up to complete yield loss on several cultivated legumes, including pea (Pavan et al., 2016; Negewo et al., 2022). The life cycle of Oc includes the stages of seed germination, attachment to the host roots, establishment of vascular connections, development of underground tubercles, emergence of floral shoots, and dispersal of seeds, which may remain viable in the soil for several decades (Xie et al., 2010; Fernández-Aparicio et al., 2016b).
Breeding for resistance proved to be a valuable strategy to cope with Oc and other parasitic weeds belonging to the botanic family of Orobanchaceae (Jamil et al., 2011; Fernández-Aparicio et al., 2014; Jamil et al., 2021; Li et al., 2023a), whereas agronomic and chemical control methods displayed limited efficacy (Fernández-Aparicio et al., 2016a). However, no Oc-resistant pea cultivar is commercially available (Rubiales, 2014; Wohor et al., 2022); thus, pea cultivation has been abandoned in several areas with a large Oc seed bank (Renna et al., 2015).
We previously reported the selection, from an Italian garden pea landrace, of the breeding line “ROR12”, displaying resistance to Oc (Pavan et al., 2016). Characterization of root extracts and exudates indicated that “ROR12” resistance might be due, at least partially, to reduced biosynthesis of strigolactones, a class of carotenoid-derived compounds acting in the rhizosphere as germination stimulants for Orobanchaceae (Yoneyama et al., 2010; Pavan et al., 2016; Bouwmeester et al., 2021). The response to Oc infection, assessed as the number of parasitic shoots emerged aboveground at crop maturity, significantly deviated from normality in an F2 population generated from a cross between “ROR12” and the susceptible cultivar “Sprinter”, suggesting the occurrence of one or a few loci having a major effect on the phenotype (Bardaro et al., 2016). In addition, testing a few polymorphic marker loci on resistant and susceptible F2 bulks revealed a significant association between response to Oc infection and a genomic region on the pea chromosome 5LG3 (Bardaro et al., 2016).
The wild pea accession “P665” was previously reported as partially resistant to Oc (Fondevilla et al., 2010). Mapping quantitative trait loci (QTLs), based on a segregant recombinant inbred line (RIL) population originating from “P665” and the susceptible cultivar “Messire”, identified four QTLs associated with the number of parasitic shoots emerged per host plant (n°br03_1, n°br03_2, n°br03_3 and n°br04), located on the pea chromosomes 2LG1, 5LG3, 3LG5, and 1LG6 (Fondevilla et al., 2010).
Genotyping-by-sequencing (GBS) is a reduced representation library sequencing strategy allowing the cost-effective identification of thousands of single-nucleotide polymorphisms (SNPs) (Elshire et al., 2011; Pavan et al., 2020). GBS was successfully used in pea to generate high-density linkage maps, in which loci associated with economically important traits were positioned (Ma et al., 2017a; Barilli et al., 2018; Guindon et al., 2019). In addition, dense linkage maps can be compared to reference genome assemblies to provide genomic context to unanchored contigs and scaffolds, resolving allelism and identifying mis-joins (Fierst, 2015; Walve et al., 2019). Currently, the genome assemblies of the cultivars “Cameor” and “ZW6” are available for the scientific community working on pea (Kreplak et al., 2019; Yang et al., 2022).
Here, we describe the use of GBS for the construction of a pea high-density linkage map, which was compared with the pea reference genome. SNP data and 2-year phenotypic observations collected on the “ROR12” x “Sprinter” RIL segregant population were used to identify and annotate genomic loci associated with Oc resistance. Finally, marker assays were designed and validated to assist selection in breeding programs.
The breeding line “ROR12” and the cultivar “Sprinter” were used in this study, together with a population of 148 F7 RILs obtained from their F2 progeny by single seed descent. “ROR12” was obtained from a local garden pea landrace by pure line selection (Pavan et al., 2016). Low strigolactone levels occurring in “ROR12” result in a slightly branched phenotype, which, however, does not cause a major penalty effect on the agronomic performance (Pavan et al., 2016). “Sprinter” is an old garden pea commercial cultivar previously shown to be highly susceptible to Oc (Bardaro et al., 2016; Pavan et al., 2016).
Two field trials (sowing dates 3 October 2020 and 8 January 2021) were carried out at the experimental farm “P. Martucci” of the University of Bari (41°01′22.1″N 16°54′21.0″E) in a silty–clayey experimental field continuously cultivated with legumes, known to be highly infested by Oc. RILs were arranged according to a randomized block design with three blocks and one replication per block, with each replicate consisting of 10 plants distant 0.15 m in a single row. The blocks were placed orthogonally to a gradient of Oc infestation observed in the previous 2 years. To check for the homogeneity of the Oc seedbank distribution within blocks, five replicates of the parental cultivar “Sprinter” were randomly allocated in each block as positive control. No fertilization and irrigation were applied during the growing season. Pest and pathogen management was performed using single applications of deltamethrin and difenoconazole, whereas weed control was performed with pendimethalin in pre-emergence and manual weeding in post-emergence. Genotypic response to Oc infection was evaluated at crop maturity on 25 May 2020, and 31 May 2021, as the average number of parasitic shoots emerged aboveground per plant.
Leaf tissue samples were collected from three individuals of the parental lines and one individual of each RIL. DNA was isolated using the DNeasy Plant Mini Kit (Qiagen) according to the manufacturer’s protocol and checked for quality and concentration using agarose gel (0.8%) electrophoresis and the Qubit 3.0 fluorometer (Life Technologies). A multiplexed ApeKI-GBS library was prepared as described by Elshire et al. (2011) and sequenced by a paired-end approach using the Illumina Novoseq 6000 sequencing system (Elshire Group Ltd.). After demultiplexing with the Axe algorithm (Murray and Borevitz, 2018), reads were trimmed for adapter and reverse-barcode sequences using the batch_trim.pl script from github (https://github.com/Lanilen/GBS-PreProcess). Alignment to the Pisum sativum v1.0 reference genome (Kreplak et al., 2019) was performed using bowtie2 (Langmead and Salzberg, 2012). After pooling together alignments of the biological replicates of the parental lines, the Stacks pipeline (Catchen et al., 2013) with the biparental filtering mode was used for SNP calling. Further filtering was performed in TASSEL 5.2.31 (Bradbury et al., 2007) by selecting SNP loci showing polymorphism between the parental lines and associated with call rate >90%, minor allele frequency (MAF) >0.25, and heterozygous calls<5%, and maintaining individuals displaying heterozygosity<10%.
The mstmap function of the ASMap R package (Taylor and Butler, 2017), implementing the Minimum Spanning Tree algorithm described by Wu et al. (2008), was used for linkage map construction. Default arguments within the function were applied, except for choosing the p-value threshold of 10-11 for clustering marker loci in linkage groups. Marker loci associated with double crossover events or displaying skewed segregation (p< 0.05 after the Bonferroni correction) were removed from analysis using the drop.markers function of ASMap. The performance of the mstmap function was checked by plotting the heat map of pairwise recombination fractions (RFs) between markers and their pairwise logarithm of odds (LOD) score of linkage. Graphical representation of the linkage map was obtained using the iplotMap function of the qtlcharts R package (Broman, 2015). The relation between the linkage map and the pea reference genome was investigated by plotting genetic vs. physical positions for each chromosome, using the ggplot2 R package (Wickham, 2016).
Broad-sense heritability (H2B) was estimated according to Schmidt et al. (2019), using the formula:
in which σ2G is the genotypic variance, σ2GY is the genotype-by-year variance, σ2ϵ is the error variance, ny is the number of years, and nr is the number of replicates within each year. Restricted maximum likelihood (REML) estimates of variance components were obtained by fitting a random effect model with the lmer function of the lme4 R package (Bates et al., 2015), in which genotype, genotype-by-year, year, and replicates within years were set as random effects; the square root of phenotypic data was set as the dependent variable, with this transformation being necessary to correct for the right-skewness of the distribution. The model assumption of normality was assessed using the qqnorm function of the Stats R package (R Core Team, 2013). The ranova function of the lmerTest R package (Kuznetsova et al., 2017) was used to test the significance of the model random effect terms.
Mapping of QTLs was performed using linkage map data and best linear unbiased predictors (BLUPs) of RIL genotypic effects, which are widely used as alternative to phenotypic means to estimate genotypic values in QTL mapping studies (Ben Sadok et al., 2013; Allard et al., 2016; Molenaar et al., 2018; Wang et al., 2023). BLUPs were extracted by applying the ranef function of lme4 to the random effect model above described for H2B estimation. The cim function of the Rqtl R package (Broman et al., 2003) was used to search for marker–trait associations by composite interval mapping (CIM). Arguments within the function were set to perform the Haley–Knott regression method and identify a LOD score QTL significance threshold based on a permutation test with 1,000 iterations. The plot function of the Stats R package (R Core Team, 2013) was applied on the output of the cim function to obtain graphs for chromosomal LOD scores. The percentage of the variance of RIL genotypic effects on the phenotype (PGE) explained by markers at QTL peaks was calculated with the formula:
Confidence intervals were identified using the lodint function of Rqtl, based on two LOD score units drop from the QTL peak. Genes included in the QTL confidence intervals were extracted from the pea reference genome annotation general feature format (gff) file, which was downloaded from the Unité de Recherche Génomique Info (URGI) bioinformatics platform (https://urgi.versailles.inra.fr/). The BLAST tools implemented by the same platform were used (a) to search, in QTL confidence intervals, for homologs of the strigolactone biosynthetic genes reviewed by Mashiguchi et al. (2021); (b) for physical mapping of the simple sequence repeat (SSR) marker AD174 (Loridon et al., 2005), previously associated with “ROR12” resistance (Bardaro et al., 2016); and (c) for physical mapping of the carbonic anhydrase gene Psat1g058960 that, according to the map of Carrillo et al. (2014), is closely linked to the RAPD marker OPAA19_702, in turn linked to the Oc resistance QTL n°br04 (Fondevilla et al., 2010). Search for defense response genes enrichment in QTL confidence intervals was performed by the gprofiler2 R package (Kolberg et al., 2020), using p = 0.05 as significance threshold and the Benjamini–Hochberg false discovery rate correction for multiple tests.
The effect of the different QTL combinations on the phenotype was investigated using the effectplot function of the Rqtl R package, which returned BLUP means and standard errors relative to different genotypic combinations at QTL pairs. Data were used to produce a custom plot using the ggplot2 R package (Wickham, 2016).
Kompetitive Allele Specific PCR (KASP) assays were performed using two allele-specific forward primers, marked with the FAM and HEX fluorescence dyes, and a common reverse primer (Table 1). PCR reactions were performed at LGC genomics (Shanghai, China) according to standard protocols. Output fluorescence data were used to produce scatter plots, using the ggplot2 R package (Wickham, 2016).
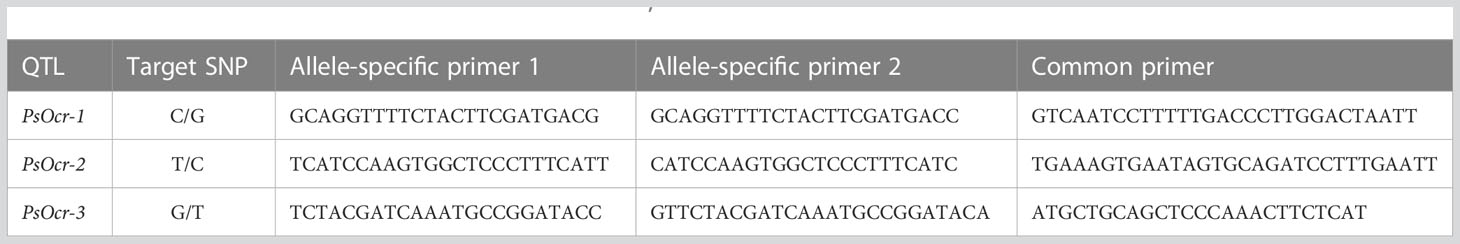
Table 1 Details of the KASP assays designed on the QTLs PsOcr-1, PsOcr-2, and PsOcr-3 identified in this study.
Two-year trials were carried out in an experimental field known to be severely infested by Oc, aiming to evaluate the response of a segregant population of 148 F7 RILs originating from a cross between “ROR12” and “Sprinter”. Scoring of the average number of parasitic shoots emerged aboveground per host plant indicated a fairly good uniformity of infestation within blocks, as relatively low dispersion around the mean was observed for five “Sprinter” replicates randomly allocated in each block (mean ± SD were 5.65 ± 0.35, 2.9 ± 0.14, and 2.95 ± 0.21 for the three blocks arranged in 2020, and 1.53 ± 0.12, 2.7 ± 0.46, and 3.4 ± 0.46 for the three blocks arranged in 2021).
The average number of parasitic shoots emerged aboveground per host plant ranged, for RILs, from 0 to 6.03 in 2020, and from 0 to 3.07 in 2021. In addition, in both years, this variable exhibited a distribution clearly deviating from normality, indicating the occurrence of one or a few major loci involved in resistance (Figure 1). “ROR12” displayed very high resistance levels, with an average number of Oc shoots emerged per host plant of 0.13 and 0.06 in 2020 and 2021, respectively, suggesting the absence of transgressive segregation (Figure 1). The estimated broad-sense heritability (H2B) was 0.84, indicating a minor effect of environmental factors on phenotypic variation.
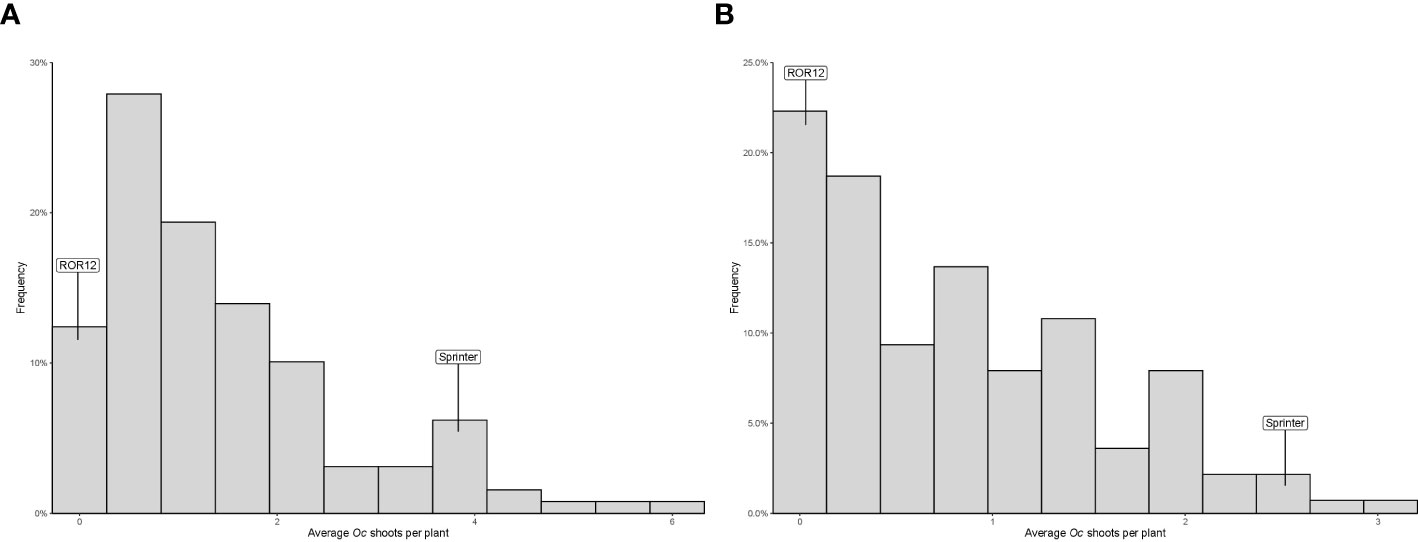
Figure 1 Frequency distribution of the average number of Orobanche crenata Forsk. (Oc) shoots emerged aboveground per host plant recorded for the parental lines “Sprinter” and “ROR12” and their RIL F7 population in 2020 (A) and 2021 (B).
Sequencing of an ApeKI-GBS library obtained from the DNA of the parental genotypes and the RIL population resulted in approximately 2.2 million reads/sample. Approximately 33% of the reads were successfully mapped onto the pea reference genome (Kreplak et al., 2019). After the SNP call and quality control procedures, 6,182 polymorphic loci were identified. Further filtering to eliminate potentially spurious SNP calls, associated with loci displaying skewed segregation or associated with double crossover, resulted in a final panel of 4,489 markers. Of these, 4,127 were located on the seven pea chromosomes, whereas the remaining ones were located on pea superscaffolds and scaffolds. The number of polymorphic loci per chromosome and chromosome length displayed a moderate correlation (R2 = 0.55, p = 0.03), indicating a quite uniform distribution of variants across the genome.
Linkage analysis resulted in a genetic map containing seven linkage groups (LGs), in accordance with the pea haploid chromosome number (Figure 2A). Genetic length, physical length, and recombination rate associated with each linkage group are presented in Table 2. Good collinearity was found between the position of markers in the genetic map and the one in the pea reference genome (Figure 2B). Most notable exceptions were represented by two regions of the chromosomes 4LG4 and 7LG7 (Figure 2B), and the mapping of 59 markers on a different chromosome than in the reference genome (Supplementary Table S1). In addition, 362 SNP loci positioned on 9 superscaffolds and 125 scaffolds were anchored to the seven linkage groups (Supplementary Table S2).
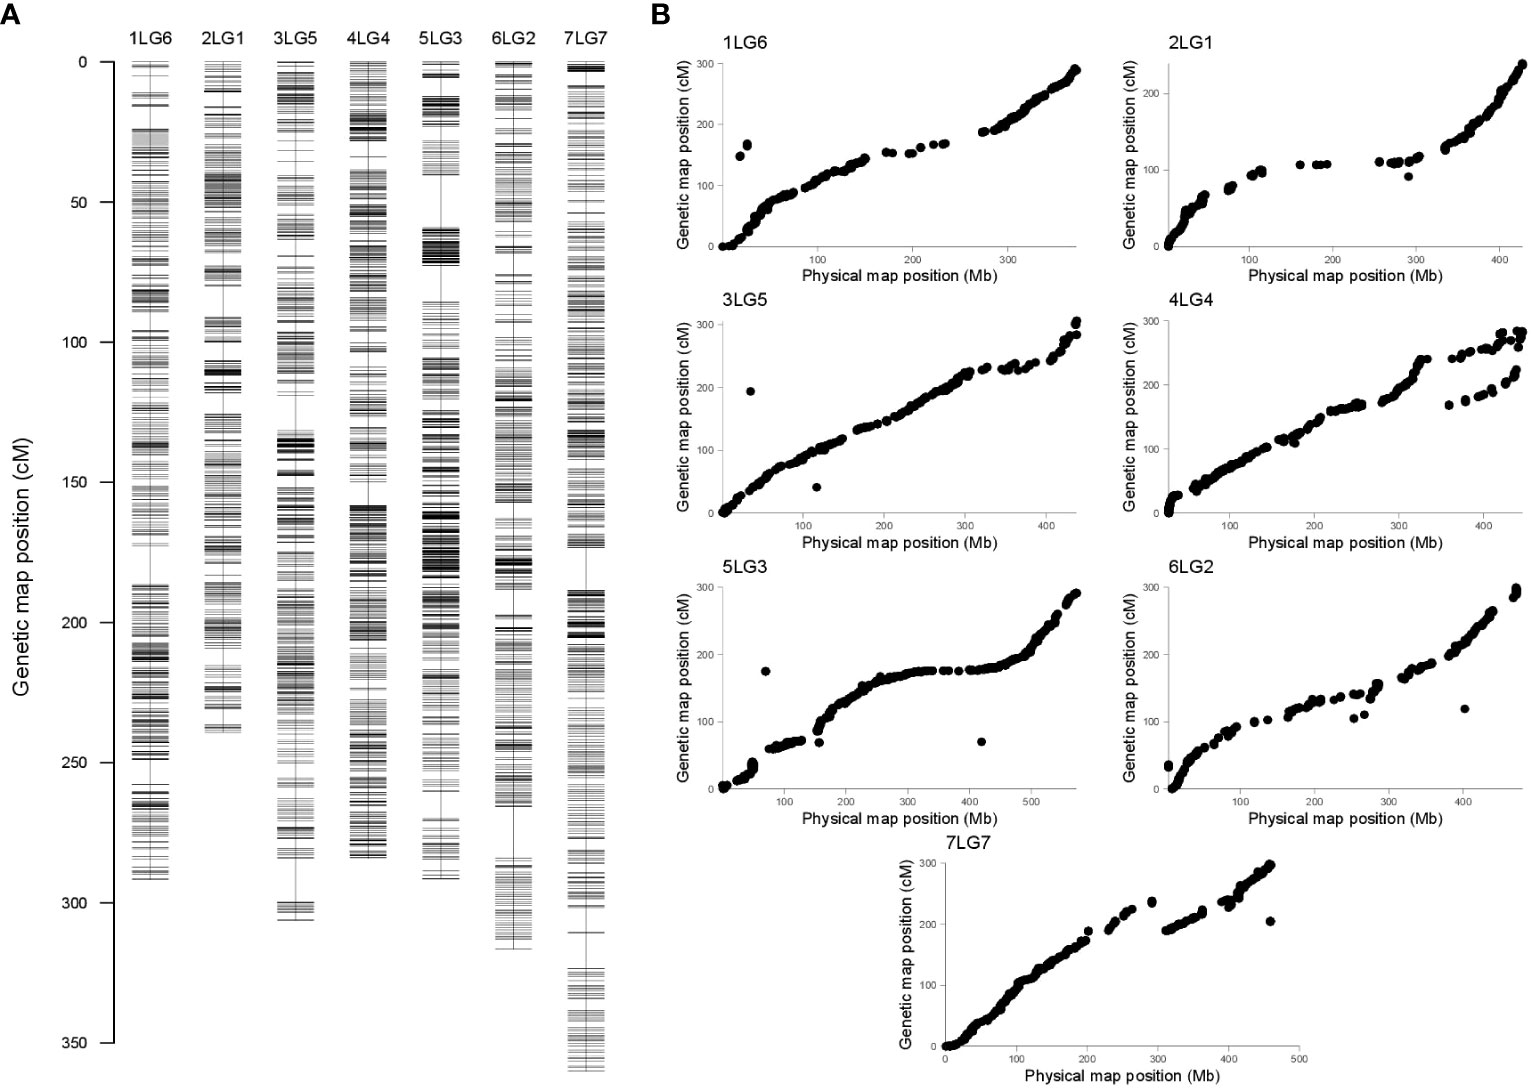
Figure 2 (A) Pea genetic map constructed with 4,489 single-nucleotide polymorphism (SNP) markers generated by genotyping-by-sequencing (GBS). Each horizontal bar indicates the marker position, expressed in centiMorgan (cM). Each linkage group (LG) has the same name of the corresponding chromosome (B). Comparison between the pea genetic and physical maps. For each LG/chromosome, SNPs are represented by dots, whose coordinates on the x and y axes are given by their positions on the genetic map (cM) and the physical map (Mb), respectively.
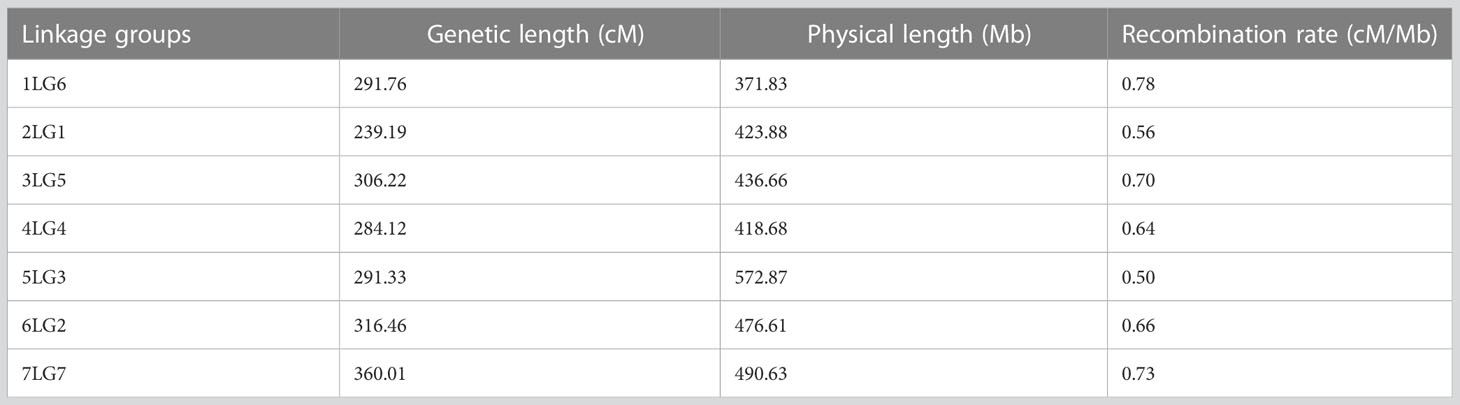
Table 2 Genetic length, physical length, and recombination rate associated with the linkage groups detected in this study.
Testing for the effect of variance components indicated a non-significant contribution of the genotype-by-year interaction term (Supplementary Table S3). Therefore, QTL mapping was performed using 2-year data, which were combined to obtain BLUPs of RIL genotypic effects on the phenotype (i.e., genotypic values). Three QTLs with LOD score peak above the significance threshold of 4.89 were identified. The QTL on chromosome 4LG4, named PsOcr-1, was associated with the highest LOD score peak (36.74), corresponding to 69.3% of the genotypic variance (σ2G) (Figure 3). The other two QTLs, located on chromosomes 1LG6 and 5LG3, were named PsOcr-2 and PsOcr-3, respectively. PsOcr-2 displayed a LOD score peak of 10.73 and explained 29.4% of σ2G, whereas PsOcr-3 displayed a LOD score peak of 4.96 and explained 15% of σ2G. The PsOcr-3 LOD score peak was mapped 14.98 Mb apart from the SSR marker AD174, previously associated with “ROR12” resistance (Bardaro et al., 2016). The PsOcr-2 LOD score peak was mapped approximately 17 Mb apart from the carbonic anhydrase gene Psat1g058960. This gene, according to the linkage map reported by Carrillo et al. (2014), is linked to the RAPD marker OPAA19_702, which was in turn linked to the Oc resistance QTL n°br04 by Fondevilla et al. (2010).
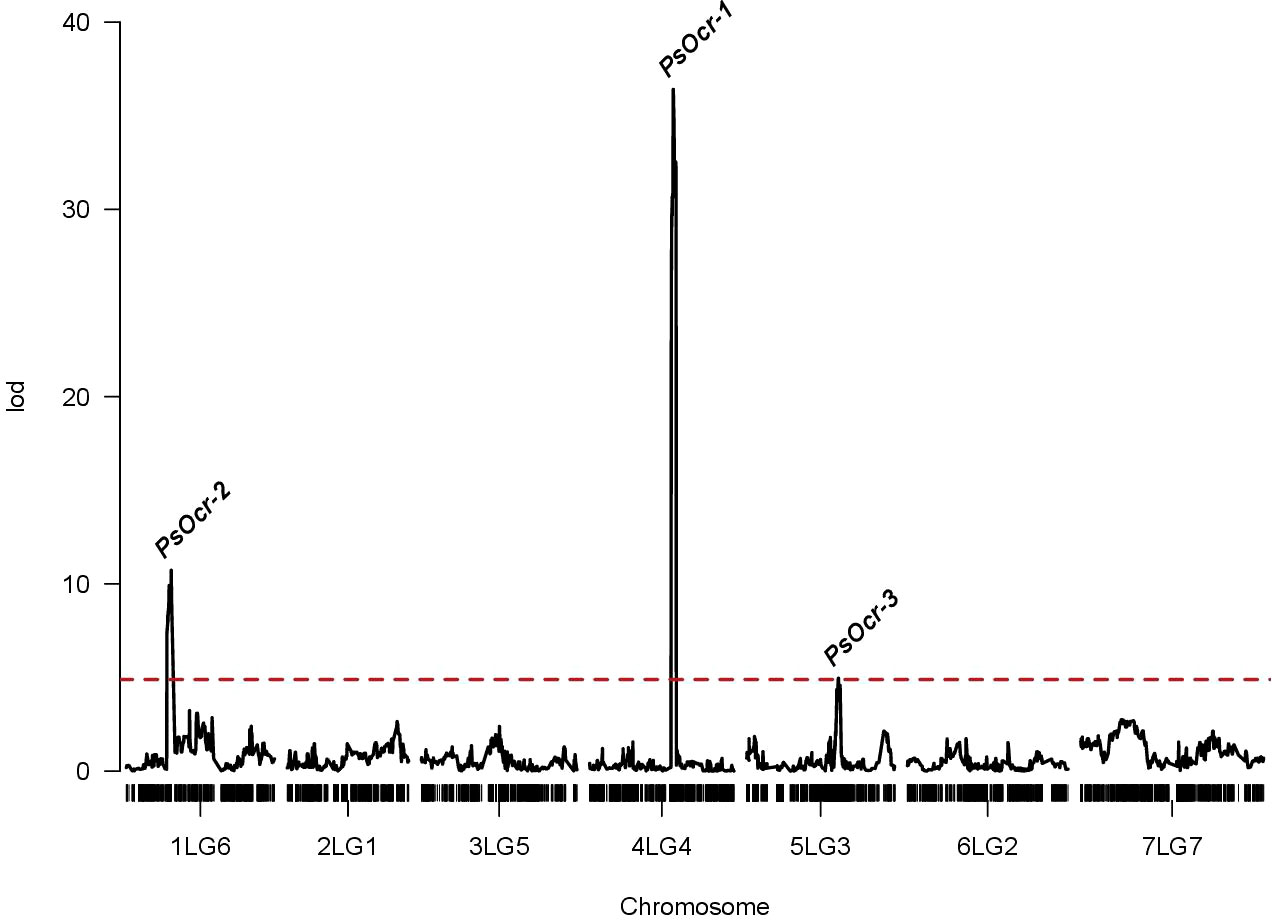
Figure 3 Logarithm of odds (LOD) score curves of quantitative trait loci (QTLs) associated with response to Orobanche crenata infection. The dashed red line indicated the significance threshold identified by permutation analysis. The three QTL above the threshold (PsOcr-1, PsOcr-2 and PsOcr-3) are indicated in correspondence of their LOD score peaks.
The QTL confidence intervals spanned physical regions of 17.2 Mb for PsOcr-1, 7.2 Mb for PsOcr-2, and 51.2 Mb for PsOcr-3, and contained 159, 99, and 617 genes, respectively (Supplementary Table S4). Among these genes, 5 in PsOcr-1 and 25 in PsOcr-3 were annotated with the gene ontology (GO) term GO:0006952, “defense response biological process” (Supplementary Table S4). Enrichment analysis showed significant enrichment of PsOcr-3 for this GO term (p-value = 7.08−10). The SNP loci corresponding to the PsOcr-1, PsOcr-2, and PsOcr-3 LOD score peaks were positioned within genes predicted to encode an F-box domain protein (Psat4g128720), a phenylalanine ammonia lyase (Psat1g046920), and a proton-dependent oligopeptide transporter (Psat5g221320), respectively (Supplementary Table S4).
“ROR12” was previously shown to be a low-strigolactone line, which causes a reduced germination of Oc seeds (Pavan et al., 2016). Thus, we searched, within the QTL confidence intervals, for predicted genes showing homology with genes involved in the strigolactone biosynthetic pathway. This resulted in the identification, in PsOcr-2, of one 2-oxoglutarate-dependent dioxygenase (2OGD) (Psat1g046960) and, in PsOcr-3, of one cytochrome P450 oxygenase of the CYP711A subfamily (Psat5g201640), two cytochrome P450 oxygenases of the CYP722C subfamily (Psat5g209960 and Psat5g209880), and two 2OGDs (Psat5g206640 and Psat5g206800) (Supplementary Table S4).
Information on the genotypic values and QTL genotypes of individual RILs was used to investigate the genetic effect of different QTL combinations. This indicated additivity between PsOcr-1 and PsOcr-2, and between PsOcr-1 and PsOcr-3 (Figures 4A, B), with the three QTL alleles contributing to Oc resistance all deriving from “ROR12”. Conversely, the genotype occurring at PsOcr-3, homozygous for either the “ROR12” allele (R) or the “Sprinter” allele (S), did not affect the genotypic value of RILs homozygous for the R allele at PsOcr-2 (Figure 4C), thus indicating epistasis of PsOcr-2 over PsOcr-3.

Figure 4 Combined effects on the phenotype of the QTL pairs PsOcr-1:PsOcr-2 (A), PsOcr-1:PsOcr-3 (B), and PsOcr-2:PsOcr-3 (C). Each plot reports: on the x-axis, the genotype for the marker locus corresponding to the first QTL LOD score peak; as a color code, the genotype for the marker locus corresponding to the second QTL LOD score peak; on the y-axis, mean best linear unbiased predictors (BLUPs) of genotypic effects on the phenotype. Black bars indicate ± SE of BLUP means. Lines express, for a given genotype of the second QTL, the BLUP mean change when varying the genotype at the first QTL. R and S indicate the “ROR12” and “Sprinter” alleles, respectively.
KASP assays were designed on the SNPs corresponding to the LOD score peaks of the QTLs PsOcr-1, PsOcr-2, and PsOcr-3. These were validated on the parental lines, as well as three different RIL panels, each one predicted from GBS data to include 10 lines homozygous for the “ROR12” allele, 10 lines homozygous for the “Sprinter” allele, and at least 1 heterozygous line. Each KASP assay yielded three fluorescence groups (Figure 5). In addition, KASP genotypic calls were fully consistent with GBS calls.
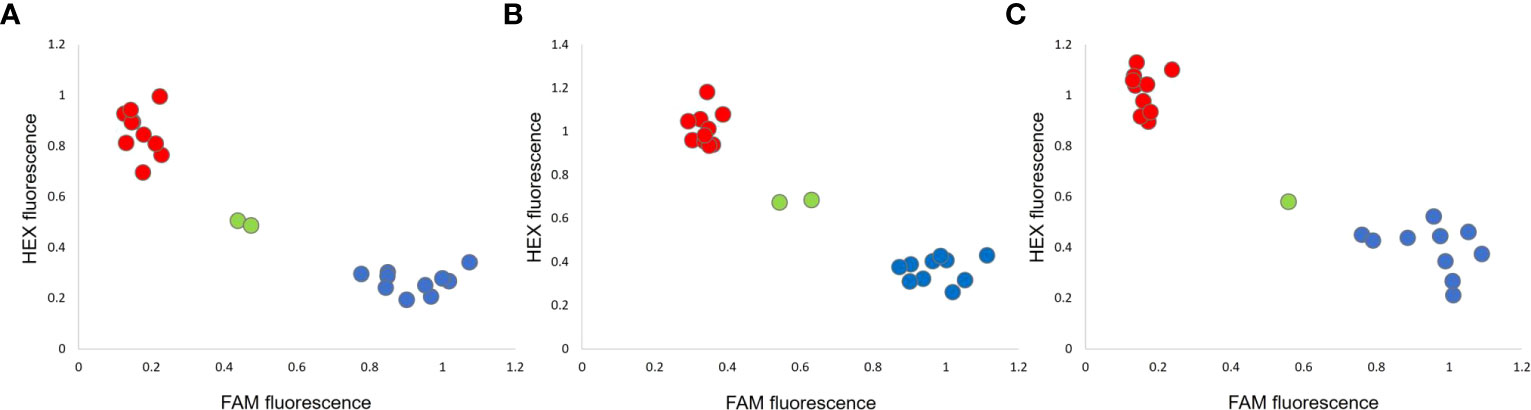
Figure 5 KASP assays for the PsOcr-1 (A), PsOcr-2 (B), and PsOcr-3 (C) quantitative trait loci (QTLs) for resistance to Orobanche crenata. Each recombinant inbred line (RIL) is associated with a dot, whose coordinates are given by the fluorescence levels recorded for the FAM and HEX dyes. The red and blue colors indicate homozygous calls for the “Sprinter” and “ROR12” alleles, respectively, whereas the green color indicates heterozygous calls.
Here, we show that “ROR12” resistance, highly effective against Oc, is controlled by three QTLs, including one (PsOcr-1) explaining as much as 69.3% of the genetic variance. In contrast, other Oc resistance sources previously identified in wild or cultivated Pisum germplasm confer incomplete immunity and are under the control of several minor effect QTLs (Rubiales et al., 2003; Valderrama et al., 2004; Pérez-de-Luque et al., 2005; Rubiales et al., 2005; Fondevilla et al., 2010; Rubiales et al., 2021; Wohor et al., 2022). High heritability (0.84) and the absence of pleiotropic phenotypes affecting the agronomic performance, such as severe dwarfism and extreme branching occurring in other strigolactone-defective mutants (Rameau et al., 1997; Morris et al., 2001; Pavan et al., 2016), are other features of “ROR12” resistance of value for breeding purposes. KASP technology provides a robust, high-throughput, and cost-effective solution for assisted selection (Ma et al., 2017b; Broccanello et al., 2018); therefore, the three KASP assays designed and validated in this study are expected to be of great value for the introgression of “ROR12” resistance into new pea cultivars. The KASP markers designed on the PsOcr-2 and PsOcr-3 LOD score peaks were mapped in proximity of the markers OPAA19_702 and AD174, suggesting that PsOcr-2 and PsOcr-3 might coincide with the Oc resistance QTLs previously detected by Fondevilla et al. (2010) and Bardaro et al. (2016), respectively.
The study of combined genetic effects indicated additivity between PsOcr-1 and PsOcr-2, and between PsOcr-1 and PsOcr-3, and epistasis of PsOcr-2 over PsOcr-3. In further support of the epistasis of PsOcr-2 over PsOcr-3, we found that two QTLs, PsOcr-1 and PsOcr-2, are alone sufficient to explain approximately 100% of the RIL population genotypic variance. Overall, our results support the hypothesis that “ROR12” resistance originates from two independent defense mechanisms, one involving PsOcr-1 and the other both PsOcr-2 and PsOcr-3.
Several defense response genes were identified in the PsOcr-1 and PsOcr-3 QTL confidence intervals. Most of them encode a nucleotide-binding domain shared by apoptotic protease-activating factor-1, resistance proteins, and Caenorhabditis elegans death-4 protein (referred to as NB-ARC domain), which was predicted to play a major role in the activation of defense responses against parasitic plants (Li and Timko, 2009; Hu et al., 2020). Interestingly, the SNP corresponding to the PsOcr-2 LOD score peak causes a missense (Thr699Ile) mutation in the phenylalanine ammonia lyase (PAL) protein encoded by the gene Psat1g046920. PAL catalyzes the first committed step in the phenylpropanoid pathway, and its expression is typically induced as a defense mechanism towards biotic agents, including broomrapes (Mabrouk et al., 2016; Briache et al., 2020).
“ROR12” resistance was previously associated with reduced production of strigolactones and, consequently, reduced Oc seed germination (Pavan et al., 2016). Interestingly, the QTL confidence intervals identified in this study do not contain the two pea strigolactone biosynthetic genes characterized so far, Rms1 and Rms5, encoding the Carotenoid Cleavage Dioxygenase 7 (CCD7) and Carotenoid Cleavage Dioxygenase 8 (CCD7) enzymes. However, the intervals do encompass several homologs of genes that were shown to play a role in strigolactone biosynthesis in other plant species, namely, cytochrome P450s of the CYP711A and CYP722C subfamilies and 2OGD enzymes. Members of the CYP711A subfamily play a highly important and varied role in strigolactone biosynthesis. They, for example, convert carlactone into carlactonoic acid in Arabidopsis (Abe et al. 2014), and carlactone into 4-deoxyorobanchol and 4-deoxyorobanchol into orobanchol in rice (Zhang et al., 2014). Enzymes of the CYP722C subfamily were shown to catalyze the formation of 5-deoxystrigol from carlactonoic acid in cotton (Wakabayashi et al., 2020), and of orobanchol from carlactonoic acid in tomato and cowpea (Wakabayashi et al., 2019; Wakabayashi et al., 2022). 2OGDs were associated with the biosynthesis of non-canonical strigolactones in the pea relative Medicago truncatula (Xie, 2016; Mashiguchi et al., 2021); however, non-canonical strigolactones have not been identified in pea. Interestingly, a recent study showed that pea is lacking a CYP712G1 orthologue that was postulated to be required for non-canonical strigolactone biosynthesis in M. truncatula (Wang et al., 2022). It will be intriguing to see whether the OGDs identified in the present study play a role in the biosynthesis of so far unknown strigolactones in pea.
This study provides another successful example of mapping genes of economic interest in pea by GBS (Holdsworth et al., 2017; Gali et al., 2018; Gali et al., 2019; Pavan et al., 2022). The quality of the linkage map provided in this study is suggested by its overall collinearity with the pea reference genome (Kreplak et al., 2019). Notably, we also highlight a few exceptions to this collinearity and provide genomic context to unanchored physical scaffolds and superscaffolds, thus delivering elements for the refinement of pea genomic resources.
In conclusion, the results of this study might contribute to foster pea cultivation in the Mediterranean Basin and the Middle East, two areas in which Oc infestations discourage farmers from using legumes in crop rotations (Renna et al., 2015; Negewo et al., 2022). Future research might be addressed to the further refinement of the QTL mapping resolution. Pea is considered recalcitrant to stable genetic transformation protocols (Choudhury and Rajam, 2021); therefore, transient transformation or TILLING (Dalmais et al., 2008; Li et al., 2023b) may be used for the functional characterization of candidate genes.
The datasets presented in this study can be found in online repositories. The names of the repository/repositories and accession number(s) can be found below: https://figshare.com/, doi: 10.6084/m9.figshare.22741481.
SP planned the study. LR and SP provided research funds. AM developed the RIL population. CD, FA, AM, VF, and MD contributed to data acquisition. CD, SP, MG, and PC contributed to data analysis. SP wrote the first draft of the paper. CD, PC, CL, HB, and LR critically revised the manuscript. All authors read and approved the final version of the manuscript.
This study was partially carried out within the framework of the Agritech National Research Center, receiving funding from the European Union Next-Generation EU [PIANO NAZIONALE DI RIPRESA E RESILIENZA (PNRR) – MISSIONE 4 COMPONENTE 2, INVESTIMENTO 1.4 – D.D. 1032 17/06/2022, CN00000022]. The work from Valentina Fanelli was supported by MIUR-PON Ricerca e Innovazione 2014–2020 (project AIM1809249-attività 2, linea 1).
The authors declare that the research was conducted in the absence of any commercial or financial relationships that could be construed as a potential conflict of interest.
All claims expressed in this article are solely those of the authors and do not necessarily represent those of their affiliated organizations, or those of the publisher, the editors and the reviewers. Any product that may be evaluated in this article, or claim that may be made by its manufacturer, is not guaranteed or endorsed by the publisher.
This manuscript reflects only the authors’ views and opinions; neither the European Union nor the European Commission can be considered responsible for them.
The Supplementary Material for this article can be found online at: https://www.frontiersin.org/articles/10.3389/fpls.2023.1216297/full#supplementary-material
Abe, S., Sado, A., Tanaka, K., Kisugi, T., Asami, K., Ota, S., et al. (2014). Carlactone is converted to carlactonoic acid by MAX1 in Arabidopsis and its methyl ester can directly interact with AtD14 in vitro. Proc. Natl. Acad. Sci. U.S.A. 111, 18084–18089. doi: 10.1073/pnas.1410801111
Allard, A., Bink, M. C., Martinez, S., Kelner, J. J., Legave, J. M., di Guardo, M., et al. (2016). Detecting QTLs and putative candidate genes involved in budbreak and flowering time in an apple multiparental population. J. Exp. Bot. 67, 2875–2888. doi: 10.1093/jxb/erw130
Bardaro, N., Marcotrigiano, A. R., Bracuto, V., Mazzeo, R., Pavan, S., Ricciardi, L. (2016). Genetic analysis of resistance to Orobanche crenata (Forsk.) in a pea (Pisum sativum l.) low-strigolactone line. J. Plant Pathol. 98, 671–675. doi: 10.4454/jpp.v98i3.3762
Barilli, E., Cobos, M. J., Carrillo, E., Kilian, A., Carling, J., Rubiales, D. (2018). A high-density integrated DArTseq SNP-based genetic map of Pisum fulvum and identification of QTLs controlling rust resistance. Front. Plant Sci. 9. doi: 10.3389/fpls.2018.00167
Bates, D., Mächler, M., Bolker, B. M., Walker, S. C. (2015). Fitting linear mixed-effects models using lme4. J. Stat. Soft. 67, 1–48. doi: 10.18637/jss.v067.i01
Ben Sadok, I., Celton, J. M., Essalouh, L., El Aabidine, A. Z., Garcia, G., Martinez, S., et al. (2013). QTL mapping of flowering and fruiting traits in olive. PloS One 8, e62831. doi: 10.1371/journal.pone.0062831
Bouwmeester, H., Li, C., Thiombiano, B., Rahimi, M., Dong, L. (2021). Adaptation of the parasitic plant lifecycle: germination is controlled by essential host signaling molecules. Plant Physiol. 185, 1292–1308. doi: 10.1093/plphys/kiaa066
Bradbury, P. J., Zhang, Z., Kroon, D. E., Casstevens, T. M., Ramdoss, Y., Buckler, E. S. (2007). TASSEL: software for association mapping of complex traits in diverse 540 samples. Bioinformatics. 23, 2633–2635. doi: 10.1093/bioinformatics/btm308
Briache, F. Z., Ennami, M., Mbasani-Mansi, J., Lozzi, A., Abousalim, A., Rodeny, W. E., et al. (2020). Effects of salicylic acid and indole acetic acid exogenous applications on induction of faba bean resistance against Orobanche crenata. Plant Pathol. J. 36, 476–490. doi: 10.5423/PPJ.OA.03.2020.0056
Broccanello, C., Chiodi, C., Funk, A., McGrath, J. M., Panella, L., Stevanato, P. (2018). Comparison of three PCR-based assays for SNP genotyping in plants. Plant Methods 14, 28. doi: 10.1186/s13007-018-0295-6
Broman, K. W. (2015). R/qtlcharts: interactive graphics for quantitative trait locus mapping. Genetics. 199, 359–361. doi: 10.1534/genetics.114.172742
Broman, K. W., Wu, H., Sen, Ś., Churchill, G. A. (2003). R/qtl: QTL mapping in experimental crosses. Bioinformatics. 19, 889–890. doi: 10.1093/bioinformatics/btg112
Carrillo, E., Satovic, Z., Aubert, G., Boucherot, K., Rubiales, D., Fondevilla, S. (2014). Identification of quantitative trait loci and candidate genes for specific cellular resistance responses against didymella pinodes in pea. Plant Cell Rep. 33, 1133–1145. doi: 10.1007/s00299-014-1603-x
Catchen, J., Hohenlohe, P. A., Bassham, S., Amores, A., Cresko, W. A. (2013). Stacks: an analysis tool set for population genomics. Mol. Ecol. 22, 3124–3140. doi: 10.1111/mec.12354
Centrone, M., Gena, P., Ranieri, M., Di Mise, A., D'Agostino, M., Mastrodonato, M., et al. (2020). In vitro and in vivo nutraceutical characterization of two chickpea accessions: differential effects on hepatic lipid over-accumulation. Antioxidants. 9, 268. doi: 10.3390/antiox9030268
Choudhury, A., Rajam, M. V. (2021). Genetic transformation of legumes: an update. Plant Cell Rep. 40, 1813–1830. doi: 10.1007/s00299-021-02749-7
Costantini, M., Summo, C., Centrone, M., Rybicka, I., D'Agostino, M., Annicchiarico, P., et al. (2021). Macro- and micro-nutrient composition and antioxidant activity of chickpea and pea accessions. Polish J. Food Nutr. Sci. 71, 177–185. doi: 10.31883/pjfns/135813
Dalmais, M., Schmidt, J., Le Signor, C., Moussy, F., Burstin, J., Savois, V., et al. (2008). UTILLdb, a Pisum sativum in silico forward and reverse genetics tool. Genome Biol. 9, R43. doi: 10.1186/gb-2008-9-2-r43
Daryanto, S., Wang, L., Jacinthe, P. (2015). Global synthesis of drought effects on food legume production. PloS One 10, e0127401. doi: 10.1371/journal.pone.0127401
Elshire, R. J., Glaubitz, J. C., Sun, Q., Poland, J. A., Kawamoto, K., Buckler, E. S., et al. (2011). A robust, simple genotyping-by-Sequencing (GBS) approach for high diversity species. PloS One 6, e19379. doi: 10.1371/journal.pone.0019379
FAOSTAT data (2021). Available at: http://www.fao.org/faostat/.
Fernández-Aparicio, M., Flores, F., Rubiales, D. (2016b). The effect of Orobanche crenata infection severity in faba bean, field pea, and grass pea productivity. Front. Plant Sci. 7, e1409. doi: 10.3389/fpls.2016.01409
Fernández-Aparicio, M., Kisugi, T., Xie, X., Rubiales, D., Yoneyama, K. (2014). Low strigolactone root exudation: a novel mechanism of broomrape (Orobanche and phelipanche spp.) resistance available for faba bean breeding. J. Agric. Food Chem. 62, 7063–7071. doi: 10.1021/jf5027235
Fernández-Aparicio, M., Reboud, X., Gibot-Leclerc, S. (2016a). Broomrape weeds. underground mechanisms of parasitism and associated strategies for their control: a review. Front. Plant Sci. 7. doi: 10.3389/fpls.2016.00135
Fierst, J. L. (2015). Using linkage maps to correct and scaffold de novo genome assemblies: methods, challenges, and computational tools. Front. Genet. 6. doi: 10.3389/fgene.2015.00220
Fondevilla, S., Fernández-Aparicio, M., Šatović, Z., Emeran, A. A., Torres, A. M., Moreno, M. T. (2010). Identification of quantitative trait loci for specific mechanisms of resistance to Orobanche crenata forsk. in pea (Pisum sativum l.). Mol. Breeding. 25, 259–272. doi: 10.1007/s11032-009-9330-7
Gali, K. K., Liu, Y., Sindhu, A., Diapari, M., Shunmugam, A. S. K., Arganosa, G., et al. (2018). Construction of high-density linkage maps for mapping quantitative trait loci for multiple traits in field pea (Pisum sativum l.). BMC Plant Biol. 18, 172. doi: 10.1186/s12870-018-1368-4
Gali, K. K., Sackville, A., Tafesse, E. G., Lachagari, V. B. R., McPhee, K., Hybl, M., et al. (2019). Genome-wide association mapping for agronomic and seed quality traits of field pea (Pisum sativum l.). Front. Plant Sci. 10. doi: 10.3389/fpls.2019.01538
Guindon, M. F., Martin, E., Cravero, M., Gali, K. K., Warkentin, T. D., Cointry, E., et al. (2019). Linkage map development by GBS, SSR, and SRAP techniques and yield-related QTLs in pea. Mol. Breeding. 39, 54. doi: 10.1007/s11032-019-0949-8
Holdsworth, W., Gazave, E., Cheng, P., Myers, J. R., Gore, M. A., Coyne, C. J., et al. (2017). A community resource for exploring and utilizing genetic diversity in the USDA pea single plant plus collection. Hortic. Res. 4, 17017. doi: 10.1038/hortres.2017.17
Hu, L., Wang, J., Yang, C., Islam, F., Bouwmeester, H. J., Muños, S., et al. (2020). The effect of virulence and resistance mechanisms on the interactions between parasitic plants and their hosts. Int. J. Mol. Sci. 21, 1–27. doi: 10.3390/ijms21239013
Jamil, M., Kountche, B. A., Al-Babili, S. (2021). Current progress in Striga management. J. Plant Physiol. 185, 1339–1352. doi: 10.1093/plphys/kiab040
Jamil, M., Rodenburg, J., Charnikhova, T., Bouwmeester, H. J. (2011). Pre-attachment Striga hermonthica resistance of new rice for africa (NERICA) cultivars based on low strigolactone production. New Phytol. 192, 964–975. doi: 10.1111/j.1469-8137.2011.03850.x
Kolberg, L., Raudvere, U., Kuzmin, I., Vilo, J., Peterson, H. (2020). gprofiler2 – an r package for gene list functional enrichment analysis and namespace conversion toolset g:Profiler. F1000Res. 9, ELIXIR–ELI709. doi: 10.12688/f1000research.24956.2
Kreplak, J., Madoui, M. A., Cápal, P., Novák, P., Labadie, K., Aubert, G., et al. (2019). A reference genome for pea provides insight into legume genome evolution. Nat. Genet. 51, 1411–1422. doi: 10.1038/s41588-019-0480-1
Kuznetsova, A., Brockhoff, P. B., Christensen, R. H. B. (2017). lmerTest package: tests in linear mixed effects models. J. Stat. Software 82, 1–26. doi: 10.18637/jss.v082.i13
Langmead, B., Salzberg, S. L. (2012). Fast gapped-read alignment with bowtie 2. Nat. Methods 9, 357–359. doi: 10.1038/nmeth.1923
Li, C., Dong, L., Durairaj, J., Guan, J. C., Yoshimura, M., Quinodoz, P., et al. (2023a). Maize resistance to witchweed through changes in strigolactone biosynthesis. Science. 379, 94–99. doi: 10.1126/science.abq4775
Li, G., Liu, R., Xu, R., Varshney, R. K., Ding, H., Li, M., et al. (2023b). Development of an agrobacterium-mediated CRISPR/Cas9 system in pea (Pisum sativum l.). Crop J. 11, 132–139. doi: 10.1016/j.cj.2022.04.011
Li, J., Timko, M. P. (2009). Gene-for-gene resistance in striga-cowpea associations. Science. 325, 1094. doi: 10.1126/science.1174754
Loridon, K., McPhee, K., Morin, J., Dubreuil, P., Pilet-Nayel, M. L., Aubert, G., et al. (2005). Microsatellite marker polymorphism and mapping in pea (Pisum sativum l.). Theor. Appl. Genet. 111, 1022–1031. doi: 10.1007/s00122-005-0014-3
Ma, Y., Coyne, C. J., Grusak, M. A., Mazourek, M., Cheng, P., Main, D., et al. (2017a). Genome-wide SNP identification, linkage map construction and QTL mapping for seed mineral concentrations and contents in pea (Pisum sativum l.). BMC Plant Bio. 17, 43. doi: 10.1186/s12870-016-0956-4
Ma, Y., Coyne, C. J., Main, D., Pavan, S., Sun, S., Zhu, Z., et al. (2017b). Development and validation of breeder-friendly KASPar markers for er1, a powdery mildew resistance gene in pea (Pisum sativum l.). Mol. Breeding. 37, 151. doi: 10.1007/s11032-017-0740-7
Mabrouk, Y., Mejri, S., Hemissi, I., Belhadj, O. (2016). Biochemical analysis of induced resistance in chickpea against broomrape (Orobanche foetida) by rhizobia inoculation. Phytopathol. Mediterr. 55, 54–61. doi: 10.14601/Phytopathol_Mediterr-16338
Mashiguchi, K., Seto, Y., Yamaguchi, S. (2021). Strigolactone biosynthesis, transport and perception. Plant J. 105, 335–350. doi: 10.1111/tpj.15059
Molenaar, H., Bohem, R., Piepho, H. P. (2018). Phenotypic selection in ornamental breeding: it's better to have the BLUPs than to have the BLUEs. Front. Plant Sci. 9. doi: 10.3389/fpls.2018.01511
Morris, S. E., Turnbull, C. G. N., Murfet, I. C., Beveridge, C. A. (2001). Mutational analysis of branching in pea. evidence that Rms1 and Rms5 regulate the same novel signal. Plant Physiol. 126, 1205–1213. doi: 10.1104/pp.126.3.1205
Murray, K. D., Borevitz, J. O. (2018). Axe: rapid, competitive sequence read demultiplexing using a trie. Bioinformatics. 34, 3924–3925. doi: 10.1093/bioinformatics/bty432
Negewo, T., Ahmed, S., Tessema, T., Tana, T. (2022). Biological characteristics, impacts, and management of crenate broomrape (Orobanche crenata) in faba bean (Vicia faba): a review. Front. Agron. 4. doi: 10.3389/fagro.2022.708187
Pavan, S., Delvento, C., Nazzicari, N., Ferrari, B., D'Agostino, N., Taranto, F., et al. (2022). Merging genotyping-by-Sequencing data from two ex situ collections provides insights on the pea evolutionary history. Hortic. Res. 9, uhab062. doi: 10.1093/hr/uhab062
Pavan, S., Delvento, C., Ricciardi, L., Lotti, C., Ciani, E., D'Agostino, N. (2020). Recommendations for choosing the genotyping method and best practices for quality control in crop genome-wide association studies. Front. Genet. 11. doi: 10.3389/fgene.2020.00447
Pavan, S., Schiavulli, A., Marcotrigiano, A. R., Bardaro, N., Bracuto, V., Ricciardi, F., et al. (2016). Characterization of low-strigolactone germplasm in pea (Pisum sativum l.) resistant to crenate broomrape (Orobanche crenata forsk.). Mol. Plant-Microbe Interact. 29, 743–749. doi: 10.1094/MPMI-07-16-0134-R
Pérez-de-Luque, A., Jorrín, J., Cubero, J. I., Rubiales, D. (2005). Orobanche crenata resistance and avoidance in pea (Pisum spp.) operate at different developmental stages of the parasite. Weed Res. 45, 379–387. doi: 10.1111/j.1365-3180.2005.00464.x
Rameau, C., Bodelin, C., Cadier, D., Grandjean, O., Miard, F., Murfet, I. C. (1997). New ramosus mutants at loci Rms1, Rms3 and Rms4 resulting from the mutation breeding program at Versailles. Pisum Genet. 29, 7–12.
R Core Team (2013). R: a language and environment for statistical computing (Vienna: R Foundation for Statistical Computing). Available at: http://www.R-project.org/.
Renna, M., Serio, F., Santamaria, P. (2015). Crenate broomrape (Orobanche crenata forskal): prospects as a food product for human nutrition. Genet. Resour. Crop Evol. 62, 795–802. doi: 10.1007/s10722-015-0249-z
Rubiales, D. (2014). Legume breeding for broomrape resistance. Czech J. Genet. Plant Breed. 50, 144–150. doi: 10.17221/106/2013-CJGPB
Rubiales, D., Fondevilla, S., Fernández-Aparicio, M. (2021). Development of pea breeding lines with resistance to Orobanche crenata derived from pea landraces and wild pisum spp. Agronomy. 11, 36. doi: 10.3390/agronomy11010036
Rubiales, D., Moreno, M. T., Sillero, J. C. (2005). Search for resistance to crenate broomrape (Orobanche crenata) in pea germplasm. Gen. Resour. Crop Evol. 52, 853–861. doi: 10.1007/s10722-003-6116-3
Rubiales, D., Pérez-de-Luque, A., Cubero, J. I., Sillero, J. C. (2003). Crenate broomrape (Orobanche crenata) infection in field pea cultivars. Crop Prot. 22, 865–872. doi: 10.1016/S0261-2194(03)00070-X
Schmidt, P., Hartung, J., Bennewitz, J., Hans-Peter, P. (2019). Heritability in plant breeding on a genotype-difference basis. Genetics. 212, 991–1008. doi: 10.1534/genetics.119.302134
Taylor, J., Butler, D. R. (2017). ASMap: efficient genetic linkage map construction and diagnosis. J. Stat. Software 79, 1–29. doi: 10.18637/jss.v079.i06
Valderrama, M. R., Román, B., Satovic, Z., Rubiales, D., Cubero, J. I., Torres, A. M. (2004). Locating genes associated with Orobanche crenata resistance in pea. Weed Res. 44, 323–328. doi: 10.1111/j.1365-3180.2004.00406.x
Wakabayashi, T., Hamana, M., Mori, A., Akiyama, R., Ueno, K., Osakabe, K., et al. (2019). Direct conversion of carlactonoic acid to orobanchol by cytochrome P450 CYP722C in strigolactone biosynthesis. Sci. Adv. 5, eaax9067. doi: 10.1126/sciadv.aax9067
Wakabayashi, T., Shida, K., Kitano, Y., Takikawa, H., Mizutani, M., Sugimoto, Y. (2020). CYP722C from Gossypium arboreum catalyzes the conversion of carlactonoic acid to 5-deoxystrigol. Planta 251, 97. doi: 10.1007/s00425-020-03390-6
Wakabayashi, T., Ueno, K., Sugimoto, Y. (2022). Structure elucidation and biosynthesis of orobanchol. Front. Plant Sci. 13. doi: 10.3389/fpls.2022.835160
Walve, R., Rastas, P., Salmela, L. (2019). Kermit: Linkage map guided long read assembly. Algorithms Mol. Biol. 14, 8. doi: 10.1186/s13015-019-0143-x
Wang, Y., Durairaj, J., Suárez Duran, H. G., van Velzen, R., Flokova, K., Liao, C. Y., et al. (2022). The tomato cytochrome P450 CYP712G1 catalyses the double oxidation of orobanchol en route to the rhizosphere signalling strigolactone, solanacol. New Phytol. 235, 1884–1899. doi: 10.1111/nph.18272
Wang, Y., Fang, Y., Ning, S., Xia, L., Zhan, J., Yang, Z., et al. (2023). QTL mapping for ovary- and fruit-related traits in Cucumis sativus-c. hystrix introgression line IL52. Genes. 14, 1133. doi: 10.3390/genes14061133
Wickham, H. (2016) ggplot2: elegant graphics for data analysis. Available at: https://ggplot2.tidyverse.org.
Wohor, O. Z., Rispail, N., Ojiewo, C. O., Rubiales, D. (2022). Pea breeding for resistance to rhizospheric pathogens. Plants. 11, 2664. doi: 10.3390/plants11192664
Wu, Y., Bhat, P., Close, T. J., Lonardi, S. (2008). Efficient and accurate construction of genetic linkage maps from minimum spanning tree of a graph. PloS Genet. 4, e1000212. doi: 10.1371/journal.pgen.1000212
Xie, X. (2016). Structural diversity of strigolactones and their distribution in the plant kingdom. J. Pestic. Sci. 41, 175–180. doi: 10.1584/jpestics.J16-02
Xie, X., Yoneyama, K., Yoneyama, K. (2010). The strigolactone story. Annu. Rev. Phytopathol. 48, 93–117. doi: 10.1146/annurev-phyto-073009-114453
Yang, T., Liu, R., Luo, Y., Hu, S., Wang, D., Wang, C., et al. (2022). Improved pea reference genome and pan-genome highlight genomic features and evolutionary characteristics. Nat. Genet. 54, 1553–1563. doi: 10.1038/s41588-022-01172-2
Yoneyama, K., Awad, A. A., Xie, X., Yoneyama, K., Takeuchi, Y. (2010). Strigolactones as germination stimulants for root parasitic plants. Plant Cell Physiol. 51, 1095–1103. doi: 10.1093/pcp/pcq055
Keywords: pea, broomrape, resistance, mapping, breeding
Citation: Delvento C, Arcieri F, Marcotrigiano AR, Guerriero M, Fanelli V, Dellino M, Curci PL, Bouwmeester H, Lotti C, Ricciardi L and Pavan S (2023) High-density linkage mapping and genetic dissection of resistance to broomrape (Orobanche crenata Forsk.) in pea (Pisum sativum L.). Front. Plant Sci. 14:1216297. doi: 10.3389/fpls.2023.1216297
Received: 03 May 2023; Accepted: 21 June 2023;
Published: 10 July 2023.
Edited by:
Tom Warkentin, University of Saskatchewan, CanadaReviewed by:
Hamid Khazaei, Natural Resources Institute Finland (Luke), FinlandCopyright © 2023 Delvento, Arcieri, Marcotrigiano, Guerriero, Fanelli, Dellino, Curci, Bouwmeester, Lotti, Ricciardi and Pavan. This is an open-access article distributed under the terms of the Creative Commons Attribution License (CC BY). The use, distribution or reproduction in other forums is permitted, provided the original author(s) and the copyright owner(s) are credited and that the original publication in this journal is cited, in accordance with accepted academic practice. No use, distribution or reproduction is permitted which does not comply with these terms.
*Correspondence: Stefano Pavan, c3RlZmFuby5wYXZhbkB1bmliYS5pdA==
Disclaimer: All claims expressed in this article are solely those of the authors and do not necessarily represent those of their affiliated organizations, or those of the publisher, the editors and the reviewers. Any product that may be evaluated in this article or claim that may be made by its manufacturer is not guaranteed or endorsed by the publisher.
Research integrity at Frontiers
Learn more about the work of our research integrity team to safeguard the quality of each article we publish.