 Malika Chabi1†
 Estelle Goulas1*†
 Dmitry Galinousky1†
 Anne-Sophie Blervacq1
 Anca Lucau-Danila2
 Godfrey Neutelings1
 Sébastien Grec1
 Arnaud Day1,3
 Brigitte Chabbert4Katharina Haag5Jörg Müssig6
 Sandrine Arribat1
 Sébastien Planchon7
 Jenny Renaut7
 Simon Hawkins1
- 1Université de Lille, CNRS, UMR 8576 - UGSF - Unité de Glycobiologie Structurale et Fonctionnelle, Lille, France
- 2Université de Lille, UMRT 1158 BioEcoAgro, Institut Charles Viollette, Lille, France
- 3Fibres Recherche Développement, Technopole de l’Aube en Champagne – Hôtel de Bureaux 2, 2 rue Gustave Eiffel, CS 90601, Troyes, France
- 4Université de Reims Champagne-Ardenne, INRAE, FARE, UMR A 614, Reims, France
- 5Fraunhofer-Institute for Manufacturing Technology and Advanced Materials IFAM, Bremen, Germany
- 6The Biological Materials Group, HSB – City University of Applied Sciences, Bremen, Germany
- 7Department of Environmental Research and Innovation, Luxembourg Institute of Science and Technology, Esch-sur-Alzette, Luxembourg
One of the biggest challenges for a more widespread utilization of plant fibers is to better understand the different molecular factors underlying the variability in fineness and mechanical properties of both elementary and scutched fibers. Accordingly, we analyzed genome-wide transcription profiling from bast fiber bearing tissues of seven different flax varieties (4 spring, 2 winter fiber varieties and 1 winter linseed) and identified 1041 differentially expressed genes between varieties, of which 97 were related to cell wall metabolism. KEGG analysis highlighted a number of different enriched pathways. Subsequent statistical analysis using Partial Least-Squares Discriminant Analysis showed that 73% of the total variance was explained by the first 3 X-variates corresponding to 56 differentially expressed genes. Calculation of Pearson correlations identified 5 genes showing a strong correlation between expression and morphometric data. Two-dimensional gel proteomic analysis on the two varieties showing the most discriminant and significant differences in morphometrics revealed 1490 protein spots of which 108 showed significant differential abundance. Mass spectrometry analysis successfully identified 46 proteins representing 32 non-redundant proteins. Statistical clusterization based on the expression level of genes corresponding to the 32 proteins showed clear discrimination into three separate clusters, reflecting the variety type (spring-/winter-fiber/oil). Four of the 32 proteins were also highly correlated with morphometric features. Examination of predicted functions for the 9 (5 + 4) identified genes highlighted lipid metabolism and senescence process. Calculation of Pearson correlation coefficients between expression data and retted fiber mechanical measurements (strength and maximum force) identified 3 significantly correlated genes. The genes were predicted to be connected to cell wall dynamics, either directly (Expansin-like protein), or indirectly (NAD(P)-binding Rossmann-fold superfamily protein). Taken together, our results have allowed the identification of molecular actors potentially associated with the determination of both in-planta fiber morphometrics, as well as ex-planta fiber mechanical properties, both of which are key parameters for elementary fiber and scutched fiber quality in flax.
1 Introduction
Climate change is becoming a major concern, and strong decisions will have to be taken in the coming years to reduce global CO2 production. In this context, a major challenge will be finding environmentally-friendly replacements for the fossil-fuel-based composites used in everyday life. Renewable materials containing plant fibers (natural fiber composites: NFCs) offer the double advantage of having a low environmental impact during production and being compatible with material end-of-life issues. Beyond the environmental arguments, natural fibers from plants have comparable and/or superior properties to synthetic fibers leading to increased use in several different industries, including building, transportation and sports (Bourmaud et al., 2018).
Flax (Linum usitatissinum L.) is an economically important fiber species grown for its long cellulose-rich fibers that are grouped together in fiber bundles located in the outer stem tissues, as well as for its seeds (Esau, 1943). It is one of the oldest cultivated plants and the current L. usitatissinum species is probably derived from pale flax L. bienne (Diederichsen and Hammer, 1995; Rahman and Hoque, 2023). There is evidence of flax fiber use in Neolithic cultures, and plants were later grown in Egypt about 6,000 years ago (Zohary and Hopf, 2004). However, whether flax selection was driven mainly for seed oil content or for fiber yield in the stems is still a matter of debate.
Previous work on flax-based NFCs has shown that their properties depend on several factors, including processing technique, polymer type and fiber quality (Haag et al., 2017). Defining “fiber quality” is difficult since it is related to what is really meant by the term “fiber” (Wrobél-Kwiatowska et al., 2010). The word fiber can refer to individual fiber cells - the botanical “elementary fibers” - or to groups of several elementary fibers glued together in which case the term “scutched fiber” is sometimes used. The fineness and the mechanical properties of both elementary and scutched fibers are key parameters used to define fiber quality, especially for textiles and/or NFCs. These parameters are linked to the plant genotype, environmental conditions, and the degree of elementary fiber separation obtained during the retting, scutching, and cleaning processes (Chabbert et al., 2020).
At the cellular level, both fineness and mechanical properties are related to the structural composition and the architecture of the fiber composite cell wall consisting of the middle lamella, the primary and gelatinous secondary cell wall characterized by high amounts of crystalline cellulose and very low lignin levels (Morvan et al., 2003; Day et al., 2005; Bourmaud et al., 2013). Although some broad correlations can currently be made between cell wall structure and fiber quality (e.g., negative relationship between lignin content and textile fiber quality), it is likely that many other more or less subtle variations in the cell wall structure and metabolism could contribute to differences in fiber properties. At the molecular level, approximately 10% of the genome is linked to cell wall construction, dynamic architecture, and sensing functions (Carpita, 2011), and a major challenge is to identify which ones are involved in this process and to understand their roles. Globally, flax is a well-studied plant from a molecular genetics point of view – its genome has been sequenced (Wang et al., 2012; You and Fofana, 2023; You et al., 2023) and chromosome pseudomolecules have been assigned (You et al., 2018), an integrated consensus genetic and physical map was constructed (Cloutier et al., 2012), and the karyotypes of common flax (Linum usitatissimum L.) (Rachinskaya et al., 2011) and wild species were also investigated (Muravenko et al., 2001). Moreover, the flax plant is a convenient object to study cell wall development because the stem contains both cell walls rich in cellulose (bast fibers) and lignin (xylem cells) (Day et al., 2005; Gorshkova et al., 2012; Huis et al., 2012; Petrova et al., 2022). Several previous studies on flax using Omics together with biochemical and imaging approaches have identified changes in the expression of numerous genes (Hotte and Deyholos, 2008; Fenart et al., 2010; Huis et al., 2012; Zhang and Deyholos, 2016; Chabi et al., 2017; Gorshkov et al., 2017; Gorshkova et al., 2018; Simon et al., 2018; Gorshkova et al., 2023; Somalraju and Fofana, 2023). In many cases, the interpretation of the results was based on the hypothesis that changes in the expression of genes related to the biosynthesis of major cell wall polymers (e.g., cellulose, hemicellulose, pectins and lignin) could be related to differences in cell wall structure and/or fiber properties. However, while such an hypothesis is no doubt basically correct, it is also possible that changes in the expression of other, less obvious genes (i.e., not apparently related to cell wall metabolism) could affect key fiber parameters such as fineness and mechanical properties.
In an attempt to obtain further information about underlying molecular processes potentially related to flax fiber quality, we combined Omics and morphometric/mechanical analyses in bast fiber bearing tissues (a complex mixture of tissues that mainly contains bast fibers, but also epidermis, cortical parenchyma and phloem sieve tubes) of seven flax varieties belonging to three contrasted morphotypes: fiber spring (Belinka, Diane, Drakkar, Hermes), fiber winter (Adelie and Violin) and oil winter (Oliver) grown under field conditions. A panel of statistical analyses allowed us to highlight a limited number of relevant central actors of in-planta and ex-planta fiber quality. Their role in the context of elementary fiber development and fiber bundle quality is discussed.
2 Materials and methods
2.1 Plant growth and sample collection
The seven flax cultivars (Diane, Hermes, Drakkar, Belinka, Adelie, Violin, and Oliver) were grown under field conditions in plots at Terre de Lin (TdL), Saint-Pierre-le-Viger, France, except for the cultivar Violin, cultivated by LINEA, Grandviliers, France. All retting and scutching were performed by Terre de Lin. For Omics and morphometrics, plant samples were col2lected from three randomly distributed areas of the field at the budding stage. Five-cm-long fragments were removed from stems at 5 cm above the cotyledons and outer tissues (peeled off fiber-enriched outer part of stem) were manually separated from the inner tissues and frozen in liquid nitrogen before storing at -80° C until used for transcriptomic and proteomic analyses. The peeled off tissues are therefore a complex mixture of tissues that contain, besides bast fibers, at least epidermis, cortical parenchyma and phloem sieve tubes. A 1-cm long fragment was removed from the stem at 10 cm above the cotyledons from the same plants for morphometric analyses. For analyses of mechanical properties, plants were pulled (harvested) at maturity, field-retted, and scutched to produce fiber bundles corresponding to the length of the flax stems.
2.2 Morphometric analyses
Measurements were performed on one-cm stem fragments, collected 10 cm above the cotyledon from the same plants used for Omics approaches. Eighty-one fiber bundles [3 fiber bundles x 3 cross-sections x 3 individuals x 3 field areas] per cultivar were examined. Two hundred and seventy measurements [10 measures x 3 cross-sections x 3 individuals x 3 field areas] per variety were made to determine the fiber cell surface, including the G-layer of secondary cell wall also called tertiary cell wall (but excluding the common middle lamella with the adjacent fiber).
Preliminary observations were made on freehand cross-sections, without fixation in ethanol, and double stained with Alcian Blue (0.1%, w/v in water, 5 min), followed by Safranin O (0.1%, w/v in EtOH, 30 secs), mounted in water, and observed on an Olympus BH-2 light microscope. Remaining stem fragments were fixed in 80% ethanol, then dehydrated using a graded ethanol series. According to the manufacturer’s protocol, three individual stem fragments per field area were embedded in Technovit 7100 (Hereaus). Semi-thin sections (5 μm) were obtained with a Leica RM2065 microtome with glass knives. Three spatially separated cross-sections (every 200 μm) were selected for each individual for measurements. Toluidine-Blue O (TBO) coloration (0.1%, w/v in water) was applied on semi-thin sections to facilitate visual separation between the inner and outer tissues, allowing discrimination of fiber bundles and cell types. Measures were acquired with FIJI free software1. Cell surface and number of elementary fibers per bundle were further referred to as “in-planta” features.
2.3 Mechanical analyses of scutched fiber bundles
The following settings were used to characterize the tensile mechanical properties of flax fiber bundles from the 7 flax varieties (55 fiber bundles per variety were tested). The force-displacement curves were measured with Fafegraph M (Textechno GmbH, Mönchengladbach, DE; clamping length: 20 mm; test speed: 20 mm/min; pretension: 250 mg) (Haag and Müssig, 2016).
The thickness of the scutched fiber bundles of the 7 studied flax varieties were measured with at least 15 000 individual values by the scanner-based image analysis system FibreShape 5.1 (IST AG, Vilters, CH). The fiber bundles were cut to a length of approx. 20 mm and distributed on the scanner surface. The images were taken at a resolution of 2400 dpi (Epson Perfection V700, Epson GmbH, Meerbusch, DE). Six images per fiber batch were measured with the measuring mask Long_fibres_2400dpi_Epson_Bast_uncalib in the FibreShape software (minimum element width: 11 µm). The cross-sectional area was calculated from the thickness value of the fiber bundle using a SEM based correction model (Haag and Müssig, 2016):
Area = d1.7256 * 0.21113, where d – the thickness of the scutched fiber bundle.
Strength, Young’s modulus, strain, maximum force, and thickness measurements were further refered as “ex-planta” features.
2.4 Omics analyses
2.4.1 Transcriptomics
2.4.1.1 RNA extraction and quality verification
Total RNA was extracted from three pools of outer stem tissues for each of the 7 varieties using TRI-Reagent (MRC, Inc., Dundee, Scotland, UK). RNA integrity and concentration were evaluated with RNA StdSens Chips using the Experion automated electrophoresis system (Bio-Rad, Marnes-la-Coquette, France).
2.4.1.2 Hybridization and data analyses
RNA processing, Cy3-labeling and hybridization were made following the manufacturer’s instruction for One-Color Microarray base gene Expression Analysis (Agilent Technologies). Hybridization was performed on Agilent microarrays Agilent-045382 UGSF flax 45K v1.0 array based upon flax genome coding sequence (Lus-names) (Wang et al., 2012) available at Phytozome2. Some genes that have genolin-names (Fenart et al., 2010) were added according to the EST database. The 4-plex array contains 45,220 60-mer in situ oligonucleotides per block. Hybridization and washing were performed following Agilent manufacturer’s instruction, and slides were immediately scanned at 5 mm pixel-1 resolution using an Axon GenePix 4000B scanner driven by GenePix Pro 6.0 software (Molecular Devices Corporation, Sunnyvale, CA, USA).
Scanned images (TIFF format) were then submitted to grid alignment and expression data analyses. For each slide, a lowest and print-tip median normalization was performed using R packages3 as implemented in CLC bio software4 followed by an inter-slide normalization. The 3 control samples were filtered for p-value < 0.05, and the average was calculated for each gene. A fold change (FC) value was calculated between individual treated samples and the mean of corresponding controls. Differentially expressed genes (DEGs) were selected for a threshold >2.0 or ≤0.5. Functional annotation of DEGs was based on NCBI GenBank, and related genes’ physiological processes were assigned with NCBI, AmiGO 2 Gene Ontology and UniProt. KEGG pathway analysis was also used to identify relevant biological pathways of selected genes.
2.4.2 Proteomics
2.4.2.1 Soluble protein extraction
Four grams of each of the three pools of frozen outer stem material were ground in liquid nitrogen to a fine powder, followed by 5 min grinding in 10 ml of Tris HCl buffer 50 mM, 0.06% IPC, pH 7.5, before centrifuging 10 min at 4°C/16,000 g. The supernatant was incubated for 15 min at room temperature with protamine sulfate under a low agitation, then centrifuged for 10 min at 18,000 g. The pellet was discarded, and the proteins were precipitated with 10% TCA (mass/v), 1 hour at -20°C. The pellet was washed once with cold acetone, and then dried for 5 min at room temperature (Goulas et al., 2001).
2.4.2.2 Protein labeling
Dry protein pellets were resolved in 2D-DIGE labeling buffer (7 M urea, 2 M thiourea, 4% (mass/v) CHAPS and 30 mM Tris) at room temperature with agitation for 1 hours. The pH of the solution was adjusted to 8.5, and protein concentration was determined by 2D Quant kit (GE Healthcare). The protein samples were labeled with CyDye minimal dyes (GE Healthcare) according to the manufacturer’s instructions and as described in Grimaud et al. (2013). 30 µg of proteins were labeled by adding 240 pmol of fluorochromes (Cy3 or Cy5). A pooled internal standard was performed by mixing 15 µg of each sample and labeled with Cy2 dye and included in all gel runs (Goulas et al., 2006).
2.4.2.3 Electrophoresis
For each 2-D gel a mixture with a final volume of 120 µl containing two samples labeled Cy3 and Cy5, internal standard labeled with Cy2, and labeling buffer [7 M urea, 2 M thiourea, 4% (mass/v) CHAPS, 6 µl.ml−1 DeStreak reagent (GE Healthcare)] and 1.5% (v/v) Biolyte, were loaded onto a 24 cm IPG non-linear strip with a pH range 3−10 (Bio-Rad) and separated using the IPGphor3 system with a rapid voltage slope to reach the maximum of 10 000 V and a total of 72 000 Vh. Second dimension resolution was carried out by SDS-PAGE on a 12.5% (v/v) resolving gel (HPE, Gel company) according to 2D HPE Large Gels manufacturer’s instructions.
2.4.2.4 Image analysis and protein identifications
Scanning of the 2D-DIGE gels was carried out using a Typhoon Imager 9400 (GE Healthcare) at three different wavelengths corresponding to the different CyDyes as described in Grimaud et al. (2013). The generated gel images were analyzed with DeCyder 7.0 software, using the Cy2 channel as a standard. The multiple 2-D DIGE gels were matched, and the significance of changes in the abundance of specific proteins from different genotypes was established. By including the internal standard on each gel in the experiment, together with the individual biological samples, it is possible to measure the abundance of each protein spot on a gel relative to its corresponding spot in the internal standard present on the same gel (i.e. as a ratio). All matched spots were manually verified on all gels.
2.4.2.5 Enzymatic digestion and protein identification
Differentially abundant spots (based on the statistical analyses described below) were excised from the gels and digested using an EVO2 Workstation (TECAN). All MS and MS/MS analyses were carried out by using a 5800 MALDI TOF/TOF (AB Sciex, Foster City CA, USA) (Chabi et al., 2017), and Protein identification was performed using MASCOT server with a Linum database downloaded from phytozome (Lusitatissimum_200_V1.0 with 43484 sequences; 17356610 residues) according to (Wang et al., 2012).
2.5 Bioinformatics and statistical analyses
2.5.1 Data deposition
Transcriptomic data have been deposited to the NCBI online repository with accession number GSE222066. The mass spectrometry proteomics data have been deposited to the ProteomeXchange Consortium via the PRIDE5 partner repository (Perez-Riverol et al., 2022) with the dataset identifier PXD039389.
2.5.2 Transcriptomic analysis
A script utilizing library functions in R with a Bonferroni-corrected p-value of less than 0.05 and a cut-off of +/- 1.5 log2 ratio was used for all experimental conditions to identify genes displaying a significant change in expression (differently expressed gene DEG) over the repetitions. Only genes with smooth expression profiles were retained. Differential analyses were performed for each variety vs the other 6 varieties giving 21 possible combinations. The differentially expressed genes and differently abundant proteins were annotated according to KEGG database using ShinyGO online tool6 (Ge et al., 2020). The MapMan framework for functional classification (Schwacke et al., 2019) with Mercator4 v.2 online tool7 was also used to assign the protein sequence annotation.
2.5.3 Proteomic analysis
Statistical analyses were performed with the Extended Data Analysis (EDA) module in DeCyder 2D Differential Analysis Software v.7.0 (Goulas et al., 2006). For every set of matched spots, the average intensity was compared to the standard deviation on these intensities for a given spot between the two compared varieties. Only spots present on all gel images from each set of samples were considered. One-way ANOVA analysis was performed for every set of matched spots, comparing the average and standard deviation for a given spot between Diane and Oliver groups to find significant differences (ANOVA, p-value ≤ 0.05; average ratio >1.5) above the experimental variation.
2.5.4 Global statistical analyses
Sparse Partial Least-Squares Discriminant Analysis (sPLS-DA) analyses were conducted by using RStudio software (2022.02.03 build 492) and the R-package mixOmics (v. 6.1.2). The PLS method searches for the highest covariance between variates, which are a linear combination of initial variables, taking into account all variables in the input matrices. sPLS combines this approach with a Lasso penalization to enable the selection of variables the most explanatory of varieties discrepancy. The arithmetic means of the gene expression value and their log2 transformation were used for statistical analysis. Morphometric and mechanical data were tested for normality by the Shapiro-Wilk test. We used the ANOVA test, Pearson correlation coefficient, Student’s t-test for normally distributed data, Spearman correlation, and the Kruskal-Wallis test if the normality test was not met. We used the R lm-function to generate the regression plots. The calculated determination coefficient (R2) was used to estimate the proportion of variation of the dependent variance that could be explained by the variation of the independent variance.
3 Results
3.1 Morphometric characterization of the 7 varieties, in-planta features
We determined the number of elementary fiber cells per bundle and fiber surface in four flax spring fiber varieties (Belinka, Diane, Drakkar, Hermes), two winter fiber varieties (Adelie, Violin) and one winter oil variety (Oliver) (Figure 1). The results show a large scale of variation for both parameters with all fiber spring varieties showing the highest values and fiber winter varieties the lowest. The oil variety Oliver showed intermediate values.
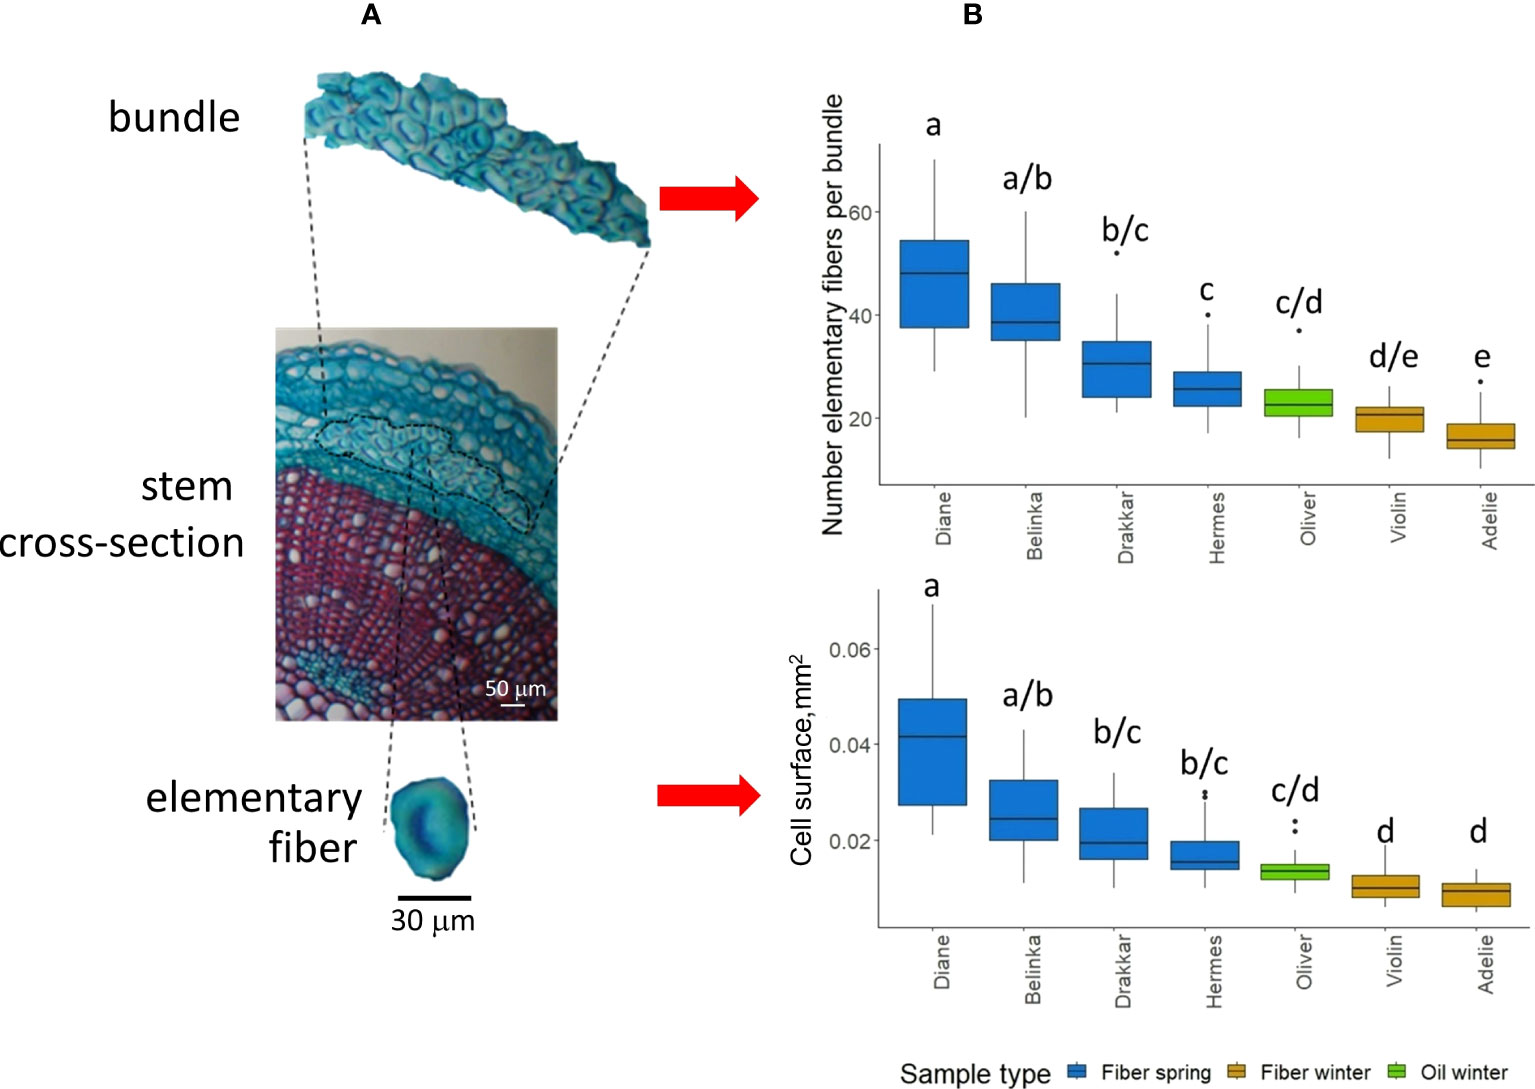
Figure 1 Flax fiber morphometric properties. (A) Light microscope image showing flax stem cross-section (middle), fiber bundle (top), and a single fiber cell (bottom). Sample stained in safranin O/alcian blue. (B) Box-plot of two morphometric features, the number of elementary fibers per bundle (upper), and the cell surface of single fibers within fiber bundles (lower) for the seven flax varieties (Diane, Hermes, Drakkar, Belinka, Adelie, Violin, and Oliver). Letters shows statistical differences between flax varieties, p-value ≤ 0.05 (Dunn’s test).
3.2 Transcriptomic analysis of 7 flax varieties and correlation with morphometric parameters
We evaluated the abundance of 42 963 transcripts (99.3%) among the 43 384 annotated genes in the flax genome8. Comparative whole transcriptomics of the fiber-bearing outer-stem tissues from the 7 varieties allowed us to identify 1041 differently expressed genes (DEGs) that showed significant differences in transcript accumulation (Figure 2; Supplementary Table 1). According to MapMan annotation, only 40 of them were classified into cell wall organization (Supplementary Table 1, bold characters). However, further expert curation allowed us to highlight 57 more genes related to cell wall metabolism (Supplementary Table 2). These 1041 DEGs were also annotated according to KEGG categories (Figure 2). Our results show that glucosinolate-, diterpenoid- and zeatin-biosynthesis are pathways in which the genes are the most overrepresented (up to 8-fold). Circadian rhythm, tryptophan, starch, sucrose metabolism, and phenyl biosynthesis also showed significant enrichment (approx. 4-fold). Finally, biosynthesis of secondary metabolites and metabolic pathways showed less fold-enrichment (approx. 2-fold), but with a much higher number of significant DEGs.
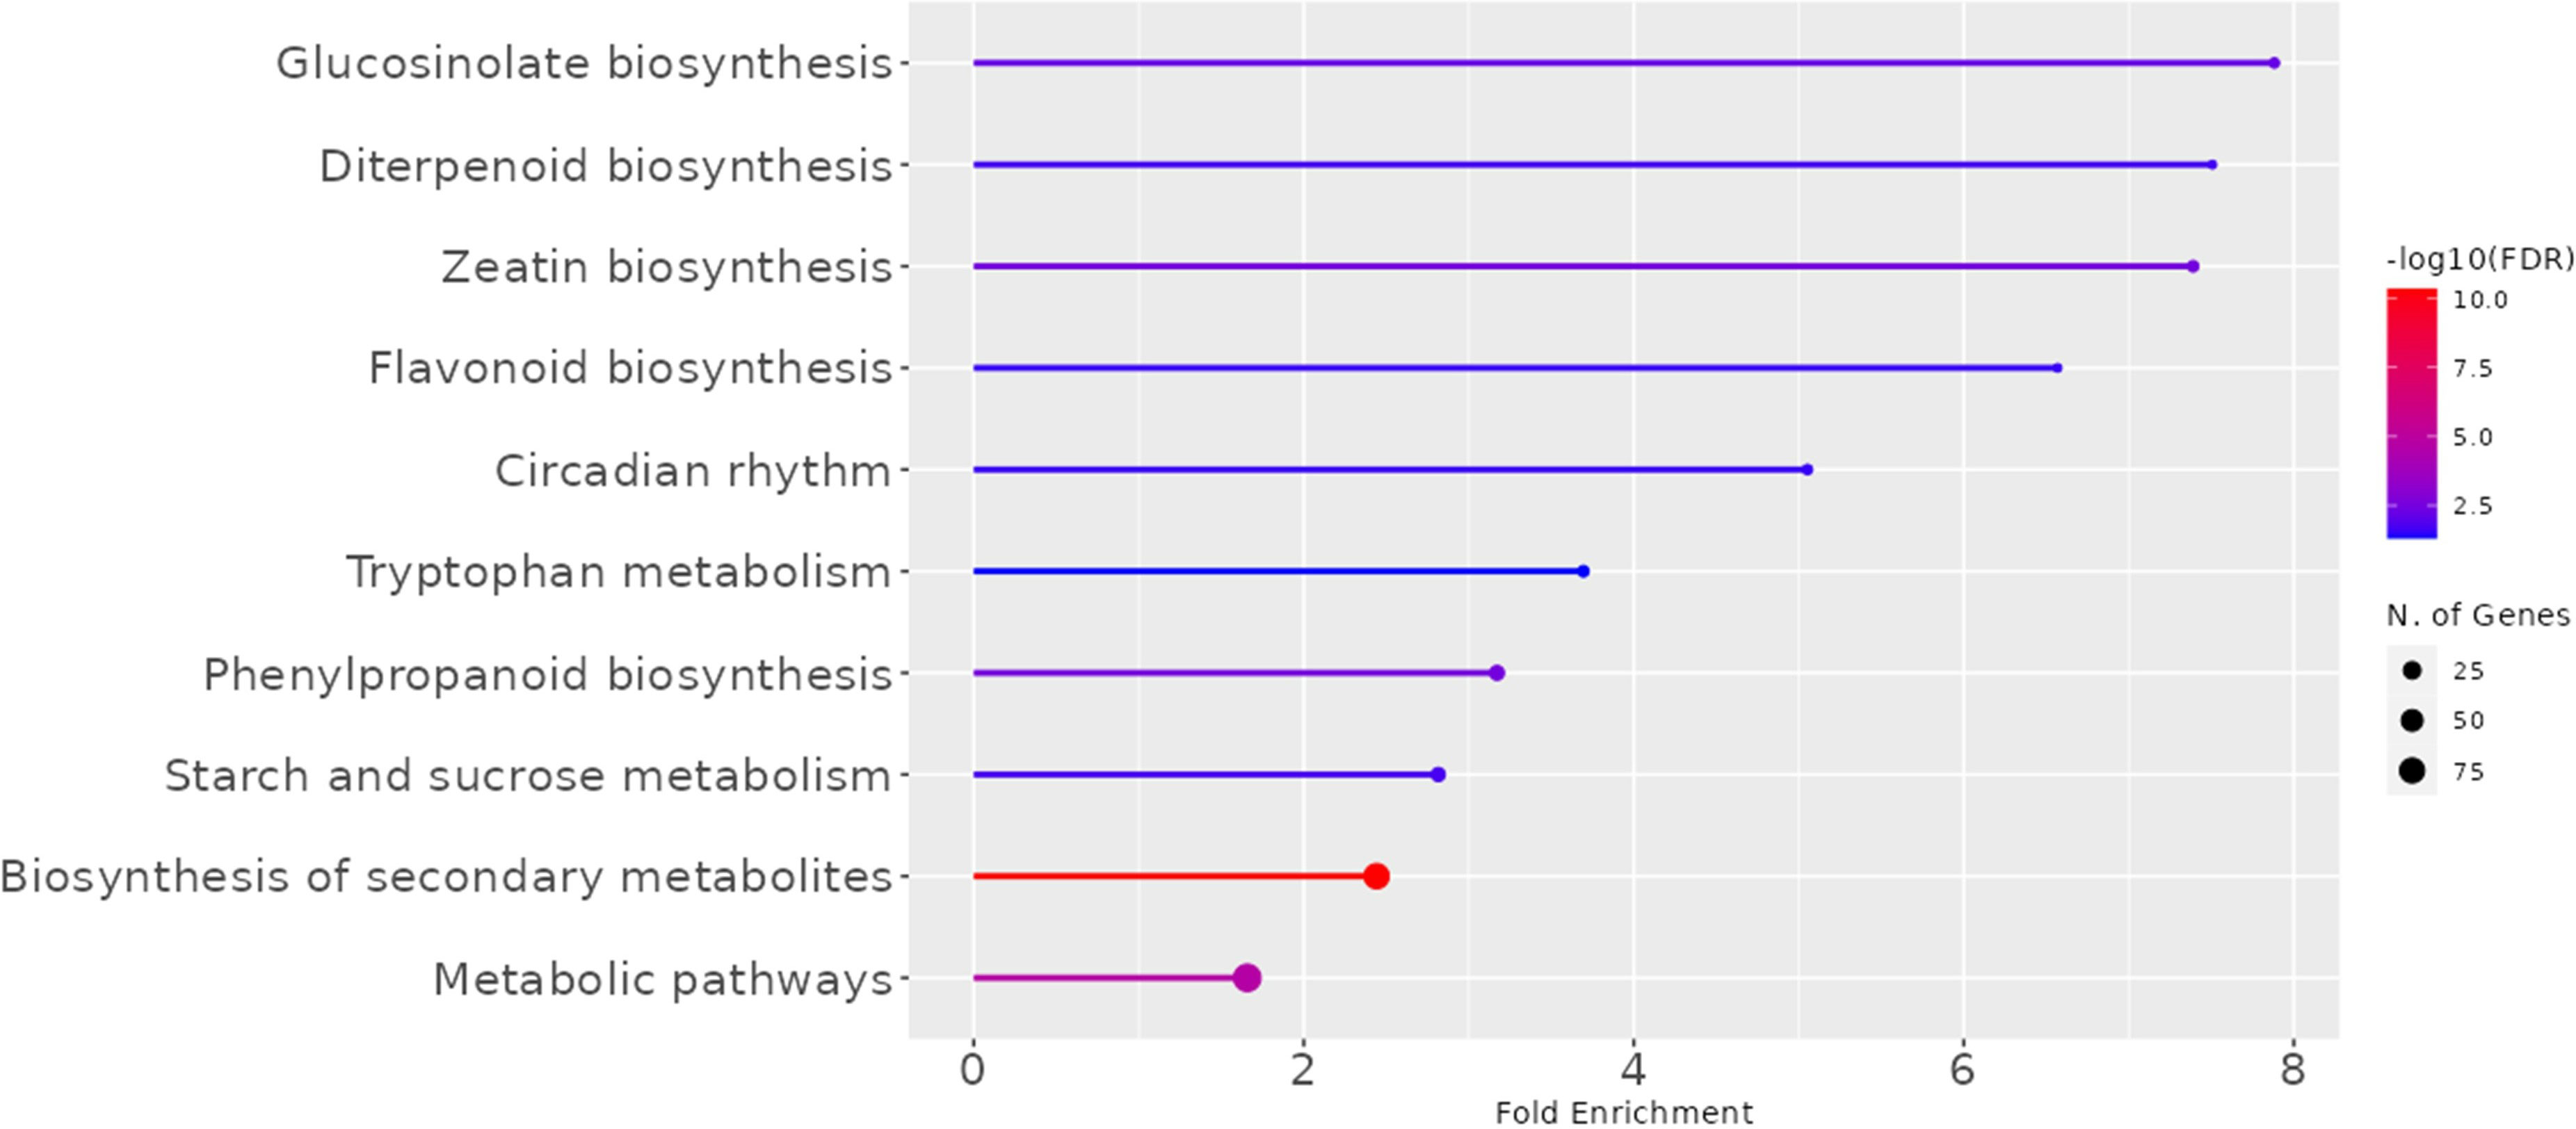
Figure 2 KEGG Pathways enriched in the transcriptome of fiber-bearing outer-stem tissues. The 1041 DEGs of the 7 varieties (Diane, Hermes, Drakkar, Belinka, Adelie, Violin, and Oliver) were selected, and their Arabidopsis thaliana orthologues were compared to the gene list of the complete Arabidopsis genome. Line length corresponds to the fold of enrichment. The Line color indicates the FDR value. The size of the end spot shows the number of genes from the 1041 LusID DEGs list that are identified in the corresponding A. thaliana KEGG-category.10
All 1041 significant DEGs were processed with mixOmics R-package to Principal Component Analysis (PCA, Figure 3A-i), and Sparse Partial Least-Squares Discriminant Analysis (sPLS-DA, Figure 3A-ii). As shown in Figure 3A-i, the PCA scree plot showed that 75% of the total variance was explained with the first three principal components (43, 18, and 14% of the total variation, respectively). Thus, the 3 principal components were selected to further sPLS-DA (Figure 3A-ii) which showed that 73% of the total variance was explained by the first three X-variates (37, 19 and 17%, respectively), corresponding to 56 DEGs. When considering the X-variate 1, a clear discrimination was noticed between the first cluster, composed of the two winter varieties, one of them is fiber flax (Violin), and the other one is oil (Oliver), and all the other varieties. The X-variate 2 showed discrimination between this first cluster and a second one composed of two spring (Drakkar, Hermes) and one winter (Adelie) fiber varieties, a third composed of one spring fiber variety (Belinka), and a fourth one composed of another spring fiber variety (Diane). Such clusterization was further confirmed by hierarchical clusterization on Euclidian distance (Figure 3A-iii).
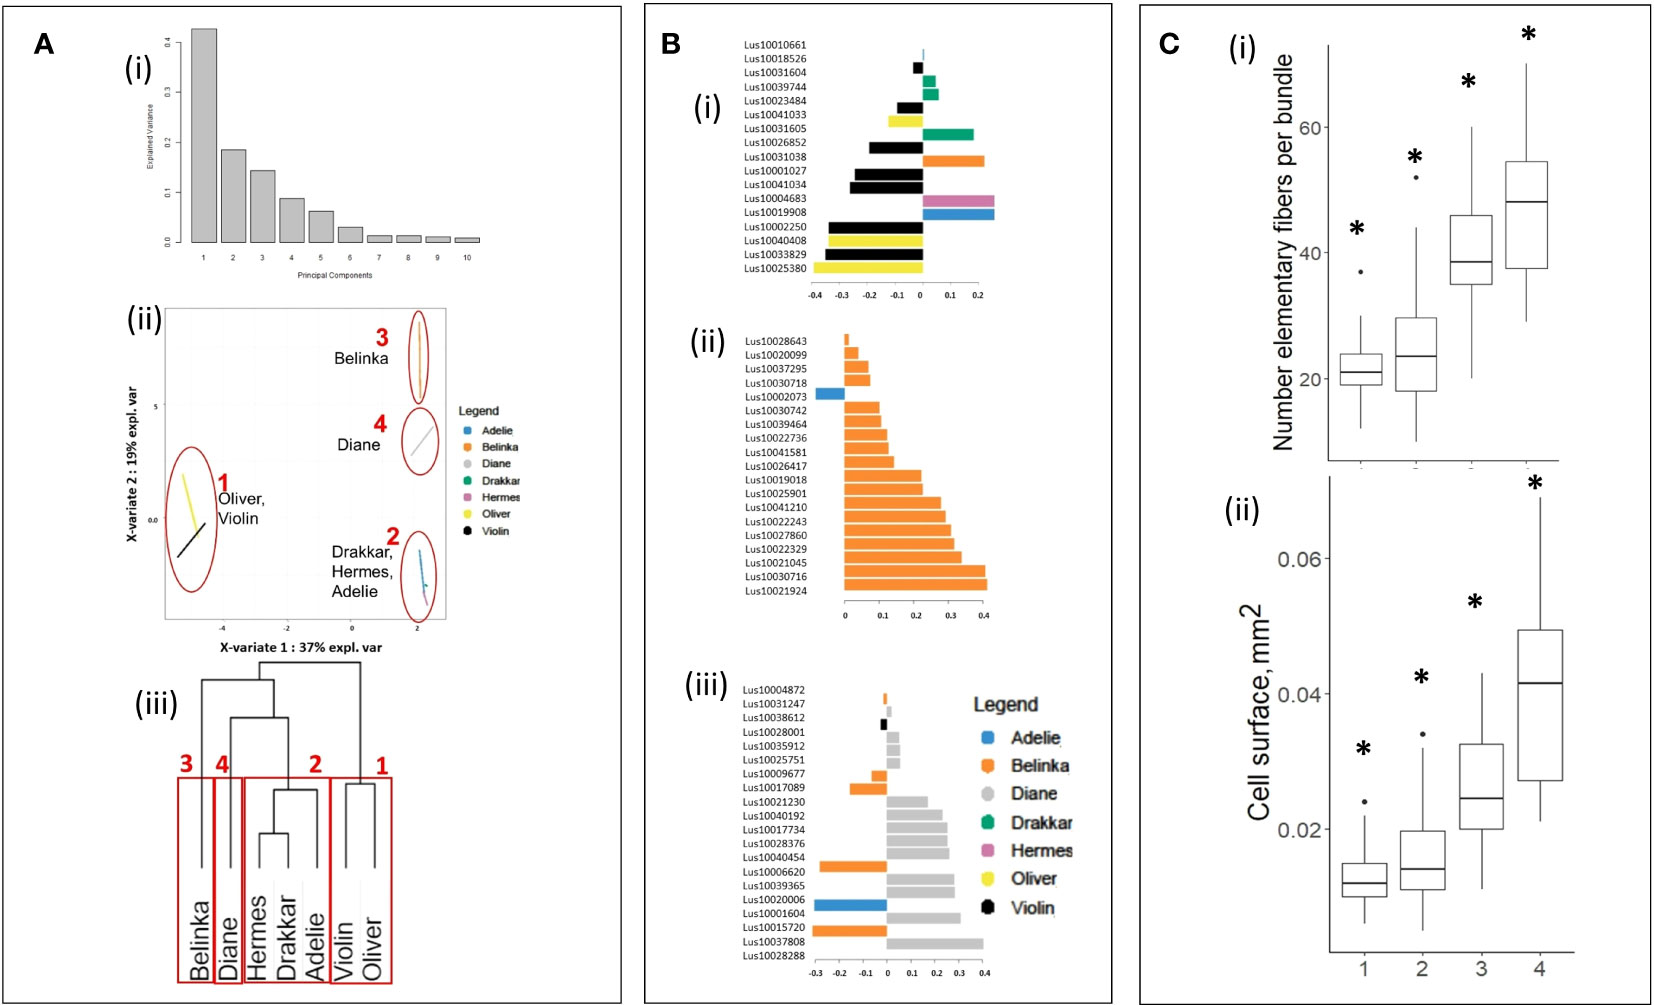
Figure 3 Statistical clusterization of the 7 flax varieties based upon DEG values from transcriptomic analysis. (A) (i) Scree plot explained variance of PCA, (ii) plot of sparse Partial Least-Squares Discriminant Analysis (sPLS-DA), and (iii) hierarchical clusterization on Euclidian distance11, (B) Contribution plots of the DEGs on X-variates 1 (i), 2 (iii) and 3 (iii) of sPLS-DA, (C) Boxplots of (i) number of single fiber cells and (ii) cell surface of fiber cells within clusters highlighted in (A). Asterisks indicate statistically significant differences (p-value ≤ 0.05) between groups..
The contribution of each variable as a component of sPLS-DA indicate the importance of that variable for discrimination. We identified a total of 56 DEGs transcripts that have higher contribution values than others of the studied transcripts (Supplementary Table 3), 17 transcripts for X-variate 1 (Figure 3B-i), 19 transcripts for X-variate 2 (Figure 3B-ii), and 20 transcripts for X-variate 3 (Figure 3Biii; Supplementary Table 3). The DEGs that were the most explanatory for sPLS-DA X-variate 1 were down-regulated only in Oliver and Violin, whereas others were up-regulated in Drakkar, Belinka, Hermes, and Adelie. For X-variate 2, the explanatory DEGs are almost all up-regulated in Belinka only, with the exception of a single down-regulated gene in Adelie. For X-variate 3, the most explanatory DEGs were down-regulated, especially in Belinka, or up-regulated only in Diane.
The variation of morphometric parameters was calculated within each of the four clusters (Figure 3C) highlighted after analysis of the 1041 DEGs (Figures 3Aii, iii). Based on the transcriptome analysis, we discriminate groups of varieties that differ significantly in morphometric traits. They showed significant differences in the studied phenotypic traits between the four clusters. The varieties within the 4th cluster have more individual fibers in bundles, and their cell diameter was the highest. And vice versa, the varieties joined in the first cluster carried fewer single cells in fiber bundles, and the cells were smaller.
The Pearson correlation coefficient between the expression level of the 56 genes highlighted after sPLS-DA analysis of bast fiber transcriptome and values of morphometric features (the number of elementary fiber cells in the bundle and the single cell surface) of the same varieties were calculated (Figure 4). We identified 5 genes whose expression level had a strong statistically significant correlation with studied morphometric features (maximum value 0.84; minimum value -0.86) (Figure 4). One gene was identified as the LusWRKY85 (Lus10022736) gene, which is a transcription factor of the WRKY family, and it is orthologous to the Arabidopsis AtWRKY62 (AT5G01900.1) (Yuan et al., 2021). Another gene is LusS40-6 (Lus10002073), and its Arabidopsis’s orthologue AtS40-6 (AT1G61930) codes senescence regulator (Fischer-Kilbienski et al., 2010). The next gene in the list is LusGLYI6 (Lus10038612), and it is also negatively correlated with cell surface (Figure 4). The Lus10038612 gene has homology with AtGLYI6 (AT1G67280.1), which encodes a Ni2+-dependent glyoxylase (Batth et al., 2020). Finally, two genes (Lus10039365 and Lus10017734) with unknown functions were also highlighted (Figure 4).
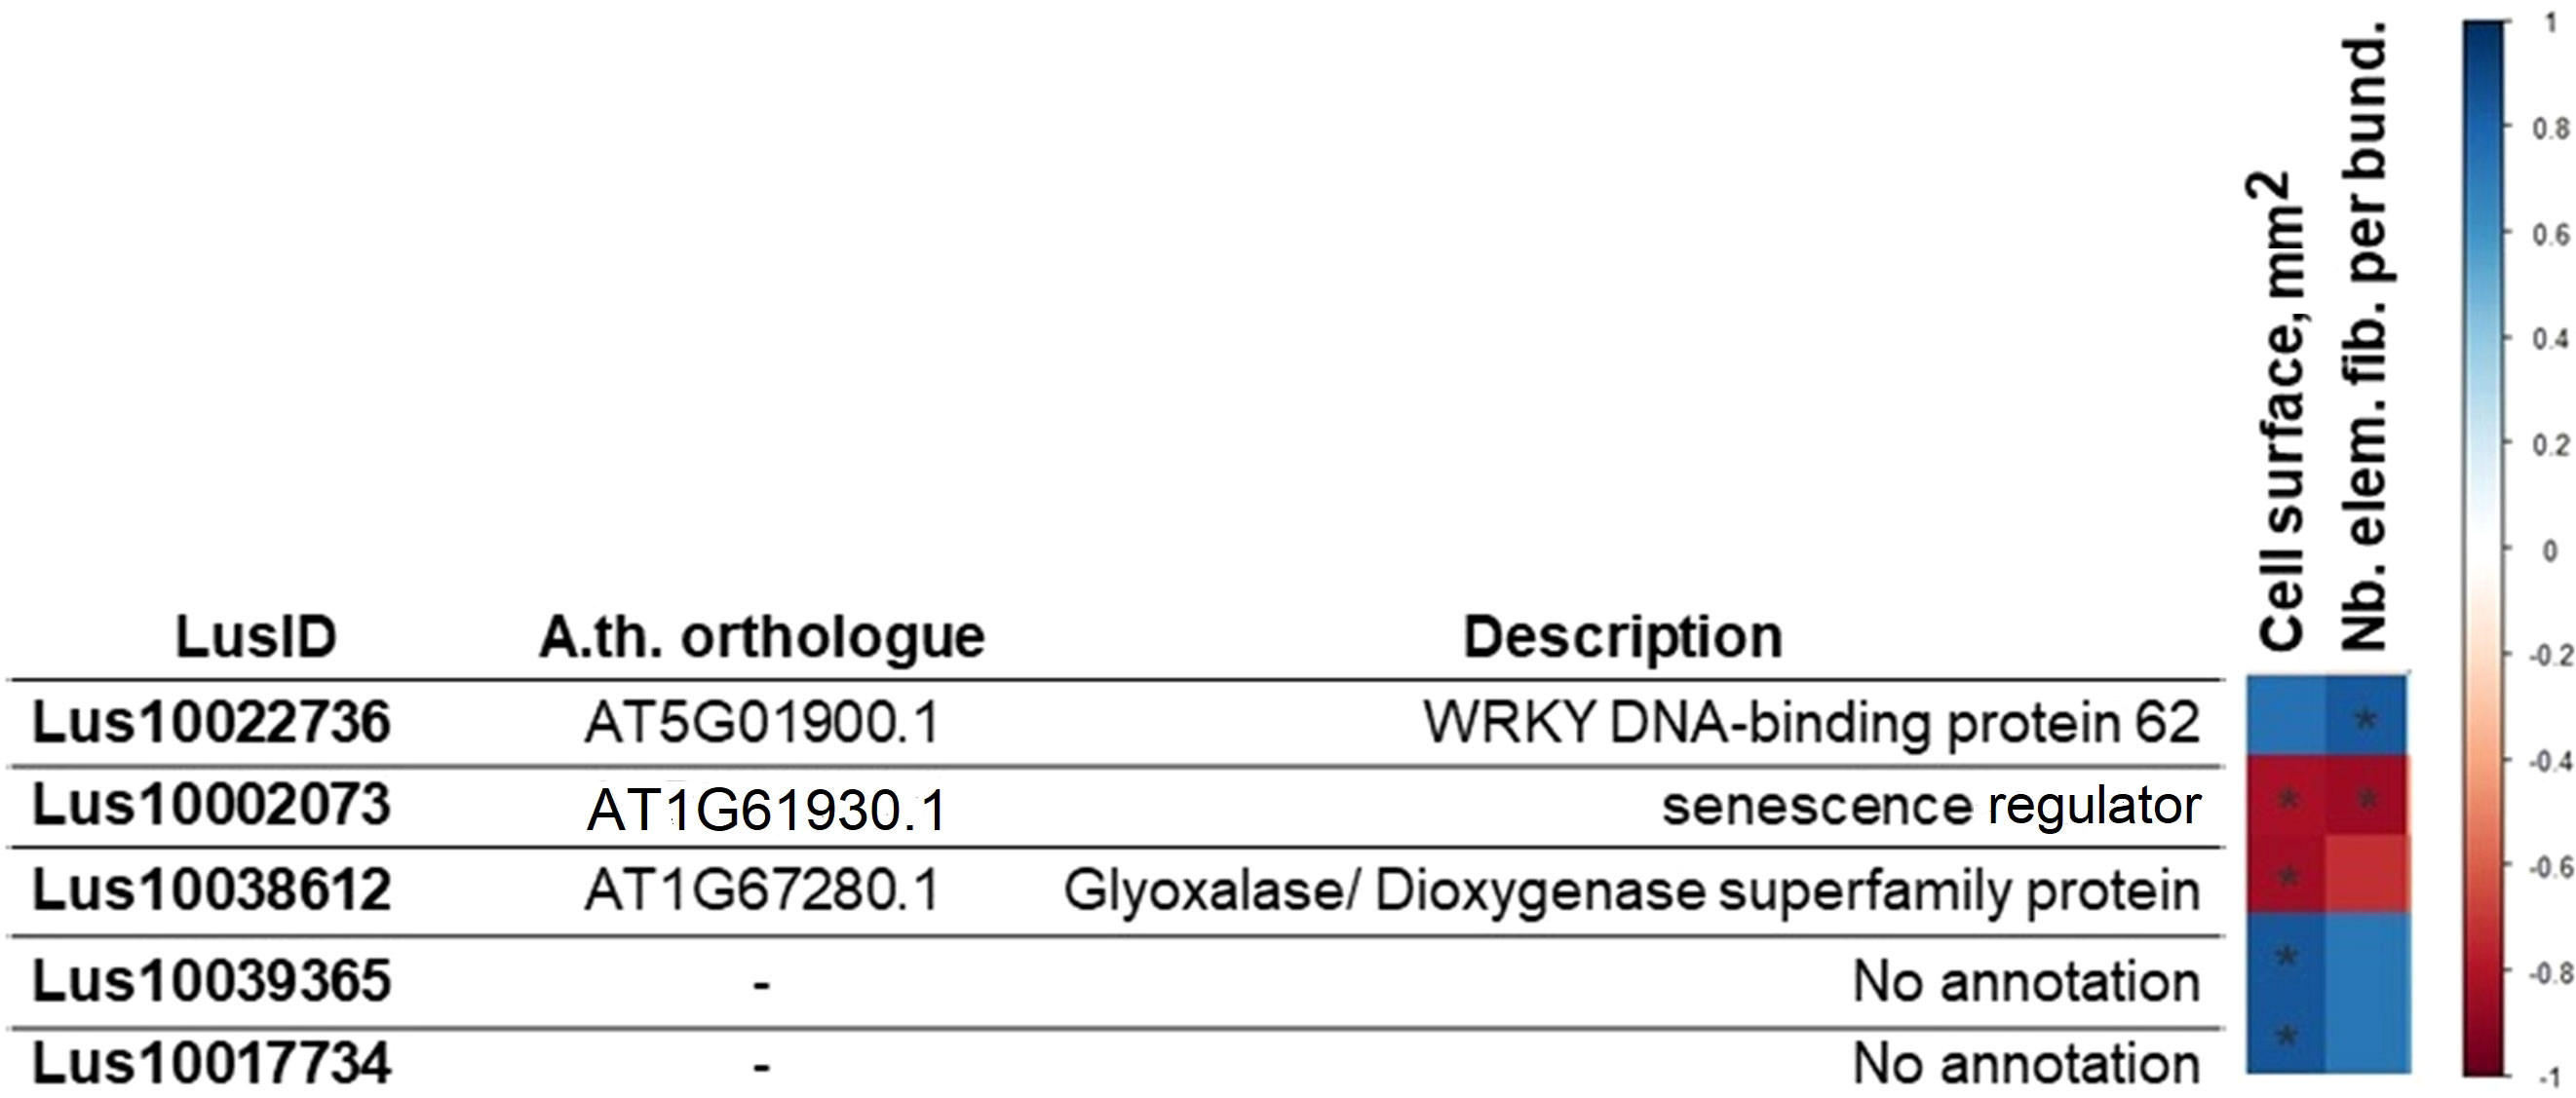
Figure 4 Pearson correlation coefficient (PC) between the expression level of genes selected on transcriptomic data analysis and morphometric (the surface of a fiber cell, mm2; the number of fibers in the bundle). The p-value for each PC was calculated, and the PC with p-value ≤ 0.05 are given in the table. The red cell color marks a negative correlation, the blue one a positive one. * - p-value of PC ≤ 0.05.
3.3 Proteomic analysis of bast fibers from a winter oil and a spring fiber variety and correlation with morphometric parameters
A comparative proteomic analysis was performed on the peeled off fiber-enriched outer stem parts of Diane and Oliver since these varieties belonged to the two transcriptomics clusters showing the most discriminant and significant differences regarding morphometric measurements (Figure 3). A total of 1490 protein spots were identified on the 2D gel. Among these, 108 showed significant differential abundance (p.value ≤ 0.05) with at least a 1.5-fold change between the two varieties (7.25% of protein spots in the gel). Subsequent excision, trypsin digestion, and mass spectrometry allowed the successful identification of 46 proteins representing 32 non-redundant proteins (Table 1), among which 15 of them were more abundant in Diane and 17 in Oliver (Supplementary Figure 1). One peptide spot (Master number 1046) that was more abundant in the Diane proteome represents a mixed sample, which included two peptides identified like ascorbate peroxidase 1 and ferretin 1 (Table 1; Supplementary Figure 1). Both of them were included in further analysis. The transcript annotations of genes coding the 32 identified proteins were classified according to MapMan annotation, and only 1 of them could be classified directly into cell wall organization, Lus10037377, a xyloglucan endotransglucosylase/hydrolase 32 [homologous to ELF4-like in Arabidopsis thaliana genome (AT2G36870.1)] (Supplementary Tables 1, 2).

Table 1 Proteins and their gene IDs differently abundant in Diane and Oliver flax varieties.
Interestingly, both in Diane and in Oliver, proteins with highest variations in abundancy ratio (Table 1) were two different protein spots (Master number 1269 and 1284, respectively) identified as the same polyketide cyclase/dehydrase and lipid transport superfamily protein (Lus10008932), roughly twice less in Diane (4.07) than in Oliver (9.78). This fact may indicate an alternative modification of the Lus10008932 protein in the proteome of two studied flax varieties. Such 2-fold range differences in ratio abundancy were also observed for a methyl esterase 4 (Lus10009205), a xyloglucan endotransglucosylase/hydrolase 32 (Lus10037377), a NAD(P)-binding Rossmann-fold superfamily protein (Lus10010846) and a cold, circadian rhythm, and RNA binding 2 protein (Lus10023569) whose ratio variation was around 2.3 in Diane whereas a unassigned protein (Lus10014003), a rotamase CYP 3 (Lus10012167), a beta glucosidase 32 (Lus10030577) and a cyclase family protein (Lus10001508) showed a ratio variation of around 4.5 in Diane. Nine proteins in Diane and twelve in Oliver showed variation in abundance ratio of roughly 1.5. It has to be noticed that the four proteins directly or indirectly linked to cell wall development were differently abundant in the studied varieties. Two of them (Lus10009205 – methyl esterase 4 and Lus10037377 – xyloglucan endotransglucosylase/hydrolase 32) were more abundant in Diane (2.54 and 2.38 times, respectively), and the other two (Lus10030577 – beta glucosidase 32 and gi|171462119 – Expansine-related protein 3 precursor) – in Oliver (4.03 and 1.80 times, respectively) (Table 1).
Since proteomic data was only available for two varieties it was not possible to evaluate the relative weight of the 32 identified proteins as potential markers for fiber-related parameters in the complete panel of 7 varieties. The expression profiles of the genes corresponding to the 32 candidate proteins IDs to gene IDs were therefore further established for the 7 flax varieties studied. Clusterization based on their expression level showed clear discrimination into three separate clusters (Figure 5A). The first cluster differentiated spring fiber varieties Diane, Belinka, Drakkar, and Hermes from winter fiber varieties Adelie and Violin (the second cluster). The winter oil flax Oliver formed the most distant cluster (the third one) from the other flax varieties. It should be noted that the cluster of the spring fiber varieties combines samples with the highest amount of fiber cells in the bundle and the biggest cell surface (Figure 5B).
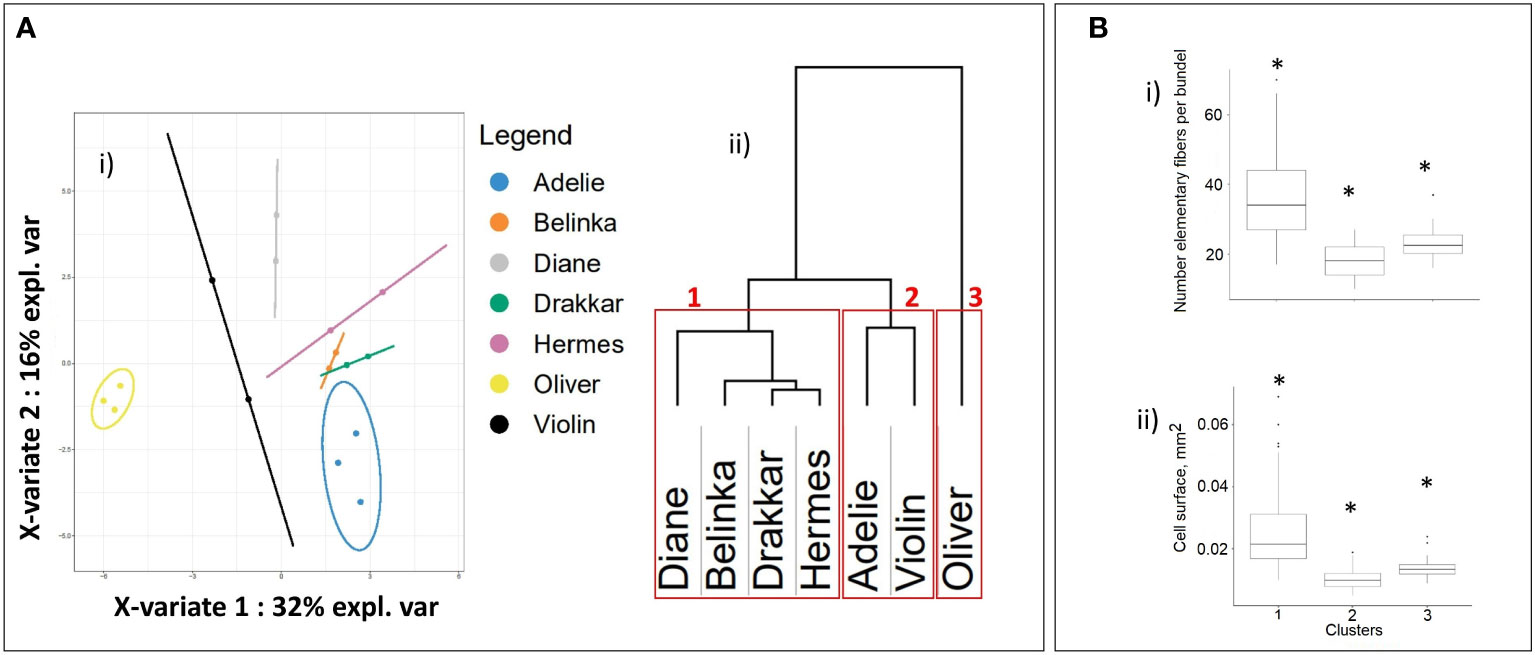
Figure 5 Statistical clusterization of the 7 flax varieties based upon expression levels of 32 genes corresponding to non-redundant proteins selected after statistical proteomic analysis. (A) (i) Partial Least-Squares Discriminant Analysis (PLS-DA), (ii) hierarchical dendrogram12, the red frames show three groups of flax varieties that corresponded to spring fiber (1), winter fiber (2), and winter oil (3) varieties. (B) Boxplots of (i) individual fiber cells and (ii) surface of fiber cells within clusters highlighted in Figure 5A after conversion of the 32 candidate proteins protein IDs to gene LusIDs and then gene sequences. Asterisks indicate statistically significant differences (p-value ≤ 0.05) between groups.
Pearson correlation coefficients were further calculated between the expression levels of 32 genes based on the results of the proteomic study and the morphometric features of the same varieties (Figure 6). We identified 4 genes whose expression level strongly correlated with studied morphometric features (maximum value -0.72; minimum value -0.93) (Figure 6). Two genes (Lus10010846 and Lus10024383) encoding putative 3-beta-hydroxysteroid dehydratase/isomerases were identified as putative lipid-binding proteins in phloem exudates of Arabidopsis plants (Guelette et al., 2012). Another gene (Lus10008932) potentially related to lipid metabolism was also identified (Figure 6); its product is described as a plant-specific protein (Gutierrez et al., 2004).
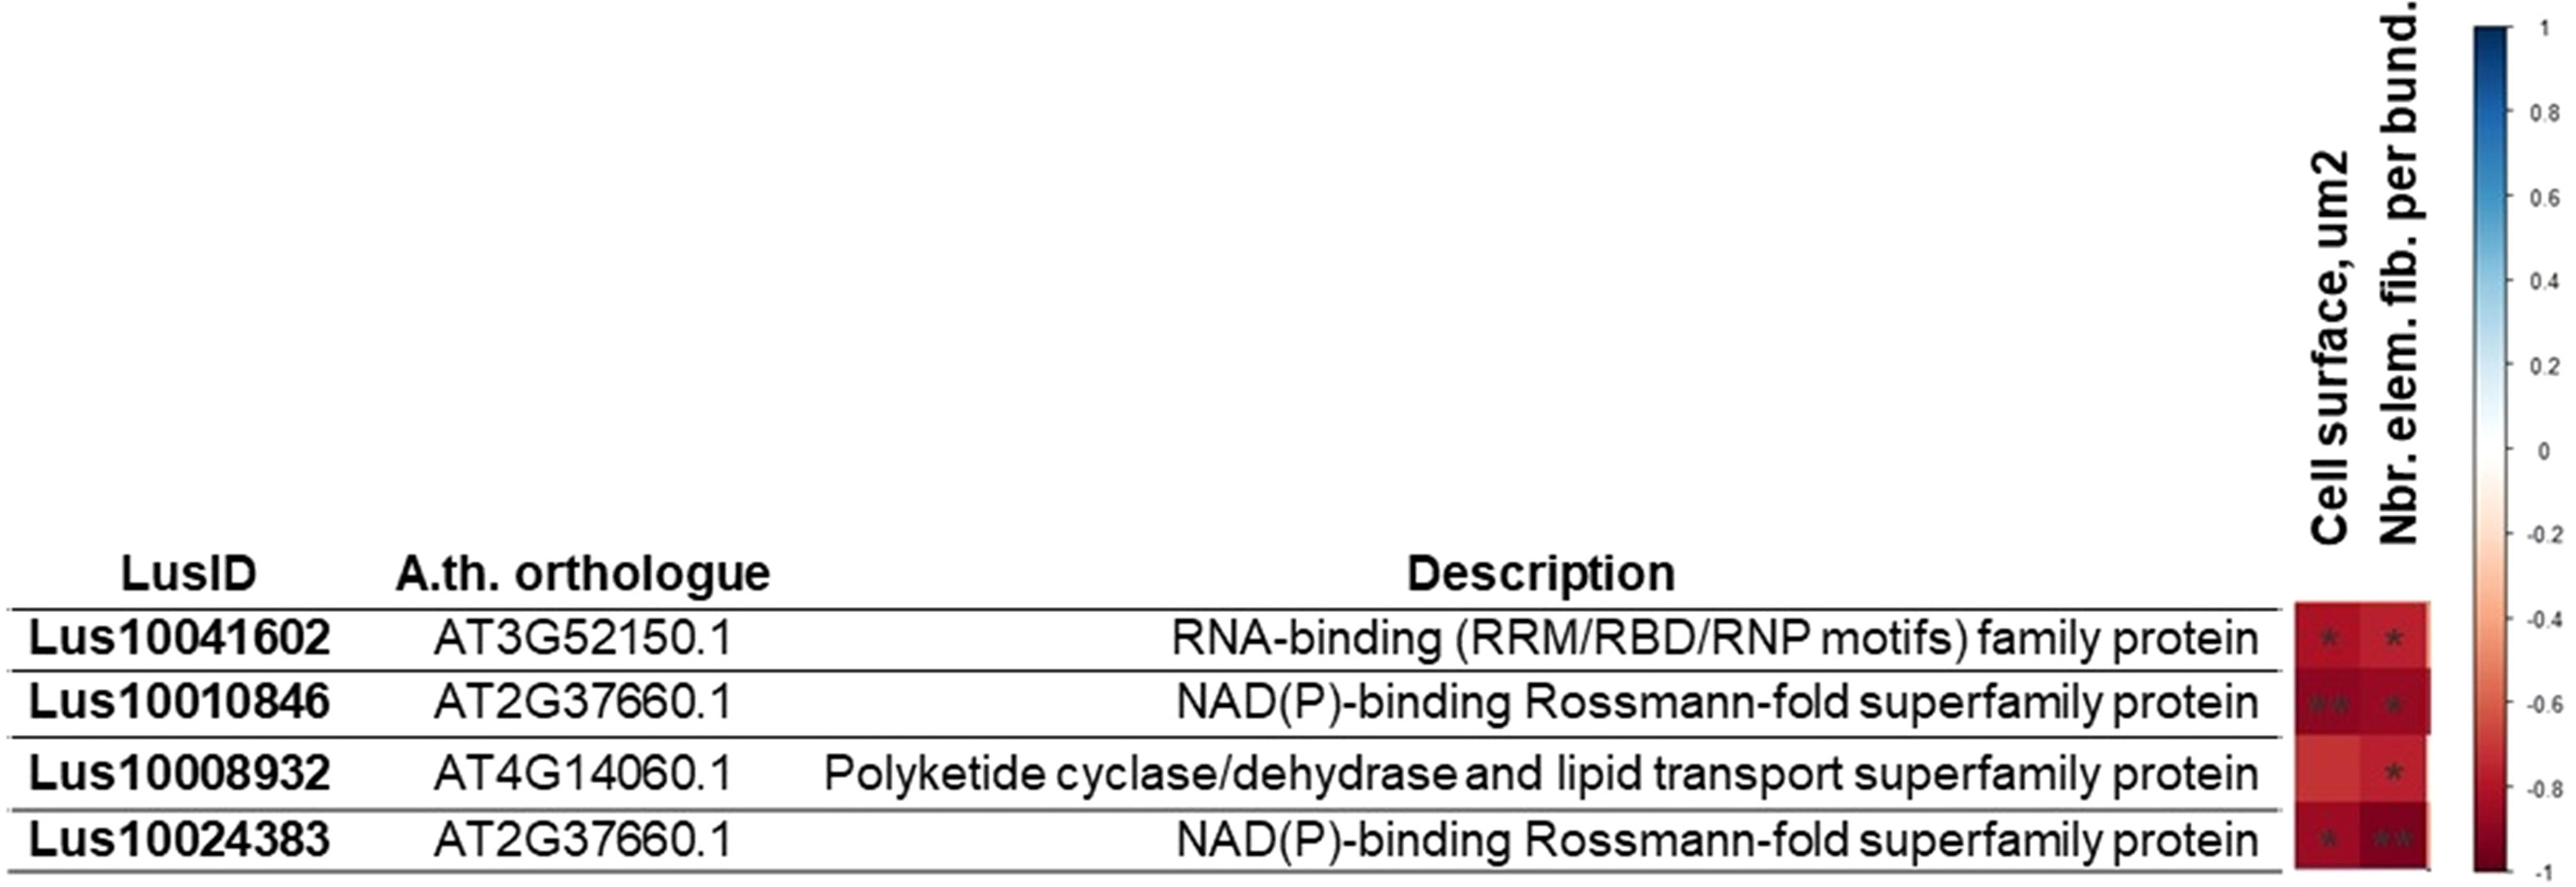
Figure 6 Pearson correlation coefficient (PC) between the expression level of genes selected on proteomic data analysis and morphometric (the surface of a fiber cell, mm2; the number of fibers in the bundle). The p-value for each PC was calculated, and PC with p-value ≤ 0.05 are given in the table. The red cell color marks a negative correlation, * - p-value of PC ≤ 0.05, ** - p-value of PC ≤ 0.01.
3.4 Ex-planta mechanical features of scutched fibers and correlation with gene candidates and in- planta morphometric parameters
Mechanical (strength, Young’s modulus, strain, maximum force) and geometric (thickness) measurements, ex-planta features, were made on scutched fiber bundles obtained from the 7 varieties (Supplementary Table 4). Statistically significant differences for strength, strain, and maximum force were found at 95% of confident interval (Figures 7A, C, D), as for the thickness of the scutched fiber bundle (Figure 7E). We noticed significant differences of Young’s modulus between the seven varieties when we accepted 90% level of the confidence interval (not at 95%). The scattering of mechanical values is a common observation with plant fibers and it is related to the variability of these natural material. There is indeed a large range of factors which can affect variability, from plant growth conditions to fiber sampling, processing and testing (Baley et al., 2020). The average calculated values for each variety are in accordance with the results reported previously (Bourmaud et al., 2018).
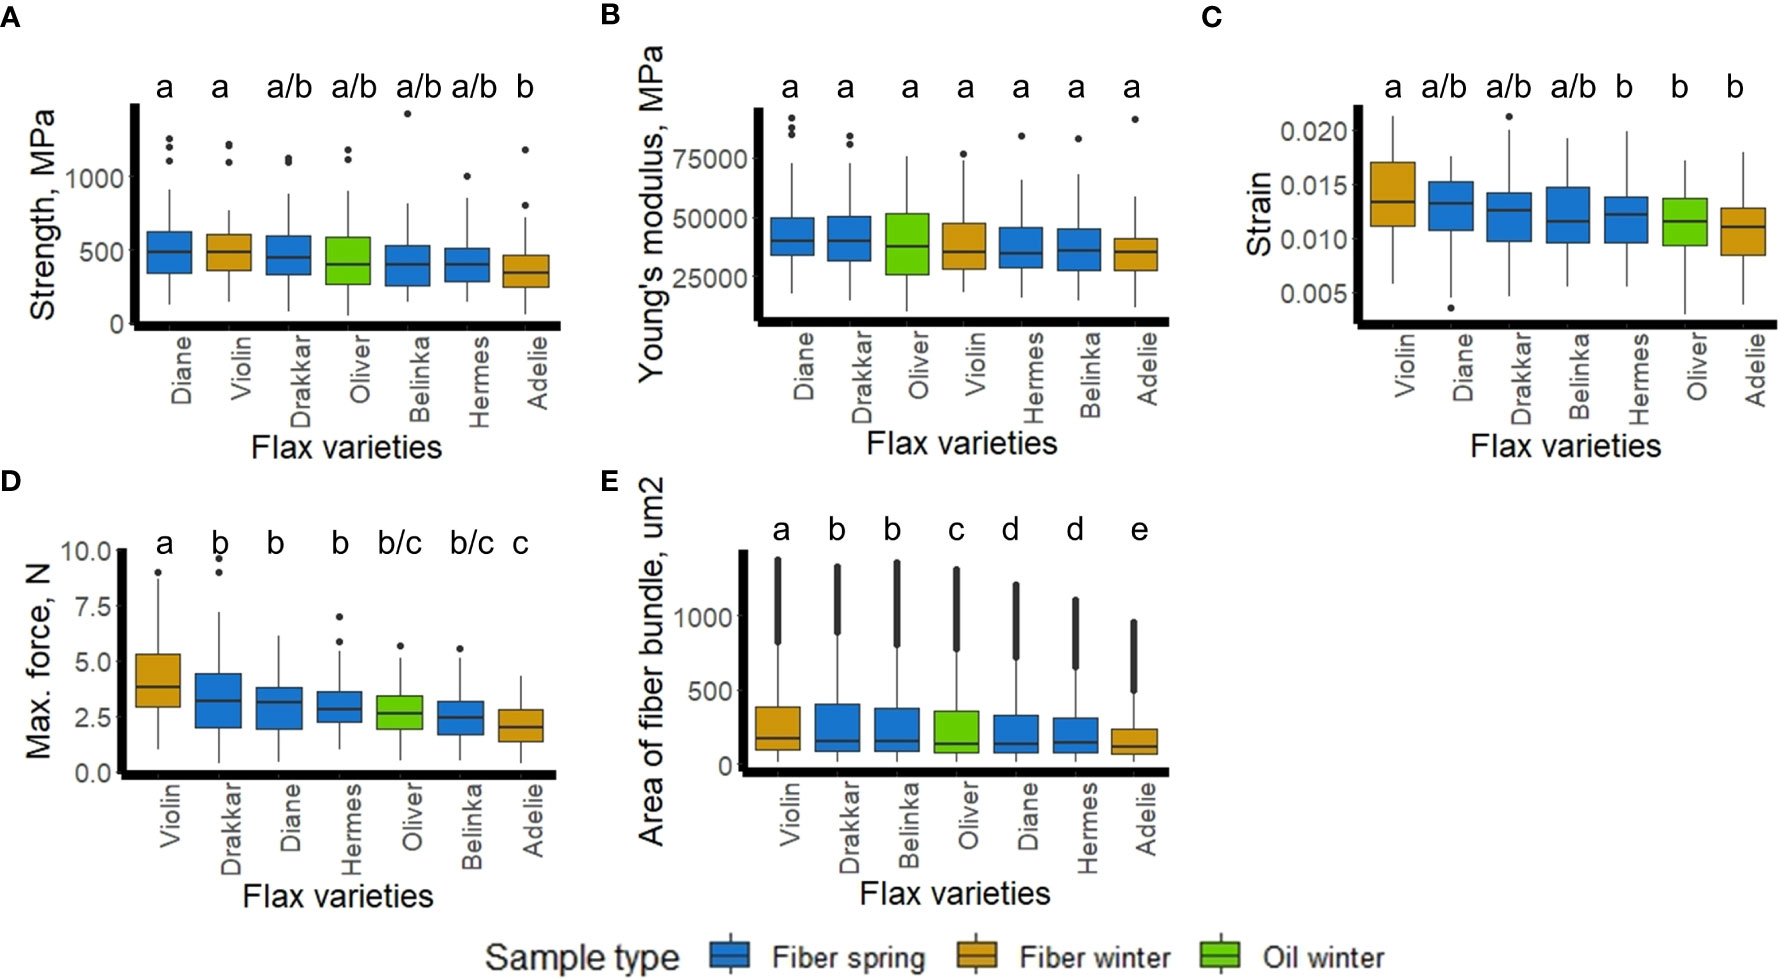
Figure 7 Flax fiber mechanical properties (A-Strength, B-Young’s modulus, C-Strain, D-Maximum force) and geometric properties (E-Area of scotched fiber bundles) of the 7 flax varieties (Diane, Hermes, Drakkar, Belinka, Adelie, Violin, and Oliver). Letters shows statistical differences between flax varieties, p-value ≤ 0.05 (Tukey’s test).
We combined the two lists of candidate genes that we identified according to previous transcriptomic (Supplementary Table 3) and proteomic (Table 1) analyses to calculate Pearson correlation coefficients between expression levels and mechanical values measured for the same varieties. We identified 3 genes whose expression level was strongly correlated with mechanical properties (Table 2). One of the candidate genes is an expansin-like protein (gi|171462119) which is connected to cell wall metabolism (Roach and Deyholos, 2008). The two other genes (Lus10011125 and Lus10010846) encode an enzyme that catalyzes the oxidative decarboxylation of L-malate, the NADP-malic enzyme 3, and an NAD(P)-binding Rossmann-fold superfamily protein, also identified as a putative 3-β-hydroxysteroid dehydratase/isomerase in Arabidopsis phloem exudates (Guelette et al., 2012).
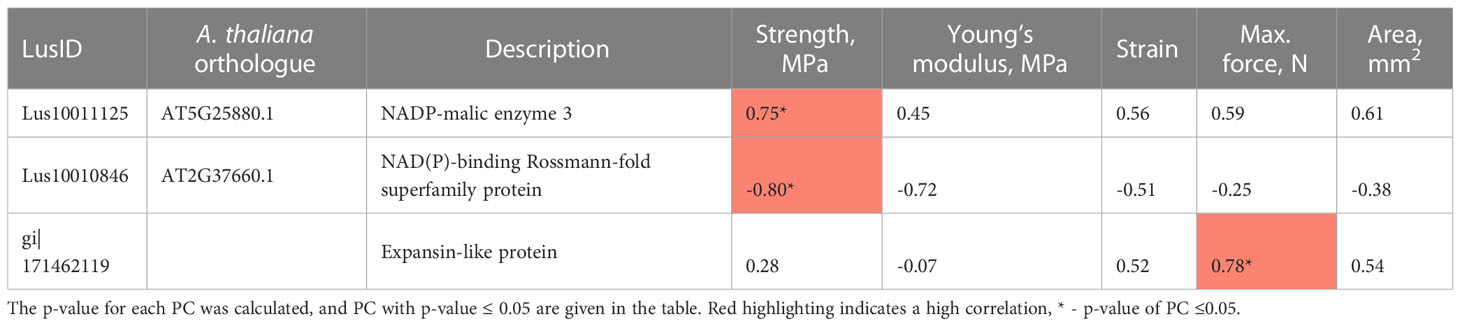
Table 2 Pearson correlation coefficient (PC) between the expression level of selected genes and mechanical features (strength, Young’s modulus, strain, maximum force, and area of a fiber bundle).
To see whether those ex-planta mechanical values (Figure 7) of scutched fibers could be related to in-planta fiber morphometric data (Figure 1), we calculated Pearson correlation coefficients with cell surface and number of fibers within bundles. The bivariate correlations between the 2 sets of morphological data (Figure 1) and the 5 sets of mechanical data (Figure 8) are shown on regression plots (Figure 8). The regression lines reflect positive correlations between both morphometric features and Young’s modulus (PC of 0.8 and 0.77, respectively) and both morphometric features and strength (PC of 0.61 and 0.60, respectively), whereas no correlation could be observed with strain, maximum force or with the area of scutched fibers. We also did not find any significant correlation between fiber bundle surface in-planta (calculated as the multiplication of cell surface and number elementary fibers per bundle) and scutched fiber area ex-planta (data not shown).
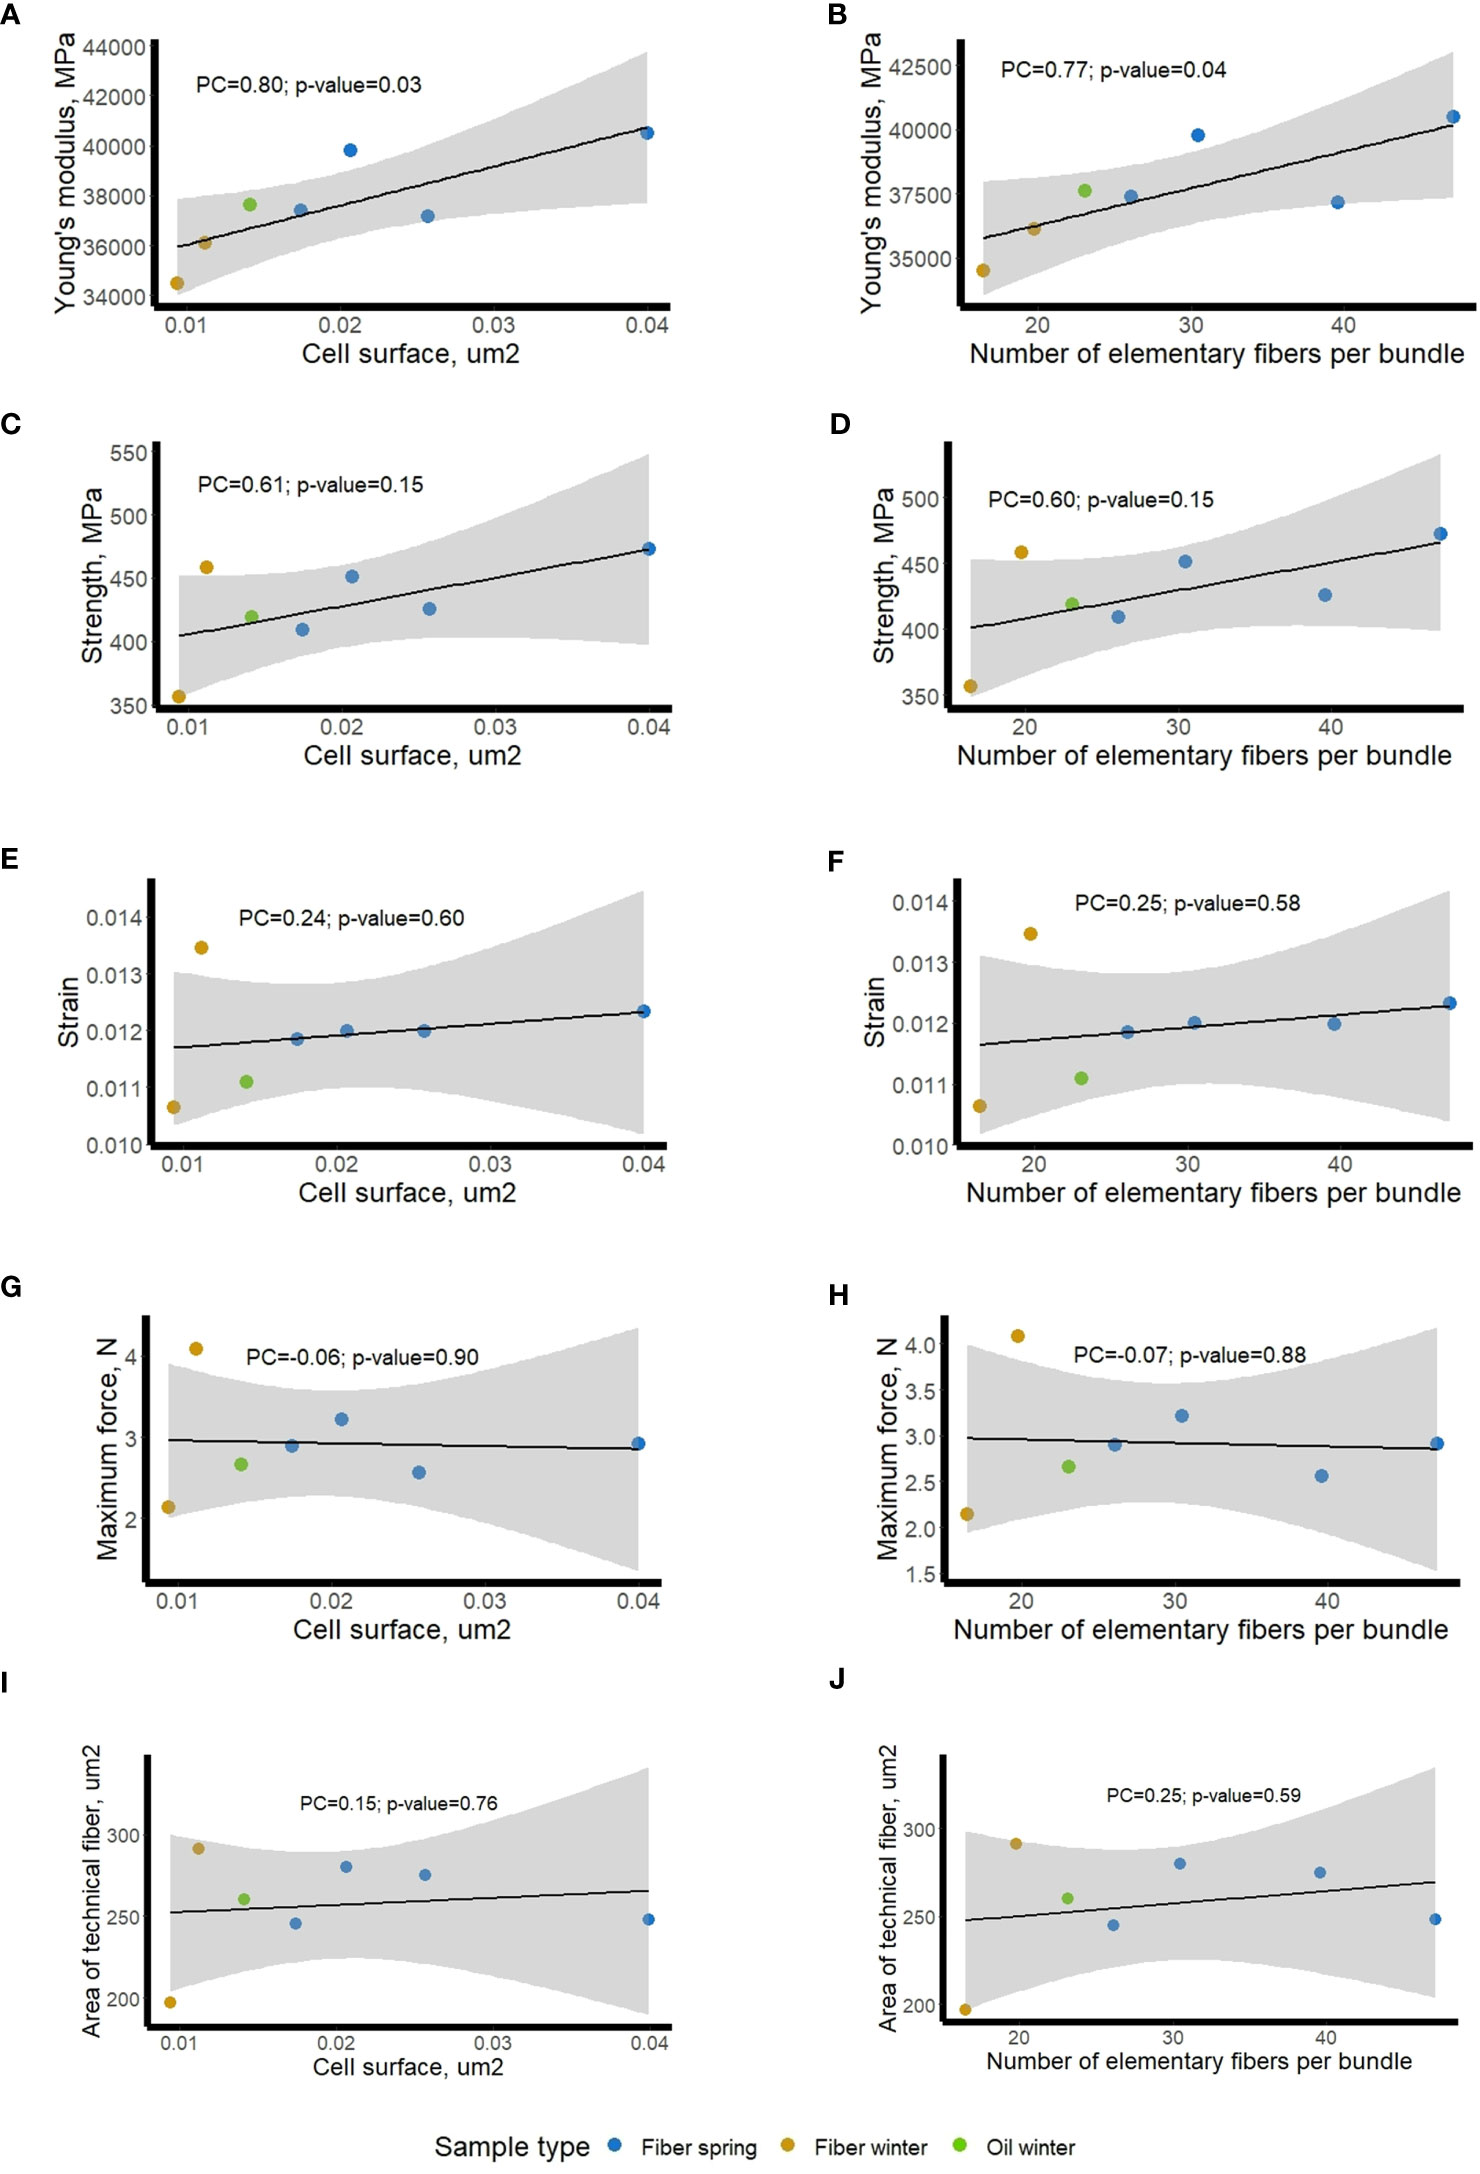
Figure 8 Relationship between mechanical data (ex-planta) of fiber bundles and morphometric data (in-planta) of stem fibers/fiber bundles in different flax varieties. Blue dots – fiber spring, bronze dots – fiber winter, and green dot – oil winter; mechanical data vs cell surface (A, C, E, G, I); mechanical data vs bundle fiber number (B, D, F, H, J). The regression line is plotted with a black line, a grey shaded area shows 95% confidence interval. Pearson Correlation coefficients (PC) and their p-values are given on the plot.
4 Discussion
The fineness and mechanical properties of fibers are key quality parameters for textiles and NFCs that are determined by two main processes in addition to scutching: i) fiber formation during the growth of the flax plant and ii) fiber separation and extraction during the post-harvest retting process (Djemiel et al., 2020). Both of these processes are, in turn, determined by the flax genotype and environmental conditions (including the composition of the retting microbiome). In this paper, we combined Omics performed on bast fiber bearing tissues and morphometric/mechanical analyses in seven flax varieties grown under field conditions to provide further information about putative key molecular actors of elementary (single) fiber constitution and fiber bundle properties.
The morphometric data revealed a relatively high degree of phenotypical variability between the different replicates for the seven varieties analyzed, most likely reflecting the combined effects of genetic and environmental factors as shown in previous studies (Stenström et al., 2002; Clarkson, 2005; Richter et al., 2012). Indeed, clear differences were observed both for elementary fiber number per bundle and fiber cross-sectional surface between the different varieties, with the highest values for the four spring fiber varieties and lowest for the two winter fiber varieties, the oil variety (Oliver) showing intermediate values. During retting and decortication process, fiber bundles are separated from each other but the individual fibers can still be linked within the bundles. The mechanical properties are dependent on the fineness of scutched fibers, i.e. the number of individual fibers in the bundles.
Comparative transcriptomics of fiber-enriched tissues from the seven varieties identified a total of 1041 DEGs of which 9.3% were related to cell wall metabolism (Supplementary Tables 1, 2). The majority of these genes is implicated in cell wall polymer modification including beta-glucanases, beta-galactosidases, glycosyl hydrolases, pectin lyase-like and xyloglucan endotransglucosylase/hydrolase. This is in the agreement with previous findings showing that the proteins identified in the outer stem tissues compared to inner stem tissues are mostly associated with pectin and hemicellulose remodeling (Roach et al., 2011; Chabi et al., 2017). Taking into account that the bast fibers contain up to 78% of cellulose (Thygesen et al., 2011), and tertiary cell wall of flax is in fact a composite containing mostly cellulose and pectin and hemicellulose (Gurjanov et al., 2008; Mohnen, 2008; Mikshina et al., 2013), we could hypothesize that pectin and hemicellulose remodeling could represent a biochemical basis for the variation of morphometric and mechanical parameters in different flax varieties.
Subsequent sPLS-DA analysis of the transcriptomic data identified 4 distinct variety clusters and showed that 56 genes corresponded to the first 3 X-variates and explained 73% total variance. Calculations of the average morphometric data for the four clusters revealed statistically significant differences between them, suggesting a possible link between the identified DEGs and morphometric data. Somewhat surprisingly, only 1 out of the 56 candidate genes, Lus10037377 encoding a xyloglucan endotransglucosylase/hydrolase 32, could be directly related to cell wall organization supporting our hypothesis that other molecular processes may be important in determining key fiber parameters.
The calculation of Pearson correlation coefficients enabled the identification of 5 (out of 56) genes showing a strong correlation between expression levels and morphometric features. One of the five identified genes – Lus10022736 (LusWRKY85) – showed a strong positive correlation with the number of elementary fibers per bundle. There are 102 LusWRKY genes predicted in the flax genome, and the LusWRKY85 (Lus10022736) gene, together with its near paralogues LusWRKY84 (Lus10014177), LusWRKY87 (Lus10025133) and LusWRKY88 (Lus10025216) are included in the same group of transcription factors (group III), which is distinguished on the distribution of conserved motifs in LusWRKY-genes (Yuan et al., 2021). Developmental studies have shown that LusWRKY85 (Lus10022736) is expressed mostly at the seedling and maturity stage (Yuan et al., 2021). Since the number of elementary fibers per bundle is largely determined by their intrusive growth (Mokshina et al., 2018), it is tempting to hypothesize that the observed expression profile of this gene at the early stages of development could explain the correlation with this trait. Another gene LusS40-6 (Lus10002073) encodes a senescence regulator and shows a strong statistically significant negative correlation with both of the measured morphometric features. Members of the S40 gene group were described in barley and Arabidopsis plants as playing a role in regulation of leaf senescens (Krupinska et al., 2002; Fischer-Kilbienski et al., 2010), and it is possible that its low expression may lead to a delay in senescence, thereby allowing for increased accumulation of cellulose-rich cell wall material and enhanced cell surface.
In order to identify additional actors of fiber development process and/or confirm transcripts identified via transcriptomics analyses, comparative proteomics were performed on the two varieties Diane (Spring fiber) and Oliver (Winter oil) that belonged to the most widely separated clusters identified both during transcriptomic and morphometric analyses. After analysis, 32 non-redundant proteins were identified, of which 15 and 17 were more abundant in Diane and Oliver, respectively compared to each other. None of the identified proteins were common with the 56 genes identified in the first 3 X-variates of the transcriptomic data. Such an observation is not unusual since protein abundance is not only determined by transcript abundance but also by other factors, including translation efficiency and protein turnover, as well as by a wide range of post-translational modifications (Gygi et al., 1999; Haider and Pal, 2013). Nevertheless, 5 of the proteins were also present in the 1041 DEGs identified by transcriptomics (Lus10023569, Lus10014003, Lus10037377, Lus10001508, and Lus10030577).
To evaluate the relative weight of the 32 identified proteins as potential markers for fiber-related parameters in the complete panel of 7 varieties, we used PLS-DA to generate clusters based on the transcript levels of the corresponding genes. This was done since insufficient proteomic data was available for sPLS-DA. Hierarchical clustering identified 3 clusters that more accurately reflected the variety morphotype (spring-/winter-fiber and oil) than similar clustering based on the 1041 DEGs. A similar clusterization was obtained for the same 7 flax varieties based on retrotransposon-derived polymorphism (Galindo-González et al., 2016). This study also revealed that the Ty1-copia retrotransposons have been active since breeding started in flax, and that they decreased the expression level of some genes.
Calculation of Pearson correlation coefficients between the expression levels of the genes corresponding to the 32 identified proteins and morphometric data led to the identification of 4 genes showing significant negative correlations. Two of the genes (Lus10010846 and Lus10024383) corresponded to the same Arabidopsis thaliana orthologue (AT2G37660), which encodes a NAD(P)-binding Rossmann-fold superfamily protein, also referred to a putative 3-β-hydroxysteroid dehydratase/isomerase. This multifunctional steroid metabolism enzyme is suspected to be involved in antioxidative defense, protein folding, and repair in various subcellular locations such as the apoplast, chloroplast, chloroplast stroma, endoplasmic reticulum and thylakoid. Interestingly, certain Arabidopsis sterol biosynthesis mutants show crucial alterations in plant organization at the cellular level in globular stage embryos, including incomplete cell wall formation and aberrant cell wall thickening (Schrick et al., 2004). The authors hypothesize that sterols could be crucial for cellulose synthesis during cell wall construction. Another example of a sterol-related enzyme is GAME25 that plays a key role in the formation of steroidal specialized metabolites (Sonawane et al., 2018). Its activity not only affects the enormous diversity of steroidal glycoalkaloids and steroidal saponins, which are produced in hundreds of plant species but also modulates the molecules’ toxic effects. It is interesting to note that this protein has been previously referred to as a lipid-binding protein in phloem exudates of Arabidopsis (Guelette et al., 2012) and that its gene is co-expressed with Lus10006497 coding a Lipase/lipooxygenase, involved in mediating response to stresses such as pathogen infection (Ascencio-Ibáñez et al., 2008). Another highlighted gene is Lus10041602 encoding an RNA-binding (RRM/RBD/RNP motifs) family protein such as PLASTID-SPECIFIC RIBOSOMAL PROTEIN 2, a protein unique to plastid ribosomes (Yamaguchi and Subramanian, 2003). Transgenic Arabidopsis plants overexpressing PSRP2 showed delayed germination compared with that of wild-type plants under salt, dehydration, or low-temperature stress conditions (Tiller et al., 2012). The PSRP2 protein shows RNA chaperone activity, and taken together these results could suggest that PSRP2 may play a role as a negative regulator in seed germination (Xu et al., 2013). The fourth gene (Lus10008932) encodes a cytosolic or nuclear polyketide cyclase/dehydrase and lipid transport superfamily protein, also known as MLP-like protein 328 (Major Latex protein-). A previous study showed that MLP-like protein 328 transcripts were the most abundant in flax stem tissues above the snap point (Guo et al., 2021), which is the transition zone in development process of fiber cells (Gorshkova et al., 2003).
Our attempts to link the Omics results with morphometric data were based upon analyses of living plant material harvested at the budding stage. As such, we considered the morphometric data as in-planta factors. However, as explained above, key fiber parameters (fineness, mechanical properties) are also affected by fiber separation and extraction during the post-harvest retting process (Djemiel et al., 2020). Since these actions occur after the plant has been harvested, we decided to refer to the obtained data as ex-planta. In order to see whether these two sets of data were related, linear regressions were made between each of the four fiber bundle quality properties (dependent variable) with the two morphometric parameters (independent variables). The results showed that the studied morphometric features were able to explain close to 50% of the Young’s modulus variation and about 30% of the strength variation. This fact suggests that the measurements of the cell surfaces and the number of elementary fibers per bundle before retting could be considered as relevant indicators of the biological background that influence the mechanical properties of the fiber bundle after retting and scutching. It also suggests that it is necessary to consider both in-planta and ex-planta properties to be able to explain fiber variability especially when considering the Young’s modulus, which is a relevant indicator of the biological quality of a fiber bundle (Haag and Müssig, 2016).
Calculation of Pearson correlation coefficients led to the identification of 3 genes whose expression levels within bast fiber bearing tissues showed a strong correlation with ex-planta mechanical parameters of scutched fibers obtained after retting. Similar approach using transcriptomic data and ex-planta parameters was recently described for flax (Galinousky et al., 2020) which shown comparable explanatory potential of individual molecular markers for mechanical features of the scutched fibers (up to 54% described by Galinousky et al., 2020; and 48-54% in the current study). In our study we highlighted the Lus10011125 gene that encodes an enzyme that catalyzes the oxidative decarboxylation of (S)-malate to pyruvate using NADP+ as a cofactor. According to the FIBexDB9 data, the expression level of this gene increases in flax roots treated with Fusarium oxysporum or aluminum, and also in the reduced fiber flax mutant (the rdf-mutant) (Dmitriev et al., 2016; Dmitriev et al., 2017; Mokshina et al., 2021; Petrova et al., 2022). The expansin-like protein encoding gene (gi|171462119) whose expression strongly correlates with the maximum force, may regulate the mechanical properties of flax fibers by affecting the degree of cellulose microfibril alignment and the interactions between cellulose and other cell wall components (Cosgrove, 2000). At last, Lus10010846, coding a binding Rossman-fold superfamily protein involved in biosynthesis and maintenance of plant cell walls, was already previously shown to be highly correlated with morphometric features (Figure 6), and could be of great interest for both in-planta and ex-planta fiber features management and prediction.
5 Conclusion and future perspectives
Our study indicates that Omics combined with appropriate statistical analyses can be a powerful tool for identifying genes potentially involved in determining in-planta and ex-planta properties related to flax fiber quality. The results suggest that the observed differences in morphometric properties between the studied varieties have a background in differentially-expressed genes involved in different biochemical pathways. The genetic variability of the studied varieties may be reflected in the functioning of a sub-set of key genes present in the bast fiber bearing tissues, including those involved in lipid metabolism in the phloem and senescence process. The expression of specific lipid transfer proteins was previously correlated with either the elongation or thickening stage of flax bast fiber development (Roach and Deyholos, 2007). Similarly, previous expression data showed that about 11% of over-expressed genes in the bast of the stem were potentially associated with lipid and wax metabolism (Fenart et al., 2010). The association of delayed senescence processes and intensive formation of bast fibers could be related to the later transition of flax fiber varieties to budding and flowering compared to oil seed, as well as to their more prolonged rapid growth stage and higher stem length (Diederichsen and Richards, 2003). There is also increasing evidence that remodeling of cell wall polymers is an important process during the formation and maturation of flax fibers. Molecular actors involved in cell wall remodeling may therefore represent a potential target for improving flax fiber properties.
Genomic breeding approaches commonly include the development of an optimal genomic model which utilizes a set of genetic markers favorable for the desired phenotypic trait (He et al., 2019; Khan et al., 2023; Rahman and Hoque, 2023). In our current study, we show how individual protein and RNA markers have a higher explanatory potential for phenotypic features and potentially could be used as effective predictors of flax fiber quality parameters. In the context of the global climate change trend, these genes we have highlighted could be tested over several years and under different climatic conditions.
Overall, our results suggest that the range of possible molecular processes that could be targeted for genetic improvement of flax fiber quality is far larger than previously imagined above and beyond the different metabolisms associated with the biosynthesis of cell wall polymers. We hypothesize the development of a new generation of breading approaches based on the combined use of Omic data and appropriate bio-informatics tools.
Data availability statement
The transcriptomic data presented in the study are deposited in the NCBI repository, accession number GSE222066. The proteomics data presented in the study are deposited in the ProteomeXchange repository, accession number PXD039389.
Author contributions
MC, SH, GN, AD, A-SB, BC, and SG contributed to conception and design of the study. SH secured the funding. MC conducted the experiment. KH and JM conducted the mechanical analyses. MC, JR, and SP conducted the proteomic analysis. MC and AL-D conducted the transcriptomic analyses. EG and DG performed the Omics statistical analyses. MC and SH wrote the first draft of the manuscript. EG, DG, GN, SH, AD and BC wrote sections of the manuscript. All authors contributed to manuscript revision, read, and approved the submitted version.
Funding
This work was carried out within the framework of the FIBRAGEN project financed by the national funding agencies, namely the German Federal Ministry of Education and Research [BMBF, Project Fibragen; FKZ: 0315911]; the French National Research Agency [ANR-10- KBBE-0003, Fibragen]; the Spanish Ministry of Economy and Competitiveness − General Management of Scientific and Technical Research [PIM2010PKB-00672]; and Genome Canada and the Natural Sciences and Engineering Research Council of Canada.
Acknowledgments
DG gratefully acknowledges the College de France PAUSE program (https://www.college-de-france.fr/programme-pause) and the University of Lille for financial support. The authors thank Terre de Lin (Saint-Pierre-le-Viger, France) and LINEA (Grandviliers, France) for flax field growing and for flax fibers extraction.
Conflict of interest
The authors declare that the research was conducted in the absence of any commercial or financial relationships that could be construed as a potential conflict of interest.
Publisher’s note
All claims expressed in this article are solely those of the authors and do not necessarily represent those of their affiliated organizations, or those of the publisher, the editors and the reviewers. Any product that may be evaluated in this article, or claim that may be made by its manufacturer, is not guaranteed or endorsed by the publisher.
Supplementary material
The Supplementary Material for this article can be found online at: https://www.frontiersin.org/articles/10.3389/fpls.2023.1204016/full#supplementary-material
Footnotes
- ^ https://imagej.net/software/fiji/
- ^ https://phytozome-next.jgi.doe.gov
- ^ http://cran.r-project.org/
- ^ https://digitalinsights.qiagen.com/
- ^ https://www.ebi.ac.uk/pride/archive
- ^ http://bioinformatics.sdstate.edu/go/
- ^ https://www.plabipd.de/portal/web/guest/mercator4
- ^ https://phytozome-next.jgi.doe.gov
- ^ https://ssl.cres-t.org/fibex/
- ^ http://bioinformatics.sdstate.edu/go74/
- ^ https://software.broadinstitute.org/morpheus/
- ^ https://software.broadinstitute.org/morpheus/
References
Ascencio-Ibáñez, J. T., Sozzani, R., Lee, T. J., Chu, T. M., Wolfinger, R. D., Cella, R., et al. (2008). Global analysis of arabidopsis gene expression uncovers a complex array of changes impacting pathogen response and cell cycle during geminivirus infection. Plant Physiol. 148, 436–454. doi: 10.1104/pp.108.121038
Baley, C., Gomina, M., Breard, J., Bourmaud, A., Davies, P.. (2020). Variability of mechanical properties of flax fibres for composite reinforcement. a review. Ind. Crops Prod. 145, 111984. doi: 10.1016/j.indcrop.2019.111984
Batth, R., Jain, M., Kumar, A., Nagar, P., Kumari, S., Mustafiz, A. (2020). Zn2+ dependent glyoxalase i plays the major role in methylglyoxal detoxification and salinity stress tolerance in plants. PloS One 15, 1–14. doi: 10.1371/journal.pone.0233493
Bourmaud, A., Beaugrand, J., Shah, D. U., Placet, V., Baley, C. (2018). Towards high-performance biocomposites for targeted applications: how can we best define the diversity and specificities of reinforcement plant fibre cell walls?
Bourmaud, A., Morvan, C., Bouali, A., Placet, V., Perré, P., Baley, C. (2013). Relationships between micro-fibrillar angle, mechanical properties and biochemical composition of flax fibers. Ind. Crops Prod. 44, 343–351. doi: 10.1016/j.indcrop.2012.11.031
Carpita, N. C. (2011). Update on mechanisms of plant cell wall biosynthesis: how plants make cellulose and other (1→4)-β-d-Glycans1. Plant Physiol. 155, 171–184. doi: 10.1104/pp.110.163360
Chabbert, B., Padovani, J., Djemiel, C., Ossemond, J., Lemaître, A., Yoshinaga, A., et al. (2020). Multimodal assessment of flax dew retting and its functional impact on fibers and natural fiber composites. Ind. Crops Prod. 148, 112255. doi: 10.1016/j.indcrop.2020.112255
Chabi, M., Goulas, E., Leclercq, C. C., De Waele, I., Rihouey, C., Cenci, U., et al. (2017). A cell wall proteome and targeted cell wall analyses provide novel information on hemicellulose metabolism in flax. Mol. Cell. Proteomics 16, 1634–1651. doi: 10.1074/mcp.M116.063727
Clarkson, D. (2005). Roots: the dynamic interface between plants and the earth. * Abe J, ed. 2003. * dordrecht: kluwer academic publishers. * 165 (hardback). 460 pp. Ann. Bot. 95, 704–704. doi: 10.1093/aob/mci074
Cloutier, S., Ragupathy, R., Miranda, E., Radovanovic, N., Reimer, E., Walichnowski, A., et al. (2012). Integrated consensus genetic and physical maps of flax (Linum usitatissimum l.). Theor. Appl. Genet. 125, 1783–1795. doi: 10.1007/s00122-012-1953-0
Cosgrove, D. J. (2000). Expansive growth of plant cell walls cell wall growth / endo-1,4-P-D-glucanase ! expansin / xyloglucan endotransglycosylase EG, endo-1,4-P-D-glucanase / XET, xyloglucan endotransglycosylase. PIam Ph~siol Bioclzern 38, 109–124. doi: 10.1016/s0981-9428(00)00164-9
Day, A., Ruel, K., Neutelings, G., Crônier, D., David, H., Hawkins, S., et al. (2005). Lignification in the flax stem: evidence for an unusual lignin in bast fibers. Planta 222, 234–245. doi: 10.1007/s00425-005-1537-1
Diederichsen, A., Hammer, K. (1995). Variation of cultivated flax (Linum usitatissimum l. subsp.usitatissimum) and its wild progenitor pale flax (subsp.angustifolium (Huds.) thell.). Genet. Resour. Crop Evol. 42, 263–272. doi: 10.1007/BF02431261
Diederichsen, A., Richards, K. (2003). “Cultivated flax and the genus linum l.: taxonomy and germplasm conservation,” in Flax the genus linum edited. Eds. Muir, A. D., Westcott, N. D. (London and New York: CRC Press), 9–15.
Djemiel, C., Goulas, E., Badalato, N., Chabbert, B., Hawkins, S., Grec, S. (2020). Targeted metagenomics of retting in flax: the beginning of the quest to harness the secret powers of the microbiota. Front. Genet. 11. doi: 10.3389/fgene.2020.581664
Dmitriev, A. A., Krasnov, G. S., Rozhmina, T. A., Kishlyan, N. V., Zyablitsin, A. V., Sadritdinova, A. F., et al. (2016). Glutathione s-transferases and UDP-glycosyltransferases are involved in response to aluminum stress in flax. Front. Plant Sci. 7. doi: 10.3389/fpls.2016.01920
Dmitriev, A. A., Krasnov, G. S., Rozhmina, T. A., Novakovskiy, R. O., Snezhkina, A. V., Fedorova, M. S., et al. (2017). Differential gene expression in response to fusarium oxysporum infection in resistant and susceptible genotypes of flax (Linum usitatissimum l.). BMC Plant Biol. 17 (Suppl 2), 253. doi: 10.1186/s12870-017-1192-2
Esau, K. (1943). Vascular differentiation in the vegetative shoot of linum. III. the origin of the bast fibers. Am. J. Bot. 30, 579–586. doi: 10.2307/2437468
Fenart, S., Ndong, Y.-P., Duarte, J., Rivière, N., Wilmer, J., van Wuytswinkel, O., et al. (2010). Development and validation of a flax (Linum usitatissimum l.) gene expression oligo microarray. BMC Genomics 11, 592. doi: 10.1186/1471-2164-11-592
Fischer-Kilbienski, I., Miao, Y., Roitsch, T., Zschiesche, W., Humbeck, K., Krupinska, K. (2010). Nuclear targeted AtS40 modulates senescence associated gene expression in arabidopsis thaliana during natural development and in darkness. Plant Mol. Biol. 73, 379–390. doi: 10.1007/s11103-010-9618-3
Galindo-González, L., Mhiri, C., Grandbastien, M. A., Deyholos, M. K. (2016). Ty1-copia elements reveal diverse insertion sites linked to polymorphisms among flax (Linum usitatissimum l.) accessions. BMC Genomics 17, 1–19. doi: 10.1186/s12864-016-3337-3
Galinousky, D., Mokshina, N., Padvitski, T., Ageeva, M., Bogdan, V., Kilchevsky, A., et al. (2020). The toolbox for fiber flax breeding: a pipeline from gene expression to fiber quality. Front. Genet. 11. doi: 10.3389/fgene.2020.589881
Ge, S. X., Jung, D., Jung, D., Yao, R. (2020). ShinyGO: a graphical gene-set enrichment tool for animals and plants. Bioinformatics 36, 2628–2629. doi: 10.1093/bioinformatics/btz931
Gorshkov, O., Mokshina, N., Gorshkov, V., Chemikosova, S., Gogolev, Y., Gorshkova, T. (2017). Transcriptome portrait of cellulose-enriched flax fibres at advanced stage of specialization. Plant Mol. Biol. 93, 431–449. doi: 10.1007/s11103-016-0571-7
Gorshkova, T., Brutch, N., Chabbert, B., Deyholos, M., Hayashi, T., Lev-Yadun, S., et al. (2012). Plant fiber formation: state of the art, recent and expected progress, and open questions. CRC Crit. Rev. Plant Sci. 31, 201–228. doi: 10.1080/07352689.2011.616096
Gorshkova, T., Chernova, T., Mokshina, N., Gorshkov, V., Kozlova, L., Gorshkov, O. (2018). Transcriptome analysis of intrusively growing flax fibers isolated by laser microdissection. Sci. Rep. 8, 1–17. doi: 10.1038/s41598-018-32869-2
Gorshkova, T., Mokshina, N., Mitsuda, N., Gorshkov, O. (2023). “Key stages of flax bast fiber development through the prism of transcriptomics,” in The flax genome. Eds. You, F. M., Fofana, B. (Canada: Springer Cham), 149–198. doi: 10.1016/S0926-6690(03)00043-8
Gorshkova, T. A., Sal’nikov, V. V., Chemikosova, S. B., Ageeva, M. V., Pavlencheva, N. V., Van Dam, J. E. G. (2003). The snap point: a transition point in linum usitatissimum bast fiber development. Ind. Crops Prod. 18, 213–221. doi: 10.1016/S0926-6690(03)00043-8
Goulas, E., Le Dily, F., Teissedre, L., Corbel, G., Robin, C., Ourry, A. (2001). Vegetative storage proteins in white clover (Trifolium repens l.): quantitative and qualitative features. Ann. Bot. 88, 789–795. doi: 10.1006/anbo.2001.1501
Goulas, E., Schubert, M., Kieselbach, T., Kleczkowski, L. A., Gardeström, P., Schröder, W., et al. (2006). The chloroplast lumen and stromal proteomes of arabidopsis thaliana show differential sensitivity to short- and long-term exposure to low temperature. Plant J. 47, 720–734. doi: 10.1111/j.1365-313X.2006.02821.x
Grimaud, F., Renaut, J., Dumont, E., Sergeant, K., Lucau-Danila, A., Blervacq, A. S., et al. (2013). Exploring chloroplastic changes related to chilling and freezing tolerance during cold acclimation of pea (Pisum sativum l.). J. Proteomics 80, 145–159. doi: 10.1016/j.jprot.2012.12.030
Guelette, B. S., Benning, U., Hoffmann-Benning, S. (2012). Identification of lipids and lipid-binding proteins in phloem exudates of arabidopsis thaliana. J. Exp. Bot. 63, 3603–3616. doi: 10.1093/jxb/ers028
Guo, Y., Wen, L., Chen, J., Pan, G., Wu, Z., Li, Z., et al. (2021). Comparative transcriptomic analysis identifies key cellulose synthase genes (CESA) and cellulose synthase-like genes (CSL) in fast growth period of flax stem (Linum usitatissimum l.). J. Nat. Fibers 19 (9), 1–16. doi: 10.1080/15440478.2021.1993510
Gurjanov, O. P., Ibragimova, N. N., Gnezdilov, O. I., Gorshkova, T. A. (2008). Polysaccharides, tightly bound to cellulose in cell wall of flax bast fibre: isolation and identification. Carbohydr. Polym. 72, 719–729. doi: 10.1016/j.carbpol.2007.10.017
Gutiérrez, R. A., Green, P. J., Keegstra, K., Ohlrogge, J. B. (2004). Phylogenetic profiling of the Arabidopsis thaliana proteome: what proteins distinguish plants from other organisms? Genome Biol. 5 (8), R53. doi: 10.1186/gb-2004-5-8-r53
Gygi, S. P., Rist, B., Gerber, S. A., Turecek, F., Gelb, M. H., Aebersold, R. (1999). Quantitative analysis of complex protein mixtures using isotope-coded affinity tags. (Nature America Inc.), 17, 1–6. doi: 10.1038/13690
Haag, K., Müssig, J. (2016). Scatter in tensile properties of flax fibre bundles: influence of determination and calculation of the cross-sectional area. J. Mater. Sci. 51, 7907–7917. doi: 10.1007/s10853-016-0052-z
Haag, K., Padovani, J., Fita, S., Trouvé, J. P., Pineau, C., Hawkins, S., et al. (2017). Influence of flax fibre variety and year-to-year variability on composite properties. Ind. Crops Prod. 98, 1–9. doi: 10.1016/j.indcrop.2016.12.028
Haider, S., Pal, R. (2013). Integrated analysis of transcriptomic and proteomic data. Curr. Genomics 14, 91–110. doi: 10.2174/1389202911314020003
He, L., Xiao, J., Rashid, K. Y., Yao, Z., Li, P., Jia, G., et al. (2019). Genome-wide association studies for pasmo resistance in flax (Linum usitatissimum l.). Front. Plant Sci. 9. doi: 10.3389/fpls.2018.01982
Hotte, N. S. C., Deyholos, M. K. (2008). A flax fibre proteome: identification of proteins enriched in bast fibres. BMC Plant Biol. 8, 52. doi: 10.1186/1471-2229-8-52
Huis, R., Morreel, K., Fliniaux, O., Lucau-Danila, A., Fénart, S., Grec, S., et al. (2012). Natural hypolignification is associated with extensive oligolignol accumulation in flax stems. Plant Physiol. 158, 1893–1915. doi: 10.1104/pp.111.192328
Khan, N., Shazadee, H., Cloutier, S., You, F. M. (2023). “Genomics assisted breeding strategy in flax,” in The flax genome. Eds. You, F. M., Fofana, B. (Canada: Springer Cham), 253–272.
Krupinska, K., Haussühl, K., Schäfer, A., van der Kooij, T. A. W., Leckband, G., Lörz, H., et al. (2002). A novel nucleus-targeted protein is expressed in barley leaves during senescence and pathogen infection. Plant Physiol. 130, 1172–1180. doi: 10.1104/pp.008565
Mikshina, P., Chernova, T., Chemikosova, S., Ibragimova, N., Mokshina, N., Gorshkova, T. (2013). “Cellulosic fibers: role of matrix polysaccharides in structure and function.,” in. Cellulose - Fundam. Aspects 91–112. doi: 10.5772/2705
Mohnen, D. (2008). Pectin structure and biosynthesis. Curr. Opin. Plant Biol. 11, 266–277. doi: 10.1016/j.pbi.2008.03.006
Mokshina, N., Chernova, T., Galinousky, D., Gorshkov, O., Gorshkova, T. (2018). Key stages of fiber development as determinants of bast fiber yield and quality. Fibers 6, 1–11. doi: 10.3390/fib6020020
Mokshina, N., Gorshkov, O., Takasaki, H., Onodera, H., Sakamoto, S., Gorshkova, T., et al. (2021). FIBexDB: a new online transcriptome platform to analyze development of plant cellulosic fibers. New Phytol. 231, 512–515. doi: 10.1111/nph.17405
Morvan, C., Andème-Onzighi, C., Girault, R., Himmelsbach, D. S., Driouich, A., Akin, D. E. (2003). Building flax fibres: more than one brick in the walls. Plant Physiol. Biochem. 41, 935–944. doi: 10.1016/j.plaphy.2003.07.001
Muravenko, O. V., Samatadze, T. E., Popov, K. V., Amosova, A. V., Zelenin, A. V. (2001). Comparative genome analysis in two flax species by c-banding patterns. Russ. J. Genet. 37, 253–256. doi: 10.1023/A:1009052909215
Perez-Riverol, Y., Bai, J., Bandla, C., García-Seisdedos, D., Hewapathirana, S., Kamatchinathan, S., et al. (2022). The PRIDE database resources in 2022: a hub for mass spectrometry-based proteomics evidences. Nucleic Acids Res. 50, D543–D552. doi: 10.1093/nar/gkab1038
Petrova, A., Zakharov, M., Ageeva, M., McKenzie, R., Gorshkova, T., Deyholos, M., et al. (2022). A flax mutant with impaired intrusive growth of phloem and xylem fibres demonstrates constitutive gravitropic response. Plant Sci. 323, 111399. doi: 10.1016/j.plantsci.2022.111399
Rachinskaya, O. A., Lemesh, V. A., Muravenko, O. V., Yurkevich, O. Y., Guzenko, E. V., Bol’sheva, N. L., et al. (2011). Genetic polymorphism of flax linum usitatissimum based on the use of molecular cytogenetic markers. Russ. J. Genet. 47, 56–65. doi: 10.1134/S1022795411010108
Rahman, M., Hoque, A. (2023). “Flax breeding,” in The flax genome. Eds. You, F. M., Fofana, B. (Canada: Springer Cham), 55–68.
Richter, S., Kipfer, T., Wohlgemuth, T., Guerrero, C. C., Ghazoul, J., Moser, B. (2012). Phenotypic plasticity facilitates resistance to climate change in a highly variable environment. Oecologia 169, 269–279. doi: 10.1007/s00442-011-2191-x
Roach, M. J., Deyholos, M. K. (2007). Microarray analysis of flax (Linum usitatissimum l.) stems identifies transcripts enriched in fibre-bearing phloem tissues. Mol. Genet. Genomics 278, 149–165. doi: 10.1007/s00438-007-0241-1
Roach, M. J., Deyholos, M. K. (2008). Microarray analysis of developing flax hypocotyls identifies novel transcripts correlated with specific stages of phloem fibre differentiation. Ann. Bot. 102, 317–330. doi: 10.1093/aob/mcn110
Roach, M. J., Mokshina, N. Y., Badhan, A., Snegireva, A. V., Hobson, N., Deyholos, M. K., et al. (2011). Development of cellulosic secondary walls in flax fibers requires β-galactosidase. Plant Physiol. 156, 1351–1363. doi: 10.1104/pp.111.172676
Schrick, K., Fujioka, S., Takatsuto, S., Stierhof, Y. D., Stransky, H., Yoshida, S., et al. (2004). A link between sterol biosynthesis, the cell wall, and cellulose in arabidopsis. Plant J. 38, 227–243. doi: 10.1111/j.1365-313X.2004.02039.x
Schwacke, R., Ponce-Soto, G. Y., Krause, K., Bolger, A. M., Arsova, B., Hallab, A., et al. (2019). MapMan4: a refined protein classification and annotation framework applicable to multi-omics data analysis. Mol. Plant 12, 879–892. doi: 10.1016/j.molp.2019.01.003
Simon, C., Lion, C., Spriet, C., Baldacci-cresp, F., Hawkins, S. (2018). One , two , Three : a bioorthogonal triple labelling strategy for studying the dynamics of plant cell wall formation In vivo. Angewandte Chemie International Edition - Wiley Online Library, 130 1–8. doi: 10.1002/anie.201808493
Somalraju, A., Fofana, B. (2023). “Metabolomics and transcriptomics-based tools for linseed improvement,” in The flax genome. Eds. You, F. M., Fofana, B. (Canada: Springer Cham), 199–216.
Sonawane, P. D., Heinig, U., Panda, S., Gilboa, N. S., Yona, M., Pradeep Kumar, S., et al. (2018). Short-chain dehydrogenase/reductase governs steroidal specialized metabolites structural diversity and toxicity in the genus solanum. Proc. Natl. Acad. Sci. U.S.A. 115, E5419–E5428. doi: 10.1073/pnas.1804835115
Stenström, A., Jónsdóttir, I. S., Augner, M. (2002). Genetic and environmental effects on morphology in clonal sedges in the Eurasian arctic. Am. J. Bot. 89, 1410–1421. doi: 10.3732/ajb.89.9.1410
Thygesen, A., Madsen, B., Bjerre, A. B., Lilholt, H. (2011). Cellulosic fibers: effect of processing on fiber bundle strength. J. Nat. Fibers 8, 161–175. doi: 10.1080/15440478.2011.602236
Tiller, N., Weingartner, M., Thiele, W., Maximova, E., Schöttler, M. A., Bock, R. (2012). The plastid-specific ribosomal proteins of arabidopsis thaliana can be divided into non-essential proteins and genuine ribosomal proteins. Plant J. 69, 302–316. doi: 10.1111/j.1365-313X.2011.04791.x
Wang, Z., Hobson, N., Galindo, L., Zhu, S., Shi, D., McDill, J., et al. (2012). The genome of flax (Linum usitatissimum) assembled de novo from short shotgun sequence reads. Plant J. 72, 461–473. doi: 10.1111/j.1365-313X.2012.05093.x
Wrobél-Kwiatowska, M., Hawkins, S., Szopa, J. (2010). Engineering of plants for improved fiber qualities. advances in textile biotechnology (Cambridge: Woodhead Publishing Series in Textiles). Woodhead p. doi: 10.1533/9780857090232.2.150
Xu, T., Lee, K., Gu, L., Kim, J., Kang, H. (2013). Functional characterization of a plastid-specific ribosomal protein PSRP2 in arabidopsis thaliana under abiotic stress conditions. Plant Physiol. Biochem. 73, 405–411. doi: 10.1016/j.plaphy.2013.10.027
Yamaguchi, K., Subramanian, A. R. (2003). Proteomic identification of all plastid-specific ribosomal proteins in higher plant chloroplast 30s ribosomal subunit: PSRP-2 (U1A-type domains), PSRP-3α/β (ycf65 homologue) and PSRP-4 (Thx homologue). Eur. J. Biochem. 270, 190–205. doi: 10.1046/j.1432-1033.2003.03359.x
You, F. M., Fofana, B. (Eds.) (2023). The flax genome (Canada: Springer Cham). doi: 10.1007/978-3-031-16061-5
You, F. M., Moumen, I., Khan, N., Cloutier, S. (2023). “Reference genome sequence of flax,” in The flax genome. Eds. You, F. M., Fofana, B. (Canada: Springer Cham), 1–17.
You, F. M., Xiao, J., Li, P., Yao, Z., Jia, G., He, L., et al. (2018). Chromosome-scale pseudomolecules refined by optical, physical and genetic maps in flax. Plant J. 95, 371–384. doi: 10.1111/tpj.13944
Yuan, H., Guo, W., Zhao, L., Yu, Y., Chen, S., Tao, L., et al. (2021). Genome-wide identification and expression analysis of the WRKY transcription factor family in flax (Linum usitatissimum l.). BMC Genomics 22, 1–15. doi: 10.1186/s12864-021-07697-w
Zhang, N., Deyholos, M. K. (2016). RNASeq analysis of the shoot apex of flax ( linum usitatissimum ) to identify phloem fiber specification genes. Front. Plant. Sci. 7, 1–5. doi: 10.3389/fpls.2016.00950
Keywords: flax (Linum usitatissimum L.), proteomics, transcriptomics, cell wall, fiber, retting, quality
Citation: Chabi M, Goulas E, Galinousky D, Blervacq A-S, Lucau-Danila A, Neutelings G, Grec S, Day A, Chabbert B, Haag K, Müssig J, Arribat S, Planchon S, Renaut J and Hawkins S (2023) Identification of new potential molecular actors related to fiber quality in flax through Omics. Front. Plant Sci. 14:1204016. doi: 10.3389/fpls.2023.1204016
Received: 11 April 2023; Accepted: 20 June 2023;
Published: 17 July 2023.
Edited by:
Milen I. Georgiev, Bulgarian Academy of Sciences, BulgariaReviewed by:
Michael Deyholos, University of British Columbia, CanadaTatyana Gorshkova, Kazan Institute of Biochemistry and Biophysics (RAS), Russia
Copyright © 2023 Chabi, Goulas, Galinousky, Blervacq, Lucau-Danila, Neutelings, Grec, Day, Chabbert, Haag, Müssig, Arribat, Planchon, Renaut and Hawkins. This is an open-access article distributed under the terms of the Creative Commons Attribution License (CC BY). The use, distribution or reproduction in other forums is permitted, provided the original author(s) and the copyright owner(s) are credited and that the original publication in this journal is cited, in accordance with accepted academic practice. No use, distribution or reproduction is permitted which does not comply with these terms.
*Correspondence: Estelle Goulas, ZXN0ZWxsZS5nb3VsYXNAdW5pdi1saWxsZS5mcg==
†These authors have contributed equally to this work and share first authorship