
94% of researchers rate our articles as excellent or good
Learn more about the work of our research integrity team to safeguard the quality of each article we publish.
Find out more
ORIGINAL RESEARCH article
Front. Plant Sci., 16 June 2023
Sec. Plant Abiotic Stress
Volume 14 - 2023 | https://doi.org/10.3389/fpls.2023.1194759
This article is part of the Research TopicCrop Physiological Responses to Abiotic StressView all 22 articles
 Xiaoyuan Bao1,2,3†
 Xiaoyang Hou1†Weiwei Duan1,3
 Baozhong Yin2Jianhong Ren1Yandong Wang1
 Xuejing Liu1,4*
 Limin Gu1,2*Wenchao Zhen1,2,3*
Background: Drought-resistant varieties are an important way to address the conflict between wheat’s high water demand and the scarcity of water resources in the North China Plain (NCP). Drought stress impacts many morphological and physiological indicators in winter wheat. To increase the effectiveness of breeding drought-tolerant varieties, choosing indices that can accurately indicate a variety’s drought resistance is advantageous.
Results: From 2019 to 2021, 16 representative winter wheat cultivars were cultivated in the field, and 24 traits, including morphological, photosynthetic, physiological, canopy, and yield component traits, were measured to evaluate the drought tolerance of the cultivars. Principal component analysis (PCA) was used to transform 24 conventional traits into 7 independent, comprehensive indices, and 10 drought tolerance indicators were screened out by regression analysis. The 10 drought tolerance indicators were plant height (PH), spike number (SN), spikelet per spike(SP), canopy temperature (CT), leaf water content (LWC), photosynthetic rate (A), intercellular CO2 concentration (Ci), peroxidase activity (POD), malondialdehyde content (MDA), and abscisic acid (ABA). In addition, through membership function and cluster analysis, 16 wheat varieties were divided into 3 categories: drought-resistant, drought weak sensitive, and drought-sensitive.
Conclusion: JM418, HM19,SM22, H4399, HG35, and GY2018 exhibited excellent drought tolerance and,therefore, can be used as ideal references to study the drought tolerance mechanism in wheat and breeding drought-tolerant wheat cultivars.
Drought is an abiotic stress with extensive crop yield losses and has become an important constraining factor of agricultural development (Fang and Xiong, 2015). As one of the driest regions in the world, the North China Plain (NCP) is China’s most important wheat-producing region, accounting for about 71% of the country’s total wheat production (Sun et al., 2006). The region has a temperate monsoon climate, with 50–150 mm of precipitation falling during the wheat-growing season (Fang et al., 2010; Jha et al., 2017). Therefore, the spring drought has become the predominant drought pattern affecting the wheat-growing period (Wu et al., 2021). To increase grain production, farmers in the NCP tapped groundwater for irrigation, causing water table declines and producing the largest funnel area in the world, with serious hydrological consequences (Liu et al., 2022).
Many strategies were implemented to alleviate the conflict between wheat production and water scarcity, including the planting of drought-resistant wheat varieties, the use of water-saving irrigation equipment, and water-saving irrigation field management (Morison et al., 2008). Among these, growing drought-resistant wheat varieties is the foundation for increased yield and water productivity. Efforts to reduce the impact of drought by breeding drought-resistant cultivars have been underway worldwide for a long time, but their progress is influenced by the environment (Mwadzingeni et al., 2016). Meanwhile, drought resistance is a complex trait controlled by a large number of genes, resulting from the interaction between different basic constituents or adaptive traits, each of which may be subject to complex genetic and environmental changes. Therefore, developing and evaluating drought-tolerant crop varieties and screening for drought-tolerant traits are necessary to ensure sustainable food production in future climate scenarios (Gambetta et al., 2020).
The morphological and physiological responses of crops to drought can explain the large variation in yield under drought stress conditions (Puangbut et al., 2022). From a morphological perspective, drought reduced the size of wheat organs, such as leaves, stems, ears, and tillers, at different developmental stages (Ihsan et al., 2016). Therefore, plant height, panicle number, spikelet seed setting rate, 1000-grain weight, and aboveground biomass all decreased (Li et al., 2010; Gao et al., 2020; Memon et al., 2021). At the canopy level, drought resulted in increased canopy temperature and decreased leaf area index. In addition to the phenotypic changes caused by drought stress, many physiological and biochemical changes occur in crops to withstand the negative effects of adversity. Photosynthesis is the basis of plant growth and the primary metabolic process in plants, and it can be disrupted by stress even at low levels (Fan et al., 2019). Carbon uptake during photosynthesis is intimately connected with wheat productivity and is also crucially controlled by stomatal opening (Correia et al., 2022). Plants’ first physiological response to water scarcity is stomatal closure, which reduces photosynthetic activity by slowing the rate of carbon dioxide entry into mesophyll cells (Gomez-Candon et al., 2022). The maximum quantum yield of primary photochemistry (Fv/Fm) in leaves in the dark-adapted state can reflect wheat’s light-use efficiency under drought conditions (Yu et al., 2021). Reactive oxygen species (ROS) are regarded as one of the mechanisms for enhancing the adaptation of plants to environmental stress conditions (Gill and Tuteja, 2010). The production of ROS can cause chemical damage to DNA and proteins, interfering with a series of physiological and biochemical processes (Cruz de Carvalho, 2008). An active antioxidant system is an important strategy for plants to cope with drought stress, and antioxidant enzymes mainly include superoxide dismutase (SOD), peroxidase (POD), catalase (CAT), and ascorbate peroxidase (APX) (Miller et al., 2010). Another important relevant response of wheat to drought stress is osmoregulation which has long been recognized as an important component of drought tolerance, and osmoregulatory substances include malondialdehyde (MDA), proline (Pro), and soluble proteins (SPC) (Hura et al., 2007; Kumar et al., 2020). Similarly, water stress would significantly impact the endogenous hormonal balance, affecting drought resistance in wheat (Luo et al., 2021). The plant hormone abscisic acid (ABA) plays a key role in regulating drought stress by stimulating short-term responses to maintain water balance by the closing of stomata and inducing the transcription and activity of antioxidant enzymes (Guan et al., 2000; Jiang and Zhang, 2003; Wang et al., 2021). Improved water use efficiency and regulated photosynthetic activity through ABA play a key role in response of plants to drought (Wang et al., 2020; Gouveia et al., 2021).
In recent years, studies have reported some traits associated with drought tolerance in wheat. However, various phenotypic characters, including yield components, plant height, number of tillers, number of spikelets, grain numbers per spike, and thousand-grain weight (Lopes et al., 2012; Zhang et al., 2016; Kadkol et al., 2020; Mdluli et al., 2020; Ahmad et al., 2022), are still the key traits for screening wheat breeding materials (Monneveux et al., 2012). Nakhforoosh et al. (2016) found that dry matter accumulation can be considered a key indicator for screening for drought-resistant cultivars. Lu et al. (2020) found that the relatively low canopy temperature(CT) value at the grain-filling stage and the high chlorophyll content during the late grain-filling stage can be used to screen the winter wheat cultivars adapted to dryland ecosystems. Similarly, at the physiological and biochemical levels, photosynthesis intensity, chlorophyll content, ABA accumulation, antioxidant enzyme activity (SOD, POD, CAT, and APX), and accumulation of osmotic regulatory substances (Pro) can be used as reference indices for drought resistance evaluation (Zivcak et al., 2009; Wang et al., 2014; Song et al., 2017; Ahmed et al., 2019). It is difficult to consider all drought resistance traits when evaluating large populations due to the diversity of drought resistance indicators, and PCA can be used to assess the weight assigned to each indicator and find the principal components that influence all variables (Tahjib-Ul-Arif et al., 2018; Ahmad et al., 2020). In addition, the combination of membership function, cluster analysis, correlation analysis, grey relational analysis, and other methodologies can be used to more accurately and reliably evaluate the performance of plants under adverse conditions (Sun et al., 2021).
There are three main problems with the previous research study. To begin with, some studies have been carried out in greenhouses or pots, where the environment and wheat growth differ from those grown in the field. A single plant or several plants in a greenhouse or pot could not represent the wheat population in the field because wheat is a densely planted crop(Ahmed et al., 2019; Ahmad et al., 2022; Correia et al., 2022). Second, as a result of climate change, drought stress in winter wheat occurs primarily in April and May in the North China Plain, and different study periods result in an inconsistent selection of drought tolerance traits. Finally, most studies considered only the wheat phenotypic traits, while ignoring the effects of photosynthetic, physiological, and biochemical on crop drought resistance (Liu et al., 2016).
Consequently, we cultivated 16 wheat cultivars in a field experiment and measured 24 related traits. The objective of this study was (1) to evaluate the drought resistance of wheat by principal component analysis, membership function, and multivariate statistics, (2) to classify cultivars according to the comprehensive evaluation value, and (3) to screen and evaluate the traits associated with drought resistance in different winter wheat varieties.
This study was conducted at the Malan Experimental Station (37° 99’N, 115° 20’E), Hebei Agricultural University, from 2019 to 2021 (Figure 1). The study area has a sub-humid continental temperate monsoon climate and is located 37 m above sea level. At a depth of 0–200 cm, the average bulk density of soil is 1.56 g/cm3, and the field water holding capacity is 22.9%. The 0–40 cm soil layer has a pH of 8.0 and an available phosphorus content of 25.8 mg/kg, a potassium content of 125 mg/kg, and a total nitrogen content of 1.26 g/kg. Before the experiment, the field was planted with summer maize in rotation, and all the maize straw was crushed and returned to the field after harvest.
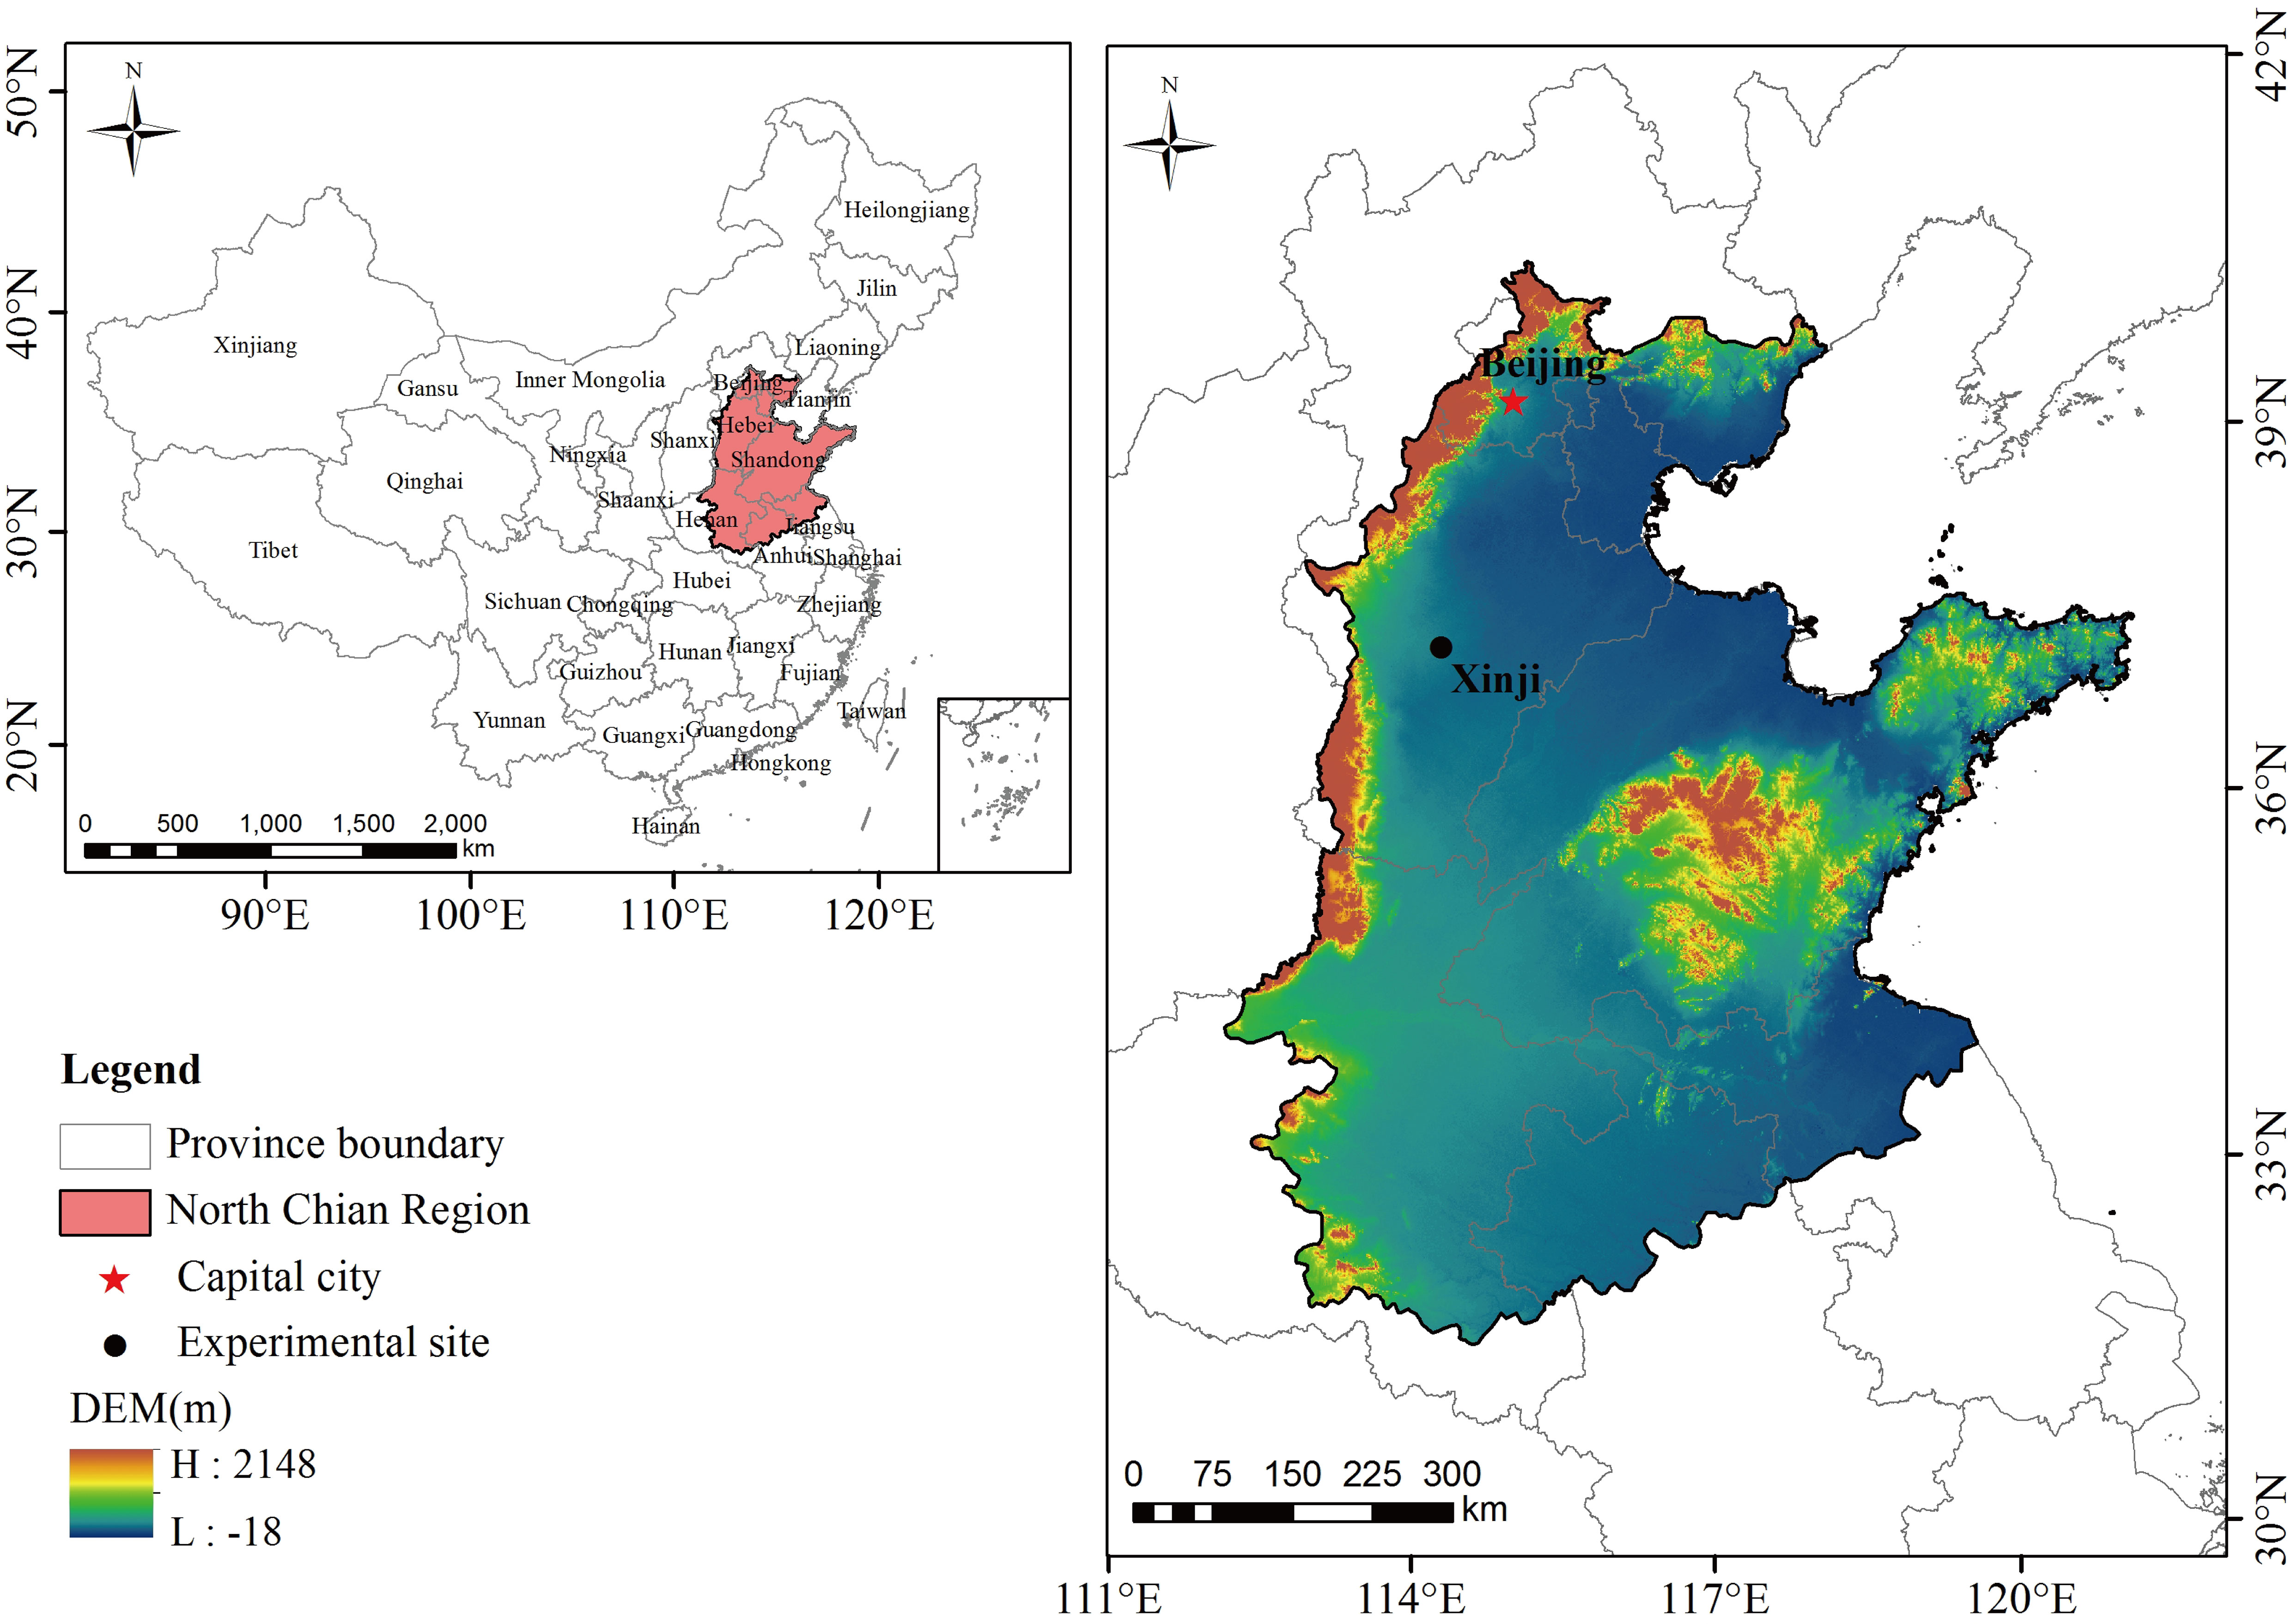
Figure 1 The geographic overview of the North China Plain and the experimental site.
The experiment included two drought treatment variables: normal irrigation (CK, two irrigations of 75 mm each at jointing and anthesis (a total of 150 mm)) and drought stress (DS, no irrigation during the spring) with 16 wheat cultivars (Table 1). The Hebei Agricultural University provided all plant materials. We measured 24 drought-tolerant traits in wheat (Table 2). The average rainfall during the wheat-growing season has been 124.5 mm, according to historical data recorded by our weather station for nearly 20 years, while the average rainfall for the 2019–2020 and 2020–2021 wheat-growing seasons was 176.2 mm and 103.4 mm, respectively. Figure 2 depicts the daily temperature and precipitation for 2019–2021. Three replicates for each treatment were arranged in a completely randomized block design. The size of the plot was 66 m2 (10 × 6.6 m), and the distance between rows was 15 cm. A total of 240 kg ha–1 of nitrogen, 105 kg ha–1 of phosphorus, and 120 kg ha–1 of potassium fertilizers were applied before planting. No spring topdressing was done during the wheat-growing season. All plots were handled in compliance with prevailing local management standards.
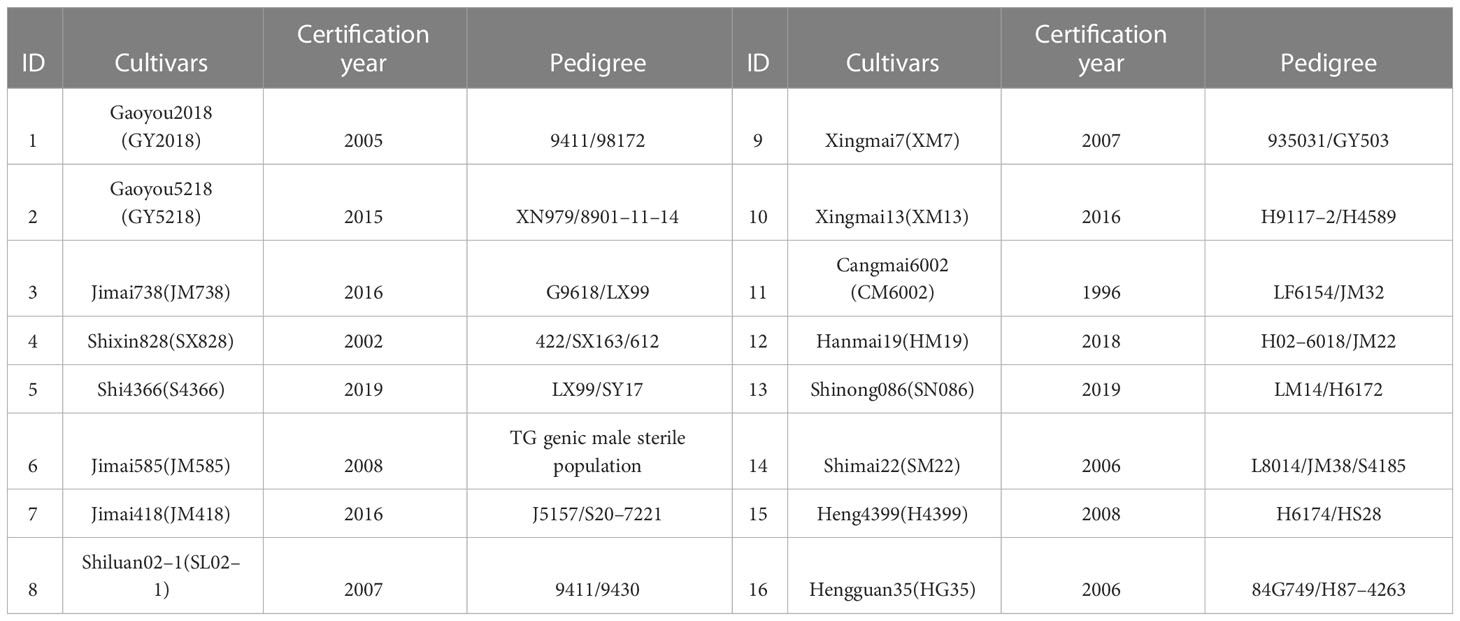
Table 1 Names and sources of different wheat cultivars used in this study.
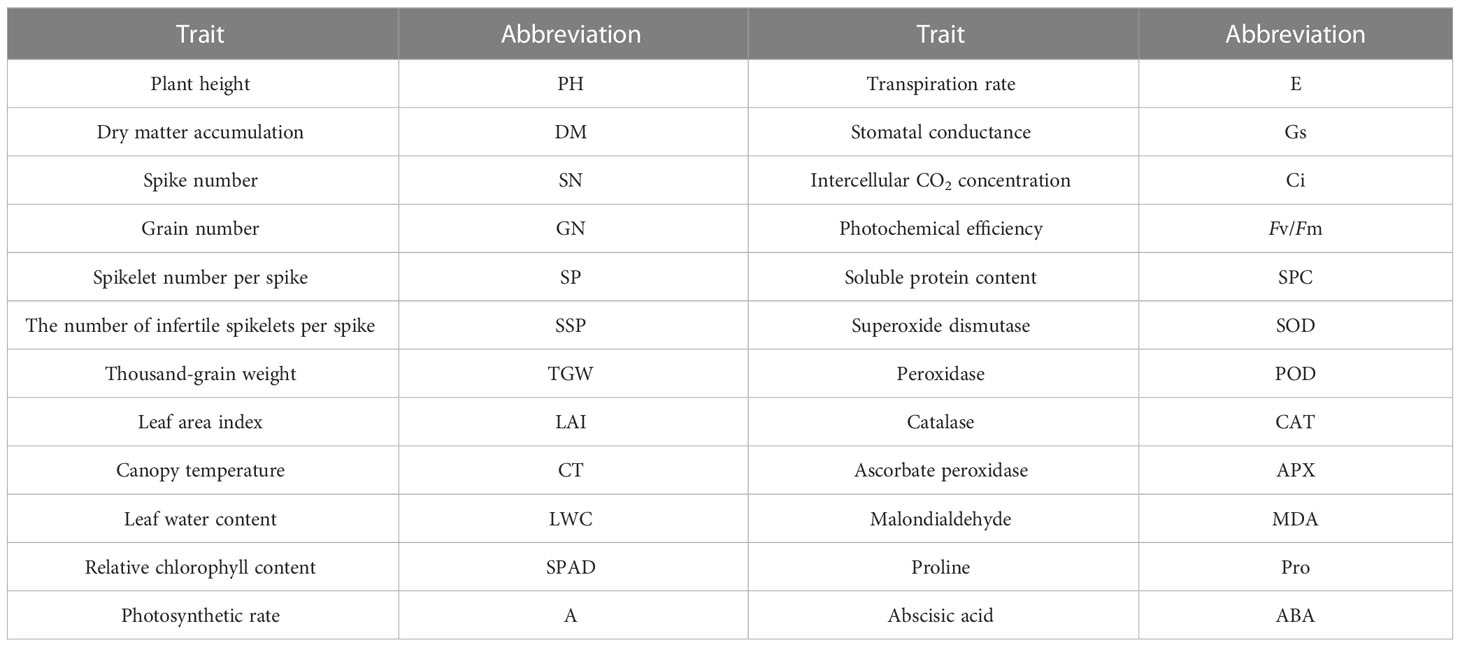
Table 2 Twenty-four drought tolerance traits and their abbreviations.
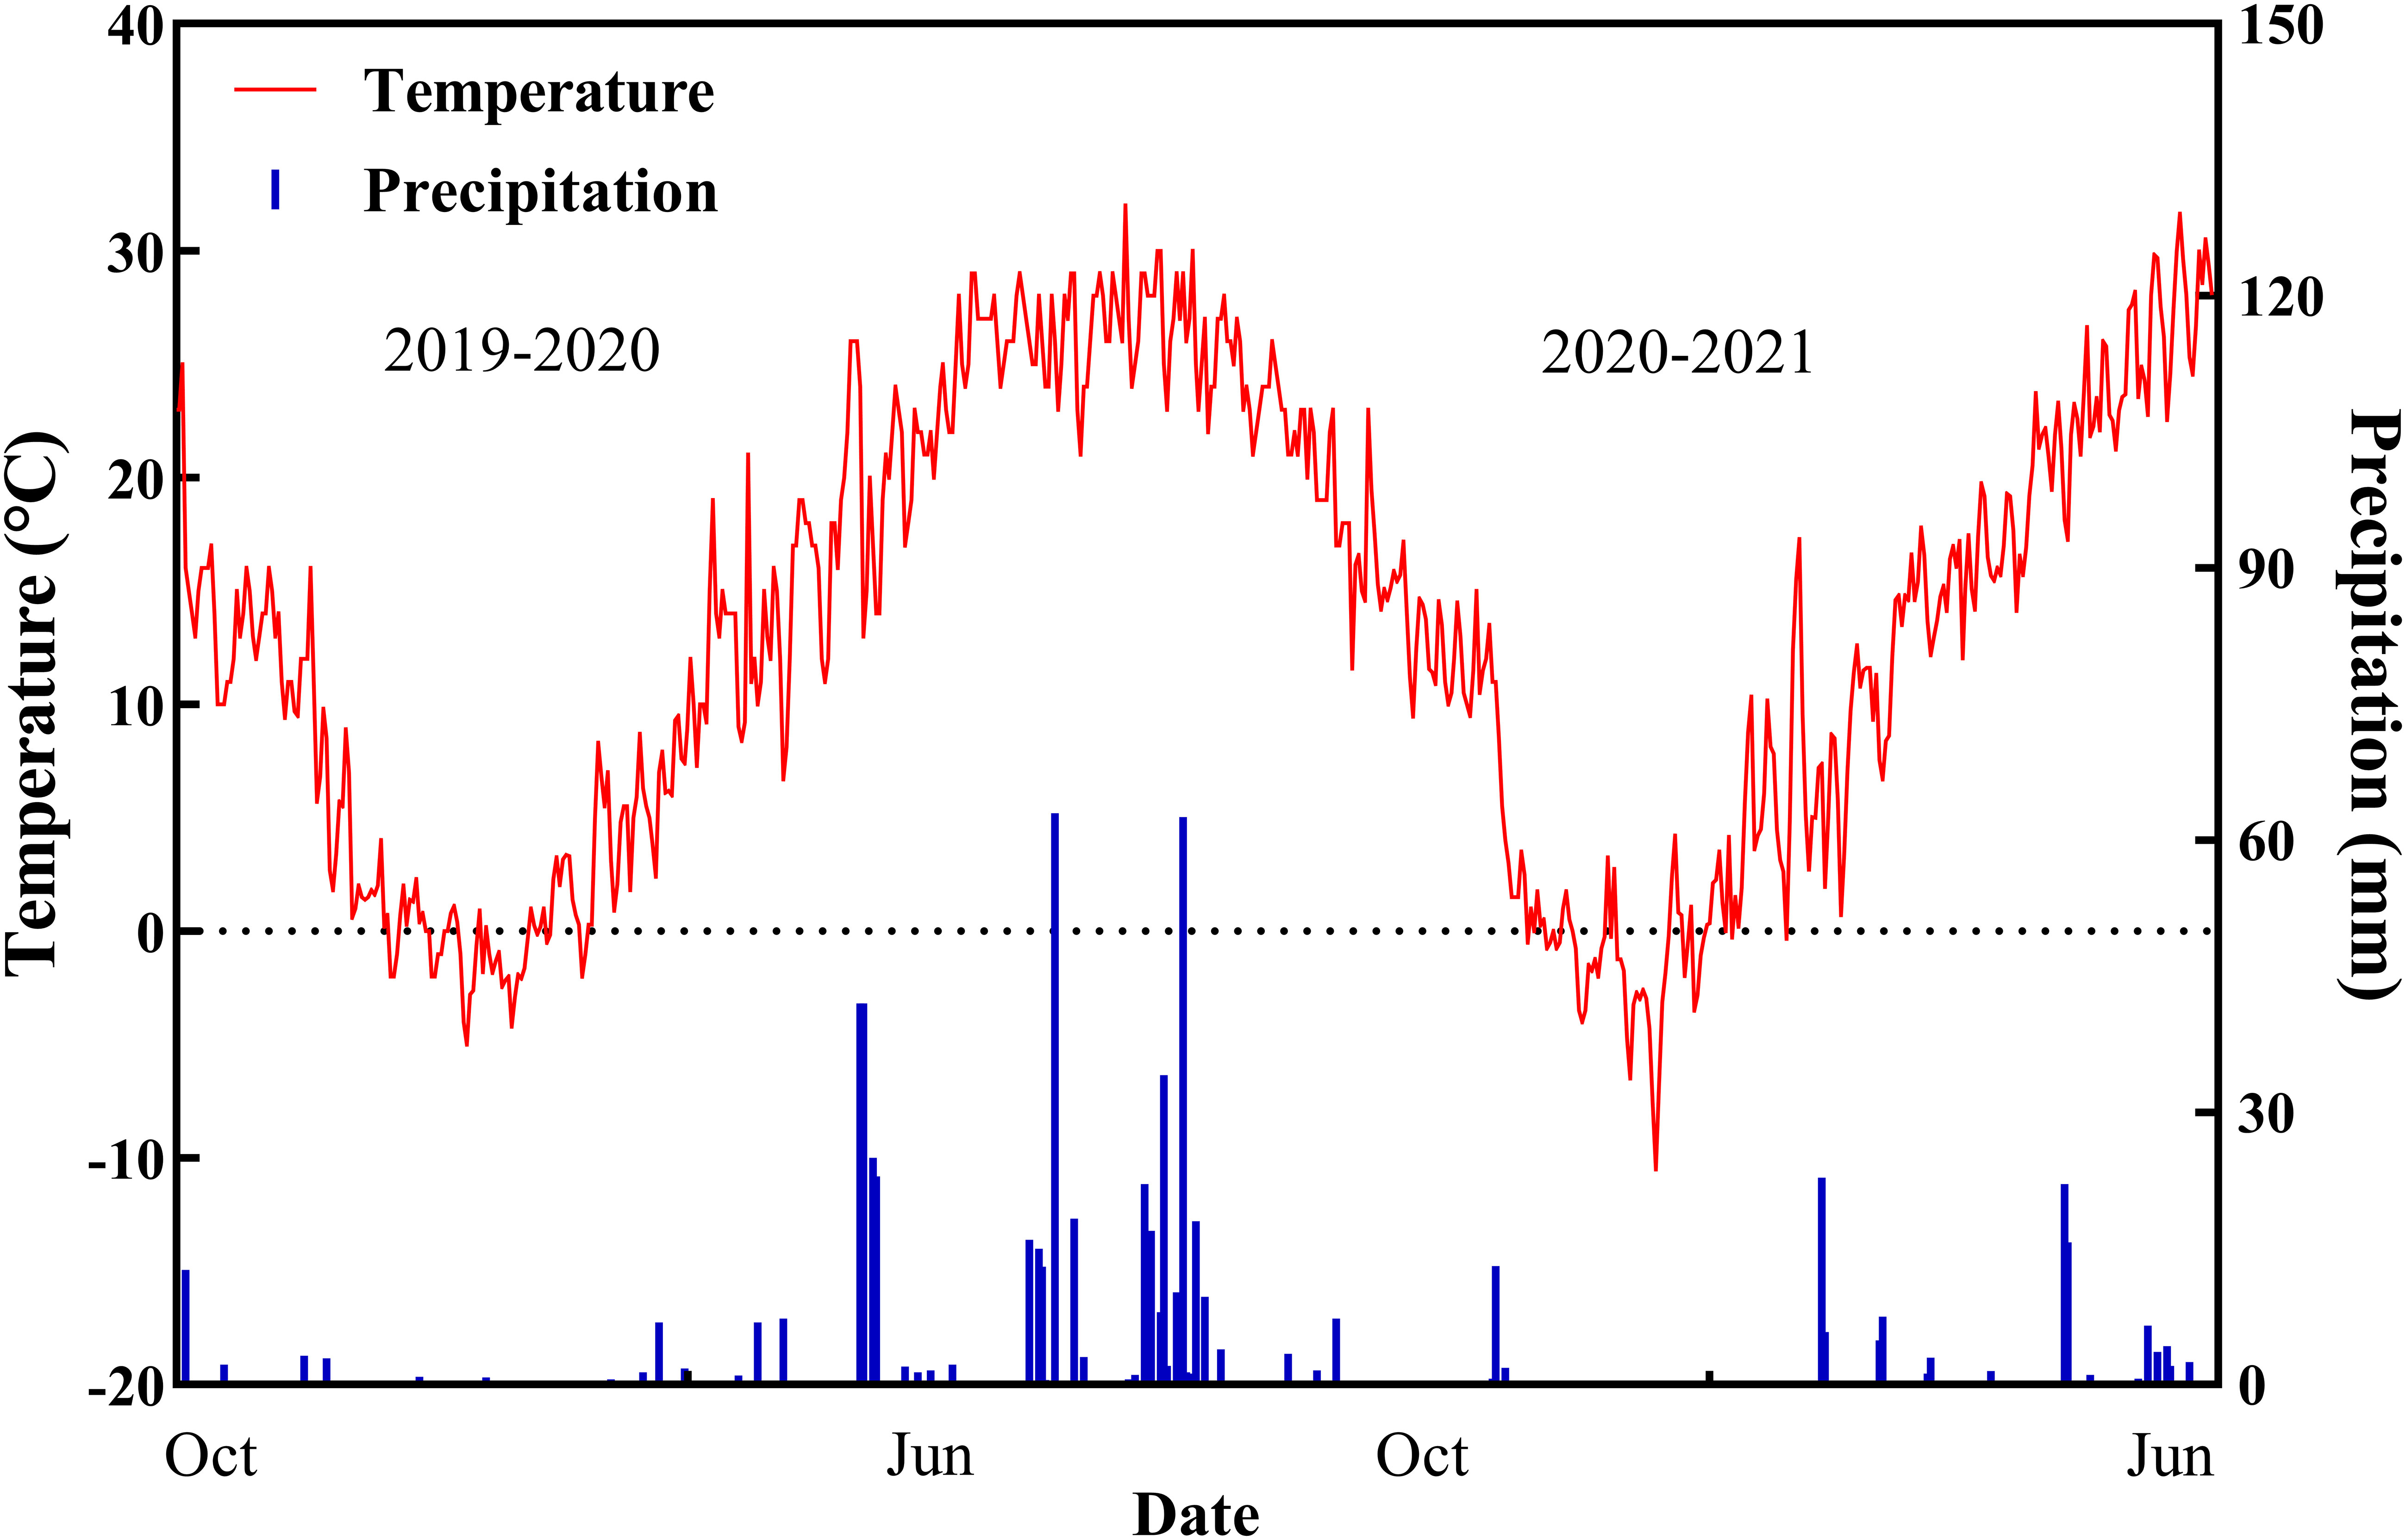
Figure 2 Precipitation and temperature values during the two growing seasons of wheat.
At 10 days after anthesis, 20 wheat plants were randomly selected from each plot. The plant height (PH, cm), leaf length (L, cm), and maximum leaf width (W, cm) were measured using a ruler. Leaf area was calculated as follows: . Then the leaf area index (LAI) was calculated as follows : where N is the number of wheat plants per field area and S is the unit area of the field. Canopy temperature (CT) was measured at noon with a hand-held thermal infrared instrument (FLIR Integrated Imaging Solutions Inc., Canada), with a field of view (FOV) of 25°×20° and a resolution of 320 × 240. Seven days before harvest, plants in 1.2 m2 from each plot with three replicates were randomly selected and investigated to determine the spike number (SN). After sampling, the total number of spikelets per spike (SP), the number of infertile spikelets per spike (SSP), and the number of grains per spike (GN) were investigated. Plants with an area of 0.15 m2 at ground level were sampled at physiological maturity and oven-dried to a constant weight to determine dry matter accumulation (DMM). Meanwhile, the wheat plants were harvested manually from the plot with a field area of 2 m2 (avoiding boundary rows) with three replicates and threshed. The water content was converted to a standard water content of 13% to determine the thousand-grain weight (TGW) and grain yield.
The chlorophyll content (SPAD) was measured in 10 flag leaves per plot 10 days after anthesis using a SPAD-502 Minolta chlorophyll meter (Spectrum Technologies, Plainfield, IL, USA). Three points were taken evenly per leaf, and three readings were averaged. As one biological replicate, we take 10 independent flag leaves. At each time point, three biological replicates were collected. All of the samples were immediately frozen in liquid nitrogen and kept at −80°C. The superoxide dismutase(SOD) activity was determined using the nitro-blue tetrazolium (NBT) photoreduction method, while the catalase(CAT) activity was determined spectrophotometrically at 240 nm (Giannopolitis and Ries, 1977). The guaiacol chromogenic method was used to determine the peroxidase (POD) activity (Han et al., 2008). The malondialdehyde (MDA) contents were determined by thiobarbituric acid and sulfosalicylic acid dihydrate methods (Hodges et al., 1999). Soluble protein content (SPC) was determined by the Coomassie brilliant blue method (Campion et al., 2011). The ascorbate peroxidase(APX) activity was determined using the method of Madhusudhan (2003) (Madhusudhan et al., 2003). The proline(Pro) content was quantified using the ninhydrin colorimetric method (Magne and Larher, 1992). Abscisic acid (ABA) was determined by high-performance liquid chromatography (Benech Arnold et al., 1991).
The LI-6800 Portable Photosynthesis System (Li-cor, Lincoln, NE, USA) was used to measure leaf gas exchange 10 days after anthesis. The leaf chamber was maintained under control, with a reference CO2 concentration of 400 µ mol mol−1, a leaf temperature of 25 °C, a saturated photosynthetic photon flux density (PPFD) of 1000 µ mol m–2 s−1, and a relative humidity of 60%-70%. In the morning, at 09:00–11:00, gas exchange was measured three times in the flag leaves with the same size and orientation in plants from each plot. Net photosynthetic rate (A), stomatal conductance (Gs), transpiration rate (Tr), and intercellular CO2 concentration (Ci) were measured. A portable FMS-2 chlorophyll fluorometer (Hansatech, King’s Lynn, UK) was used to measure the chlorophyll fluorescence parameter Fv/Fm in flag leaves at 0:00–2:00.
is the drought-tolerant coefficient, whereas and are the trait values for cultivars evaluated under drought stress (DS) and normal irrigation (CK) conditions, respectively. is the membership function value of drought tolerance based on the trait of genotypes, while is the composite indicator, and and are the maximum and minimum values of the composite index, respectively. is the weight of the comprehensive index, and is the variance contribution rate of the comprehensive index. The membership function value of the comprehensive index of each wheat variety was calculated by the formula (2). The contribution rate of each comprehensive index was used to calculate the weight of principal components, and the index weight and membership function value were used to calculate the comprehensive evaluation value of drought resistance (D value). The D value is the comprehensive evaluation value of each genotype’s drought resistance, as determined by a comprehensive evaluation of the index of various wheat cultivars under drought stress.
Where is the grey correlation coefficient and is the grey relational degree. In the formula, is the absolute difference between the two sequences at time . and are the minimum and maximum values of the absolute difference between all compared sequences at each time; ; and the resolution coefficient .
Twenty-four traits were used for analysis. Data were summarized and analyzed using Excel 2016 (Microsoft, Redmond, WA, USA), with measurements for each trait corresponding to three independent replicates. SPSS 21.0 (SPSS Inc., Chicago, IL, USA) was used to analyze variance, principal component analysis, and stepwise regression analysis. The images were drawn using ArcGIS 10.2, Origin 2021 (OriginLab Corporation, Northampton, MA, USA), and GraphPad Prism 9.0 (GraphPad Software, Inc., San Diego, CA, USA).
Figure 3 depicts the yield performance of 16 wheat cultivars in two growing seasons under normal irrigation (CK) and drought stress (DS) conditions. There were significant yield differences between irrigation treatments and cultivars, which were more noticeable in 2019–2020 (Figure 3A) than in 2020–2021. (Figure 3B). During the two wheat-growing seasons, HM19, JM585, JM418, and SN086 showed a higher average yield (9492.6–9887.5 kg ha–1) under CK, while GY5218 and SL02–1 showed a lower average yield (8083.8–8309.1 kg ha–1). Under DS conditions, JM418, CM6002, and H4399 all had higher average yields (5807.95–6032.7 kg ha–1), while SX828, SL02–1, and XM7 had lower average yields (4009.75–4367.3 kg ha–1). Compared with CK, CM6002, SM22, JM418, and HG35 had the lowest average decrease (by 33.5%) under DS within two years, while XM7 and SX828 showed the biggest declines in production (53.6% and 52%, respectively).
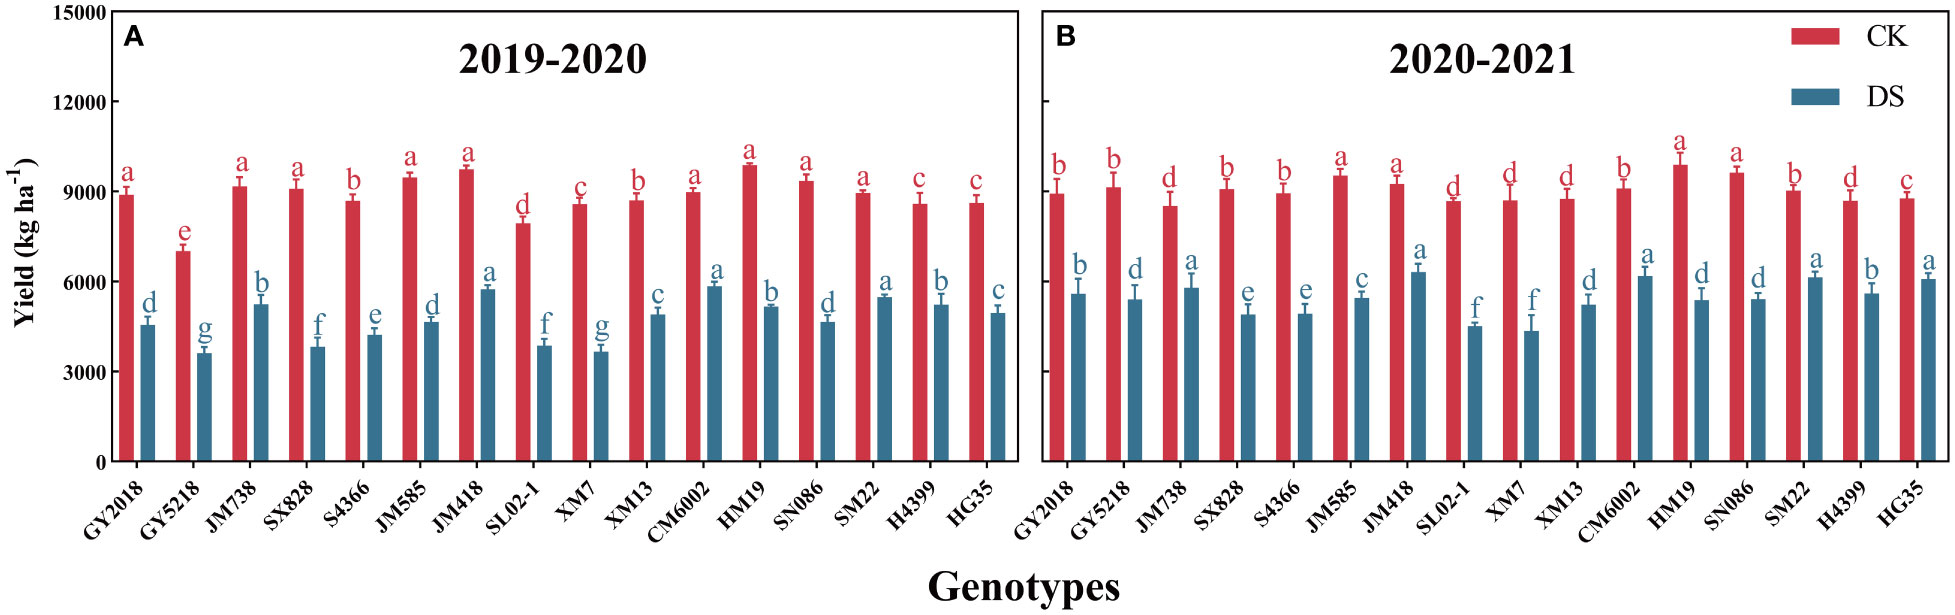
Figure 3 Yield of 16 wheat cultivars grown under CK and DS conditions during 2019-2020 (A) and 2020-2021 (B); Data are represented as mean ±SD (n = 3). Different lowercase letters on columns indicate significant differences between the means of the same irrigation treatments 5% level by LSD test.
To determine the effect of drought on different wheat cultivars, we investigated 24 morphological traits, photosynthetic traits, physiological indices, and yield component parameters related to drought tolerance in wheat after anthesis and at maturity for two consecutive years (Table 3). Figure 4 depicts the growth of wheat in the field under various treatments. The findings revealed that all traits varied with irrigation supply. (P≤0.05). SSP, CT, SPC, MDA, Pro, and ABA in the DS treatment had significantly higher values than those in the CK treatments (Drought resistance coefficient>1). However, the mean values of the other 18 traits for the DS treatment were lower than those under CK (Drought resistance coefficient<1). The degree of decline in treatments from CK to DS also differed in the two growing seasons. The average coefficient of variation (CV) for the measured traits was 6.4 under CK but 9.0 under DS. The average drought tolerant coefficient of the two wheat-growing seasons ranged from 0.43 to 2.02, and the CV ranged from 0.66% to 19.62%. The range of variation for every single trait was different. Therefore, the drought tolerance of wheat was evaluated by the drought-tolerant coefficient of different characters, and the results were different.
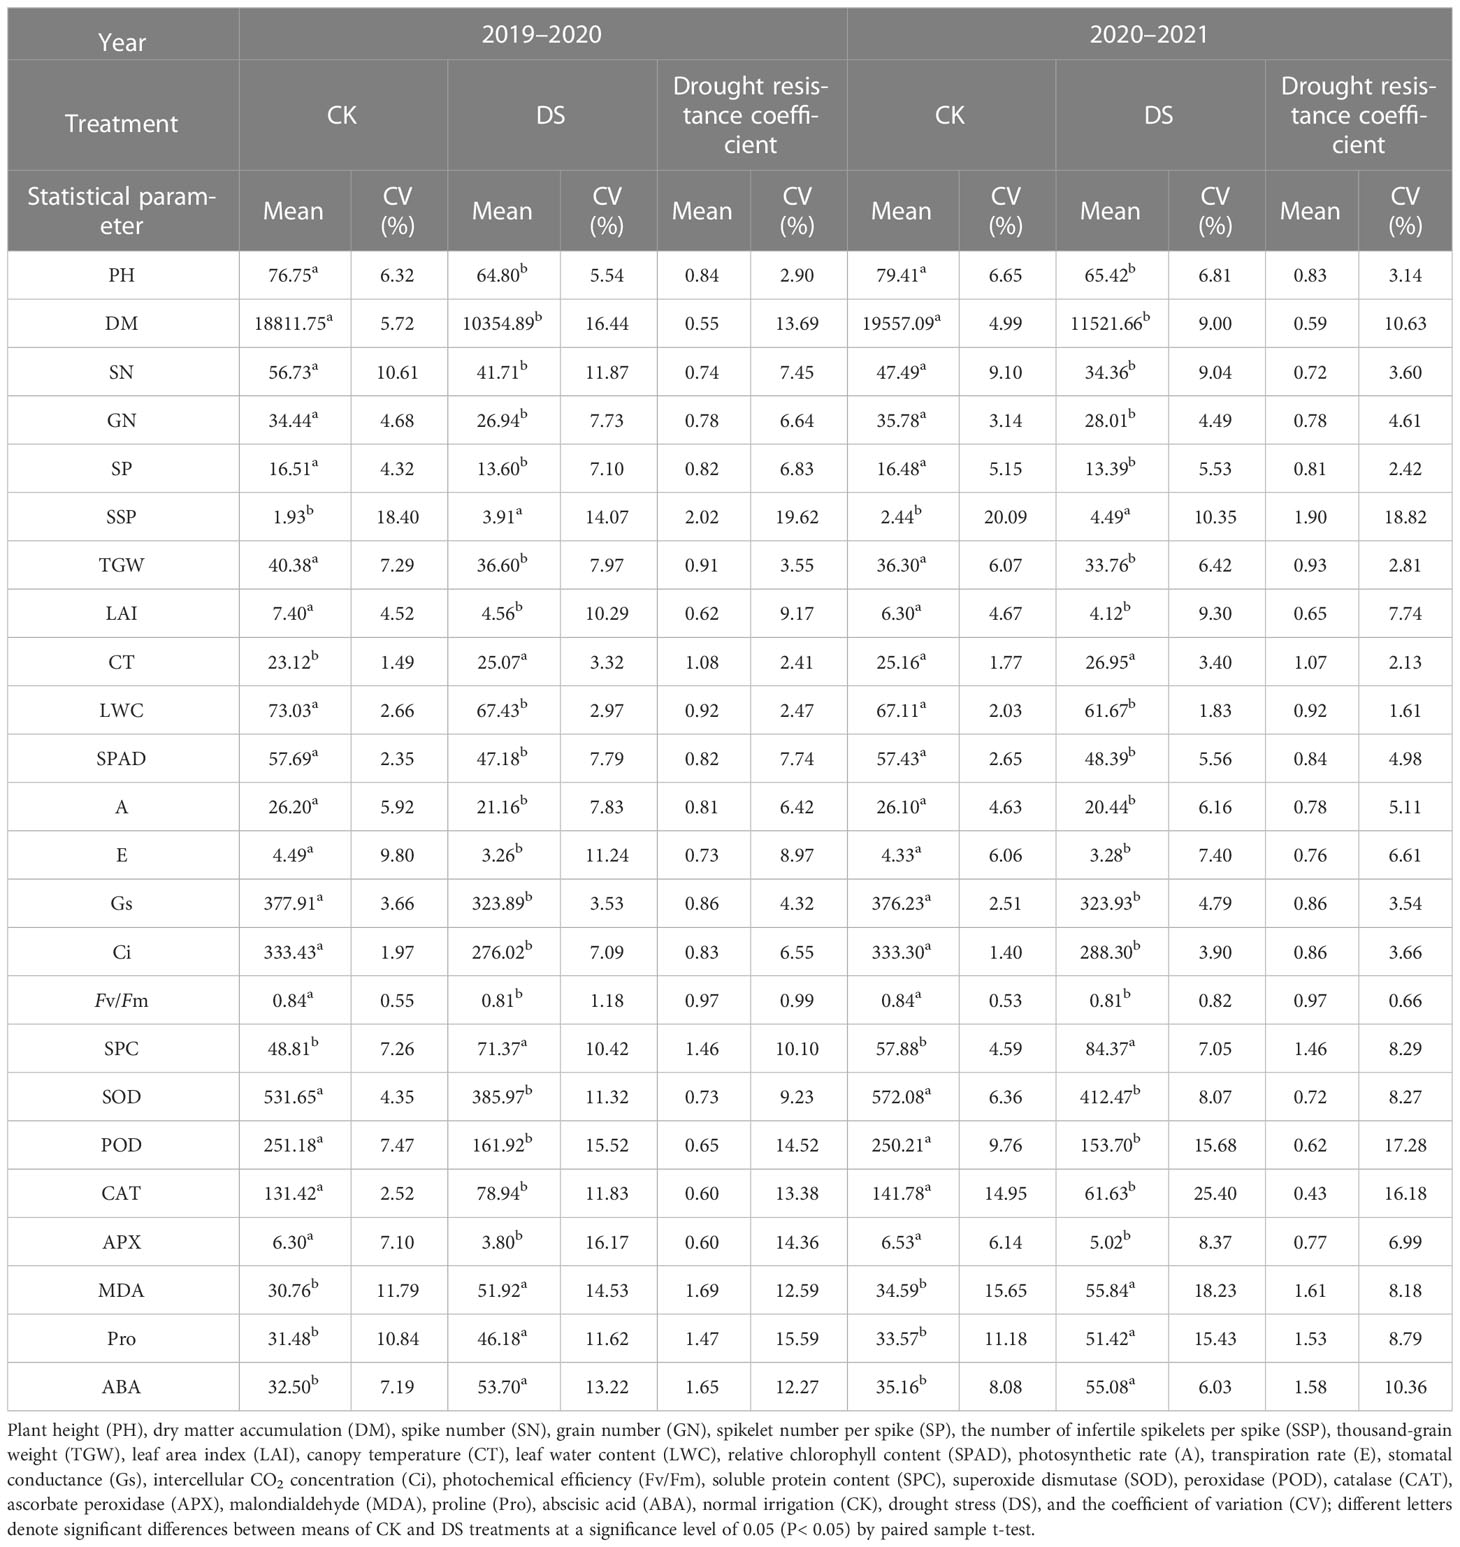
Table 3 Descriptive statistics of the various traits investigated under normal (CK) and drought stress (DS) conditions in 2 growing seasons of wheat.
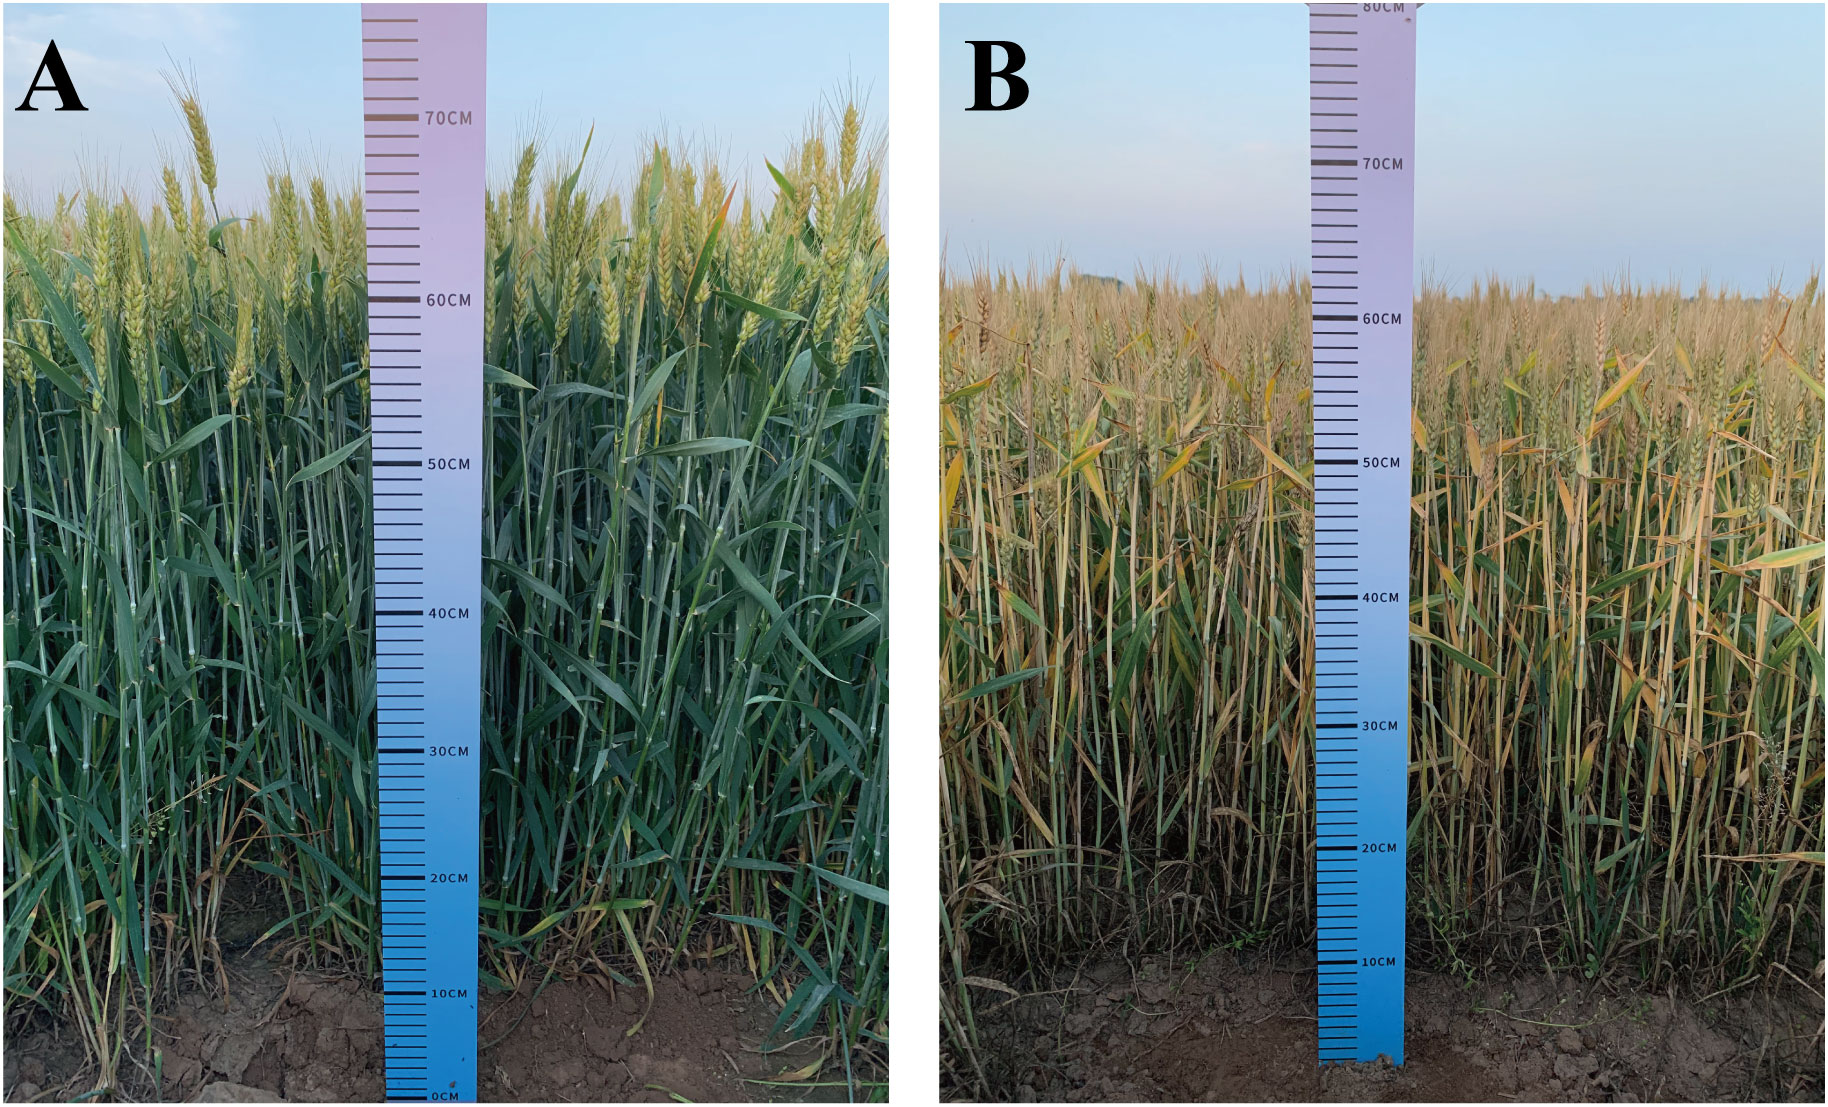
Figure 4 The growth of winter wheat in the field under normal irrigation (A) and drought stress (B).
Wheat traits were divided into two clusters using the clustering analysis of cultivars based on the drought-tolerant coefficient for two years (Figure 5). Cluster-1(C1) and Cluster-2(C2) comprised 8 and 16 traits, respectively, during the two wheat-growing seasons, and the highly correlated traits were assembled into a population. During 2019–2020, PH, SP, SSP, TGW, MDA, CT, ABA, and Pro were separated from the other parameters (Figure 5A). During 2020–2021, however, SP, CT, ABA, Pro, SPC, SSP, and TGW were separated from the other traits (Figure 5B). Based on the drought-tolerant coefficient of each trait, 16 wheat cultivars were included in group-1(G1) and group-2(G2), and cultivars in the same group showed similar drought tolerance. In two years, HM19, SM22, JM418, JM515, HG35, H4399, and JM738 were divided into a same group, while SX828, SN086, SL02–1, XM7, S4366, and GY5218 formed another group. The drought-tolerant coefficients of different traits in the same cluster and drought tolerance among cultivars showed similarity, proving that this grouping method was representative.
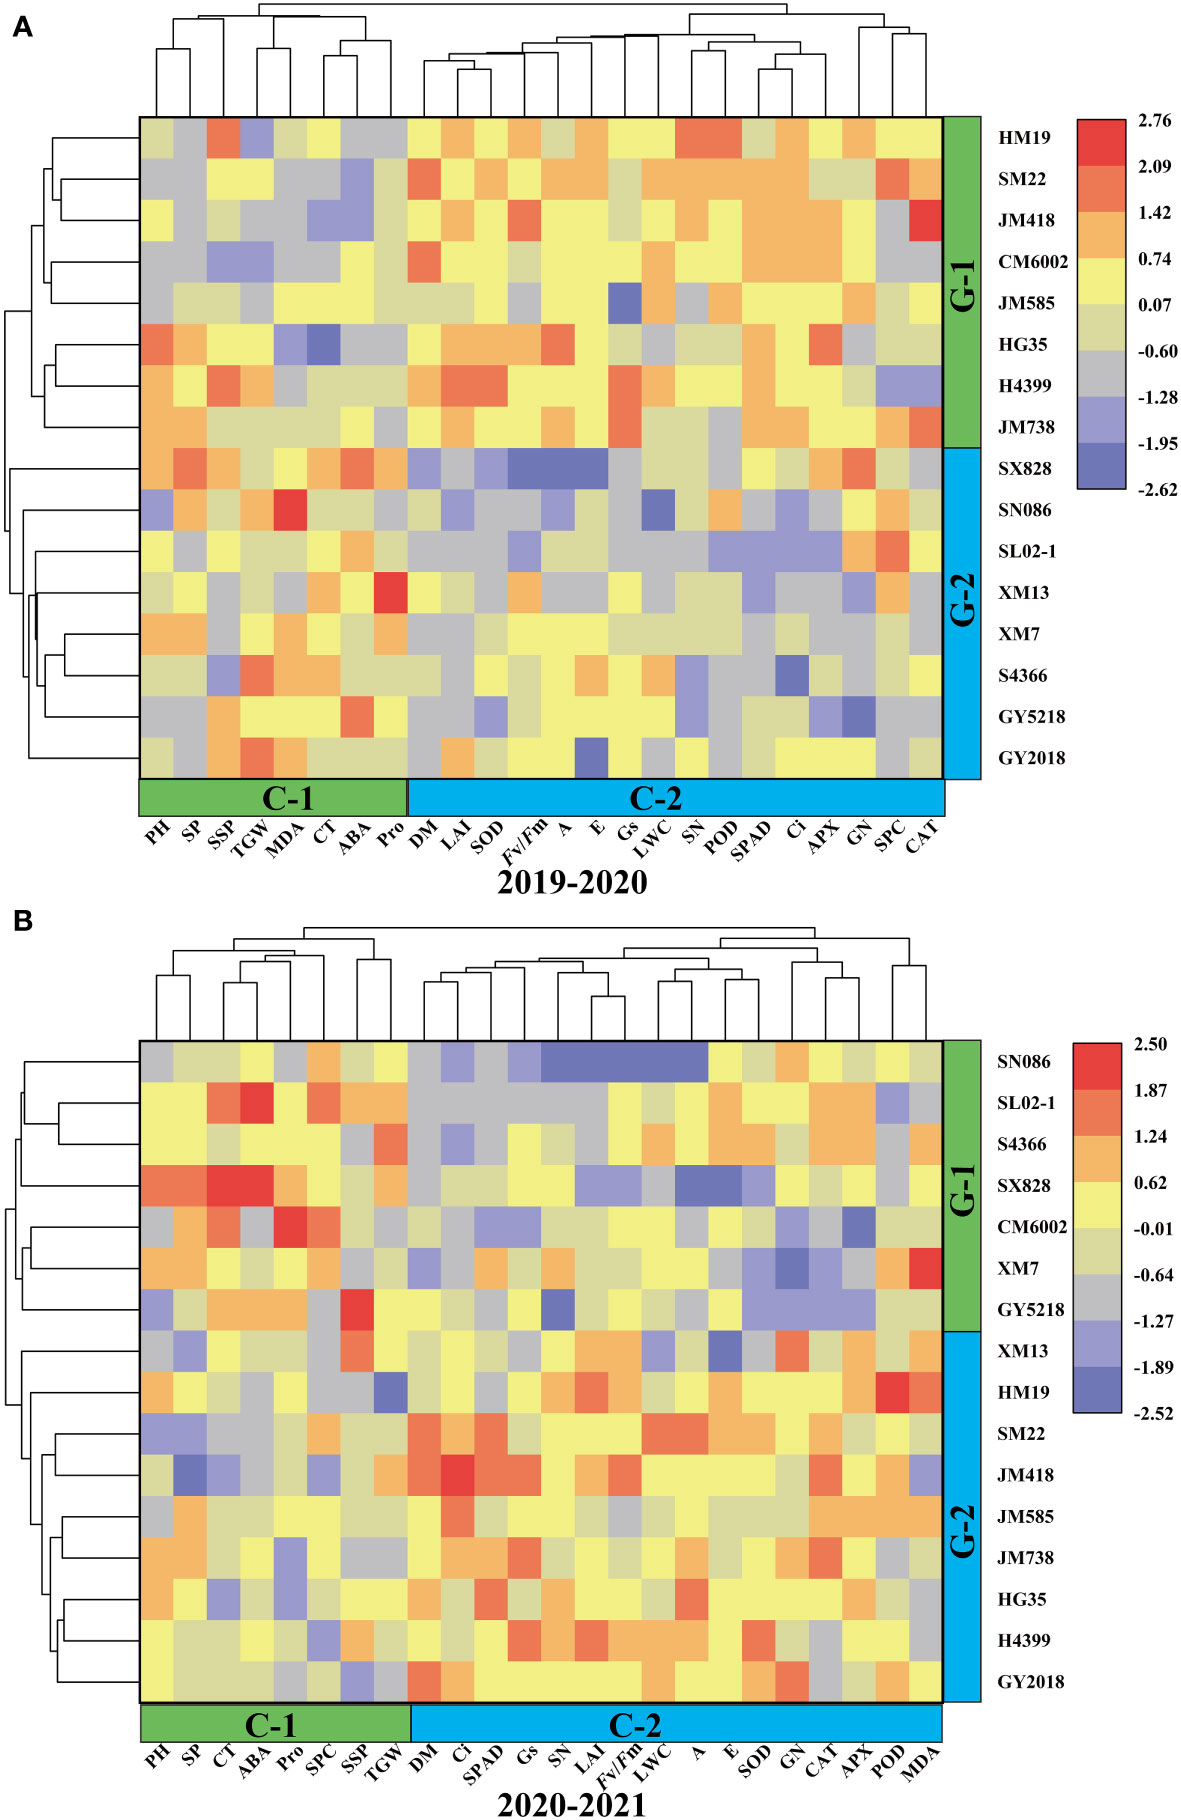
Figure 5 Hierarchical clustering and heatmaps based on correlationsbetween drought tolerant coefficients for 16 wheat cultivars and 24 different traits during 2019–2020 (A) and 2020–2021 (B).
Spearman’s correlation analysis revealed that the correlation between traits was similar in two years (Figure 6). LAI was correlated positively with SN and Fv/Fm. CT was positively correlated with ABA but negatively with DM, SPAD, and A. SOD was correlated positively with A and E. The correlation between these traits also indicates the overlap of information shared by them. These findings demonstrated that drought tolerance in wheat is a complex trait, and evaluating drought resistance in wheat based on a single trait is insufficient. Therefore, it is necessary to use the multivariate statistical method for further analysis with multiple indicators.
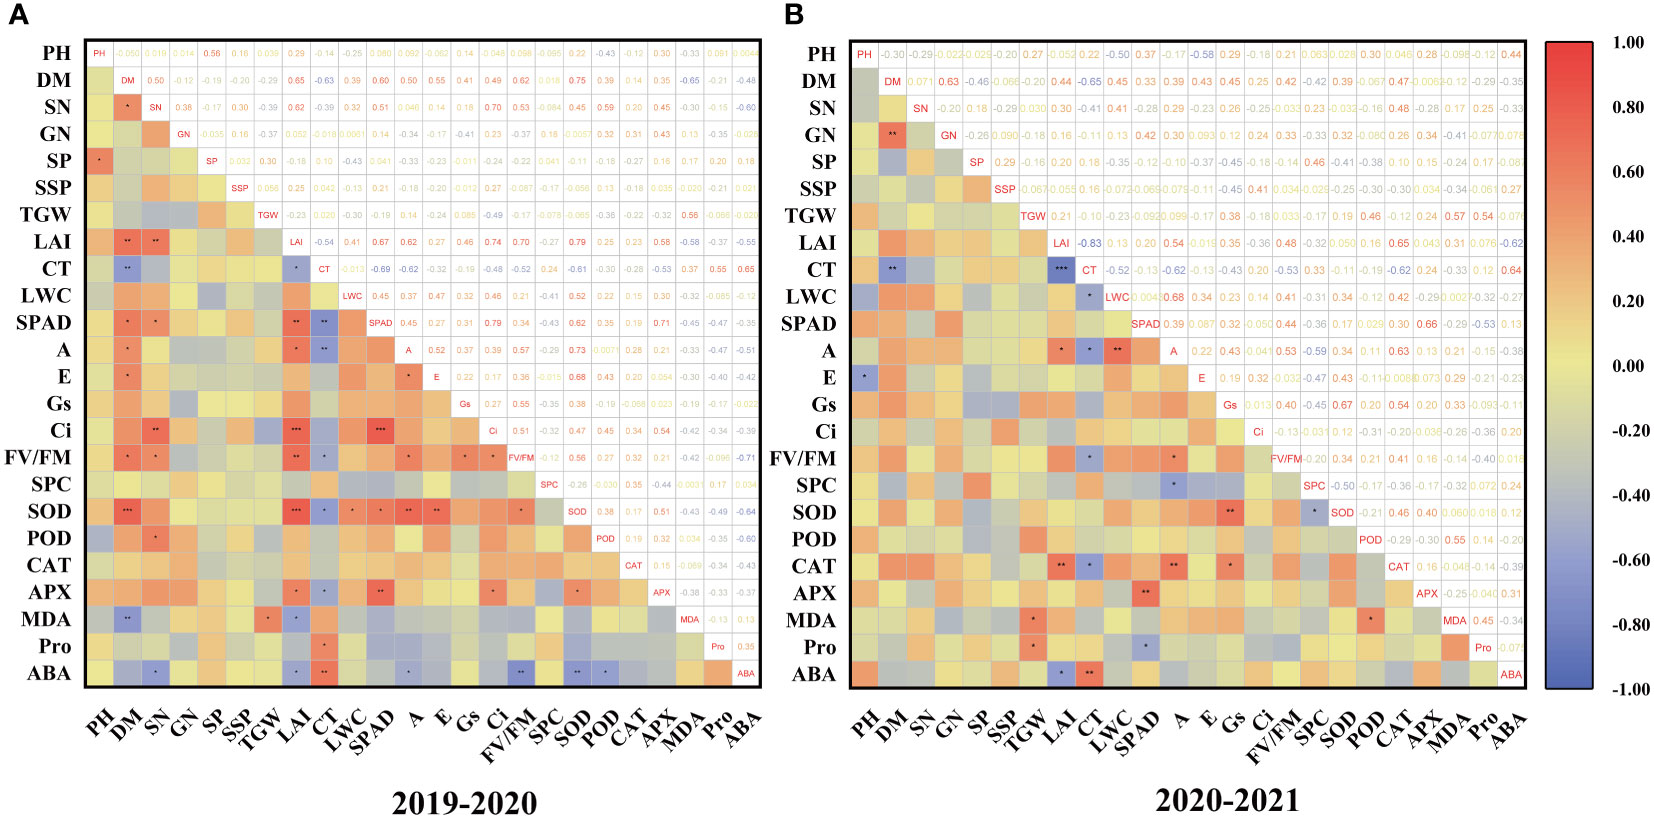
Figure 6 Distribution and correlation among drought tolerant coefficient of each character of wheat cultivars during 2019–2020 (A) and 2020–2021 (B); *, **, and *** show significant differences between means of different treatment groups at 0.05, 0.01, and 0.001 significance levels, respectively.
Further PCA of the drought tolerant coefficient of 24 tested traits showed that seven principal components were extracted in the two growing seasons (Tables 4, 5). From 2019 to 2020, the variance contribution rates of CI comprehensive indices (from CI1 to CI7) were 34.20%, 11.80%, 10.24%, 8.25%, 7.29%, 5.74%, and 4.94%, respectively. The cumulative contribution rate was 82.44%. From 2020 to 2021, however, the variance contribution rates of CI1 to CI7 were 31.79%, 12.88%, 11.58%, 10.38%, 8.15%, 5.53%, and 4.36%, respectively, with the cumulative contribution rate of 84.65%. The original 24 single traits could be converted into 7 new independent comprehensive indices, which can cover most of the information. In both wheat-growing seasons, the first factors contributed more than 30%. From 2019 to 2020, the load coefficients of POD, CT, A, SOD, and SPAD were large. However, from 2020 to 2021, the load coefficients of SPAD, CT, A, Pro, and Ci were large. These traits mainly reflect the information regarding stress tolerance, canopy parameters, and photosynthetic physiological parameters of winter wheat. PCA could fully reflect the primary and secondary functions of indicators in wheat screened for drought tolerance to comprehensively evaluate the drought tolerance differences between different cultivars of wheat.
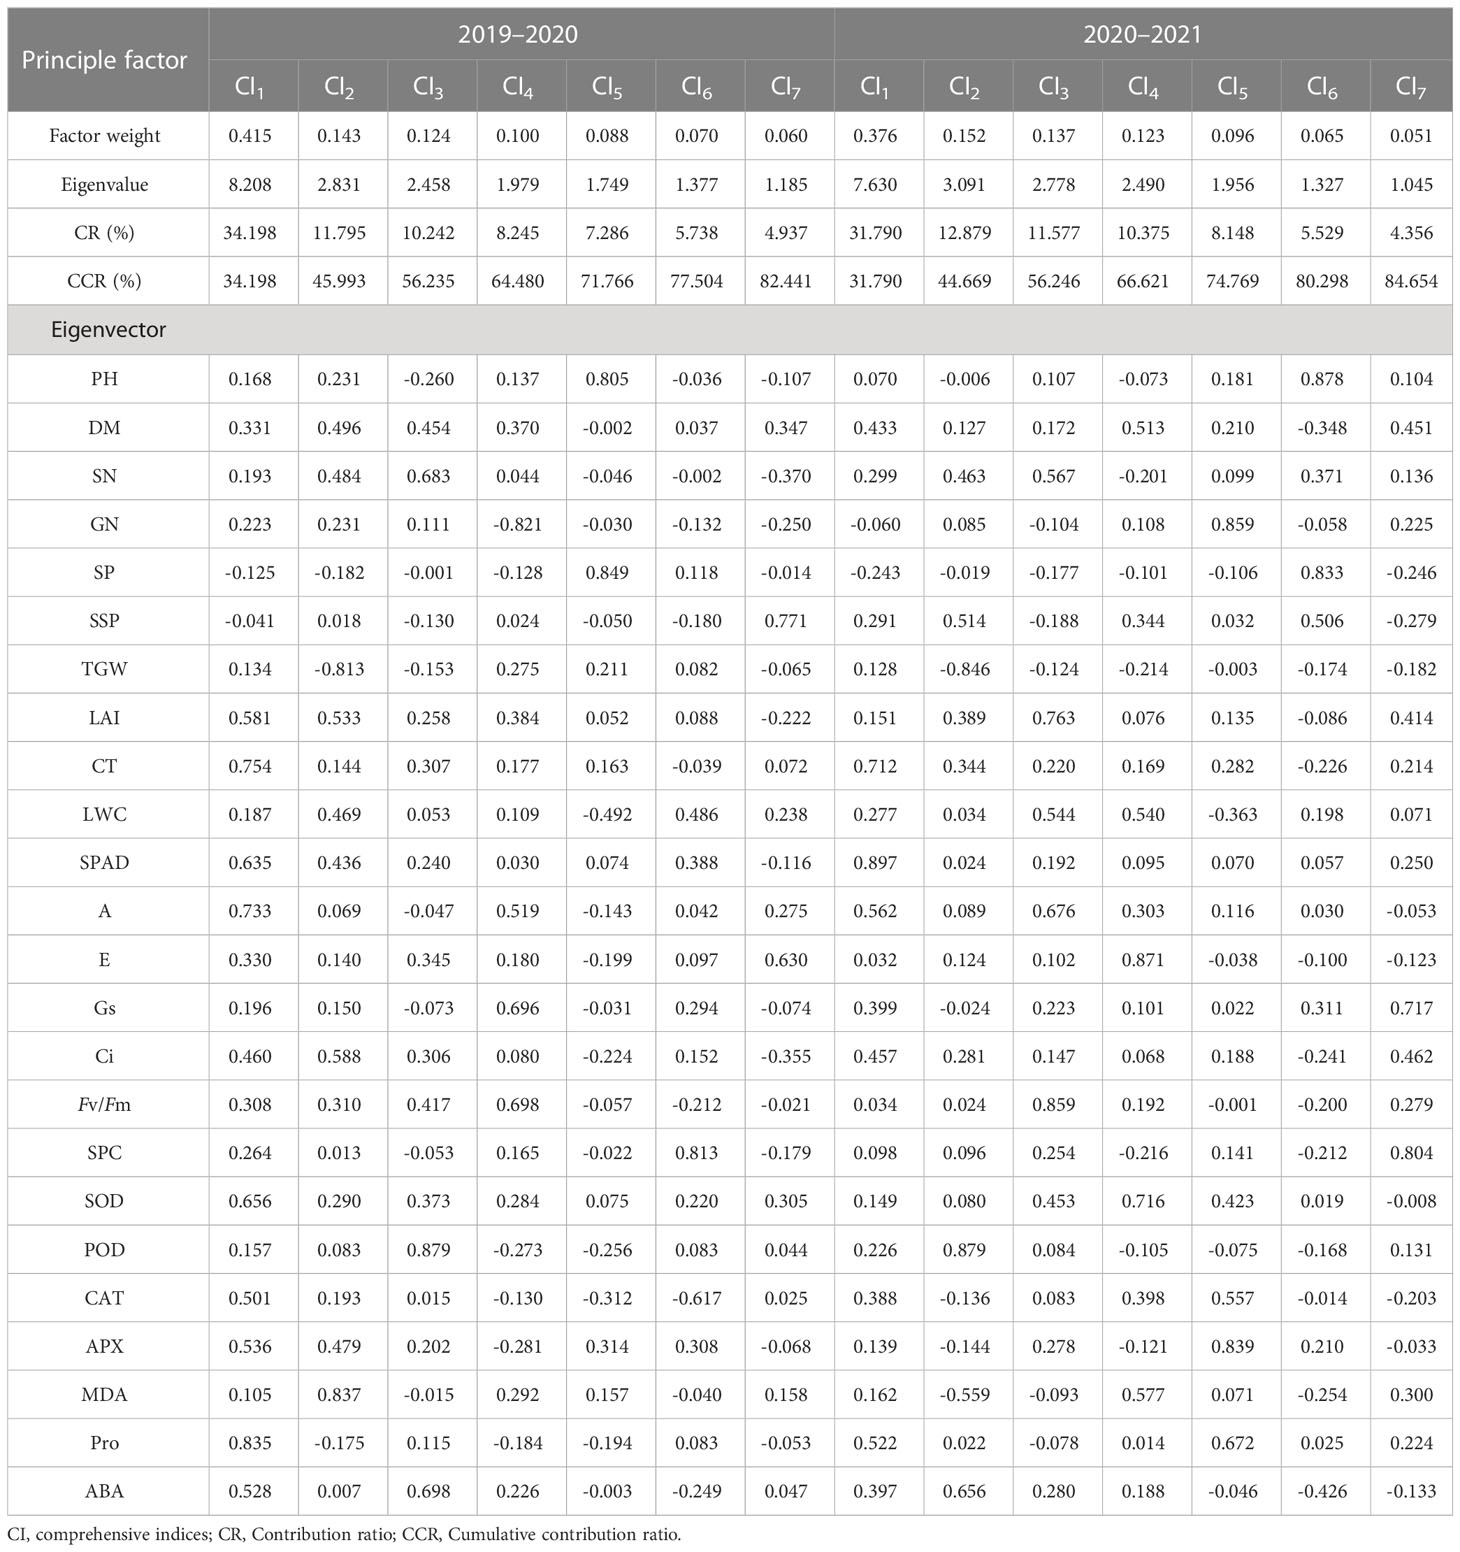
Table 4 Component matrix and the cumulative contribution rate of principal components during 2019–2020 and 2020–2021.
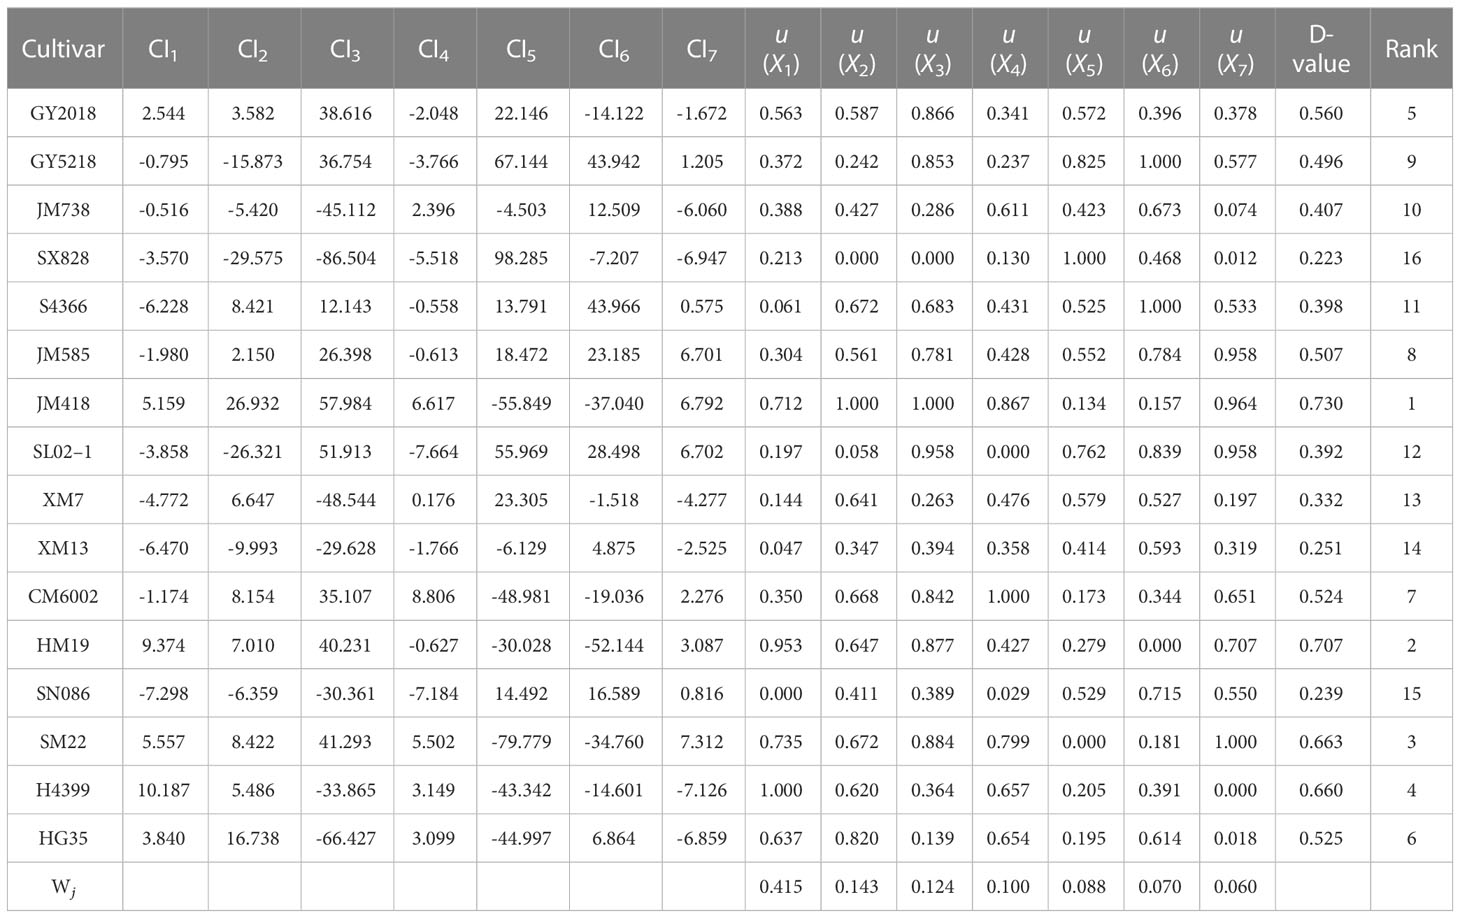
Table 5 The evaluation of drought tolerance, comprehensive indices, and D value of different wheat cultivars during 2019–2020.
In this experiment, 24 traits were evaluated by PCA under two moisture conditions, and the biplot showed the distribution of 16 wheat cultivars along the axes for factor 1 and factor 2 in each corner of the scatter plot. The contribution rate of the first two principal components was 41.6% under the CK treatment (Figure 7A), with PC 1 explaining 26.3% and PC 2 explaining 15.4% of the total variation. Vectors that were parallel or close to each other showed a strong positive correlation between traits. In contrast, vectors that were in opposite directions (at 180°) showed a high negative correlation, and vectors that were laterally oriented showed a weak correlation. PC1 was mostly represented by CT, SPC, LAI, and LWC, while PC2 was mostly represented by MDA, POD, A, and Fv/Fm. Under the DS treatment (Figure 7B), however, the contribution rate of the first two principal components was 52.0%, of which PC 1 explained 32.5% but PC 2 explained 19.5%. PC1 was characterized by LAI, A, and Fv/Fm, while PC2 was mainly characterized by LWC and APX. To evaluate the difference in drought resistance among 16 wheat cultivars, PCA could fully reflect the primary and secondary effects of indices screened for wheat drought resistance. In general, the PCA biplot could explain the relationship between each index and the contribution of each trait to the principal component under various moisture conditions.
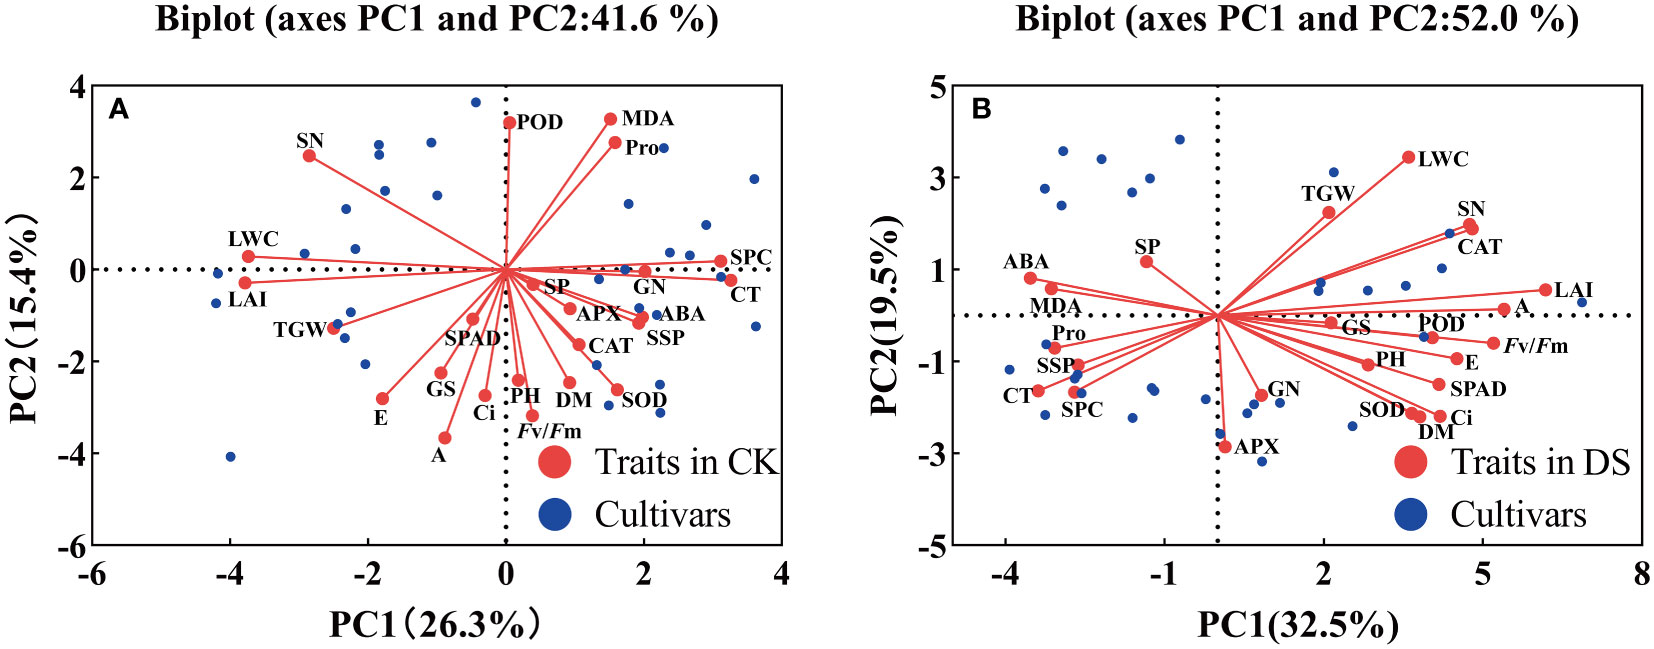
Figure 7 Biplot of 24 different traits of 16 wheat cultivars under CK (A) and DS (B) treatments.
According to formula (2), the membership function values of each comprehensive index for various cultivars were determined (Tables 6, 7). In the principal component, the higher the CI value, the stronger the drought resistance of the cultivar. In CI1, for example, H4399 had the highest u (X1) value (1.000) during 2019–2020, indicating that the cultivar had the highest significant drought resistance among CI1, whereas SN086 had the lowest µvalue (X1) (0.000), indicating the cultivar had the lowest drought resistance. JM418 had the highest u (X1) value in 2020–2021, while SX828 had the lowest. The weight of each comprehensive index was calculated using formula (3). From 2019 to 2020, the weights of the seven comprehensive indices (from CI1 to CI7) were 0.415, 0.143, 0.124, 0.100, 0.088, 0.070, and 0.060, respectively. From 2020 to 2021, however, the weights of these indices were 0.376, 0.152, 0.137, 0.123, 0.096, 0.065, and 0.051, respectively.
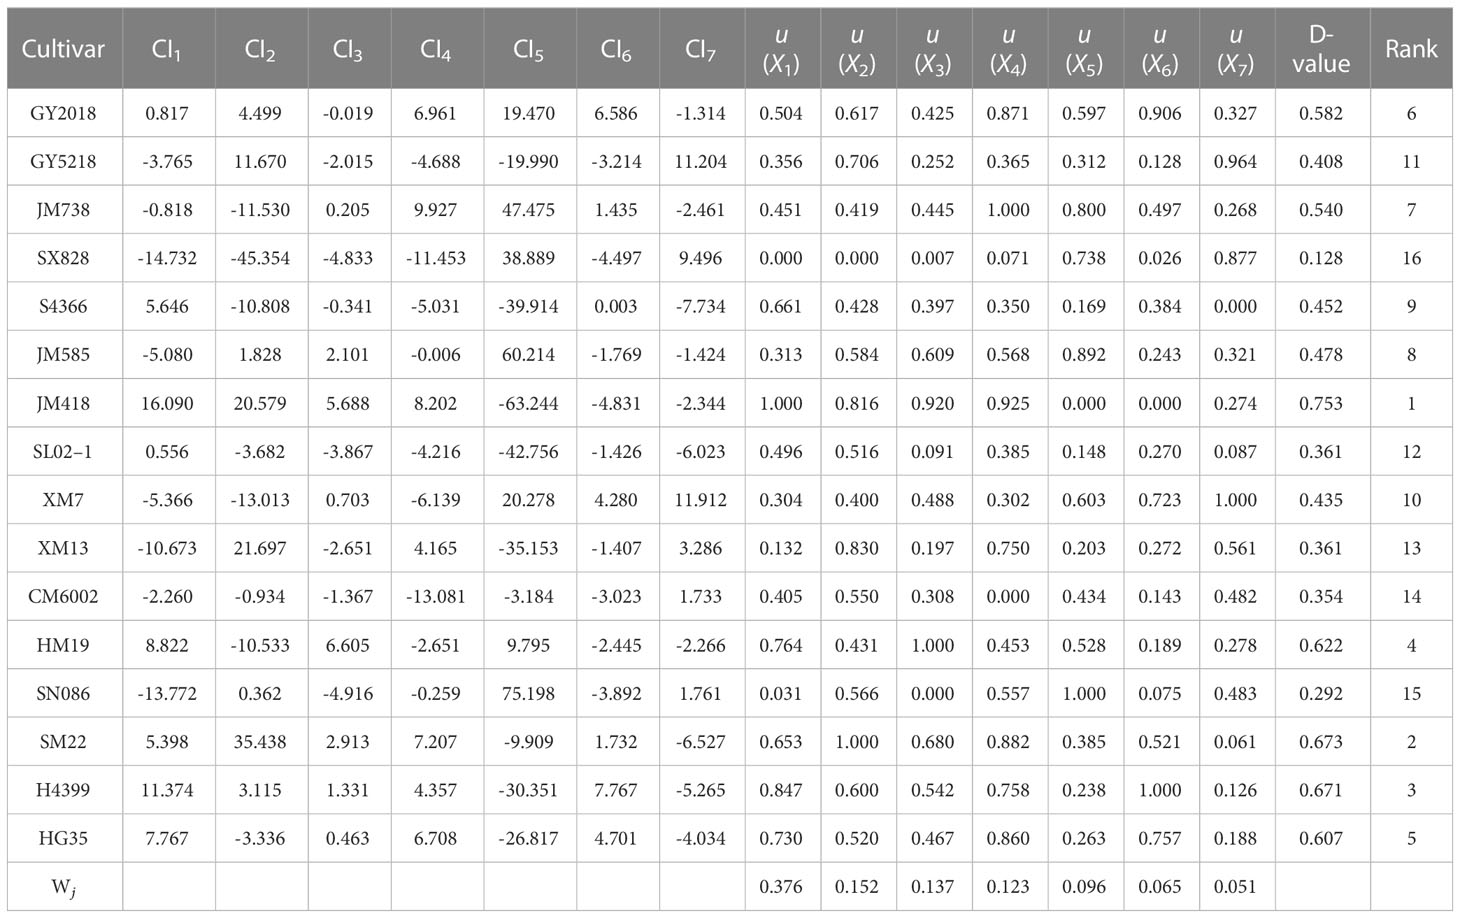
Table 6 The evaluation of drought tolerance, comprehensive indices, and D value of different wheat cultivars during 2020–2021.
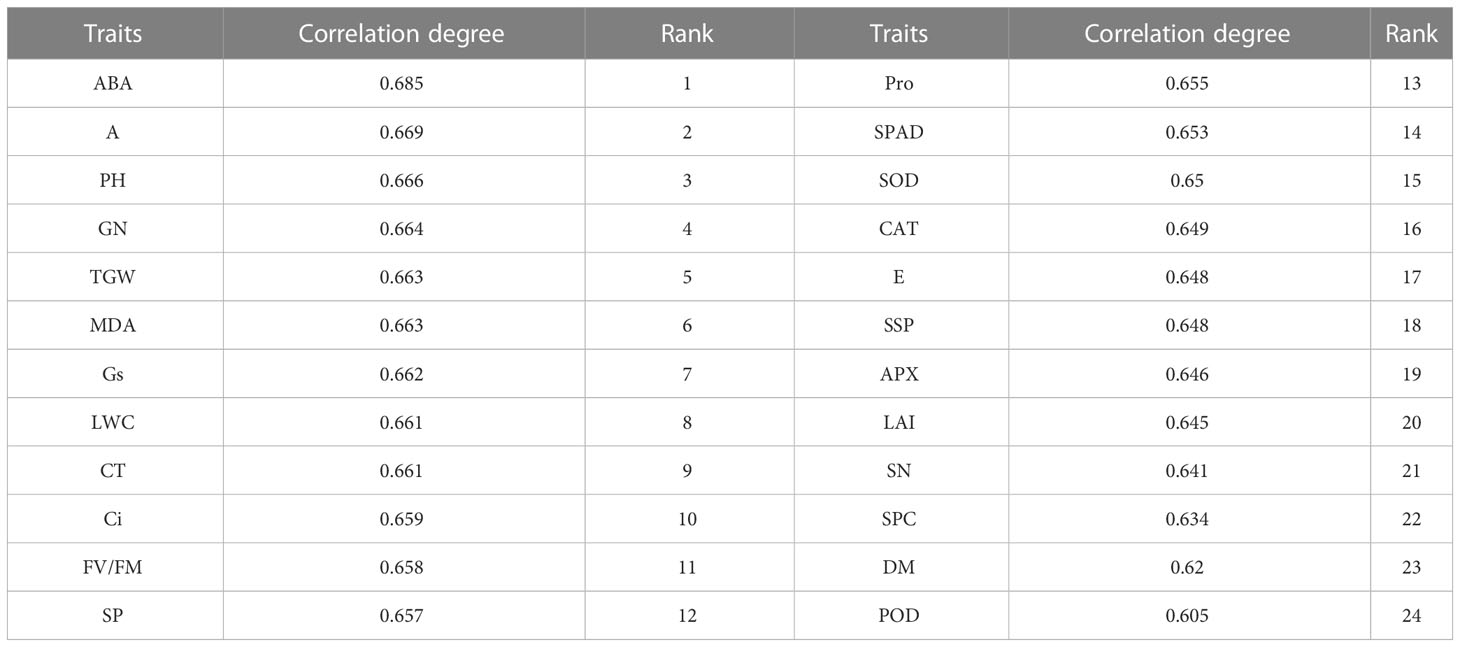
Table 7 The grey correlation degree between the drought tolerant coefficient and the D value of each trait.
The comprehensive evaluation value of drought tolerance (D value) was calculated by the formula (4), and the drought tolerance of wheat cultivars was ranked according to the D value. The lower the D value, the more sensitive the wheat crop to drought stress, and the lower the drought tolerance. In 2019–2020, JM418 had the highest D value (0.730), followed by HM19, SM22, and H4399 (Table 4). The D value of SX828 was the lowest (0.223), indicating that it was less tolerant to drought stress. In 2020–2021, the D value of JM418 was the highest, reaching 0.753, followed by SM22, H4399, and HM19 (Table 6). SX828 had the lowest D value (0.128). The squared Euclidean distance and the clustering method were used to cluster the average D values for 2 years. At the Euclidean distance of 1.5, 16 wheat varieties could be clustered into 3 categories (Figure 8), including drought-resistant (GY2018, HG35, JM418, HM19, SM22, and H4399), drought weak sensitive (GY5218, CM6002, JM585, JM738, S4366, XM7, and SL02–1) and drought-sensitive varieties (SX828, SM13, and SN086).
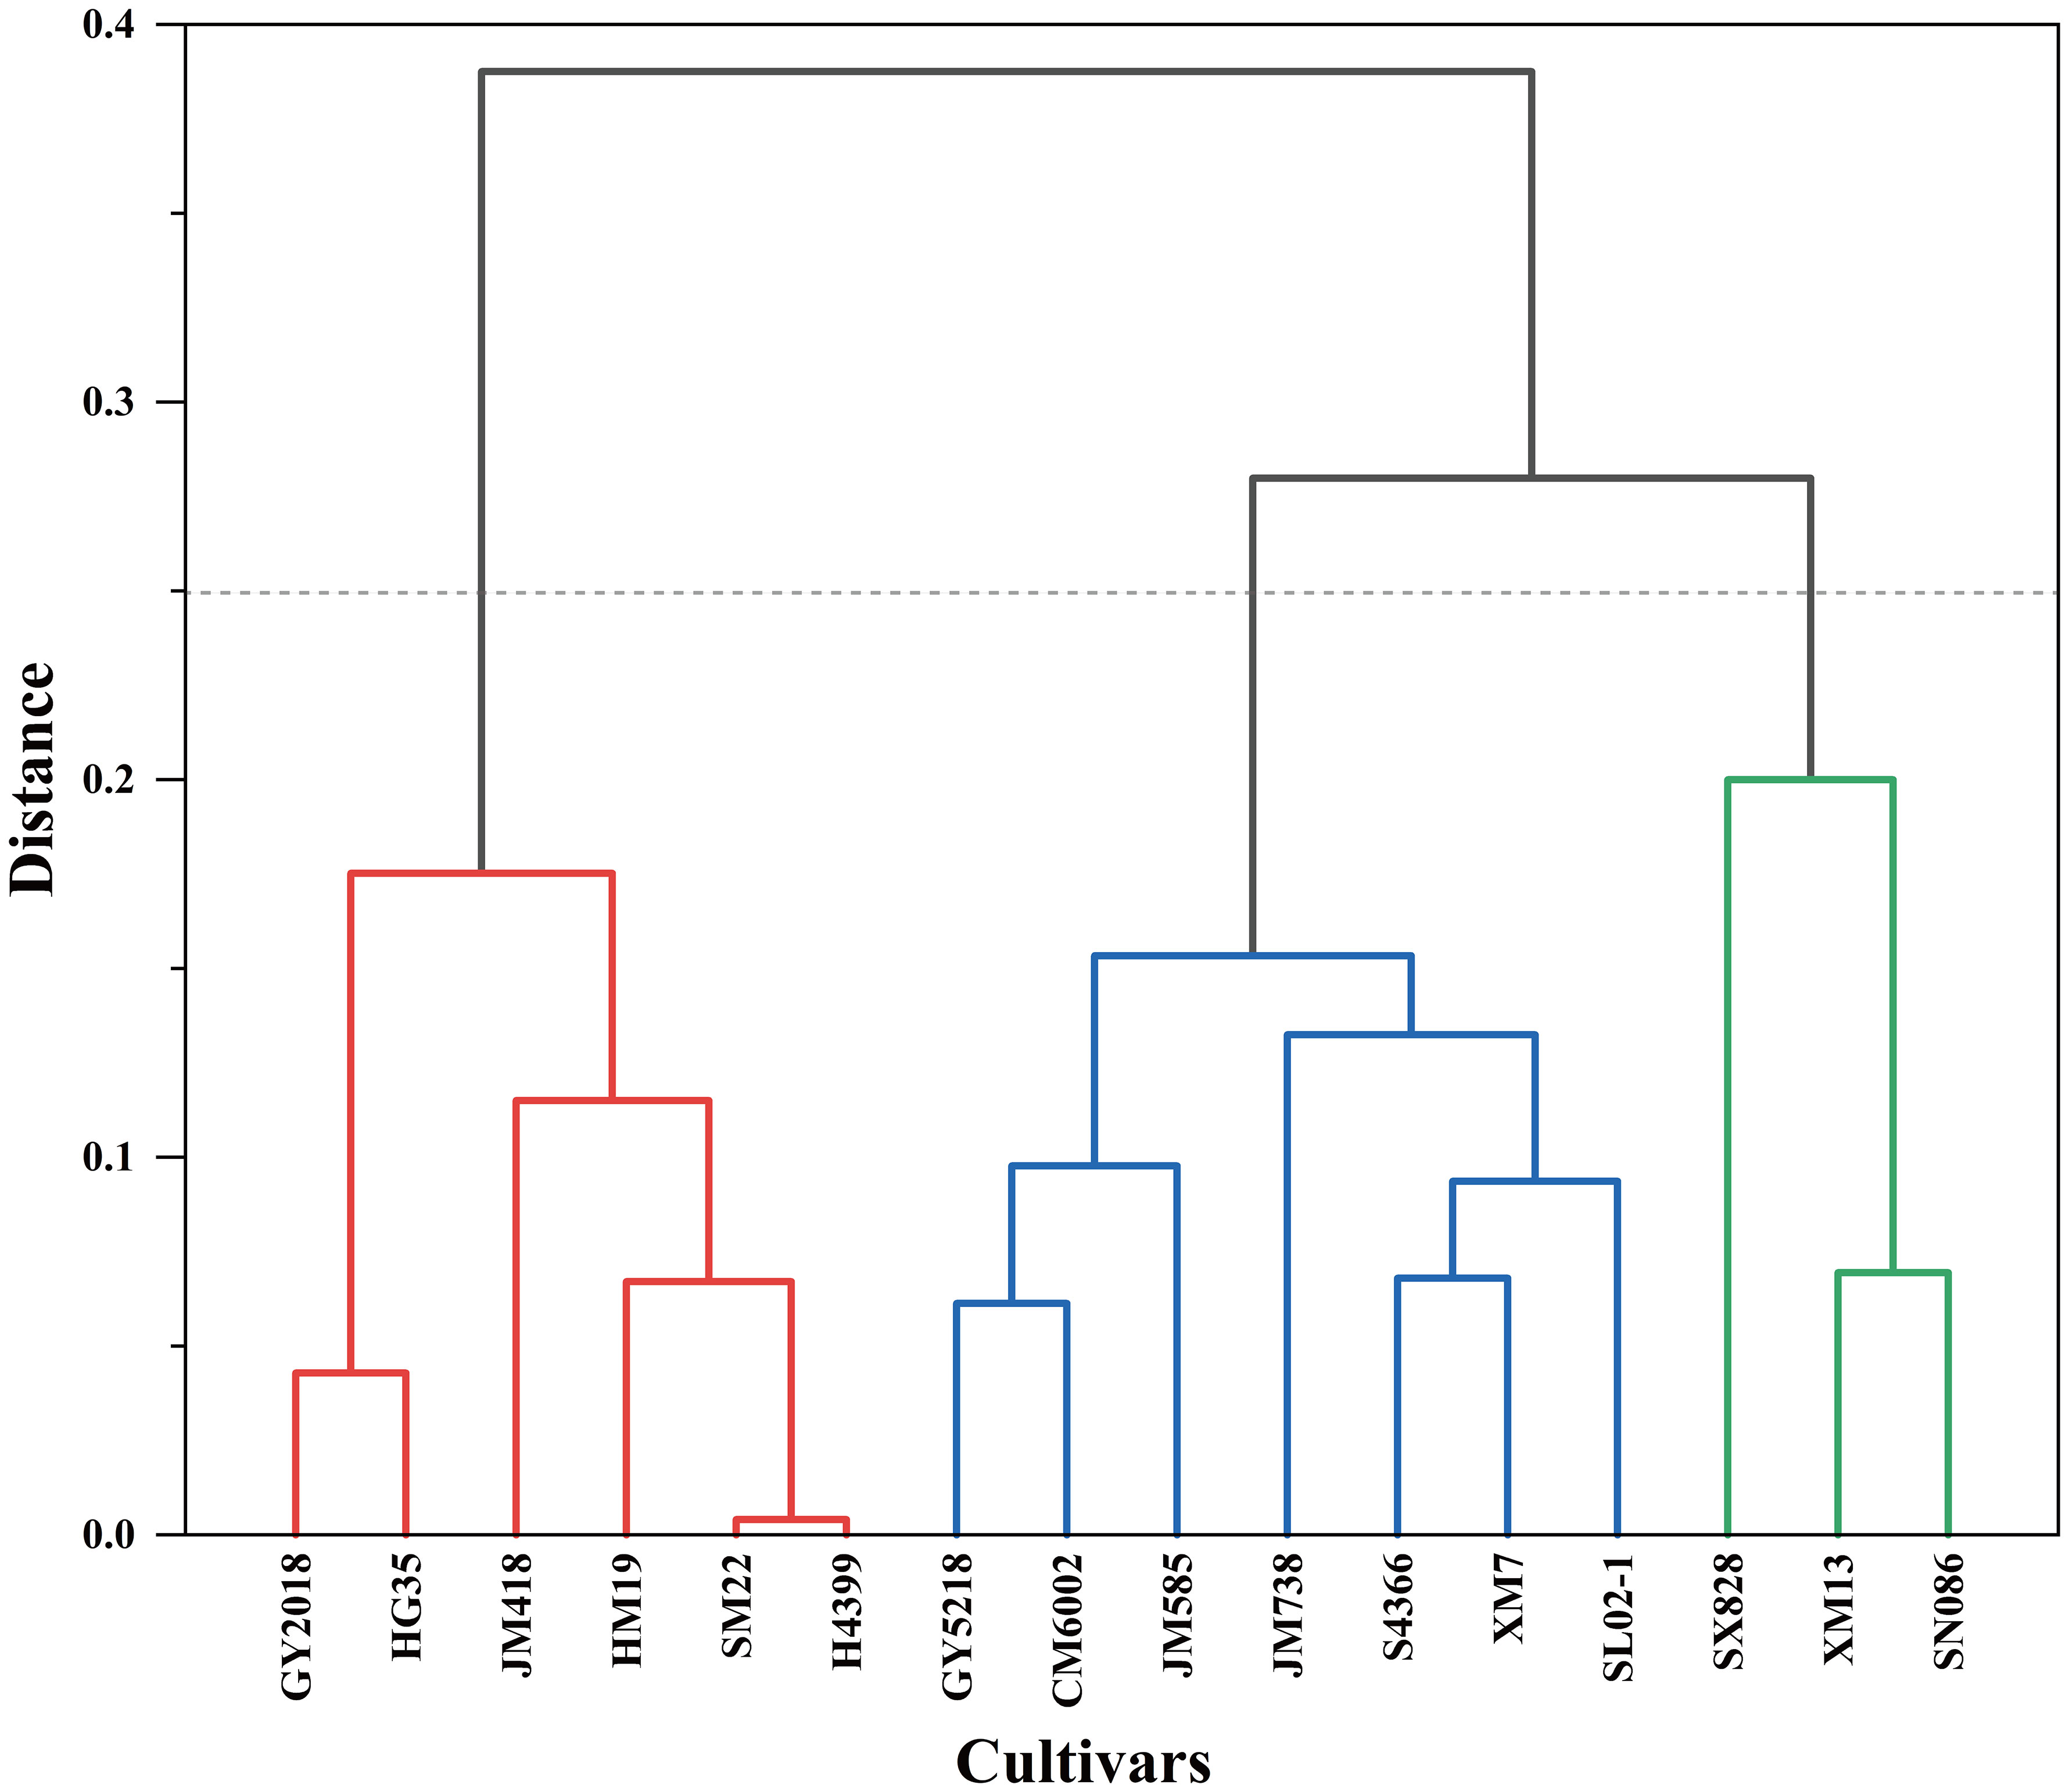
Figure 8 Systematic clustering of 16 wheat cultivars based on D-values.
To screen and evaluate drought tolerance traits in winter wheat, we used the D value as a dependent variable and the drought resistance coefficient of each trait as an independent variable to develop the best regression equation for predicting drought tolerance. The optimal regression equation is as follows: D =-4.775+5.056Ci-3.701SN+2.528LWC-1.693POD+4.421PH+0.902MDA-2.76A-2.494SP-0.706ABA+2.37CT (R2 = 0.988, P = 0.0001). Grey correlation analysis showed that the correlation coefficient between 24 traits ranged from 0.605 to 0.685, with an average value of 0.653. ABA had the strongest correlation with the comprehensive evaluation value of drought tolerance (D value) (0.685), followed by A (0.669). The traits closely related to the D value were ABA, A, PH, GN, TGW, MDA, Gs, LWC, CT, and Ci. Seven common traits were used in the grey correlation analysis and regression equation, namely ABA, A, PH, MDA, LWC, CT, and Ci, which also confirmed the feasibility and accuracy of the regression equation.
In recent years, climate change has caused a decrease in the yield of gramineous crops, including a 5.5% decrease in the global wheat yield (Lobell et al., 2011). Drought stress has emerged as one of the most significant abiotic stresses limiting crop production globally, and wheat is one of the most vulnerable crops to drought stress (Mei et al., 2022). Many wheat cultivars have been previously cultivated, but the response of different wheat cultivars to drought stress has been strikingly different. To resist climate change and reduce the agricultural water pressure in the NCP, breeding excellent wheat cultivars is an important measure to maintain and even increase wheat yield under adverse weather conditions. Scientists have made significant progress in developing high-yielding wheat cultivars since the Green Revolution. This has, however, been accomplished based on high yields obtained under ideal conditions, with no additional screening for tolerance traits under adverse conditions (Landi et al., 2017). Further progress in the development of drought-resistant germplasm depends on the efficiency of breeding methods and the evaluation of drought tolerance traits, and accurate drought phenotyping implies a precise definition of target environments and the management and characterization of water stress (Monneveux et al., 2012). At present, the evaluated traits associated with wheat drought tolerance are affected by multiple factors, such as experimental environment, screening period, and representativeness of indices. The results are not the same.
In our study, 16 wheat cultivars were cultivated in the field for two consecutive years. Grain yield and 24 traits closely related to drought tolerance, including morphological, physiological, and biochemical traits, were measured. Within 2 years, the results of variance analysis revealed significant yield differences among wheat cultivars grown in different water treatments, and the difference was more obvious under DS. Among them, CM6002, SM22, JM418, and HG35 had the lowest average decrease and showed better drought tolerance. However SX828, SL02–1, and XM7 had the biggest declines and were more sensitive to drought. These indicates that the selected wheat varieties have enough genetic diversity to be regionally representative. Drought stress had a significant effect on 24 traits (P< 0.05), with 18 traits decreasing (drought tolerance coefficient< 1) and 6 traits increasing (drought tolerance coefficient > 1) (Table 3). Meanwhile, the coefficient of variation (CV) value of most traits under DS was higher than that under CK, indicating that the wheat cultivars selected in this study were abundant, the effect of drought stress was obvious, and the results were representative.
To avoid inherent differences among cultivars, the performance of different wheat cultivars under drought stress was evaluated by relative values. However, drought tolerance is a complex trait determined by multiple factors, and several errors occur in evaluating drought tolerance of different cultivars by single-trait or single-type trait. At present, no single trait can be used to fully and accurately evaluate wheat’s drought resistance; therefore, selecting more comprehensive traits and appropriate evaluation methods are very important for the evaluation of wheat cultivars. In addition, there was a certain degree of correlation between many indicators, which led to the overlapping response as a source of crop stress tolerance traits (Figure 6). Therefore, it is necessary to use the multivariate analysis method to evaluate and screen for comprehensive traits related to drought resistance. PCA can reduce multiple variables to a few underlying factors while reducing missing data, allowing for more efficient grouping of drought-tolerant genotypes (Wu and Bao, 2012; Maheswari et al., 2016). Through PCA, 24 individual traits of winter wheat under drought stress were converted into 7 independent comprehensive indices (Table 4). The cumulative contribution rate of the first 7 independent comprehensive indicators reached more than 80% during the two-year experiment, indicating that most of the data on 24 traits could be covered. The drought tolerance membership function value is a multivariate index that integrates the drought tolerant coefficients of different traits and can effectively reflect the overall performance of plants under drought stress. The membership function values were calculated based on the principal component scores, and the comprehensive evaluation value of drought tolerance (D value) was calculated by combining the weights; the drought tolerance of wheat cultivars was ranked according to the D value. Many previous studies have classified 12 onion cultivars into two groups according to their waterlogging tolerance and wheat and maize salt-tolerant genotypes according to their Euclidean distances (Huqe et al., 2021; Gedam et al., 2022; Uzair et al., 2022). The cotton cultivars were classified according to their drought tolerance by the membership function and D value (Zahid et al., 2021). In this study, wheat cultivars differed significantly in various morphological and physiological characteristics in different growing seasons, indicating that there was sufficient genetic diversity among the selected wheat cultivars. Also, they were representative of the region. We used PCA to convert the 24 drought resistance indicators of wheat into 7 independent composite indicators. D values of different wheat cultivars were obtained by the membership function. Furthermore, the use of PCA in conjunction with the membership function and cluster analysis makes assessing stress resistance in crops more reliable and practical. Hierarchical clustering analysis classified 16 wheat cultivars into 3 categories based on the D value: drought resistant, drought weak sensitive, and drought sensitive. In this study, 10 drought tolerance traits (Ci, SN, LWC, POD, PH, MDA, A, SP, ABA, and CT) were identified by regression analysis and found to have significant effects on drought tolerance of wheat and, therefore, it could be used as the main traits for screening drought tolerant wheat cultivars in the future. At the same time, we established a reliable regression model for the drought resistance evaluation of wheat as follows: D =-4.775+5.056Ci-3.701SN+2.528LWC-1.693POD+4.421PH+0.902MDA-2.76A-2.494SP-0.706ABA+2.37CT (R2 = 0.988, P = 0.0001). The grey relational analysis can determine the correlation degree between the drought tolerant coefficient of each trait and the D value. The higher the correlation degree, the stronger the correlation between a trait and drought tolerance of wheat. The results of the grey relational analysis further confirmed the accuracy of the regression analysis and enhanced the scientific reliability and persuasive assessment of the identified traits.
Plant growth is an important index to measure drought adaptation, and most scientists evaluate drought-tolerant and drought-sensitive wheat cultivars under drought conditions based on morphological characteristics or yield indicators, including plant height, tiller number, spikelet number, grain number per spike, 1000-grain weight, leaf area index, biological yield, and grain yield (Zhao et al., 2013; Gao et al., 2020; Memon et al., 2021; Ahmad et al., 2022). In this study, we looked at three phenotypic traits: SN, SP, and PH. Drought stress, on the other hand, affects not only plant morphology and yield but also the physiological and biochemical characteristics of plants (Claeys and Inze, 2013). Photosynthesis is an important process for the production of dry matter, and the increase in grain yield is due to the assimilation products of photosynthesis (Li et al., 2020). Water stress during the grain-filling period can lead to decreased photosynthesis, induce accelerated leaf senescence, and shorten the grain-filling period, with the latter being the main reason for the decrease in wheat yield (Yang and Zhang, 2006). During photosynthesis, stomatal traits account for the large extent of yield losses since stomatal closure can reduce water loss (Liu et al., 2010). We identified two important photosynthetic physiological traits, including A and Ci, highly similar to the results of previous studies. Similarly, CT and LWC during the grain-filling period can also be used to identify drought-resistant genotypes. CT is a low-cost, large-scale method for rapidly identifying drought-tolerant cultivars at the canopy level. At the grain-filling stage, there was a continuous negative linear correlation between canopy temperature (CT) and grain yield, and higher leaf water content could contribute to and maintain a lower canopy temperature and a larger water absorption capacity of roots (Deery et al., 2016). Throughout evolution, plants have withstood harsh environmental conditions by elevating abscisic acid levels, controlling stomatal aperture, accumulating antioxidants and osmoprotectants, and regulating gene expression in response to stress (Fu et al., 2016). Therefore, these are often used as physiological indicators associated with stress resistance in crops (Hassan et al., 2015; Mu et al., 2021). Reactive oxygen species (ROS) produced as a result of drought stress lead to lipid peroxidation and increased activities of superoxide dismutase (SOD), peroxidase (POD), catalase (CAT), and ascorbate peroxidase (APX), which are important components of the antioxidant enzyme system in the cell membrane and can reduce the toxicity of ROS to cells. In addition, ABA plays a crucial role in the response of plants to drought through stomatal closure and maintenance of the water balance, as well as the transcription and activity of antioxidant enzymes (Wang et al., 2021). In other words, the improved plant performance provided by these traits can serve as a foundation for selecting materials for the development of drought-tolerant wheat genotypes (Mwadzingeni et al., 2016). Chlorophyll content has traditionally been regarded as a key indicator of wheat growth. The retention of green leaf area was the most valuable genetic trait associated with maintenance of yield under drought conditions (Foulkes et al., 2007). However, SPAD value was not selected as the identification index of drought resistance, which may be due to the difference in wheat leaf color itself, leading to different experimental results. The results of our screening revealed that A, Ci, POD, MDA, and ABA could best reflect drought resistance in wheat. We speculated that flag leaves maintained high anti-aging ability and maintain higher photosynthesis in the late grain filling stage under DS, thus guaranteeing the accumulation of dry matter. This is the key physiological factor to distinguish drought tolerance of different wheat cultivars.
Through a two-year field experiment, we comprehensively evaluated the drought tolerance of different wheat varieties, identified the wheat varieties with superior drought tolerance, screened 10 key indices for the evaluation of winter wheat drought tolerance, and developed the best mathematical model for the prediction of wheat drought resistance. There are some flaws in this study as well. For example, we only considered variation between indicators for two conditions (normal irrigation and drought stress). However, it has been reported that after being subjected to abiotic stress, some physiological parameters of plants can restore to optimal function(Liu et al., 2022). Therefore, we believe that further research into the resilience of different wheat varieties after drought rehydration compensation and the feasibility of key indicators is required. This could lead to more drought-tolerant varieties being selected. The flow chart of the screening of drought-tolerant cultivars and drought-tolerance traits in Figure 9 provides a foundation for efficient and accurate identification of drought-tolerant wheat cultivars for future wheat production research.
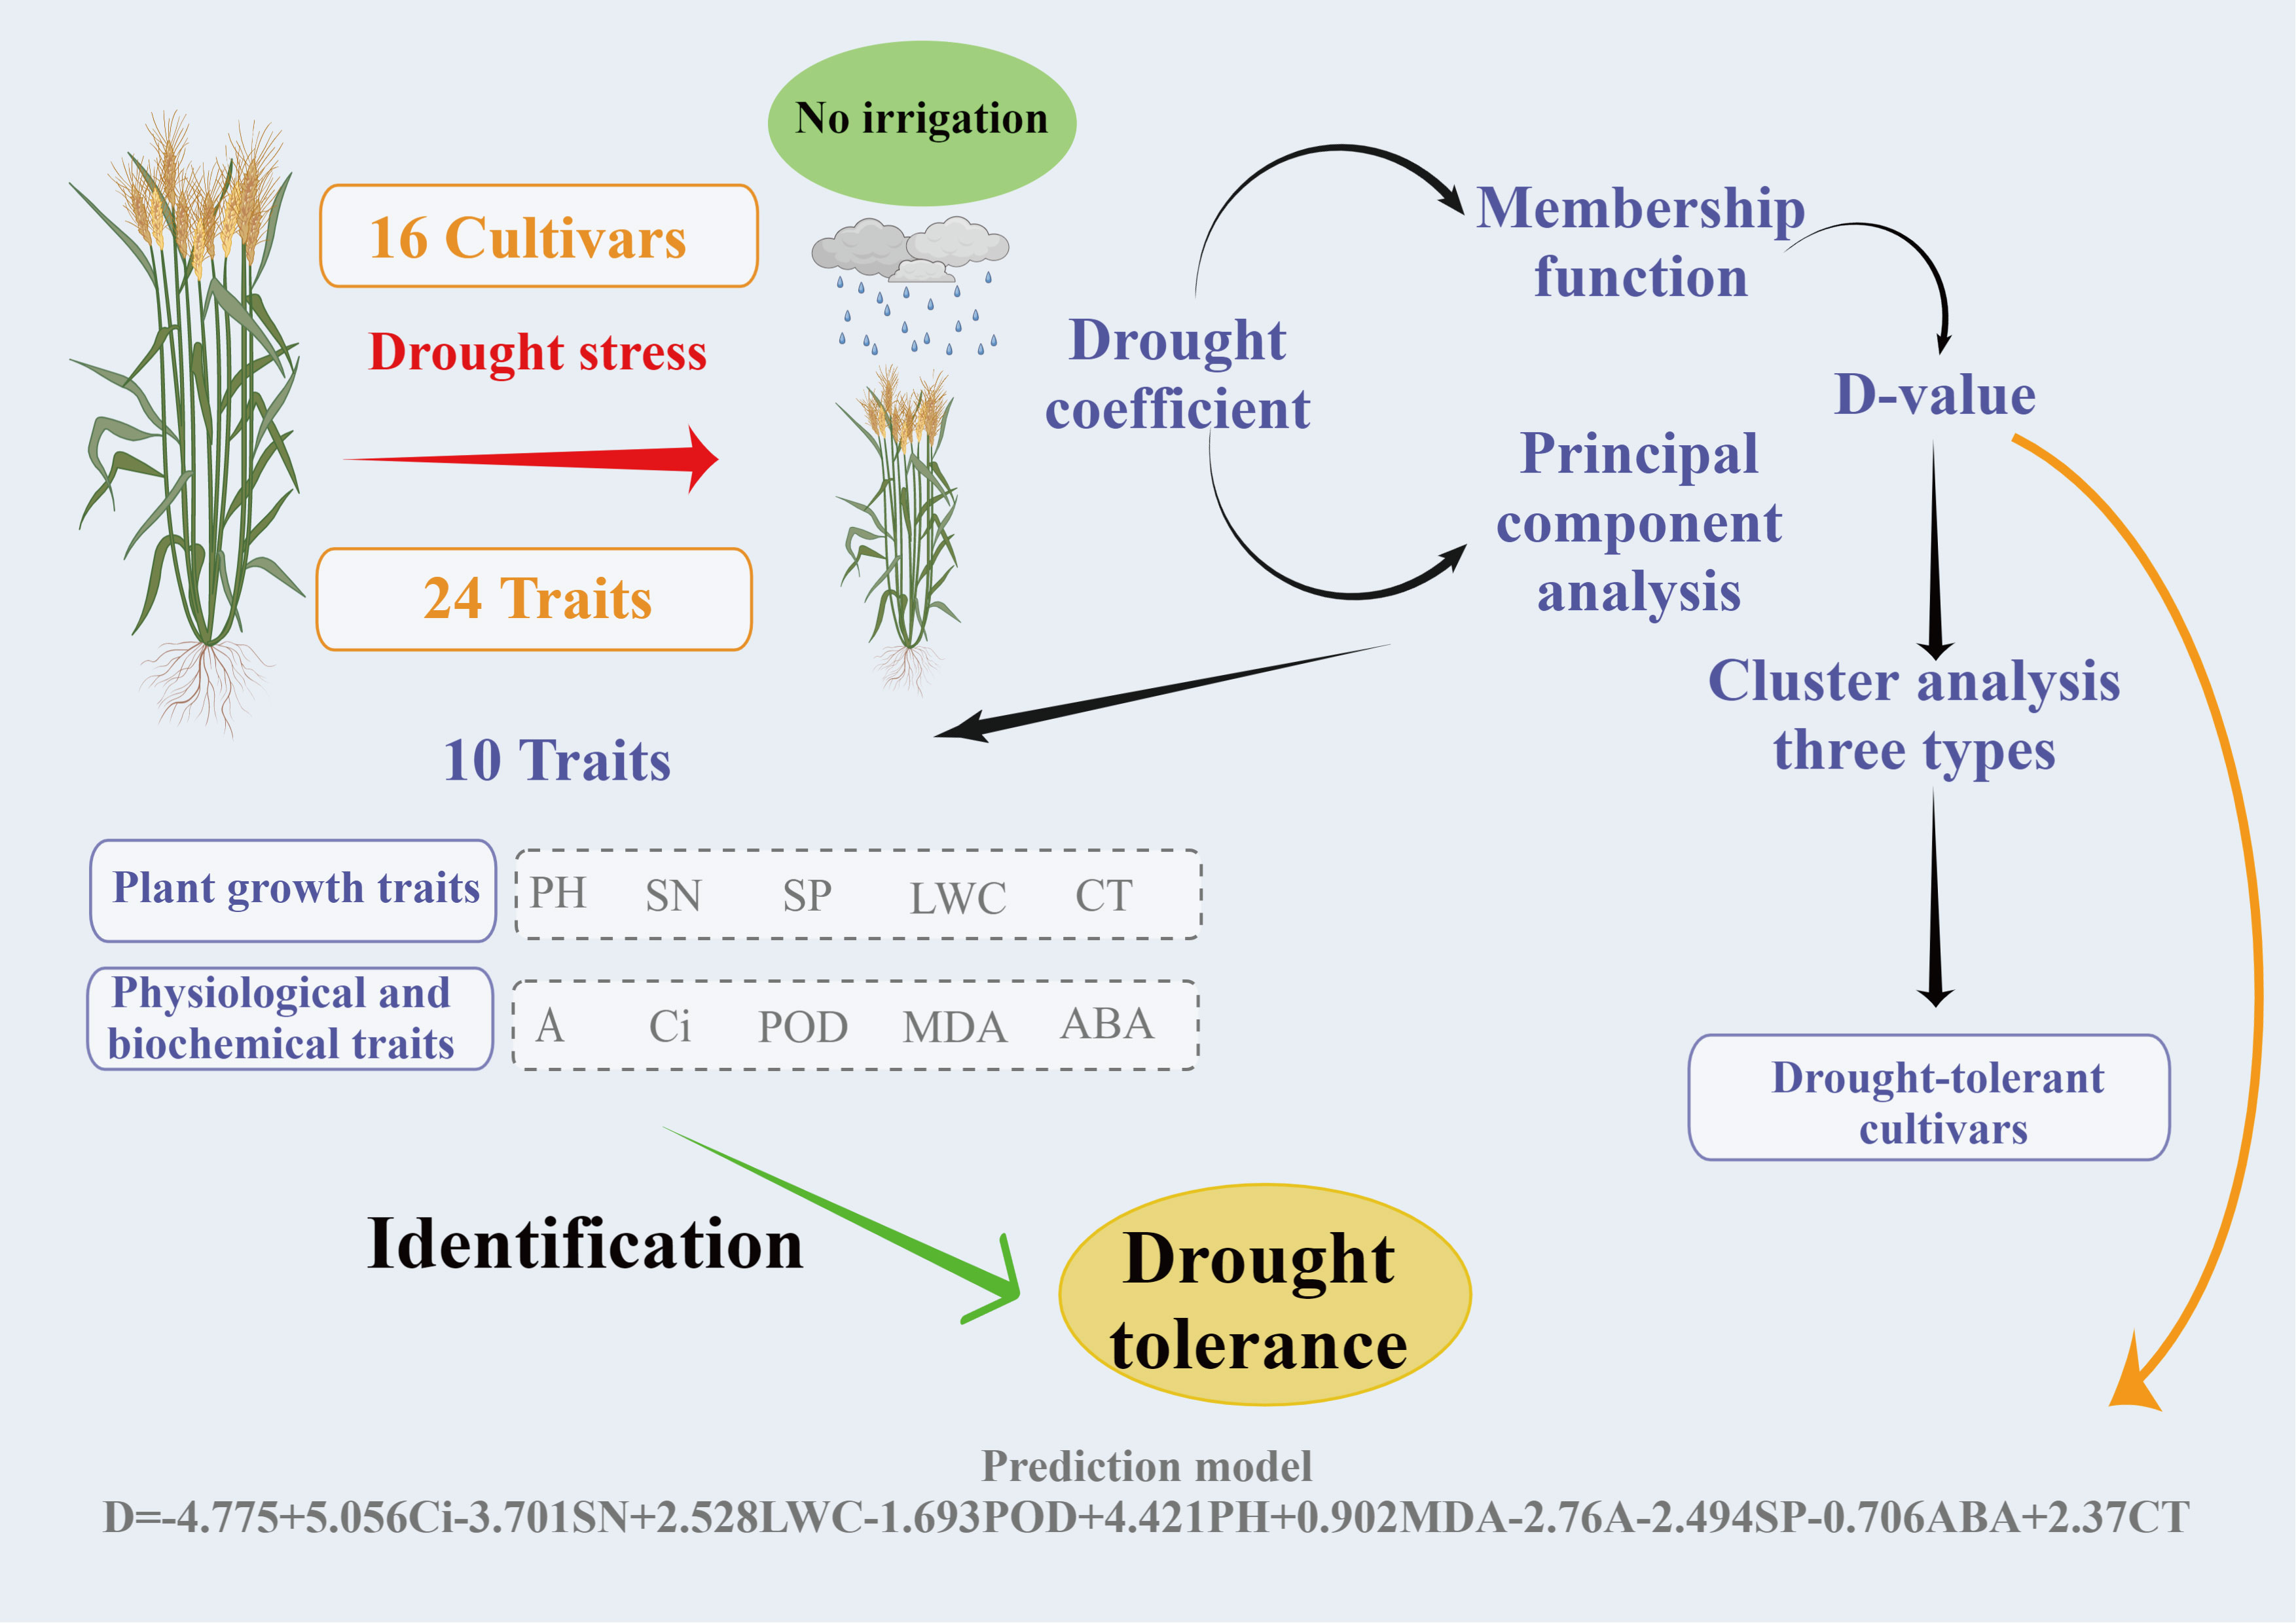
Figure 9 Screening process and prediction model for drought-resistant wheat cultivars and drought-resistance traits.
This study evaluated 24 drought-related indices, including yield, morphology, photosynthesis, physiology, and osmotic regulation in wheat, under drought stress conditions. PCA, membership function analysis, and multiple regression analysis were performed to effectively evaluate the drought resistance of the wheat crop. A total of 10 traits associated with wheat drought resistance, such as PH, SN, SP, CT, LWC, A, Ci, POD, MDA, and ABA, were evaluated, and a digital model for wheat drought resistance evaluation was established. Furthermore, 6 drought-tolerant wheat cultivars were chosen: JM418, HM19, SM22, HG35, H4399, and CM6002. This study provides useful material for breeding wheat cultivars with drought resistance and the theoretical basis for explaining the mechanism underlying wheat drought resistance.
The original contributions presented in the study are included in the article/supplementary material. Further inquiries can be directed to the corresponding authors.
WZ and LG conceived the project and set scientific objectives. XB, XL, and XH contributed to preparing the field experiment and data acquisition. XB, XL, and XH wrote the manuscript. WD, JR, BY, and YW writing—review and editing. All authors contributed to the article and approved the submitted version.
This work was supported by the National Key Research and Development Project (Grant No. 2017YFD0300900), the Key R&D projects in Hebei Province (Grant No. 21327001D22326406D), and the Modern Agricultural Industrial Technology System in Hebei Province (Grant No. HBCT2018010205).
We express the profound sense of reverence to the entire research team, and any other person who contributed; we have deep gratitude for you so much.
The authors declare that the research was conducted in the absence of any commercial or financial relationships that could be construed as a potential conflict of interest.
All claims expressed in this article are solely those of the authors and do not necessarily represent those of their affiliated organizations, or those of the publisher, the editors and the reviewers. Any product that may be evaluated in this article, or claim that may be made by its manufacturer, is not guaranteed or endorsed by the publisher.
Ahmad, A., Aslam, Z., Javed, T., Hussain, S., Raza, A., Shabbir, R., et al. (2022). Screening of wheat (Triticum aestivum l.) genotypes for drought tolerance through agronomic and physiological response. Agronomy-Basel 12 (2), 287. doi: 10.3390/agronomy12020287
Ahmad, M. S., Wu, B., Wang, H., Kang, D. (2020). Field screening of rice germplasm (Oryza sativa l. ssp. japonica) based on days to flowering for drought escape. Plants-Basel 9 (5), 609. doi: 10.3390/plants9050609
Ahmed, H.G.M.-D., Khan, A. S., Li, M.-j., Khan, S. H., Kashif, M. (2019). Early selection of bread wheat genotypes using morphological and photosynthetic attributes conferring drought tolerance. J. Integr. Agric. 18 (11), 2483–2491. doi: 10.1016/s2095-3119(18)62083-0
Benech Arnold, R. L., Fenner, M., Edwards, P. J. (1991). Changes in germinability, ABA content and ABA embryonic sensitivity in developing seeds of sorghum bicolor (L.) moench. induced by water stress during grain filling. New Phytol. 118 (2), 339–347. doi: 10.1111/j.1469-8137.1991.tb00986.x
Campion, E. M., Loughran, S. T., Walls, D. (2011). Protein quantitation and analysis of purity. Methods Mol. Biol. 681, 229–258. doi: 10.1007/978-1-60761-913-0_13
Claeys, H., Inze, D. (2013). The agony of choice: how plants balance growth and survival under water-limiting conditions. Plant Physiol. 162 (4), 1768–1779. doi: 10.1104/pp.113.220921
Correia, P. M. P., Westergaard, J. C., da Silva, A. B., Roitsch, T., Carmo-Silva, E., da Silva, J. M. (2022). High-throughput phenotyping of physiological traits for wheat resilience to high temperature and drought stress. J. Exp. Bot. 73 (15), 5235–5251. doi: 10.1093/jxb/erac160
Cruz de Carvalho, M. H. (2008). Drought stress and reactive oxygen species: production, scavenging and signaling. Plant Signaling Behav. 3 (3), 156–165. doi: 10.4161/psb.3.3.5536
Deery, D. M., Rebetzke, G. J., Jimenez-Berni, J. A., James, R. A., Condon, A. G., Bovill, W. D., et al. (2016). Methodology for high-throughput field phenotyping of canopy temperature using airborne thermography. Front. Plant Sci. 7. doi: 10.3389/fpls.2016.01808
Fan, Y., Liu, J., Zhao, J., Ma, Y., Li, Q. (2019). Effects of delayed irrigation during the jointing stage on the photosynthetic characteristics and yield of winter wheat under different planting patterns. Agric. Water Manage. 221, 371–376. doi: 10.1016/j.agwat.2019.05.004
Fang, Q. X., Ma, L., Green, T. R., Yu, Q., Wang, T. D., Ahuja, L. R. (2010). Water resources and water use efficiency in the north China plain: current status and agronomic management options. Agric. Water Manage. 97 (8), 1102–1116. doi: 10.1016/j.agwat.2010.01.008
Fang, Y., Xiong, L. (2015). General mechanisms of drought response and their application in drought resistance improvement in plants. Cell. Mol. Life Sci. 72 (4), 673–689. doi: 10.1007/s00018-014-1767-0
Foulkes, M. J., Sylvester-Bradley, R., Weightman, R., Snape, J. W. (2007). Identifying physiological traits associated with improved drought resistance in winter wheat. Field Crops Res. 103 (1), 11–24. doi: 10.1016/j.fcr.2007.04.007
Fu, L., Ding, Z., Han, B., Hu, W., Li, Y., Zhang, J. (2016). Physiological investigation and transcriptome analysis of polyethylene glycol (PEG)-induced dehydration stress in cassava. Int. J. Mol. Sci. 17 (3), 283. doi: 10.3390/ijms17030283
Gambetta, G. A., Herrera, J. C., Dayer, S., Feng, Q., Hochberg, U., Castellarin, S. D. (2020). The physiology of drought stress in grapevine: towards an integrative definition of drought tolerance. J. Exp. Bot. 71 (16), 4658–4676. doi: 10.1093/jxb/eraa245
Gao, Z., Wang, Y., Tian, G., Zhao, Y., Li, C., Cao, Q., et al. (2020). Plant height and its relationship with yield in wheat under different irrigation regime. Irrig. Sci. 38 (4), 365–371. doi: 10.1007/s00271-020-00678-z
Gedam, P. A., Shirsat, D. V., Arunachalam, T., Ghosh, S., Gawande, S. J., Mahajan, V., et al. (2022). Screening of onion (Allium cepa l.) genotypes for waterlogging tolerance. Front. Plant Sci. 12. doi: 10.3389/fpls.2021.727262
Giannopolitis, C. N., Ries, S. K. (1977). Superoxide dismutases: i. occurrence in higher plants. Plant Physiol. 59 (2), 309–314. doi: 10.1104/pp.59.2.309
Gill, S. S., Tuteja, N. (2010). Reactive oxygen species and antioxidant machinery in abiotic stress tolerance in crop plants. Plant Physiol. Biochem. 48 (12), 909–930. doi: 10.1016/j.plaphy.2010.08.016
Gomez-Candon, D., Mathieu, V., Martinez, S., Labbe, S., Delalande, M., Regnard, J.-L. (2022). Unravelling the responses of different apple varieties to water constraints by continuous field thermal monitoring. Sci. Hortic. 299, 111013. doi: 10.1016/j.scienta.2022.111013
Gouveia, C. S. S., Gananca, J. F. T., Slaski, J. J., Lebot, V., Pinheiro de Carvalho, M. A. A. (2021). Abscisic acid phytohormone estimation in tubers and shoots ofIpomoea batatassubjected to long drought stress using competitive immunological assay. Physiol. Plant 172 (2), 419–430. doi: 10.1111/ppl.13192
Guan, L. Q. M., Zhao, J., Scandalios, J. G. (2000). Cis-elements and trans-factors that regulate expression of the maize Cat1 antioxidant gene in response to ABA and osmotic stress: H2O2 is the likely intermediary signaling molecule for the response. Plant J. 22 (2), 87–95. doi: 10.1046/j.1365-313x.2000.00723.x
Han, L.-B., Song, G.-L., Zhang, X. (2008). Preliminary observations on physiological responses of three turfgrass species to traffic stress. Horttechnology 18 (1), 139–143. doi: 10.21273/horttech.18.1.139
Hassan, N. M., El-Bastawisy, Z. M., El-Sayed, A. K., Ebeed, H. T., Alla, M. M. N. (2015). Roles of dehydrin genes in wheat tolerance to drought stress. J. Adv. Res. 6 (2), 179–188. doi: 10.1016/j.jare.2013.11.004
Hodges, D. M., DeLong, J. M., Forney, C. F., Prange, R. K. (1999). Improving the thiobarbituric acid-reactive-substances assay for estimating lipid peroxidation in plant tissues containing anthocyanin and other interfering compounds. Planta 207 (4), 604–611. doi: 10.1007/s004250050524
Huqe, M. A. S., Haque, M. S., Sagar, A., Uddin, M. N., Hossain, M. A., Hossain, A. Z., et al. (2021). Characterization of maize hybrids (Zea mays l.) for detecting salt tolerance based on morpho-physiological characteristics, ion accumulation and genetic variability at early vegetative stage. Plants-Basel 10 (11), 254. doi: 10.3390/plants10112549
Hura, T., Grzesiak, S., Hura, K., Thiemt, E., Tokarz, K., Wedzony, M. (2007). Physiological and biochemical tools useful in drought-tolerance detection in genotypes of winter triticale: accumulation of ferulic acid correlates with drought tolerance. Ann. Bot. 100 (4), 767–775. doi: 10.1093/aob/mcm162
Ihsan, M. Z., El-Nakhlawy, F. S., Ismail, S. M., Fahad, S., Daur, I. (2016). Wheat phenological development and growth studies as affected by drought and late season high temperature stress under arid environment. Front. Plant Sci. 7. doi: 10.3389/fpls.2016.00795
Jha, S. K., Gao, Y., Liu, H., Huang, Z., Wang, G., Liang, Y., et al. (2017). Root development and water uptake in winter wheat under different irrigation methods and scheduling for north China. Agric. Water Manage. 182, 139–150. doi: 10.1016/j.agwat.2016.12.015
Jiang, M., Zhang, J. (2003). Cross-talk between calcium and reactive oxygen species originated from NADPH oxidase in abscisic acid-induced antioxidant defence in leaves of maize seedlings. Plant Cell Environ. 26 (6), 929–939. doi: 10.1046/j.1365-3040.2003.01025.x
Kadkol, G., Smith, A., Cullis, B., Chenu, K. (2020). Variation in Australian durum wheat germplasm for productivity traits under irrigated and rainfed conditions: genotype performance for agronomic traits and benchmarking. J. Agric. Sci. 158 (6), 479–495. doi: 10.1017/s0021859620000817
Kumar, S., Dwivedi, S. K., Basu, S., Kumar, G., Mishra, J. S., Koley, T. K., et al. (2020). Anatomical, agro-morphological and physiological changes in rice under cumulative and stage specific drought conditions prevailed in eastern region of India. Field Crops Res. 245, 107658. doi: 10.1016/j.fcr.2019.107658
Landi, S., Hausman, J.-F., Guerriero, G., Esposito, S. (2017). Poaceae vs. abiotic stress: focus on drought and salt stress, recent insights and perspectives. Front. Plant Sci. 8. doi: 10.3389/fpls.2017.01214
Li, Q., Dong, B., Qiao, Y., Liu, M., Zhang, J. (2010). Root growth, available soil water, and water-use efficiency of winter wheat under different irrigation regimes applied at different growth stages in north China. Agric. Water Manage. 97 (10), 1676–1682. doi: 10.1016/j.agwat.2010.05.025
Li, Y., Ma, L., Wu, P., Zhao, X., Chen, X., Gao, X. (2020). Yield, yield attributes and photosynthetic physiological characteristics of dryland wheat (Triticum aestivum l.)/maize (Zea mays l.) strip intercropping. Field Crops Res. 248, 107656. doi: 10.1016/j.fcr.2019.107656
Liu, G., Freschet, G. T., Pan, X., Cornelissen, J. H. C., Li, Y., Dong, M. (2010). Coordinated variation in leaf and root traits across multiple spatial scales in Chinese semi-arid and arid ecosystems. New Phytol. 188 (2), 543–553. doi: 10.1111/j.1469-8137.2010.03388.x
Liu, E. K., Mei, X. R., Yan, C. R., Gong, D. Z., Zhang, Y. Q. (2016). Effects of water stress on photosynthetic characteristics, dry matter translocation and WUE in two winter wheat genotypes. Agric. Water Manage. 167, 75–85. doi: 10.1016/j.agwat.2015.12.026
Liu, X., Wang, X., Liu, P., Bao, X., Hou, X., Yang, M., et al. (2022). Rehydration compensation of winter wheat is mediated by hormone metabolism and de-peroxidative activities under field conditions. Front. Plant Sci. 13. doi: 10.3389/fpls.2022.823846
Liu, R., Zhong, B., Li, X., Zheng, K., Liang, H., Cao, J., et al. (2022). Analysis of groundwater changes, (2003-2020) in the north China plain using geodetic measurements. J. Hydrol. Reg. Stud. 41, 101085. doi: 10.1016/j.ejrh.2022.101085
Lobell, D. B., Schlenker, W., Costa-Roberts, J. (2011). Climate trends and global crop production since 1980. Science 333 (6042), 616–620. doi: 10.1126/science.1204531
Lopes, M. S., Reynolds, M. P., Manes, Y., Singh, R. P., Crossa, J., Braun, H. J. (2012). Genetic yield gains and changes in associated traits of CIMMYT spring bread wheat in a "historic" set representing 30 years of breeding. Crop Sci. 52 (3), 1123–1131. doi: 10.2135/cropsci2011.09.0467
Lu, Y., Yan, Z., Li, L., Gao, C., Shao, L. (2020). Selecting traits to improve the yield and water use efficiency of winter wheat under limited water supply. Agric. Water Manage. 242, 106410. doi: 10.1016/j.agwat.2020.106410
Luo, Y., Li, W., Huang, C., Yang, J., Jin, M., Chen, J., et al. (2021). Exogenous abscisic acid coordinating leaf senescence and transport of assimilates into wheat grains under drought stress by regulating hormones homeostasis. Crop J. 9 (4), 901–914. doi: 10.1016/j.cj.2020.08.012
Madhusudhan, R., Ishikawa, T., Sawa, Y., Shigeoka, S., Shibata, H. (2003). Characterization of an ascorbate peroxidase in plastids of tobacco BY-2 cells. Physiol. Plant 117 (4), 550–557. doi: 10.1034/j.1399-3054.2003.00066.x
Magne, C., Larher, F. (1992). High sugar content of extracts interferes with colorimetric determination of amino acids and free proline. Anal. Biochem. 200 (1), 115–118. doi: 10.1016/0003-2697(92)90285-f
Maheswari, M., Tekula, V. L., Yellisetty, V., Sarkar, B., Yadav, S. K., Singh, J., et al. (2016). Functional mechanisms of drought tolerance in maize through phenotyping and genotyping under well watered and water stressed conditions. Eur. J. Agron. 79, 43–57. doi: 10.1016/j.eja.2016.05.008
Mdluli, S. Y., Shimelis, H., Mashilo, J. (2020). Screening for pre- and post-anthesis drought responses in selected bread wheat (Triticum aestivum l.) genotypes. Acta Agric. Scand. Sect. B.: Soil Plant Sci. 70 (4), 272–284. doi: 10.1080/09064710.2020.1725105
Mei, F., Chen, B., Du, L., Li, S., Zhu, D., Chen, N., et al. (2022). A gain-of-function allele of a DREB transcription factor gene ameliorates drought tolerance in wheat. Plant Cell 34 (11), 4472–4494. doi: 10.1093/plcell/koac248
Memon, S. A., Sheikh, I. A., Talpur, M. A., Mangrio, M. A. (2021). Impact of deficit irrigation strategies on winter wheat in semi-arid climate of sindh. Agric. Water Manage. 243, 106389. doi: 10.1016/j.agwat.2020.106389
Miller, G., Suzuki, N., Ciftci-Yilmaz, S., Mittler, R. (2010). Reactive oxygen species homeostasis and signalling during drought and salinity stresses. Plant Cell Environ. 33 (4), 453–467. doi: 10.1111/j.1365-3040.2009.02041.x
Monneveux, P., Jing, R., Misra, S. C. (2012). Phenotyping for drought adaptation in wheat using physiological traits. Front. Physiol. 3. doi: 10.3389/fphys.2012.00429
Morison, J. I. L., Baker, N. R., Mullineaux, P. M., Davies, W. J. (2008). Improving water use in crop production. Philos. Trans. R. Soc B.: Biol. Sci. 363 (1491), 639–658. doi: 10.1098/rstb.2007.2175
Mu, Q., Cai, H., Sun, S., Wen, S., Xu, J., Dong, M., et al. (2021). The physiological response of winter wheat under short-term drought conditions and the sensitivity of different indices to soil water changes. Agric. Water Manage. 243, 106475. doi: 10.1016/j.agwat.2020.106475
Mwadzingeni, L., Shimelis, H., Dube, E., Laing, M. D., Tsilo, T. J. (2016). Breeding wheat for drought tolerance: progress and technologies. J. Integr. Agric. 15 (5), 935–943. doi: 10.1016/s2095-3119(15)61102-9
Nakhforoosh, A., Bodewein, T., Fiorani, F., Bodner, G. (2016). Identification of water use strategies at early growth stages in durum wheat from shoot phenotyping and physiological measurements. Front. Plant Sci. 7. doi: 10.3389/fpls.2016.01155
Puangbut, D., Jogloy, S., Vorasoot, N., Songsri, P. (2022). Photosynthetic and physiological responses to drought of Jerusalem artichoke genotypes differing in drought resistance. Agric. Water Manage. 259, 107252. doi: 10.1016/j.agwat.2021.107252
Song, Q., Liu, C., Bachir, D. G., Chen, L., Hu, Y.-G. (2017). Drought resistance of new synthetic hexaploid wheat accessions evaluated by multiple traits and antioxidant enzyme activity. Field Crops Res. 210, 91–103. doi: 10.1016/j.fcr.2017.05.028
Sun, F., Chen, Q., Chen, Q., Jiang, M., Gao, W., Qu, Y. (2021). Screening of key drought tolerance indices for cotton at the flowering and boll setting stage using the dimension reduction method. Front. Plant Sci. 12. doi: 10.3389/fpls.2021.619926
Sun, H.-Y., Liu, C.-M., Zhang, X.-Y., Shen, Y.-J., Zhang, Y.-Q. (2006). Effects of irrigation on water balance, yield and WUE of winter wheat in the north China plain. Agric. Water Manage. 85 (1-2), 211–218. doi: 10.1016/j.agwat.2006.04.008
Tahjib-Ul-Arif, M., Abu Sayed, M., Islam, M. M., Siddiqui, M. N., Begum, S. N., Hossain, M. A. (2018). Screening of rice landraces (Oryza sativa l.) for seedling stage salinity tolerance using morpho-physiological and molecular markers. Acta Physiol. Plant 40 (4), 70. doi: 10.1007/s11738-018-2645-4
Uzair, M., Ali, M., Fiaz, S., Attia, K., Khan, N., Al-Doss, A. A., et al. (2022). The characterization of wheat genotypes for salinity tolerance using morpho-physiological indices under hydroponic conditions. Saudi J. Biol. Sci. 29 (6), 103299. doi: 10.1016/j.sjbs.2022.103299
Wang, X., Li, Q., Xie, J., Huang, M., Cai, J., Zhou, Q., et al. (2021). Abscisic acid and jasmonic acid are involved in drought priming-induced tolerance to drought in wheat. Crop J. 9 (1), 120–132. doi: 10.1016/j.cj.2020.06.002
Wang, X., Vignjevic, M., Jiang, D., Jacobsen, S., Wollenweber, B. (2014). Improved tolerance to drought stress after anthesis due to priming before anthesis in wheat (Triticum aestivum l.) var. vinjett. J. Exp. Bot. 65 (22), 6441–6456. doi: 10.1093/jxb/eru362
Wang, X., Zhang, J., Song, J., Huang, M., Cai, J., Zhou, Q., et al. (2020). Abscisic acid and hydrogen peroxide are involved in drought priming-induced drought tolerance in wheat (Triticum aestivumL.). Plant Biol. 22 (6), 1113–1122. doi: 10.1111/plb.13143
Wu, X.-l., Bao, W.-k. (2012). Statistical analysis of leaf water use efficiency and physiology traits of winter wheat under drought condition. J. Integr. Agric. 11 (1), 82–89. doi: 10.1016/s1671-2927(12)60785-8
Wu, D., Li, Z., Zhu, Y., Li, X., Wu, Y., Fang, S. (2021). A new agricultural drought index for monitoring the water stress of winter wheat. Agric. Water Manage. 244, 106599. doi: 10.1016/j.agwat.2020.106599
Yang, J. C., Zhang, J. H. (2006). Grain filling of cereals under soil drying. New Phytol. 169 (2), 223–236. doi: 10.1111/j.1469-8137.2005.01597.x
Yu, S., Zhang, N., Kaiser, E., Li, G., An, D., Sun, Q., et al. (2021). Integrating chlorophyll fluorescence parameters into a crop model improves growth prediction under severe drought. Agric. For. Meteorol. 303, 108367. doi: 10.1016/j.agrformet.2021.108367
Zahid, Z., Khan, M. K. R., Hameed, A., Akhtar, M., Ditta, A., Hassan, H. M., et al. (2021). Dissection of drought tolerance in upland cotton through morpho-physiological and biochemical traits at seedling stage. Front. Plant Sci. 12. doi: 10.3389/fpls.2021.627107
Zhang, Y., Xu, W., Wang, H., Dong, H., Qi, X., Zhao, M., et al. (2016). Progress in genetic improvement of grain yield and related physiological traits of Chinese wheat in henan province. Field Crops Res. 199, 117–128. doi: 10.1016/j.fcr.2016.09.022
Zhao, D., Shen, J., Lang, K., Liu, Q., Li, Q. (2013). Effects of irrigation and wide-precision planting on water use, radiation interception, and grain yield of winter wheat in the north China plain. Agric. Water Manage. 118, 87–92. doi: 10.1016/j.agwat.2012.11.019
Keywords: winter wheat, drought resistance, screening, principal component analysis, comprehensive evaluation
Citation: Bao X, Hou X, Duan W, Yin B, Ren J, Wang Y, Liu X, Gu L and Zhen W (2023) Screening and evaluation of drought resistance traits of winter wheat in the North China Plain. Front. Plant Sci. 14:1194759. doi: 10.3389/fpls.2023.1194759
Received: 27 March 2023; Accepted: 02 May 2023;
Published: 16 June 2023.
Edited by:
Yang Gao, Farmland Irrigation Research Institute, (CAAS), ChinaReviewed by:
Klára Kosová, Crop Research Institute (CRI), CzechiaCopyright © 2023 Bao, Hou, Duan, Yin, Ren, Wang, Liu, Gu and Zhen. This is an open-access article distributed under the terms of the Creative Commons Attribution License (CC BY). The use, distribution or reproduction in other forums is permitted, provided the original author(s) and the copyright owner(s) are credited and that the original publication in this journal is cited, in accordance with accepted academic practice. No use, distribution or reproduction is permitted which does not comply with these terms.
*Correspondence: Wenchao Zhen, d2VuY2hhb0BoZWJhdS5lZHUuY24=; Limin Gu, Z3VsaW1pbnFAMTYzLmNvbQ==; Xuejing Liu, bGl1eHVlamluZzgzMDUyN0AxNjMuY29t
†These authors have contributed equally to this work
Disclaimer: All claims expressed in this article are solely those of the authors and do not necessarily represent those of their affiliated organizations, or those of the publisher, the editors and the reviewers. Any product that may be evaluated in this article or claim that may be made by its manufacturer is not guaranteed or endorsed by the publisher.
Research integrity at Frontiers
Learn more about the work of our research integrity team to safeguard the quality of each article we publish.