 Maitry Paul1,2†
 Jaakko Tanskanen1,2,3†Marko Jääskeläinen1,2†
 Wei Chang1,2†
 Ahan Dalal4†
 Menachem Moshelion4†
 Alan H. Schulman1,2,3†*
- 1HiLIFE Institute of Biotechnology, University of Helsinki, Helsinki, Finland
- 2Viikki Plant Science Centre (ViPS), University of Helsinki, Helsinki, Finland
- 3Production Systems, Natural Resources Institute Finland (LUKE), Helsinki, Finland
- 4The Robert H. Smith Institute of Plant Sciences and Genetics in Agriculture, The Hebrew University of Jerusalem, Rehovot, Israel
Introduction: During drought, plants close their stomata at a critical soil water content (SWC), together with making diverse physiological, developmental, and biochemical responses.
Methods: Using precision-phenotyping lysimeters, we imposed pre-flowering drought on four barley varieties (Arvo, Golden Promise, Hankkija 673, and Morex) and followed their physiological responses. For Golden Promise, we carried out RNA-seq on leaf transcripts before and during drought and during recovery, also examining retrotransposon BARE1expression. Transcriptional data were subjected to network analysis.
Results: The varieties differed by their critical SWC (ϴcrit), Hankkija 673 responding at the highest and Golden Promise at the lowest. Pathways connected to drought and salinity response were strongly upregulated during drought; pathways connected to growth and development were strongly downregulated. During recovery, growth and development pathways were upregulated; altogether, 117 networked genes involved in ubiquitin-mediated autophagy were downregulated.
Discussion: The differential response to SWC suggests adaptation to distinct rainfall patterns. We identified several strongly differentially expressed genes not earlier associated with drought response in barley. BARE1 transcription is strongly transcriptionally upregulated by drought and downregulated during recovery unequally between the investigated cultivars. The downregulation of networked autophagy genes suggests a role for autophagy in drought response; its importance to resilience should be further investigated.
1 Introduction
Optimization of the balance between carbon fixed and water lost by transpiration is a central problem for plants. In drought, the challenge to water homeostasis from decreased water potential generates a response by the plant at a critical soil water content (SWC), which leads to stomatal closure, even in daylight, to reduce water loss. The associated dehydration and its consequences are commonly referred to as drought stress. Drought response involves mechanisms and signaling cascades, leading to stomatal closure (Merilo et al., 2015) and to physiological and metabolic changes (Jogawat et al., 2021). Mechanisms to counter dehydration and cellular damage include accumulation of osmolytes to mediate osmotic adjustment (Hildebrandt, 2018) and enzymatic and non-enzymatic scavenging of excess reactive oxygen species (ROS) (Das and Roychoudhury, 2014), as well as changes in the chloroplast proteome (Chen et al., 2021a).
Two contrasting responses to water limitation have been described: isohydric and anisohydric (Sade et al., 2012). Isohydric implies maintenance of constant water potential; many physiological parameters are involved (Scharwies and Dinneny, 2019). Barley has been shown to be diurnally anisohydric (Tardieu and Simonneau, 1998). The terms also have been applied broadly for drought response strategy (Sade et al., 2012), isohydric plants conservating water, closing stomata at a relatively high SWC, sacrificing carbon fixation but delaying plant dehydration. This strategy may reduce risk from early droughts in climates where the probability of precipitation increases during the growing season. An anisohydric plant delays stomatal closure and continues fixing carbon, a strategy consistent with environments having terminal droughts or with those where dry periods are short and show little seasonal variation.
Studies in Arabidopsis indicate that induction of autophagy is needed for drought tolerance (Avin-Wittenberg, 2019). Autophagy is an evolutionarily conserved mechanism for recycling damaged proteins and cellular organelles by transport to the vacuoles or lysosomes for degradation (Chen et al., 2021b). Rewatering at the end of drought may result in the resumption of normal diurnal stomatal opening, recovery of photosynthesis, and the resumption of growth. The occurrence, degree, and rate of recovery strongly depends both on the intensity and duration of drought and on the species; recovery has relatively little studied on its own (Xu et al., 2010; Lawas et al., 2019; Chen et al., 2021b; Qi et al., 2021) but involves the ABA signaling pathway (Cao et al., 2021).
Drought is also well known to induce transcription of transposable elements, particularly retrotransposons (RLX; Wicker et al. (2007). The RLXs have been shown to be transcriptionally induced by stresses ranging from ionizing and UV radiation to drought and heavy metals (Kimura et al., 2001; Grandbastien et al., 2005; Ramallo et al., 2008; Makarevitch et al., 2015; Galindo-Gonzalez et al., 2017). For barley (Hordum vulgare L.) RLX, earlier studies indicated that BARE1 transcripts and translational products accumulated under drought (Jääskeläinen et al., 2013) and appeared linked to the abscisic acid (ABA) signaling pathway through the ABA-response elements (ABREs) present in the BARE1promoter (Jääskeläinen et al., 2013).
Optimization of drought response for an annual crop such as barley is related to the climatic zone for which the plant is bred. In some zones, the probability of drought may be greater early in the growing season (e.g., Nordic conditions, before flowering); in others, the probability of drought increases during seed maturation (Mediterranean basin, as terminal drought) (Rollins et al., 2013; Tao et al., 2017). Here, we focus on pre-flowering drought in four barley cultivars shown in pilot experiments to respond differentially to SWC (Dalal et al., in prep). For one of them (Golden Promise), the goal was to carry out transcriptional analyses for leaves for both genes and the BARE1 RLX at physiologically defined time points before, during, and after drought. Gene expression data were then input to network analysis to understand the activated pathways and possible connections to RLX stress response.
2 Materials and methods
2.1 Plant material
Barley cultivars Arvo, Golden Promise (“GP”), Hankkija 673 (“H673”), and Morex were selected from the diversity set of the ERA-NET SusCrop Climbar Project. GP is the standard genotype for transformation in barley (Schreiber et al., 2019), whereas preliminary experiments indicated that Arvo and H673 have high and low stomatal conductance, respectively (Dalal et al., in prep.). Morex is the established reference genome assembly in barley (Beier et al., 2017; Mascher et al., 2017; Mascher et al., 2021).
2.2 Growth conditions
Plants were grown during the winter season in the iCORE functional phenotyping greenhouse (https://plantscience.agri.huji.ac.il/icore-center ) under natural sunlight, with moderate temperature control, which closely reflects the natural external environment (Halperin et al., 2017; Galkin et al., 2018) (Figure 1A). There, drought experiments were carried out with a randomized block design on a gravimetric functional phenotyping platform (Dalal et al., 2020; Gosa SC et al, 2022) (Plantarray, PA 3.0, PlantDitech Ltd., Yavne, Israel), which allows simultaneous standardized control of drought treatment with continuous monitoring of multiple physiological parameters. The platform comprises temperature-compensated load cells (lysimeters) for simultaneous and continuous gravimetric monitoring of water relations in the soil–plant–atmosphere continuum (SPAC) under dynamic environmental conditions (Halperin et al., 2017).
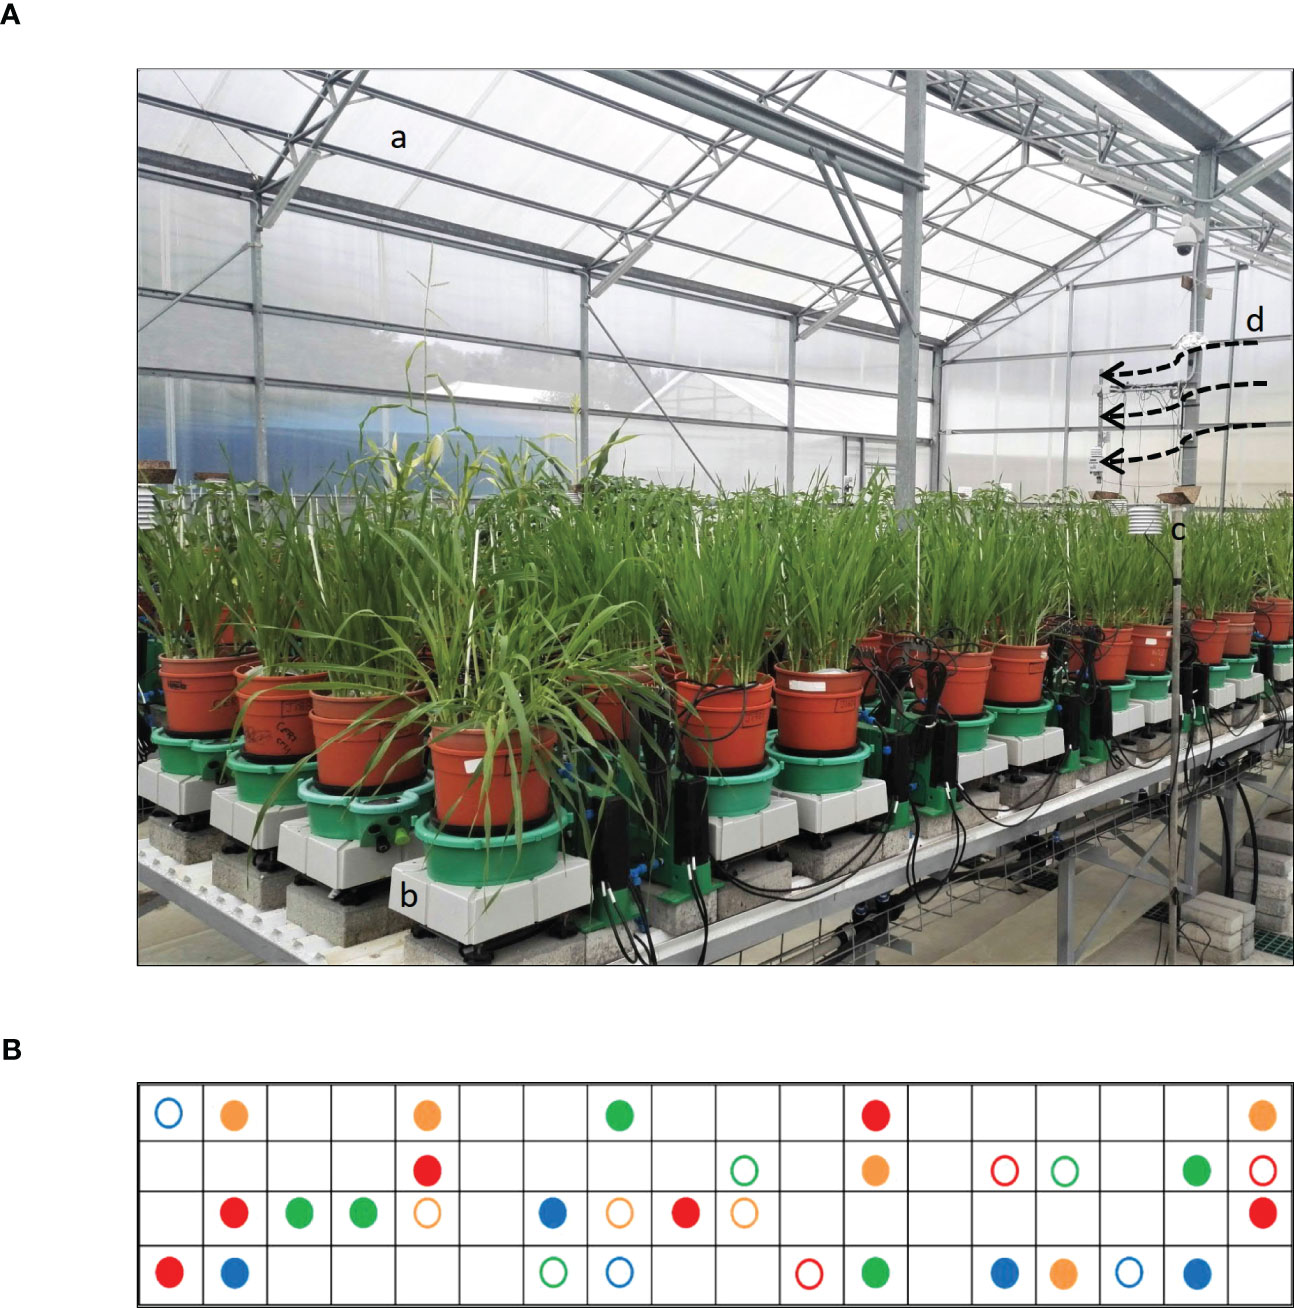
Figure 1 Experimental setup. (A) Lysimeters of gravimetric functional phenotyping platform, comprising 72 lysimeter platforms with soil probes and four weather stations. The setup features: (a) minimally controlled greenhouse, (b) lysimeter platform, (c) weather station, and (d) cooling vent. (B) Table diagram for sample pots distributed according to a randomized block design. Filled circles are drought treatments; empty circles are well-watered (controls). Arvo, orange; GP, red; H673, green; Morex, blue.
Seeds were sown in germination trays and then transplanted at the 3- to 4-leaf stage (2 weeks old) to pots. Before transplanting, seedling roots were carefully washed to remove the original soil, planted into potting soil [“Bental 11”, Tuff Marom Golan, Israel; four per 3.9-liter pot; Dalal et al. (2020)], and then placed onto lysimeters (Dalal et al., 2019; Gosa SC et al, 2022). Each cultivar was grown in four to six biological replicates for the drought treatment and in three biological replicates for the controls, which were maintained under well-irrigated conditions (Figure 1B). The plants were grown at 18°C–25°C, 20%–35% relative humidity, and 10-h light/14-h dark, typical of the greenhouse’s semi-controlled conditions as affected by the external Mediterranean winter. Temperature, humidity, and photosynthetically active radiation (PAR) were monitored as described earlier (Dalal et al., 2020; Gosa SC et al, 2022). The vapor pressure deficit (VPD) ranged between 0.2 and 4.0 kPa in the greenhouse and represented typical weather fluctuations during winters in Central Israel (Figure 2B).
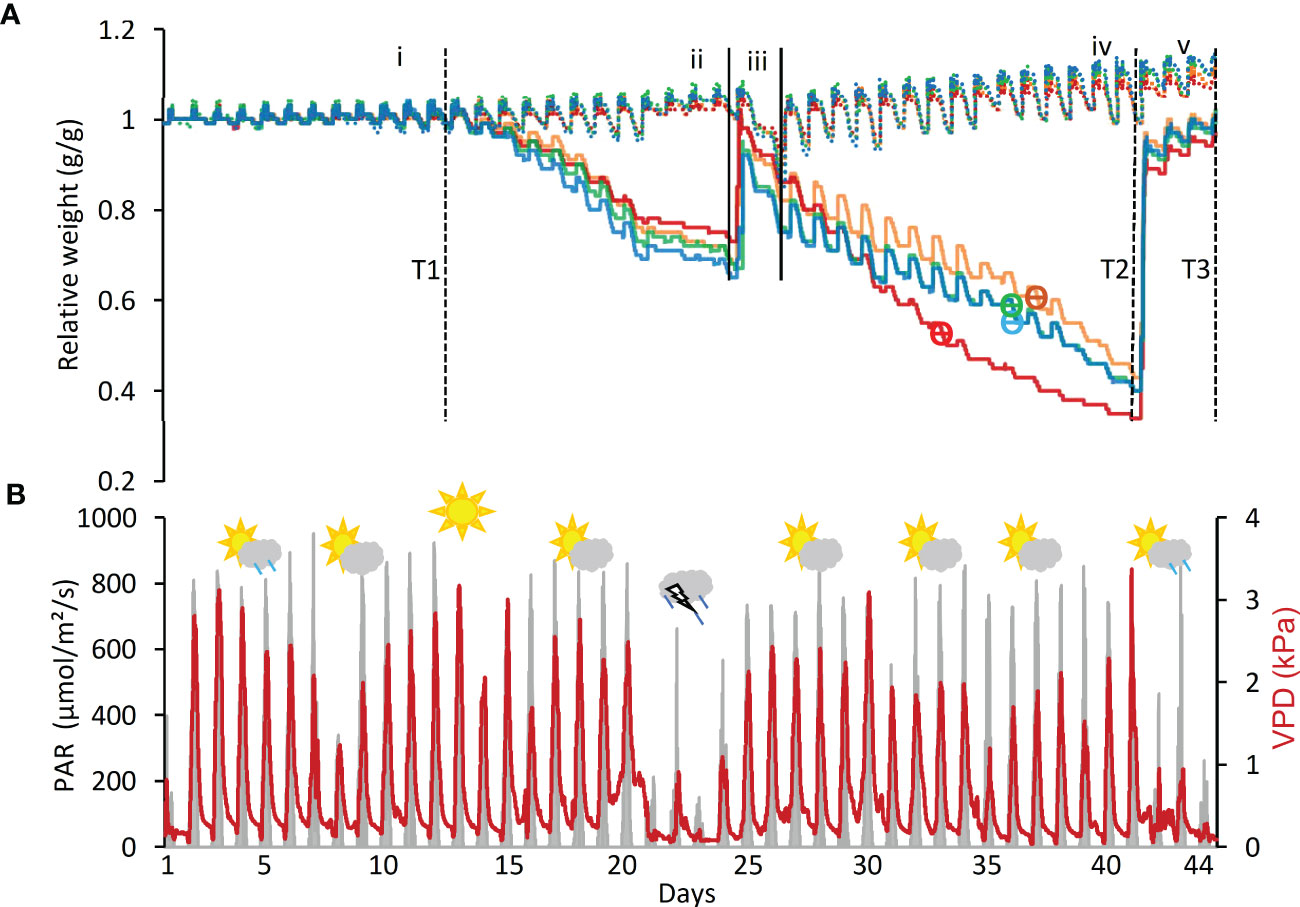
Figure 2 Key system parameters during drought and recovery. (A) Relative change in system weight of all control and drought-treated pots. The experiment is divided into five phases:(i)well-watered,(ii)dry phase I,rewatering I, (iv) dry phase II, and (v) rewatering II. Drought samples, solid lines; well-irrigated controls, dashed. Cultivars are Arvo, orange; Golden Promise (GP), red; Hankkija 673 (H673), green; Morex, blue. Day of ϴ crit indicated by ϴ on the cultivars’ curves. Time points (T) for collection of RNA from leaf samples are: T1, last day of well-watered; T2, last day of drought; T3, last day of recovery. (B) Photosynthetically active radiation (PAR) and vapor pressure deficit (VPD) over the course of the experiment. The weather symbols depict conditions outdoors during this time each symbol representing the average of five days.
2.3 Experimental design
To mimic the onset of a drought, the experiment was divided into five phases on the lysimeter platform: (i) well watered, (ii) dry phase I (iii), rewatering I (iv), dry phase II, and (v) rewatering II (Figure 2A). For the well-watered phase (first 12 days) and for the controls throughout, plants daily received three nighttime irrigations at 3-h intervals to reach field capacity. The volumetric water content (VWC) was calculated with the SPAC analytical software embedded in the Plantarray system (Figure 3). In dry phase I, the system was set to irrigate droughted plants to 80% of their own previous day’s transpiration, so that these would be subjected to gradual water stress from days 13 to 24, followed by rewatering (rewatering I) on the night of day 25. Dry phase II extended from days 26 to 41 with the same irrigation parameters as dry phase I, until the time when the droughted plants reached <100 g of daily transpiration (DT; around 20% to 30% of controls) (Figure 4D). Rewatering II began on day 42. Daily night irrigation was given to all plants until day 44. At that point, several irrigation cycles were used to moisten the soil and to ensure a laterally uniform SWC in the pots. VPD data were continuously monitored (Figure 2B).
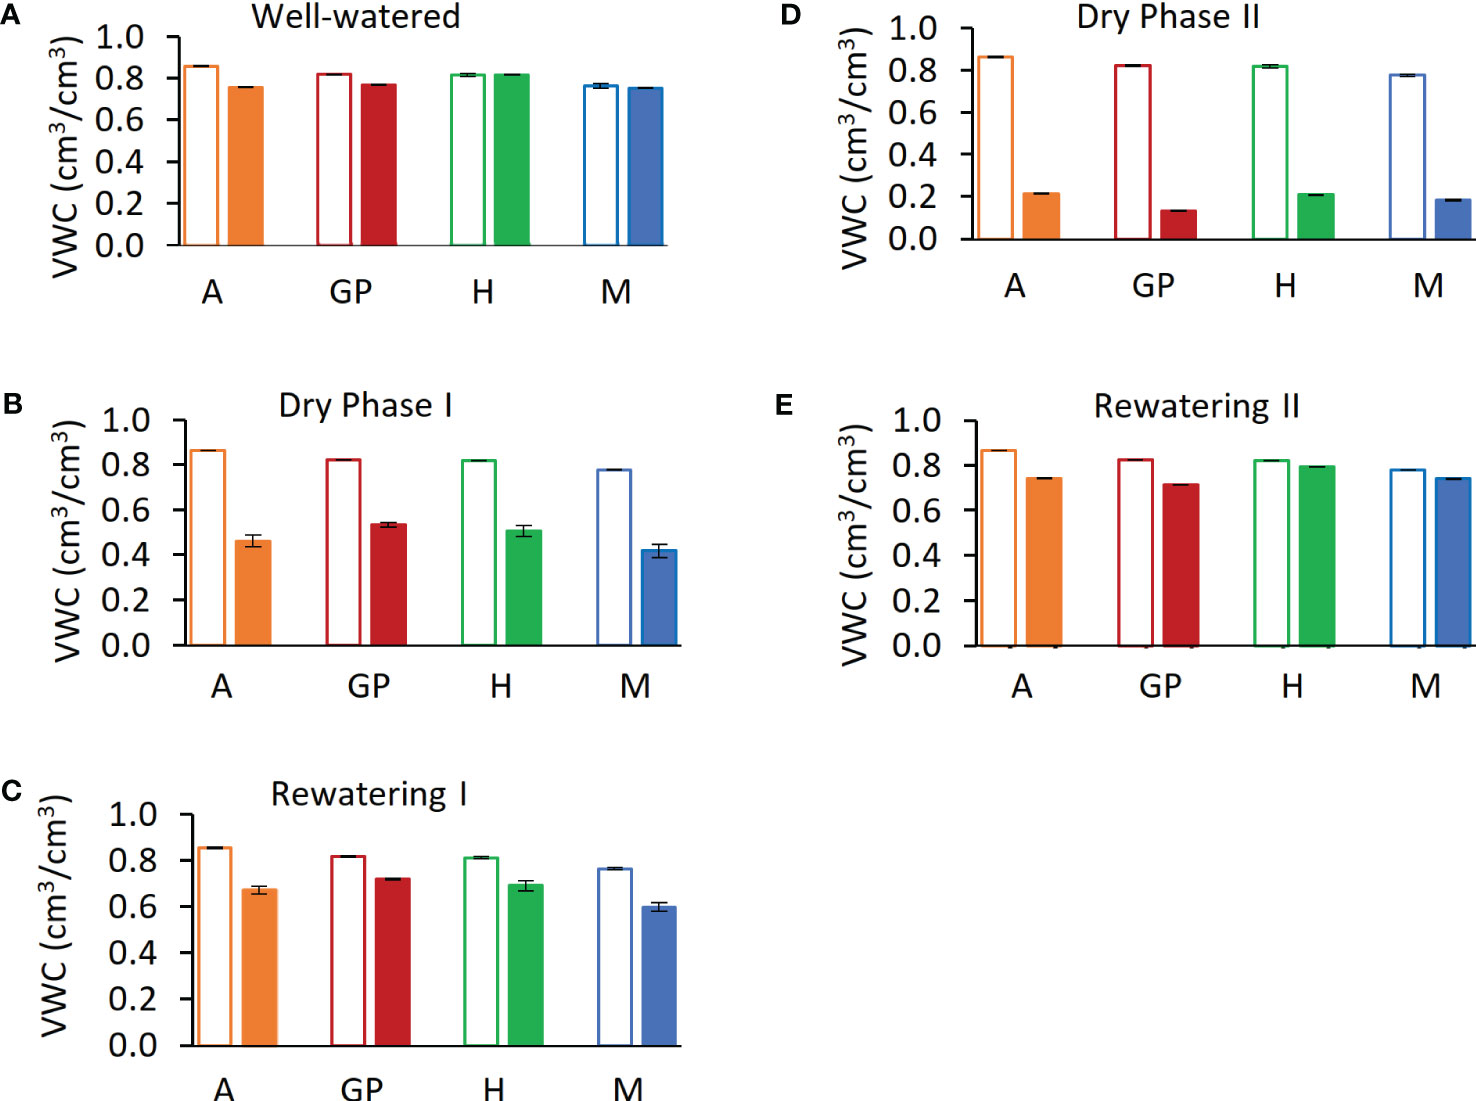
Figure 3 Calculated soil volumetric water content (VWC) during five phases of the experiment. (A) Day 12, last day of well-watered (phase i). (B) Day 24, last day of dry phase I (C) Day 25, last day of rewatering I (D) Day 41, dry phase II. (E) Day 44, last day of rewatering II. Solid bars represent drought samples; empty bars represent controls. Arvo (A), orange; red, Golden Promise (GP), green; Hankkija 673 (H); blue, Morex (M)..
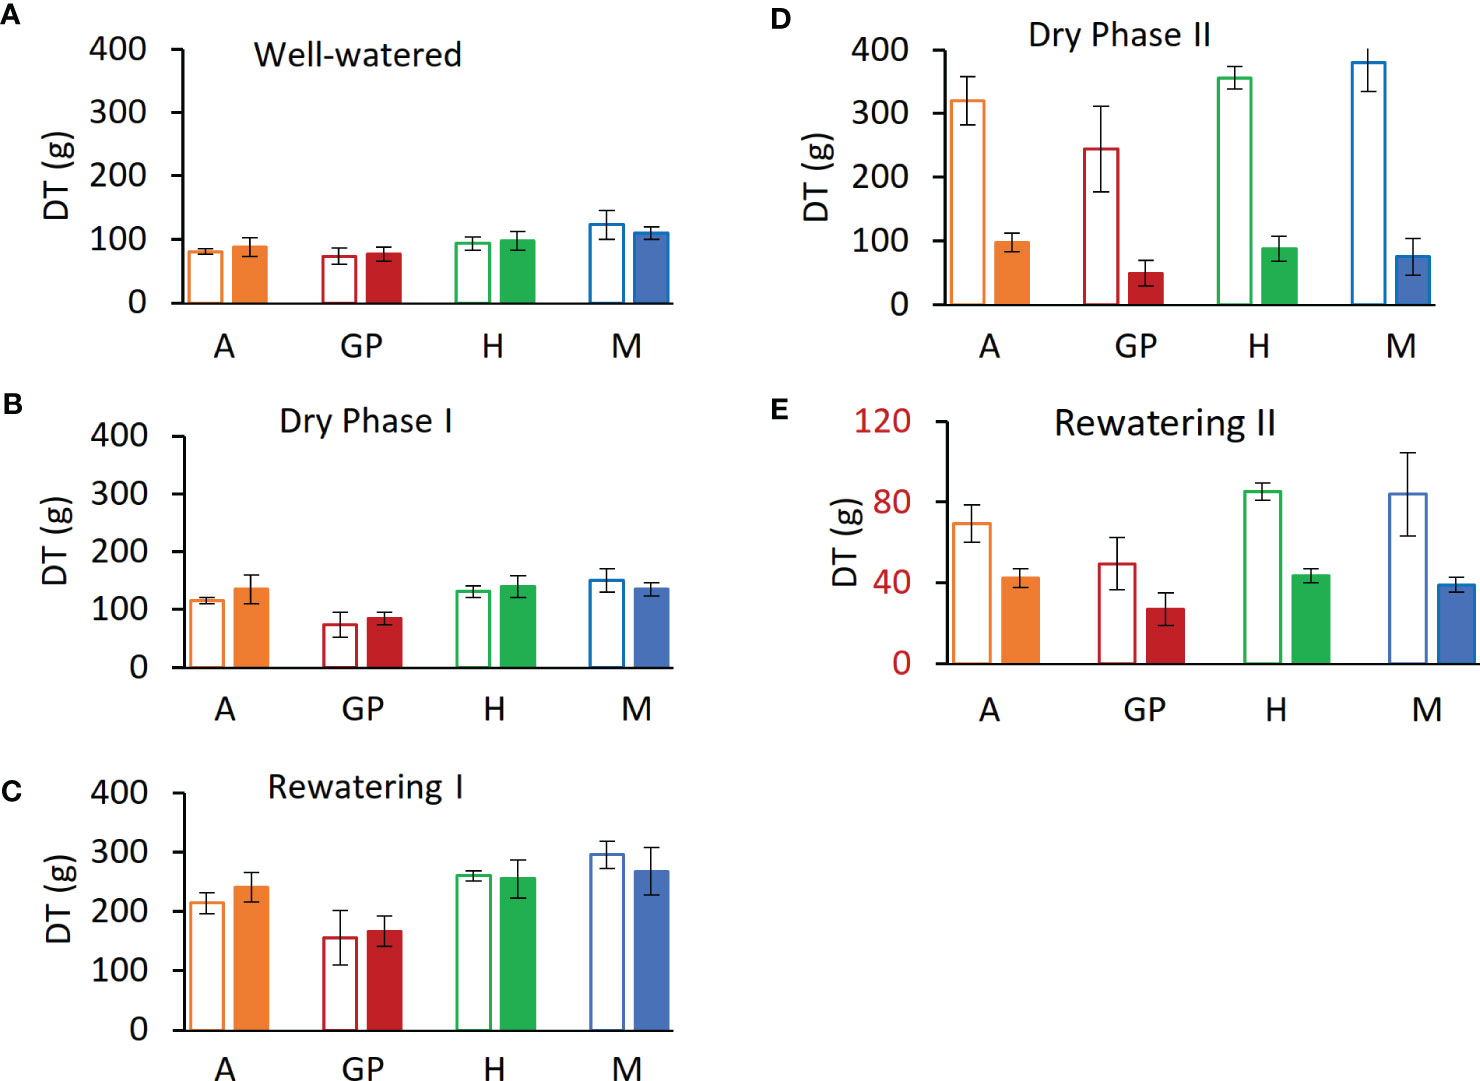
Figure 4 Daily transpiration (DT) at the end of each experimental phase. (A) Day 12, last day of well-watered (phase i). (B) Day 24, last day of dry phase I (C) Day 25, last day of Rewatering I (D) Day 41, dry phase II. (E) Day 44, last day of rewatering II. Solid bars represent drought samples, empty bars controls. Orange represents Arvo (A); red, Golden Promise (GP); green, Hankkija 673 (H); blue, Morex (M).
2.4 Sampling and isolation of RNA
Second leaves from the youngest tillers were collected for RNA analysis: time point 1 (T1) on the last day of the well-watered phase (day 12); T2, on the last day of dry phase II (day 41); T3, last day of rewatering II (day 44). Well-watered control samples at the same growth stages were collected at T2 and T3. For RNA extraction, leaf samples were collected in liquid N2 and later ground and stored in TRIzol reagent (Invitrogen). Total RNA was extracted from the leaf samples with the Direct-zol RNA Miniprep Plus kit according to the manufacturer’s (Zymo Research Europe GmbH) guidelines. RNA (1 µg) from each sample was treated with Ambion® DNase I (RNase-free; Applied Biosystems) in a 20-µl reaction mixture for 90 min at 37°C to remove remaining DNA. An RNeasy MinElute Cleanup Kit (Qiagen) was used to purify and concentrate the RNA from the DNase treatments. RNA quantity and quality were checked both spectrophotometrically (NANODROP-2000 spectrophotometer, Thermo Scientific) and by agarose gel electrophoresis.
2.5 qPCR analysis
Reverse transcription to cDNA was carried out in reactions containing 200 ng of total RNA, 1 µl of Invitrogen™ SuperScript® IV Reverse Transcriptase (RT) (Thermo Fisher Scientific), 1 µl of 10 mM deoxynucleotide triphosphates (dNTPs; Thermo Scientific),, and 0.5 µl of 10 µM primer E1820 (AAGCAGTGGTAACAACGCAGAGTACT30NA) as the oligo(dT) primer (Chang et al., 2013). For qPCR, 10 µl of reactions comprised 0.5 µl of cDNA as template, 5 µl of SsoAdvanced™ Universal SYBR® Green Supermix, 0.1 µl of each forward and reverse primer, and 4.3 µl of water. Reactions were run on a CFX 384 Real-Time PCR detection system (Bio-Rad) in three technical replicates as follows: activation for 2 min at 94°C; 40 cycles comprising denaturation for 30 s at 94°C, annealing for 30 s at 56°C, and extension for 1 min at 72°C. Relative quantification of the cDNA product was made by the 2− ΔΔCT method (Livak and Schmittgen, 2001). All primers used for qPCR are listed in Supplementary Table S1. The amplification efficiency of all the primers has been checked; R2 was from 0.97 to 0.99.
2.6 RNA-seq and network analysis
Three sets of biological replicates from each time point and their corresponding controls were taken from cv. GP for RNA-seq analysis. Libraries were constructed using the TruSeq Stranded Total RNA kit with plant cytoplasmic and chloroplast ribosomal RNA removal (Illumina); adaptors were TruSeq adaptors. FastQC (Andrews, 2010) was used to check the quality control metrics of the raw reads and to trim the RNA-seq data. Adapter sequences were removed with Trimmomatic (Bolger et al., 2014). The STAR alignment method (Dobin et al., 2013) served to map sequence reads to the GP genome (GPV1.48, Ensembl Plants). Next, to quantify transcript expression, the Salmon tool was applied (Patro et al., 2017). Differentially expressed genes (DEGs) and principal component analysis (PCA) plots were obtained with DESeq2 (Love et al., 2014; Hong et al., 2020). Multidimensional scaling (MDS) plots were used to verify the approximate expression differences between sample replicates.
From the clean reads, those with pADJ value < 0.05 for their fold change were run in g:Profiler for functional enrichment analysis and to obtain a Gene Matrix Transposed (GMT) file for Cytoscape (Reimand et al., 2019). Cytoscape_v3.8.2 was then used to develop network clusters for biological pathways. The parameters used were false discovery rate (FDR) q-value cutoff = 1, node cutoff = 0.5, edge cutoff = 0.375, and significance threshold for functional enrichment p≤ 0.01.
3 Results
3.1 Whole-plant water relations over the course of drought and recovery
Four barley varieties (Arvo, GP, H673, and Morex), which, in preliminary experiments, differed in their water use strategies, were placed on lysimeters and measured through the four experimental phases. Transpiration and plant weight were followed continuously. The SWC at which the transpiration rate drops in response to drought [ϴ critical point (ϴcrit)] was calculated from the data.
Daily transpiration.Analysis of DT of the four varieties on the Plantarray platform revealed variation in their transpiration both between the varieties (Figure 4, Supplementary Figure S1) and day by day (Figure 5A, Supplementary Figures S1A–C). All plants were exposed to similar changes in PAR and VPD simultaneously (Figure 1), which were monitored throughout the experiment (Figure 2B); from days 21 to 23, the cloudy and rainy weather outside the minimally controlled greenhouse reduced the PAR and VPD within, lowering DT. For the well-watered control plants of all varieties, DT gradually increased along with plant size over the course of the experiment, closely matched by the droughted plants, which then diverged following the onset of dry phase II. The overall DT of Morex is the highest, followed by H673, Arvo, and GP. The DT of droughted Morex plants diverged from controls by day 20 (Supplementary Figure S1C) and H673 by day 25 (Supplementary Figure S1B), whereas Arvo and GP only by day 30 (Figure 5A, Supplementary Figure S1A). A complete return to control whole-plant transpiration was not observed for any of the varieties before termination of the experiment on day 44; all plants showed low DT between days 42 and 44, linked to low VPD and PAR.
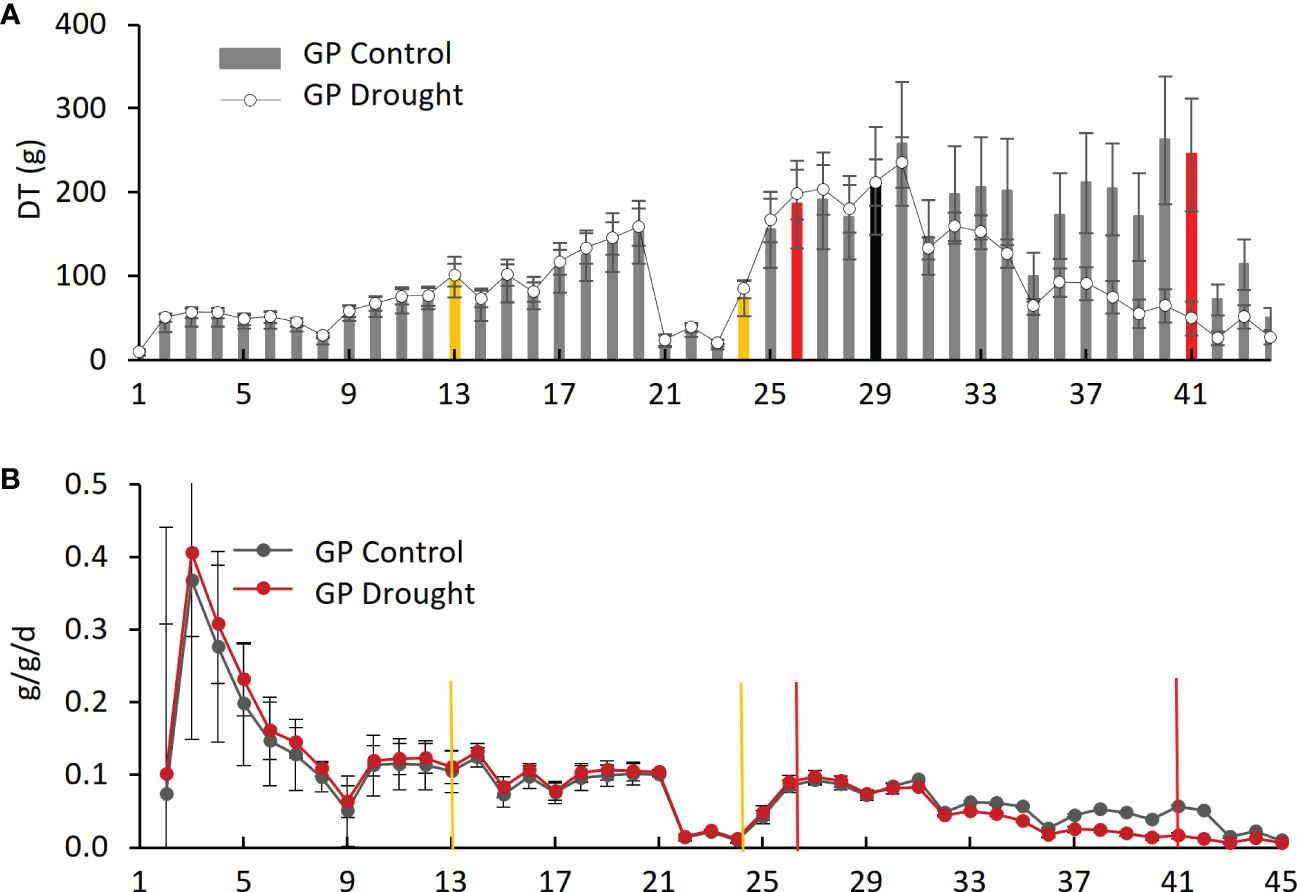
Figure 5 Daily transpiration and plant weight over the experimental period for Golden Promise (GP). (A) Daily transpiration (DT). The black bar represents the divergence of drought from control plants. (B) Daily specific change in plant weight (g/g/d). Yellow bars represent the start and end of dry phase I, and red bars show the start and end of dry phase II.
3.2 Effect of drought on the plant growth and transpiration
Changes in net plant weight as a measure of growth were calculated from the Plantarray system as before (Halperin et al., 2017). The high rate of growth observed for all varieties between days 2 and 9 (Figure 5B, Supplementary Figures S2A–C) corresponds to the peak in PAR during the same period (Figure 2B). The control plants showed similar trends in growth rates throughout the experiment. The droughted plants of all four varieties displayed specific growth rates lower than their well-watered controls during drought: first in Morex (day 23), then Arvo (day 29), and then both H673 and GP (on day 30) (Supplementary Figure S2, Figure 5B). The relative effect of drought on the growth rate of the four varieties is most apparent when the rate of change is considered.
The ϴcrit was calculated for all varieties (Figure 6) on the basis of midday whole-plant transpiration (Halperin et al., 2017). The transpiration rates of all four varieties remained constant up to a VWC of 0.55 and then declined, with the VWC at the ϴcrit differing by variety. Arvo, H673, and Morex display similar initial transpiration rates, whereas GP was about 30% lower. The H673 ϴcrit occurred at 0.53 VWC on day 36, Arvo at 0.52 on day 37, Morex at 0.46 on day 36, and GP at 0.42 already on day 33. Following stomatal closure at ϴcrit, weight (water) loss preceded at different rates among the varieties. Although GP had the lowest initial transpiration rate (Figure 6), it declined the fastest, whereas Arvo, with a high transpiration rate, declined the slowest.
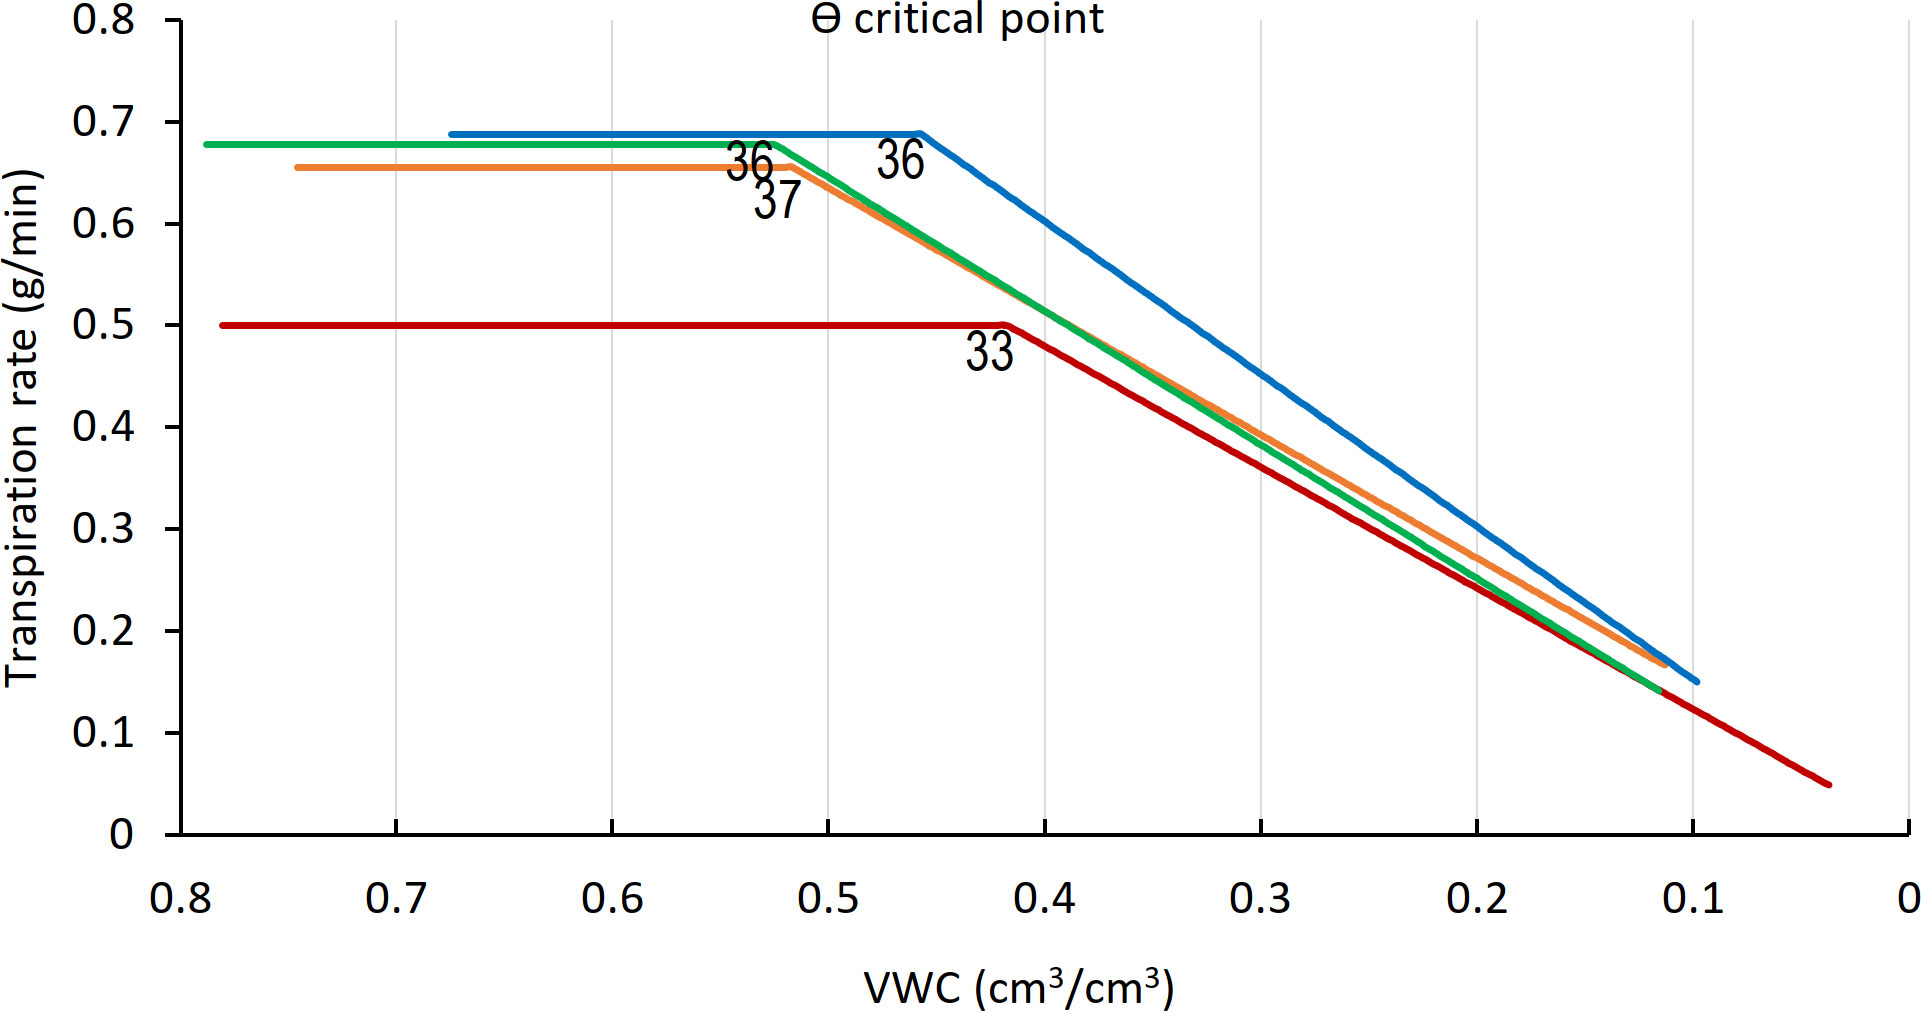
Figure 6 ϴ critical point (ϴcrit), for midday whole-plant transpiration versus calculated VWC. The inflection points in the fitted transpiration lines indicate the ϴcrit. Arvo, orange; Golden Promise, red; Hankkija 673 (H673), green; Morex, blue. Day on which the ϴcrit occurred is indicated by a number adjacent to the inflection point..
3.3 Gene expression analysis
An average of 33 million reads per sample were generated by RNA-seq, which showed the expression of approximately 27,000 genes. To check the quality of the gene expression, DESeq2 dispersion estimates were made to reflect the variance in gene expression for a given mean value; values were adjusted as the basis for significance testing (Supplementary Figure S3). PCA of differential gene expression showed an alignment of all groups of samples along PC1 and a narrow dispersion of all control groups along PC2 (Supplementary Figure S4). Movement of the expression pattern during the course of the experiment shows a shift within PC2 during drought and then a return to near the position of the control groups for the recovery samples (Supplementary Figure S4), consistent with ongoing physiological recovery. Of the genes detected, those differentially expressed (DEGs) with adjusted p < 0.01 include 611 that were upregulated and 643 downregulated in drought compared to the well-watered controls samples taken on the same day, whereas 697 were upgregulated and 282 downregulated during recovery compared with the controls on the same day (Supplementary Tables S2–S5).
RNA-seq reads were annotated by reference to the cv. Morex genome (release 2), transcript expression was quantified, and DEGs were identified. In the drought samples, the most highly upregulated gene compared to the well-watered control was for glutathione s-transferase (Table 1), with 3-million-fold more expression than control; in the samples from plants undergoing recovery, this gene dropped by 8.6-fold compared with drought. Altogether, 44 genes showed more than 100-fold upregulation and 218 genes over 10-fold upregulation compared to controls (Supplementary Table S2). The most downregulated gene was for a cytochrome P450 family protein (Table 2), with around 3,000-fold less expression than control. Conversely, among the DEGs in recovery compared to drought, this gene showed the third highest upregulation, 195-fold (Supplementary Table S7). Altogether, nine genes showed more than 100-fold downregulation and 53 genes over 10-fold downregulation (Supplementary Table S3).
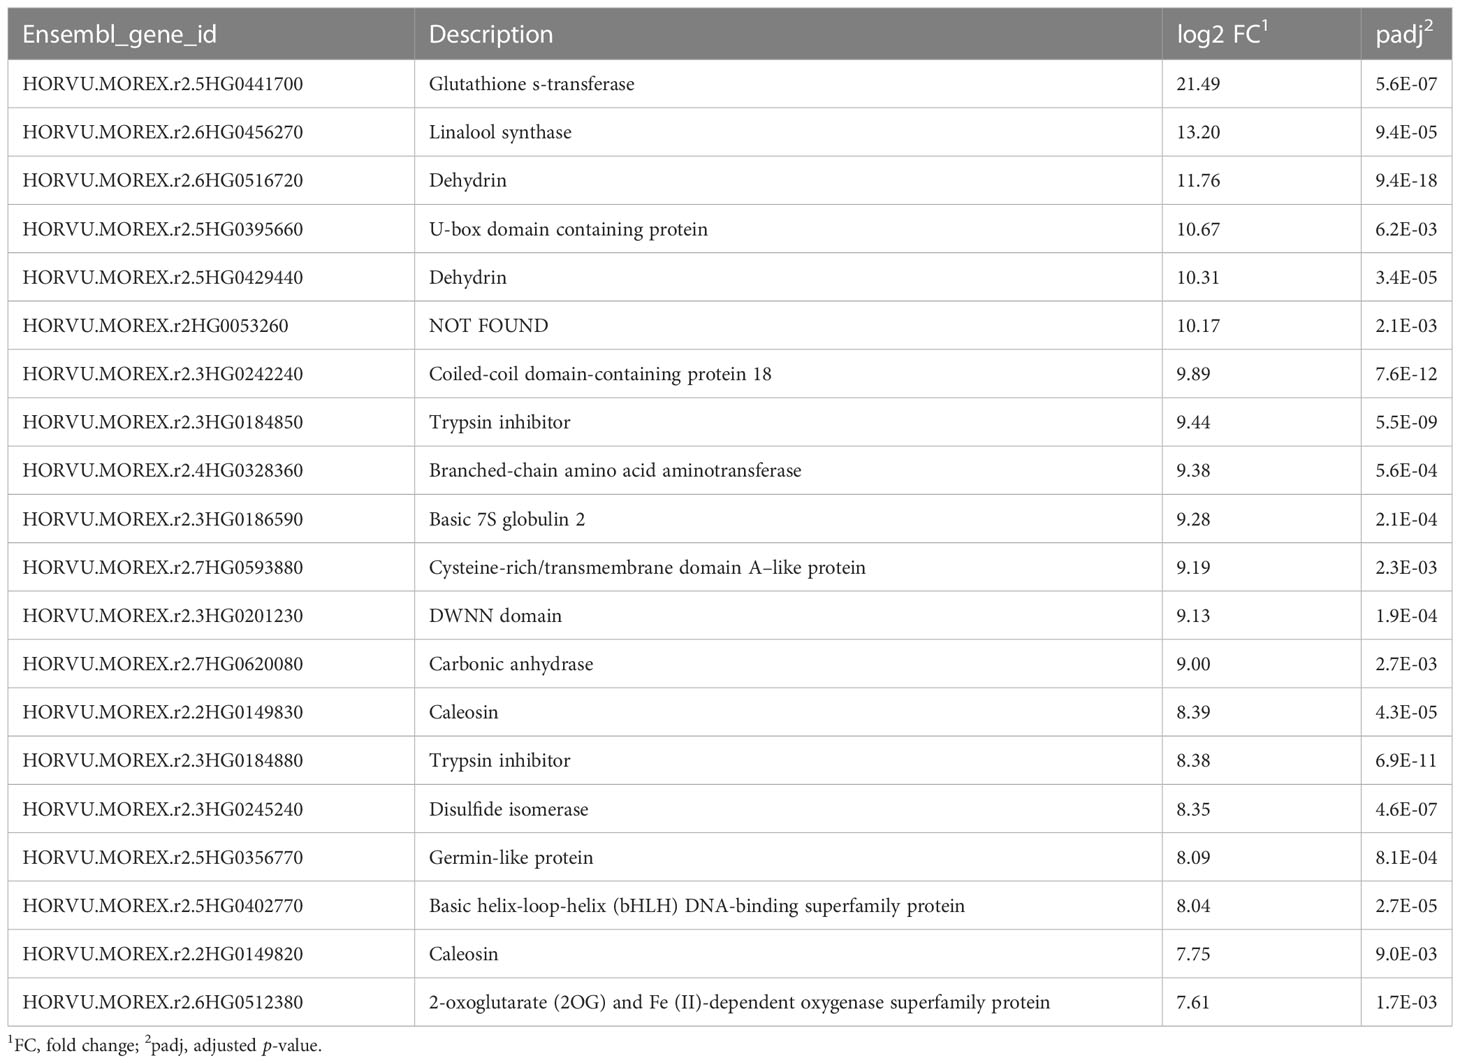
Table 1 Top 20 upregulated genes, drought phase.
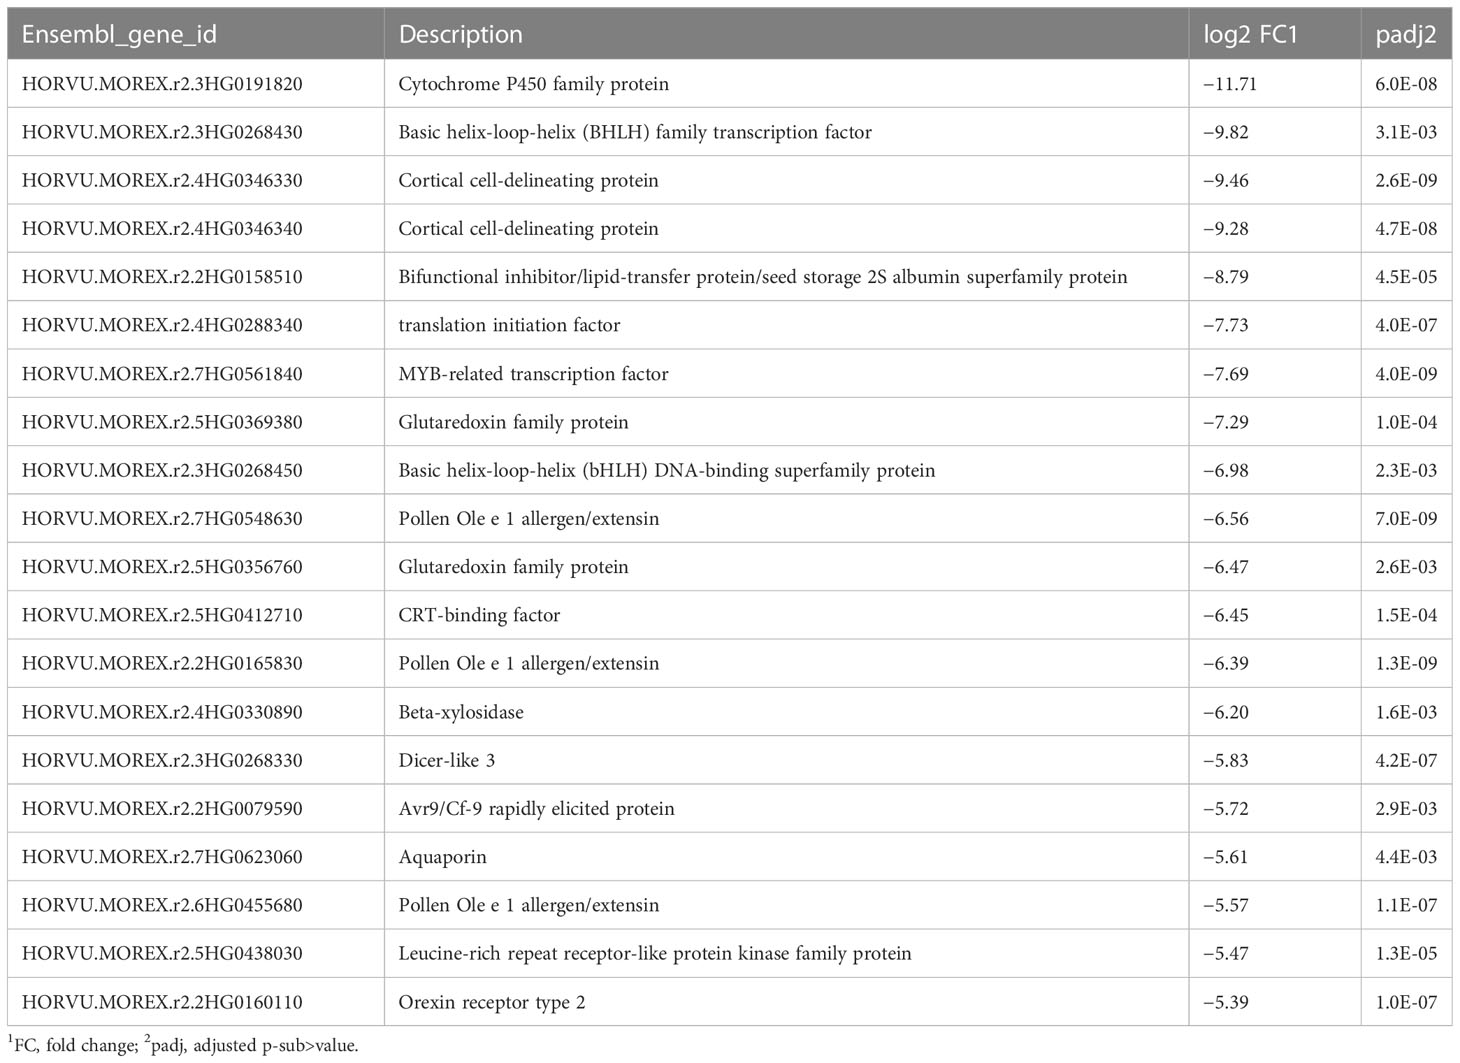
Table 2 Top 20 downregulated genes, drought phase.
In the recovery samples, compared to the controls that never experienced drought, the most upregulated gene was annotated as a leguminosin group485 secreted peptide, having 16-billion-fold more expression than in the controls (Table 3). This gene has been reported in Medicago truncatula root during root nodulation, with gene ID Medtr5g064530 and Medtr2g009450. However, a BLASTp of the transcript corresponding to the barley gene (HORVU.MOREX.r2.5HG0428280.1) has its best match (89% identity, Expected value (E-value) of 2e-36) to a serine/threonine-protein phosphatase 7 (PP7) long-form homolog for barley (XP_044965344.1). Four genes showed more than 100-fold upregulation and 58 genes over 10-fold upregulation (Supplementary Table S4). Compared to the drought samples, 139 genes showed more than 10-fold upregulation. The most upregulated, compared with drought (635X; Supplementary Table S7), was annotated as for a “bifunctional inhibitor/lipid-transfer protein/seed storage 2S albumin superfamily protein,” a protein type reported to have diverse functions (Wei and Zhong, 2014).
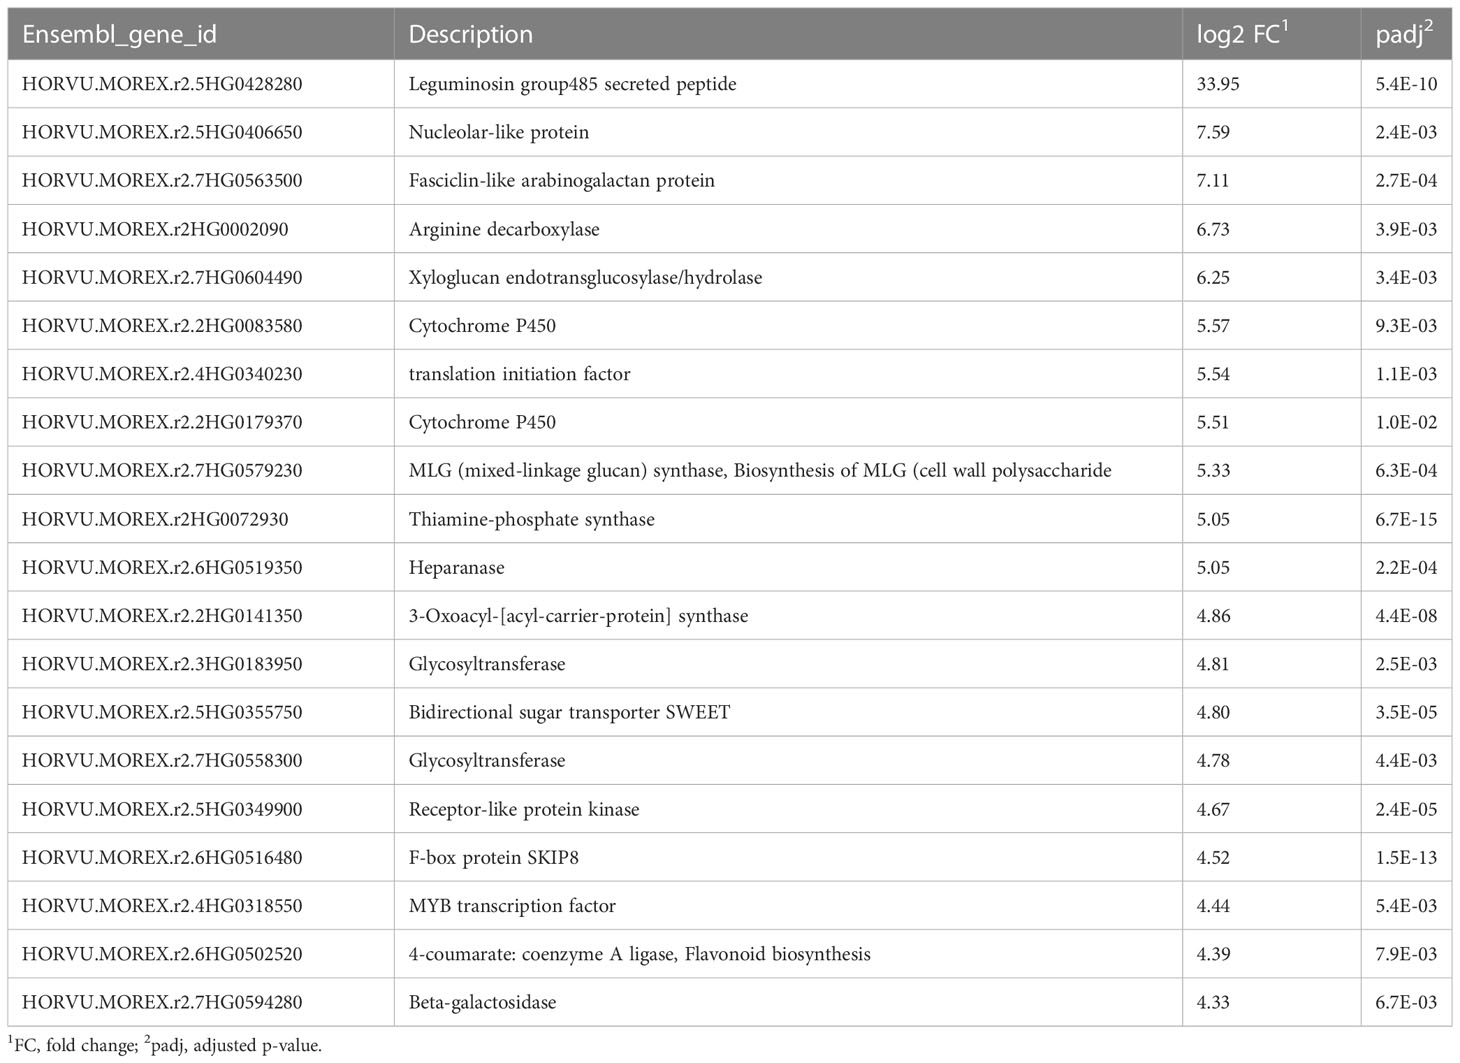
Table 3 Top 20 upregulated genes during the recovery phase.
The most downregulated transcript in recovery compared to control corresponded to a superfamily Copia RLX, which automatic annotation designated as a “retrovirus-related Pol polyprotein”, having around 8-million-fold less expression than the control (Table 4). When drought and recovery DEGs were compared, the most strongly downregulated (1.8-million fold) transcript likewise was annotated as a “Pol polyprotein from transposon Tnt1-94”, i.e., a superfamily Copia RLX (Supplementary Table S6). Of the top 20 repressed in recovery compared with drought samples (Supplementary Table S6), three were annotated as dehydrins (435- to 1634-fold downregulated) and three as heat-shock proteins (188- to 627-fold downregulated). Compared to controls, overall, three genes showed more than 100-fold downregulation and nine genes more than 10-fold downregulation (Supplementary Table S5). Compared to drought samples, 222 genes in the recovery phase showed more than 10-fold downregulation and 140 showed more than 10-fold upregulation. To place the very many significantly DEGs into a biological context, we undertook a network analysis, as described below.
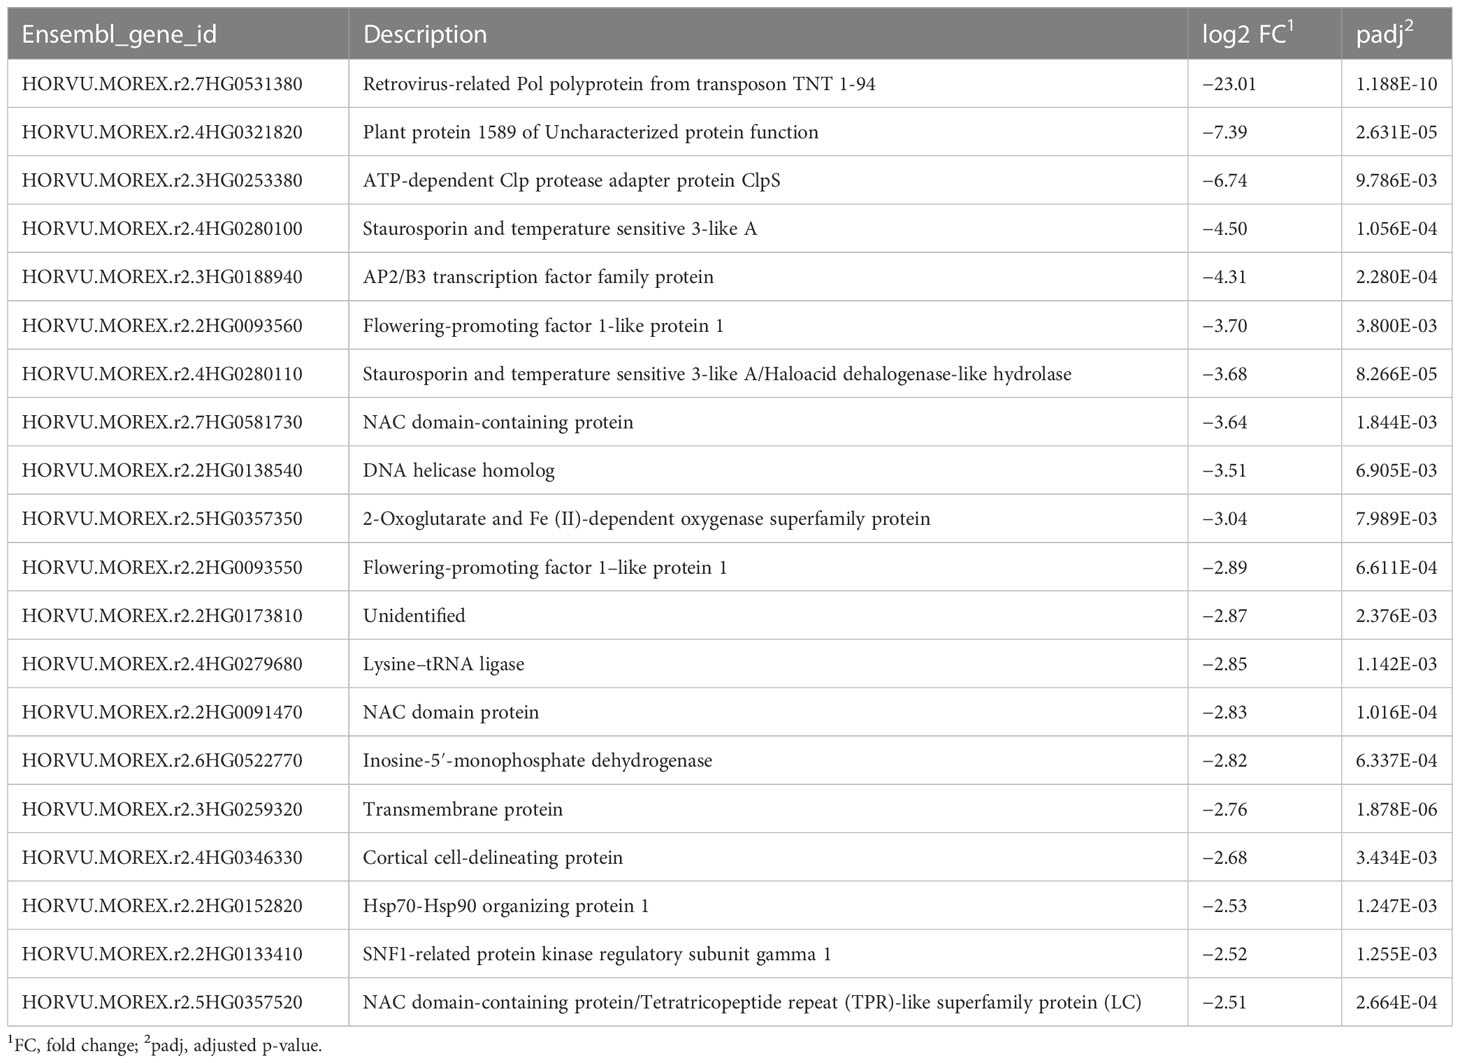
Table 4 Top 20 downregulated genes during the recovery phase.
3.4 Network analysis
3.4.1 Upregulated networks under drought stress
When drought-treated plants were compared to the well-watered controls of the same age, a simple pattern of three clusters with two nodes, each comprising the upregulated genes, was seen (Figure 7). Detailed information on key nodes with the clusters is presented in Supplementary Table S8. Cluster A, which has the highest statistical significance and contains 113 genes, is annotated as “response to water” (GO:0009415) and to “acid chemical” (GO:0001101), meaning any process that responds to the availability of water (e.g., under drought), or to an anion. In this cluster, the dehydrin genes have the highest differential expression, ranging from 100- to 3458-fold upregulation during drought, followed by the late-embryogenesis-abundant (LEA) protein Lea14 at 60-fold (Supplementary Table S12). Both are associated with physiological drought; dehydrin is a drought-inducible LEA II protein (Kosová et al., 2014). Conversely, three dehydrins are among the top 20 downregulated DEGs in recovery vs. drought (Supplementary Table S6). Of the other two clusters, one (cluster B) comprises nodes for response to salt stress (GO:0009651) and osmotic stress (GO:0006970), together with 126 genes (Supplementary Table S8). In cluster B, the most strongly upregulated genes are for a serine-threonine protein kinase (Supplementary Table S12), which is a family well connected to drought response (Saddhe et al., 2021) and salt stress (GO:0009651; 19-fold), and for an uncharacterized transcription factor (18-fold). Drought, salt, and osmotic stress response pathways are well-known to overlap (Buti et al., 2019). The third cluster C, with 250 genes, is associated with negative regulation of protein metabolic processes in two nodes (GO:0051248 and GO:0032269). These nodes contain multiple proteinase inhibitors, including a trypsin/amylase inhibitor such as was earlier shown to confer drought tolerance (Xiao et al., 2013), that are strongly upregulated in drought (64- to 694-fold).
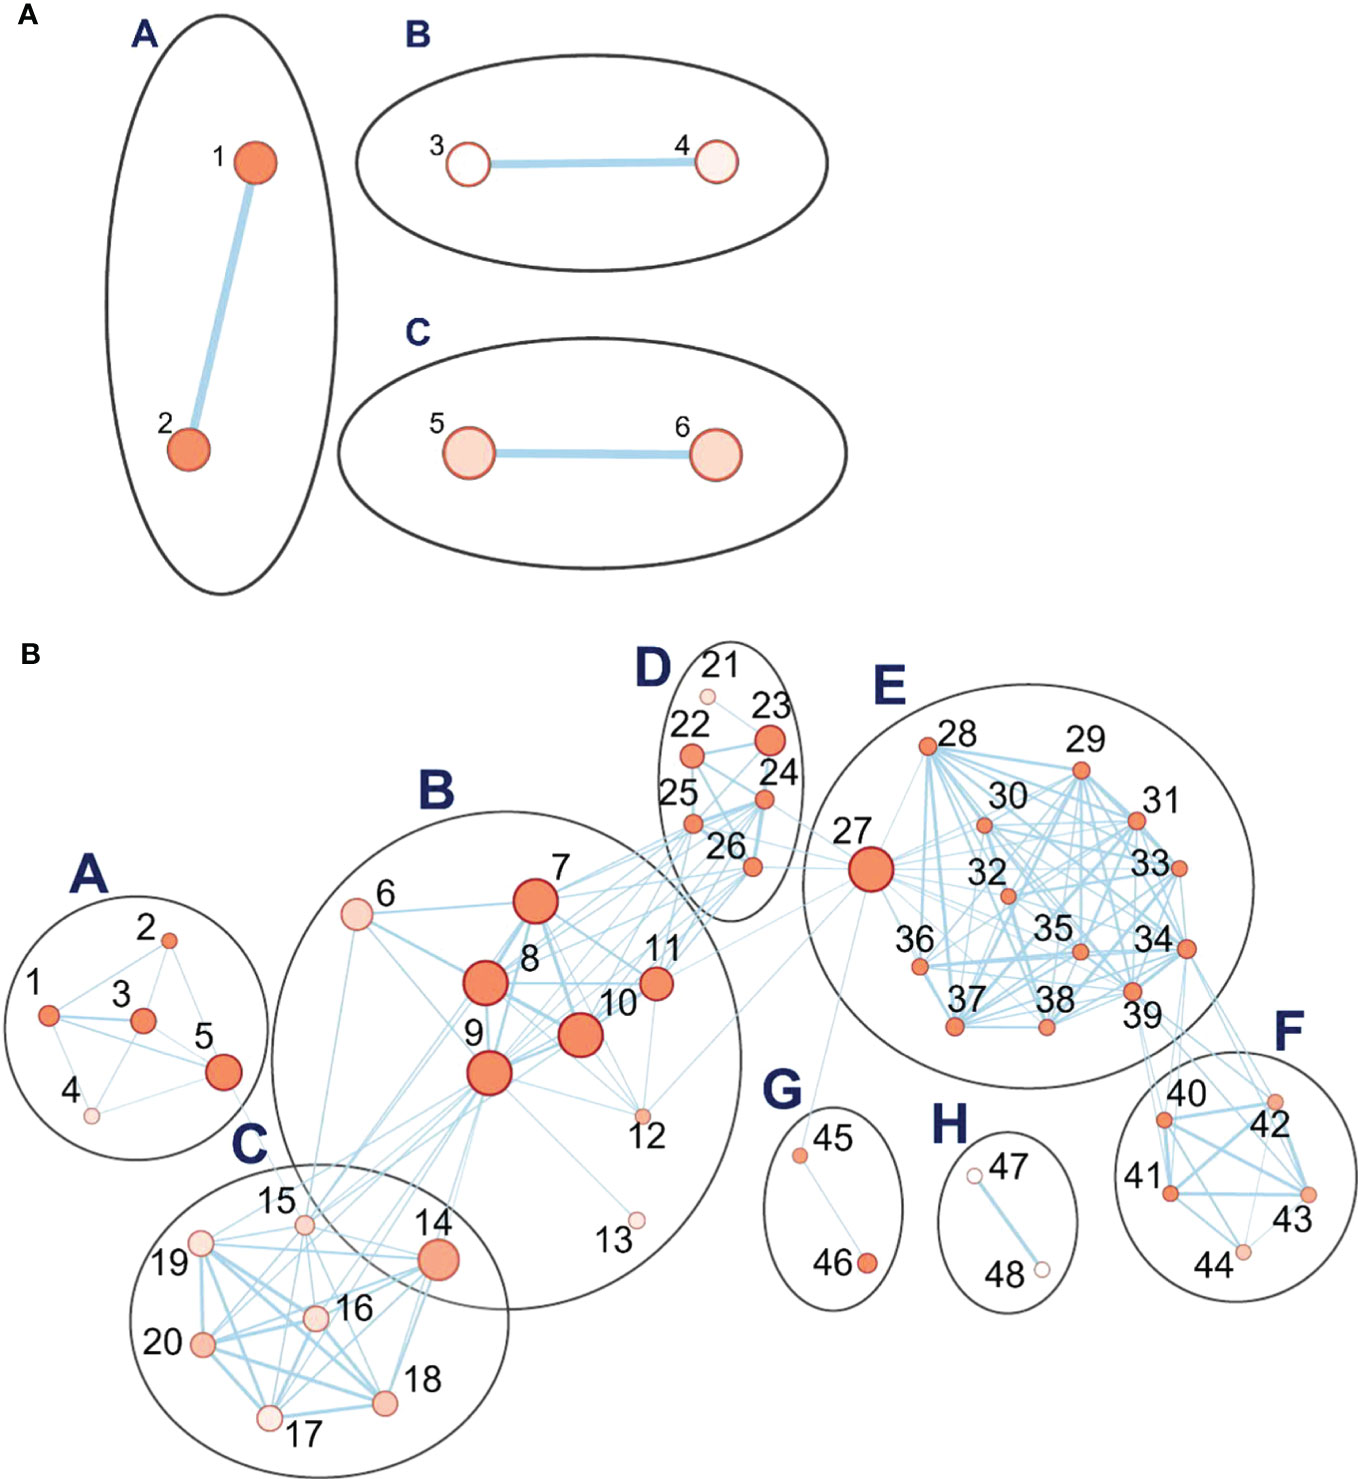
Figure 7 Pathway enrichment analysis of differentially expressed genes (DEGs) during the drought phase. (A) The set of three clusters of nodes containing upregulated genes. (B) Eight interlinked clusters of interlinked nodes containing genes downregulated during the drought phase. Pathway nodes are shown as small circles connected by lines (edges) if the pathways share many genes. Nodes are colored by enrichment score, and the thickness of lines according to the number of genes shared by the connected pathways. The clusters are A, photosynthesis; B, acid metabolic process; C, purine metabolic process; tRNA aminoacylation translation; E, pigment biosynthesis; F, tetraterpenoid process; G, plastid translation organization; H, plant ovary development. Nodes are numbered; descriptions for upregulated and downregulated genes are organized by node number in Supplementary Tabless S8, S9, respectively.
3.4.2 Downregulated networks under drought stress
During the drought stress, eight clusters, comprising 48 nodes, were downregulated (Figure 7B). All are related to processes of growth and development. The cluster with the highest significance and with the greatest number of genes (B) is related to metabolism of carboxylic acids and anions and comprises 3,600 genes. These are involved in nutrient supply, plant development, and processes including cell wall signaling, guard mother cell division, and pathogen virulence (Polko and Kieber, 2019). The key nodes in this cluster include metabolism of organic acids (GO:0006082), oxoacids (GO:0043436), cellular amino acids (GO:0006520), carboxylic acids (GO:0019752), and small molecules (GO:0044281) (Supplementary Table S9). The other interconnected clusters are associated with cluster A (654 genes), which concerns the regulation of photosynthesis, (e.g., photosystem genes, 2- to 5-fold downregulated): purine ribonucleotide metabolism, transfer RNA (tRNA) aminoacylation translation, pigment biosynthesis, and tetraterpenoid biosynthesis. A second set of linked clusters downregulated under drought stress comprises plastid translation organization (cluster G, 83 genes; GO:00032544 and GO:0009657) and pigment, including chlorophyll and carotenoid, biosynthesis (cluster E, 1588 genes; cluster F, 136 genes). A small cluster (H, 10 genes) unlinked to others is annotated as concerning plant ovary development (GO:0032544) although, given that leaf samples were analyzed, the function appears to be otherwise. Detailed information on the key nodes and clusters can be found in Supplementary Tables S9, S13. Hence, the downregulated pathways are manifold and generally involved in growth and development.
3.4.3 Upregulated networks during recovery
Recovery is the process of restoring the physiological and molecular functions from drought-induced damage (Chen et al., 2021). As described above, gene networks related to the growth and development were downregulated during drought. In turn, during recovery, many associated with growth, plastidial function, and energy metabolism were upregulated, organized in five linked clusters of interconnected nodes (Figure 8A). Cluster A has 2597 genes and concerns cell wall metabolism (Supplementary Table S10). Its nodes include those for carbohydrate (GO:0005975), polysaccharide (GO:0005976), glucan (GO:0006073), and xyloglucan (GO:0010411) metabolism, “cell wall organization or biogenesis”, “external encapsulation structure organization” (GO:0045229), and hemicellulose metabolism (GO:0010410). Genes for biosynthesis of xyloglucan, an abundant component of the primary cell wall, were particularly strongly induced, up to 239-fold over the control plants that did not experience drought. Two of the clusters (B, 2522 genes; C, 7842 genes) include nodes associated with protein biosynthesis that were downregulated during drought but are upregulated during recovery. These include nodes for ribosome biogenesis (GO:0042254), ncRNA metabolism (GO:0034660), ribosomal RNA (rRNA) processing (GO:0006364), ribonucleoprotein complex assembly (GO:0022618), maturation of large subunit rRNA (GO:0000463), translation (GO:0006412), peptide biosynthesis and metabolism (GO:0043043 and GO:0006518), amide biosynthesis (GO:0043604), and tRNA aminoacylation and metabolism (GO:0043039 and GO:0006399). Consistent with reactivation of leaf function, plastid and chloroplast organization processes (GO:0009657 and GO:0009658) were upregulated. One unlinked cluster, for “quinone process” (GO:1901663), nevertheless, also indicates upregulation of photosynthetic function and growth, as plastoquinone and ubiquinone serve in the electron transport chains, respectively, of photosynthesis and aerobic respiration. Descriptions of the clusters and their nodes are found in Supplementary Tables S10, S14.
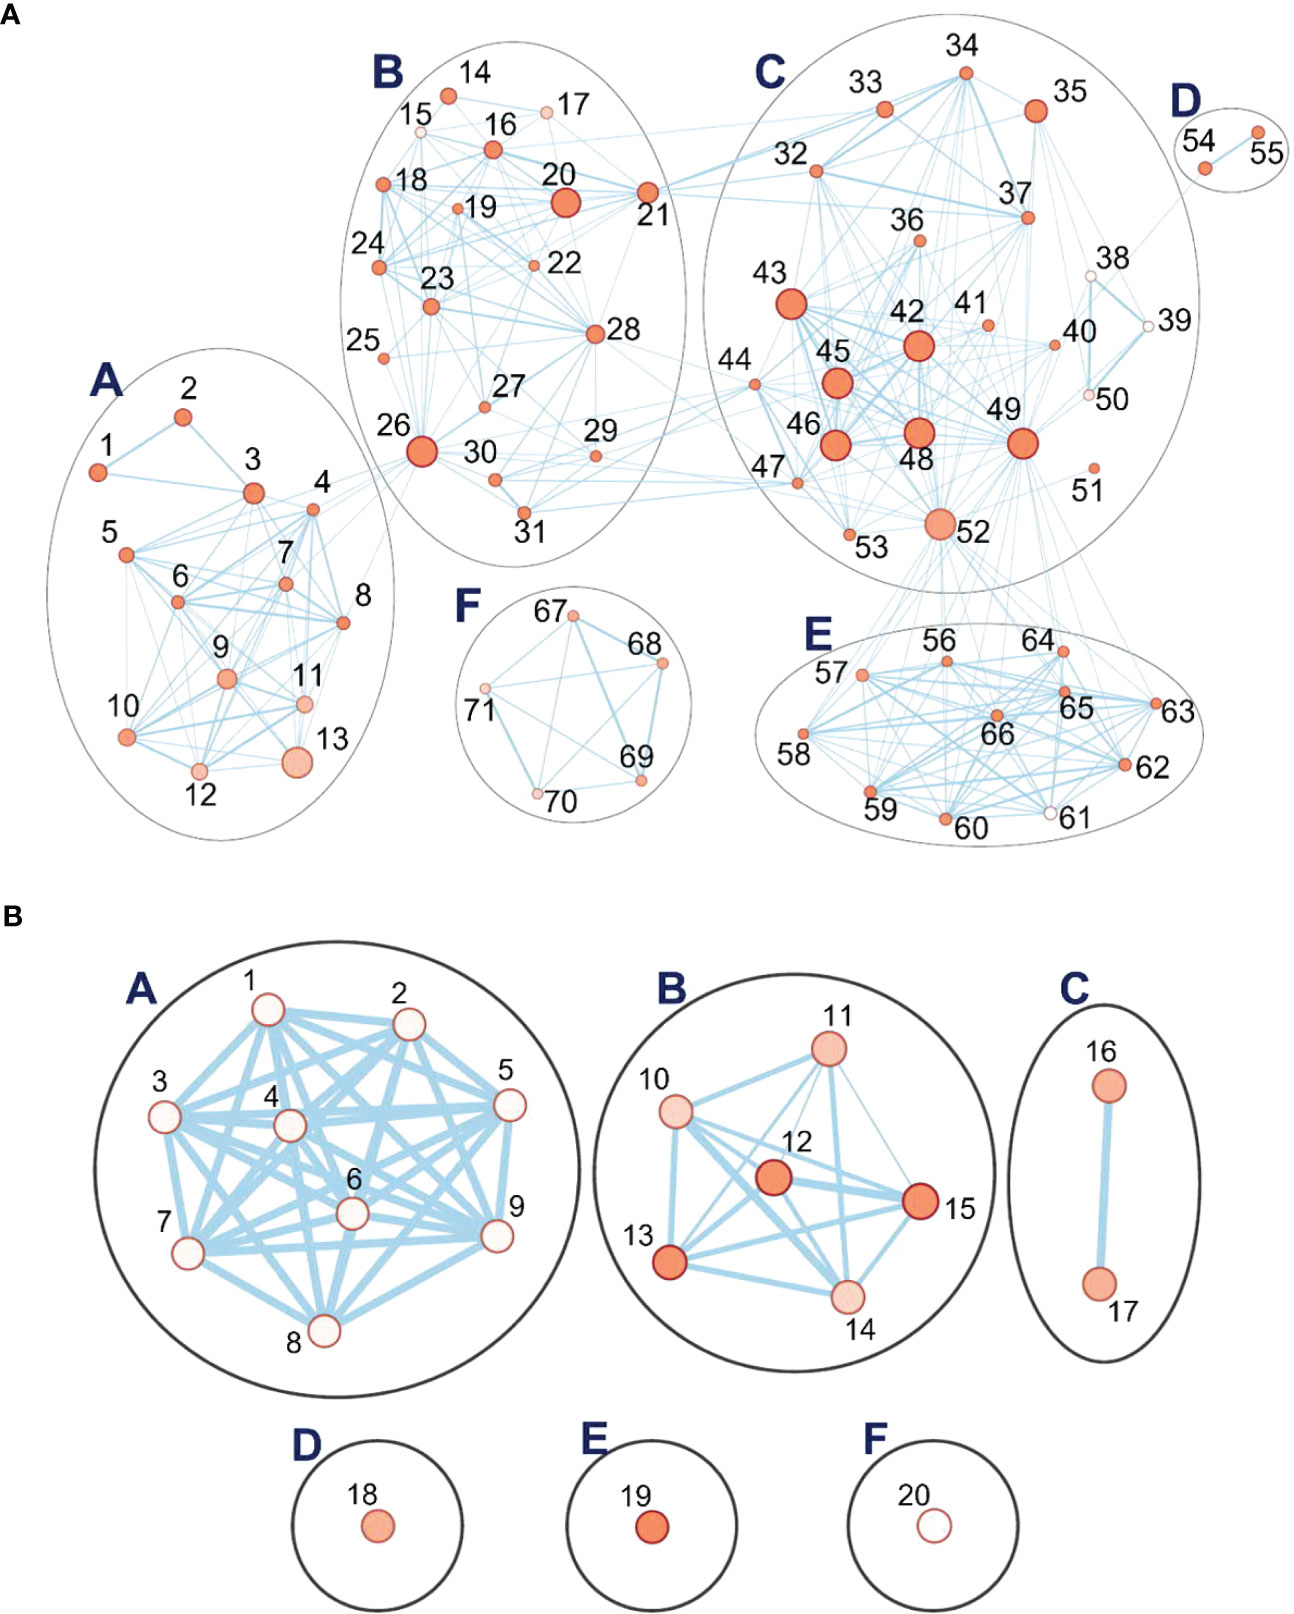
Figure 8 Pathway enrichment analysis of differentially expressed genes (DEGs) during the recovery phase. (A) Six interlinked clusters of interlinked nodes containing upregulated genes. (B) Six clusters of nodes containing downregulated genes. Pathway nodes are shown as small circles connected by lines (edges) if the pathways share many genes. Nodes are colored by enrichment score, and the thickness of lines according to the number of genes shared by the connected pathways. The clusters are A, positive regulation process; B, autophagy; C, response to sucrose and disaccharide; D, protein K63; E, protein neddylation; F, positive regulation of organelle. Pathway nodes are shown as small circles connected by lines (edges) if the pathways share many genes. Nodes are colored by enrichment score, and the thickness of lines according to the number of genes shared by the connected pathways. Nodes are numbered; descriptions for upregulated and downregulated genes are organized by node number in Supplementary Tables S10, S11, respectively.
3.4.4 Downregulated networks during recovery
The networks of genes downregulated during recovery, when compared to the controls, form six clusters (Figure 8B). Cluster F (13 genes in one node) is associated with the de-repression of genes associated with organelle organization (GO:0010638). Cluster A has nine nodes, each with a single gene, for processes spanning cell wall macromolecules (GO:0010981), carbohydrate metabolism (GO:0010676), trichome papilla formation (GO:1905499), among others. Descriptions of the clusters and their nodes are presented in Supplementary Tables S11 and S15.
Of the other five clusters of genes downregulated during recovery, notably, three (B, D, and E) contain altogether 117 networked autophagy-related genes (ATGs) involved in ubiquitin-mediated autophagy (Figure 8B). The largest cluster (B) has six nodes, including ones with genes concerned with autophagosome organization and assembly. Two unlinked ATG clusters (D and E) consist of a single node each. One is for genes involved in protein K63- linked de-ubiquitination (GO:0070536). In this cluster, the genes for deubiquitinating enzyme AMSH1 are also observed. The other cluster with its single node concerns genes involved in protein neddylation (GO:0045116), the process by which the ubiquitin-like protein NEDD8 is conjugated to its target proteins in a manner analogous to ubiquitination.
The reduction in expression of the ATGs genes is modest, compared with the controls, around two-fold at most. However, of the six gene clusters with reduced expression during recovery, the top three most strongly reduced are all for ATGs genes. The p-values of the ATG nodes are all highly significant (mean of 0.01). Among the ATGs, the most strongly downregulated are autophagy-related protein 101 (−1.76X), beclin 1 (−1.7X), and autophagy-related protein 3 (−1.48X), all in cluster B (autophagy); a 26S proteasome regulatory subunit (−1.98X), in cluster D (protein K63-linked deubiquitination); and ubiquitin-conjugating enzyme E2 (−1.57X), in cluster E (neddylation). When gene expression levels at recovery are compared to that at drought, a similar picture emerges for ATGs (Supplementary Table S15). While only a few are significant at padj = 0.05, most show the same trends.
3.5 BARE response during drought and recovery
For all four varieties during drought and recovery (Table 5, Supplementary S16), the mRNA levels matching the BARE gag region was analyzed by qPCR; in GP, additionally, the abundance of mRNA containing the 5′ untranslated leader (UTL) regions corresponding to expression from TATA1 and TATA2 (Chang and Schulman, 2008), respectively, for the genomic RNA (gRNA) and mRNA, was measured (Table 5). As an indicator of general stress response, hsp17 expression was examined; putative hsp17 and hsp21 were among the most strongly downregulated genes in recovery vs. drought (Supplementary Table S6).
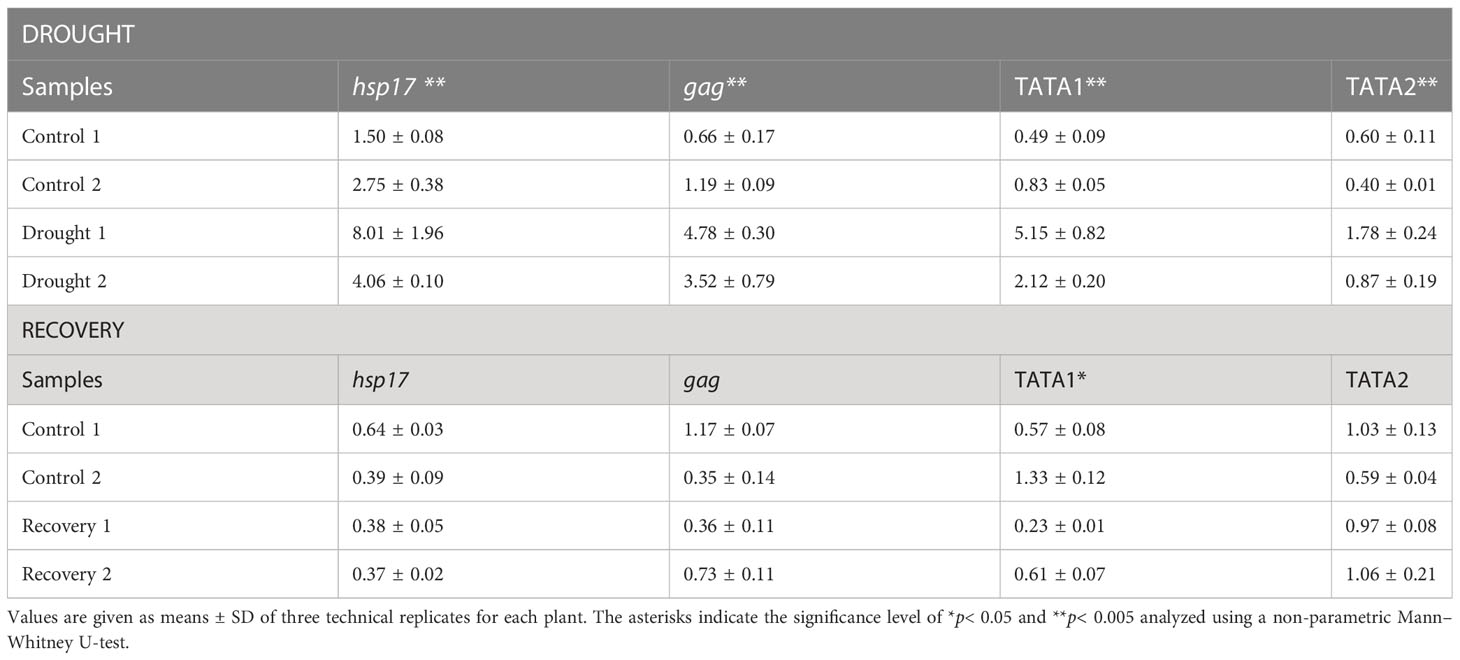
Table 5 Relative expression of hsp17and BARE transcripts in Golden Promise during the drought and recovery phases along with TATA1- and TATA2-driven mRNA levels.
Drought-induced expression of both hsp17 and of BARE (gag) was significantly higher (Supplementary Tables S17, S18) in GP and Arvo over the well-watered control (Table 5, Supplementary S16). During recovery, BARE gag and hsp17 were downregulated in Arvo and GP (down 2.2X, Arvo; 1.3X, GP), but not in H673 (up 2.9X over control), suggesting delayed recovery in H673 (Table 5, Supplementary S16). Notably, in Morex, gag levels but not hsp17 showed an inverse pattern from the other lines: decreasing 1.8-fold under drought but increasing 1.7-fold during recovery (Supplementary Table S16). We additionally followed the expression of the 5′ UTLs corresponding to both the gRNA (TATA1) and the mRNA (TATA2) of BARE in GP. TATA1 was more strongly upregulated than TATA2 under drought (Table 5, Supplementary S17). During recovery, TATA1 and HSP17 expression were below that of the well-watered control, whereas TATA2 was near to control levels. On the protein level (Supplementary Figure S5), BARE Pol, produced from the TATA2 mRNA, showed a strong drought response, which decreased but was still above the control during recovery.
4 Discussion
Drought tolerance and resilience are important traits for wild plants and commonly sought for crops. For crops, in contrast to wild species, not only the production of viable seed but also high yield is desirable. Hence, trade-offs between drought tolerance and concomitant stomatal water loss and CO2 uptake are relevant to breeding. Drought under field conditions is complex, affected by many factors: ambient heat, humidity, VPD, and their diurnal fluctuations; soil structure and hydration profile; soil and root microbiomes; the length and completeness of rain cessation (Scharwies and Dinneny, 2019). Likewise, experimental droughts in greenhouses and growth chambers can differ greatly from each other and from those in the field. Here, we sought to correlate transcriptional to physiological responses in barley on a precision feedback lysimeter platform with well-controlled soil and watering as well as continuous data collection. We recorded VPD and PAR continuously throughout the experiment, as well as the DT and increase in plant weight. The platform itself was in a greenhouse that closely reflected natural external environmental conditions beyond.
4.1 Physiological response of four barley varieties to drought and rewatering
We analyzed the drought and recovery responses of four barley varieties for which pilot experiments showed a difference in transpiration rates and ϴcrit. We have not tracked leaf water potential but rather the stomatal response to SWC; we use the terms anisohydric and isohydric as equivalent to ϴcrit at comparatively low and high SWC, respectively. The SWC at which drought response is invoked is genotype-dependent; the two strategies can be found within genotypes of the same species such as barley or wheat (Triticum aestivum L.), which have both spring- and autumn-sown types that thereby experience contrasting rainfall patterns (Tao et al., 2017) depending on the cultivation region (Galle et al., 2013).
Morex, having the highest DT rate, reached ϴcrit at VWC 0.46 cm3/cm3 on day 36, whereas GP reached ϴcrit at the lowest VWC, 0.42 cm3/cm3, already on day 33 and continued to dehydrate at the fastest rate, but with the lowest initial transpiration rate. Hence, the rate of water loss after ϴcrit was not linked to the initial transpiration rate, as GP dried the fastest and Arvo the slowest. Our interpretation is that GP is therefore the most anisohydric of the four. As bred in the UK, GP may be able to manage the risk as SWC falls because of its low transpiration rate and the relatively balanced precipitation throughout the growing season. Morex also reaches ϴcrit at a comparatively low VWC but, nevertheless, maintains weight as well as H673, which has ϴcrit at the highest VWC, so would appear to manage water loss well. Arvo appears to be the most isohydric; it, like H673, responds at a high ϴcrit and maintains its weight best during drought. This is consistent with Arvo and H673 being varieties from Finland, where droughts occur early in the growing season and can persist for weeks, but where the probability of precipitation increases as the season progresses (Tao et al., 2017). All lines responded to rewatering by increasing specific weight gain (g/g), GP being the lowest, but none returned to control rates during the three days that recovery was followed. Full recovery may require longer.
4.2 Gene networks and differential expression in Golden Promise during drought and recovery
We focused gene expression analyses on GP, as the standard line for transformation and editing. Drought: Networks of genes responding to drought, salt, and acid, as well as negative regulators of metabolism, were upregulated following ϴcrit. Among individual genes, glutathione s-transferase (GST) was most upregulated (3 × 10⁶-fold) over the control; at the sampling point early in recovery, it had dropped by 8.6-fold relative to drought samples. GST expression is associated with drought tolerance in barley (Rezaei et al., 2013); it scavenges drought-produced ROS for detoxification (Guo et al., 2009). Likewise, increased GST expression was observed under cold and osmotic stress in a potato genotype tolerant to these (Guo et al., 2009). The second most highly upregulated (447X) gene is chloroplastic linalool synthase (XP_044955412), a terpenoid biosynthetic enzyme; its expression fell 70-fold in recovery relative to drought. In rice, the bHLH family transcription factor RERJ1 is drought-induced, leading to jasmonate (JA) biosynthesis and induction of linalool synthase (Valea et al., 2022). In barley, 98 among 135 detected phenolic and terpenoid compounds (linolool was not investigated) were shown to change in expression as result of drought stress (Piasecka et al., 2017). Our observed induction of linolool synthase here is consistent with a role in ABA/JA-mediated stomatal closure as reported for Arabidopsis (Munemasa et al., 2019). Dehydrin (Dhn) transcripts were also highly upregulated, 3500X over control, and among the most strongly downregulated in recovery vs. drought. Dehydrins, along with other late embryogenesis abundant (LEA) proteins such as LEA14 (also upregulated here), protect enzymes from dehydration and other environmental stresses (Liu et al., 2017). Differential Dhn expression was shown in cultivated and wild (H. spontaneum) barley to be correlated with drought tolerance (Suprunova et al., 2004; Kosová et al., 2014), likewise in Brachypodium distachyon (Decena et al., 2021), wheat (Brini et al., 2007; Wang et al., 2014), and rice (Verma et al., 2017).
Networks for photosynthetic and plastidial processes, metabolism, and ovary development were downregulated during drought, consistent with earlier reports for some individual genes from these processes: ribulose 1,5-bisphosphate carboxylase small subunit (rbcS), chlorophyll a/b-binding protein (cab), and components of photosystems I and II (Seki et al., 2002; Narusaka et al., 2004). Here, the most strongly downregulated gene was for cytochrome P450 (CYP), which conversely was the third most strongly upregulated in recovery vs. drought. The CYP genes are widely distributed in plants and animals (Shiota et al., 2000), forming a large family, 45 in wheat (Li and Wei, 2020), playing multiple roles (McKinnon et al., 2008), including in biotic and abiotic stress response (Li and Wei, 2020). In rice, 83 OsCYPs are differentially expressed, of which six are strongly induced and three are strongly downregulated, during drought (Wei and Chen, 2018).
Two genes for cortical cell delineating protein were highly (−705X and −621X) repressed during drought; while associated with roots, they appear to have a role in cell division and elongation (Isayenkov et al., 2020). These, too, had their expression strongly upregulated during recovery vs. drought. Downregulated almost as strongly (−442X) was a gene of the bHLH family. This widespread family of transcription factors has been shown in various plants, including wheat, to be integrated into ABA- and JA-mediated signaling, ROS scavenging, and stomatal closure, as well as to play multiple roles in development (Yang et al., 2016; Guo et al., 2021). Given that bHLH is strongly induced by drought and ABA, the pattern seen here suggests that induction occurs before ϴcrit and that its downregulation thereafter may be linked to suppression of developmental processes.
Recovery: During the recovery phase, gene networks connected to growth and to chloroplast development were upregulated; these processes were downregulated under drought. The putative PP7, here the most upregulated individual gene vs. control during recovery, has shown to be highly expressed in Arabidopsis stomata (Andreeva et al., 1999), to regulate phytochrome signaling (Andreeva et al., 1999) and to be involved also in Arabidopsis chloroplast development (Xu et al., 2019), a function that would be consonant with recovery in the barley system.
Notably, autophagy processes were downregulated. Autophagy mechanisms are conserved in eukaryotes for turning over unwanted cytoplasmic components and maintaining homeostasis during stress (Marshall and Vierstra, 2018; Bao, 2020; Tang and Bassham, 2022). Mutant or silenced individual autophagy genes (atg5,ATG6, atg7, ATG8d,and ATG18h), variously in Arabidopsis, tomato, and wheat (Liu et al., 2009; Marshall and Vierstra, 2018; Zhu et al., 2018; Li et al., 2019), reduced drought tolerance. In barley, a mutant of autophagosome formation gene ATG6 (Beclin 1) was upregulated under various abiotic stresses including drought, whereas its knockdown resulted in yellowing leaves in dark and H2O2 treatments (Zeng et al., 2017). We confirmed that ATG6 is identical to 3HG0280440.1 (Morex assembly vers3) and saw a 1.47X reduction in recovery vs. drought (adjusted p= 0.01). While these studies indicated the importance of individual autophagy components in mediating abiotic stress response including drought, the autophagy network as a whole had not been examined. During recovery, along with ATG6, we observed a downregulation of many other ATGs in nodes connected either to initiation of autophagy, vesicle nucleation, expansion, or autophagosome formation. The likely importance of the suppression of autophagy during recovery is indicated by COST1 (constitutively stressed 1), attenuating autophagy in Arabidopsis under optimal growth conditions; cost1 mutants are highly drought tolerant but very small, growing slowly (Bao et al., 2020). Of the two COST1 matches in the barley genome, expression of HORVU.MOREX.r2.4HG0296600.1 was not seen; for HORVU.MOREX.r2.6HG0480550, expression was almost identical in drought and recovery samples and regarding the controls.
4.3 Response of retrotransposon BARE to drought and recovery
BARE, of which the reference genome contains 20,258 full-length copies and 6,216 solo LTRs (Mascher et al., 2021), carries out the various stages of the RLX lifecycle: It is transcribed, translated, and forms virus-like particles (Jääskeläinen et al., 2013). While the BARE LTR promoter was earlier shown to carry ABREs (Suoniemi et al., 1996), the capsid protein Gag to be more strongly expressed under drought (Jääskeläinen et al., 2013), and BARE copy number variations and insertional polymorphism patterns to be consistent with long-term drought activation (Kalendar et al., 2000), BARE transcription has not earlier been linked to physiologically characterized drought. Here, we found that BARE transcription, as measured by qPCR from the gag coding region, increased following ϴcrit in GP, Arvo, and H673, as did the gene for heat-shock protein HSP17, a marker for drought stress (Guo et al., 2009); Morex, however, showed HSP17 response but no increased BARE transcription. For Arvo and GP, both the BARE gag and HSP17 were strongly lower in the samples taken after rewatering, whereas H673 had apparently not entered recovery, given that the HSP17 level was still elevated. Divergent BARE levels in different varieties are consistent with those seen earlier (Jääskeläinen et al., 2013), where GP showed a stronger response on the Gag protein level than did cv. Bomi. For GP, we also examined the drought response for the two transcripts, one driven by TATA1, which produces the gRNA that will be reverse transcribed, and another by TATA2, which produces the translatable mRNA. In drought, TATA1 was more strongly induced than TATA2, whereas, during recovery, TATA1 showed lower expression than in control samples, perhaps indicating post-transcriptional silencing of the BARE gRNA. Consonant with the qPCR results, the most strongly downregulated gene in the recovery RNA-seq (HORVU.MOREX.r2.7HG0531380) matches best a superfamily Copia integrase domain (KAE8773625.1; 65% similar residues, E-value 7 × 10-101), likely from the Hopscotch family.
5 Conclusions
Using a precision phenotyping platform, we have identified barley varieties whose transpiration rates drop (ϴcrit) at different points as soil dries during drought, which may mirror adaptation to pre-flowering vs. terminal drought or to droughts of varying length. The timing of droughts regarding phenology is expected to shift across Europe over the coming decades (Appiah et al., 2023). Using ϴcrit as a guidepost, we carried out a global analysis of gene expression in the transformable variety GP in response to drought and rewatering and placed the DEGs into the context of biological pathways. We identified several strongly DEGs not earlier associated with drought response in barley, including for linalool synthase, cortical cell delineating protein, and long-form PP7. These data will serve to establish candidate genes from phenotyped mapping populations and diversity sets and for analysis of the many drought tolerance QTLs heretofore identified (Zhang et al., 2017; Moualeu-Ngangue et al., 2020). We were able to confirm that the BARE RLX family is strongly transcriptionally upregulated by drought and downregulated during recovery unequally between cultivars and that the two BARE promoters are differentially drought responsive. Consistent with what may be a general epigenetic deregulation of RLXs and DNA transposons (Pontes et al., 2009; Wei et al., 2014), Dicer-like 3 (DCL3) was downregulated 57-fold compared to the well-watered control during the drought phase (Supplementary Table S3); full analysis of transposable element expression under drought and recovery is currently in progress. In the context of recovery rate and resilience, which is key to maintenance of crop yields in the face of climate change, our observation that the autophagy gene network is downregulated during recovery is worthy of further investigation; we are currently constructing a higher resolution timeline.
Data availability statement
The datasets presented in this study can be found in online repositories. The names of the repository/repositories and accession number(s) can be found in the article/Supplementary Material.
Author contributions
MP carried out the physiological experiments and expression assays, analyzed the data, and wrote the manuscript; JT was responsible for bioinformatics analyses; MJ carried out protein expression analyses; WC contributed to qPCR analyses; AD contributed to physiological experiments; MM and AS designed the experiments; AS revised the manuscript and was project P.I. All authors contributed to the article and approved the submitted version.
Funding
Funding was provided by the Finnish Ministry of Agriculture and Forestry (Decision 153/03.01.02, ClimBar project), the Academy of Finland (Decision 292726, BARISTA project) and by the Academy of Finland (Decision 314961) for project “Retrostress”. MP was supported in part by a BRAVE Erasmus Mundus scholarship.
Acknowledgments
We acknowledge Anne-Mari Narvanto for excellent technical assistance and Triin Vahisalu for useful discussions on the physiology and molecular biology of drought response.
Conflict of interest
The authors declare that the research was conducted in the absence of any commercial or financial relationships that could be construed as a potential conflict of interest.
Publisher’s note
All claims expressed in this article are solely those of the authors and do not necessarily represent those of their affiliated organizations, or those of the publisher, the editors and the reviewers. Any product that may be evaluated in this article, or claim that may be made by its manufacturer, is not guaranteed or endorsed by the publisher.
Supplementary material
The Supplementary Material for this article can be found online at: https://www.frontiersin.org/articles/10.3389/fpls.2023.1193284/full#supplementary-material
References
Andreeva, A. V., Kearns, A., Hawes, C. R., Evans, D. E., Kutuzov, M. A. (1999). PP7, a gene encoding a novel protein Ser/Thr phosphatase, is expressed primarily in a subset of guard cells in Arabidopsis thaliana. Physiol. Plant 106, 219–223. doi: 10.1034/j.1399-3054.1999.106211.x
Andrews, S. (2010). FASTQC. a quality control tool for high throughput sequence data. Available at: http://www.bioinformatics.babraham.ac.uk/projects/fastqc
Appiah, M., Bracho-Mujica, G., Ferreira, N., Schulman, A., Rötter, R. (2023). Projected impacts of sowing date and cultivar choice on the timing of heat and drought stress in spring barley grown along a European transect. Field Crops Res. 291, 108768. doi: 10.1016/j.fcr.2022.108768
Avin-Wittenberg, T. (2019). Autophagy and its role in plant abiotic stress management. Plant Cell Environ. 42, 1045–1053. doi: 10.1111/pce.13404
Bao, Y. (2020). Links between drought stress and autophagy in plants. Plant Signal Behav. 15, 1779487. doi: 10.1080/15592324.2020.1779487
Bao, Y., Song, W. M., Wang, P. P., Yu, X., Li, B., Jiang, C. M., et al. (2020). COST1 regulates autophagy to control plant drought tolerance. Proc. Natl. Acad. Sci. U.S.A. 117, 7482–7493. doi: 10.1073/pnas.1918539117
Beier, S., Himmelbach, A., Colmsee, C., Zhang, X. Q., Barrero, R. A., Zhang, Q., et al. (2017). Construction of a map-based reference genome sequence for barley, Hordeum vulgare l. Sci. Data 4, 170044. doi: 10.1038/sdata.2017.443
Bolger, A. M., Lohse, M., Usadel, B. (2014). Trimmomatic: a flexible trimmer for illumina sequence data. Bioinformatics 30, 2114–2120. doi: 10.1093/bioinformatics/btu170
Brinii, F., Hanin, M., Irar, S., Pagès, M., Masmoudi, K. (2007). Functional characterization of DHN-5, a dehydrin showing a differential phosphorylation pattern in two Tunisian durum wheat (Triticum durum desf.) varieties with marked differences in salt and drought tolerance. Plant Sci. 172, 20–28. doi: 10.1016/j.plantsci.2006.07.011
Buti, M., Baldoni, E., Formentin, E., Milc, J., Frugis, G., Lo Schiavo, F., et al. (2019). A meta-analysis of comparative transcriptomic data reveals a set of key genes involved in the tolerance to abiotic stresses in rice. Int. J. Mol. Sci. 20, 5662. doi: 10.3390/ijms20225662
Cao, L., Lu, X., Wang, G., Zhang, Q., Zhang, X., Fan, Z., et al. (2021). Maize ZmbZIP33 is involved in drought resistance and recovery ability through an abscisic acid-dependent signaling pathway. Front. Plant Sci. 12, 629903. doi: 10.3389/fpls.2021.629903
Chang, W., Jaaskelainen, M., Li, S. P., Schulman, A. H. (2013). BARE retrotransposons are translated and replicated via distinct RNA pools. PloS One 8, e72270. doi: 10.1371/journal.pone.0072270
Chang, W., Schulman, A. H. (2008). BARE retrotransposons produce multiple groups of rarely polyadenylated transcripts from two differentially regulated promoters. Plant J. 56, 40–50. doi: 10.1111/j.1365-313X.2008.03572.x
Chen, H., Dong, J., Wang, T. (2021a). Autophagy in plant abiotic stress management. Int. J. Mol. Sci. 22, 4075. doi: 10.3390/ijms22084075
Chen, S., Li, P., Tan, S., Pu, X., Zhou, Y., Hu, K., et al. (2021b). Combined proteomic and physiological analysis of chloroplasts reveals drought and recovery response mechanisms in Nicotiana benthamiana. Plants 10, 1127. doi: 10.3390/plants10061127
Dalal, A., Bourstein, R., Haish, N., Shenhar, I., Wallach, R., Moshelion, M. (2019). Dynamic physiological phenotyping of drought-stressed pepper plants treated with "productivity-enhancing" and "survivability-enhancing" biostimulants. Front. Plant Sci. 10, 905. doi: 10.3389/fpls.2019.00905
Dalal, A., Shenhar, I., Bourstein, R., Mayo, A., Grunwald, Y., Averbuch, N., et al. (2020). A telemetric, gravimetric platform for real-time physiological phenotyping of plant-environment interactions. J. Vis. Exp. 162, 10.3791/61280. doi: 10.3791/612804
Das, K., Roychoudhury, A. (2014). Reactive oxygen species (ROS) and response of antioxidants as ROS-scavengers during environmental stress in plants. Front. Environ. Sci. 2, 53. doi: 10.3389/fenvs.2014.00053
Decena, M. A., Galvez-Rojas, S., Agostini, F., Sancho, R., Contreras-Moreira, B., Des Marais, D. L., et al. (2021). Comparative genomics, evolution, and drought-induced expression of dehydrin genes in model Brachypodium grasses. Plants 10, 2664. doi: 10.3390/plants10122664
Dobin, A., Davis, C. A., Schlesinger, F., Drenkow, J., Zaleski, C., Jha, S., et al. (2013). STAR: ultrafast universal RNA-seq aligner. Bioinformatics 29, 15–21. doi: 10.1093/bioinformatics/bts635
Galindo-Gonzalez, L., Mhiri, C., Deyholos, M. K., Grandbastien, M. A. (2017). LTR-Retrotransposons in plants: engines of evolution. Gene 626, 14–25. doi: 10.1016/j.gene.2017.04.051
Galkin, E., Dalal, A., Evenko, A., Fridman, E., Kan, I., Wallach, R., et al. (2018). Risk-management strategies and transpiration rates of wild barley in uncertain environments. Physiol. Plant 164, 412–428. doi: 10.1111/ppl.12814
Galle, A., Csiszar, J., Benyo, D., Laskay, G., Leviczky, T., Erdei, L., et al. (2013). Isohydric and anisohydric strategies of wheat genotypes under osmotic stress: biosynthesis and function of ABA in stress responses. J. Plant Physiol. 170, 1389–1399. doi: 10.1016/j.jplph.2013.04.010
Gosa SC, G. B., Patil, R., Mencia, R., Moshelion, M. (2022). Diurnal stomatal apertures and density ratios affect whole-canopy stomatal conductance, water-use efficiency and yield. BioRxiv. doi: 10.1101/2022.01.06.475121
Grandbastien, M. A., Audeon, C., Bonnivard, E., Casacuberta, J. M., Chalhoub, B., Costa, A. P., et al. (2005). Stress activation and genomic impact of Tnt1 retrotransposons in solanaceae. Cytogenet. Genome Res. 110, 229–241. doi: 10.1159/000084957
Guo, P., Baum, M., Grando, S., Ceccarelli, S., Bai, G., Li, R., et al. (2009). Differentially expressed genes between drought-tolerant and drought-sensitive barley genotypes in response to drought stress during the reproductive stage. J. Exp. Bot. 60, 3531–3544. doi: 10.1093/jxb/erp194
Guo, J. R., Sun, B. X., He, H. R., Zhang, Y. F., Tian, H. Y., Wang, B. S. (2021). Current understanding of bHLH transcription factors in plant abiotic stress tolerance. Int. J. Mol. Sci. 22, 4921. doi: 10.3390/ijms22094921
Halperin, O., Gebremedhin, A., Wallach, R., Moshelion, M. (2017). High-throughput physiological phenotyping and screening system for the characterization of plant-environment interactions. Plant J. 89, 839–850. doi: 10.1111/tpj.13425
Hildebrandt, T. M. (2018). Synthesis versus degradation: directions of amino acid metabolism during arabidopsis abiotic stress response. Plant Mol. Biol. 98, 121–135. doi: 10.1007/s11103-018-0767-0
Hong, Y., Ni, S. J., Zhang, G. P. (2020). Transcriptome and metabolome analysis reveals regulatory networks and key genes controlling barley malting quality in responses to drought stress. Plant Physiol. Biochem. 152, 1–11. doi: 10.1016/j.plaphy.2020.04.029
Isayenkov, S., Hilo, A., Rizzo, P., Moya, Y. A. T., Rolletschek, H., Borisjuk, L., et al. (2020). Adaptation strategies of halophytic barley Hordeum marinum ssp. marinum to high salinity and osmotic stress. Int. J. Mol. Sc. 21, 9019.
Jääskeläinen, M., Chang, W., Moisy, C., Schulman, A. H. (2013). Retrotransposon BARE displays strong tissue-specific differences in expression. New Phytol. 200, 1000–1008. doi: 10.1111/nph.12470
Jogawat, A., Yadav, B., Chhaya, Lakra, N., Singh, A. K., Narayan, O. P. (2021). Crosstalk between phytohormones and secondary metabolites in the drought stress tolerance of crop plants: a review. Physiol. Plant 172, 1106–1132. doi: 10.1111/ppl.13328
Kalendar, R., Tanskanen, J., Immonen, S., Nevo, E., Schulman, A. H. (2000). Genome evolution of wild barley (Hordeum spontaneum) by BARE-1 retrotransposon dynamics in response to sharp microclimatic divergence. Proc. Natl. Acad. Sci. U.S.A. 97, 6603–6607. doi: 10.1073/pnas.110587497
Kimura, Y., Tosa, Y., Shimada, S., Sogo, R., Kusaba, M., Sunaga, T., et al. (2001). OARE-1, a Ty1-Copia retrotransposon in oat activated by abiotic and biotic stresses. Plant Cell Physiol. 42, 1345–1354. doi: 10.1093/pcp/pce171
Kosová, K., Vítámvás, P., Prášil, I. T. (2014). Wheat and barley dehydrins under cold, drought, and salinity – what can LEA-II proteins tell us about plant stress response? Front. Plant Sci. 5,343. doi: 10.3389/fpls.2014.00343
Lawas, L. M. F., Erban, A., Kopka, J., Jagadish, S. V. K., Zuther, E., Hincha, D. K. (2019). Metabolic responses of rice source and sink organs during recovery from combined drought and heat stress in the field. Gigascience 8, giz102. doi: 10.1093/gigascience/giz102
Li, Y. B., Cui, D. Z., Sui, X. X., Huang, C., Huang, C. Y., Fan, Q. Q., et al. (2019). Autophagic survival precedes programmed cell death in wheat seedlings exposed to drought stress. Int. J. Mol. Sci. 20, 5777. doi: 10.3390/ijms20225777
Li, Y. X., Wei, K. F. (2020). Comparative functional genomics analysis of cytochrome P450 gene superfamily in wheat and maize. BMC Plant Biol. 20, 93. doi: 10.1186/s12870-020-2288-7
Liu, Y., Song, Q., Li, D., Yang, X., Li, D. (2017). Multifunctional roles of plant dehydrins in response to environmental stresses. Front. Plant Sci. 8,1018. doi: 10.3389/fpls.2017.01018
Liu, Y., Xiong, Y., Bassham, D. C. (2009). Autophagy is required for tolerance of drought and salt stress in plants. Autophagy 5, 954–963. doi: 10.4161/auto.5.7.9290
Livak, K. J., Schmittgen, T. D. (2001). Analysis of relative gene expression data using real-time quantitative PCR and the 2(-delta delta C(T)) method. Methods 25, 402–408. doi: 10.1006/meth.2001.1262
Love, M. I., Huber, W., Anders, S. (2014). Moderated estimation of fold change and dispersion for RNA-seq data with DESeq2. Genome Biol. 15, 550. doi: 10.1186/s13059-014-0550-8
Makarevitch, I., Waters, A. J., West, P. T., Stitzer, M., Hirsch, C. N., Ross-Ibarra, J., et al. (2015). Transposable elements contribute to activation of maize genes in response to abiotic stress. PloS Genet. 11:e1004915. doi: 10.1371/journal.pgen.10049156
Marshall, R. S., Vierstra, R. D. (2018). Autophagy: the master of bulk and selective recycling. Ann. Rev. Plant Biol. 69, 173–208. doi: 10.1146/annurev-arplant-042817-040606
Mascher, M., Gundlach, H., Himmelbach, A., Beier, S., Twardziok, S. O., Wicker, T., et al. (2017). A chromosome conformation capture ordered sequence of the barley genome. Nature 544, 427–433. doi: 10.1038/nature22043
Mascher, M., Wicker, T., Jenkins, J., Plott, C., Lux, T., Koh, C. S., et al. (2021). Long-read sequence assembly: a technical evaluation in barley. Plant Cell 33, 1888–1906. doi: 10.1093/plcell/koab077
McKinnon, R. A., Sorich, M. J., Ward, M. B. (2008). Cytochrome P450 part 1: multiplicity and function. J. Pharm. Pract. Res. 38, 55–57. doi: 10.1002/j.2055-2335.2008.tb00798.x
Merilo, E., Jalakas, P., Laanemets, K., Mohammadi, O., Horak, H., Kollist, H., et al. (2015). Abscisic acid transport and homeostasis in the context of stomatal regulation. Mol. Plant 8, 1321–1333. doi: 10.1016/j.molp.2015.06.006
Moualeu-Ngangue, D., Dolch, C., Schneider, M., Leon, J., Uptmoor, R., Stutzel, H. (2020). Physiological and morphological responses of different spring barley genotypes to water deficit and associated QTLs. PloS One 15, e0237834. doi: 10.1371/journal.pone.0237834
Munemasa, S., Hirao, Y., Tanami, K., Mimata, Y., Nakamura, Y., Murata, Y. (2019). Ethylene inhibits methyl jasmonate-induced stomatal closure by modulating guard cell slow-type anion channel activity via the OPEN STOMATA 1/SnRK2.6 kinase-independent pathway in arabidopsis. Plant Cell Physiol. 60, 2263–2271. doi: 10.1093/pcp/pcz121
Narusaka, Y., Narusaka, M., Seki, M., Umezawa, T., Ishida, J., Nakajima, M., et al. (2004). Crosstalk in the responses to abiotic and biotic stresses in arabidopsis: analysis of gene expression in cytochrome P450 gene superfamily by cDNA microarray. Plant Mol. Biol. 55, 327–342. doi: 10.1007/s11103-004-0685-1
Patro, R., Duggal, G., Love, M. I., Irizarry, R. A., Kingsford, C. (2017). Salmon provides fast and bias-aware quantification of transcript expression. Nat. Methods 14, 417–419. doi: 10.1038/nmeth.4197
Piasecka, A., Sawikowska, A., Kuczynska, A., Ogrodowicz, P., Mikolajczak, K., Krystkowiak, K., et al. (2017). Drought-related secondary metabolites of barley (Hordeum vulgare l.) leaves and their metabolomic quantitative trait loci. Plant J. 89, 898–913. doi: 10.1111/tpj.13430
Polko, J. K., Kieber, J. J. (2019). 1-aminocyclopropane 1-carboxylic acid and its emerging role as an ethylene-independent growth regulator. Front. Plant Sci. 10,1602. doi: 10.3389/fpls.2019.01602
Pontes, O., Costa-Nunes, P., Vithayathil, P., Pikaard, C. S. (2009). RNA Polymerase V functions in arabidopsis interphase heterochromatin organization independently of the 24-nt siRNA-directed DNA methylation pathway. Mol. Plant 2, 700–710. doi: 10.1093/mp/ssp006
Qi, M., Liu, X., Li, Y., Song, H., Yin, Z., Zhang, F., et al. (2021). Photosynthetic resistance and resilience under drought, flooding and rewatering in maize plants. Photosynth Res. 148, 1–15. doi: 10.1007/s11120-021-00825-3
Ramallo, E., Kalendar, R., Schulman, A. H., Martinez-Izquierdo, J. A. (2008). Reme1, a Copia retrotransposon in melon, is transcriptionally induced by UV light. Plant Mol. Biol. 66, 137–150. doi: 10.1007/s11103-007-9258-4
Reimand, J., Isserlin, R., Voisin, V., Kucera, M., Tannus-Lopes, C., Rostamianfar, A., et al. (2019). Pathway enrichment analysis and visualization of omics data using g:Profiler, GSEA, cytoscape and EnrichmentMap. Nat. Protoc. 14, 482–517. doi: 10.1038/s41596-018-0103-9
Rezaei, M. K., Shobbar, Z. S., Shahbazi, M., Abedini, R., Zare, S. (2013). Glutathione s-transferase (GST) family in barley: identification of members, enzyme activity, and gene expression pattern. J. Plant Physiol. 170, 1277–1284. doi: 10.1016/j.jplph.2013.04.005
Rollins, J. A., Drosse, B., Mulki, M. A., Grando, S., Baum, M., Singh, M., et al. (2013). Variation at the vernalisation genes Vrn-H1 and Vrn-H2 determines growth and yield stability in barley (Hordeum vulgare) grown under dryland conditions in Syria. Theor. Appl. Genet. 126, 2803–2824. doi: 10.1007/s00122-013-2173-y
Saddhe, A. A., Karle, S. B., Aftab, T., Kumar, K. (2021). With no lysine kinases: the key regulatory networks and phytohormone cross talk in plant growth, development and stress response. Plant Cell Rep. 40, 2097–2109. doi: 10.1007/s00299-021-02728-y
Sade, N., Gebremedhin, A., Moshelion, M. (2012). Risk-taking plants: anisohydric behavior as a stress-resistance trait. Plant Signal Behav. 7, 767–770. doi: 10.4161/psb.20505
Scharwies, J. D., Dinneny, J. R. (2019). Water transport, perception, and response in plants. J. Plant Res. 132, 311–324. doi: 10.1007/s10265-019-01089-8
Schreiber, M., Barakate, A., Uzrek, N., Macaulay, M., Sourdille, A., Morris, J., et al. (2019). A highly mutagenised barley (cv. golden promise) TILLING population coupled with strategies for screening-by-sequencing. Plant Methods 15, 99. doi: 10.1186/s13007-019-0486-9
Seki, M., Narusaka, M., Ishida, J., Nanjo, T., Fujita, M., Oono, Y., et al. (2002). Monitoring the expression profiles of 7000 arabidopsis genes under drought, cold and high-salinity stresses using a full-length cDNA microarray. Plant J. 31, 279–292. doi: 10.1046/j.1365-313X.2002.01359.x
Shiota, N., Kodama, S., Inui, H., Ohkawa, H. (2000). Expression of human cytochromes P450 1A1 and P450 1A2 as fused enzymes with yeast NADPH-cytochrome P450 oxidoreductase in transgenic tobacco plants. Biosci. Biotechnol. Biochem. 64, 2025–2033. doi: 10.1271/bbb.64.2025
Suoniemi, A., Narvanto, A., Schulman, A. H. (1996). The BARE-1 retrotransposon is transcribed in barley from an LTR promoter active in transient assays. Plant Mol. Biol. 31, 295–306. doi: 10.1007/BF00021791
Suprunova, T., Krugman, T., Fahima, T., Chen, G., Shams, I., Korol, A., et al. (2004). Differential expression of dehydrin genes in wild barley, Hordeum spontaneum, associated with resistance to water deficit. Plant Cell Environ. 27, 1297–1308. doi: 10.1111/j.1365-3040.2004.01237.x
Tang, J., Bassham, D. C. (2022). Autophagy during drought: function, regulation, and potential application. Plant J. 109, 390–401. doi: 10.1111/tpj.15481
Tao, F. L., Rotter, R. P., Palosuo, T., Diaz-Ambrona, C. G. H., Minguez, M. I., Semenov, M. A., et al. (2017). Designing future barley ideotypes using a crop model ensemble. Eur. J. Agron. 82, 144–162. doi: 10.1016/j.eja.2016.10.012
Tardieu, F., Simonneau, T. (1998). Variability among species of stomatal control under fluctuating soil water status and evaporative demand: modelling isohydric and anisohydric behaviours. J. Exp. Bot. 49, 419–432. doi: 10.1093/jxb/49.Special_Issue.419
Valea, I., Motegi, A., Kawamura, N., Kawamoto, K., Miyao, A., Ozawa, R., et al. (2022). The rice wound-inducible transcription factor RERJ1 sharing same signal transduction pathway with OsMYC2 is necessary for defense response to herbivory and bacterial blight. Plant Mol. Biol. 109, 651–666. doi: 10.1007/s11103-021-01186-0
Verma, G., Dhar, Y. V., Srivastava, D., Kidwai, M., Chauhan, P. S., Bag, S. K., et al. (2017). Genome-wide analysis of rice dehydrin gene family: its evolutionary conservedness and expression pattern in response to PEG induced dehydration stress. PloS One 12, e0176399. doi: 10.1371/journal.pone.0176399
Wang, Y., Xu, H., Zhu, H., Tao, Y., Zhang, G., Zhang, L., et al. (2014). Classification and expression diversification of wheat dehydrin genes. Plant Sci. 214, 113–120. doi: 10.1016/j.plantsci.2013.10.005
Wei, K. F., Chen, H. Q. (2018). Global identification, structural analysis and expression characterization of cytochrome P450 monooxygenase superfamily in rice. BMC Genomics 19, 35. doi: 10.1186/s12864-017-4425-8
Wei, L., Gu, L., Song, X., Cui, X., Lu, Z., Zhou, M., et al. (2014). Dicer-like 3 produces transposable element-associated 24-nt siRNAs that control agricultural traits in rice. Proc. Natl. Acad. Sci. U.S.A. 111, 3877–3882. doi: 10.1073/pnas.1318131111
Wei, K., Zhong, X. (2014). Non-specific lipid transfer proteins in maize. BMC Plant Biol. 14, 281. doi: 10.1186/s12870-014-0281-8
Wicker, T., Sabot, F., Hua-Van, A., Bennetzen, J. L., Capy, P., Chalhoub, B., et al. (2007). A unified classification system for eukaryotic transposable elements. Nat. Rev. Genet. 8, 973–982. doi: 10.1038/nrg2165
Xiao, Y., Huang, X., Shen, Y., Huang, Z. (2013). A novel wheat alpha-amylase inhibitor gene, TaHPS, significantly improves the salt and drought tolerance of transgenic arabidopsis. Physiol. Plant 148, 273–283. doi: 10.1111/j.1399-3054.2012.01707.x
Xu, D. R., Marino, G., Klingl, A., Enderle, B., Monte, E., Kurth, J., et al. (2019). Extrachloroplastic PP7L functions in chloroplast development and abiotic stress tolerance. Plant Physiol. 180, 323–341. doi: 10.1104/pp.19.00070
Xu, Z., Zhou, G., Shimizu, H. (2010). Plant responses to drought and rewatering. Plant Signal Behav. 5, 649–654. doi: 10.4161/psb.5.6.11398
Yang, T. R., Yao, S. F., Hao, L., Zhao, Y. Y., Lu, W. J., Xiao, K. (2016). Wheat bHLH-type transcription factor gene TabHLH1 is crucial in mediating osmotic stresses tolerance through modulating largely the ABA-associated pathway. Plant Cell Rep. 35, 2309–2323. doi: 10.1007/s00299-016-2036-5
Zeng, X., Zeng, Z., Liu, C., Yuan, W., Hou, N., Bian, H., et al. (2017). A barley homolog of yeast ATG6 is involved in multiple abiotic stress responses and stress resistance regulation. Plant Physiol. Biochem. 115, 97–106. doi: 10.1016/j.plaphy.2017.03.013
Zhang, X., Shabala, S., Koutoulis, A., Shabala, L., Zhou, M. (2017). Meta-analysis of major QTL for abiotic stress tolerance in barley and implications for barley breeding. Planta 245, 283–295. doi: 10.1007/s00425-016-2605-4
Keywords: drought, autophagy, barley, resilience (environmental), network analysis, gene expression, Hordeum vulgare
Citation: Paul M, Tanskanen J, Jääskeläinen M, Chang W, Dalal A, Moshelion M and Schulman AH (2023) Drought and recovery in barley: key gene networks and retrotransposon response. Front. Plant Sci. 14:1193284. doi: 10.3389/fpls.2023.1193284
Received: 24 March 2023; Accepted: 09 May 2023;
Published: 12 June 2023.
Edited by:
Jose M. Mulet, Universitat Politècnica de València, SpainReviewed by:
Dinakaran Elango, Iowa State University, United StatesMarkus Kuhlmann, Leibniz Institute of Plant Genetics and Crop Plant Research (IPK), Germany
Copyright © 2023 Paul, Tanskanen, Jääskeläinen, Chang, Dalal, Moshelion and Schulman. This is an open-access article distributed under the terms of the Creative Commons Attribution License (CC BY). The use, distribution or reproduction in other forums is permitted, provided the original author(s) and the copyright owner(s) are credited and that the original publication in this journal is cited, in accordance with accepted academic practice. No use, distribution or reproduction is permitted which does not comply with these terms.
*Correspondence: Alan H. Schulman, YWxhbi5zY2h1bG1hbkBoZWxzaW5raS5maQ==
‡ORCID: Maitry Paul, orcid.org/0000-0002-3558-4654
Jaakko Tanskanen, orcid.org/0000-0003-0995-804X
Marko Jääskeläinen, orcid.org/0000-0002-6387-5539
Wei Chang, orcid.org/0000-0003-3371-749X
Ahan Dalal, orcid.org/0000-0003-1876-1484
Menachem Moshelion, orcid.org/0000-0003-0156-2884
Alan H. Schulman, orcid.org/0000-0002-4126-6177