
94% of researchers rate our articles as excellent or good
Learn more about the work of our research integrity team to safeguard the quality of each article we publish.
Find out more
ORIGINAL RESEARCH article
Front. Plant Sci., 29 May 2023
Sec. Plant Nutrition
Volume 14 - 2023 | https://doi.org/10.3389/fpls.2023.1186818
This article is part of the Research TopicAdvances in Plant-Soil Nitrogen Management StrategiesView all 17 articles
 Mengyun Chen1,2
 Kaikai Zhu1,2
 Junyi Xie1,3
 Junping Liu1,2
 Zhenbing Qiao1,2
 Pengpeng Tan1,2
 Fangren Peng1,2*
Nitrogen (N) limits plant productivity, and its uptake and assimilation may be regulated by N sources, N assimilating enzymes, and N assimilation genes. Mastering the regulatory mechanisms of N uptake and assimilation is a key way to improve plant nitrogen use efficiency (NUE). However, it is poorly known how these factors interact to influence the growth process of pecans. In this study, the growth, nutrient uptake and N assimilation characteristics of pecan were analyzed by aeroponic cultivation at varying / ratios (0/0, 0/100,25/75, 50/50, 75/25,100/0 as CK, T1, T2, T3, T4, and T5). The results showed that T4 and T5 treatments optimally promoted the growth, nutrient uptake and N assimilating enzyme activities of pecan, which significantly increased aboveground biomass, average relative growth rate (RGR), root area, root activity, free amino acid (FAA) and total organic carbon (TOC) concentrations, nitrate reductase (NR), nitrite reductase (NiR), glutamine synthetase (GS), glutamate synthase (Fd-GOGAT and NADH-GOGAT), and glutamate dehydrogenase (GDH) activities. According to the qRT-PCR results, most of the N assimilation genes were expressed at higher levels in leaves and were mainly significantly up-regulated under T1 and T4 treatments. Correlation analysis showed that a correlation between N assimilating enzymes and N assimilating genes did not necessarily exist. The results of partial least squares path model (PLS-PM) analysis indicated that N assimilation genes could affect the growth of pecan by regulating N assimilation enzymes and nutrients. In summary, we suggested that the / ratio of 75:25 was more beneficial to improve the growth and NUE of pecan. Meanwhile, we believe that the determination of plant N assimilation capacity should be the result of a comprehensive analysis of N concentration, N assimilation enzymes and related genes.
Nitrogen (N) is the most important mineral nutrient required for plant growth and development (Guo et al., 2019). most nonlegume plants require their roots to take up 20-50 g N for every 1 kg of dry biomass produced (Xu et al., 2012). N fertilizer was the most widely used fertilizer in the world, and the suitable amount of N fertilizer can help improve crop yield and quality (Lu et al., 2021). However, the utilization efficiency of N fertilizer was very poor, with only about 30% (Guo et al., 2020). The loss of large amounts of N fertilizer has caused adverse effects such as land acidification, water pollution and greenhouse gas emissions (Qin et al., 2021). Therefore, improving N uptake and utilization by plants is important to promote better plant growth using less N fertilizer.
and are the two main forms of N absorbed by plants, and studies have shown that the mixture of and is more beneficial to promote plant growth and N uptake. The maximum biomass of C. paliurus (Cyclocarya paliurus) was reached when the : ratio was 50:50 (Qin et al., 2021, 2). And the mixed application of and also increased the biomass, leaf area and TN concentration of black walnut (Juglans nigra L.) (Nicodemus et al., 2008). Zhang et al. (2007) showed that P, K+, Ca2+, and Mg2+ concentrations significantly varied under different N forms, while N forms affected the uptake of various mineral nutrients by plants in three main ways. Firstly, the N form can affect the absorption of mineral elements by regulating the balance of anions and cations (Egenolf et al., 2021), with antagonistic effects between and cations and between and anions (M’rah Helali et al., 2010). Second, the intake of and by plants will change the pH of the medium, the absorption of will acidify the medium, the absorption of will alkalize the medium, and the pH will directly affect the absorption of mineral elements (Zhao and Shen, 2018). Third, the uptake of by plants requires higher energy cost than the uptake of , which leads to slower absorption of other mineral elements (Tang et al., 2020).
Once and enter the plant through root uptake, most will be assimilated in the roots, while will be mainly assimilated in the leaves (Ruan et al., 2016). can be reduced to in the cytoplasm by nitrate reductase (NR), which is the rate-limiting and key enzyme of metabolism and is also involved in energy metabolism, water stress and photorespiration of plants (Polcyn and Garnczarska, 2009; Bloom, 2015). Subsequently, forms catalyzed by nitrite reductase (NiR). NR-related genes have two types, Nia1, which is specifically induced to be expressed by NADH, and Nia2, whose expression is based on NAD(P)H as a substrate (Harris et al., 2000). It was shown that deletion mutations in AtNIA2 resulted in 90% reduction of NR activity in leaves, but AtNIA1 and AtNIA2 genes were overexpressed in the roots of NR-deficient mutants (Loqué et al., 2003). Loppes et al. (1999) found that Nia expression was down-regulated by the presence of , while and significantly up-regulated the expression of Nia. NiRs encoding genes include nirS and nirK, which encode heme c and heme d1 (cd1-Nir) and copper (Cu-Nir), respectively. nirS is more widely distributed than nirK (Priemé et al., 2002). At present, little research has been reported on the response of NiR to N morphology.
Glutamine synthetase (GS) is a key enzyme for N assimilation and reactivation, and it forms the GS-GOGAT cycle with glutamate synthase (GOGAT) (Li et al., 2017). synthesizes a Glutamine (Gln) via GS with a glutamate (Glu), while Glu is synthesized by the action of Gln and two GOGAT. Meanwhile, glutamate dehydrogenase (GDH) located in mitochondria can also synthesize Glu directly using 2-ketoglutarate and (Krapp, 2015). GS includes two isoforms, cytosolic GS1 and plastidic GS2, GS1 is the main enzyme in non-photosynthetic tissues or roots which is responsible for primary assimilation in roots or for re-assimilation of produced in leaves during protein turnover, while GS2 is mainly responsible for the assimilation of produced by photorespiration in chloroplasts (Thomsen et al., 2014). GS-related genes in plants have two types, one is Gln1 located in the cytoplasm and the other is Gln2 in the chloroplast (Bernhard and Matile, 1994). Gln1 was not induced by light and was mainly expressed in plant roots, while Gln2 expression was induced by light and was majorly present in the aboveground of plants (Edwards and Coruzzi, 1989). In Arabidopsis thaliana, GLN1;2 was significantly up-regulated in response to induction (Guo et al., 2004), whereas gln1;2 mutants exhibited lower GS activity and higher concentrations in the presence of adequate supply (Lothier et al., 2011). Based on the electron donor, GOGAT can be divided into two types: ferredoxin-dependent (Fd-GOGAT) and NADH-dependent (NADH-GOGAT) enzymes (Li et al., 2017). GLU1 and GLU2 are two Fd-GOGATs identified in Arabidopsis, while GLU1 plays a main role in photorespiration and N assimilation in leaves, GLU2 may play a major role in primary N assimilation in roots (Coschigano et al., 1998). GLT is the only NADH-GOGAT gene in Arabidopsis that functions in non-photosynthetic assimilation and Glu synthesis (Lancien et al., 2002).
The pecan [Carya illnoinensis (Wangenh.) K. Koch] is a member of the Juglandaceae family. Pecans have thin shells and full, sweet kernels, which makes them a world-renowned economic tree (Zhu et al., 2020). However, pecans have the same problem of low nitrogen use efficiency (NUE) in cultivation, and hardly any relevant reports are available. Therefore, in this experiment, pecan seedlings were used as materials to study the effects of different : ratios on their growth and development and N assimilation. Specifically, biomass, leaf area, root growth, mineral element content, N uptake, N assimilation enzymes, and expression of related genes were measured to address the following questions: (A) Which : ratio is more helpful to enhance the growth and NUE of pecan seedlings under certain N concentration? (B) How N assimilation genes, N assimilation enzymes, and N interact to affect the growth and development of pecan?
This experiment was conducted in the underground greenhouse of Nanjing Forestry University from April 18, 2021 to June 9, 2021. The seedlings of pecan “Pawnee” seeds were used as experimental materials. The seedlings with a height of about 25 cm were selected, and the roots were cleaned and disinfected for indoor aeroponic cultivation trials. Each treatment had 18 seedlings, arranged according to a randomized complete block design. Greenhouse conditions were as follows: natural light, 12h/12h day/night, day and night temperature of 30/25°C, relative humidity of 70% ± 5%. The nutrient solution was modified Hoagland nutrient solution. The formula was as follows: 1.25 mM Ca(NO3)2, 0.5 mM Ca(H2PO4)2, 1.0 mM K2SO4, 0.5 mM MgSO4, 1.0 μM ZnSO4, 12.5 μM H3BO3, 1.0 μM MnSO4, 0.25 μM CuSO4, 0.1 μM (NH4)6Mo7O24, 10 μM EDTA-Fe. The pH was adjusted to approximately 6.0 every other day with 24 h aeration, and the nutrient solution was replaced every 7 days. The seedlings were precultured with 1/4 nutrient solution for one week, and then cultured in total nutrient solution for experimental treatment. The nitrogen concentration in the nutrient solution was 2 mM. Based on the same N supply, the five ammonium-nitrate ratios (: ) were 0:100, 25:75, 50:50, 75:25, and 100:0, corresponding to T1, T2, T3, T4, and T5, respectively. The nutrient solution without N was used as the control (CK), and each treatment was repeated 3 times, each with 6 seedlings. (NH4)6Mo7O24 was replaced by (Na)6Mo7O24, (NH4)2SO4 was used as the ammonium source, and Ca(NO3)2 was used as the nitrate source. Samples were taken after 45 days of treatment for further determination.
To evaluate the effects of different N forms on the growth of pecans, pecan seedlings cultivated for 45 d under different treatments were used for the determination of growth indicators. Aboveground and underground biomass (g), which were measured by weighing. Leaf area (mm2), which was measured by weighing method and LI-3000 leaf areometer. Pecan roots were scanned with a digital scanner (STDl600EpsonUSA) and root length, root surface area, and root volume were determined with winRhizo root analysis software. Root activity (mg g-1 h-1) was determined by TTC redox method (Stūrīte et al., 2005). And the average relative growth rate (RGR) (g g-1 d-1) calculation formula is as follows:
Where W1 and W2 represent the total pecan biomass (g) of the same plant before and after treatment, respectively. Δt denotes the time interval (d) between the two measurements.
To evaluate the effects of different N forms on the biochemical traits of pecan seedlings, Total nitrogen (TN), total phosphorus (TP), and total potassium (TK) concentrations, which were determined by HClO4-H2SO4 decoction method. The total organic carbon (TOC) concentrations were determined by K2Cr2O7 volumetric and external heating method. And free amino acid (FAA) concentration measurements refer to GB/T 8312-87 to GB/T 8314-87.
To evaluate the effect of different N forms on the nutrient absorption of pecans, the nitrate reductase (NR), nitrite reductase (NiR), glutamine synthetase (GS), glutamate synthase (Fd-GOGAT and NADH-GOGAT), and glutamate dehydrogenase (GDH) activity in roots and leaves were determined by enzyme activity kit (Jiancheng, Nanjing, China). NR catalyzes the reduction of to by NADH, and the NR activity was expressed by measuring the NADH reduction rate. NiR reduces to NO, and the NiR activity was calculated according to the reduction rate of . In the presence of ATP and Mg2+, GS catalyzes and glutamic acid to synthesize glutamine, which is further converted into γ-glutamyl hydroxamic acid. The complex formed under acidic conditions was measured to calculate GS activity. Fd-GOGAT catalyzes the transfer of the amino group of glutamine to α-ketoglutarate and forms glutamic acid. The dehydrogenation of glutamic acid produces NADH, which makes WST-8 orange-yellow. The absorbance value was measured to indicate Fd-GOGAT activity. NADH-GOGAT catalyzes the transfer of the amino group of glutamine to α-ketoglutarate to form glutamic acid, while NADH is oxidized to NAD+. The NADH-GOGAT activity was reflected by measuring the NADH decline rate. GDH catalyzes , α-ketoglutarate and NADH to produce glutamic acid and NAD+, and GDH activity was expressed by measuring the rate of NADH reduction.
According to the manufacturer’s protocol, the total RNA was extracted from the leaves and roots of pecan using a Universal Plant Total RNA Extraction Kit (Bioteke, Beijing, China) and stored at -80°C until further use. The purity and integrity of the isolated total RNA was analyzed by agarose gel electrophoresis and Nanodrop 2000 spectrophotometer (Thermo Scientific, Wilmington, NC, USA). First-strand cDNA was synthesized using a cDNA Synthesis Kit (HiScript ®RIII RT SuperMix for qPCR +gDNA wiper, Vazyme, Nanjing, China). The qRT-PCR was performed on a 7500 Real-Time PCR system (Applied BiosystemsTM, Foster City, CA, USA) using a Taq Pro Universal SYBR qPCR Master Mix (Vazyme, Nanjing, China). The specific primers were synthesized by Tsingke Biotechnology Ltd (Nanjing, China), the details of the primers were provided in Table 1, melting curve analyses were used to verify the efficiency of the primers (Supplementary Figure S1). The Actin gene was used as an internal reference gene (Zhu et al., 2022), and the relative expression levels of pecan Nia, NiR, Gln, GOGAT, and GDH genes were determined using the 2-ΔΔCt method (Livak and Schmittgen, 2001). Values represent mean calculated from three biological replicates and three technological repeats. The pecan N assimilate genes were renamed according to the Arabidopsis gene name and the NCBI pblast results.
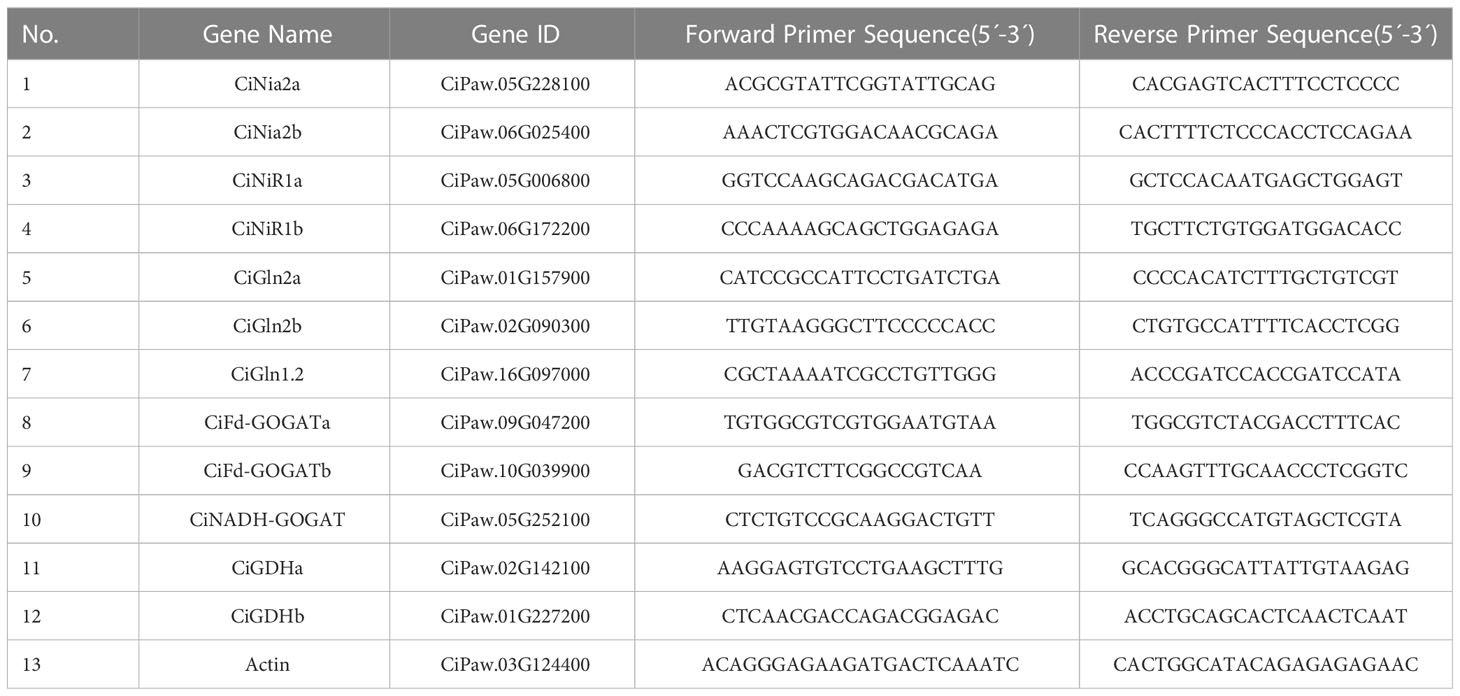
Table 1 The sequences of primers used for qPCR.
Before analysis of variance (ANOVA), data were checked for normality and homogeneity of variances. One-way ANOVA was performed to test the effects of different N forms on biomass, leaf area, root growth, N uptake rate, and N transport capacity of pecan. Two-way ANOVA was performed to test the effects of N form, organ and their interactions on the nutrients, enzyme activity and gene expression of pecan. Differences were considered significant at p<0.05. Correlation analysis was used to test the correlations between the growth and N assimilation indicators. Partial least squares path model (PLS-PM) was used to analyze the role between N assimilation genes, N assimilation enzymes, plant nutrients and growth. Finally, principal component analysis (PCA) was carried out on 20 indicators of N assimilation, determining the number of principal components according to characteristic values and cumulative contribution rates and calculating principal component scores based on factor scores (Rahmani and Atia, 2017).
All statistical analyses were performed with SPSS 23.0 software (Version 23.0, Chicago, IL, USA) and r4.2.1, the partial least squares path model was constructed using the “plspm” package (Latan and Noonan, 2017). All charts were drawn with r4.2.1 and SigmaPlot (Version 14.0, Barcelona, Spain).
To explore the effect of different N forms on the growth characteristics of pecan, we analyzed pecan biomass, leaf area and root growth under different N forms (Figure 1, 2). The results showed that the leaf area of pecan was not significantly affected by different N form treatments (Figure 1A). T4 and T5 significantly increased aboveground biomass of pecan (p< 0.05), other treatments were not significantly different from CK (Figure 1B). However, there was no significant effect of N form on underground biomass of pecan (Figure 1C). T4 and T5 were significantly increased the RGR of pecan (p< 0.05), other treatments were not significantly different from CK (Figure 1D). T4 and T5 significantly increased the root length (p< 0.05), while the other treatments were not significantly different from CK (Figure 2A). Both T1-T5 treatments significantly increased root area and root activity compared to CK (p< 0.05) (Figures 2B, D). T2 and T4 significantly increased the root volume (p< 0.05), while the other treatments were not significantly different from CK (Figure 2C). T3 and T5 treatments significantly increased SRL (p< 0.05), and T1, T2, and T4 treatments were not significantly different from CK (Figure 2E). Different N forms had no significant effect on RMR of pecan (Figure 2F).
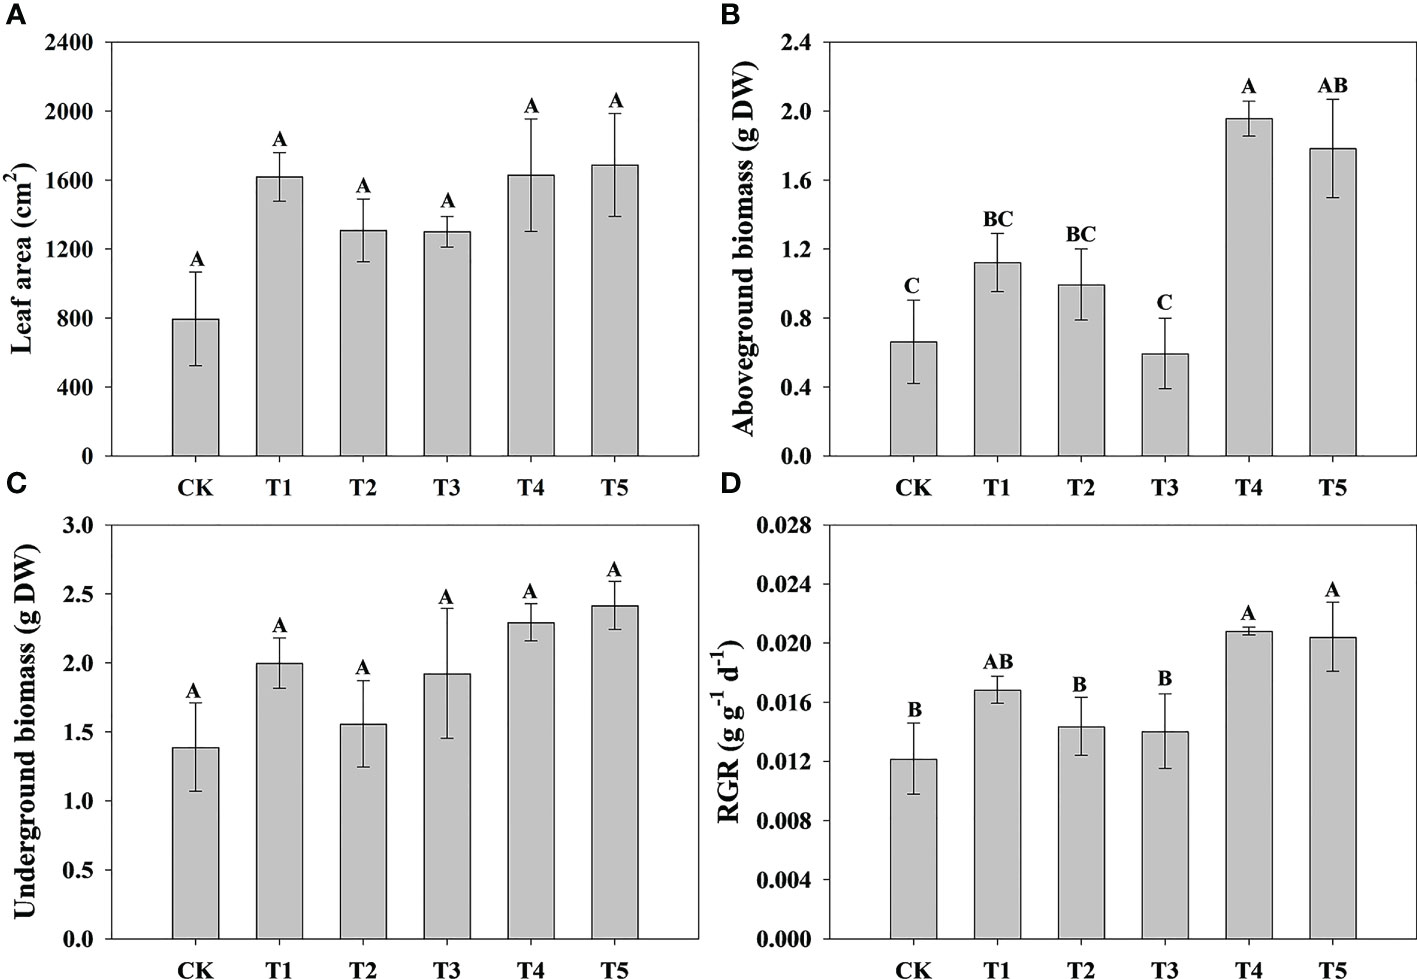
Figure 1 Analysis of leaf area and biomass of pecan under different N forms. Leaf area of pecan under different N forms (A). Aboveground biomass of pecan under different N forms (B). Underground biomass of pecan under different N forms (C). RGR of pecan under different N forms (D). Uppercase letters indicate differences between N form treatments, at p< 0.05. RGR, average relative growth rate; DW, dry weight.
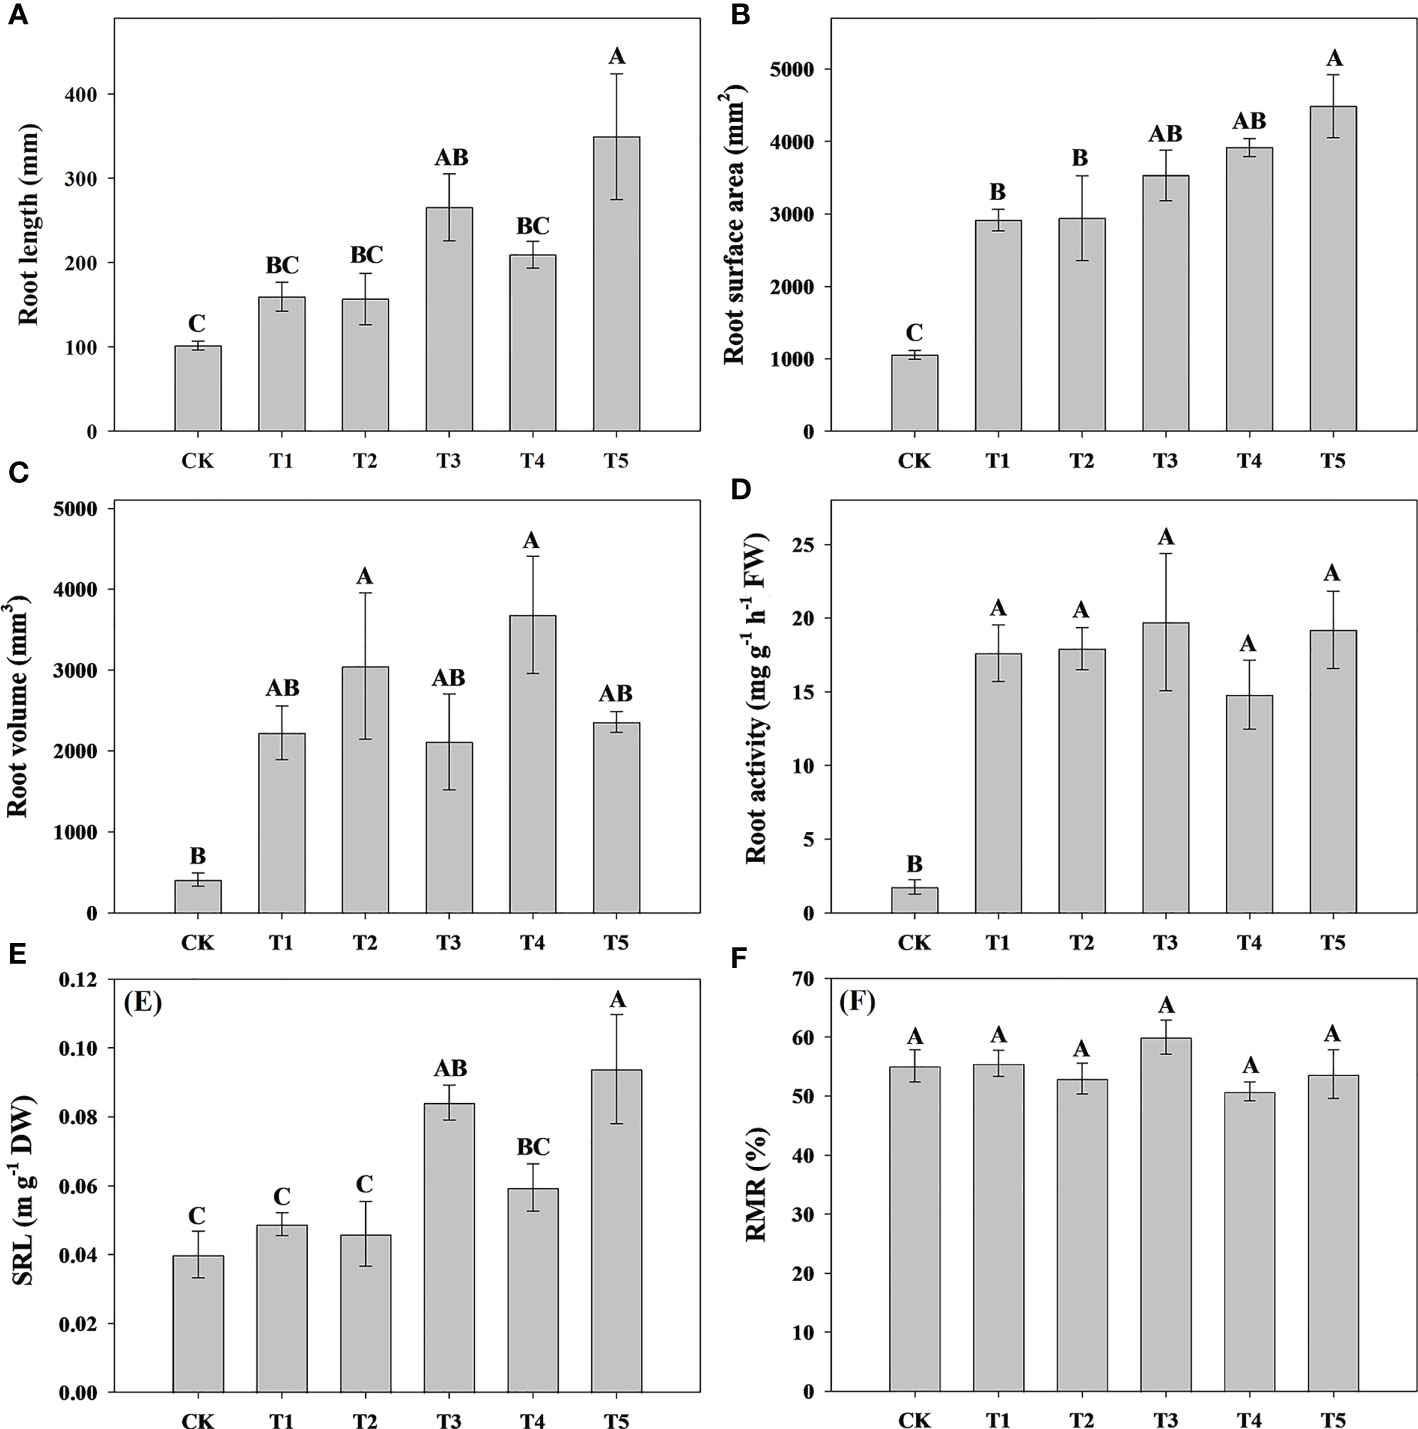
Figure 2 Analysis of root length, root surface area, root volume, and root activity of pecan under different N forms. Root length of pecan under different N forms (A). Root surface area of pecan under different N forms (B). Root volume of pecan under different N forms (C). Root activity of pecan under different N forms (D). SRL of pecan under different N forms (E), SRL is the ratio of root length to root biomass. RMR of pecan under different N forms (F), RMR is the ratio of root biomass to whole plant biomass. Uppercase letters indicate differences between N form treatments, at p< 0.05. SRL, specific root length; RMR, root mass ratio; FW, fresh weight; DW, dry weight.
To study the effect of different N forms on the N uptake and assimilation of pecan, we analyzed the TN concentration in all organs of pecan under different N forms (Table 2, Figure 3). According to Table 2, we found that both N form and plant organ had a highly significant effect on TN (p< 0.01), but the interaction between them had no significant effect on TN. The TN concentrations in pecan leaves were greater than that in the stems and roots (Figure 3A). In leaves, T1, T3, and T4 treatments were not significantly different but significantly greater than CK (p< 0.05), and T2 and T5 were not significantly different from CK (Figure 3A). In the stems, the T4 was significantly higher than the other treatments (p< 0.05), and there was no significant difference between other treatments (Figure 3A). In the roots, the difference between treatments was not significant (Figure 3A). According to the mean value of pecan leaf, stem, and root, the T4 was significantly higher than CK (p< 0.05), and they were not significantly different from the other treatments (Figure 3B). T4 treatment significantly increased the NUE of leaves and stems (p< 0.05), and the average NUE of leaves, stems, and roots also showed that T4 treatment was significantly higher than T1, T2, and T3 treatments (p< 0.05) (Figures 3C, D). Both N form treatments were significantly increased N uptake rate of pecan (p< 0.05), with the most significant being the T4 treatment (Figure 3E). surprisingly, the N uptake rate of pecan under CK was negative, indicating that the N efflux from pecan was greater than the influx under CK (Figure 3E). Both N forms and CK treatment had no significant effect on N transport capacity of pecan (Figure 3F).
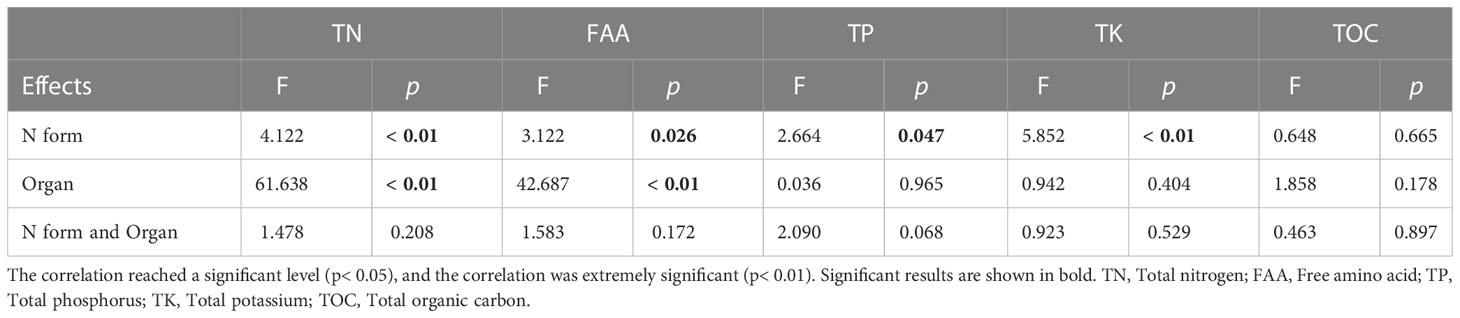
Table 2 ANOVAs on the effects of N form and organ on FAA and nutrient elements in pecan.
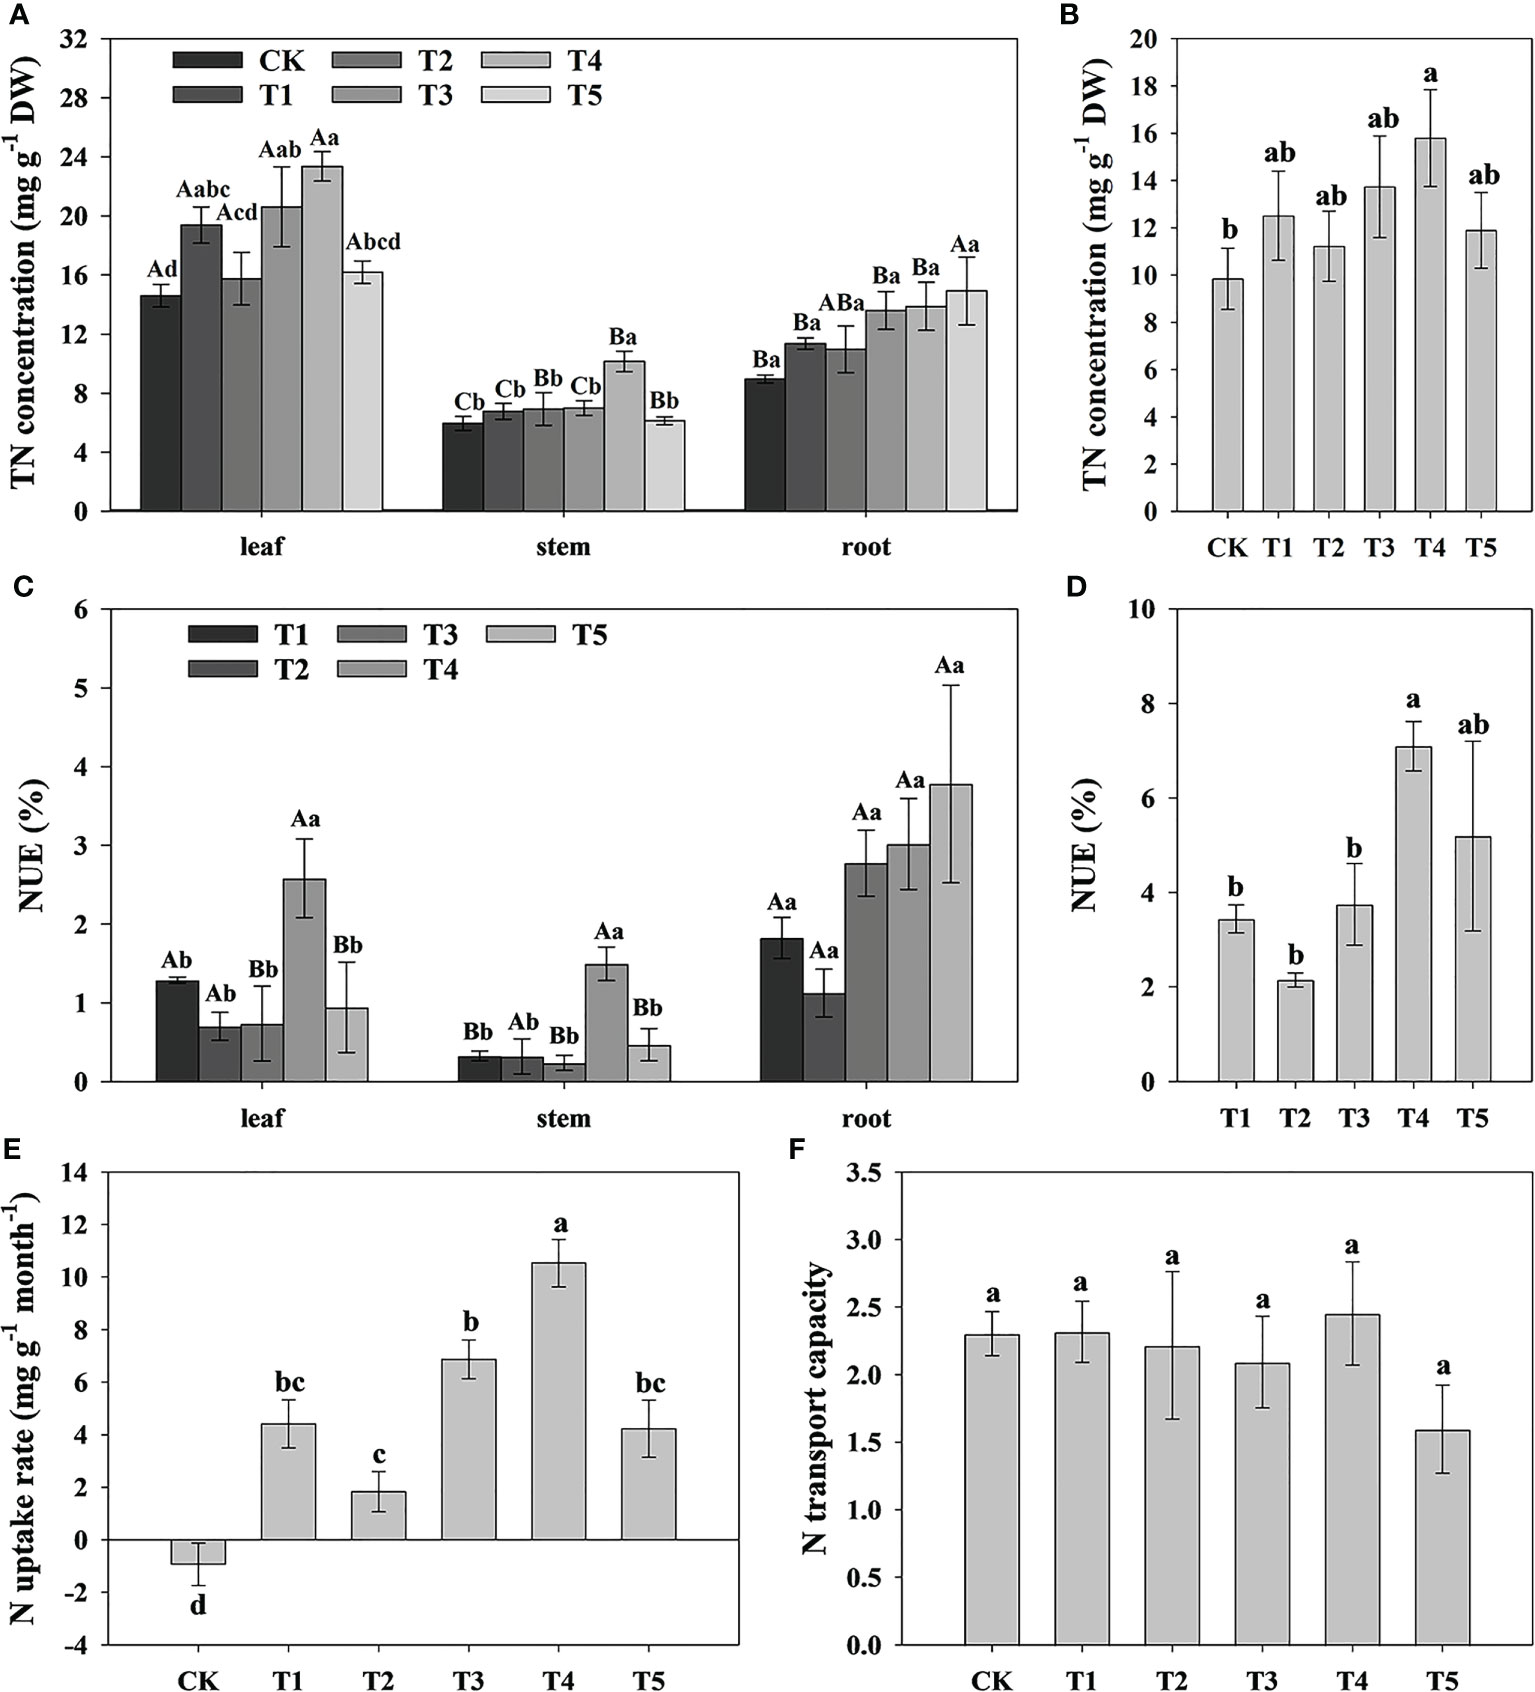
Figure 3 Analysis of N uptake rate and N transport capacity of pecan under different N forms. TN concentrations in leaves, stems and roots of pecan under different N forms (A). The mean level of TN concentrations of pecan leaves, stems and roots under different N forms (B). NUE of leaves, stems and roots of pecan under different N forms (C), NUE was measured by the ratio of the difference between the TN accumulation of the N application treatment and the TN accumulation of the CK treatment to the total N application. The sum of NUE of pecan leaves, stems and roots under different N forms (D). N uptake rate of pecan under different N forms (E), N uptake rate was measured by the ratio of the differential of TN concentration before and after fertilization to the time. N transport capacity of pecan under different N forms (F), N transport capacity was measured by the ratio of TN concentration in the aboveground and underground of the plant. Uppercase letters indicate differences between organs, and lowercase letters indicate differences between : treatments, at p< 0.05. TN, Total nitrogen; NUE, nitrogen use efficiency; DW, dry weight.
To study the effect of different N forms on the FAA and nutrient elements of pecan, we analyzed the FAA, TP, TK, and TOC concentration in all organs of pecan under different N forms (Table 2, Figure 4). We found that N form had a highly significant effect on TK (p< 0.01) and a significant effect on FAA and TP (p< 0.05), plant organ had a strongly significant effect on FAA (p< 0.01), neither N form nor plant organ had a significant effect on TOC, and the interaction between them had no significant effect on FAA and all nutrient elements (Table 2). We found that FAA concentrations were highest in the leaves of pecan (Figure 4A). In the leaves, the FAA concentrations of pecan under T4 and T5 were significantly greater than CK (p< 0.05), and T1, T2, and T3 were not significantly different from other treatments (Figure 4A). In the stems, the FAA concentrations of pecan under T1, T3, and T5 were significantly greater than CK and T4 (p< 0.05), and T2 was significantly greater than CK (p< 0.05) and not significantly different from the other treatments (Figure 4A); The TP concentrations under T1, T2, and T4 were significantly greater than CK (p< 0.05), and T3 and T5 were not significantly different from the other treatments (Figure 4B). In the roots, the FAA concentrations were significantly greater under T3 and T4 than CK and T5 (p< 0.05), and T1 and T2 were not significantly different from the other treatments(Figure 4A); The TP concentrations under T4 were significantly greater than the other treatments (p< 0.05) (Figure 4B); The TK concentrations under T1 were significantly greater than CK and T5 (p< 0.05), and T2, T3, and T4 were not significantly different from the other treatments (Figure 4C); The TOC concentrations under T4 were significantly greater than CK (p< 0.05), and T1, T2, T3, and T5 were not significantly different from the other treatments (Figure 4D). According to the mean value of pecan leaf, stem, and root, the FAA concentrations of pecan under T1, T3, T4, and T5 were significantly greater than CK (p< 0.05), and T2 was not significantly different from the other treatments (Figure 4A); the TP concentrations of pecan under T3 and T5 were significantly greater than CK (p< 0.05), and T1, T2, and T4 were not significantly different from the other treatments (Figure 4B); the TK concentrations of pecan under T2 and T3 were significantly greater than CK (p< 0.05), and T1 and T4 were not significantly different from the other treatments (Figure 4C); the TOC concentrations of pecan under T4 and T5 were significantly greater than CK (p< 0.05), and T1, T2, and T3 were not significantly different from the other treatments (Figure 4D).
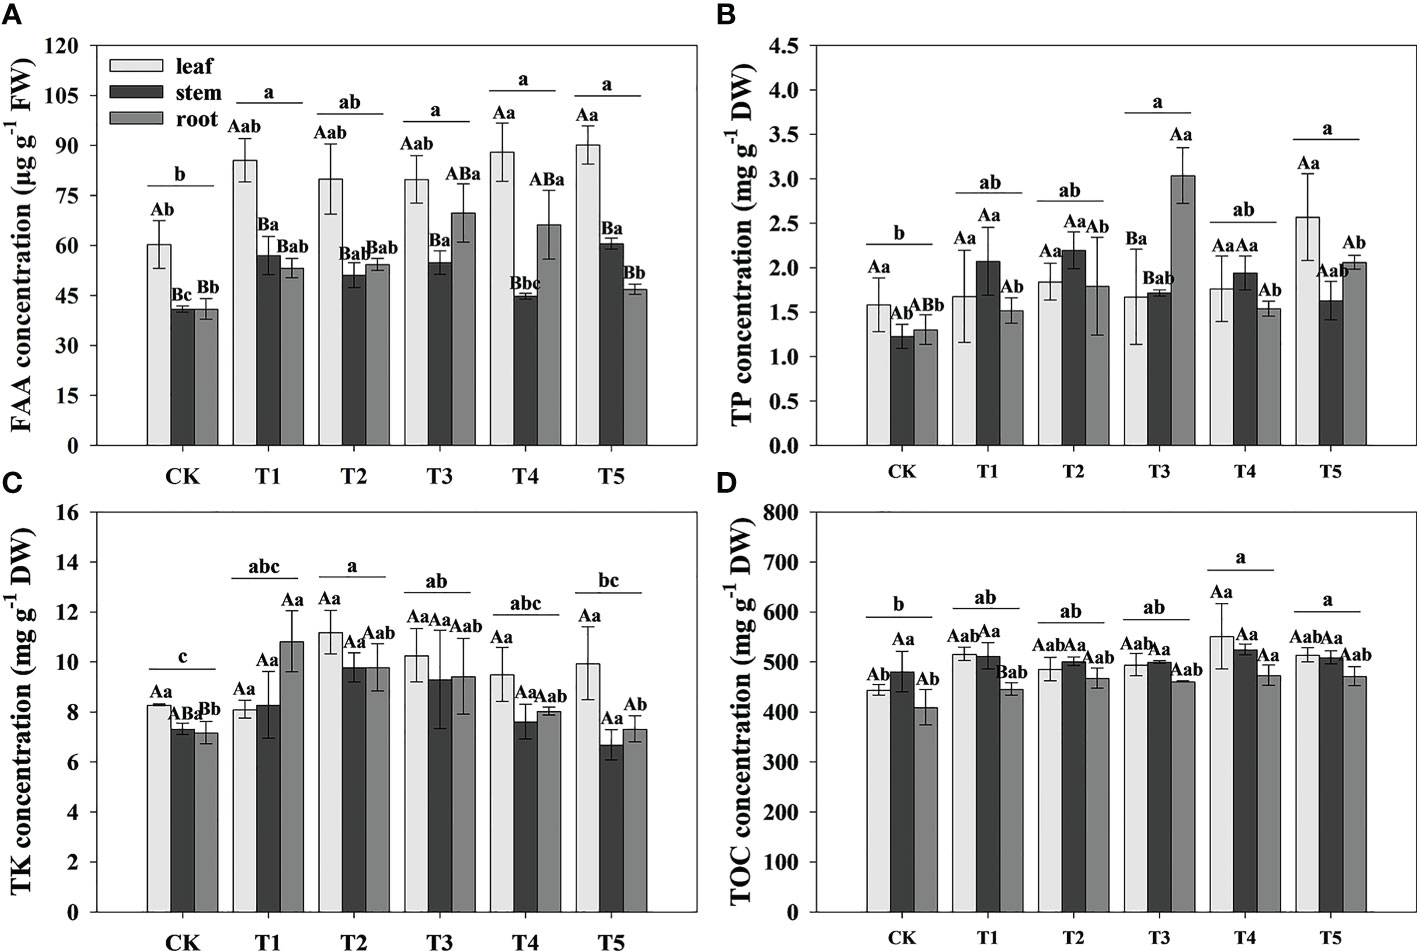
Figure 4 Analysis of FAA and nutrient elements concentration of pecan under different N forms. FAA concentrations in leaves, stems and roots of pecan under different N forms (A). TP concentrations in leaves, stems and roots of pecan under different N forms (B). TK concentrations in leaves, stems and roots of pecan under different N forms (C). SOC concentrations in leaves, stems and roots of pecan under different N forms (D). Uppercase letters indicate differences between organs, and lowercase letters indicate differences between : treatments, at p< 0.05. FAA, Free amino acid; TP, Total phosphorus; TK, Total potassium; TOC, Total organic carbon; FW, fresh weight; DW, dry weight.
To research the effect of N form on N assimilation in pecan, we analyzed the N assimilation-related enzyme activity in leaves and roots of pecan under different N forms (Figure 5). In the leaves, the NR activity under T4 and T5 was significantly greater than CK and T2 (p< 0.05), and T1 and T3 were not significantly different from the other treatments (Figure 5A); the NiR activity under T1, T2, and T4 was significantly greater than CK and T5 (p< 0.05) (Figure 5B); the GS activity under all N form treatments was significantly greater than CK (p< 0.05) (Figure 5C); the F-GOGAT activity under T3, T4, and T5 was significantly greater than CK, T1, and T2 (p< 0.05), and CK, T1, and T2 treatments were not significantly different from each other, and T4 treatment was significantly greater than T3 and T5 (p< 0.05) (Figure 5D).The NADH-GOGAT activity under T1, T2, T4, and T5 was significantly greater than CK (p< 0.05), and T3 was not significantly different from the other treatments (Figure 5E); the GDH activity under T4 and T5 was significantly greater than CK, T1, T2, and T3 (p< 0.05) (Figure 5F). In the roots, the NR activity under T4 was significantly greater than CK, T1, T3, and T5 (p< 0.05), and T2 was not significantly different from the other treatments (Figure 5A); the NiR activity under T1, T2, T3, and T4 was significantly greater than CK and T5 (p< 0.05) (Figure 5B); the GS activity under T2, T4, and T5 was significantly greater than CK and T1 (p< 0.05), and CK, T1, and T3 were not significantly different from each other (Figure 5C); the Fd-GOGAT activity under T1, T3, and T4 treatments was significantly greater than CK, T2, and T5 (p< 0.05), and T1, T3, and T4 treatments were not significantly different from each other, and CK and T5 treatments had no significantly difference and less significantly than T2 (p< 0.05) (Figure 5D); the NADH-GOGAT activity under T4 was significantly greater than the other treatments (p< 0.05) (Figure 5E); the GDH activity under T1, T2, and T4 was significantly greater than CK (p< 0.05), and T3 and T5 were not significantly different from CK (Figure 5F).
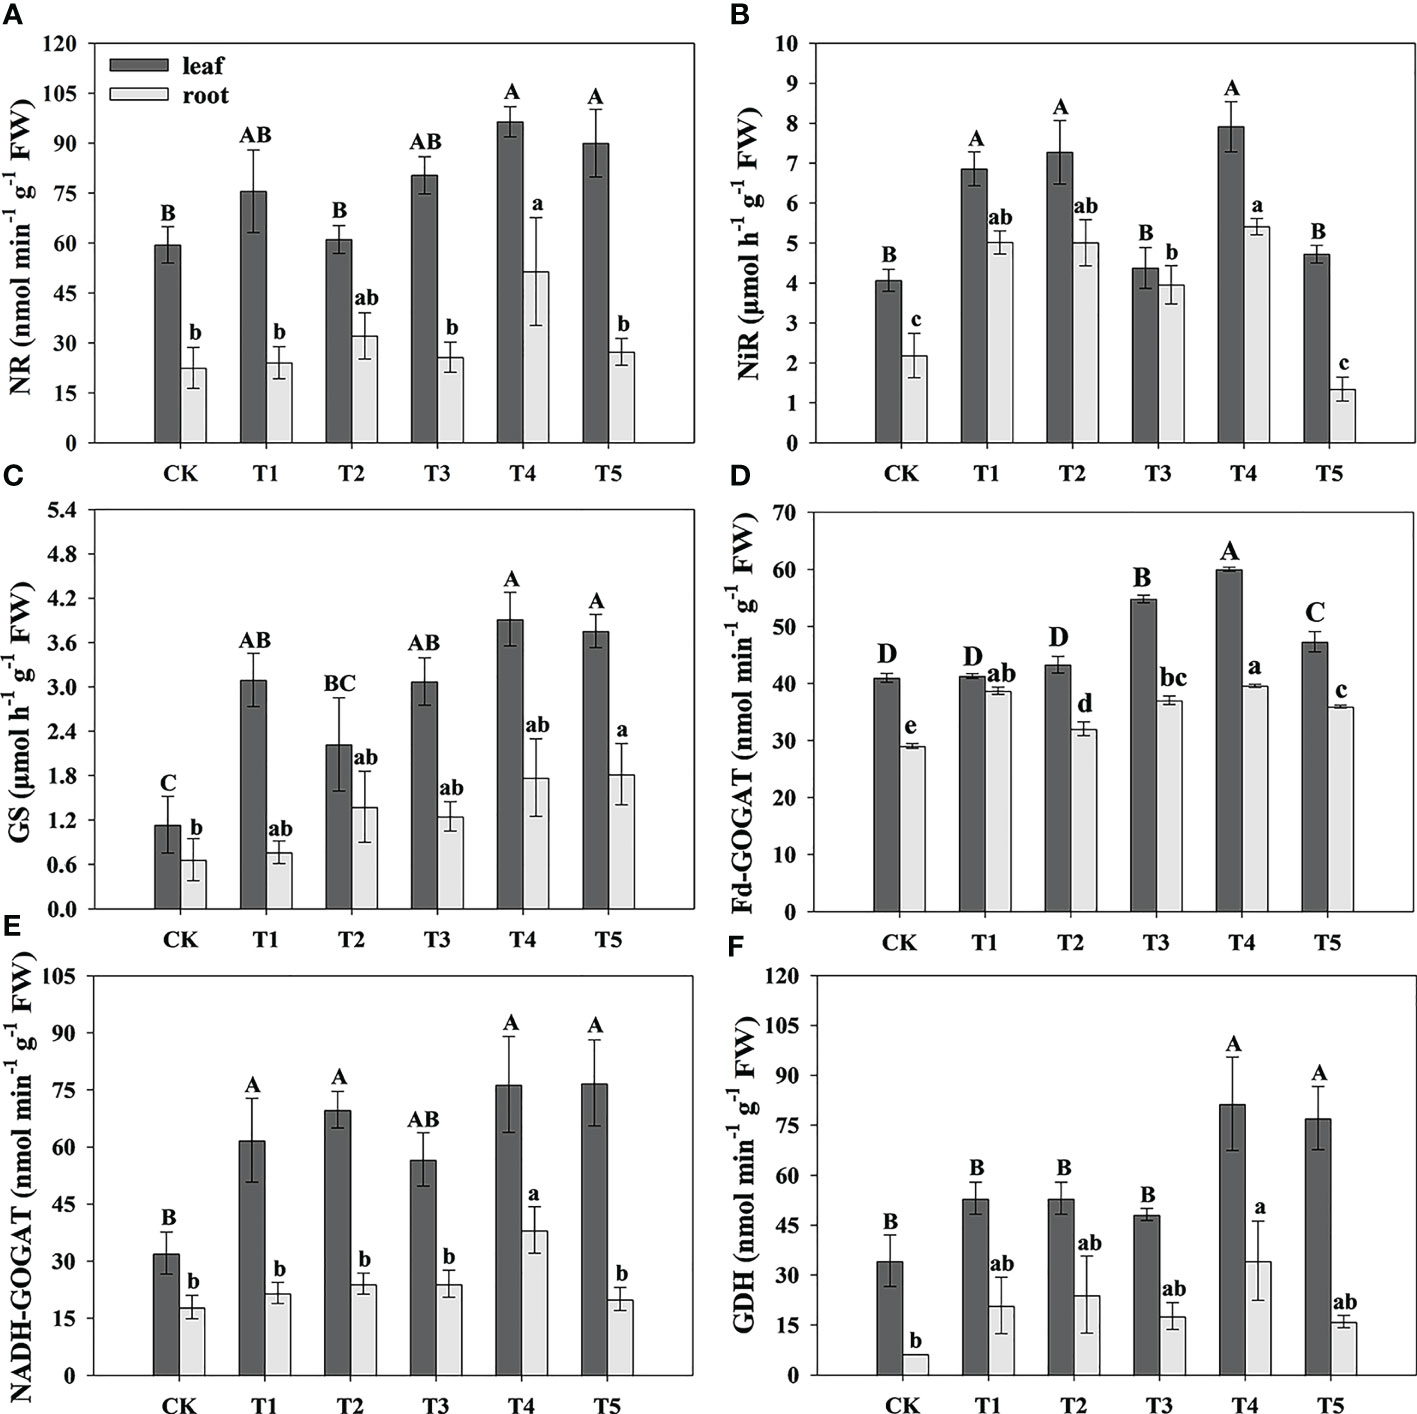
Figure 5 Analysis of N assimilation-related enzymes activity of pecan under different N forms. NR activity in leaves and roots of pecan under different N forms (A). NiR activity in leaves and roots of pecan under different N forms (B). GS activity in leaves and roots of pecan under different N forms (C). GOGAT activity in leaves and roots of pecan under different N forms (D). GDH activity in leaves and roots of pecan under different N forms (E). Uppercase letters indicate differences between organs, and lowercase letters indicate differences between : treatments, at p< 0.05. NR, Nitrate reductase; NiR, Nitrite reductase; GS, Glutamine synthetase; GOGAT, Glutamate synthase; GDH, Glutamate dehydrogenase.
To further investigate the effect of N form on N assimilation in pecan, we analyzed the N assimilation enzyme-related genes in leaves and roots of pecan under different N forms (Figure 6). In the leaves, the expression levels of CiNia2a, CiGln1.2, CiGln2b, CiFd-GOGATb, and CiNADH-GOGAT under T1 were significantly up-regulated (p< 0.05); the expression levels of CiNia2b, CiNiR1a, CiNiR1b, CiGln2a, CiFd-GOGATb, and CiGDHa under T4 were significantly up-regulated (p< 0.05); the expression levels of CiFd-GOGATa under T1, T4, and T5 were significantly up-regulated (p< 0.05); and the expression levels of CiGDHb under T1 and T4 were significantly up-regulated (p< 0.05). In the roots, the expression levels of CiNia2a, CiNia2b, CiNiR1a, CiNiR1b, CiGln2a, CiFd-GOGATb, CiNADH-GOGAT, and CiGDHa under T4 were significantly up-regulated (p< 0.05); the expression levels of CiGln1.2, CiGln2b, and CiFd-GOGATa under CK were significantly up-regulated (p< 0.05); and the expression levels of CiGDHb under T1 and T3 were significantly up-regulated (p< 0.05).
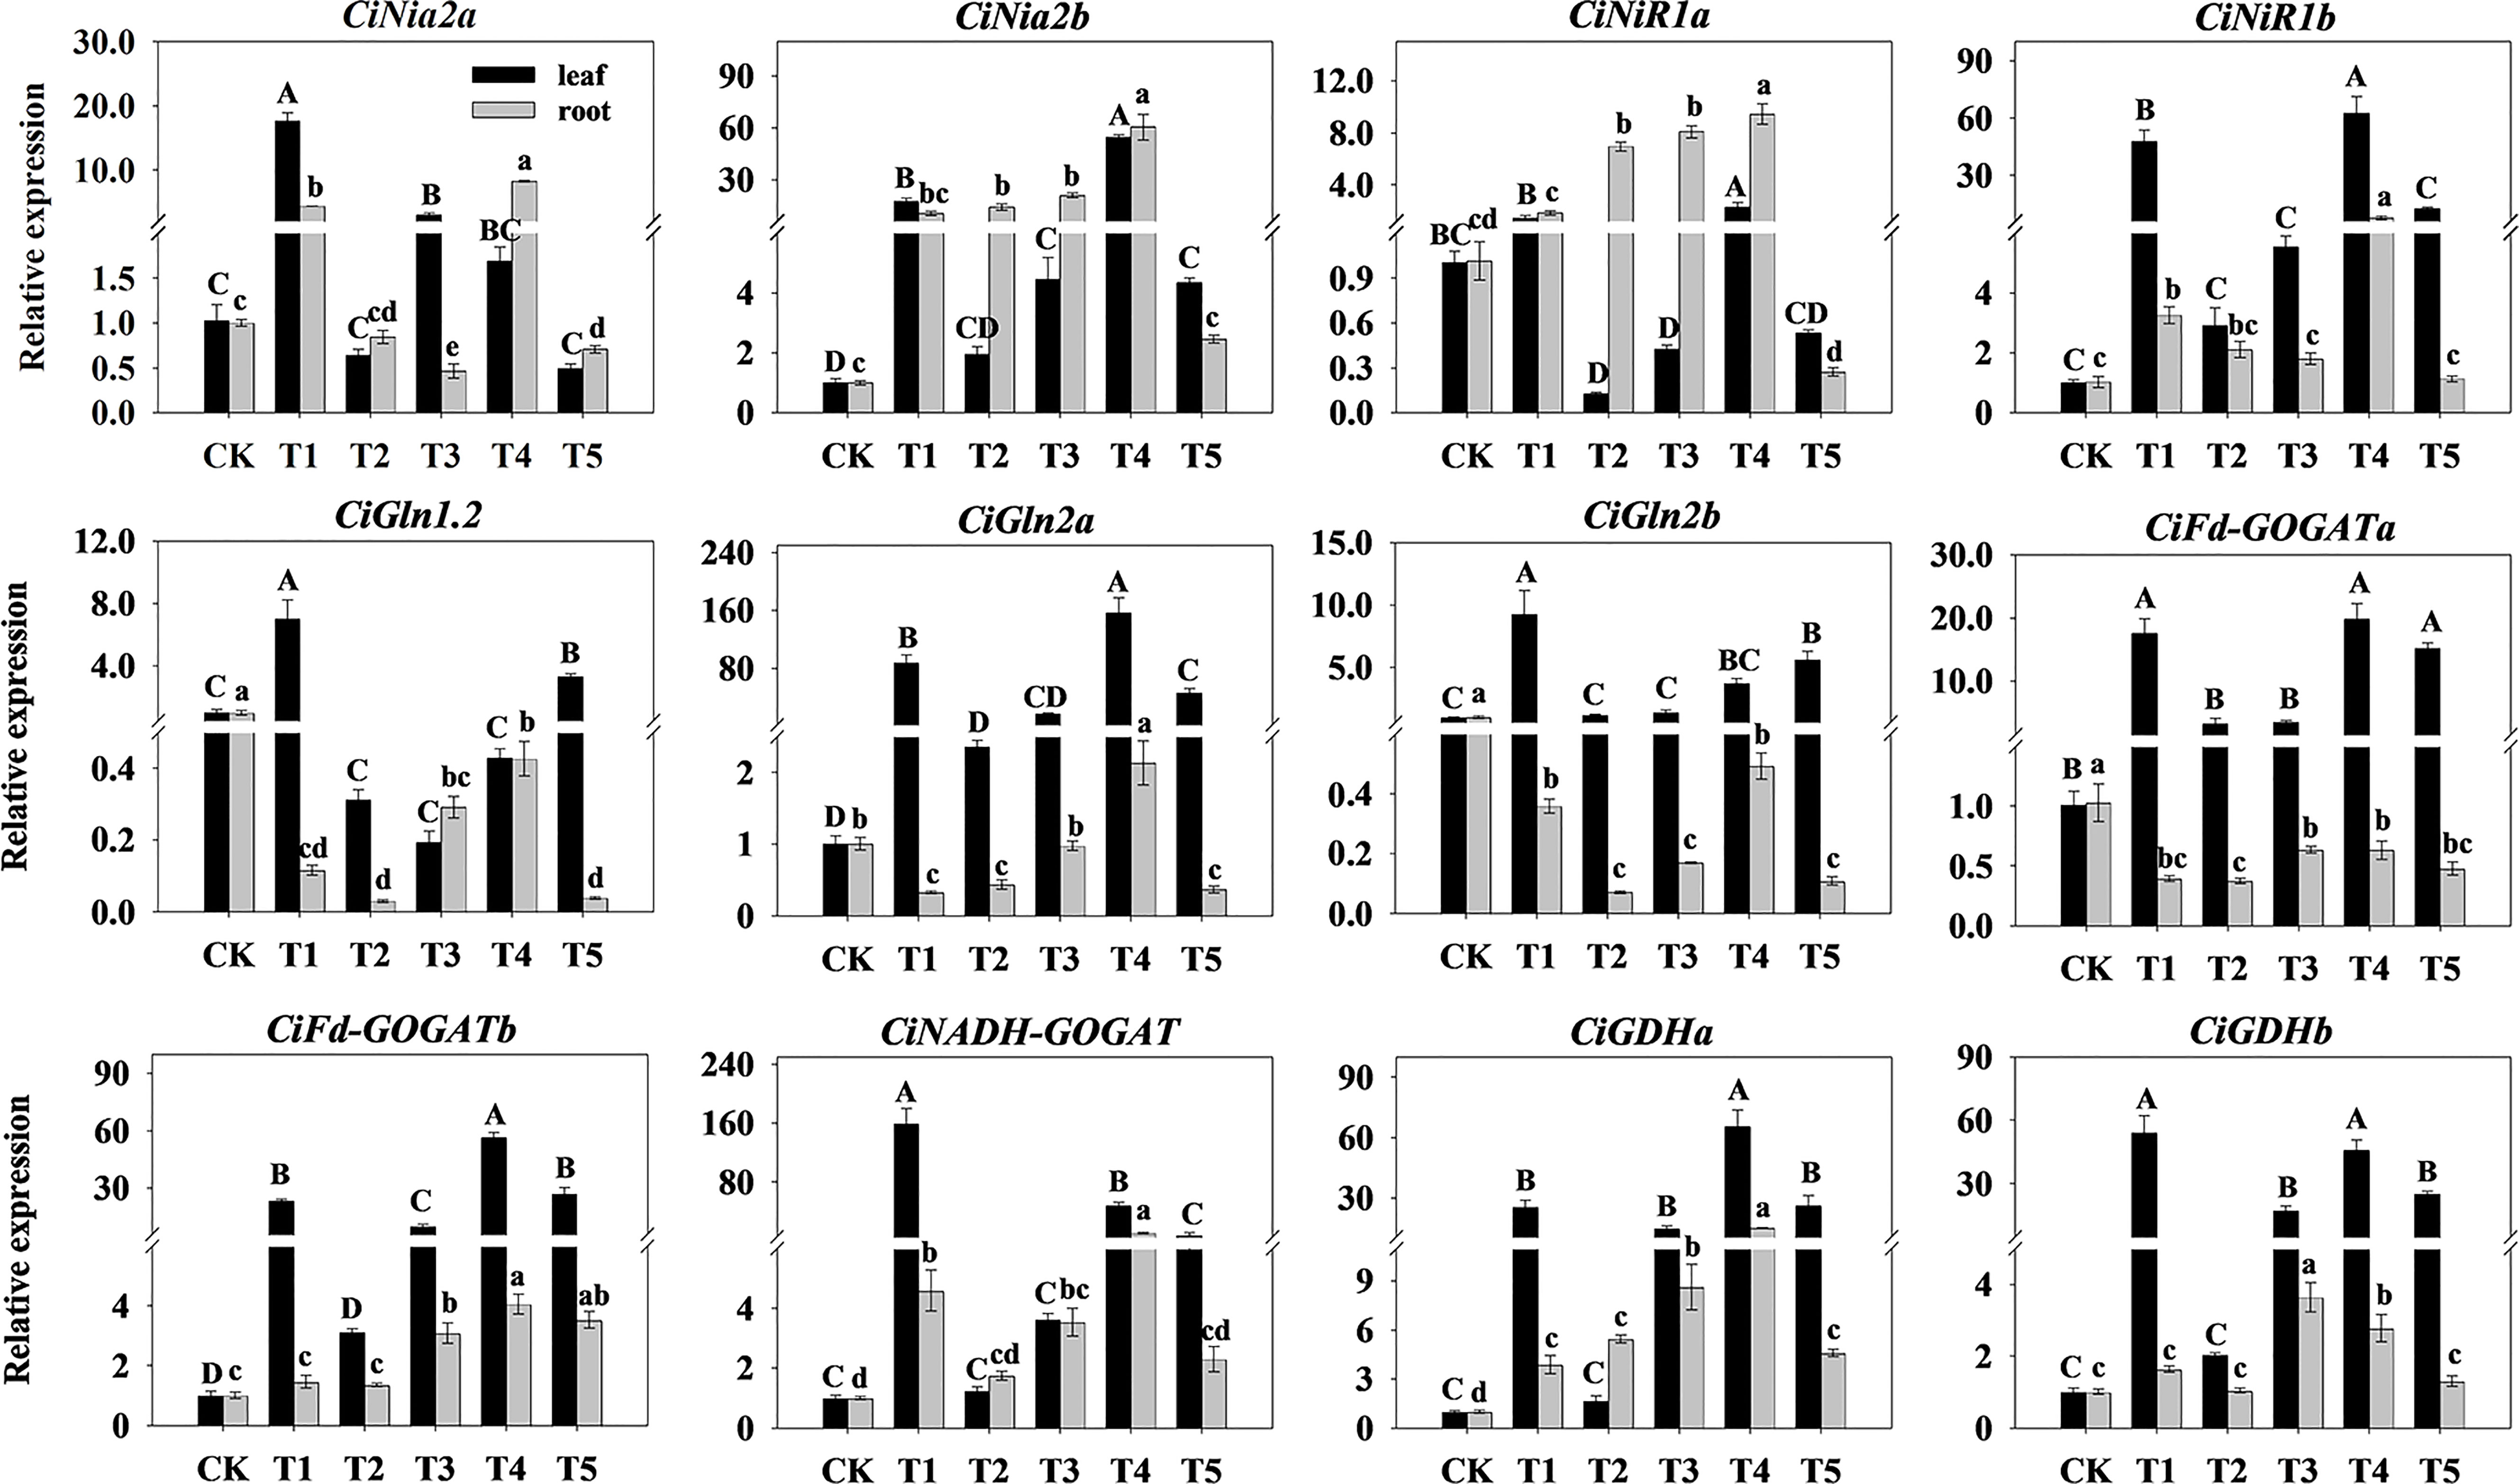
Figure 6 Relative expression of N assimilation-related enzymes genes in pecan under different N forms. The expression levels of CiNia, CiNiR, CiGln, CiGOGAT, and CiGDH genes in leaves and roots of pecan after varying : ratio treatments were quantified by qRT-PCR, with Actin as the reference gene. Different capital letters indicate significant differences in leaves (p< 0.05), and different lowercase letters indicate significant differences in roots (p< 0.05).
Correlation analysis showed that most of the N assimilate enzyme genes were positively correlated with growth and N assimilate enzymes in pecan (Figure 7). Leaf area was significantly positively correlated with CiNADH-GOGAT (p< 0.05). Root length was significantly positively correlated with CiNiR1b, CiFd-GOGATa, and CiGDHb (p< 0.05), and highly significantly positively correlated with CiGln2a, CiFd-GOGATb, and CiGDHa (p< 0.01). Root surface area was significantly positively correlated with CiNiR1b, CiGln2a, and CiGDHb (p< 0.05), and highly significantly positively correlated with CiGDHa and CiFd-GOGATb (p< 0.01). SRL was significantly positively correlated with CiNiR1b, CiGln2a, and CiGDHb (p< 0.05), and highly significantly positively correlated with CiFd-GOGATa, CiFd-GOGATb, and CiGDHa (p< 0.01). TN was significantly positively correlated with CiNiR1b, CiGln2a, and CiGDHb (p< 0.05), and extremely significantly positively correlated with CiFd-GOGATa, CiFd-GOGATb, and CiGDHa (p< 0.01). NR was highly significantly positively correlated with CiNiR1b, CiGln1.2, CiGln2a, CiGln2b, CiFd-GOGATa, CiFd-GOGATb, CiNADH-GOGAT, CiGDHa, and CiGDHb (p< 0.01). NiR was significantly positively correlated with CiNiR1b, CiFd-GOGATa, and CiGDHb (p< 0.05), and extremely significantly positively correlated with CiGln2a, CiFd-GOGATb, and CiGDHa (p< 0.01). GS was significantly positively correlated with CiGln2b (p< 0.05), and extremely significantly positively correlated with CiNiR1b, CiGln2a, CiFd-GOGATa, CiFd-GOGATb, CiNADH-GOGAT, CiGDHa, and CiGDHb (p< 0.01). Fd-GOGAT was significantly positively correlated with CiNiR1b, CiGln2a, and CiFd-GOGATa (p< 0.05), and highly significantly positively correlated with CiGDHa and CiFd-GOGATb (p< 0.01). GDH was significantly positively correlated with CiNiR1b, CiGln2a, and CiGDHb (p< 0.05), and highly significantly positively correlated with CiFd-GOGATa, CiFd-GOGATb, and CiGDHa (p< 0.01).
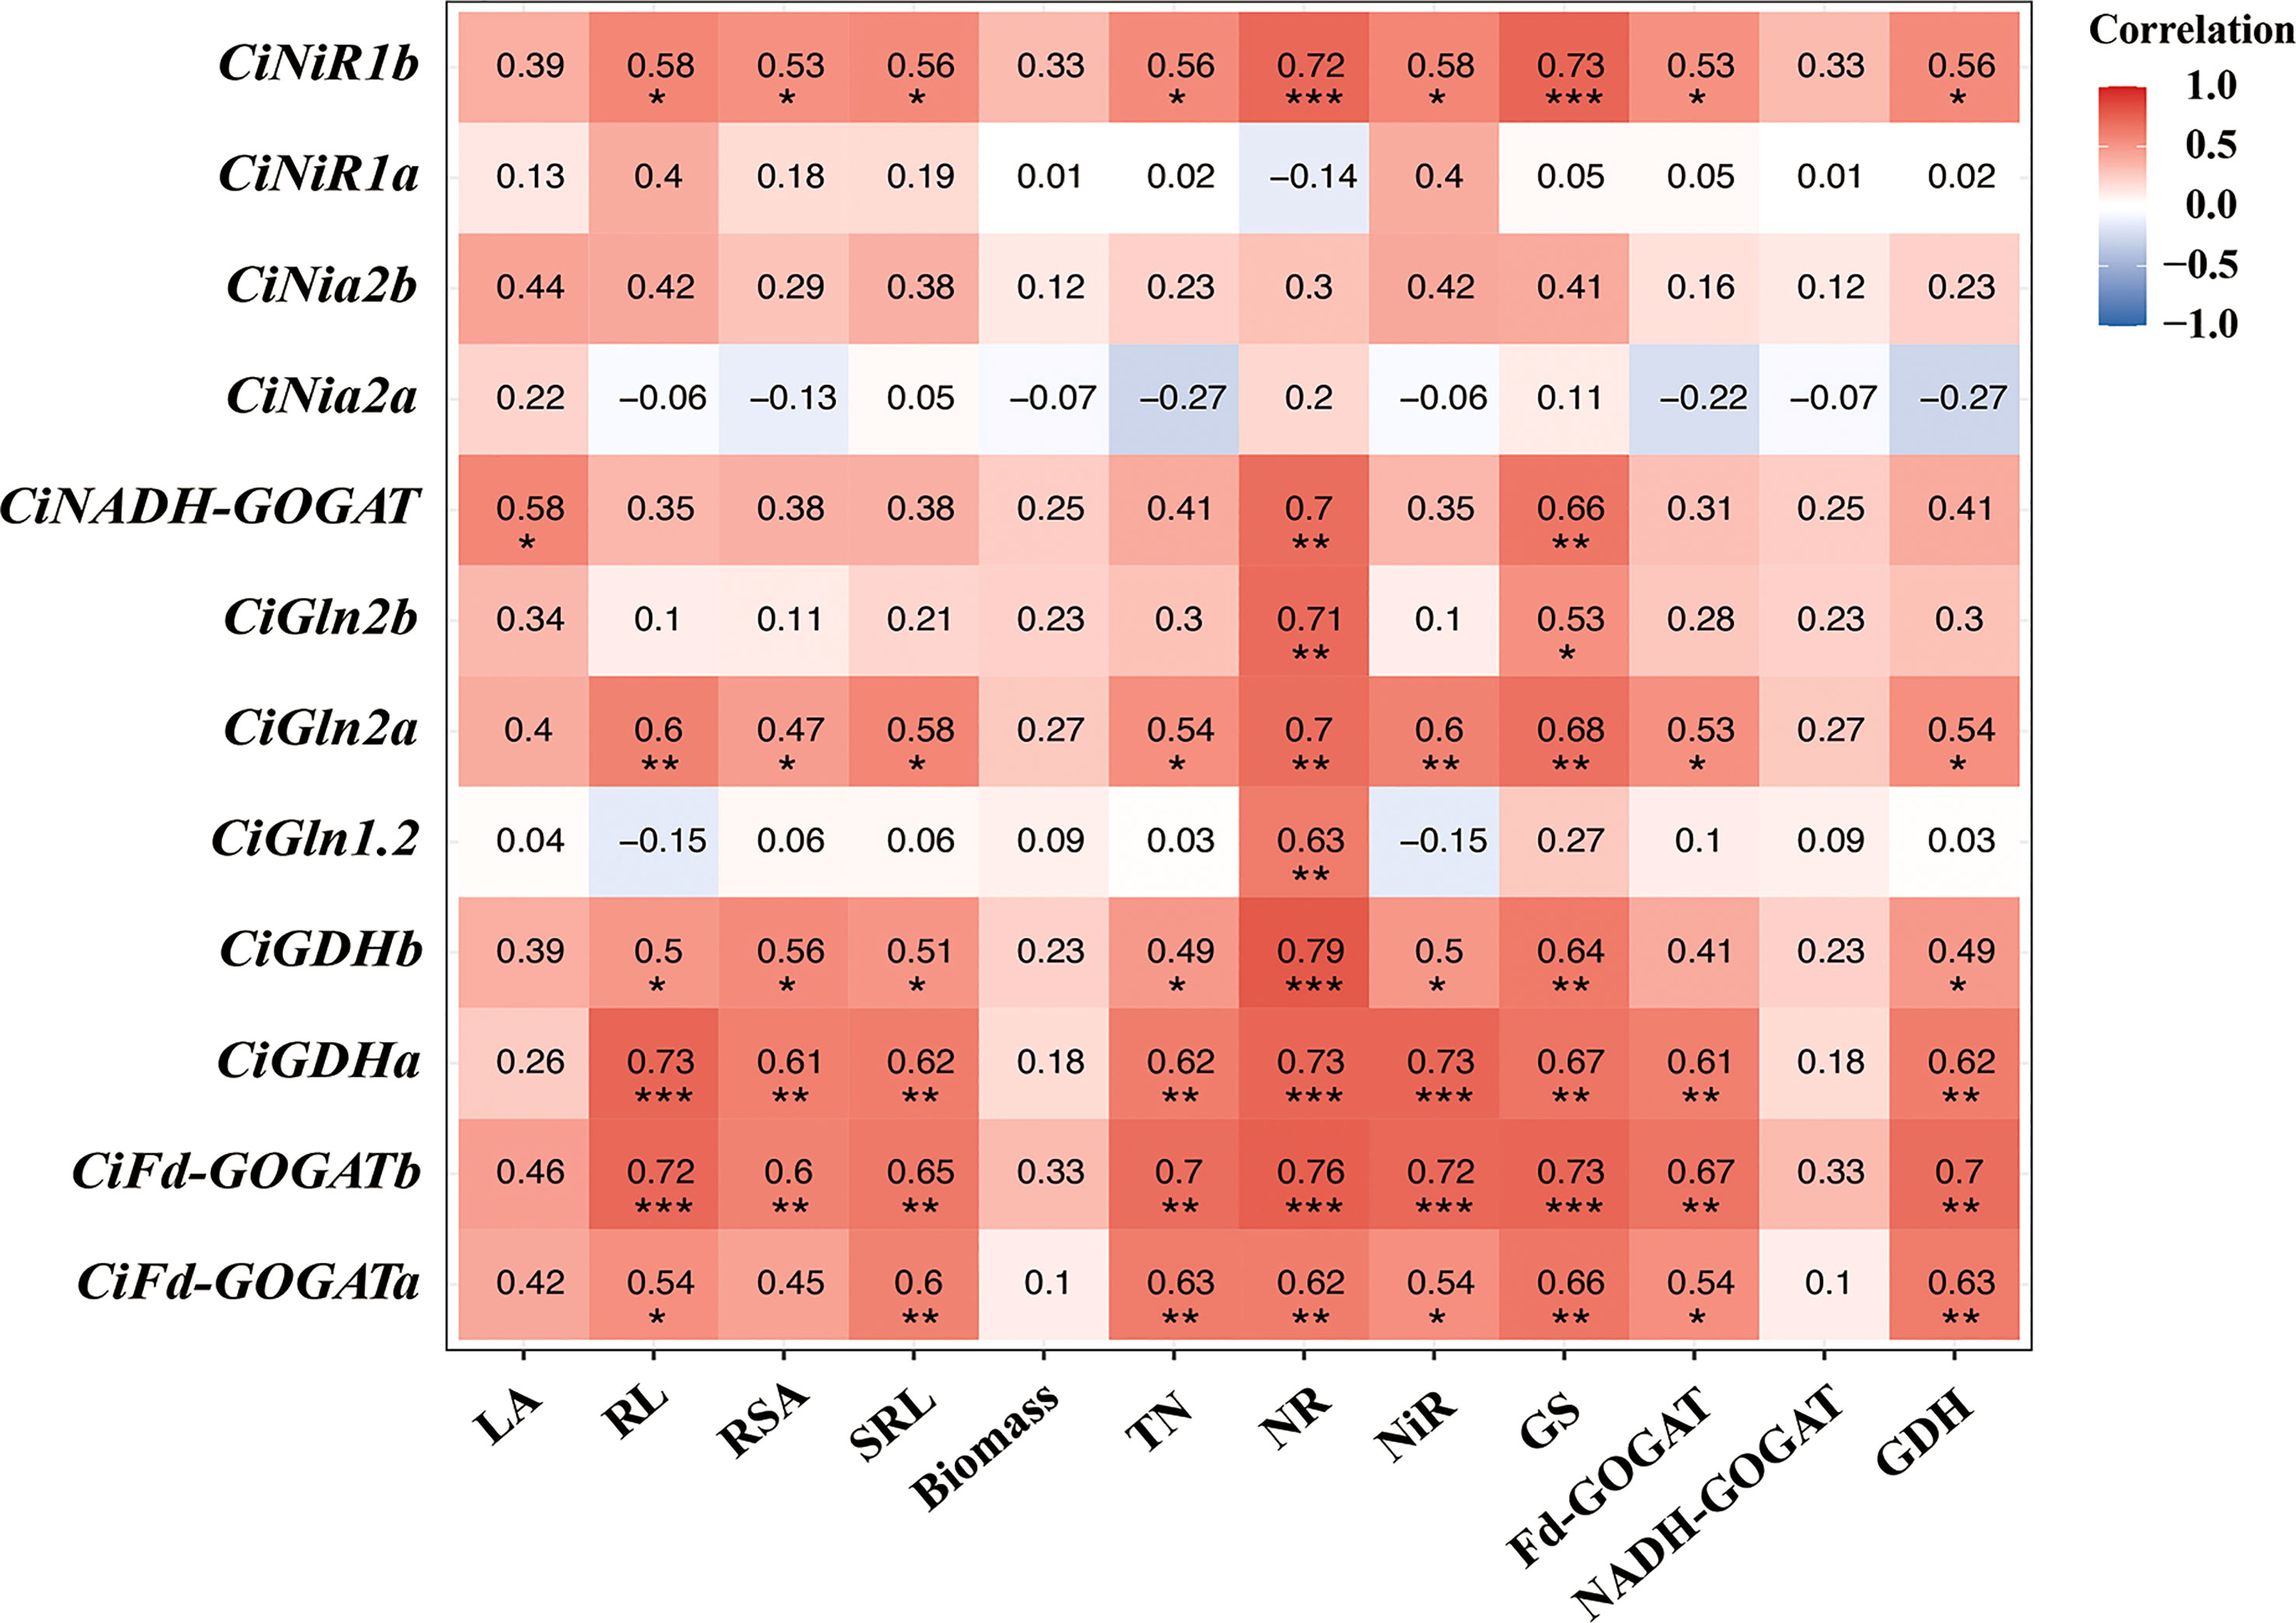
Figure 7 Correlation analysis of growth physiological indexes of pecan. *p< 0.05; **p< 0.01; ***p< 0.001. LA, Leaf area; RL, Root length; RSA, Root surface area; SRL, specific root length; TN, Total nitrogen; NR, Nitrate reductase; NiR, Nitrite reductase; GS, Glutamine synthetase; GOGAT, Glutamate synthase; GDH, Glutamate dehydrogenase.
The partial least squares path model (PLS-PM), which has been widely used to study complex multivariate relationships among variables (Latan and Noonan, 2017), was performed to infer potential direct and indirect effects of N assimilation genes, N assimilation enzymes, and nutrients factors on growth of pecan (Figure 8). The PLS-PM differs from the conventional covariance-based path analysis, and does not impose any distributional assumptions on the data which is usually difficult to meet. According to the results of PLS-PM analysis, plant nutrients had the main direct contribution to pecan growth, with TN, FAA, and TOC having the largest contribution to plant nutrients (contribution ratio > 0.8). N assimilation genes had a direct contribution to N assimilatory enzyme activity, with CiNiR1b, CiGln2a, CiGDHa, CiGDHb, CiFd-GOGATa, CiFd-GOGATb, and CiNADH-GOGAT contributing more to N assimilation genes (contribution ratio >0.8). In addition, N assimilating enzymes were positively regulating pecan growth and nutrients, with GS, Fd-GOGAT, and NADH-GOGAT contributing more to N assimilating enzymes (contribution ratio >0.8). The main effect analysis showed that N assimilating enzymes had the greatest total effect on pecan growth.
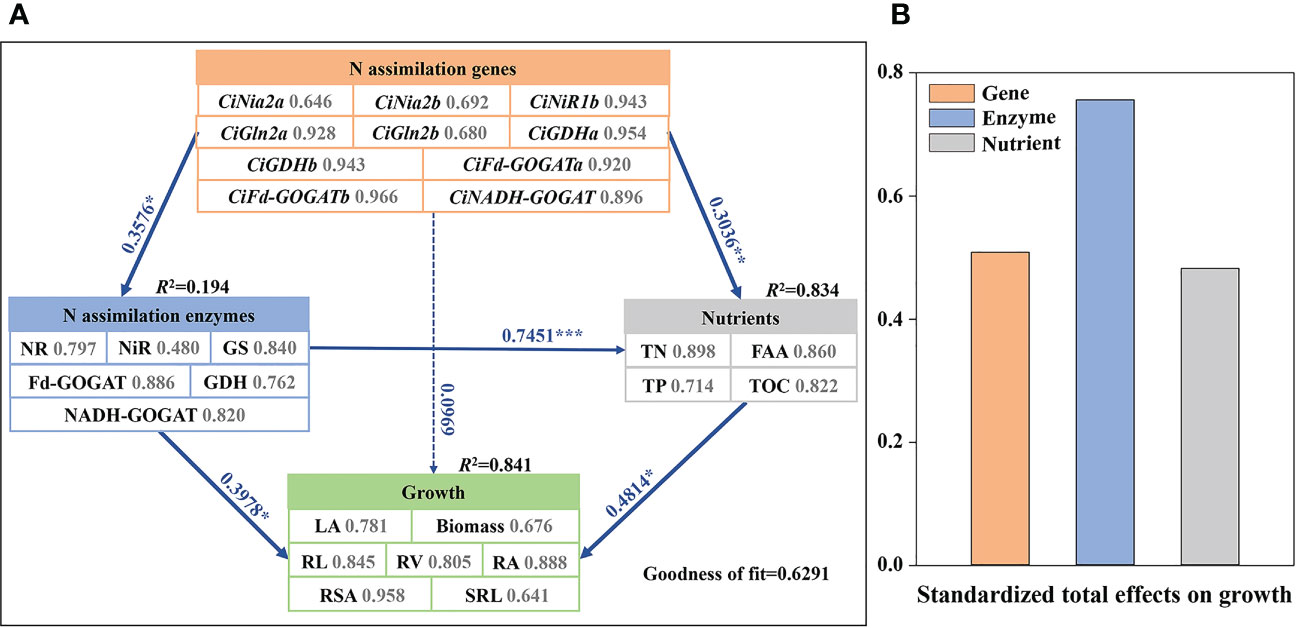
Figure 8 The partial least squares path models (A). The partial least squares path models showing the effects of N assimilation genes, N assimilation enzymes, and nutrients on growth in pecan. The blue and red lines indicate positive and negative effects, respectively. Numbers adjacent to each arrow denote partial correlation coefficients (significance codes: ***p< 0.001, **p< 0.01, *p< 0.05). The number next to each indicator represents the contribution of each predictor variable to the latent variable. R2 values display the proportion of variance explained for each factor. (B). The bar chart showing the standardized total effect of each factor on the growth composition in pecan. NR, Nitrate reductase; NiR, Nitrite reductase; GS, Glutamine synthetase; GOGAT, Glutamate synthase; GDH, Glutamate dehydrogenase; TN, Total nitrogen; TP, Total phosphorus; FAA, Free amino acid; TOC, Total organic carbon; LA, Leaf area; SRL, specific root length; RL, Root length; RSA, Root surface area; RV, Root volume; RA, Root activity.
In order to objectively evaluate the effects of the : treatments on the N assimilation, a principal component analysis was performed on 20 N assimilation traits, and the two principal components with the largest eigenvalues were obtained. The eigenvalues of the first and second principal components were 11.261 and 4.194, respectively. The cumulative contribution of the two principal components was 77.276% (Table 3), suggesting that the common factor can contain 77.276% of the original data information without losing variables. The factor loadings of the first and second principal components were performed on the X-axis and Y-axis, respectively (Figure 9). In the first principal component, the indexes with higher load (> 0.7) were TN, N uptake rate, CiNia2b, CiNiR1b, CiGln2a, CiFd-GOGATa, CiFd-GOGATb, CiGDH1a, CiGDH1b, NR, and Fd-GOGAT, indicating that the main factors determining the first principal component. In the second principal component, the indicators with larger load (> 0.7) were CiNia2a, CiGln1.2, CiGln2b, and CiNADH-GOGAT, which were the main factors determining the second principal component. We weighted the contribution of the principal components to calculate the combined scores under different : treatments, and then ranked (Table 4). The results showed that the comprehensive scores of the different treatments were T4 > T1 > T5 > T3 > T2 > CK. Except for T1 and T4 treatments, the scores of all other treatments were negative, indicating that T4 had a better promoting effect on the N assimilation of pecan seedlings than did the other treatments.

Table 3 The rate of eigenvalue, contribution, and cumulative contribution in principal components.
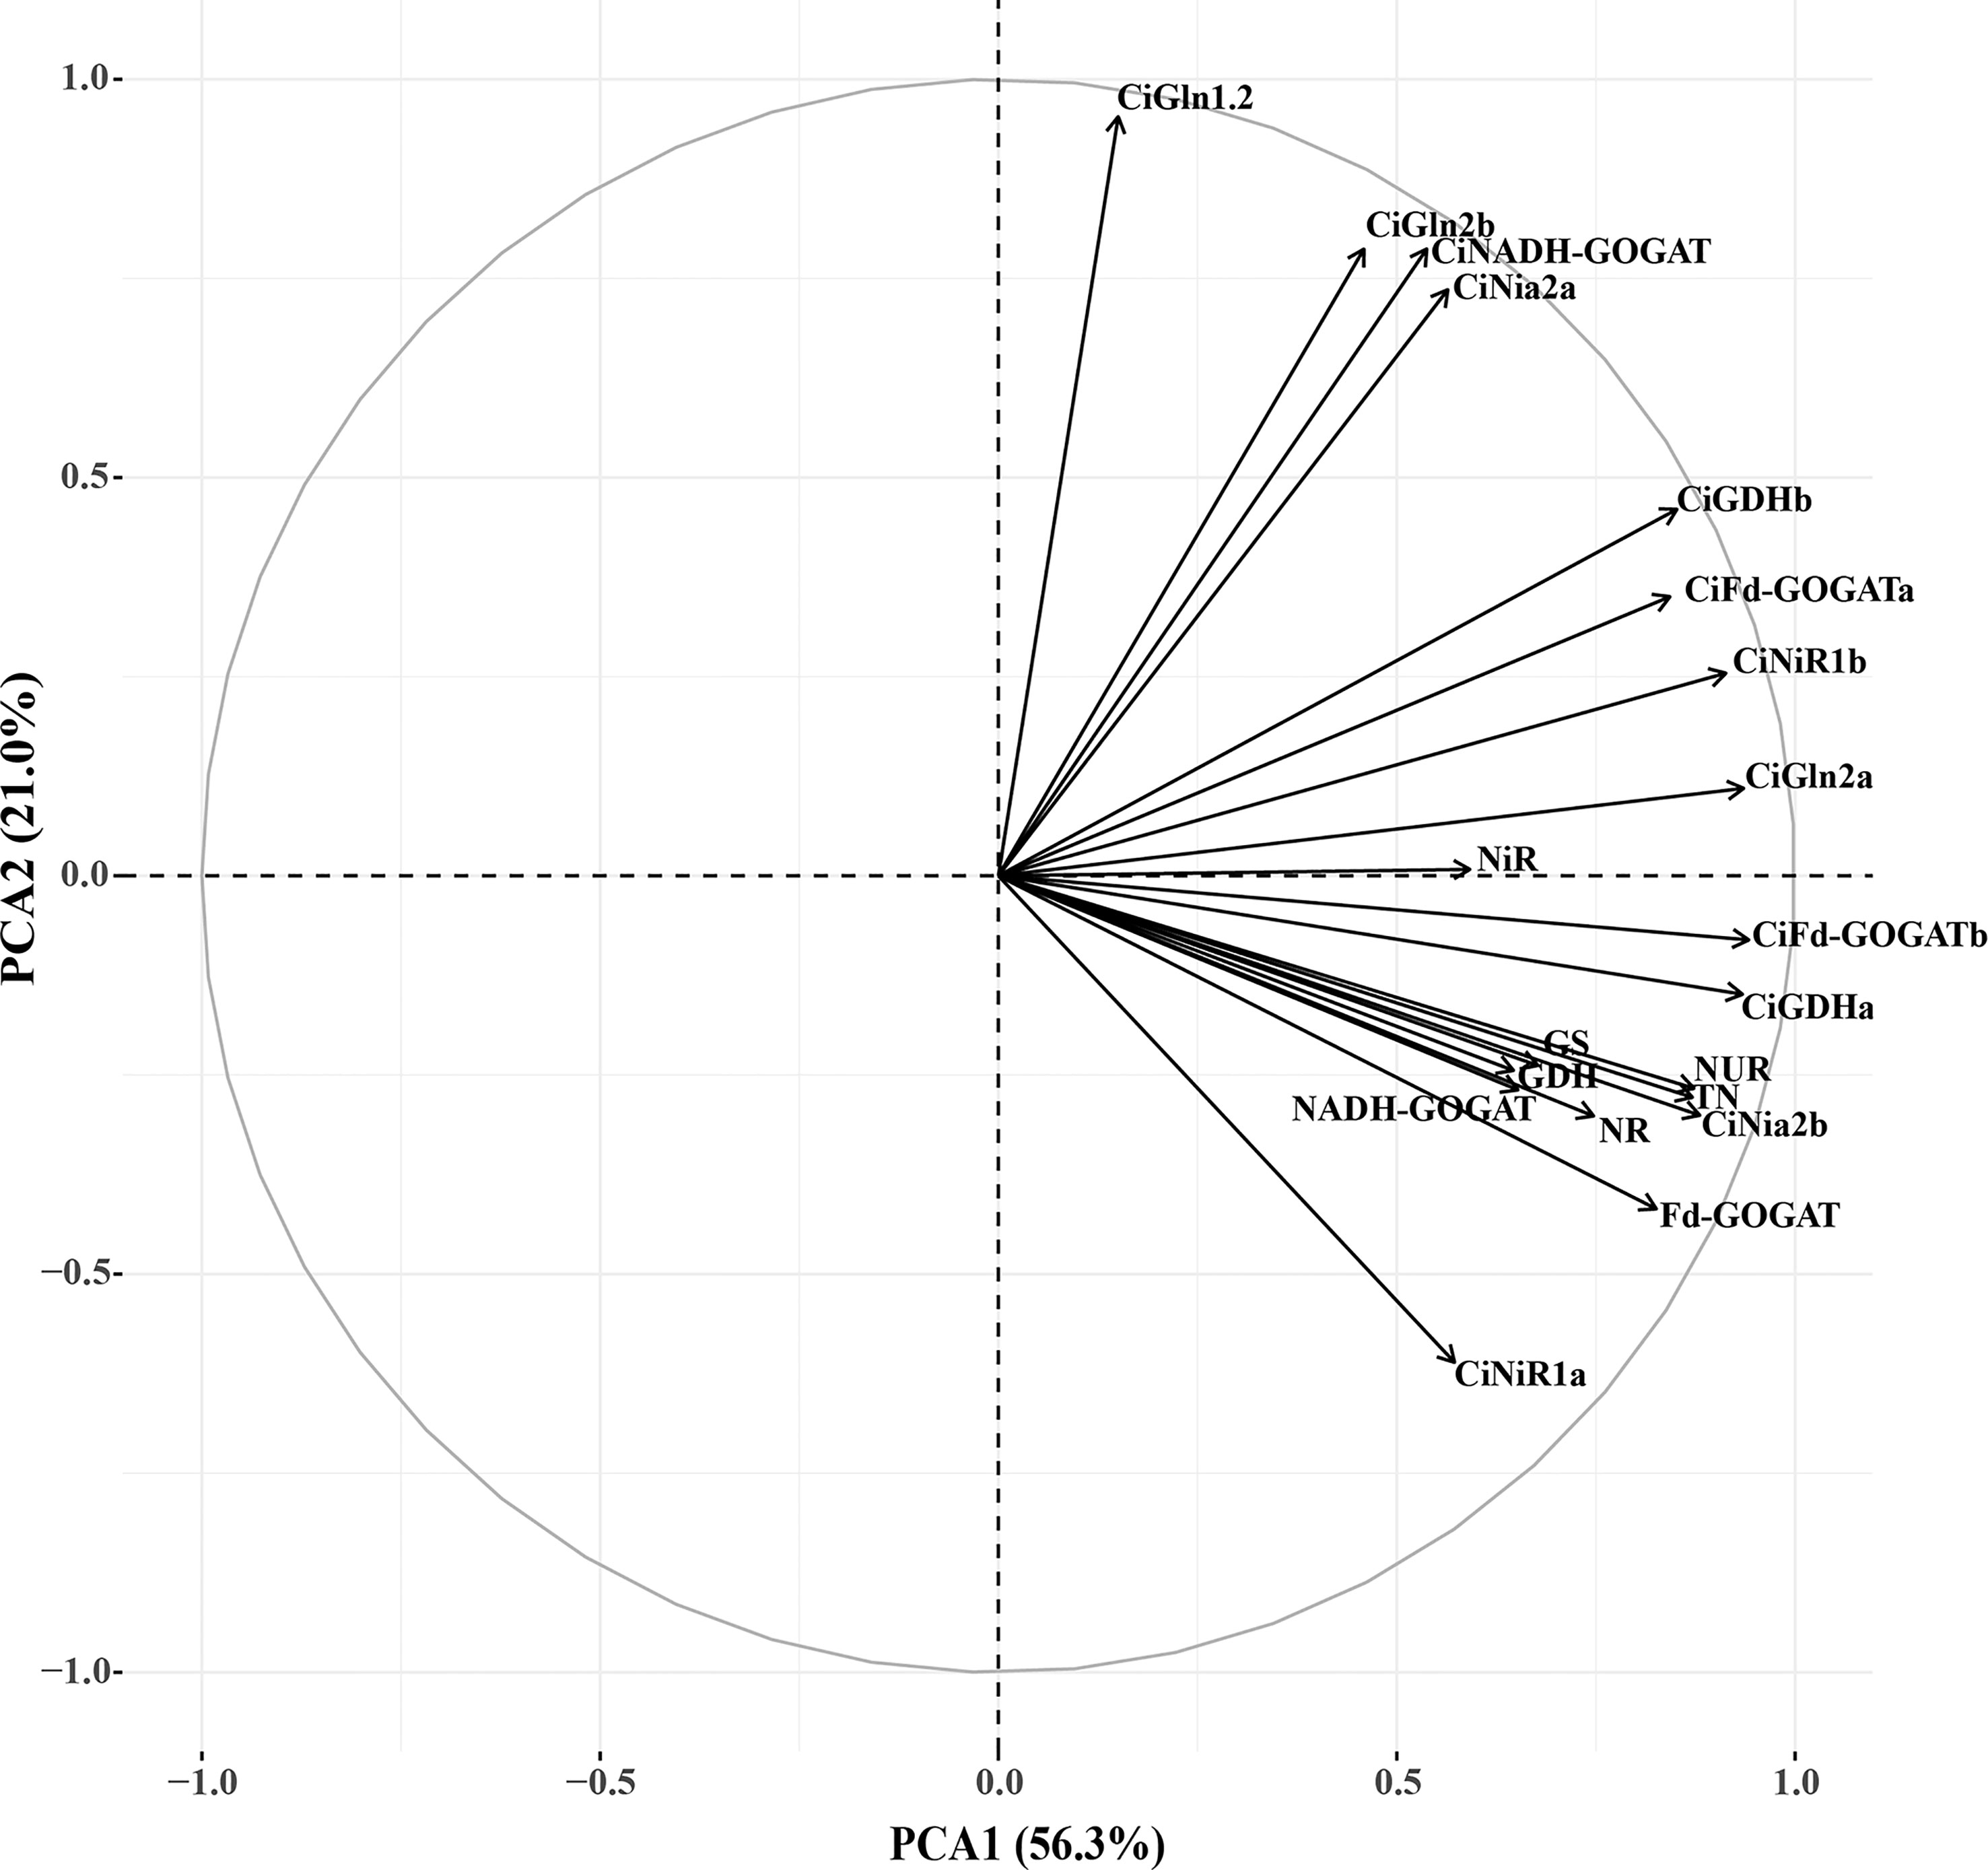
Figure 9 Factor loads of PCA. NUR, nitrogen uptake rate; NR, Nitrate reductase; NiR, Nitrite reductase; GS, Glutamine synthetase; GOGAT, Glutamate synthase; GDH, Glutamate dehydrogenase; TN, Total nitrogen.
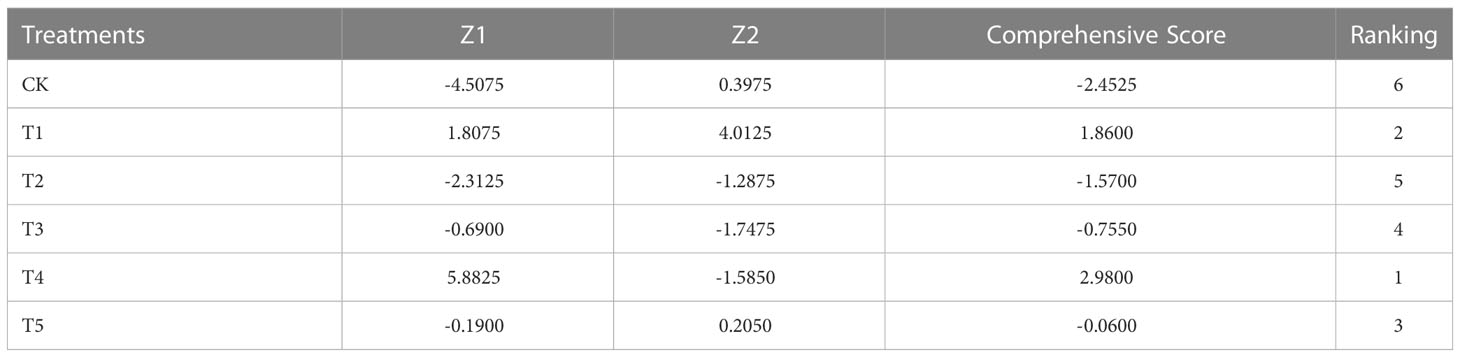
Table 4 Scores of NH4+:NO3– ratio treatments in the principal component and comprehensive evaluation.
The application of N fertilizer is an important way to improve the productivity of cash crops (Negrini et al., 2020). However, the effect of different forms of N fertilizer on plant growth is different (Nicodemus et al., 2008; Lang et al., 2018; Qin et al., 2020). We found that the ammonium-nitrate mixture promoted the growth and nutrient accumulation of pecan to different degree, Ammonia–Nitrate Mixture Dominated by –N had the best effect (Chen et al., 2021).
We found that T4 and T5 treatments significantly increased aboveground biomass and RGR by further study. However, Kim et al. (2002) found that biomass of pecan decreased instead when : ratio was 75:25, which might be caused by the different levels of N addition, and the high ammonium concentration could lead to plant toxicity. Both and addition treatments increased but didn’t have significant differences in the underground biomass of pecan compared to the N deficiency treatment, and a significant difference existed in root length, root area, root volume, SRL, and root activity of pecan. This suggests that the different : ratio treatments may only have a unilateral promotion effect on the horizontal or vertical growth of pecan roots. It has been suggested that promotes the emergence of lateral roots to establish a highly branched root system (Meier et al., 2020), which may be one of the reasons why the T4 and T5 treatments significantly increased the root area of pecan. The accumulation of FAAs is the result of biosynthesis and catabolism, and Yang et al. (2020) showed that both single addition of and ammonia-nitrate mixture significantly increased the total FAAs in tea (Camellia sinensis L.). The results of our study were generally agreed with them, as the T3, T4, and T5 treatments all significantly increased the FAA concentrations of pecan. Previous studies have suggested that N and P have interaction in plants, and the supply of N usually increases the efficiency of P acquisition and use by plants, which was consistent with our findings (Güsewell, 2004). In general, uptake by plants decreases rhizosphere pH, while weak acid conditions are more favorable for P absorption (Barrow, 2017), and our study also found that TP concentrations significantly increased under the condition of single addition of . In addition, TK concentrations in roots increased significantly when : ratio was 50:50, which was consistent with the findings of Wang and Below (1998). The growth and development of plants are highly dependent on the interaction between C and N metabolism. Plants need to absorb a large amount of N into the photosynthesis mechanism, and also need a large amount of fixed C to provide C skeleton as a receptor in the assimilation process of inorganic N (Krapp and Traong, 2006). N can promote photosynthesis to produce more carbon substrates (Coruzzi and Bush, 2001). This study found that different forms of N addition increased the TOC concentration of plants, but with the decrease of , the TOC concentration was higher, which may be due to the assimilation of consumes more ATP and C skeleton (Nunes-Nesi et al., 2010). According to the results of PLS-PM analysis, TN and TOC were critical factors for plant growth, and T4 treatment significantly increased the FAA concentrations, TOC concentrations, TN concentrations, and NUE of pecan, indicating that ammonium-nitrate mixture dominated by would be more beneficial to the growth of pecan, which was likewise confirmed by the results of principal component analysis.
N assimilation of plants is the process by which they absorb or to synthesize nitrogenous organic compounds such as amino acids and proteins. The main enzymes involved in the assimilation of are NR and NiR. In this study, both NR and NiR activities showed significantly greater in leaves than roots, which was attributed to the fact that most of the absorbed by the root would be transported to the shoot and reduced in the mesophyll cells (Liu et al., 2022). Nitrate is both a nutrient and a signal to initiate various processes that trigger the induction of assimilatory enzymes (Tischner and Kaiser, 2007). Therefore, NR and NiR activities in the leaves of pecan were significantly increased by a single addition of . It has been suggested that stimulates NR activity (Ivashikina and Sokolov, 1997), but a negative feedback effect of on the assimilation pathway has also been observed (Tischner, 2000), and the results of our study were the same as the former.
Regarding assimilation of plant, the role of the GS/GOGAT cycle has been generally accepted (Zhao and Shi, 2006), while it still continues to be argued that the GDH shunt is also important and that it may be expected to play a deamination role in the tissue where amino acids are converted to transport compounds with low C/N ratios (Kant et al., 2007). Only a limited fraction of N is transferred in the organs after entering the plant, and a large fraction is released as NH3 and reassimilated via GS (Miflin and Habash, 2002). It is generally believed that is mainly assimilated in roots (Ruan et al., 2016), and GS, GOGAT, and GDH activities all showed higher in leaves in this study, which may be due to differences in species and N supply levels (Feng et al., 2020), or it may be that assimilation genes were mainly expressed in leaves of pecan. Low concentrations of external and had a positive effect on GS and GOGAT activity (Miflin and Habash, 2002; Balotf et al., 2016), which was consistent with the results of our study. Studies have shown that GDH activity increases under various stress conditions (Srivastava and Singh, 1987). GDH activity was significantly increased when was added alone, which may be due to the role of GDH in relieving ammonium toxicity (Kant et al., 2007). Based on the results of the PLS-PM analysis, we suggested that pecan may enhance growth through increased N assimilation enzyme activity to accelerate and. metabolism. The activities of all five N assimilating enzymes of pecan were significantly increased under T4 treatment, further indicating that ammonium-nitrate mixture dominated by was more beneficial in promoting the growth of pecan.
The PLS-PM results indicate that the N assimilate enzyme genes can influence nutrient uptake in pecan by regulating N assimilate enzyme activity, which ultimately affects growth of pecan, so the expression level of the N assimilate genes could indirectly reflect the growth status of pecan. In the assimilation of , Nia2 was responsible for 90% of the total NR activity in seedlings, whereas Nia1 accounts for the remaining 10% (Yu et al., 1998). Previous studies suggested that is a signal for assimilation genes (Wang et al., 2004), and it can up-regulate the expression of Nia and NiR genes (Loppes et al., 1999; Konishi and Yanagisawa, 2010), which was consistent with the results of our study, where the expression levels of pecan CiNia2a, CiNia2b, and CiNiR1b were significantly up-regulated under single application of . Loppes et al. (1999) also found that down-regulated the expression level of Nia genes, but Kim et al. (2016) suggested that up-regulated the expression level of nia2, and our study were consistent with the former, with CiNia2a, CiNia2b, and CiNiR1b expression levels significantly down-regulated under single application of . The response of critical assimilation genes to may be independent of reduction (Wang et al., 2004), and our study found no significant correlation between CiNia2a and NR, perhaps as Nia2 gene was also involved in the regulation of chlorate resistance (Wilkinson and Crawford, 1991). Loqué et al. (2003) also showed that the AtNIA2 gene was overexpressed in the roots of NR-deficient mutants.
In the Arabidopsis genome, one Gln2 gene and five Gln1 genes are encoded (Taira et al., 2004). Gln1;2 is essential for N assimilation and ammonia detoxification, and gln1;2 mutants exhibit lower GS activity (Lothier et al., 2011). Under high treatment, the expression level of AtGln1;2 in shoots was up-regulated, the expression level of AtGln1;1, AtGln1;4, and AtGln1;5 was down-regulated, and the expression level of AtGln1;3 was unchanged (Guan et al., 2016). The expression pattern of CiGln1.2 was similar to that of AtGln1;2, and the expression level of CiGln1.2 in leaves was significantly up-regulated by single treatment with , indicating that CiGln1.2 also has an important role in assimilation and ammonium detoxification in pecan leaves. Wang et al. (2021) found that Gln2 was up-regulated in shoots when was the only N source, which was consistent with the results of our study. However, recent studies have shown that gln2 mutants do not exhibit an abnormal phenotype and that the isozyme encoded by the GS1 genes, may mask the gln2 mutation in Arabidopsis shoots (Lee et al., 2022). In case of assimilation genes, is also a direct signal (Wang et al., 2004), and CiGlns were significantly up-regulated in leaves of pecan under T1 treatment. Additionally, CiGln2s were highly expressed in the leaves but very low levels in the roots, which agreed with the study of Guan et al. (2016).
GOGAT is mostly found in the plasmid, and Fd-GOGAT accounts for 96% of the total GOGAT activity (Bi et al., 2017). Studies have shown that the Fd-GOGAT gene acts primarily in leaves, while the NADH-GOGAT gene contributes more to root assimilation (Konishi et al., 2014), which was also confirmed in poplar (Populus L.) (Cao et al., 2023). However, this was not entirely accordance with the results of our study, where CiFd-GOGATs were expressed at higher levels in leaves except for CK treatment, whereas CiNADH-GOGAT was expressed at higher levels in roots under CK, T2, and T3 treatments, which may be due to differences in species and N levels. (Balotf et al., 2016) found that high concentrations of and could increase the expression level of GOGAT genes, sand the transcript level of GOGAT genes decreased under N-deficient conditions. This was the same with our findings that the expression level of pecan GOGAT gene was significantly up-regulated in leaves under the addition of or alone, while CiFd-GOGATb and CiNADH-GOGAT were significantly down-regulated under CK treatment except for CiFd-GOGATa. Importantly, T4 treatment significantly up-regulated the pecan GOGAT gene, indicating that the addition of ammonium-nitrate mixtures dominated by was more favorable for pecan assimilation.
In the model plant Arabidopsis, besides the GS/GOGAT cycle, GDH has a complementary role in N assimilation under specific physiological conditions of high concentrations (Glevarec et al., 2004). In this study, we found that not only T5 treatment up-regulated the expression level of CiGDHs in pecan leaves, but also T1, T3, and T4 treatments, suggesting that the expression level of CiGDHs can also be regulated by . Although the expression patterns of CiGDHa and CiGDHb were almost identical under different N form treatments, GDH was highly significantly positively correlated with CiGDHa, implying that CiGDHa may play a more important role in pecan assimilation.
We analyzed the effects of different N form treatments on the growth, nutrient uptake, and N assimilation of pecan, and found that was more beneficial to promote the growth, N uptake and assimilation of pecan, and the ammonium-nitrate mixture dominated by had the best effect. The results of PLS-PM analysis also indicated that N uptake and assimilation would directly affect the growth of pecan. Furthermore, correlation analysis showed that N assimilate enzyme activity did not necessarily correlate positively with N assimilate gene expression level, partly because N assimilate enzymes are not only regulated by N assimilate genes, and partly because some N assimilate genes have other functions than regulating N assimilate enzymes. Therefore, we believe that the N assimilation ability of plants should not be judged only by N assimilation genes in future studies, which should be confirmed by a comprehensive analysis of N concentration, N assimilation enzymes, and related genes. The study provides a basis for further identification of the functions of N assimilation genes in the N assimilation process of pecan, and also provides a theoretical support for improving the yield of pecan by improving NUE, and promoting the scale development of pecan.
The original contributions presented in the study are included in the article/Supplementary Material. Further inquiries can be directed to the corresponding author.
FP conceived and designed the study. MC collected experimental data, analyzed, and wrote the manuscript. MC and JL participated in the collection of samples. MC, ZQ, and JX performed the experiments. PT and KZ provided help in data analysis and in improving the manuscript. All authors contributed to the article and approved the submitted version.
This research was funded by the Central Financial Forestry Science and Technology Extension Demonstration Funds Program (Su (2022) TG04) and a grant from the National Key R&D Program of China (2021YFD1000403).
The authors declare that the research was conducted in the absence of any commercial or financial relationships that could be construed as a potential conflict of interest.
All claims expressed in this article are solely those of the authors and do not necessarily represent those of their affiliated organizations, or those of the publisher, the editors and the reviewers. Any product that may be evaluated in this article, or claim that may be made by its manufacturer, is not guaranteed or endorsed by the publisher.
The Supplementary Material for this article can be found online at: https://www.frontiersin.org/articles/10.3389/fpls.2023.1186818/full#supplementary-material
Supplementary Figure 1 | Melt curves of 12 selected genes.
Balotf, S., Kavoosi, G., Kholdebarin, B. (2016). Nitrate reductase, nitrite reductase, glutamine synthetase, and glutamate synthase expression and activity in response to different nitrogen sources in nitrogen-starved wheat seedlings. Biotechnol. Appl. Biochem. 63, 220–229. doi: 10.1002/bab.1362
Barrow, N. J. (2017). The effects of pH on phosphate uptake from the soil. Plant Soil 410, 401–410. doi: 10.1007/s11104-016-3008-9
Bernhard, W. R., Matile, P. (1994). Differential expression of glutamine synthetase genes during the senescence of arabidopsis thaliana rosette leaves. Plant Sci. 98, 7–14. doi: 10.1016/0168-9452(94)90142-2
Bi, Z., Zhang, Y., Wu, W., Zhan, X., Yu, N., Xu, T., et al. (2017). ES7, encoding a ferredoxin-dependent glutamate synthase, functions in nitrogen metabolism and impacts leaf senescence in rice. Plant Sci. 259, 24–34. doi: 10.1016/j.plantsci.2017.03.003
Bloom, A. J. (2015). Photorespiration and nitrate assimilation: a major intersection between plant carbon and nitrogen. Photosynth Res. 123, 117–128. doi: 10.1007/s11120-014-0056-y
Cao, L., Xu, C., Sun, Y., Niu, C., Leng, X., Hao, B., et al. (2023). Genome-wide identification of glutamate synthase gene family and expression patterns analysis in response to carbon and nitrogen treatment in populus. Gene 851, 146996. doi: 10.1016/j.gene.2022.146996
Chen, M., Zhu, K., Tan, P., Liu, J., Xie, J., Yao, X., et al. (2021). Ammonia–nitrate mixture dominated by NH4+–N promoted growth, photosynthesis and nutrient accumulation in Pecan (Carya illinoinensis). Forests 12, 1808. doi: 10.3390/f12121808
Coruzzi, G., Bush, D. R. (2001). Nitrogen and carbon nutrient and metabolite signaling in plants. Plant Physiol. 125, 61–64. doi: 10.1104/pp.125.1.61
Coschigano, K. T., Melo-Oliveira, R., Lim, J., Coruzzi, G. M. (1998). Arabidopsis gls mutants and distinct fd-GOGAT genes. implications for photorespiration and primary nitrogen assimilation. Plant Cell 10, 741–752. doi: 10.1105/tpc.10.5.741
Edwards, J. W., Coruzzi, G. M. (1989). Photorespiration and light act in concert to regulate the expression of the nuclear gene for chloroplast glutamine synthetase. Plant Cell 1, 241–248. doi: 10.1105/tpc.1.2.241
Egenolf, K., Verma, S., Schöne, J., Klaiber, I., Arango, J., Cadisch, G., et al. (2021). Rhizosphere pH and cation-anion balance determine the exudation of nitrification inhibitor 3-epi-brachialactone suggesting release via secondary transport. Physiologia Plantarum 172, 116–123. doi: 10.1111/ppl.13300
Feng, H., Fan, X., Miller, A., xu, G. (2020). Plant nitrogen uptake and assimilation: regulation of cellular pH homeostasis. J. Exp. Bot. 71 (15), 4380–4392. doi: 10.1093/jxb/eraa150
Glevarec, G., Bouton, S., Jaspard, E., Riou, M.-T., Cliquet, J.-B., Suzuki, A., et al. (2004). Respective roles of the glutamine synthetase/glutamate synthase cycle and glutamate dehydrogenase in ammonium and amino acid metabolism during germination and post-germinative growth in the model legume medicago truncatula. Planta 219, 286–297. doi: 10.1007/s00425-004-1214-9
Guan, M., de Bang, T. C., Pedersen, C., Schjoerring, J. K. (2016). Cytosolic glutamine synthetase Gln1;2 is the main isozyme contributing to GS1 activity and can be up-regulated to relieve ammonium toxicity. Plant Physiol. 171, 1921–1933. doi: 10.1104/pp.16.01195
Guo, Y., Cai, Z., Gan, S. (2004). Transcriptome of arabidopsis leaf senescence. Plant Cell Environ. 27, 521–549. doi: 10.1111/j.1365-3040.2003.01158.x
Guo, Y., Chen, Y., Searchinger, T. D., Zhou, M., Pan, D., Yang, J., et al. (2020). Air quality, nitrogen use efficiency and food security in China are improved by cost-effective agricultural nitrogen management. Nat. Food 1, 648–658. doi: 10.1038/s43016-020-00162-z
Guo, J., Jia, Y., Chen, H., Zhang, L., Yang, J., Zhang, J., et al. (2019). Growth, photosynthesis, and nutrient uptake in wheat are affected by differences in nitrogen levels and forms and potassium supply. Sci. Rep. 9, 1248. doi: 10.1038/s41598-018-37838-3
Güsewell, S. (2004). N : p ratios in terrestrial plants: variation and functional significance. New Phytol. 164, 243–266. doi: 10.1111/j.1469-8137.2004.01192.x
Harris, N., Foster, J. M., Kumar, A., Davies, H. V., Gebhardt, C., Wray, J. L. (2000). Two cDNAs representing alleles of the nitrate reductase gene of potato (Solanum tuberosum l. cv. desirée): sequence analysis, genomic organization and expression1. J. Exp. Bot. 51, 1017–1026. doi: 10.1093/jexbot/51.347.1017
Ivashikina, N. V., Sokolov, O. A. (1997). Regulation of nitrate uptake and distribution in maize seedlings by nitrate, nitrite, ammonium and glutamate. Plant Sci. 123, 29–37. doi: 10.1016/S0168-9452(96)04566-9
Kant, S., Kant, P., Lips, H., Barak, S. (2007). Partial substitution of NO3– by NH4+ fertilization increases ammonium assimilating enzyme activities and reduces the deleterious effects of salinity on the growth of barley. J. Plant Physiol. 164, 303–311. doi: 10.1016/j.jplph.2005.12.011
Kim, J. Y., Kwon, Y. J., Kim, S.-I., Kim, D. Y., Song, J. T., Seo, H. S. (2016). Ammonium inhibits chromomethylase 3-mediated methylation of the Arabidopsis nitrate reductase gene NIA2. Front. Plant Sci. 6. doi: 10.3389/fpls.2015.01161
Kim, T., Mills, H. A., Wetzstein, H. Y. (2002). Studies on effects of nitrogen form on growth, development, and nutrient uptake in pecan. J. Plant Nutr. 25, 497–508. doi: 10.1081/PLN-120003378
Konishi, N., Ishiyama, K., Matsuoka, K., Maru, I., Hayakawa, T., Yamaya, T., et al. (2014). NADH-dependent glutamate synthase plays a crucial role in assimilating ammonium in the Arabidopsis root. Physiologia Plantarum 152, 138–151. doi: 10.1111/ppl.12177
Konishi, M., Yanagisawa, S. (2010). Identification of a nitrate-responsive cis-element in the Arabidopsis NIR1 promoter defines the presence of multiple cis-regulatory elements for nitrogen response. Plant J. 63, 269–282. doi: 10.1111/j.1365-313X.2010.04239.x
Krapp, A. (2015). Plant nitrogen assimilation and its regulation: a complex puzzle with missing pieces. Curr. Opin. Plant Biol. 25, 115–122. doi: 10.1016/j.pbi.2015.05.010
Krapp, A., Traong, H.-N. (2006). Regulation of C/N interaction in model plant species. J. Crop Improvement 15, 127–173. doi: 10.1300/J411v15n02_05
Lancien, M., Martin, M., Hsieh, M.-H., Leustek, T., Goodman, H., Coruzzi, G. M. (2002). Arabidopsis glt1-T mutant defines a role for NADH-GOGAT in the non-photorespiratory ammonium assimilatory pathway. Plant J. 29, 347–358. doi: 10.1046/j.1365-313x.2002.01218.x
Lang, C. P., Merkt, N., Zörb, C. (2018). Different nitrogen (N) forms affect responses to n form and n supply of rootstocks and grafted grapevines. Plant Sci. 277, 311–321. doi: 10.1016/j.plantsci.2018.10.004
Latan, H., Noonan, R. (2017). Partial least squares path modeling (Cham: Springer International Publishing). doi: 10.1007/978-3-319-64069-3
Lee, K.-T., Chung, Y.-H., Hsieh, M.-H. (2022). The Arabidopsis glutamine synthetase2 mutants (gln2-1 and gln2-2) do not have abnormal phenotypes. Plant Physiol. 189, 1906–1910. doi: 10.1093/plphys/kiac224
Li, H., Hu, B., Chu, C. (2017). Nitrogen use efficiency in crops: lessons from arabidopsis and rice. J. Exp. Bot. 68, 2477–2488. doi: 10.1093/jxb/erx101
Liu, X., Hu, B., Chu, C. (2022). Nitrogen assimilation in plants: current status and future prospects. J. Genet. Genomics 49, 394–404. doi: 10.1016/j.jgg.2021.12.006
Livak, K. J., Schmittgen, T. D. (2001). Analysis of relative gene expression data using real-time quantitative PCR and the 2–ΔΔCT method. Methods 25, 402–408. doi: 10.1006/meth.2001.1262
Loppes, R., Radoux, M., Ohresser, M. C. P., Matagne, R. F. (1999). Transcriptional regulation of the Nia1 gene encoding nitrate reductase in chlamydomonas reinhardtii: effects of various environmental factors on the expression of a reporter gene under the control of the Nia1 promoter. Plant Mol. Biol. 41, 701–711. doi: 10.1023/A:1006381527119
Loqué, D., Tillard, P., Gojon, A., Lepetit, M. (2003). Gene expression of the NO3– transporter NRT1.1 and the nitrate reductase NIA1 is repressed in Arabidopsis roots by NO2–, the product of NO3– reduction. Plant Physiol. 132, 958–967. doi: 10.1104/pp.102.018523
Lothier, J., Gaufichon, L., Sormani, R., Lemaître, T., Azzopardi, M., Morin, H., et al. (2011). The cytosolic glutamine synthetase GLN1;2 plays a role in the control of plant growth and ammonium homeostasis in Arabidopsis rosettes when nitrate supply is not limiting. J. Exp. Bot. 62, 1375–1390. doi: 10.1093/jxb/erq299
Lu, J., Hu, T., Zhang, B., Wang, L., Yang, S., Fan, J., et al. (2021). Nitrogen fertilizer management effects on soil nitrate leaching, grain yield and economic benefit of summer maize in Northwest China. Agric. Water Manage. 247, 106739. doi: 10.1016/j.agwat.2021.106739
Meier, M., Liu, Y., Lay-Pruitt, K. S., Takahashi, H., von Wirén, N. (2020). Auxin-mediated root branching is determined by the form of available nitrogen. Nat. Plants 6, 1136–1145. doi: 10.1038/s41477-020-00756-2
Miflin, B. J., Habash, D. Z. (2002). The role of glutamine synthetase and glutamate dehydrogenase in nitrogen assimilation and possibilities for improvement in the nitrogen utilization of crops. J. Exp. Bot. 53, 979–987. doi: 10.1093/jexbot/53.370.979
M’rah Helali, S., Nebli, H., Kaddour, R., Mahmoudi, H., Lachaâl, M., Ouerghi, Z. (2010). Influence of nitrate–ammonium ratio on growth and nutrition of Arabidopsis thaliana. Plant Soil 336, 65–74. doi: 10.1007/s11104-010-0445-8
Negrini, A. C. A., Evans, J. R., Kaiser, B. N., Millar, A. H., Kariyawasam, B. C., Atkin, O. K., et al. (2020). Effect of n supply on the carbon economy of barley when accounting for plant size. Funct. Plant Biol. 47, 368–381. doi: 10.1071/FP19025
Nicodemus, M. A., Salifu, F. K., Jacobs, D. F. (2008). Growth, nutrition, and photosynthetic response of black walnut to varying nitrogen sources and rates. J. Plant Nutr. 31, 1917–1936. doi: 10.1080/01904160802402856
Nunes-Nesi, A., Fernie, A. R., Stitt, M. (2010). Metabolic and signaling aspects underpinning the regulation of plant carbon nitrogen interactions. Mol. Plant 3, 973–996. doi: 10.1093/mp/ssq049
Polcyn, W., Garnczarska, M. (2009). Short-term effect of nitrate or water stress on nitrate reduction and malate fermentation pathways in yellow lupine (Lupinus luteus) nodules. Acta Physiol. Plant 31, 1249. doi: 10.1007/s11738-009-0361-9
Priemé, A., Braker, G., Tiedje, J. M. (2002). Diversity of nitrite reductase (nirK and nirS) gene fragments in forested upland and wetland soils. Appl. Environ. Microbiol. 68, 1893–1900. doi: 10.1128/AEM.68.4.1893-1900.2002
Qin, J., Yue, X., Ling, Y., Zhou, Y., Li, N., Shang, X., et al. (2021). Nitrogen form and ratio impact phenolic accumulation and relative gene expression in cyclocarya paliurus. Trees 35, 685–696. doi: 10.1007/s00468-020-02068-6
Qin, J., Yue, X., Shang, X., Fang, S. (2020). Nitrogen forms alter triterpenoid accumulation and related gene expression in Cyclocarya paliurus (Batalin) iljinsk. seedlings. Forests 11, 631. doi: 10.3390/f11060631
Rahmani, M., Atia, G. K. (2017). Coherence pursuit: fast, simple, and robust principal component analysis. IEEE Trans. Signal Process. 65, 6260–6275. doi: 10.1109/TSP.2017.2749215
Ruan, L., Wei, K., Wang, L., Cheng, H., Zhang, F., Wu, L., et al. (2016). Characteristics of NH4+ and NO3– fluxes in tea (Camellia sinensis) roots measured by scanning ion-selective electrode technique. Sci. Rep. 6, 38370. doi: 10.1038/srep38370
Srivastava, H. S., Singh, R. P. (1987). Role and regulation of l-glutamate dehydrogenase activity in higher plants. Phytochemistry 26, 597–610. doi: 10.1016/S0031-9422(00)84749-4
Stūrīte, I., Henriksen, T. M., Breland, T. A. (2005). Distinguishing between metabolically active and inactive roots by combined staining with 2,3,5-triphenyltetrazolium chloride and image colour analysis. Plant Soil 271, 75–82. doi: 10.1007/s11104-004-2027-0
Taira, M., Valtersson, U., Burkhardt, B., Ludwig, R. A. (2004). Arabidopsis thaliana GLN2-encoded glutamine synthetase is dual targeted to leaf mitochondria and chloroplasts. Plant Cell 16, 2048–2058. doi: 10.1105/tpc.104.022046
Tang, D., Liu, M.-Y., Zhang, Q., Ma, L., Shi, Y., Ruan, J. (2020). Preferential assimilation of NH4+ over NO3– in tea plant associated with genes involved in nitrogen transportation, utilization and catechins biosynthesis. Plant Sci. 291, 110369. doi: 10.1016/j.plantsci.2019.110369
Thomsen, H. C., Eriksson, D., Møller, I. S., Schjoerring, J. K. (2014). Cytosolic glutamine synthetase: a target for improvement of crop nitrogen use efficiency? Trends Plant Sci. 19, 656–663. doi: 10.1016/j.tplants.2014.06.002
Tischner, R. (2000). Nitrate uptake and reduction in higher and lower plants. Plant Cell Environ. 23, 1005–1024. doi: 10.1046/j.1365-3040.2000.00595.x
Tischner, R., Kaiser, W. (2007). “Chapter 18 - nitrate assimilation in plants,” in Biology of the nitrogen cycle. Eds. Bothe, H., Ferguson, S. J., Newton, W. E. (Amsterdam: Elsevier), 283–301. doi: 10.1016/B978-044452857-5.50019-9
Wang, X., Below, F. E. (1998). Accumulation and partitioning of mineral nutrients in wheat as influenced by nitrogen form. J. Plant Nutr. 21, 49–61. doi: 10.1080/01904169809365382
Wang, Y., Hua, Y., Zhou, T., Huang, J., Yue, C. (2021). Genomic identification of nitrogen assimilation-related genes and transcriptional characterization of their responses to nitrogen in allotetraploid rapeseed. Mol. Biol. Rep. 48, 5977–5992. doi: 10.1007/s11033-021-06599-0
Wang, R., Tischner, R., Gutiérrez, R. A., Hoffman, M., Xing, X., Chen, M., et al. (2004). Genomic analysis of the nitrate response using a nitrate reductase-null mutant of Arabidopsis. Plant Physiol. 136, 2512–2522. doi: 10.1104/pp.104.044610
Wilkinson, J. Q., Crawford, N. M. (1991). Identification of the Arabidopsis CHL3 gene as the nitrate reductase structural gene NIA2. Plant Cell 3, 461–471. doi: 10.1105/tpc.3.5.461
Xu, G., Fan, X., Miller, A. J. (2012). Plant nitrogen assimilation and use efficiency. Annu. Rev. Plant Biol. 63, 153–182. doi: 10.1146/annurev-arplant-042811-105532
Yang, T., Li, H., Tai, Y., Dong, C., Cheng, X., Xia, E., et al. (2020). Transcriptional regulation of amino acid metabolism in response to nitrogen deficiency and nitrogen forms in tea plant root (Camellia sinensis l.). Sci. Rep. 10, 6868. doi: 10.1038/s41598-020-63835-6
Yu, X., Sukumaran, S., Márton, L. (1998). Differential expression of the Arabidopsis Nia1 and Nia2 Genes1: cytokinin-induced nitrate reductase activity is correlated with increased Nia1 transcription and mRNA levels. Plant Physiol. 116, 1091–1096. doi: 10.1104/pp.116.3.1091
Zhang, F.-C., Kang, S.-Z., Li, F.-S., Zhang, J.-H. (2007). Growth and major nutrient concentrations in brassica campestris supplied with different NH4+/NO3– ratios. J. Integr. Plant Biol. 49, 455–462. doi: 10.1111/j.1744-7909.2007.00373.x
Zhao, X. Q., Shen, R. F. (2018). Aluminum–nitrogen interactions in the soil–plant system. Front. Plant Sci. 9. doi: 10.3389/fpls.2018.00807
Zhao, X.-Q., Shi, W.-M. (2006). Expression analysis of the glutamine synthetase and glutamate synthase gene families in young rice (Oryza sativa) seedlings. Plant Sci. 170, 748–754. doi: 10.1016/j.plantsci.2005.11.006
Zhu, K., Fan, P., Liu, H., Tan, P., Ma, W., Mo, Z., et al. (2022). Insight into the CBL and CIPK gene families in pecan (Carya illinoinensis): identification, evolution and expression patterns in drought response. BMC Plant Biol. 22, 221. doi: 10.1186/s12870-022-03601-0
Keywords: pecan, nitrogen uptake and assimilation, NH4+–N, NO3––N, gene expression
Citation: Chen M, Zhu K, Xie J, Liu J, Qiao Z, Tan P and Peng F (2023) Ammonium-nitrate mixtures dominated by NH4+-N promote the growth of pecan (Carya illinoinensis) through enhanced N uptake and assimilation. Front. Plant Sci. 14:1186818. doi: 10.3389/fpls.2023.1186818
Received: 15 March 2023; Accepted: 27 April 2023;
Published: 29 May 2023.
Edited by:
Fahad Shafiq, Government College University, Lahore, PakistanReviewed by:
Antonio Lupini, Mediterranea University of Reggio Calabria, ItalyCopyright © 2023 Chen, Zhu, Xie, Liu, Qiao, Tan and Peng. This is an open-access article distributed under the terms of the Creative Commons Attribution License (CC BY). The use, distribution or reproduction in other forums is permitted, provided the original author(s) and the copyright owner(s) are credited and that the original publication in this journal is cited, in accordance with accepted academic practice. No use, distribution or reproduction is permitted which does not comply with these terms.
*Correspondence: Fangren Peng, ZnJwZW5nQG5qZnUuZWR1LmNu
Disclaimer: All claims expressed in this article are solely those of the authors and do not necessarily represent those of their affiliated organizations, or those of the publisher, the editors and the reviewers. Any product that may be evaluated in this article or claim that may be made by its manufacturer is not guaranteed or endorsed by the publisher.
Research integrity at Frontiers
Learn more about the work of our research integrity team to safeguard the quality of each article we publish.