 Ximeng Yang
 Gangyu Guo
 Shunzhao Sui
- Chongqing Engineering Research Center for Floriculture, Key Laboratory of Horticulture Science for Southern Mountainous Regions of Ministry of Education, College of Horticulture and Landscape Architecture, Southwest University, Chongqing, China
Introduction: Metabolic engineering of anthocyanin synthesis is an active research area for pigment breeding and remains a research hotspot involving AtPAP1 and ZmLc transcription factors. Caladium bicolor is a desirable anthocyanin metabolic engineering receptor, with its abundant leaf color and stable genetic transformation system.
Methods: We transformed C. bicolor with AtPAP1 and ZmLc and successfully obtained transgenic plants. We then used a combination of metabolome, transcriptome, WGCNA and PPI co-expression analyses to identify differentially expressed anthocyanin components and transcripts between wild-type and transgenic lines.
Results: Cyanidin-3-O-glucoside, cyanidin-3-O-rutinoside and peonidin-3-O-rutinoside are the main components of anthocyanins in the leaves and petioles of C. bicolor. Exogenous introduction of AtPAP1 and ZmLc resulted in significant changes in pelargonidins, particularly pelargonidin-3-O-glucoside and pelargonidin-3-O-rutinoside in C. bicolor. Furthermore, 5 MYB-TFs, 9 structural genes, and 5 transporters were found to be closely associated with anthocyanin synthesis and transport in C. bicolor.
Discussion: In this study, a network regulatory model of AtPAP1 and ZmLc in the regulation of anthocyanin biosynthesis and transport in C. bicolor was proposed, which provides insights into the color formation mechanisms of C. bicolor, and lays a foundation for the precise regulation of anthocyanin metabolism and biosynthesis for economic plant pigment breeding.
1 Introduction
Anthocyanins are important water-soluble pigments that impart various colors to vegetative and reproductive plant organs (Yan et al., 2021). These colors, primarily red, purple, and blue, are regulated by anthocyanins through different biosynthetic pathways, which pigment flowers, fruits, and seeds to attract pollinators and seed dispersers (Chen et al., 2019; Mattioli et al., 2020). In addition, anthocyanins help protect plants against cold or drought, and defend against herbivores and pathogens (Ma and Constabel, 2019). As a result, anthocyanin-rich plants are often used in landscape gardens to enhance the natural landscape (Jiang et al., 2016; Sun et al., 2020). Therefore, anthocyanins have multiple functions for plant survival and are highly commercially valuable.
Anthocyanins belong to the diverse family of aromatic molecules known as flavonoids (Belwal et al., 2020). Plants contain structural genes from the anthocyanin biosynthesis pathway, including phenylalanine ammonialyase (PAL), cinnamate 4-hydroxylase (C4H), 4-coumarate-CoA ligase (4CL), chalcone synthase (CHS), chalcone isomerase (CHI), flavanone 3-hydroxylase (F3H), flavonoid 3’ -hydroxylase (F3’ H) or flavonoid 3’,5’-hydroxylase (F3’5’H), dihydroflavonol 4-reductase (DFR), anthocyanidin synthase (ANS), and anthocyanidin-O -methyltransferase (AOMT) (Saigo et al., 2020). To be stored, anthocyanin must be efficiently transported from the surface of the endoplasmic reticulum to the vacuole. Four transporters related to anthocyanin transport have been identified, including glutathione S-transferase (GST), multidrug resistance-associated protein (MRP, an ABCC transporter-type), multidrug and toxic compound efflux (MATE) transporters, and the plasma membrane H+-ATPase (AHA10) (Shi and Xie, 2014). In addition, the MYB-bHLH-WD40 complex (MBW), consisting of R2R3-MYB, bHLH, and WD40 proteins, directly regulates the transcription of the anthocyanidins structural genes and transporter genes (Lloyd et al., 2017; Xu et al., 2020). That is, transcriptionally activating MYB transcription factors usually lead to anthocyanin accumulation in plant leaves or fruits (Naing and Kim, 2018; Xie et al., 2020). MYB transcription factors regulating anthocyanin biosynthesis in the model plant Arabidopsis thaliana have been studied most clearly, among which AtPAP1 (Production of Anthocyanin Segment 1) is the key transcription factor regulating anthocyanin biosynthesis. Activating excessive expression of AtPAP1 induces a large accumulation of anthocyanins, leading to a deep purple color in A. thaliana leaves (Borevitz et al., 2000). Overexpression of AtPAP1 affects the expression of genes such as CHS, CHI, and ANS (Tohge et al., 2005). The Lc (Leaf color) gene encodes a bHLH-type transcription factor from maize, one of the earliest discovered bHLH family transcription factors which are important for regulating anthocyanin production (Ludwig et al., 1989). ZmLc can complement the anthocyanin deficient phenotype in the double mutant of Petunia hybrida an2/an11 by activating the expression of CHS and DFR (Quattrocchio et al., 1993).
Metabolic engineering of anthocyanin synthesis remains a research hotspot involving AtPAP1 and ZmLc transcription factors. Heterologous expression of AtPAP1 in Nicotiana benthamiana (tobacco) can promote the accumulation of anthocyanins (Gatica-Arias et al., 2012; Qiu et al., 2014). Transferred the AtPAP1 into tobacco and detected a medicinal anthocyanin Cyanidin-3-O-rutinoside in the transgenic tobacco, which accounts for 98% of the total anthocyanin content (He et al., 2017). Moreover, overexpression AtPAP1 can effectively induce anthocyanin production in Rosa hybridaby, Salvia miltiorrhiza, Solidago Canadensis, Solanum nigrum and Scutellaria baicalensis (Zvi et al., 2012; Zhang et al., 2014b; Skaliter et al., 2019; Chhon et al., 2020; Ha Park et al., 2021). In addition, ectopic expression of ZmLc has been shown to enhance anthocyanin accumulation in Solanum lycopersicum (Goldsbrough et al., 1996), P. hybrida (Bradley et al., 1998), Medicago sativa (Ray et al., 2003), C. bicolor (Li et al., 2005), Malus domestica (Li et al., 2007), and S. baicalensis (Ha Park et al., 2021). In A. thaliana, expressing AtPAP1 and ZmLc simultaneously increased anthocyanin production (Sharma and Dixon, 2005). Co-expression of AtPAP1 and ZmLc was transferred into the rare wild medicinal plant Saussurea involucrata, and at least 4 derivatives of cyanidins were found in the callus and tender shoots of the transgenic strain; At the same time, the expression of most structural genes in the anthocyanin synthesis pathway is induced, with the most significant change in the expression level of the CHS (Qiu et al., 2013).
Caladium bicolor (Araceae family) is a popular choice for containers or as accent/border plants due to its attractive and variably shaped leaves (Li et al., 2005). Color is an important trait of ornamental plants that has a direct influence on their ornamental and economic value (Boutigny et al., 2020). C. bicolor has a diverse range of colors, and the formation of color patches is closely linked to changes in anthocyanin synthesis and content. C. bicolor has many varieties that provide a great resource for identifying anthocyanins and anthocyanin-related genes. Furthermore, C. bicolor has a reliable genetic transformation system, making it an ideal model plant for studying anthocyanin metabolism. This transgenic host also supports targeted breeding through genetic engineering, providing a basis for the cultivation of new varieties with desired colors for specific garden applications.
This study successfully transferred AtPAP1 and ZmLc into C. bicolor and plants, wild-type (WT) and transgenic-type (TT), were subjected to metabolome, transcriptome, WGCNA and PPI co-expression network analysis. The aim of this study was to quantify the composition and content of anthocyanins in C. bicolor, and to investigate the regulation of AtPAP1 and ZmLc expression in C. bicolor, providing a basis for metabolic engineering of anthocyanin biosynthesis.
2 Methods
2.1 Plant materials
C. bicolor seedlings were collected from a nursery at Southwest University, Chongqing, China. In stage 2 (T2), white spots appeared on the leaves of the wild-type plants after plantlets were transferred to soil, whereas red spots appeared on the transgenic-type plants. In stage 3, red spots were seen on the wild type, and the transgenic type’s red spot area covered half the surface area of the leaf. The transgenic-AtPAP1+ZmLc-type and wild-type plants’ leaves (L) and petioles (P), respectively, were sampled at stages T2 and T3 of the C. bicolor plant. The material was then marked with the notations WT2L, WT2P, WT3L, WT3P, TT2L, TT2P, and TT3L for metabolome and transcriptome analysis with three biological replicates (Figure 1A).
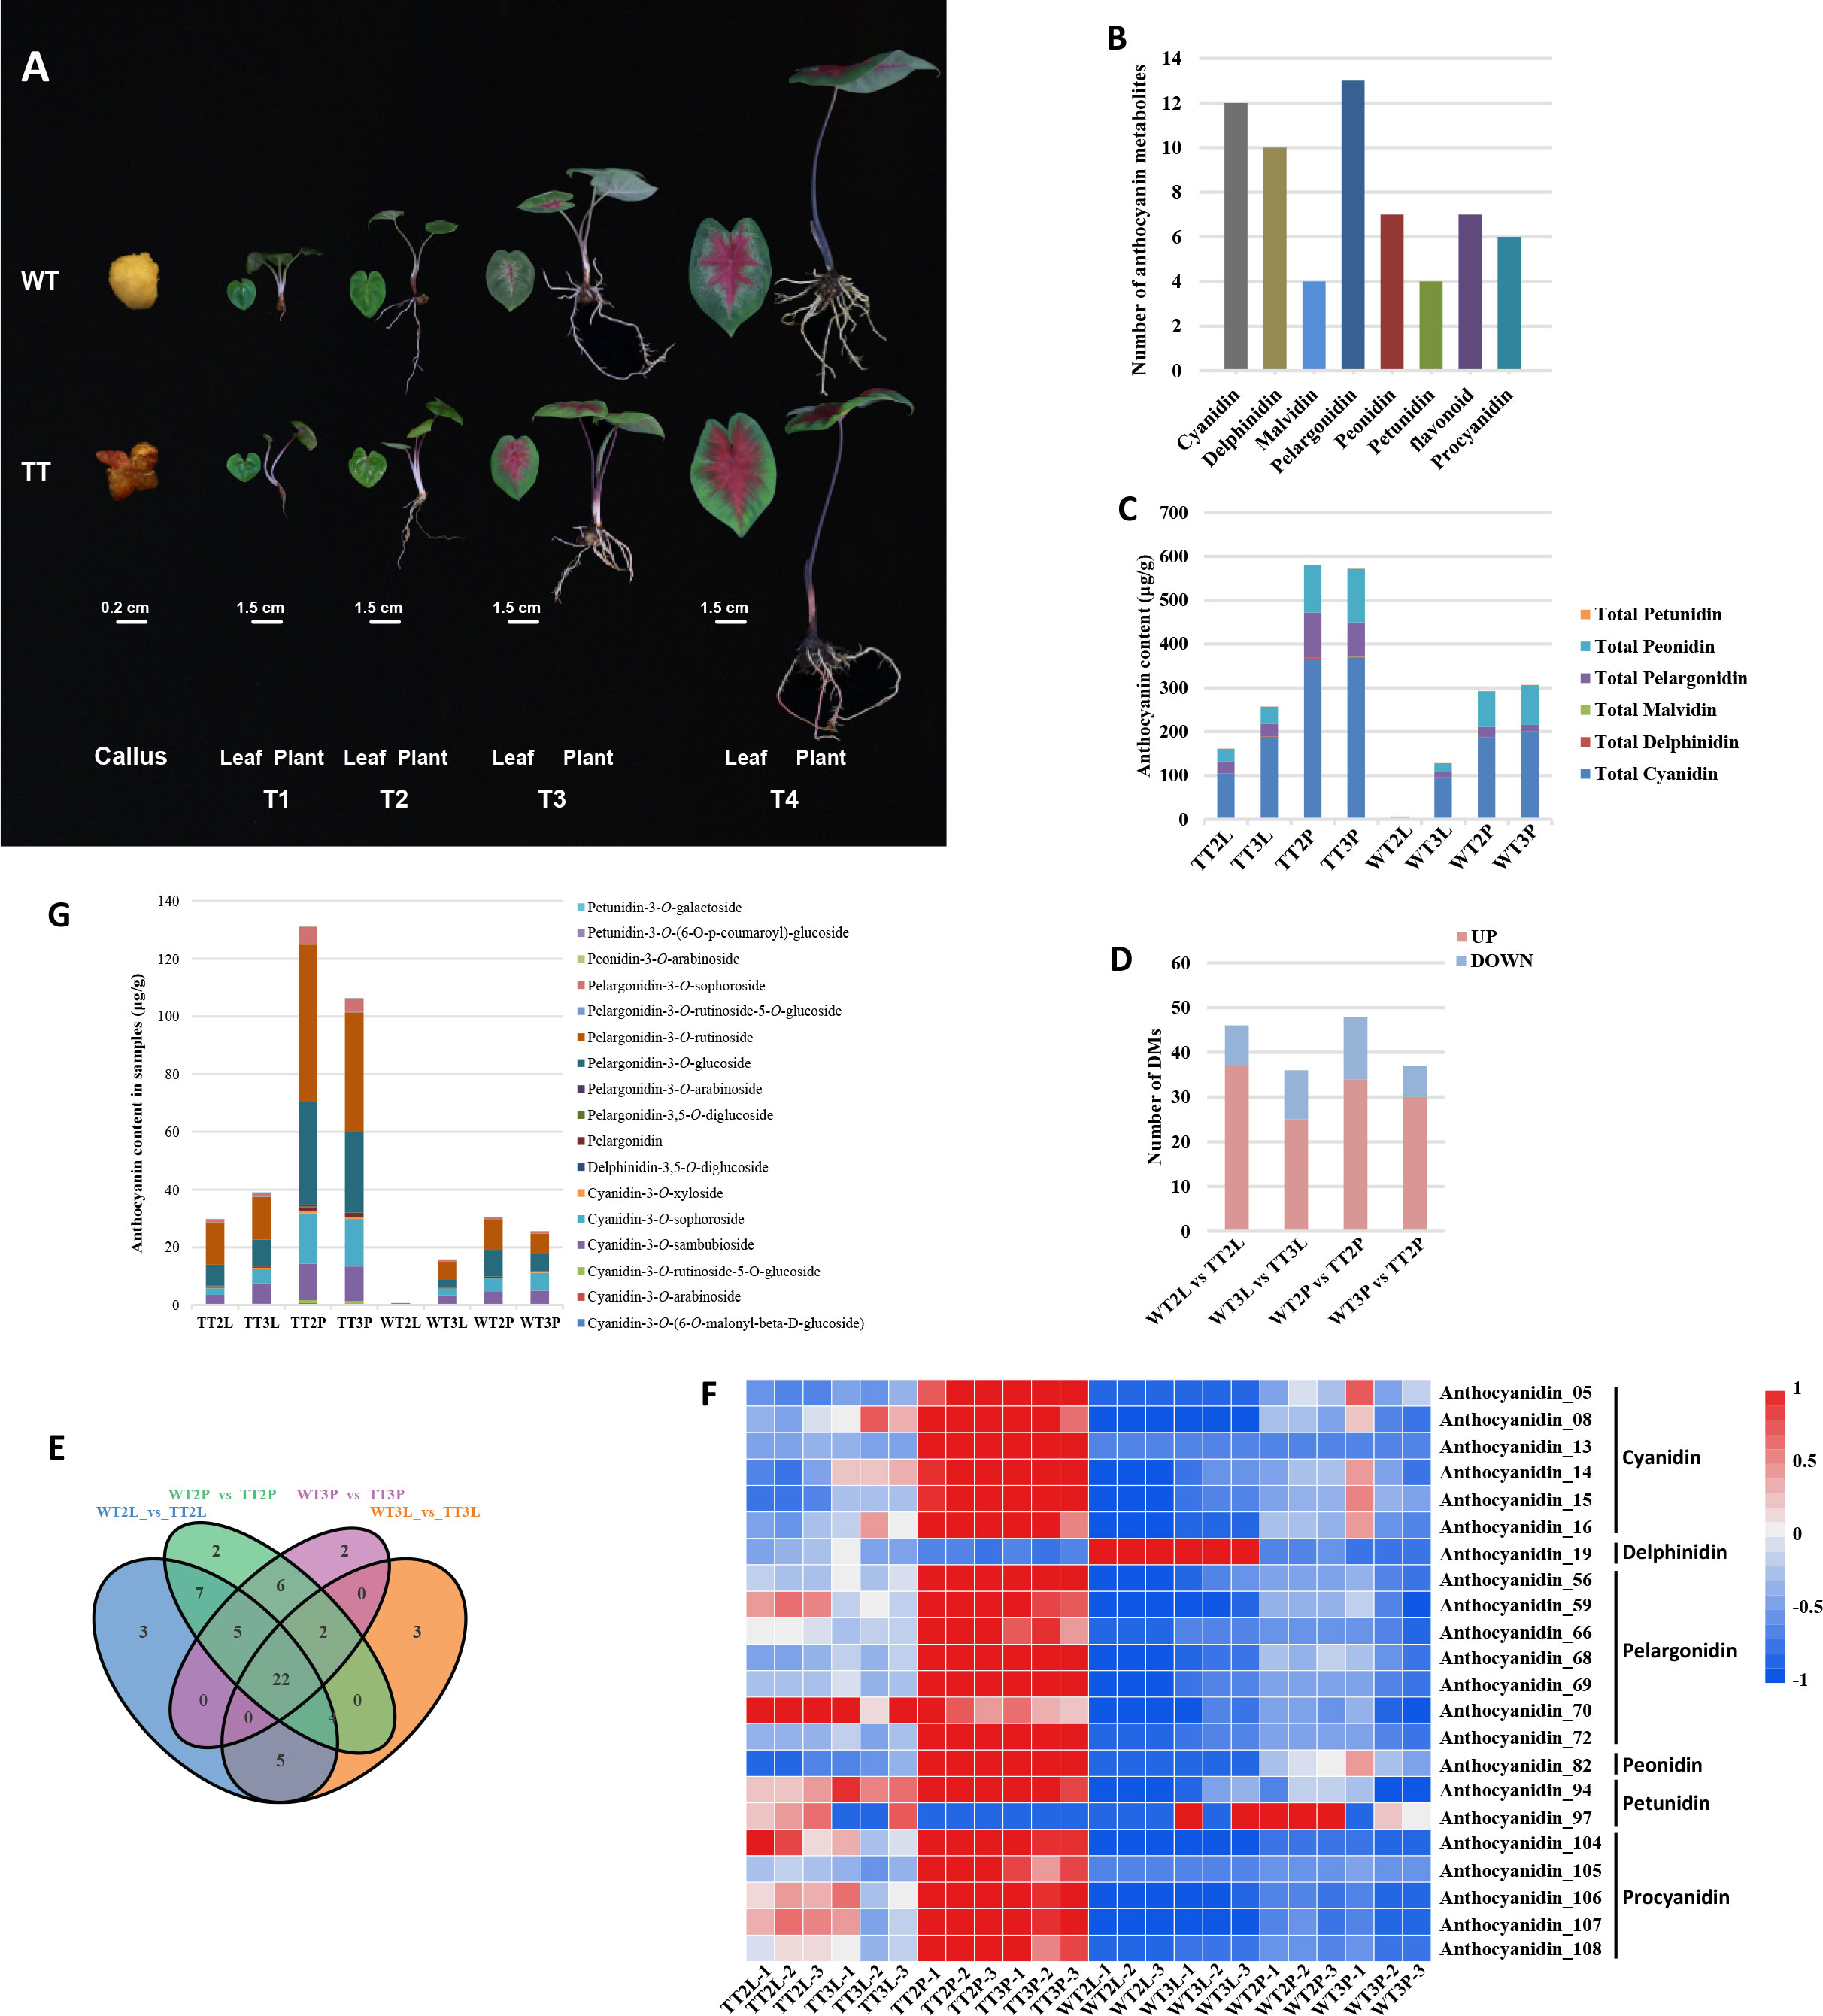
Figure 1 Phenotype and differentially accumulated metabolites analysis of metabolome in TTs and WTs. (A), The phenotype of callus, roots, petioles, leaves of transgenic lines and WT. T1-T4, representing four growth periods of C. bicolor. (B), Classification and statistical analysis of all metabolites detected. (C), The relative content of anthocyanins. (D), Number of DMs among all comparison units. (E), Venn analysis among WT2L vs. TT2L, WT2P vs. TT2P, WT3L vs. TT3L and WT3P vs. TT3P. (F), The heatmap analysis of overlapping DMs according to the relative content in samples. (G), The relative content of overlapping different anthocyanins.
2.2 Plant transformation
The State Key Laboratory for Conservation and Utilization of Subtropical Agro-Bioresources, Guangzhou, China, provided the plant binary expression vector (pC1300-PAP1+Lc) (Supplementary Method 1). The vector constructs were introduced into Agrobacterium tumefaciens strain GV3101 and used to transform C. bicolor using the leaf disk transformation–regeneration method (Li et al., 2005). C. bicolor tender leaves as the explant were inoculated into callus induction Murashige and Skoog Medium (MS) with 4 mg L−1 6-benzylaminopurine (6-BA), 0.2 mg L−1 α-Naphthaleneacetic acid (NAA) for 2 days, and the explants were immersed in pC1300-PAP1+Lc Agrobacterium solution (OD600 = 0.3) with 2 mg L−1 acetosyringone (AS) for 5 minutes. The infected explants were inoculated into callus induction medium for 2 days in dark culture at 28°C. Inoculated into MS with 4 mg/L 6-BA, 0.2 mg L−1 NAA, 7.5 mg L−1 hygromycin (Hyg) and 500 mg L−1 carbenicillin (Carb) for selection. The explants were cultured in a growth chamber at 25 ± 1°C with 16-h photoperiod under cool white light (60 µmol m-1 s−1) and subcultured on fresh medium every 20 days. After the infected leaf-disc grew callus, were transferred to MS medium supplemented with 2 mg L−1 6-BA and 0.2 mg L−1 NAA. Shoots of about 1.5 cm in length, were transferred to a hormone-free medium for rooting (1/2 MS medium supplemented with 600 mg L−1 NAA). Rooted plantlets 3-4 cm high were transferred to soil for further growth in a greenhouse.
2.3 Identification and quantitative analysis of metabolite
The sample was freeze-dried, ground into powder (30 Hz, 90 s). 50 mg powder was weighted and extracted with 0.5 mL methanol/water/hydrochloric acid (500:500:1, V/V/V). Subsequently, the extract was vortexed for 5 min and ultrasound for 5 min and centrifuged at 12, 000 g under 4°C for 3 min. After repeating the extractions twice, the supernatants were collected and filtrated through a membrane filter (SCAA-104, 0.22 μm pore size; ANPEL, Shanghai, China, http://www.anpel.com.cn/) before analysis.
The sample extracts were analyzed using an UPLC-ESI-MS/MS system (UPLC, ExionLC™ AD, https://sciex.com.cn/; MS, Applied Biosystems 6500 Triple Quadrupole, https://sciex.com.cn/). The analytical conditions were as follows, UPLC: column, WatersACQUITY BEH C18 (1.7 µm, 2.1 mm*100 mm); the mobile phase consisted of solvent A, pure water with 0.1% formic acid, and solvent B, methanol with 0.1% formic acid. Sample measurements were performed with a gradient program that employed the starting conditions of 95% A and 5% B. A linear gradient of 50% A and 50% B was programed at 6 min. Within 12 min, a linear gradient of 5% A and 95% B was programed, and a composition of 5% A and 95% B was maintained for 2 min. Subsequently, a composition of 95% A and 5.0% B was adjusted within 14 min and kept for 2 min. The flow rate was set to 0.35 mL per minute; The column oven temperature was set to 40 °C, and the injection volume was 2 μL. The effluent was alternatively connected to an ESI-triple quadrupole linear ion trap (QTRAP)-MS system.
Linear ion trap (LIT) and triple quadrupole (QQQ) scans were acquired on a triple quadrupole-linear ion trap mass spectrometer (QTRAP), QTRAP® 6500+ LC-MS/MS System, equipped with an ESI Turbo Ion-Spray interface, operating in positive ion mode and controlled by Analyst 1.6.3 software (Sciex). The ESI source operation parameters were as follows: ion source, ESI+; source temperature 550 °C; ion spray voltage (IS) 5500 V; curtain gas (CUR) was set at 35 psi, respectively.
Anthocyanins were analyzed using scheduled multiple reaction monitoring (MRM). Data acquisitions were performed using Analyst 1.6.3 software (Metware Biotechnology Co., Ltd., Wuhan, China). The differentially accumulated anthocyanins were identified by R statistical software (www.r-project.org), and the screening criteria were as follows: significantly regulated metabolites between groups were determined by absolute |Log2FC (fold change)| ≥1.
2.4 Illumina sequencing and data analysis
Total RNA was extracted from three replications of TT and WT plants leaves and petioles at T2 and T3 using the Quick RNA isolation Kit (Huayueyang, Beijing, China) following the manufacturer’s protocols. The C. bicolor RNA-seq transcriptome library was prepared following Illumina® Stranded mRNA Prep, Ligation from Illumina (San Diego, CA) using 1μg of total RNA. The raw paired end reads were trimmed and quality controlled by fastp with default parameters (Chen et al., 2018). Then clean data from the samples of C. bicolor were used to do de novo assembly with Trinity (Grabherr et al., 2011). BLAST2GO program was used to get GO annotations of unique assembled transcripts for describing biological processes, molecular functions and cellular components (Conesa et al., 2005). Metabolic pathway analysis was performed using the Kyoto Encyclopedia of Genes and Genomes (KEGG) (Kanehisa and Goto, 2000).
To identify differential expression genes (DEGs) between two different samples (WT2L vs. TT2L, WT2P vs. TT2P, WT3L vs. TT3L and WT3P vs. TT3P), the expression level of each gene was calculated according to the transcripts per million reads (TPM) method. RSEM (Li and Dewey, 2011) was used to quantify gene abundances. Essentially, differential expression analysis was performed using the DESeq2 (Love et al., 2014), DEGs with |log2 (fold change)| ≥ 1 and P-adjust ≤ 0.05 were considered to be significantly different expressed genes. In addition, functional-enrichment analysis including GO and KEGG were performed to identify which DEGs were significantly enriched in GO terms and metabolic pathways at P-adjust ≤ 0.05 compared with the whole-transcriptome background. GO functional enrichment and KEGG pathway analysis were carried out by Goatools and KOBAS (Xie et al., 2011).
2.5 Co-expression network analysis
The R statistical software, DCGL, was used to identify the key candidate gene clusters using Weighted Gene Co-expression Network Analysis (WGCNA) (Langfelder and Horvath, 2008). The modules were obtained using the automatic network construction function. Modules were identified using default settings, except that the soft power was 8, the min module size was 30, and the merge cut height was 0.25. The genes of the connections between nodes with weight values greater than 0.4 were chosen to construct a visualizing co-expression network. Pearson correlation coefficients and P-values were calculated for the transcriptome TPM and metabolomics (the content of anthocyanins) data integration using Spearman’s method. Correlations corresponding to a coefficient of |R| >0.7 were selected to construct a visualizing co-expression network. Next, the string database (http://string-db.org/) was used to perform protein-protein interaction network analysis on the genes of interest (Doncheva et al., 2018). For A. thaliana having a relatively comprehensive protein interaction relationship in the database, the interaction relationship corresponding to the genes of interest in our research was directly extracted from the database to construct the network. Cytoscape software 2.8 was used to visualize the co-expression networks (Doncheva et al., 2018).
2.6 Isolation and sequence analyses of MYBs
The sequences of MYB-5 and MYB-10 genes were obtained from transcriptome and identified by Co-expression Network Analysis, which were translated using the NCBI Open Reading Frame Finder and sequenced using DNAMAN. R2R3-MYBs amino acid sequences from other plants were obtained from GenBank. All protein sequences are listed in Table S11. The protein sequence alignment was generated by ClustalW algorithm in MEGA 7 (Kumar et al., 2016) and used for phylogenetic analyses. A maximum likelihood (ML) tree was constructed, and branch supports were estimated using 1000 bootstrap replicates. Bootstrap values greater than 50 are shown along the branches.
2.7 Reverse transcription quantitative PCR (qRT-PCR) analysis
An aliquot of cDNA synthesized from the total RNA samples for Illumina sequencing was reverse transcribed using the NOVA All-in-one First-Strand Synthesis Master kit (Yugong Biolabs, Jiangsu, China). Primer 5.0 (Table S1) designed the primers for the selected genes with the UBC gene (Pan, 2021) as the reference for normalization. Quantitative real-time PCR was performed using the 2×TSINGKE® Master qPCR Mix (SYBR Green I with UDG) (Tsingke, Beijing, China) on a CFX96 Real-time PCR System (Bio-Rad, CA, USA). The program involved initial denaturation at 50 °C for 2 min, then 95 °C for 2 min, followed by 40 cycles of 95 °C for 15 s, and 60 °C for 30 s. Each plate was amplified three times, and the 2-ΔΔCT method was used to analyze gene expression levels (Schmittgen and Livak, 2008).
3 Results
3.1 Metabolic differences among the transgenic lines (TTs) and wild-type lines (WTs)
Co-overexpression of AtPAP1 and ZmLc caused a different color formation in various plant parts (Figure 1A). The metabolites were detected by UHPLC-ESI-MS/MS to further analyze the differences in metabolites in the C. bicolor leaves and petioles at T2 and T3 of different colors. A total of 63 metabolites were identified from these eight sample groups. The annotation, relative content, and classification of the 63 metabolites are detailed in Table S2. These metabolites were classified into 8 categories, including cyanidin, delphinidin, malvidin, pelargonidin, peonidin, petunidin, flavonoid and procyanidin. And these categories contained 4 to 13 types of metabolites (Figure 1B). The content of cyanidin, delphinidin, malvidin, pelargonidin, peonidin, and petunidin metabolites were calculated separately. Among these six major anthocyanidins, the contents of cyanidin, peonidin, pelargonidin, delphinidin, malvidin, petunidin were in descending order (Figure 1C).
Based on the data obtained from the metabolome, 46, 36, 48 and 37 types of Different Metabolites (DMs) were identified between the WT2L vs. TT2L, WT2P vs. TT2P, WT3L vs. TT3L and WT3P vs. TT3P groups, respectively (Figure 1D). A total of 61 DMs were identified among all samples Table S3. Moreover, the overlapping metabolites were identified. The results showed that 22 DMs were shared among WT2L vs. TT2L, WT2P vs. TT2P, WT3L vs. TT3L and WT3P vs. TT3P (Figure 1E). These 22 metabolites included 17 of anthocyanins and 5 proanthocyanidins and the relative contents of these 22 DMs were illustrated in a heatmap (Figure 1F). The classification results of these 17 anthocyanins indicated that most were pelargonidin-3-O-glucoside, pelargonidin-3-O-rutinoside, and then cyanidin-3-O -sambubioside, cyanidin-3-O -sophorosid, and a small amount were delphinidin, malvidin and petunidin (Figure 1G).
3.2 De novo sequencing, assembly, and identification of differentially expressed genes
To further analyze the molecular mechanism of TT and WT plants, transcriptome sequencing was used to analyze the leaves (L) and petiole (P) of transgenic material and wild-type material at the T2 and T3 stages. These samples were used to construct 24 sequencing libraries (three biological replicates). A total of 177.98 Gb clean data was obtained. Each sample had more than 6.21 Gb of clean data. The percentage of Q30 base was more than 93.71% (Table S4). The clean data were assembled, then the assembly results were optimized and evaluated. A total of 129980 unigenes and 268446 transcription factors (TFs) were obtained via assembly (average length of N50: 1357bp) (Table S5). The clean reads were compared with the assembled reference sequence using Trinity to obtain the mapping results of each sample. The analysis alignment rate ranged from 60.20% to 67.27% (Table S6).
Transcriptomic analyses of WT2L vs. TT2L, WT2P vs. TT2P, WT3L vs. TT3L and WT3P vs. TT3P were conducted to identify the key DEGs related to the color formation (Figure 2A). A total of 7070 DEGs were identified based on a 2-fold change at P < 0.05 (Table S7).
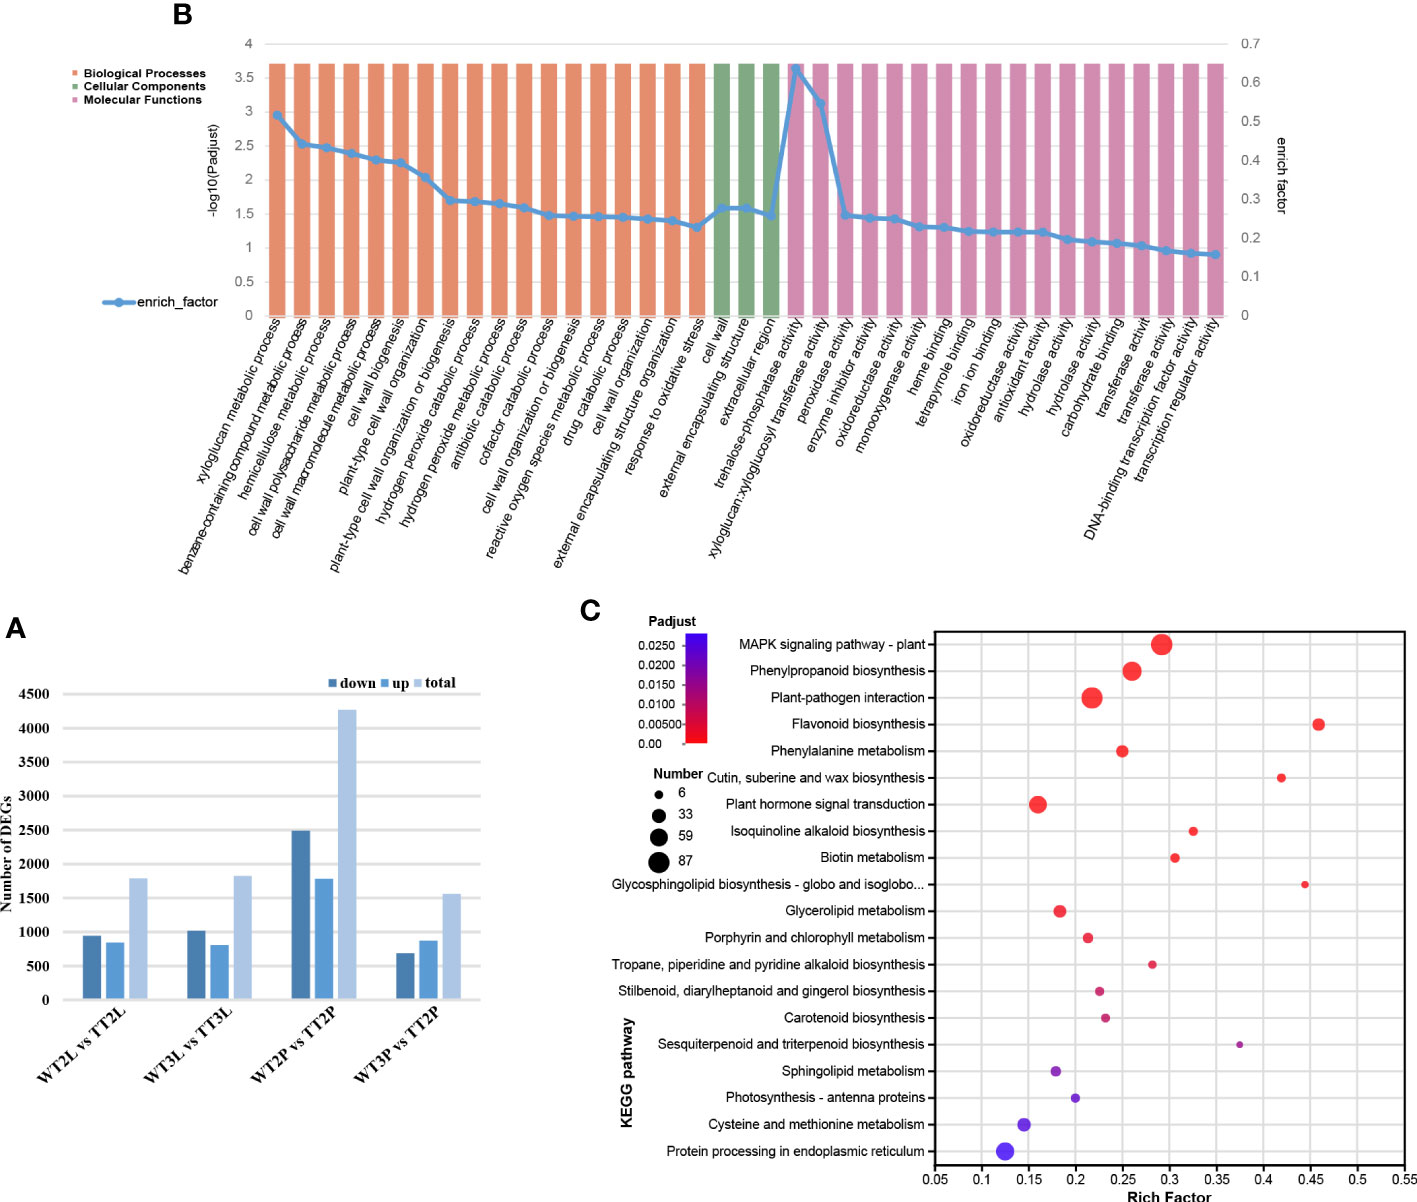
Figure 2 Differentially expressed unigenes (DEGs) in TTs and WTs. (A), The number of up- and down-regulated genes in WT2L vs. TT2L, WT2S vs. TT2S, WT3L vs. TT3L, WT3S vs. TT3S, and WT2L vs. WT3L. (B), GO enrichment analysis. (C), KEGG enrichment analysis.
The function of the DEGs was determined using Gene Ontology (GO) enrichment analysis. A total of 7070 DEGs were related to biological processes (BP), cellular components (CC), and molecular functions (MFs). There were 39 most enriched GO terms, of which 18 belonged to BP, 3 CC as well as 18 MF. The most enriched GO terms in these three categories were listed in Figure 2B. KEGG enrichment analysis was used for pathway classification and functional enrichment to further evaluate the biological functions of the identified DEGs. Significant enrichment of DEGs in phenylpropanoid biosynthesis (ko00940) and flavonoid biosynthesis (ko00941) pathways (Figure 2C).
3.3 WGCNA and functional annotation of DEGs-related anthocyanin synthesis
WGCNA is used to describe the correlations patterns of gene expression and reveal clusters or modules of genes whose expressions are highly correlated. The module eigen genes, intramodular hub genes and the association between modules with one another and sample traits can be determined using WGCNA (Langfelder and Horvath, 2008). Herein, WGCNA was conducted using the TPM values of the total of 7070 DEGs and the content of the overlapping 22 DMs as source data (Figure 3A), identified 11 co-expression modules, where the ‘blue’ and ‘pink’ modules were significantly correlated with the transgenic line and anthocyanin content (Figure 3B). Furthermore, the biological functions of the ‘blue’ (1365 DEGs) and ‘pink’ (148 DEGs) modules were analyzed using KEGG pathway enrichment analysis (Figures 3C, D). The ‘blue’ and ‘pink’ modules were both enriched in the ‘flavonoid biosynthesis’ and ‘phenylalanine metabolism’ pathway. The genes related to ‘anthocyanin biosynthesis’ and ‘phenylpropanoid biosynthesis’, ‘flavone and flavonol biosynthesis’ were also clustered in ‘blue’ and ‘pink’ modules, respectively (Figures 3C, D).
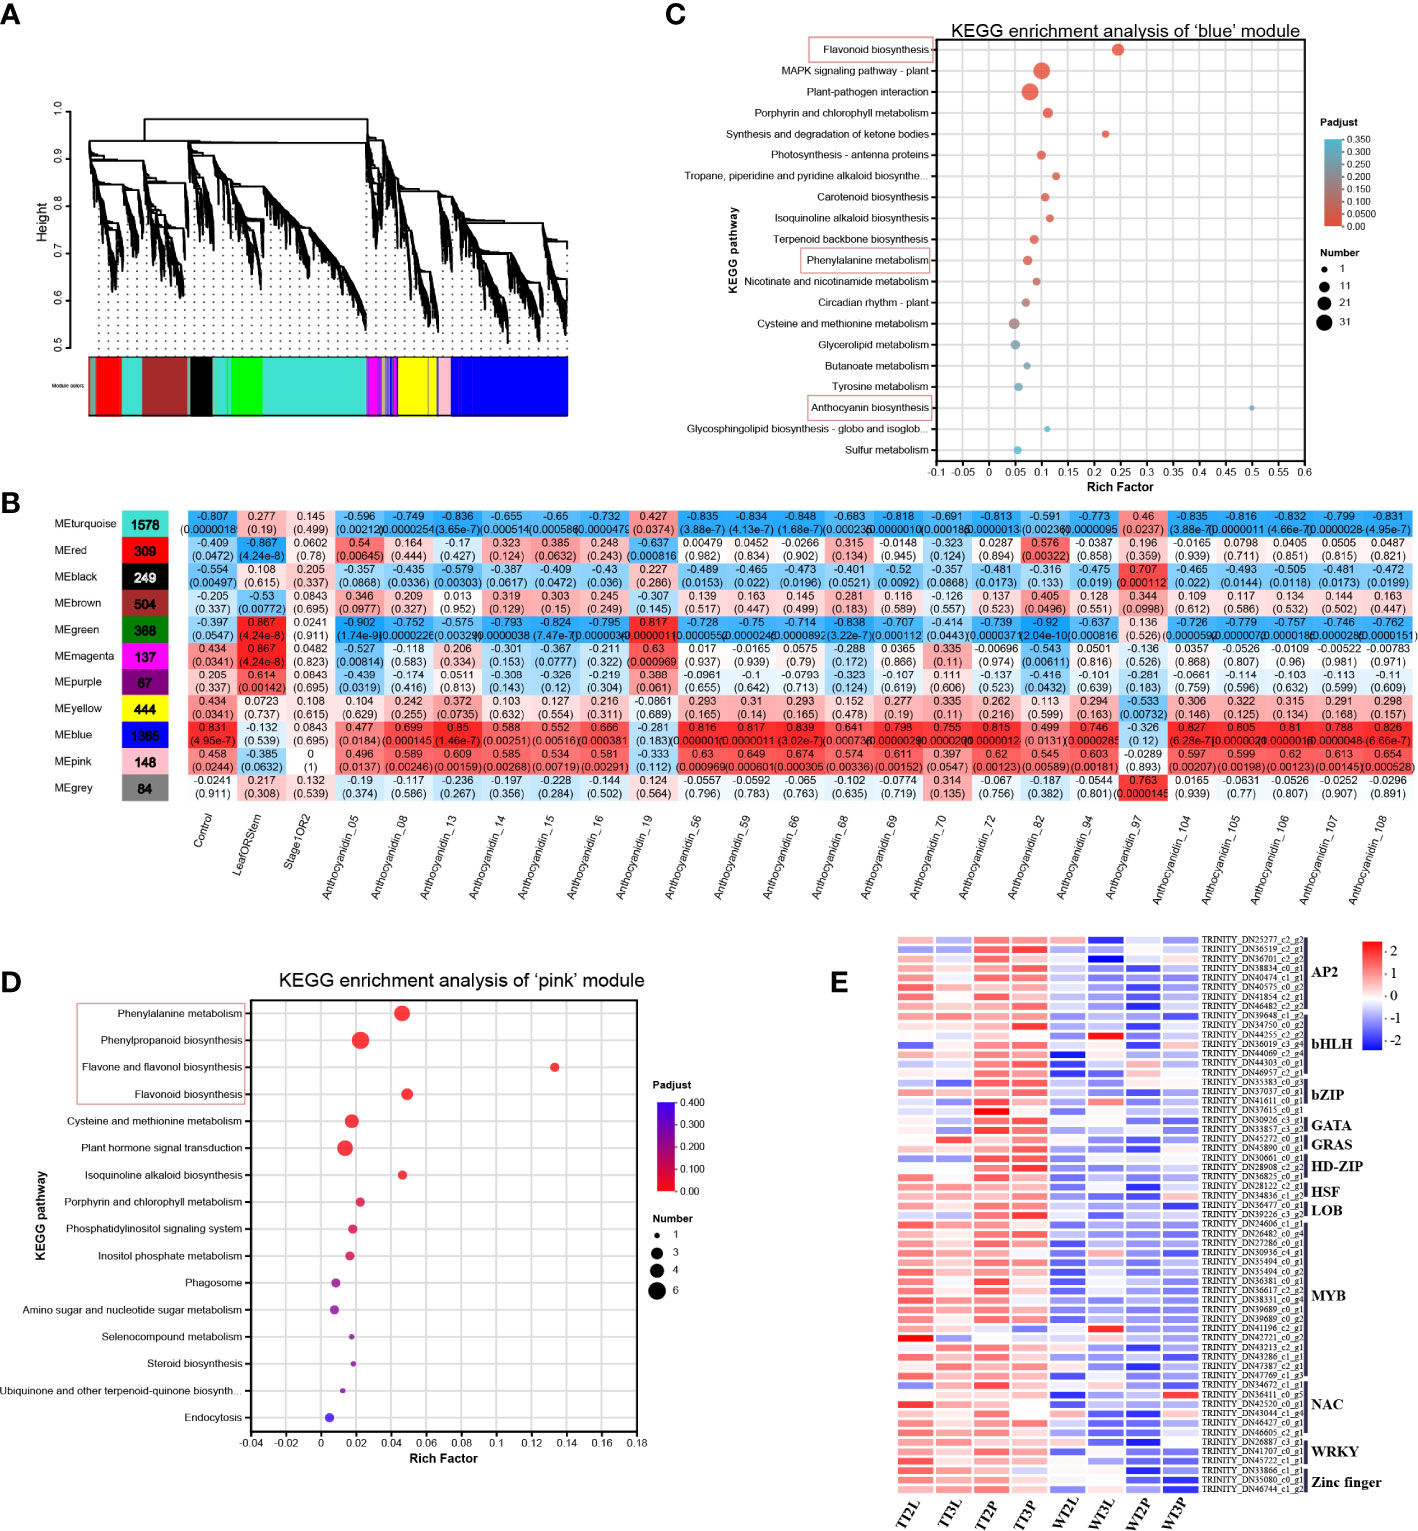
Figure 3 Weighted gene co-expression network analysis. (A), Hierarchical clustering tree (cluster dendrogram) results showed 11 expression modules, labeled with different colors. (B), Module correlations and corresponding p-values. The left panel shows the 11 modules and the number of genes in each module. The value inside each box represents Pearson’ s correlation coefficient between the module with anthocyanin, and the number in each parentheses represents p-value. The color scale on the right represents the degree of correlation between modules and anthocyanins and the red represent high correlation. (C), KEGG enrichment analysis of genes in ‘blue’ module. (D), KEGG enrichment analysis of genes in ‘pink’ module. (E), The heatmap of identified TFs in ‘blue’ and ‘pink’ modules.
The ‘blue’ and ‘pink’ modules contained 59 TFs, 32 structural genes and 24 transporters that may be related to anthocyanin synthesis and transport. The 115 DEGs in the ‘blue’ and ‘pink’ modules were then analyzed (Table S8).
In ‘blue’ and ‘pink’ modules identified 32 DEGs in the anthocyanin synthesis pathway (Figure 4; Table S8), including the phenylpropanoid biosynthesis, flavonoid biosynthesis, and anthocyanin biosynthesis pathways. The 24 transporters were identified by the annotation results of the DEGs in the ‘blue’ and ‘pink’ modules, which belonged to the MATE, AHA10, ABCC and GST, that may be related to anthocyanin transport (Figure 4; Table S8). The ‘blue’ and ‘pink’ modules contained 59 TFs, the classified results indicated that these TFs belonged to the AP2/ERF, bHLH, bZIP, GATA, GRAS, HD-ZIP, HSF, LOB, MYB, NAC, WRKY and Zinc finger family (Figure 3E; Table S8).
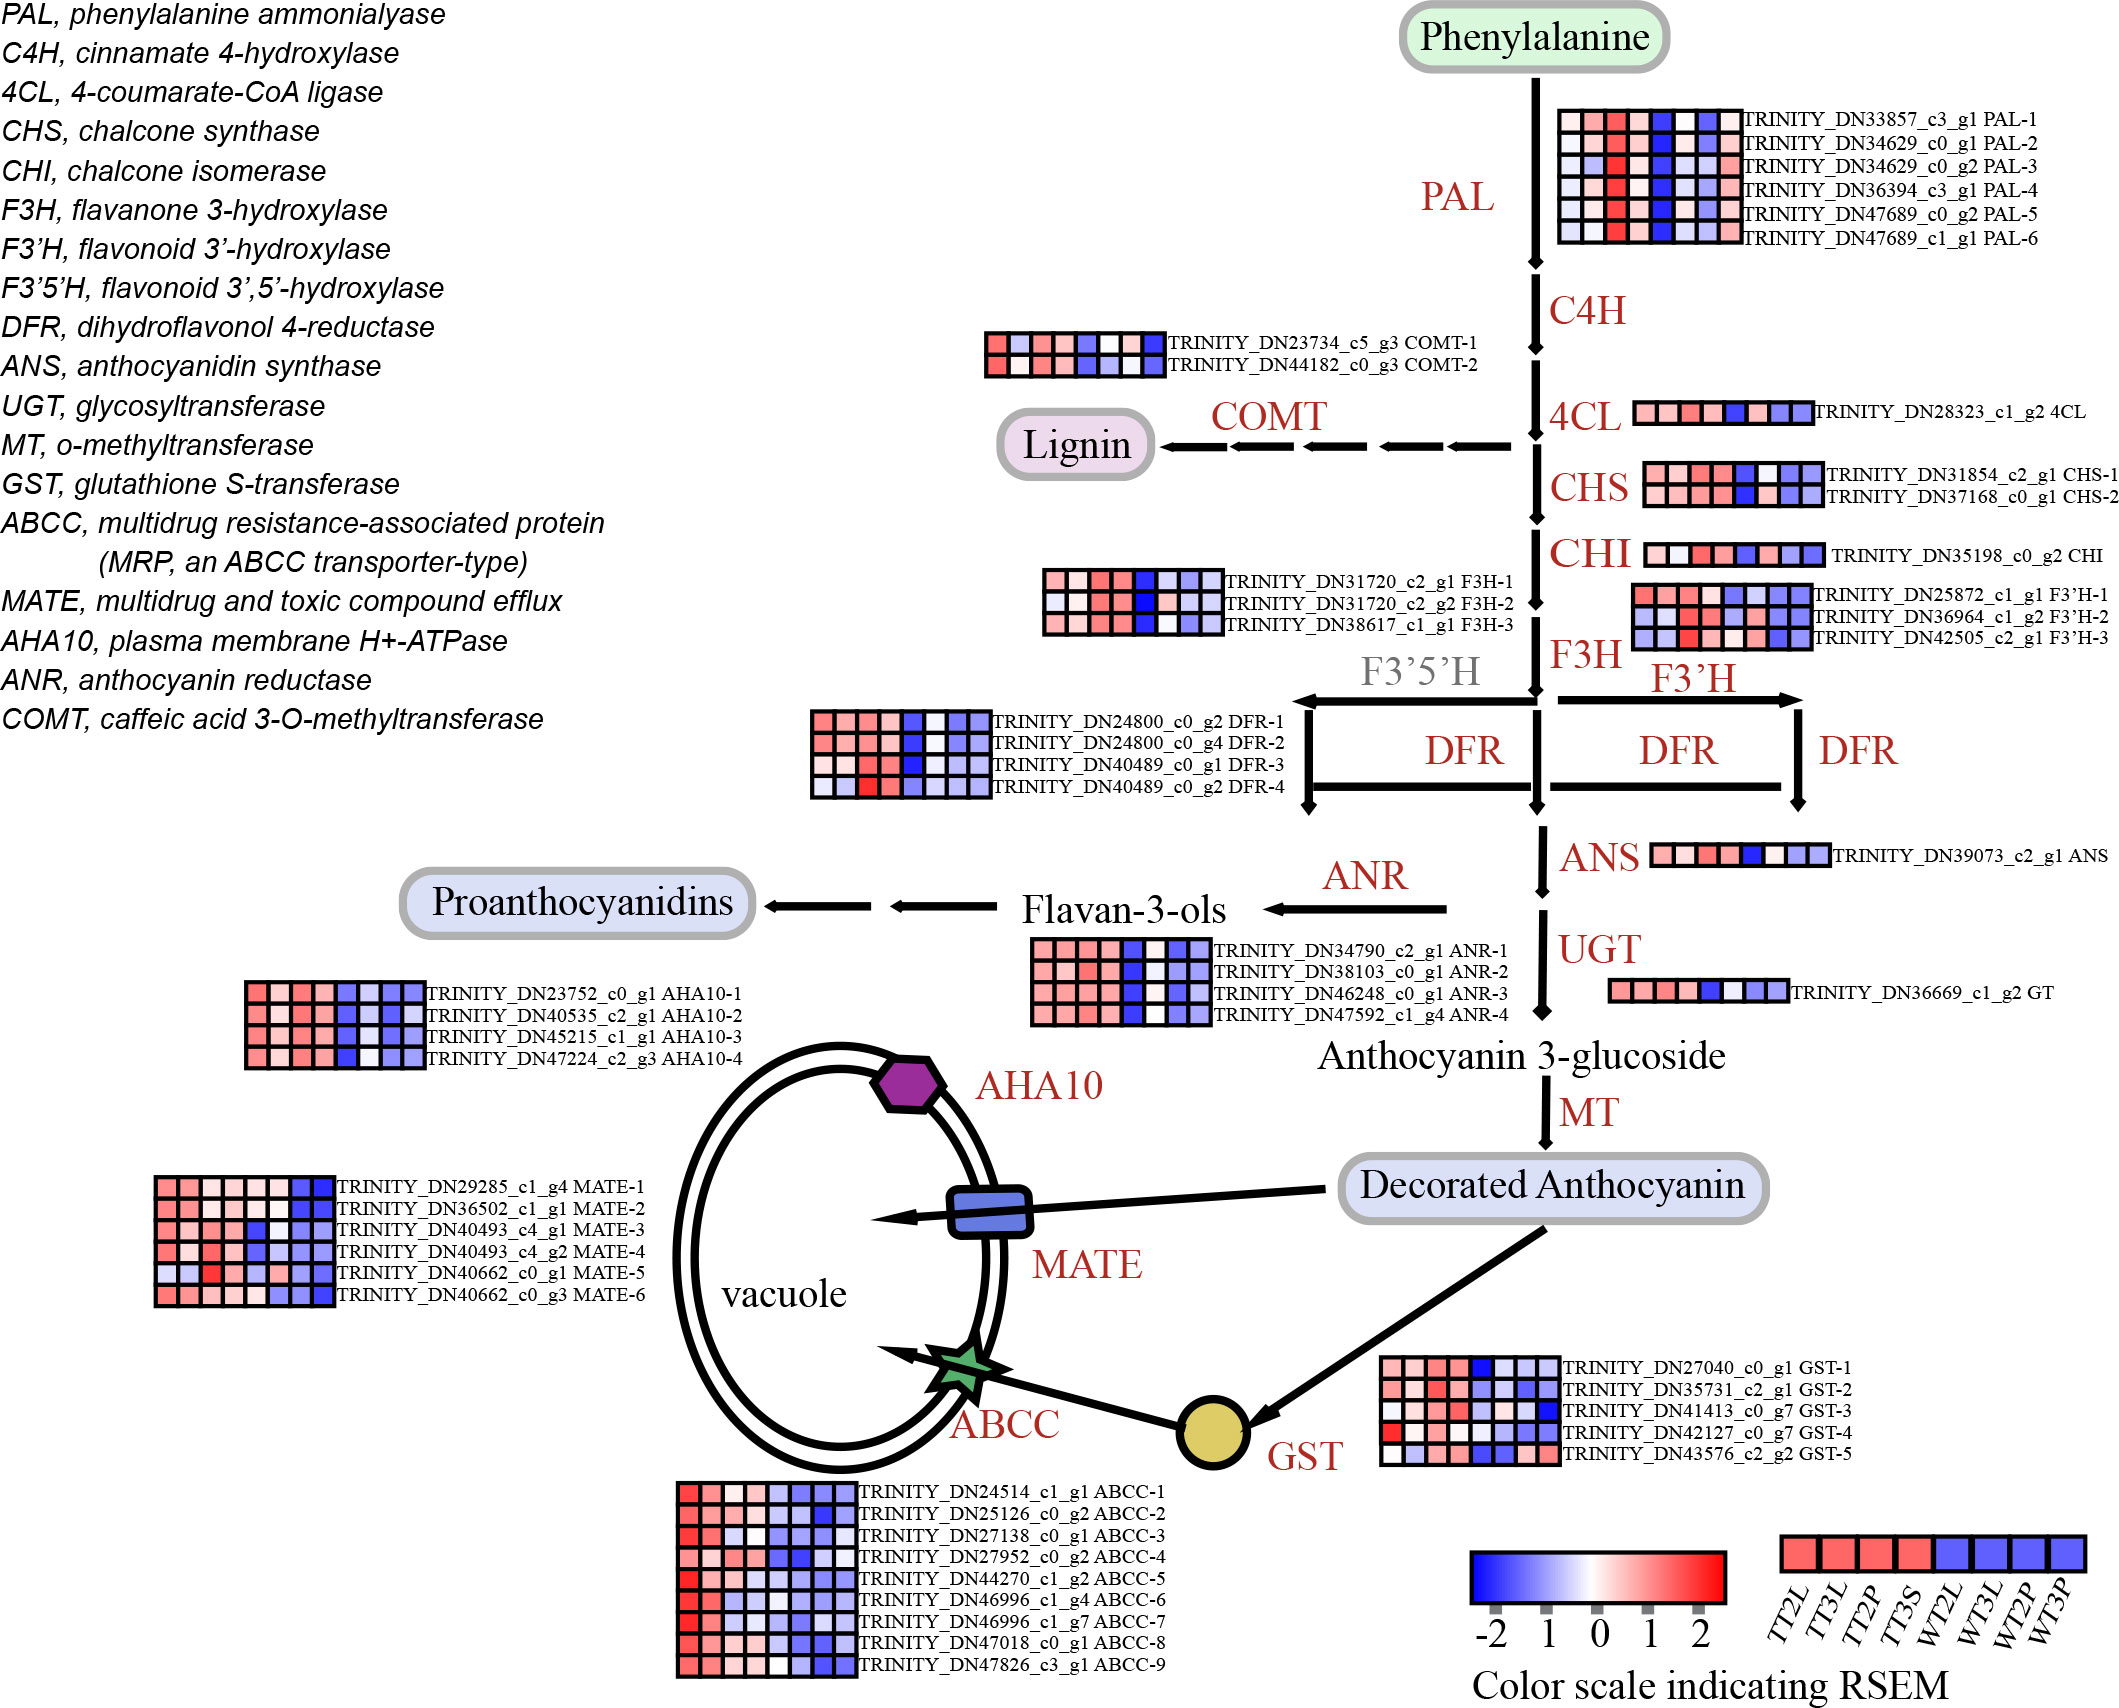
Figure 4 The identification of DEGs in ‘blue’ and ‘pink’ modules of anthocyanin biosynthesis and transport pathway.
3.4 Network analysis of the transcriptome and metabolomics
Further narrow the scope of key genes, 59 TFs, 32 structural genes and 24 transporters in the ‘blue’ and ‘pink’ modules were visualized using Cytoscape version 2.8, filtering the connections between nodes with weight values greater than 0.4 for analysis (Figure 5A; Table S9). We extracted 33 genes. And MYB-10, CHS-1 and AHA10-3 were identified as hub genes, which not only were putatively associated with transgenic line and anthocyanin contents and closely related to genes in the anthocyanin synthesis pathway (Figure 5A). Phylogenetic analysis indicated that MYB-10 belonged to the subgroup 4 of the R2R3-MYB transcription factor gene family (Figure 5D). Although the weight values of MYB-2, AP2-4 and NAC-5 were also high, they formed a cluster of their own and were not clustered with the genes related to anthocyanin biosynthesis (Figure 5A).
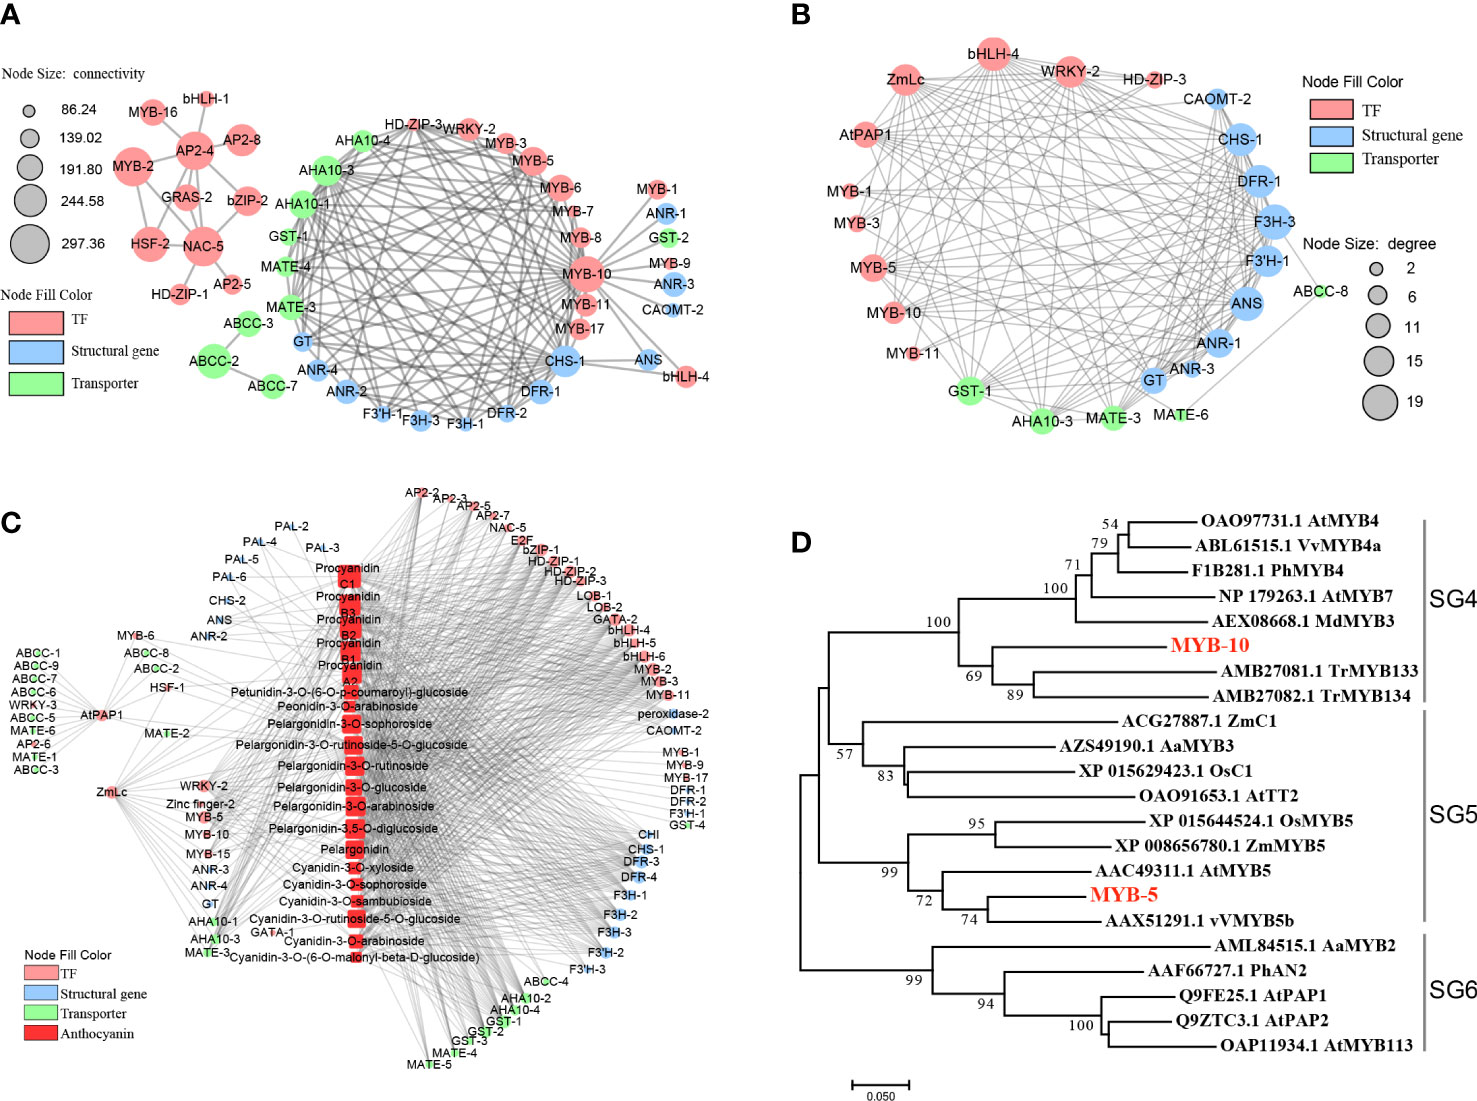
Figure 5 Connection network between KEY DEGs and differential metabolites. (A), Gene co-expression network of key genes by WGCNA analysis. (B), Co-expression network of key genes and anthocyanins content by Pearson analysis. (C), Gene co-expression network of key genes by PPI analysis. The circle sizes represent the number of connections between genes. The red, blue and green circles represent transcription factors, structural genes of anthocyanin biosynthesis and transporters, respectively. (D), Phylogenetic relationships of MYB-TFs. The MYBs belonging to the SG4-SG6 and R3-MYB were used to build a phylogenetic tree based on maximum likelihood, which was employed to infer the MYB candidates.
Moreover, the interaction network diagram was constructed using the TPM between the key DEGs (59 TFs, 32 structural genes, 24 transporters, AtPAP1 and ZmLc) and the content of the overlapping 17 anthocyanins and 5 proanthocyanidins, for directed displaying the AtPAP1 and ZmLc regulatory network of anthocyanin accumulation. Correlations corresponding to a coefficient of |R| >0.7 were selected to visualize co-expression network (Figure 5C). There were 26 genes directly associated with AtPAP1 and ZmLc. Analysis of the DMs and genes directly related to AtPAP1 and ZmLc revealed that both were significantly correlated with pelargonidin-3-O-rutinoside-5-O-glucoside. In addition, ZmLc was directly associated with petunidin-3-O-(6- O -p-coumaroyl)-glucoside, procyanidin A2, procyanidin B2 and procyanidin B3, while AtPAP1 was indirectly related to procyanidin A2 through MYB-6 and HSF-1. Furthermore, ZmLc was also found to be connected to other type of cyanidin, pelargonidin and peonidin through other genes, with MYB-5 and WRKY-2 being important intermediate bridges (Figure 5B). Phylogenetic analysis revealed that MYB-5 was in the branch which belonged to the subgroup 5 of the R2R3-MYBs (Figure 5D).
Herein, the 33 genes extracted by WGCNA analysis method were compared with 26 genes obtained by Pearson correlation analysis, as well as AtPAP1 and ZmLc genes, a total of 51 genes. Subsequently, these 51 genes were analyzed using PPI to further evaluate the regulatory network of anthocyanin synthesis and transport pathway in C. bicolor, and how AtPAP1 and ZmLc regulate anthocyanin synthesis and transport pathway in C. bicolor (Figure 5C). AtPAP1 and ZmLc were found to have expression patterns closely related to key structural genes and transporters, such as CHS-1, DFR-1, F3H-3, F3’H-1, ANS, ANR-1, GT, GST-1, AHA10-3 and MATE-3. Not only that, they are both closely related to transcription factors WRKY-2. AtPAP1 is correlated with bHLH-4, while ZmLc is also associated with Zinc finger, HD-ZIP and MYB-like transcription factors. Except for AtPAP1, the expression patterns of 5 MYB TFs, especially MYB-5 and MYB-10 were closely related to those of key structural genes and transporters (Figure 5C). The final screen yielded 5 MYB-TFs, 9 structural genes, and 5 transporter key genes (Table 1; Table S10).
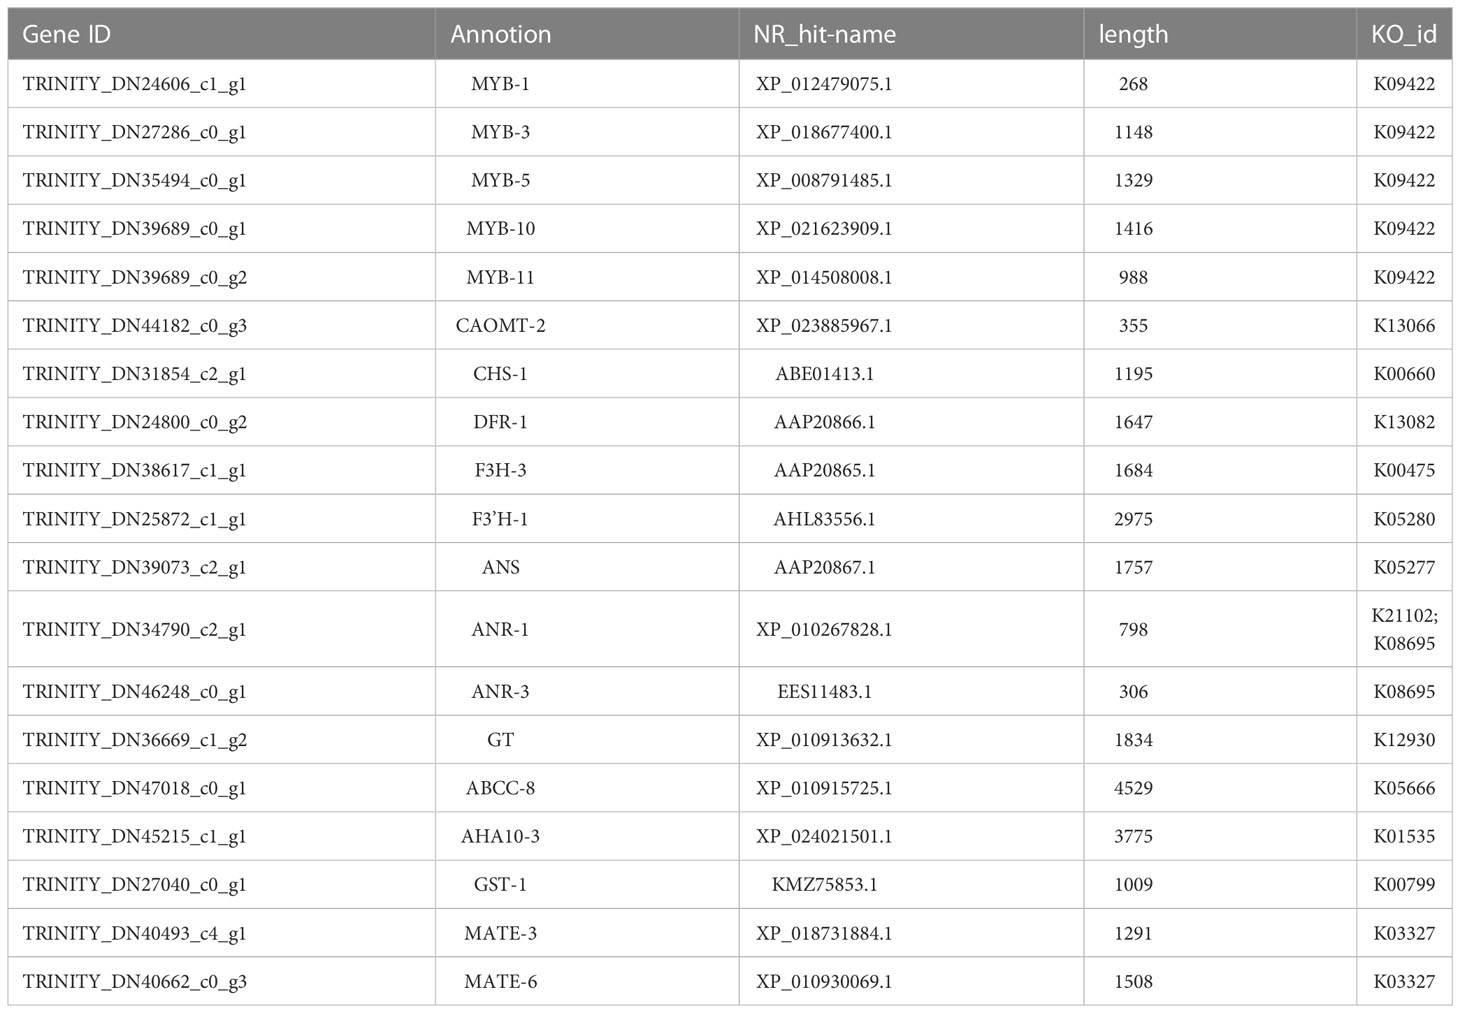
Table 1 The candidate genes involved in AtPAP1 and ZmLc regulating anthocyanin synthesis and transport in C. bicolor.
3.5 qRT -PCR analysis of DEGs involved in anthocyanin biosynthesis
AtPAP1, ZmLc and eight key DEGs involved in anthocyanin biosynthesis were further analyzed using qRT-PCR to validate the transcript expression patterns of DEGs involved in anthocyanin biosynthesis. As a result, the high expression of AtPAP1 and ZmLc in transgenic plants and the low expression detected in wild-type plants verified the reliability of the transgenic strains from the transcriptional level. Moreover, the expression pattern of the DEGs was consistent with the transcriptome data, and these in the wild-type T3 petioles were also significantly expressed (Figure 6). Furthermore, the high transcription level of ANS and MATE-3 may directly lead to the color formation in C. bicolor leaf.
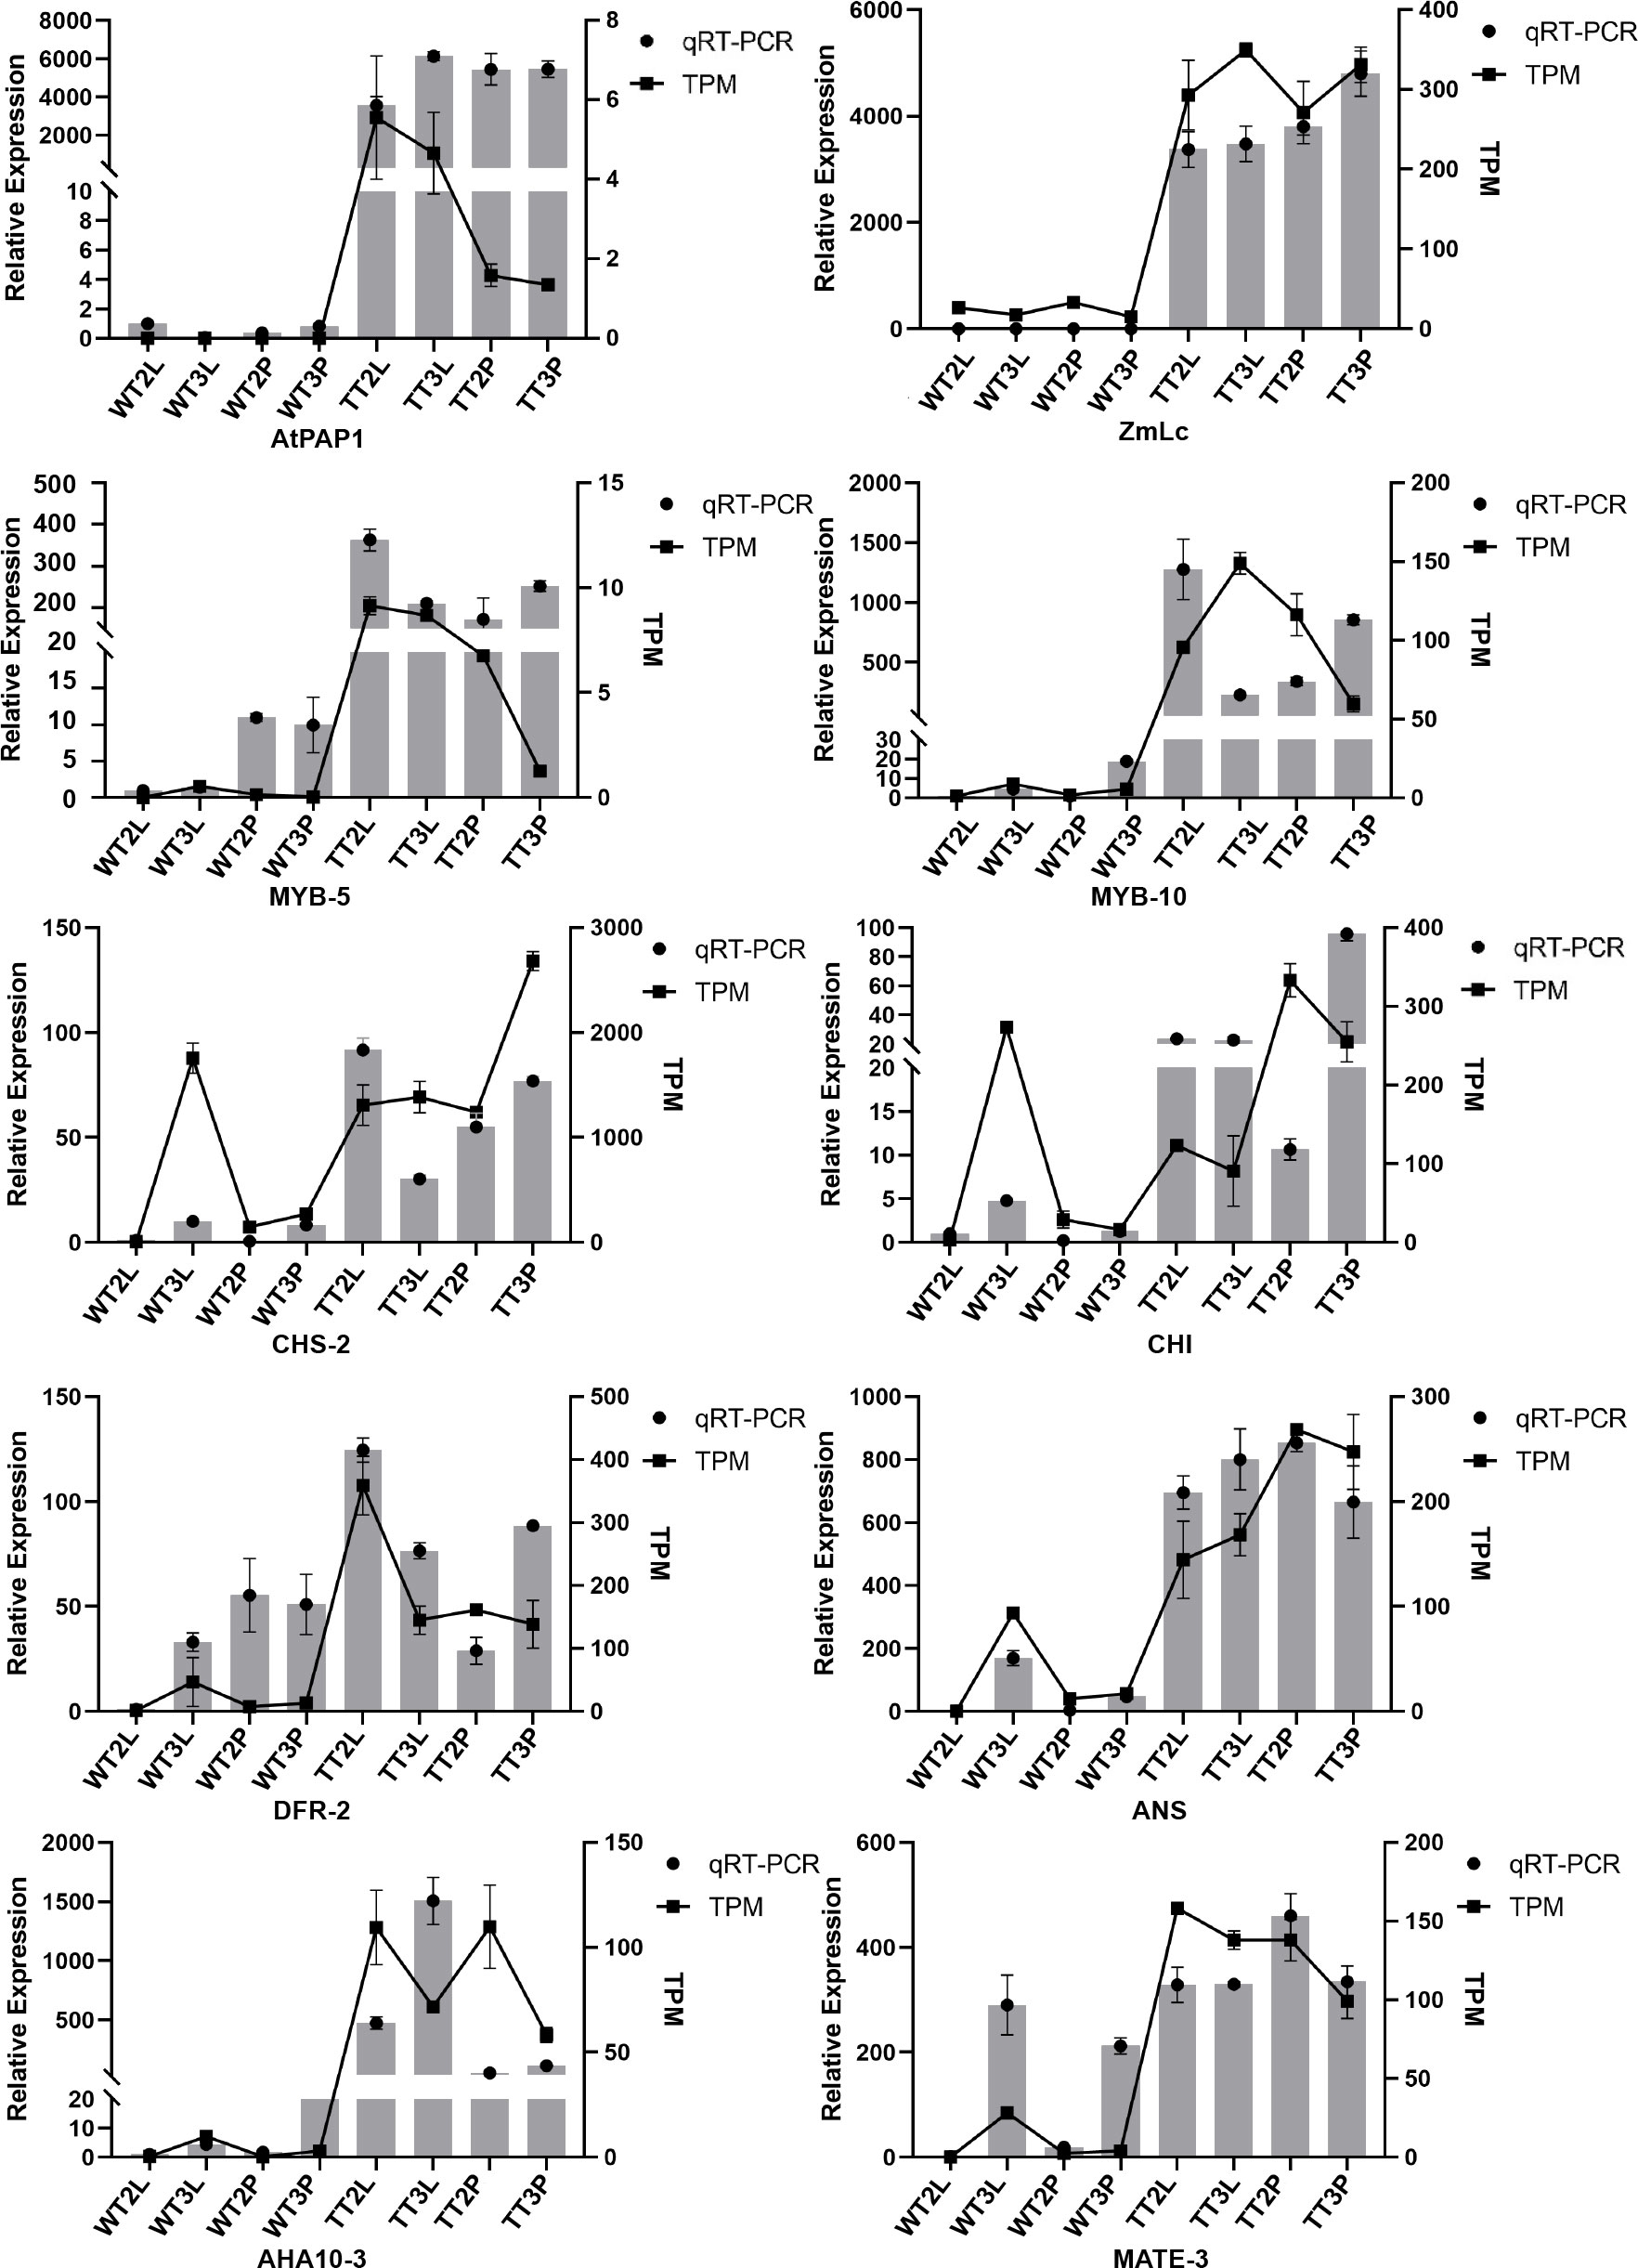
Figure 6 Validation of the expression of pigment-related genes in C. bicolor by qRT-PCR.
4 Discussion
4.1 Cyanidin-3-O-glucoside, cyanidin-3- O -rutinoside and peonidin-3-O-rutinoside are the main anthocyanins in the leaves and petioles of C. bicolor
Anthocyanins are key metabolites for coloration in plant organs, contributing to the purple leaves and the purple skin (Zhang et al., 2014a; Horiuchi et al., 2020; Tang et al., 2020). There are numerous species of anthocyanins present in colorful plants, with six of them being the most well-known, namely pelargonidin, cyanidin, delphinidin, peonidin, petunidin and malvidin. The molecular structures and chemical characteristics of these anthocyanins have been extensively investigated. In particular, cyanidin is the major contributor to the formation of red-purple pigments; delphinidin to blue-red or purple pigments; and pelargonidin to orange and red pigments (Khoo et al., 2017).
The colors of C. bicolor are diverse and the formation of color patches is closely related to the variation of anthocyanins and content. The anthocyanins in the C. bicolor have not been sufficiently identified or quantified. In our study, anthocyanins mainly accumulates in the vegetative organs of C. bicolor leaves and petioles, we detected and quantified the composition and content of anthocyanins in C. bicolor. The results showed that six aglycones of anthocyanin were detected in the C. bicolor leaves and petioles, and the main anthocyanins in C. bicolor were cyanidin, which was dominated by cyanidin-3- O -glucoside and cyanidin-3- O -rutinoside (Figure S1A; Table S2). The next major anthocyanins present were predominantly peonidin-3-O-rutinoside (Figure S1B), with significant amounts of pelargonidin-3-O-glucoside and pelargonidin-3-O-rutinoside (Figure S1C). Additionally, delphinidin, petunidin and malvidin were also detected, albeit in low levels (Figure S1D). These findings corroborate the results of (Lei et al., 2017), who demonstrated that cyanidin, pelargonidin were the main components of the red spathe in Zantedeschia hybrid (family Araceae). Notably, this study revealed significant levels of peonidin (peonidin-3-O-rutinoside), which has a bluish color compared to cyanidin and pelargonidin. Thus, the combination of these anthocyanin glycosides resulted in a reddish-purple color for C. bicolor. Furthermore, the species and content of peonidin were barely affected by the interaction of AtPAP1 and ZmLc.
4.2 Pelargonidin-3-O-glucoside and pelargonidin-3-O-rutinoside content contributes to color variation in transgenic lines
In this studies, 17 anthocyanins among WT2L vs. TT2L, WT2P vs. TT2P, WT3L vs. TT3L and WT3P vs. TT3P were identified according to the anthocyanin content in each sample, which indicated that these 17 anthocyanins contribute to the different colors in transgenic lines of C. bicolor. The content of pelargonidin-3-O-glucoside and pelargonidin-3-O-rutinoside varied greatly among the 24 samples, and next were cyanidin-3-O-sambubioside and cyanidin-3-O-sophoroside (Figure 1G; Table S3).
The transgenic S. baicalensis hairy root cultures exhibited a distinct color change to a red brick hue upon introduction of AtPAP1 and ZmLc into S. baicalensis, respectively. However, this study focused on flavone metabolic components and could not ascertain the effect of these introductions on the anthocyanins pathway (Ha Park et al., 2021). AtPAP1 was transferred into Nicotiana tabacum and several transgenic plants developed red/purple pigmentation in different tissues. Qualitative analysis of anthocyanin composition in transgenic material was cyanidin-3- O-rutinoside (He et al., 2017). Ectopic expression of AtPAP1 in Solanum nigrum increases anthocyanin accumulation in both nutritional and reproductive tissues of transgenic plants. The induced anthocyanins components were concentrated in delphinidin, petunidin and malvidin (Chhon et al., 2020). These scientific results are different from the results of the present study, the regulation of anthocyanin metabolic synthesis and transport in different plants is complex and diverse.
Wild type materials display an interesting phenomenon in which the petioles of the T2/T3 period possess the same anthocyanins content as the leaves, and even higher, yet there is no visible color change. This is due to a combination of factors will influence the color formation of plants, including the type and content of anthocyanins, intermolecular auxiliary coloring, molecular accumulation effect, chelation of metal ions, and the pH value of the vacuole (Jiang et al., 2020). Not only that, the leaves and petioles of C. bicolor differ from the petals and belong to vegetative organs, and in terms of pigment composition, photosynthetic pigments (the chlorophyll and carotenoid) are expected to be taken into account. Unsurprisingly, there are many unsolved mysteries about the complex coloration mechanism of C. bicolor waiting for us to explore.
4.3 Co-expression of AtPAP1 and ZmLc transcription factors affects anthocyanin accumulation in C. bicolor by regulating anthocyanin synthesis and transport
Anthocyanin metabolic engineering has been applied to improve the color of ornamental plants, as traditional breeding techniques such as hybridization and mutation are not efficient for the purpose (Boutigny et al., 2020). To achieve this, the overexpression of heterologous transcription factor genes is essential for regulating anthocyanin synthesis. The transcription factors AtPAP1 and ZmLc are widely used in anthocyanin metabolic engineering. Besides expression studies of the individual genes, AtPAP1 and ZmLc have been simultaneously expressed to increase anthocyandin production in Arabidopsis and S. involucrata (Sharma and Dixon, 2005; Qiu et al., 2013). There was no significant color change in S. involucrata when AtPAP1 and ZmLc were transferred alone. However, anthocyanin accumulation significantly increased in the callus and tender branches of transgenic tissue when AtPAP1 and ZmLc were co-expressed. Li et al. also transferred ZmLc into C. bicolor, and the color of the whole leaf was not changed. Herein, AtPAP1 and ZmLc co-expression in C. bicolor yielded similar results as when ZmLc was transferred alone.
The overexpression of MYB and bHLH TFs enhances the expression of anthocyanin biosynthetic genes and anthocyanin accumulation in many plants. In this research, anthocyanin accumulation increased in the transgenic lines. The co-overexpression of AtPAP1 and ZmLc can activate the key genes related to anthocyanin synthesis and transport, thus improving anthocyanin biosynthesis.
Herein, we screened 9 structural genes and 5 transport key genes through PPI analysis, involved in each step of anthocyanin biosynthesis and transport. These genes were highly expressed at the transgenic lines and WT-T3 stage. The F3’5’H gene was not found in the transcriptome data. These results suggest that the cyanidin and pelargonidin biosynthesis pathways are involved in anthocyanin biosynthesis and promote color formation in C. bicolor. This is consistent with the results of metabolomics.
AtPAP1 and ZmLc can also stimulate other transcription factors, including 5 MYB-TFs, one bHLH-4, one WRKY and one HD-ZIP. MYB-TFs can directly regulate anthocyanin biosynthesis or interact with bHLH and WD40 transcription factors for anthocyanin biosynthesis regulation. Among the 5 MYB-TFs screened, MYB-5 and MYB-10 were more important. Phylogenetic analysis showed that the derived amino acid sequence of MYB-5 was highly similar to subgroup 5 R2R3-MYBs. The first R2R3-MYB transcription factor discovered to regulate anthocyanin biosynthesis is C1 (Colorless-1) in maize, belonged to subgroup 5 R2R3-MYBs, which specifically regulates the expression of CHS and DFR through light dependent regulation (Cone et al., 1993). And thus MYB-5 may act in the same manner in secondary metabolism. ZmC1 belongs to R2R3-MYB TFs, which can be classified into subgroups based on phylogenetic relationships and short signature motifs that are conserved within and unique to each subgroup (Tang et al., 2020). ZmC1 in subgroup 5 R2R3-MYBs, while TrMYB133 and TrMYB134, which MYB-10 homologous to subgroup 4 R2R3-MYBs (Figure 5D). These subgroup 4 R2R3-MYBs can be further classified into the ‘FaMYB1-type’ and the ‘AtMYB4-type’ (LaFountain and Yuan, 2021). The ‘FaMYB1-type’ regulates the flavonoid pathway, including crucial steps of anthocyanin biosynthesis, while the ‘AtMYB4-type’ regulates the general phenylpropanoid pathway leading to the production of phenolic acids and lignans (Ma and Constabel, 2019). TrMYB133 and TrMYB134 belonged to ‘FaMYB1-type’ can inhibit the activity of anthocyanin-regulated and proanthocyanidin-regulated MBW complexes, respectively (Albert, 2015). It is speculated that MYB transcription factors may be responsible for the significant increase in proanthocyanidin content of transgenic materials observed in this study, as they are known to regulate both anthocyanins and proanthocyanidins.
5 Conclusion
Constitutive promoter and heterologous expression of transcription factors have been employed to effectively improve the color presentation in C. bicolor petioles and leaves, with the aim of saving certain means of regulating biosynthesis and metabolism in this species. Although significant up-regulation of upstream regulatory transcription factors, as well as downstream key structural genes and transporter genes in the transgenic material was observed, no significant color changes were observed in the transgenic leaf margins. This indicates that the regulation of anthocyanin synthesis in C. bicolor is different in leaves and petioles, and that the mechanism of leaf color formation is complex, making commonly used genes insufficient for the targeted regulation of leaf spot in foliage plants. Therefore, further optimization of metabolic engineering strategies is needed to achieve targeted color improvement in ornamental plants. To this end, more efficient genes involved in anthocyanin biosynthesis and transport should be identified. For example, recent studies have demonstrated that MYB-TFs can regulate anthocyanin pigmentation in leaves; Wang et al. showed that the classic Medicago truncatula leaf anthocyanin spot trait depends on two R2R3-MYB paralogous regulators (RED HEART1 (RH1) and RH2) using M. truncatula leaf marking as a model (Wang et al., 2021). Further studies should be conducted to gain a better understanding of the mechanisms underlying the regulation of leaf spot in C. bicolor, and to identify more targeted and effective genes. In this study, MYB-5 and MYB-10 were found to have important roles in the regulation of anthocyanin synthesis in C. bicolor, and further in-depth functional studies can be conducted.
Data availability statement
The data presented in the study are deposited in the National Center for Biotechnology Information (NCBI) repository, accession number PRJNA976473; https://www.ncbi.nlm.nih.gov/bioproject/PRJNA976473.
Author contributions
SS and XY designed the research. AL, YH, and XL analyzed the data. JX and GG analyzed gene expression. XY, AL, and YH wrote the article. All authors contributed to the article and approved the submitted version.
Funding
This work was supported by grants from the Fundamental Research Funds for the Central Universities (no. XDJK2019D039 and no. XDJK2016E140). The funders had no role in the design of the study, data collection, analysis and interpretation, decision to publish, or preparation of the manuscript.
Acknowledgments
We are grateful to the State Key Laboratory for Conservation and Utilization of Subtropical Agro-Bioresources for technical support and critical advice.
Conflict of interest
The authors declare that the research was conducted in the absence of any commercial or financial relationships that could be construed as a potential conflict of interest.
Publisher’s note
All claims expressed in this article are solely those of the authors and do not necessarily represent those of their affiliated organizations, or those of the publisher, the editors and the reviewers. Any product that may be evaluated in this article, or claim that may be made by its manufacturer, is not guaranteed or endorsed by the publisher.
Supplementary material
The Supplementary Material for this article can be found online at: https://www.frontiersin.org/articles/10.3389/fpls.2023.1186816/full#supplementary-material
Supplementary Figure 1 | Anthocyanin composition statistics of C. bicolor.
Supplementary Figure 2 | Protein sequence alignment of MYB-5 and MYB-10.
References
Albert, N. W. (2015). Subspecialization of R2R3-MYB repressors for anthocyanin and proanthocyanidin regulation in forage legumes. Front. In Plant Sci. 6. doi: 10.3389/fpls.2015.01165
Belwal, T., Singh, G., Jeandet, P., Pandey, A., Giri, L., Ramola, S., et al. (2020). Anthocyanins, multi-functional natural products of industrial relevance: recent biotechnological advances. Biotechnol. Adv. 43, 107600. doi: 10.1016/j.biotechadv.2020.107600
Borevitz, J. O., Xia, Y., Blount, J., Dixon, R. A., Lamb, C. (2000). Activation tagging identifies a conserved MYB regulator of phenylpropanoid biosynthesis. Plant Cell 12, 2383–2394. doi: 10.1105/tpc.12.12.2383
Boutigny, A.-L., Dohin, N., Pornin, D., Rolland, M. (2020). Overview and detectability of the genetic modifications in ornamental plants. Horticulture Res. 7, 1–12. doi: 10.1038/s41438-019-0232-5
Bradley, J. M., Davies, K. M., Deroles, S. C., Bloor, S. J., Lewis, D. H. (1998). The maize lc regulatory gene up-regulates the flavonoid biosynthetic pathway of petunia. Plant J. 13, 381–392. doi: 10.1046/j.1365-313X.1998.00031.x
Chen, L., Hu, B., Qin, Y., Hu, G., Zhao, J. (2019). Advance of the negative regulation of anthocyanin biosynthesis by MYB transcription factors. Plant Physiol. Biochem. 136, 178–187. doi: 10.1016/j.plaphy.2019.01.024
Chen, S., Zhou, Y., Chen, Y., Gu, J. (2018). Fastp: an ultra-fast all-in-one FASTQ preprocessor. Bioinformatics 34, i884–i890. doi: 10.1093/bioinformatics/bty560
Chhon, S., Jeon, J., Kim, J., Park, S. U. (2020). Accumulation of anthocyanins through overexpression of AtPAP1 in solanum nigrum Lin.(Black nightshade). Biomolecules 10, 277. doi: 10.3390/biom10020277
Cone, K. C., Cocciolone, S. M., Burr, F. A., Burr, B. (1993). Maize anthocyanin regulatory gene pl is a duplicate of c1 that functions in the plant. Plant Cell 5, 1795–1805. doi: 10.1105/tpc.5.12.1795
Conesa, A., Götz, S., García-Gómez, J. M., Terol, J., Talón, M., Robles, M. (2005). Blast2GO: a universal tool for annotation, visualization and analysis in functional genomics research. Bioinformatics 21, 3674–3676. doi: 10.1093/bioinformatics/bti610
Doncheva, N. T., Morris, J. H., Gorodkin, J., Jensen, L. J. (2018). Cytoscape StringApp: network analysis and visualization of proteomics data. J. Proteome Res. 18, 623–632. doi: 10.1021/acs.jproteome.8b00702
Gatica-Arias, A., Farag, M. A., Stanke, M., Matoušek, J., Wessjohann, L., Weber, G. (2012). Flavonoid production in transgenic hop (Humulus lupulus l.) altered by PAP1/MYB75 from arabidopsis thaliana l. Plant Cell Rep. 31, 111–119. doi: 10.1007/s00299-011-1144-5
Goldsbrough, A. P., Tong, Y., Yoder, J. I. (1996). Lc as a non-destructive visual reporter and transposition excision marker gone for tomato. Plant J. 9, 927–933. doi: 10.1046/j.1365-313X.1996.9060927.x
Grabherr, M. G., Haas, B. J., Yassour, M., Levin, J. Z., Thompson, D. A., Amit, I., et al. (2011). Full-length transcriptome assembly from RNA-seq data without a reference genome. Nat. Biotechnol. 29, 644–652. doi: 10.1038/nbt.1883
Ha Park, C., Xu, H., Yeo, H. J., Park, Y. E., Hwang, G. S., Park, N. I., et al. (2021). Enhancement of the flavone contents of scutellaria baicalensis hairy roots via metabolic engineering using maize lc and arabidopsis PAP1 transcription factors. Metab. Eng. 64, 64–73. doi: 10.1016/j.ymben.2021.01.003
He, X. Z., Li, Y., Lawson, D., Xie, D. Y. (2017). Metabolic engineering of anthocyanins in dark tobacco varieties. Physiologia Plantarum 159, 2–12. doi: 10.1111/ppl.12475
Horiuchi, R., Nishizaki, Y., Okawa, N., Ogino, A., Sasaki, N. (2020). Identification of the biosynthetic pathway for anthocyanin triglucoside, the precursor of polyacylated anthocyanin, in red cabbage. J. Agric. Food Chem. 68, 9750–9758. doi: 10.1021/acs.jafc.0c03480
Jiang, M., Ren, L., Lian, H., Liu, Y., Chen, H. (2016). Novel insight into the mechanism underlying light-controlled anthocyanin accumulation in eggplant (Solanum melongena l.). Plant Sci. 249, 46–58. doi: 10.1016/j.plantsci.2016.04.001
Jiang, T., Zhang, M., Wen, C., Xie, X., Tian, W., Wen, S., et al. (2020). Integrated metabolomic and transcriptomic analysis of the anthocyanin regulatory networks in salvia miltiorrhiza bge. flowers. BMC Plant Biol. 20, 349. doi: 10.1186/s12870-020-02553-7
Kanehisa, M., Goto, S. (2000). KEGG: kyoto encyclopedia of genes and genomes. Nucleic Acids Res. 28, 27–30. doi: 10.1093/nar/28.1.27
Khoo, H. E., Azlan, A., Tang, S. T., Lim, S. M. (2017). Anthocyanidins and anthocyanins: colored pigments as food, pharmaceutical ingredients, and the potential health benefits. Food Nutr. Res. 61, 1361779. doi: 10.1080/16546628.2017.1361779
Kumar, S., Stecher, G., Tamura, K. (2016). MEGA7: molecular evolutionary genetics analysis version 7.0 for bigger datasets. Mol. Biol. Evol. 33, 1870–1874. doi: 10.1093/molbev/msw054
LaFountain, A. M., Yuan, Y. W. (2021). Repressors of anthocyanin biosynthesis. New Phytol 231, 933–949. doi: 10.1111/nph.17397
Langfelder, P., Horvath, S. (2008). WGCNA: an r package for weighted correlation network analysis. BMC Bioinf. 9, 559. doi: 10.1186/1471-2105-9-559
Lei, T., Song, Y., Jin, X., Su, T., Pu, Y. (2017). Effects of pigment constituents and their distribution on spathe coloration of zantedeschia hybrida %J HortScience horts. HortScience 52, 1840–1848. doi: 10.21273/hortsci12229-17
Li, S. J., Deng, X. M., Mao, H. Z., Hong, Y. (2005). Enhanced anthocyanin synthesis in foliage plant caladium bicolor. Plant Cell Rep. 23, 716–720. doi: 10.1007/s00299-004-0871-2
Li, B., Dewey, C. N. (2011). RSEM: accurate transcript quantification from RNA-seq data with or without a reference genome. BMC Bioinf. 12, 323. doi: 10.1186/1471-2105-12-323
Li, H., Flachowsky, H., Fischer, T. C., Hanke, M.-V., Forkmann, G., Treutter, D., et al. (2007). Maize lc transcription factor enhances biosynthesis of anthocyanins, distinct proanthocyanidins and phenylpropanoids in apple (Malus domestica borkh.). Planta 226, 1243–1254. doi: 10.1007/s00425-007-0573-4
Lloyd, A., Brockman, A., Aguirre, L., Campbell, A., Bean, A., Cantero, A., et al. (2017). Advances in the MYB-bHLH-WD repeat (MBW) pigment regulatory model: addition of a WRKY factor and Co-option of an anthocyanin MYB for betalain regulation. Plant Cell Physiol. 58, 1431–1441. doi: 10.1093/pcp/pcx075
Love, M. I., Huber, W., Anders, S. (2014). Moderated estimation of fold change and dispersion for RNA-seq data with DESeq2. Genome Biol. 15, 550. doi: 10.1186/s13059-014-0550-8
Ludwig, S. R., Habera, L. F., Dellaporta, S. L., Wessler, S. R. (1989). Lc, a member of the maize r gene family responsible for tissue-specific anthocyanin production, encodes a protein similar to transcriptional activators and contains the myc-homology region. Proc. Natl. Acad. Sci. United States America 86, 7092–7096. doi: 10.1073/pnas.86.18.7092
Ma, D., Constabel, C. P. (2019). MYB repressors as regulators of phenylpropanoid metabolism in plants. Trends In Plant Sci. 24, 275–289. doi: 10.1016/j.tplants.2018.12.003
Mattioli, R., Francioso, A., Mosca, L., Silva, P. (2020). Anthocyanins: a comprehensive review of their chemical properties and health effects on cardiovascular and neurodegenerative diseases. Molecules 25, 3809. doi: 10.3390/molecules25173809
Naing, A. H., Kim, C. K. (2018). Roles of R2R3-MYB transcription factors in transcriptional regulation of anthocyanin biosynthesis in horticultural plants. Plant Mol. Biol. 98, 1–18. doi: 10.1016/j.ijbiomac.2020.01.167
Pan, Y. (2021). Screening reference genes of caladium bicolor and cloning and functional analysis of CbMYB5 gene (Chongqing: Southwest University). doi: 10.27684/d.cnki.gxndx.2021.004586
Qiu, J., Gao, F., Shen, G., Li, C., Han, X., Zhao, Q., et al. (2013). Metabolic engineering of the phenylpropanoid pathway enhances the antioxidant capacity of saussurea involucrata. PloS One 8, e70665. doi: 10.1371/journal.pone.0070665
Qiu, J., Sun, S., Luo, S., Zhang, J., Xiao, X., Zhang, L., et al. (2014). Arabidopsis AtPAP1 transcription factor induces anthocyanin production in transgenic taraxacum brevicorniculatum. Plant Cell Rep. 33, 669–680. doi: 10.1007/s00299-014-1585-8
Quattrocchio, F., Wing, J. F., Leppen, H. T. C., Mol, J. N. M., Koes, R. E. (1993). Regulatory genes controlling anthocyanin pigmentation are functionally conserved among plant species and have distinct sets of target genes. Plant Cell 5, 1497–1512. doi: 10.1105/tpc.5.11.1497
Ray, H., Yu, M., Auser, P., Blahut-Beatty, L., Mckersie, B., Bowley, S., et al. (2003). Expression of anthocyanins and proanthocyanidins after transformation of alfalfa with maize lc. Plant Physiol. 132, 1448–1463. doi: 10.1104/pp.103.025361
Saigo, T., Wang, T., Watanabe, M., Tohge, T. (2020). Diversity of anthocyanin and proanthocyanin biosynthesis in land plants. Curr. Opin. Plant Biol. 55, 93–99. doi: 10.1016/j.pbi.2020.04.001
Schmittgen, T. D., Livak, K. J. (2008). Analyzing real-time PCR data by the comparative C(T) method. Nat. Protoc. 3, 1101–1108. doi: 10.1038/nprot.2008.73
Sharma, S. B., Dixon, R. A. (2005). Metabolic engineering of proanthocyanidins by ectopic expression of transcription factors in arabidopsis thaliana. Plant J. 44, 62–75. doi: 10.1111/j.1365-313X.2005.02510.x
Shi, M., Xie, D. (2014). Biosynthesis and metabolic engineering of anthocyanins in arabidopsis thaliana. Recent patents Biotechnol. 8, 47–60. doi: 10.2174/1872208307666131218123538
Skaliter, O., Ravid, J., Shklarman, E., Ketrarou, N., Shpayer, N., Ben Ari, J., et al. (2019). Ectopic expression of PAP1 leads to anthocyanin accumulation and novel floral color in genetically engineered goldenrod (Solidago canadensis l.). Front. Plant Sci. 10. doi: 10.3389/fpls.2019.01561
Sun, C., Deng, L., Du, M., Zhao, J., Chen, Q., Huang, T., et al. (2020). A transcriptional network promotes anthocyanin biosynthesis in tomato flesh. Mol. Plant 13, 42–58. doi: 10.1016/j.molp.2019.10.010
Tang, B., Li, L., Hu, Z., Chen, Y., Tan, T., Jia, Y., et al. (2020). Anthocyanin accumulation and transcriptional regulation of anthocyanin biosynthesis in purple pepper. J. Agric. Food Chem. 68, 12152–12163. doi: 10.1021/acs.jafc.0c02460
Tohge, T., Nishiyama, Y., Hirai, M. Y., Yano, M., Nakajima, J.-I., Awazuhara, M., et al. (2005). Functional genomics by integrated analysis of metabolome and transcriptome of arabidopsis plants over-expressing an MYB transcription factor. Plant J. 42, 218–235. doi: 10.1111/j.1365-313X.2005.02371.x
Wang, C., Ji, W., Liu, Y., Zhou, P., Meng, Y., Zhang, P., et al. (2021). The antagonistic MYB paralogs RH1 and RH2 govern anthocyanin leaf markings in medicago truncatula. New Phytol. 229, 3330–3344. doi: 10.1111/nph.17097
Xie, S., Lei, Y. J., Chen, H. W., Li, J. N., Chen, H. Z., Zhang, Z. W. (2020). R2R3-MYB transcription factors regulate anthocyanin biosynthesis in grapevine vegetative tissues. Front. Plant Sci. 11. doi: 10.3389/fpls.2020.00527
Xie, C., Mao, X., Huang, J., Ding, Y., Wu, J., Dong, S., et al. (2011). KOBAS 2.0: a web server for annotation and identification of enriched pathways and diseases. Nucleic Acids Res. 39, W316–W322. doi: 10.1093/nar/gkr483
Xu, H., Zou, Q., Yang, G., Jiang, S., Fang, H., Wang, Y., et al. (2020). MdMYB6 regulates anthocyanin formation in apple both through direct inhibition of the biosynthesis pathway and through substrate removal. Horticulture Res. 7, 1–17. doi: 10.1038/s41438-020-0294-4
Yan, H., Pei, X., Zhang, H., Li, X., Zhang, X., Zhao, M., et al. (2021). MYB-mediated regulation of anthocyanin biosynthesis. Int. J. Mol. Sci. 22, 3103. doi: 10.3390/ijms22063103
Zhang, Y., Chen, G., Dong, T., Pan, Y., Zhao, Z., Tian, S., et al. (2014a). Anthocyanin accumulation and transcriptional regulation of anthocyanin biosynthesis in purple bok choy (Brassica rapa var. chinensis). J. Agric. Food Chem. 62, 12366–12376. doi: 10.1021/jf503453e
Zhang, Y., Yan, Y. P., Wu, Y. C., Hua, W. P., Chen, C., Ge, Q., et al. (2014b). Pathway engineering for phenolic acid accumulations in salvia miltiorrhiza by combinational genetic manipulation. Metab. Eng. 21, 71–80. doi: 10.1016/j.ymben.2013.10.009
Keywords: Caladium bicolor, AtPAP1, ZmLc, anthocyanin biosynthesis, metabolic engineering
Citation: Yang X, Li A, Xia J, Huang Y, Lu X, Guo G and Sui S (2023) Enhancement of the anthocyanin contents of Caladium leaves and petioles via metabolic engineering with co-overexpression of AtPAP1 and ZmLc transcription factors. Front. Plant Sci. 14:1186816. doi: 10.3389/fpls.2023.1186816
Received: 15 March 2023; Accepted: 05 June 2023;
Published: 21 June 2023.
Edited by:
Gabriella Sonnante, Consiglio Nazionale delle Ricerche (CNR), ItalyReviewed by:
Aurelia Scarano, Consiglio Nazionale delle Ricerche (CNR), ItalyYue Yin, Ningxia Academy of Agriculture and Forestry Sciences, China
Yue Wang, Zhejiang University, China
Copyright © 2023 Yang, Li, Xia, Huang, Lu, Guo and Sui. This is an open-access article distributed under the terms of the Creative Commons Attribution License (CC BY). The use, distribution or reproduction in other forums is permitted, provided the original author(s) and the copyright owner(s) are credited and that the original publication in this journal is cited, in accordance with accepted academic practice. No use, distribution or reproduction is permitted which does not comply with these terms.
*Correspondence: Shunzhao Sui, c3N6Y3FAc3d1LmVkdS5jbg==